pasta · pasta (such as spaghetti, rigatoni, ... specifically, to be labeled as macaroni, the...
TRANSCRIPT
Pasta
USITC Publication 3592April 2003
OFFICE OF INDUSTRIESU.S. International Trade CommissionWashington, DC 20436
UNITED STATES INTERNATIONAL TRADE COMMISSION
This report was prepared principally by
Warren S. Payne
Agricultural Crops and Specialty Products BranchAgriculture and Forest Products Division
Vern Simpson
Robert A. Rogowsky
Address all communications toSecretary to the Commission
United States International Trade CommissionWashington, DC 20436
Director of Operations
Director of Industries
COMMISSIONERS
Marcia E. Miller
Deanna Tanner Okun, ChairmanJennifer A. Hillman, Vice Chairman
Stephen Koplan
Under the direction of
Cathy Jabara and Stephen Burket
1 The information and analysis provided in this report are for the purposes of this report only.Nothing in this report should be construed to indicate how the Commission would find in aninvestigation conducted under statutory authority covering the same or similar subject matter.
i
PREFACE
In 1991 the United States International Trade Commission initiated its current Industry andTrade Summary series of informational reports on the thousands of products imported intoand exported from the United States. Each summary addresses a differentcommodity/industry area and contains information on product uses, U.S. and foreignproducers, and customs treatment. Also included is an analysis of the basic factors affectingtrends in consumption, production, and trade of the commodity, as well as those bearing onthe competitiveness of U.S. industries in domestic and foreign markets.1
This report on pasta covers the period 1997 through 2001. Listed below are the individualsummary reports published to date on the agriculture and forest products sectors.
USITCpublicationnumber Publication date Title2459 November 1991 . . . . . . . . . . . . Live Sheep and Meat of Sheep2462 November 1991 . . . . . . . . . . . . Cigarettes2477 January 1992 . . . . . . . . . . . . . . Dairy Products2478 January 1992 . . . . . . . . . . . . . . Oilseeds2511 March 1992 . . . . . . . . . . . . . . . Live Swine and Fresh, Chilled, or
Frozen Pork2520 June 1992 . . . . . . . . . . . . . . . . . Poultry2544 August 1992 . . . . . . . . . . . . . . Fresh or Frozen Fish2545 November 1992 . . . . . . . . . . . . Natural Sweeteners2551 November 1992 . . . . . . . . . . . . Newsprint2612 March 1993 . . . . . . . . . . . . . . . Wood Pulp and Waste Paper2615 March 1993 . . . . . . . . . . . . . . . Citrus Fruit2625 April 1993 . . . . . . . . . . . . . . . . Live Cattle and Fresh, Chilled, or
Frozen Beef and Veal2631 May 1993 . . . . . . . . . . . . . . . . . Animal and Vegetable Fats and Oils2635 June 1993 . . . . . . . . . . . . . . . . . Cocoa, Chocolate, and Confectionery2636 May 1993 . . . . . . . . . . . . . . . . . Olives2639 June 1993 . . . . . . . . . . . . . . . . . Wine and Certain Fermented Beverages2693 October 1993 . . . . . . . . . . . . . . Printing and Writing Paper2702 November 1993 . . . . . . . . . . . . Fur Goods2726 January 1994 . . . . . . . . . . . . . . Furskins2737 March 1994 . . . . . . . . . . . . . . . Cut Flowers2749 March 1994 . . . . . . . . . . . . . . . Paper Boxes and Bags2762 April 1994 . . . . . . . . . . . . . . . . Coffee and Tea
ii
PREFACE—Continued
USITCpublicationnumber
Publicationdate Title
2859 May 1995 . . . . . . . . . . . . . . . . . Seeds2865 April 1995 . . . . . . . . . . . . . . . . Malt Beverages2875 May 1995 . . . . . . . . . . . . . . . . . Certain Fresh Deciduous Fruits2898 June 1995 . . . . . . . . . . . . . . . . . Certain Miscellaneous Vegetable
Substance and Products2917 October 1995 . . . . . . . . . . . . . . Lumber, Flooring, and Siding2918 August 1995 . . . . . . . . . . . . . . Printed Matter2928 November 1995 . . . . . . . . . . . . Processed Vegetables3015 February 1997 . . . . . . . . . . . . . Hides, Skins, and Leather3020 March 1997 . . . . . . . . . . . . . . . Nonalcoholic Beverages3022 April 1997 . . . . . . . . . . . . . . . . Industrial Papers and Paperboards3080 January 1998 . . . . . . . . . . . . . . Dairy Products3083 February 1998 . . . . . . . . . . . . . Canned Fish, Except Shellfish3095 March 1998 . . . . . . . . . . . . . . . Milled Grains, Malts, and Starches3096 April 1998 . . . . . . . . . . . . . . . . Millwork3145 December 1998 . . . . . . . . . . . . Wool and Related Animal Hair3148 December 1998 . . . . . . . . . . . . Poultry3171 March 1999 . . . . . . . . . . . . . . . Dried Fruits Other Than Tropical3268 December 1999 . . . . . . . . . . . . Eggs3275 January 2000 . . . . . . . . . . . . . . Animal Feeds3350 September 2000 . . . . . . . . . . . . Grain (Cereals)3352 September 2000 . . . . . . . . . . . . Edible Nuts3355 September 2000 . . . . . . . . . . . . Newsprint3373 November 2000 . . . . . . . . . . . . Distilled Spirits3391 January 2001 . . . . . . . . . . . . . . Cotton3461 October 2001 . . . . . . . . . . . . . . Cured Fish3463 October 2001 . . . . . . . . . . . . . . Fresh or Frozen Fish3490 February 2002 . . . . . . . . . . . . . Wood Pulp and Waste Paper3576 February 2003 . . . . . . . . . . . . . Oilseeds3579 February 2003 . . . . . . . . . . . . . Live Sheep and Meat of Sheep3580 February 2003 . . . . . . . . . . . . . Cut Flowers
iii
CONTENTSPage
Preface . . . . . . . . . . . . . . . . . . . . . . . . . . . . . . . . . . . . . . . . . . . . . . . . . . . . . . . . . . . . . . . . . . . . . . i
Abstract . . . . . . . . . . . . . . . . . . . . . . . . . . . . . . . . . . . . . . . . . . . . . . . . . . . . . . . . . 1
Introduction . . . . . . . . . . . . . . . . . . . . . . . . . . . . . . . . . . . . . . . . . . . . . . . . . . . . 3
U.S. industry profile . . . . . . . . . . . . . . . . . . . . . . . . . . . . . . . . . . . . . . . . . . . . . . . . . . . 4
Dry pasta . . . . . . . . . . . . . . . . . . . . . . . . . . . . . . . . . . . . . . . . . . . . . . . . . . . . . . . . . . . . . . . . . . 4Employment . . . . . . . . . . . . . . . . . . . . . . . . . . . . . . . . . . . . . . . . . . . . . . . . . . . . . . . . . . . . . 4Concentration . . . . . . . . . . . . . . . . . . . . . . . . . . . . . . . . . . . . . . . . . . . . . . . . . . . . . . . . . . . . 5Capacity and capacity utilization . . . . . . . . . . . . . . . . . . . . . . . . . . . . . . . . . . . . . . . . . . . . . 6
Fresh, frozen and refrigerated pasta . . . . . . . . . . . . . . . . . . . . . . . . . . . . . . . . . . . . . . . . . . . . . . 7
U.S. market . . . . . . . . . . . . . . . . . . . . . . . . . . . . . . . . . . . . . . . . . . . . . . . . . . . . . . . . . . . . . . . . 8
Consumer characteristics and factors affecting demand . . . . . . . . . . . . . . . . . . . . . . . . . . . . . . 8Channels of distribution . . . . . . . . . . . . . . . . . . . . . . . . . . . . . . . . . . . . . . . . . . . . . . . . . . . . . . . 8
Retail sales . . . . . . . . . . . . . . . . . . . . . . . . . . . . . . . . . . . . . . . . . . . . . . . . . . . . . . . . . . . . . . 8Food service markets . . . . . . . . . . . . . . . . . . . . . . . . . . . . . . . . . . . . . . . . . . . . . . . . . . . . . . 11Ingredient market . . . . . . . . . . . . . . . . . . . . . . . . . . . . . . . . . . . . . . . . . . . . . . . . . . . . . . . . . 11Co-pack . . . . . . . . . . . . . . . . . . . . . . . . . . . . . . . . . . . . . . . . . . . . . . . . . . . . . . . . . . . . . . . . . 11
Consumption . . . . . . . . . . . . . . . . . . . . . . . . . . . . . . . . . . . . . . . . . . . . . . . . . . . . . . . . . . . . . . . 12U.S. shipments . . . . . . . . . . . . . . . . . . . . . . . . . . . . . . . . . . . . . . . . . . . . . . . . . . . . . . . . . . . . . . 13Factors affecting production . . . . . . . . . . . . . . . . . . . . . . . . . . . . . . . . . . . . . . . . . . . . . . . . . . . 13
U.S. trade . . . . . . . . . . . . . . . . . . . . . . . . . . . . . . . . . . . . . . . . . . . . . . . . . . . . . . . . . . . . . . . . . . 14
Overview . . . . . . . . . . . . . . . . . . . . . . . . . . . . . . . . . . . . . . . . . . . . . . . . . . . . . . . . . . . . . . . . . . 14U.S. imports . . . . . . . . . . . . . . . . . . . . . . . . . . . . . . . . . . . . . . . . . . . . . . . . . . . . . . . . . . . . . . . . 16
Principal suppliers and import levels . . . . . . . . . . . . . . . . . . . . . . . . . . . . . . . . . . . . . . . . . . 16Italy . . . . . . . . . . . . . . . . . . . . . . . . . . . . . . . . . . . . . . . . . . . . . . . . . . . . . . . . . . . . . . . . 16Canada . . . . . . . . . . . . . . . . . . . . . . . . . . . . . . . . . . . . . . . . . . . . . . . . . . . . . . . . . . . . . 16
U.S. trade measures . . . . . . . . . . . . . . . . . . . . . . . . . . . . . . . . . . . . . . . . . . . . . . . . . . . . . . . 17Tariff measures . . . . . . . . . . . . . . . . . . . . . . . . . . . . . . . . . . . . . . . . . . . . . . . . . . . . . . . . 17Nontariff measures . . . . . . . . . . . . . . . . . . . . . . . . . . . . . . . . . . . . . . . . . . . . . . . . . . . . . . 17U.S. Government trade-related investigations . . . . . . . . . . . . . . . . . . . . . . . . . . . . . . . . . 18
U.S. exports . . . . . . . . . . . . . . . . . . . . . . . . . . . . . . . . . . . . . . . . . . . . . . . . . . . . . . . . . . . . . . . . 19Principal markets and export levels . . . . . . . . . . . . . . . . . . . . . . . . . . . . . . . . . . . . . . . . . . . 19Foreign trade measures . . . . . . . . . . . . . . . . . . . . . . . . . . . . . . . . . . . . . . . . . . . . . . . . . . . . . 19
Tariff and nontariff measures . . . . . . . . . . . . . . . . . . . . . . . . . . . . . . . . . . . . . . . . . . . . . 19
iv
CONTENTS—ContinuedPage
U.S. trade—ContinuedForeign investments . . . . . . . . . . . . . . . . . . . . . . . . . . . . . . . . . . . . . . . . . . . . . . . . . . . . . . . . . . 20Foreign market and industry profiles . . . . . . . . . . . . . . . . . . . . . . . . . . . . . . . . . . . . . . . . . . . . . 21
Canada . . . . . . . . . . . . . . . . . . . . . . . . . . . . . . . . . . . . . . . . . . . . . . . . . . . . . . . . . . . . . . . . . . 21European Union . . . . . . . . . . . . . . . . . . . . . . . . . . . . . . . . . . . . . . . . . . . . . . . . . . . . . . . . . . 22
AppendixesA. Explanation of tariff and trade agreement terms . . . . . . . . . . . . . . . . . . . . . . . . . . . . . . . . . . . . . . . A-1B. Statistical tables . . . . . . . . . . . . . . . . . . . . . . . . . . . . . . . . . . . . . . . . . . . . . . . . . . . . . . . . . . . . . . . . B-1
Figures1. U.S. pasta capacity reductions due to plant closures, 1996-2002 . . . . . . . . . . . . . . . . . . . . . . . . . . 72. Channels of distribution for the U.S. pasta industry . . . . . . . . . . . . . . . . . . . . . . . . . . . . . . . . . . . . 93. U.S. imports of pasta products, by major import source, 1997-2001 . . . . . . . . . . . . . . . . . . . . . . . 15
TablesB-1. Dry pasta industry: Number of establishments, employment, and value of
shipments, 1997-2000 . . . . . . . . . . . . . . . . . . . . . . . . . . . . . . . . . . . . . . . . . . . . . . . . . . . . . . . B-2B-2. Pasta products: U.S. shipments, U.S. exports of domestic merchandise, U.S.
imports for consumption, and U.S. apparent domestic consumption, 1997-2001 . . . . . . . . . B-2B-3. Durum wheat: Inventory, production, imports, domestic uses, and average annual
price, crop years 1997/98-2001/02 . . . . . . . . . . . . . . . . . . . . . . . . . . . . . . . . . . . . . . . . . . . . . B-2B-4. U.S. pasta products manufacturers: Cost of materials, value of shipments, ratio of
costs to shipments, 1997-2000 . . . . . . . . . . . . . . . . . . . . . . . . . . . . . . . . . . . . . . . . . . . . . . . . B-3B-5. Spaghetti and macaroni: Average price data, U.S. city average price by month,
January 1997- June 2002 . . . . . . . . . . . . . . . . . . . . . . . . . . . . . . . . . . . . . . . . . . . . . . . . . . . . . B-4B-6. Pasta: U.S. exports of domestic merchandise, import for consumption, and
merchandise trade balance, by selected countries, 1997-2001 . . . . . . . . . . . . . . . . . . . . . . . . B-5B-7. Pasta products: U.S. imports for consumption, by selected sources, 1997-2001 . . . . . . . . . . . B-6B-8. Pasta products: U.S. imports for consumption from Italy, by HTS description,
1997-2001 . . . . . . . . . . . . . . . . . . . . . . . . . . . . . . . . . . . . . . . . . . . . . . . . . . . . . . . . . . . . . . . . B-7B-9. Pasta products: U.S. imports for consumption from Canada, by HTS description,
1997-2001 . . . . . . . . . . . . . . . . . . . . . . . . . . . . . . . . . . . . . . . . . . . . . . . . . . . . . . . . . . . . . . . . B-7B-10. Pasta products: U.S. exports of domestic merchandise, by selected countries,
1997-2001 . . . . . . . . . . . . . . . . . . . . . . . . . . . . . . . . . . . . . . . . . . . . . . . . . . . . . . . . . . . . . . . . B-8B-11. Pasta products: U.S. exports of domestic merchandise, by HTS description,
1997-2001 . . . . . . . . . . . . . . . . . . . . . . . . . . . . . . . . . . . . . . . . . . . . . . . . . . . . . . . . . . . . . . . . B-9B-12. Total imports of pasta from Italy, imports subject to Inward Processing Regime
(IPR), and imports under the U.S.-EU pasta agreement, 1997-2001 . . . . . . . . . . . . . . . . . . . B-10
CONTENTS—ContinuedPage
v
Tables—ContinuedB-13. Pasta and pasta related input products: U.S. imports for consumption from
Canada, 1997-2001 . . . . . . . . . . . . . . . . . . . . . . . . . . . . . . . . . . . . . . . . . . . . . . . . . . . . . . . . . B-10B-14. Pasta products: Harmonized Tariff Schedule subheading; description; U.S. column 1
rate of duty as of Jan. 1, 2002; bound concession rate of duty; U.S. exports, 2001;and U.S. imports, 2001 . . . . . . . . . . . . . . . . . . . . . . . . . . . . . . . . . . . . . . . . . . . . . . . . . . . . . B-11

OMB No.: 3117--0188
04/03
ITC READER SATISFACTION SURVEYIndustry and Trade Summary: Pasta
The U.S. International Trade Commission (USITC) is interested in your voluntary com-ments (burden less than 10 minutes) to help assess the value and quality of our reports, and to assistin improving future products. Please return survey by facsimile (202-205-2384) or by mail to theUSITC, or visit the USITC Internet home page(http://reportweb.usitc.gov/reader_survey/readersurvey.html) to electronically submit a Web version ofthe survey.
(Please print; responses below not for attribution):
Your name and title:
Organization (if applicable):
Which format is most useful to you? - CD-ROM - Hardcopy - USITC Internet site
Circle your assessment of each factor below: SA = strongly agree, A = agree, N = no opinion,D = disagree, or SD = strongly disagree.
Value of this report:" Statistical data are useful SA A N D SD. . . . . . . . . . . . . . . . . . . . . . . . . . . . . ." Other non-numerical facts are useful SA A N D SD. . . . . . . . . . . . . . . . . . ." Analysis augments statistical data/other facts SA A N D SD. . . . . . . . . . . ." Relevant topic(s)/subject matter SA A N D SD. . . . . . . . . . . . . . . . . . . . . . . ." Primary or leading source of information on this subject SA A N D SD. .
Quality of this report:" Clearly written SA A N D SD. . . . . . . . . . . . . . . . . . . . . . . . . . . . . . . . . . . . . . ." Key issues are addressed SA A N D SD. . . . . . . . . . . . . . . . . . . . . . . . . . . . . . ." Charts and graphs aid understanding SA A N D SD. . . . . . . . . . . . . . . . . . ." References cite pertinent sources SA A N D SD. . . . . . . . . . . . . . . . . . . . . . .
Other preferred source of information on this subject:
Specify chapters, sections, or topics in report that are most useful:
Identify any type of additional information that should have been included in report:
Suggestions for improving report:
Please update your mailing and electronic addresses below (voluntary)-
Mailing address:
City, state, and zip code:
E-mail address:

UNITED STATESINTERNATIONAL TRADE COMMISSION
WASHINGTON, DC 20436
OFFICIAL BUSINESSPENALTY FOR PRIVATE, USE $300
FOLD
NO POSTAGENECESSARY
IF MAILEDIN THE
UNITED STATES
BUSINESS REPLY MAILFIRST CLASS PERMIT NO. 12840 WASHINGTON, DC
POSTAGE WILL BE PAID BY ADDRESSEE
U.S INTERNATIONAL TRADE COMMISSION500 E STREET, SW.WASHINGTON, DC 20277--2840
ATTN:OFFICE OF INDUSTRIESITS: Pasta
1
ABSTRACT
This summary analyzes trade and industry conditions in the U.S. pasta products market,primarily dry pasta, for the period 1997-2001. Dry pasta constitutes both dry “Italian-style”pasta (such as spaghetti, rigatoni, and lasagna) and other types of dry pasta such as orientalor ramen noodles. It also includes dry pasta that the dry pasta manufacturers may packagewith other ingredients, such as a sauce. Other types of pasta include refrigerated (fresh)pasta, frozen pasta, and canned pasta. Both pasta containing egg and non-egg pasta areincluded in this summary.
• Imports play a significant role in the U.S. pasta market, accounting for
approximately 24 percent of apparent U.S. consumption in 2001. Imports of pastafrom Italy continue to hold the largest import share, although imports from Italyhave declined somewhat from their 1997 levels. Imports from Canada haveincreased considerably since 1997 and account for an increasingly importantimport share.
• The U.S. industry has experienced significant consolidation during 1997-2001 aswell as increased foreign investment, both by foreign firms operating in the UnitedStates and U.S. firms expanding their production operations outside of the UnitedStates. The consolidation of the U.S. industry has resulted in reductions in capacityand employment in the industry.
• Data from the U.S. Bureau of the Census (Census) indicate that apparent U.S.consumption of pasta products has declined sharply, in value terms, during1997-2001. However, the U.S. industry believes that consumption, in unit terms,has remained fairly stable with declines in the retail market partially offset bygrowth in the ingredient market. The discrepancy in these estimates may beattributable to the stagnation in the retail price of dry pasta and the possibility thatthe Census data do not completely capture captive production and consumption forthe ingredient market.
• Although the United States continues to have a significant trade deficit in pastaproducts, U.S. exports have been growing faster than U.S. imports. The primarymarket for U.S. pasta exports is Canada. Despite the significant increase in importsfrom Canada the United States continues to have a trade surplus in pasta productswith respect to Canada.

1 Part 39 of Chapter 21 of the Code of Federal Regulations (CFR) provides standards ofidentity for macaroni (which is non-egg pasta) and noodles (which are egg pasta). Except for eggor egg yolk, the list of permissible additives for noodle products is similar to the list for macaroniproducts. Specifically, to be labeled as macaroni, the articles must meet the standards whichspecify macaroni products “...are prepared by drying formed units of dough made from semolina,durum flour, farina, flour, or any combination of two or more of these, with water...” Noodleproducts “...are prepared by drying formed units of dough made from semolina, durum flour,farina, flour, or any combination of two or more of these, with liquid eggs, frozen eggs, driedeggs, egg yolks, frozen yolks, dried yolks, or any combination of two or more of these with orwithout water...” The CFR further states that macaroni product may contain egg white not toexceed 2.0 percent of the weight of the finished product, and other specified additives. 2 The CFR provides standards of identity for the labeling of macaroni, and various noodleproducts. For example, spaghetti is tube-shaped or cord-shaped, but not tubular or hollow, andmore than 0.06 inch but not more than 0.11 inch in diameter.
3
INTRODUCTION
This summary provides information on pasta products, with a particular focus on dry pastaproducts. Pasta products are provided for in the Harmonized Tariff Schedule of the UnitedStates (HTS) under heading 1902. This report provides information on the structure of theU.S. and some foreign industries, domestic and foreign tariff and nontariff barriers, and theconditions of competition in these markets. This analysis covers the period 1997-2001.
The structure of the U.S. pasta products industry and the market into which it sells arechanging in a variety of ways. The domestic industry has recently consolidated andinternational trade is a significant condition of competition. Imports of pasta productsincreased from 1997 to 2001 by approximately 4 percent. However, the increase has beenirregular, with imports peaking in 1999, and then falling slightly from 1999 levels in 2000and 2001. While imports from Italy still constitute the largest import share, accounting for36 percent of total imports in 2001, imports from Canada have grown from only 12 percentof total imports in 1997 to 24 percent of imports in 2001. Much of the increase in Canada’simport share has occurred at the expense of imports from Italy. U.S. exports have increasedsignificantly during 1997-2001, from $107 million to $148 million, or by 38 percent. Whileimports and exports have increased, U.S. apparent consumption has fallen 31 percent.
The U.S. pasta products industry is primarily classified under the North American IndustryClassification System (NAICS) code 311823, dry pasta manufacturing. There were 239establishments classified under this NAICS code in 1999, the latest year for whichestablishment data are available. The industry employed 4,315 workers in 2000, which is adecline of approximately 29 percent from 1997. The value of shipments totaledapproximately $1.2 billion in 2000, a decline of 33 percent since 1997.
Pasta is a food product such as macaroni (including spaghetti, rigatoni, and other forms) andnoodles, which may contain egg or other additives.1 Pasta is formed by extrusion intodifferent shapes and sizes. Pasta is made in many different shapes, sizes, colors, and flavors,and is sometime categorized in terms of extruded solid goods, extruded hollow goods, androlled and cut goods. Another method of categorizing pasta is into long goods (spaghetti andlinguine); short goods (elbows and twists); noodles; and specialty items (lasagna and jumboshells).2 Dry pasta is pasta that has been dried into a brittle form that is ready for cooking or
3 U.S. industry officials, interview by USITC staff, Oct. 4, 2002. Semolina is coarsely milleddurum wheat, as opposed to durum wheat flour, which is finely milled durum wheat. 4 Data are not available for 2001. 5 U.S. Bureau of the Census, Annual Survey of Manufacturers 2000, Feb. 11, 2002. 6 U.S. industry officials, interview by USITC staff, July 29, 2002.
4
for incorporation into downstream products such as canned soup or boxed macaroni andcheese. Other forms of pasta include wet-extruded pasta, which is not dried and typically isimmediately incorporated into a downstream product, such as soups; fresh and frozen pasta;and oriental style noodles. Virtually all dry pasta produced in the United States is producedusing a mixture of durum wheat semolina and water.3 For egg noodles however, U.S.produces typically use finer durum flour because of the flour’s smaller particle size.
U.S. INDUSTRY PROFILE
Dry pasta manufacturing is primarily contained in NAICS code 311823. Fresh pastaproduction is contained in NAICS code 311994, perishable prepared food manufacturing,while pasta specialties production, which includes ready-to-eat meals containing pasta, arecontained in NAICS code 3117, fruit and vegetable preserving and specialty foodmanufacturing. The vast majority of the pasta produced and consumed in the United Statesis dry pasta. U.S. dry pasta producers estimate total U.S. consumption to be approximately4 billion pounds per year. A survey commissioned by the Italian trade association, UnionIndustriali Pastai Italiani (UN.I.P.I.), and reflecting 2000 data, estimated U.S. per capitaconsumption to be approximately 20 pounds per year, (or approximately 5.5 billion poundsbased on the U.S. population in 2000).
Dry Pasta
Employment
Employment in the dry pasta products industry has declined steadily since 1997, from 6,063to 4,315 in 2000,4 a decline of 29 percent. This decline in employment has occurred inconjunction with a decrease in the number of pasta production facilities in the United Statesover the same period.5 The number of establishments has declined by 12 percent, in 1997 to239 in 1999. These declines can likely be attributed to significant consolidation in the U.S.industry and improvement in production technology. The most modern pasta productionfacilities have achieved production rates twice those of facilities built only 10 years ago.6
7 In 1995, the top five U.S. producers accounted for approximately 70 percent of U.S.production of dry pasta. The top five U.S. producers at that time included Borden Foods, whosebusiness was purchased by AIPC and New World Pasta. It also included the Hershey Pasta Groupwhich is now New World Pasta. These consolidations likely increased the total share of themarket held by the top companies. USITC Certain Pasta from Italy and Turkey. inv. Nos. 701-TA-365-366 (Final) and 731-TA-734-735 (Final), USITC pub. No. 2977, July 1996. Additionally,trade press reports indicate that in 2001, the top three U.S. producers, AIPC, New World Pasta,and Dakota Growers Pasta Company controlled 62 percent of the U.S. market. Prairie PastaProducers, company press release, Dec. 9, 2001. 8 American Italian Pasta Company Press Release, “American Italian Pasta Company AqiresMartha Goods and Larosa Pasta Brands in the U.S. and Lensi Pasta Brand in Italy,” Oct. 2, 2002. 9 National Pasta Association, found at http://www.ilovepasta.org/npa_companies.html,retrieved May 2, 2002.
5
Concentration
The dry pasta industry in the United States is characterized by a high degree ofconcentration. The major U.S. producers include New World Pasta, American Italian PastaCompany (AIPC), Barilla America (Barilla), and the Dakota Growers Pasta Company(Dakota Growers). Although an exact industry concentration ratio is not available, thesecompanies account for the vast majority of all retail sales of branded pasta and a significantportion of the private label sales as well.7 These companies account for a smaller share of theingredient market. The major producers distribute their product nationally using severaldifferent brand names and through private label brands.
The level of industry concentration is partially the result of significant merger andacquisition activity in the industry over the last 5 years. The two key consolidations withinthe industry were the sale of Borden Foods pasta production facilities and brand names toNew World Pasta and American Italian Pasta and the purchase of the Mueller's pasta brandfrom Bestfoods by American Italian Pasta. In July 2001, American Italian Pasta purchasedseven regional brand names from Borden Foods. At the same time New World Pastapurchased 11 pasta brands and 6 manufacturing facilities in the United States, Canada, andItaly from Borden Foods. These two transactions marked Borden Foods exit from the pastaindustry. In November 2001, American Italian Pasta purchased the Mueller's brand fromBestfoods. American Italian Pasta had been performing the manufacturing and distributionof the Mueller's brand for Bestfoods since 1997. In October 2002, American Italian Pastapurchased the Martha Gooch and LaRosa pasta brands from Archer Daniels Midland in theUnited States, and purchased the Lensi brand of pasta from Pastificio Lensi in Italy.8
The balance of U.S. production is provided by a number of smaller, regional pasta producers.Included among these are Philadelphia Macaroni, A. Zerega's Sons, and Golden GrainMacaroni. Philadelphia Macaroni and A. Zerega’s Sons produce primarily for the foodservice and ingredient markets. Golden Grain Macaroni, formerly part of the Quaker OatsCompany, is now part of PepsiCo, and markets its products primarily in the Western UnitedStates. The National Pasta Association lists 12 additional U.S. pasta producers.9Additionally, a number of processed foods companies operate pasta production facilitiesstrictly for captive consumption.
While New World Pasta, American Italian Pasta, and Dakota Growers are U.S. companies,Barilla America (Barilla) is the U.S. subsidiary of Barilla S.p.A., an Italian producer andexporter of pasta. In 1998, Barilla opened a large durum milling and pasta production facility
10 “Barilla sees U.S. as major step in global presence,” Milling & Baking News, Dec. 9, 1997. 11 U.S. Bureau of the Census, Survey of Plant Capacity 2000, Jan. 2002. 12 U.S. Bureau of the Census, Survey of Plant Capacity 2000, Jan. 2002. 13 Data provided by North American Millers Association. 14 Milling & Baking News, Aug. 14, 2001; Rural Cooperatives Magazine, Jan./Feb. 2001; andstaff interviews. 15 “New World Pasta to boost production capacity with high-speed pasta manufacturing line,”Milling & Baking News, Apr. 30, 2002. 16 “In the Wake of the Break,” Milling & Baking News, July 9, 2002. 17 “Revised data confirm downward trend in U.S. milling rate,” Milling & Baking News,Aug. 28, 2001.
6
in Ames, Iowa. According to trade press accounts, this facility reportedly has the capacityto produce between 130 million and 155 million pounds of pasta annually.10
Capacity and Capacity Utilization
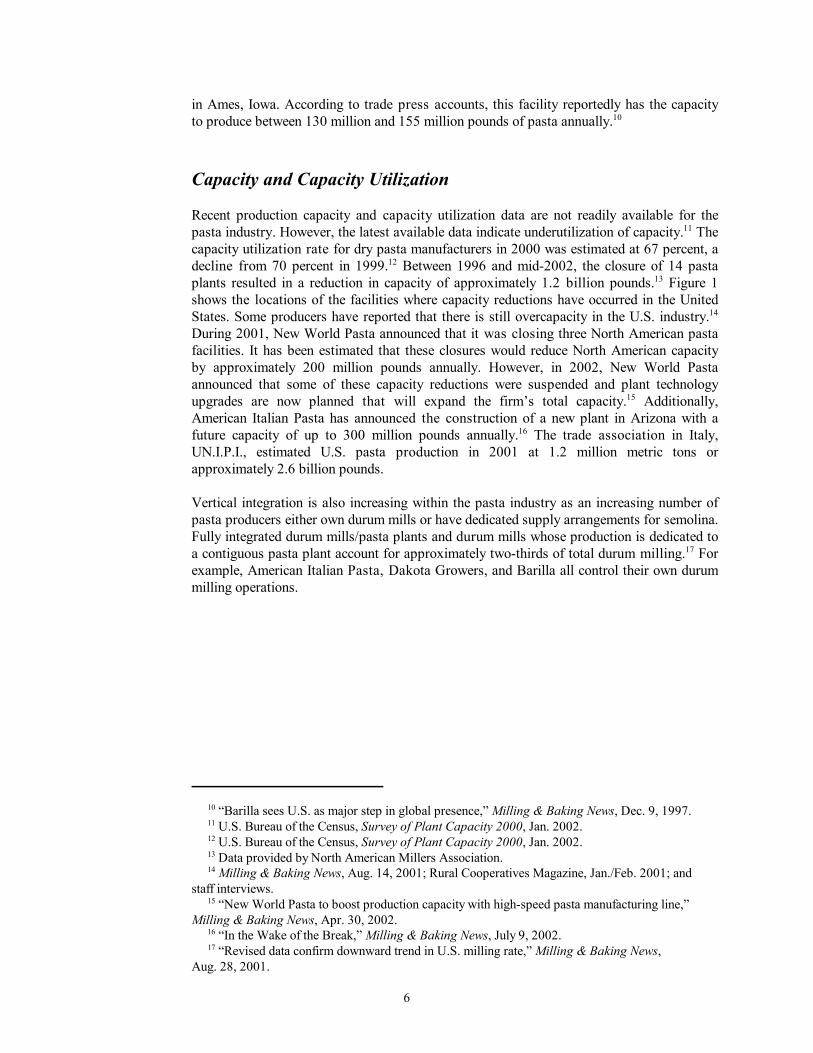
Recent production capacity and capacity utilization data are not readily available for thepasta industry. However, the latest available data indicate underutilization of capacity.11 Thecapacity utilization rate for dry pasta manufacturers in 2000 was estimated at 67 percent, adecline from 70 percent in 1999.12 Between 1996 and mid-2002, the closure of 14 pastaplants resulted in a reduction in capacity of approximately 1.2 billion pounds.13 Figure 1shows the locations of the facilities where capacity reductions have occurred in the UnitedStates. Some producers have reported that there is still overcapacity in the U.S. industry.14
During 2001, New World Pasta announced that it was closing three North American pastafacilities. It has been estimated that these closures would reduce North American capacityby approximately 200 million pounds annually. However, in 2002, New World Pastaannounced that some of these capacity reductions were suspended and plant technologyupgrades are now planned that will expand the firm’s total capacity.15 Additionally,American Italian Pasta has announced the construction of a new plant in Arizona with afuture capacity of up to 300 million pounds annually.16 The trade association in Italy,UN.I.P.I., estimated U.S. pasta production in 2001 at 1.2 million metric tons orapproximately 2.6 billion pounds.
Vertical integration is also increasing within the pasta industry as an increasing number ofpasta producers either own durum mills or have dedicated supply arrangements for semolina.Fully integrated durum mills/pasta plants and durum mills whose production is dedicated toa contiguous pasta plant account for approximately two-thirds of total durum milling.17 Forexample, American Italian Pasta, Dakota Growers, and Barilla all control their own durummilling operations.
18 Euromonitor, Packaged Food in the United States, Nov. 2001. 19 Ibid. 20 “Borden breakup bestirs pasta category,” Milling & Baking News, Aug. 14, 2001 and“Credible Coverage, advertising needed to solve pasta perception problem,” Milling & BakingNews, May 29, 2001. 21 Euromonitor, Packaged Food in the United States, Nov. 2001.
7
Millions pounds of capacity per region
Source: North American Millers Association.
100
110
70
25
145
19080
185
65
160
Total: 14 pasta plants 1.16 billion pounds per year
30
Figure 1U.S. pasta capacity reductions due to plant closures, 1996-2002
Fresh, Frozen, and Refrigerated Pasta
Frozen or refrigerated pasta represents a smaller market than dry pasta. This market isestimated to account for less than 10 percent of the total pasta market in the United States.18
These pasta products are generally higher priced than dry pasta products. Sales of chilledpastas have experienced some decline during 1997-2000. Retail sales have declined fromapproximately $203 million in 1997 to $190 million in 2000.19 This decline in sales has beenattributed to shifts in consumer tastes.20 These products are marketed at higher price pointsthan dry pasta and have historically been targeted at single or two-person households.However, during 1997-2000, these types of households increasingly ate out or purchasedcomplete frozen or chilled ready-to-eat meals.21 Nestle S.A., Kraft Foods, Inc., and MontereyPasta Company are among the industry leaders in frozen/chilled pasta products. Nestlemarkets its products under the Contadina and Buitoni brand names while Kraft Foodsmarkets its products using the DiGiorno brand name.
22 Bakery Production and Marketing Red Book, 2001. 23 U.S. industry officials, interviewed by USITC staff, Oct. 11, 2002. 24 Ibid., July 29, 2002. 25 Data provided by U.S. industry.
8
U.S. Market
Consumer Characteristics and Factors Affecting Demand
Total U.S. consumption of dry pasta is estimated to be approximately 4 billion poundsthrough all channels: retail, ingredient, and food service. Consumption of dry pasta in theretail channel has trended downward over the last 5 years, although the rate of decline hasslowed in the last year.22 The value of shipments of dry pasta declined from $1.8 billion in1997 to $1.2 billion in 2000, or by approximately 33 percent (table B-2). The U.S. industrybelieves that the Census figures overstate the decline in U.S. shipments. Specifically,industry sources indicate that the growth in the ingredient market, which may not be fullycaptured in the Census data, has been sufficient to offset the decline in retail consumption.23
There are several hypotheses that may account for the apparent discrepancy between theCensus data and the U.S. industry’s data. First, the Census data are presented in value terms,while the industry data are in unit terms. Pasta prices have declined or been stable during1997-2001, which could contribute to some decline in the total value of shipments. Second,a significant portion of the production of pasta for the ingredient market is captiveconsumption and therefore may not be fully captured in the Census data. The different U.S.industry estimates suggest that dry pasta consumption during 1997-2001 has ranged fromstable to consumption growth of up to 2 percent per year.24
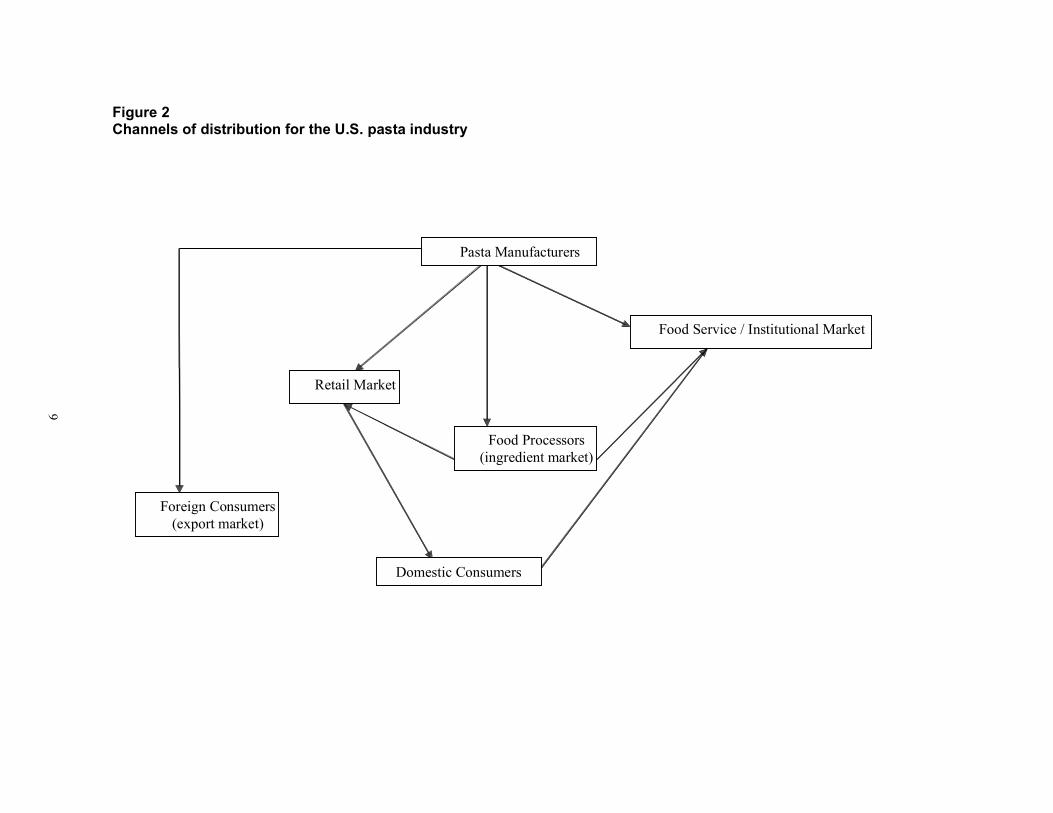
Channels of Distribution
Retail sales
The majority of pasta products are sold to retail, food service, and ingredient customers.Figure 2 presents the channels of distribution for the dry pasta market. The retail marketrepresents the largest portion of sales for independent dry pasta producers. The retail marketaccounts for an estimated 35 percent of the total pasta market.25 The retail market includessales of both private label and branded pasta products. The main channels of distribution forthe retail market are grocery stores, mass merchants, and club stores. Unlike some other foodmarkets, brand names do not provide a significant competitive advantage over non-brandedproducts. In the pasta market, branded and private label products have historically competedon the basis of price. This price based competition prevents significant retail pricedifferences between branded and private label products. Additionally, supermarkets tend toprefer private label products where possible because they generally realize a higher marginon sales of private label products.
9
Figure 2 Channels of distribution for the U.S. pasta industry
Retail Market
Food Processors (ingredient market)
Food Service / Institutional Market
Foreign Consumers (export market)
Pasta Manufacturers
Domestic Consumers
26 Pasta Journal, Sept./Oct. 1995; New World Pasta, SEC Form 10-K, for fiscal year endedDec. 31, 2001; Dakota Growers Pasta Company, SEC Form 10-K, for fiscal year ended July 31,2001; and American Italian Pasta Company, SEC Form 10-K, for fiscal year ended Sept. 30,2001. 27 U.S. industry officials, interview by USITC staff, Oct. 17, 2002. 28 “Barilla sees U.S. as major step in global presence,” Milling & Baking News, Dec. 9, 1997. 29 “Borden breakup bestirs pasta category,” Milling & Baking News, Aug. 14, 2001. 30 Rankings are based on data provided by Information Resources, Inc. and cite data for the52 weeks ended June 17, 2001, in U.S. supermarkets with annual sales of $2 million or more.These data may actually understate the market share of private label pasta, since they do notcapture sales at mass merchants or warehouse stores, which perhaps more heavily promote thesale of private label product than grocery stores. As a result, the data likely understate the extentof private label sales from this rapidly growing retail segment. 31 “Pizzazz, portability and price the pursuit for pasta preference,” Milling & Baking News,June 13, 2000.
10
Most consumers see dry pasta as a commodity product and therefore base their purchasingdecisions on price, which further reinforces the price-based competition between brandedand private label products.26 These price-based decisions can influence the selection ofprivate label pasta over products sold under brand names. Additionally, there are someindications that retailers' marketing activity leads to lower retail prices for pasta. Someretailers use pasta as a loss leader to bring consumers into their stores.27 Also, the growth inpopularity of mass merchant and discount chains, such as Costco or Sam's Club, hascontributed to increased purchases of private label brands and in larger, lower per unit costpackages.
Store brands or private label products are produced by a number of domestic pastaproducers. American Italian Pasta is the leading producer of private label pasta. New WorldPasta, the largest domestic producer by market share, produces both branded and privatelabel product, although private label products account for a relatively smaller share of itssales. Additionally, Dakota Growers markets its product under such store brands as Kroger,Fred Meyer, Ralphs, First Choice, and FMV.
U.S. producers selling brand name products tend to operate using several regional brandnames. Dakota Growers utilizes its own brand names: Dakota Growers, Zia Briosa, and PastaSanita in North Dakota and South Dakota, Minnesota, and Montana. American Italian Pastaacquired a number of regional brands from Borden Foods, including Anthony's, Globe/A-1,Luxury, Mrs. Grass, Pennsylvania Dutch, R&F, and Ronco. Products with regional brandname recognition produced by New World Pasta include Ronzoni, Creamette, San Giorgio,American Beauty, and Skinner.
Only Barilla, which supplies the U.S. market through a combination of U.S. production andimports, has attempted to establish a national brand identity for its pasta.28 Theregionalization of brands can be observed among top selling pasta brands. The top sellingbrand in the United States. is actually the aggregate of all private label brands.29 Private labelis followed by Barilla, Ronzoni, Mueller's, Creamette, San Giorgio, American Beauty,Skinner, Price, and Gold Grain Mission.30 Further, regional brands may bear the brunt ofdeclines in consumer spending on pasta. Data compiled by Information Resources, Inc. (IRI)for the 52 weeks ending April 23, 2000, show that private label and Barilla brand productsare the only major brands showing any significant increase in sales values.31 After privatelabel and Barilla, four of the next five brands had declining dollar share and one held even.Some of these trends may be explained by the marketing strategies employed. Producers
32 Data provided by industry. 33 U.S. industry officials, interview by USITC staff, Aug. 17, 2002 and Oct. 11, 2002. 34 Ibid. 35 Ibid
11
generally compete on price, not only with other branded products, but with private labelproducts as well. Further, advertising is often limited to coupons and in-store displays.
Food service markets
The primary pasta consumers in the food service market include restaurants, hotels, schooland office cafeterias, hospitals, and other away-from-home eating establishments. The foodservice market is estimated to account for approximately 20 percent of the dry pastamarket.32 Consumers in this market generally purchase pasta through distributors.
Ingredient market
The ingredient market includes pasta used for prepared meals, such as macaroni and cheese;frozen, refrigerated, and canned meals; soups; and baby food. U.S. producers estimate thatthe ingredient market represents as much as 45 percent of the total domestic dry pastamarket. However, as noted above, a number of the companies that produce productscontaining pasta produce their own pasta for these products. Industry representativesestimate that approximately two-thirds of the pasta used in the ingredient market is producedinternally.33 Thus, while this market may represent a significant share of total pastaconsumption, it is a limited market for independent U.S. pasta producers. Recently,American Italian Pasta has made significant in-roads into this market, capturing market sharefrom smaller regional producers.34
Production for the ingredient market requires very strict quality control.35 Some U.S.producers have commented that the quality control measures for the ingredient market aremore strict than those for the retail market. These higher quality control requirements canresult in higher production costs for producers selling to the ingredient market. Suchrequirements are set by the company producing the final product.
Co-pack
An additional means of product distribution are co-pack arrangements. Co-packarrangements involve the sale of pasta between pasta manufacturers. These sales are used tosupply product to manufacturers that cannot currently produce the full quantity required tomeet their customers needs.
36 “Revised data confirm downward trend in U.S. milling rate,” Milling & Baking News,Aug. 28, 2001. 37 Pasta Journal, Sept./Oct. 1995; New World Pasta, SEC Form 10-K, for fiscal year endedDec. 31, 2001; Dakota Growers Pasta Company, SEC Form 10-K, for fiscal year ended July 31,2001; and American Italian Pasta Company, SEC Form 110-K, for fiscal year ended Sept. 30,2001. 38 Euromonitor, Packaged Food in the United States, Nov. 2001. 39 Pasta Journal, Sept./Oct. 1995; New World Pasta, SEC Form 10-K, for fiscal year endedDec. 31, 2001; Dakota Growers Pasta Company, SEC Form 10-K, for fiscal year ended July 31,2001; and American Italian Pasta Company, SEC Form 110-K, for fiscal year ended Sept. 30,2001. 40 Ibid. 41 “Credible coverage, advertising needed to solve pasta perception problem,” Milling &Baking News, May 29, 2001.
12
Consumption
There is some belief within the industry that demand for pasta is slightly counter-cyclical tothe general economic climate. As pasta is a relatively less expensive food staple, demand forpasta increases when the economy slows. An increase in economic activity does notnecessarily increase consumption of pasta, as consumers may substitute more expensiveproducts for pasta.36
Trends in U.S. consumer characteristics have led to a decline in pasta consumption. U.S.apparent consumption declined in each year from 1997 to 2000, from approximately$2 billion in 1997 to $1.4 billion in 2000 (table B-2). The decline in consumption hasprimarily been absorbed by U.S. producers, since import market share increased from16 percent in 1997 to 24 percent in 1999 and remained at 24 percent in 2000. Three majorchanges reportedly have had negative impacts on pasta consumption: an increase in theconsumption of ready-to-eat meals, dining out, and the popularity of fad diets that stressminimizing the consumption of carbohydrate rich foods such as pasta.37
American consumers have increasingly demanded more convenient meal options in termsof faster preparation with less preparation effort. As a result, the consumption of ready-to-eatmeals has increased dramatically. At least some of this growth has come at the expense ofretail sales of dry pasta products.38 In addition, as average household incomes rose throughthe year 2000, more consumers dined out. Again, some of this growth in dining out came atthe expense of home preparation of dry pasta.
Within the pasta industry, a considerable amount of attention has been given to the impactof diet plans, such as the Atkin’s diet, that stress reduced consumption of carbohydrate richfoods such as pasta and instead focused on high protein foods.39 There is concern within theindustry that these diets have influenced consumers to believe that pasta is an unhealthy orless healthy food.40 This is a new phenomenon in the pasta industry as pasta has historicallyhad a strong image as a healthy food. A survey commissioned by the American BakersAssociation and the Wheat Foods Council found that 50 percent of consumers recentlypolled believe that pasta is fattening, up from 40 percent in 1998 and up from 11 percent in1995.41 The healthiness of pasta consumption will likely remain an important issue for theindustry, as recent public attention on obesity rates in the United States will continue toprovide a forum for advocates of low-carbohydrate diets.
42 Baking Production and Marketing Redbook, 2001. 43 U.S. Bureau of the Census, Annual Survey of Manufacturers 2000, Feb. 11, 2002. 44 U.S. industry officials, interview by USITC staff, Oct. 17, 2002. 45 Ibid., Oct. 4, 2002. 46 At the end of 2001, U.S. growers of hard red spring wheat and durum wheat had filedcountervailing duty and antidumping petitions against U.S. imports from Canada.
13
The most recent market data appear to indicate that the decline in dry pasta consumption mayhave bottomed out.42 As noted above, the two largest U.S. producers have announced capitalexpenditures on new plants and production equipment. Although some of this new capacityis likely to come at the expense of less efficient existing capacity, total capacity shouldincrease. Additionally, there is anecdotal evidence from trade press reports that some of thesmaller, regional pasta producers are also contemplating capacity expansions.
U.S. Shipments
The U.S. dry pasta industry has faced declining sales over the last several years. Shipmentsof dry pasta fell steadily from $1.8 billion in 1997 to $1.2 billion in 2000, a decline of33 percent (table B-1).43 However, as noted earlier, the U.S. industry believes that the Censusdata likely overstate the total decline in the pasta market. Estimates provided by the U.S.industry for dry pasta consumption during 1997-2001 ranged from stable to consumptiongrowth of up to 2 percent per year.
Factors Affecting Production
While a number of factors impact the cost of production for pasta manufacturers, two of themore important factors are energy and wheat costs. Energy costs are an important factor inpasta production. The drying process requires the use of high temperature ovens,44 risingenergy costs, and in particular, spikes in energy costs in the recent past have adverselyaffected U.S. pasta producers.
The supply, quality, and price of durum wheat is another major cost factor for pastaproducers. Durum production in the United States has fluctuated over the last 5 crop yearswhile the use of durum for food products has increased (table B-3). U.S. pasta producershave indicated that the United States is unable to produce sufficient amounts of durum wheatat the quality required for pasta production and therefore imports are necessary for theiroperations.45 Imports of durum have ranged from between 14 percent and 20 percent of thetotal supply of durum between the 1997/98 crop year and the 2001/02 crop year. Importsheld their highest market share during the 1997/98 and 2001/02 crop years, when domesticdurum production was at its lowest levels. Durum prices have declined steadily since the1997/98 crop year. Prices have fallen approximately 46 percent between the 1997/98 cropyear and the 2000/01 crop year. However, many of the wheat growing regions in the UnitedStates and Canada experienced significant drought in 2002, resulting in increasing prices fordurum wheat.46
47 Cost of materials includes all raw materials, semifinished goods, fuels consumed for heat andpower, purchased electricity, and the cost of contract work.
14
In spite of declining wheat costs, the cost of materials as a percentage of shipment value fordry pasta increased each year from 1997 to 2000 (table B-4). Cost of materials has risen fromapproximately 41 percent of shipments value in 1997 to approximately 52 percent in 2000.47
This may be partially attributable to stagnant retail prices for dry pasta. The averageannualized price for spaghetti and macaroni rose by only 5 percent from 1997 through thefirst 6 months of 2002 (table B-5).
U.S. TRADE
Overview
The United States has a sizeable trade deficit with respect to pasta products (table B-6). In2001, the value of U.S. imports for consumption of all pasta products totaled approximately$324 million, and U.S. exports of pasta products were valued at approximately $148 million.However, U.S. exports are increasing more rapidly than imports. From 1997 to 2001, U.S.imports have increased by 4 percent, or $13.4 million, while U.S. exports increased38 percent, or $41.1 million. As a result, the trade deficit shrank somewhat from its high of$203 million in 1997 to $176 million in 2001. The United States has a trade deficit will allsignificant exporting countries except Canada.
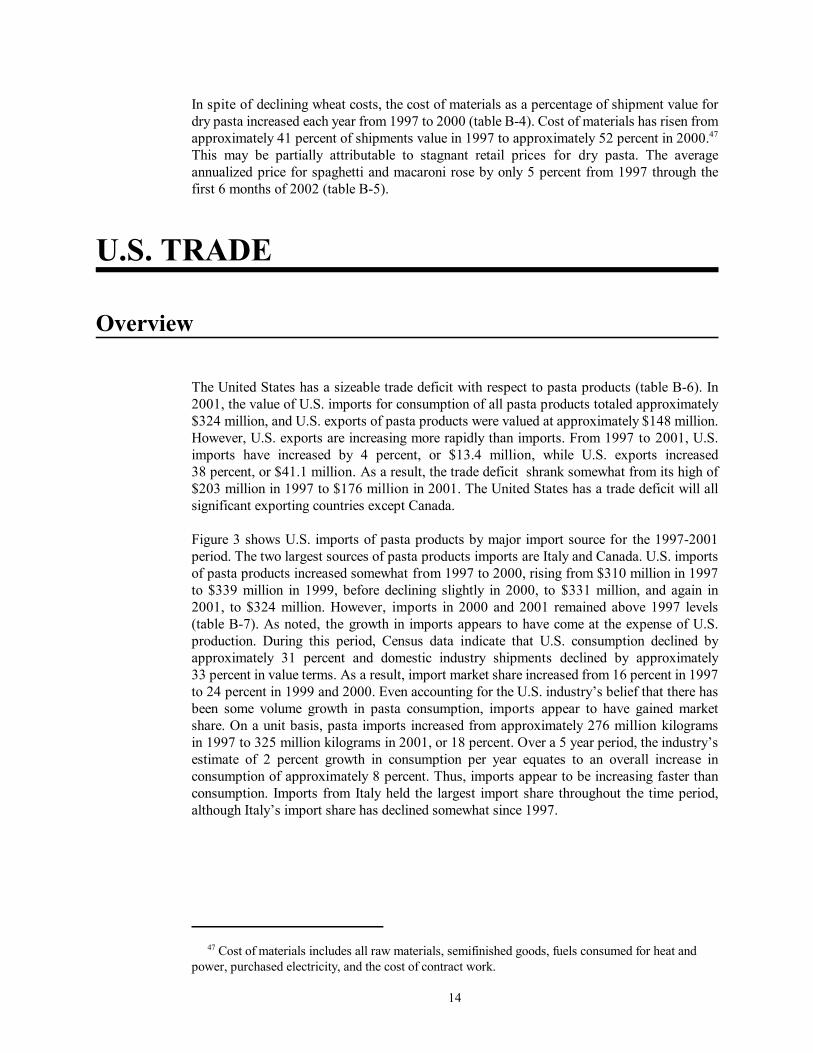
Figure 3 shows U.S. imports of pasta products by major import source for the 1997-2001period. The two largest sources of pasta products imports are Italy and Canada. U.S. importsof pasta products increased somewhat from 1997 to 2000, rising from $310 million in 1997to $339 million in 1999, before declining slightly in 2000, to $331 million, and again in2001, to $324 million. However, imports in 2000 and 2001 remained above 1997 levels(table B-7). As noted, the growth in imports appears to have come at the expense of U.S.production. During this period, Census data indicate that U.S. consumption declined byapproximately 31 percent and domestic industry shipments declined by approximately33 percent in value terms. As a result, import market share increased from 16 percent in 1997to 24 percent in 1999 and 2000. Even accounting for the U.S. industry’s belief that there hasbeen some volume growth in pasta consumption, imports appear to have gained marketshare. On a unit basis, pasta imports increased from approximately 276 million kilogramsin 1997 to 325 million kilograms in 2001, or 18 percent. Over a 5 year period, the industry’sestimate of 2 percent growth in consumption per year equates to an overall increase inconsumption of approximately 8 percent. Thus, imports appear to be increasing faster thanconsumption. Imports from Italy held the largest import share throughout the time period,although Italy’s import share has declined somewhat since 1997.
15
Figure 3U.S. imports of pasta products, by major import source, 1997-2001
48 U.S. industry officials, interviewed by USITC staff, July 29, 2002. 49 Canadian and U.S. industry officials, interviews by USITC staff, July 29, 2002 and Oct. 11,2002.
16
Several U.S. producers import pasta, and the two largest U.S. pasta producers also operatepasta production facilities overseas. American Italian Pasta opened a pasta plant in Italyduring 2001 to serve the private label markets in the United States and Europe. New WorldPasta acquired pasta production facilities in Canada and Italy from Borden Foods in 2001.
U.S. Imports
Principal Suppliers and Import Levels
Italy
The U.S. market is an important one for Italian producers. According to the Italian tradeassociation, approximately 10 percent of all exports of pasta are shipped to the U.S. market.U.S. imports from Italy declined from $154 million in 1997 to $108 million in 2000, beforerecovering slightly to $116 million in 2001. However, Italy remained the largest source ofimports in each year. The two factors that are likely responsible for the decline in importsfrom Italy are the antidumping and countervailing duty order on imports from Italy (seesection below) and the completion of Barilla’s pasta plant in Iowa. The antidumping andcountervailing duty orders were imposed on non-egg, dry pasta from Italy and Turkey in1996, and a circumvention investigation was completed in 1998. The vast majority(approximately 88 percent of imports in 2001) of imports from Italy consist of non-egg, drypasta (table B-8). The completion of the Barilla pasta plant in Iowa allowed Barilla to supplythe U.S. market with U.S. production.
Canada
U.S. imports from Canada have increased notably during 1997-2001, from $39 million in1997 to $100 million 1999, declining slightly to $96 million in 2000, and more substantiallyto $77 million in 2001. The decline in imports from Canada in 2001 was the primary causeof the decline in total imports in 2001, and more than offset the modest increases in importsfrom Italy and all other countries. U.S. pasta producers have expressed surprise at the rateof growth in imports of pasta from Canada.48
Canadian exporters enjoy advantages not available to other exporting nations. Foremostamong these are NAFTA preferences and geographic proximity to major U.S. markets.While almost all pasta products have entered the U.S. market free of duty following theUruguay Round, NAFTA has provided Canada with zero tariffs on the small number ofproducts not normally conferred duty free status. Canadian exporters have indicated that theincreased efficiency and speed with which imports are processed by the U.S. CustomsService are the real benefits of NAFTA.49
50 U.S. industry officials, interview by USITC staff, July 29, 2002.
17
Additionally, Canadian producers enjoy a geographic proximity to major U.S. East Coastmarkets, which is a significant competitive advantage when dealing with perishable foodproducts. The Canadian industry is positioned to take advantage of this proximity. PriorCensus information reported that in 1999, 58 percent of pasta production establishments inCanada were located in Ontario and Qúebec, close to the major U.S. East Coast markets.Imports from Canada also serve a complimentary role in the U.S. market, at least one U.S.producer notes that it imports from Canada specialty shapes or pasta types not otherwisemanufactured in its U.S. plants.50
Unlike imports from Italy, a slight majority of imports from Canada in 2001 consisted ofpasta products other than non-egg, dry pasta. Approximately 33 percent of imports fromCanada consisted of pasta packaged with sauce preparations and approximately 21 percentconsisted of canned or frozen pasta (table B-9). The combination of the fact that Canadareceives duty free treatment for these products under NAFtA, while products from Italy aresubject to a tariff of 6.4 percent ad valorem, and the shorter transport distances from Canadato the United States likely contribute to the difference in the form of pasta products exportedfrom these countries to the United States
U.S. trade measures
Tariff measures
Most pasta products imported from countries with normal trade relations status enter theUnited States free of duty. All dry pasta enters the United States free of duty, while pastapackaged with sauce preparations, stuffed pasta, and other canned and frozen pasta aresubject to a tariff rate of 6.4 percent ad valorem. However, some of these pasta productsimports enter the United States free of duty under several trade agreements, includingNAFTA, Generalized System of Preferences, Caribbean Basin Economic Recovery Act,U.S.- Israel Free Trade Area, and the Andean Trade Preference Act. Additionally, productsentering the United States under the U.S.- Jordan Free Trade Implementation Act are subjectto a tariff of 1.6 percent ad valorem in 2003.
Nontariff measures
Imports of pasta products to the United States are subject to three significant nontariffmeasures. These are the U.S.-EU Pasta Agreement, and antidumping orders andcountervailing duty orders against imports from Italy and Turkey. The U.S.-EU PastaAgreement was originally designed to address export rebates provided by the EU tocompanies exporting pasta produced using European durum wheat. Under this agreement,the EU committed to providing export rebates to only 50 percent of its exports to the UnitedStates. Shipments that did not receive the rebate were generally products produced under theInward Processing Regime (see below for more information on the Inward ProcessingRegime). While this agreement is still in effect, the EU no longer provides rebates tocompanies using wheat grown in the EU.
51 See USITC, Certain Pasta from Italy and Turkey, inv. Nos. 701-TA-365-366 (Final) and731-TA-734-735 (Final), USITC pub. No. 2977, July 1997. 52 Federal Register, 63 FR 43905 (Aug. 17, 1998) and 66 FR 11269 (Feb. 23, 2001). 53 Federal Register, 65 FR 77852 (Dec. 13, 2000). 54 USITC Certain Pasta from Italy and Turkey, inv. Nos. 701-TA-365-366 (Review) and731-TA-734-735 (Review), USITC pub. No. 3462, Oct. 2001.
18
U.S. Government trade-related investigations
In 1996, the U.S. industry filed a countervailing duty (CVD) and antidumping (AD) petitionwith the U.S. Department of Commerce and the U.S. International Trade Commission onimports of non-egg, dry pasta in packages of 5 pounds or less from Italy and Turkey.51 Thepetition alleged that exports of this product were subsidized and were being sold in theUnited States at less than fair value (dumped). Following affirmative decisions by bothagencies, the U.S. Department of Commerce issued CVD and AD duty orders against certainpasta from both countries. As the result of an antidumping and countervailing dutyinvestigation, both dumping and CVD orders were issued on imports of non-egg, dry pastafrom Italy and Turkey in 1996. For Italy the initial CVD rates calculated by the Departmentof Commerce ranged from 0 percent to 11.23 percent depending on the specific companyinvolved, with an “all others” rate of 3.85 percent.52 For Turkey the initial CVD rates rangedfrom 3.87 percent to 15.82 percent with an “all others” rate of 9.38 percent. The initial ADrates for Italy ranged from 0 percent to 46.67 percent with an “all others” rate of11.26 percent. The highest rate, 46.67 percent, was assigned to the Italian producer DeCecco, with the next highest rate being 19.09 percent. For Turkey the initial dumpingmargins ranged from 60.87 percent to 63.29 percent. The “all others rate” for Turkey was60.87 percent. In December 2000, the Department of Commerce revoked the dumping orderagainst De Cecco, having found that De Cecco had made sales in commercial quantities atnot less than normal value for three consecutive administrative reviews.53 Following theimposition of the CVD and AD orders imports from Turkey declined significantly. Turkeyis no longer a leading supplier of pasta to the U.S. market. However, imports from Italyincreased in the two years immediately following issuance of the order (table B-8).
In 1998, the Department of Commerce completed a circumvention investigation in which itfound that the importation of pasta in bulk and subsequent repackaging in the United Statesinto packages of five pounds or less by the Italian producer and exporter Barilla constitutedcircumvention of the antidumping duty order on pasta from Italy. After this determination,imports of non-egg, dry pasta from Italy decreased to an amount below the 1996 level andremained there through 2001. However, the decline in imports from Italy also coincided withthe opening of Barilla's pasta facility in the United States. It is possible that some of thisdecline in imports is attributable to the opening of Barilla’s U.S. plant. Imports from Italyhave accounted for the largest share of U.S. imports in each year since the originalinvestigation in 1996. Total import volume of all pasta products from Italy continued toremain above its 1996 level during the 1997-1999 period and fell below the 1996 level in2000. However, total imports increased in 2001 and once again were above the 1996 level.
In October of 2001 the U.S. International Trade Commission conducted an expedited 5-yearSunset Review of the CVD and AD orders against Italy and Turkey. It found that revocationof the orders would likely lead to a continuation or recurrence of material injury to the U.S.industry and therefore the orders remained in place.54
55 “U.S. pasta subsidies slammed by Canadian producers,” found at www.just-food.com,May 27, 2002. 56 See USITC Processed Foods and Beverages: A Description of Tariff and Non-TariffBarriers for Major Products and Their Impact on Trade, inv. No. 332-421, USITC pub.No. 3455, Oct. 2001. 57 Ibid.
19
Under the Continued Dumping and Subsidy Offset Act of 2000 (known as the ByrdAmendment) the U.S. Customs Service disbursed approximately $17.5 million in FY2001in dumping duties it had collected under these orders to U.S. pasta producers. U.S. producersreceiving disbursements included New World Pasta, Philadelphia Macaroni, A. Zarega'sSons, Gooch Foods, and American Italian Pasta. Canadian pasta producers have indicatedthat they consider these payments to be a subsidy and the Canadian Government isparticipating in a challenge to the program in the World Trade Organization.55
U.S. Exports
Principal markets and export levels
U.S. exports of pasta products have increased irregularly from $107 million in 1997 toapproximately $148 million in 2001 (table B-10). U.S. exports saw impressive growth from1997 to 1998. However, exports declined somewhat in 1999 and 2000, although remainingabove 1997 levels, before recovering slightly in 2001. Canada is by far the largest exportmarket for U.S. producers, accounting for between 71 percent and 82 percent of all exportsfor the period reviewed. Additionally, the United States exports more pasta products toCanada ($121 million in 2001) than it imports from Canada ($77 million in 2001). The U.S.had a trade surplus in pasta products with Canada for each year of the 1997-2001 period.Canada’s importance as an export market for U.S. pasta products has grown, as indicated byCanada’s increasing share of total exports. There has also been some minor growth inexports to Japan. Non-egg, dry pasta represents an important and somewhat growing shareof U.S. exports. At the same time exports of all types of frozen pasta have fallen sharply(table B-11).
Foreign trade measures
Tariff and nontariff measures
Contrasting with U.S. trade measures, foreign trade measures are often significant and arean important barrier to expanding U.S. exports. U.S. exports of pasta are subject to a varietyof tariff and non-tariff barriers. Tariffs on pasta products in major developed markets vary,with stuffed pastas having higher tariffs than dry or egg pasta. Pasta is subject to tariff ratequota (TRQ) on wheat in Canada, though retail-packed pastas with a package weight of lessthan 2.3 kg are not subject to the over-quota tariffs.56 Japan, the second-largest market forU.S. exports, applies specific tariff rates to dry pasta imports, ranging from ¥27/kg to ¥34/kg,while stuffed pastas are subject to ad valorem rates of up to 24 percent.57 As with most
58 Ibid. 59 “Borden breakup bestirs pasta category,” Milling and Baking News, Aug. 14, 2001. 60 World Grain, June 2000. 61 Did you know...? Facts about the Canadian Agri-Food Industry. Agriculture and Agri-FoodCanada.
20
grain-based foods, the EU applies a complex rate on dry pasta, while stuffed pasta is subjectto either an ad valorem rate or a specific tariff. Under NAFTA, Mexican tariffs on pastarange from 3 percent to 6 percent.58
The EU maintains a program designed to facilitate exports to non-EU member countriescalled the Inward Processing Regime (IPR). The IPR is a duty-relief program that allowscompanies to import raw materials or semimanufactured goods duty-free for use as inputsinto products that will subsequently be exported, if it is impractical to use EU sourcedmaterials. Additionally, goods imported under the IPR program are exempt from thevalue-added tax (VAT). Imports of pasta from Italy have benefitted from the IPR to varyingdegrees. Between 1997 and 2001, the share of imports from Italy that have utilized the IPRprogram has ranged from 9 percent to 42 percent (table B-12). The U.S. also exportssignificant quantities of durum wheat to Italy, although the degree to which these exportsbenefit from the IPR regime is unclear. The overall impact of this program is uncertain.
Foreign Investment
Foreign participation in the U.S. pasta market includes significant foreign investment inaddition to goods trade. Barilla America is the subsidiary of its Italian parent and is one ofthe largest dry pasta producers in the United States. Nestle S.A., a Swiss company, isinvolved in the frozen/chilled pasta market in the United States, through its U.S. andCanadian subsidiaries. Additionally, U.S. dry pasta producers have expanded theiroperations through foreign investments. These include the purchase of existing facilities,such as New World Pasta's purchase of Borden's pasta facilities in Canada, and newinvestments such as American Italian Pasta's development of a pasta facility in Italy.59
Foreign investment is not limited to the largest producers. Medallion Foods, based inTacoma, Washington, is a subsidiary of the Japanese pasta manufacturer Nisshin Foods.According to trade press reports approximately 85 percent of Medallion's production is forexport to the Japanese market.60
Foreign Market and Industry Profiles
Canada
Canadian agri-food industries are heavily dependent on the U.S. market. In 2000, 61 percentof all Canadian agri-food exports were to the United States.61 As discussed further below,Canadian exporters of grain based foods are even more dependent on the U.S. market thanCanadian food exporters as a whole. Canada is both the second largest source of U.S.
62 Statistics Canada, Canada at a Glance, 2002. 63 USDA, FAS, Canada Market Development Reports Canadian Bakery Market Profile: Breads, Rolls and Other Yeast Baked Products 2000, GAIN Report CA0006, Jan. 24, 2000. 64 U.S. industry officials, interview by USITC staff, July 29, 2002. 65 “U.S. Canadian pasta coops link,” Saskatoon News, Dec. 5, 2002.
21
imports of pasta products and the largest export market for U.S. producers. Among thereasons for this strong interdependence are the geographic proximity of the two markets, theexistence of an highly integrated and efficient transportation infrastructure, and very similarconsumer demographics.
According to Statistics Canada, 62 percent of Canada’s population lives in Ontario andQúebec.62 Additionally, for Canada as whole it is estimated that the majority of thepopulation of Canada resides within a 2 hour drive of the Canadian-U.S. border.63 The borderregions are interconnected by an extensive network of highways and rail lines. Thistransportation infrastructure greatly facilitates trade between the United States and Canada.Canadian producers are situated to take advantage of the geographic proximity of the U.S.and Canadian markets. Statistics compiled by Industry Canada report that in 1999,58 percent of Canada’s pasta production establishments was located in Ontario and Québec.
Additionally, consumer demographics in the United States and Canada are very similar,increasing the ability of producers to sell the same product in both markets. Per capita GDPin Canada is estimated at US$28,100, close to the per capita GDP in the United States of$36,000. Additionally, education levels and family size are also similar in Canada and theUnited States. These factors combine to integrate the U.S. and Canadian markets.
As a result of these factors, export sales have become increasingly important to Canadianproducers. Industry Canada reports that the export intensity of the Canadian pasta industry(measured as the ratio of domestic exports to manufacturing shipments) has increased fromslightly more than 10 percent in 1997 to nearly 40 percent in 1999.
The Canadian pasta industry consists of fewer companies than the U.S. industry, and U.S.manufacturers have a significant presence in the market. Some of the top pasta brands inCanada, Catelli and Lancia, were acquired from Borden Canada by New World Pasta as partof New World's purchase of assets from Borden Foods. Prior to this sale, Borden wasconsidered the largest participant in the Canadian pasta market. New World reports that itsbrands hold a 42-percent market share in the Canadian market.64 Also, as part of thatacquisition, New World Pasta acquired pasta production facilities in Canada as well.
Primo Foods, a subsidiary of Nabisco and now Kraft Foods, is a significant player in theCanadian market. Various trade press accounts reported Primo pasta as the leader or amongthe leaders in branded market share in Canada. Three other Canadian pasta manufacturersare GrissPasta Products, located in Québec, and Italpasta, and Ronzini Foods Canada Corp.in Ontario. Additionally, the Prairie Pasta Producers in Saskatchewan have entered into acooperative agreement with the North Dakota Growers Pasta Company. Prairie PastaProducers has received an option to purchase up to 25 percent of the Dakota Growers Pastacompany shares. Further, Prairie Pasta Producers has reached an agreement with theCanadian Wheat Board that will allow Prairie Pasta Producers to export durum wheat to theNorth Dakota Growers Pasta Company.65
66 Euromonitor, Packaged Food in Canada, Nov. 2001. 67 Ibid. 68 Data provided by the UN.I.P.I. 69 Ibid. 70 Ibid. 71 USDA, FAS, Italy Grain and Feed Annual 2002, GAIN Report IT2004, Feb. 22, 2002.
22
The market for dried pasta in Canada is considerably smaller than the U.S. market, estimatedat approximately $145 million in 2000, or approximately 244 million pounds.66 However,the Canadian market appears to share several consumer characteristics in common with theU.S. market. The market for dry pasta has been predominantly stagnant during 1998-2000,after having declined significantly during 1995-1998. Growth in the Canadian pasta marketis predominantly in the fresh pasta segment; however, the fresh market is still estimated tobe less than 5 percent of the dry pasta market.67
Additionally, Canada exports a significant quantity of durum wheat to the United States, themajority of which is used to produce pasta (table B-13). The value of Canadian exports tothe United States of pasta input products exceeds the value of Canadian pasta exports.
European Union
The European pasta industry and market is largely dominated by Italy. The Italian pastaindustry is large and very competitive. Unlike the U.S. industry, the Italian industry issignificantly fragmented, although a handful of major producers stand above the rest of theindustry. Official Italian statistics reported that in 2001, there were approximately 132 pastamanufacturing facilities in Italy with approximately 6,900 employees.68 There has been someconsolidation within the Italian industry as the number of production facilities has declined.The total number of production facilities fell from 152 in 1996 to 132 in 2001. Thisconsolidation appears to be the result of the closing of smaller production facilities. Thenumber of production facilities with rated production capacity of between 30 and 100 mt per24 hours fell from 33 to 26, and the number of facilities with rated production capacity ofless than 30 mt per 24 hours fell from 71 to 56.69 The number of facilities with a ratedcapacity of 100 mt or more per 24 hours remained unchanged.70 In 2000, Barilla andPastificio Rana were the two leading pasta producers in Italy, accounting for approximately30 percent of production. Additionally, Italian producers have increasingly expanded theirproduct offerings beyond pasta to soups, sauces, and other ready-to-eat meal options.Additionally, like U.S. producers, Italian producers have succumbed to significant pricecompetition, both between various brands and between branded product and private labelproducts.
The market for dry pasta in Italy is estimated to be approximately $1.2 billion. Similar to theU.S. market, consumption of dry pasta in Italy has been relatively stable, although 2000 sawrecord pasta production of approximately 3 million metric tons. This increase in productionreflected a rise in domestic consumption, and more particularly an increase in exports,including exports to the United States. Preliminary estimates for 2001 indicate a further, ifslight, increase in production.71 Unlike the U.S. market, the market for fresh or chilled pastain Italy is significant, estimated at approximately $910 million. Given pasta's predominantposition in Italian food consumption patterns and its already significant share of total food
72 Ibid. 73 Ibid.
23
consumption, growth in pasta consumption is unlikely to be significant and more likely torepresent shifts from one form of pasta to another.
Additionally, a significant portion of the Italian pasta industry is dependent on U.S. exportsof durum wheat, which have increased in recent years. During the 2001/02 crop year, Italianproduction of durum wheat fell significantly and as a result Italian imports of durum wheatwere expected to reach 2.35 million metric tons.72 Several major Italian pasta producers havededicated cultivation contracts with U.S. farmers, particularly growers of desert durum inCalifornia and Arizona. Imports of durum wheat from the United States totaledapproximately 370,000 mt during the 2000/01 market year, approximately 100,000 to120,000 mt of which was desert durum. Imports of U.S. durum in the 2001/02 market yearare expected to reach 630,000 mt.73

APPENDIX AEXPLANATION OF TARIFFS ANDTRADE AGREEMENT TERMS
A-2
TARIFF AND TRADE AGREEMENTTERMS
In the Harmonized Tariff Schedule of the United States (HTS), chapters 1through 97 coverall goods in trade and incorporate in the tariff nomenclature the internationally adoptedHarmonized Commodity Description and Coding System through the 6-digit level of productdescription. Subordinate 8-digit product subdivisions, either enacted by Congress orproclaimed by the President, allow more narrowly applicable duty rates; 10-digitadministrative statistical reporting numbers provide data of national interest. Chapters 98 and99 contain special U.S. classifications and temporary rate provisions, respectively. The HTSreplaced the Tariff Schedules of the United States (TSUS) effective January 1, 1989.
Duty rates in the general subcolumn of HTS column 1 are normal trade relations rates; manygeneral rates have been eliminated or are being reduced due to concessions resulting fromthe Uruguay Round of Multilateral Trade Negotiations. Column 1-general duty rates applyto all countries except those listed in HTS general note 3(b) (Cuba, Laos, and North Korea)plus Serbia and Montenegro, which are subject to the statutory rates set forth in column 2.Specified goods from designated general-rate countries may be eligible for reduced rates ofduty or duty-free entry under preferential tariff programs, as set forth in the specialsubcolumn of HTS rate of duty column 1 or in the general notes. If eligibility for specialtariff rates is not claimed or established, goods are dutiable at column 1-general rates. TheHTS does not list countries covered by a total or partial embargo.
The Generalized System of Preferences (GSP) affords nonreciprocal tariff preferences todesignated beneficiary developing countries. The U.S. GSP, enacted in title V of the TradeAct of 1974 for 10 years and extended several times thereafter, applies to merchandiseimported on or after January 1, 1976, and before the close of December 31, 2006. Indicatedby the symbol "A", "A*", or "A+" in the special subcolumn, GSP provides duty-free entryto eligible articles the product of and imported directly from designated beneficiarydeveloping countries (see HTS gen. note 4). Eligible products of listed sub-Saharan Africancountries may qualify for duty-free entry under the African Growth and Opportunity Act(AGOA) (see HTS gen. note 16) through September 30, 2008, as indicated by the symbol“D” in the special subcolumn; see subchapter XIX of chapter 98.
The Caribbean Basin Economic Recovery Act (CBERA) affords nonreciprocal tariffpreferences to designated Caribbean Basin developing countries. The CBERA, enacted intitle II of Public Law 98-67, implemented by Presidential Proclamation 5133 of November30, 1983, and amended by the Customs and Trade Act of 1990, applies to goods entered, orwithdrawn from warehouse for consumption, on or after January 1, 1984. Indicated by thesymbol "E" or "E*" in the special subcolumn, CBERA provides duty-free entry to eligiblearticles, and reduced-duty treatment to certain other articles, which are the product of andimported directly from designated countries (see HTS gen. note 7). Eligible products oflisted beneficiary countries may qualify for duty-free or reduced-duty entry under theCaribbean Basin Trade Partnership Act (CBTPA) (see HTS gen. note 17), throughSeptember 30, 2008, as indicated by the symbol “R” in the special subcolumn; seesubchapter XX of chapter 98.
A-3
Free rates of duty in the special subcolumn followed by the symbol "IL" are applicable toproducts of Israel under the United States-Israel Free Trade Area Implementation Act of1985 (IFTA), as provided in general note 8 to the HTS; see also subchapter VIII of chapter99.
Preferential nonreciprocal duty-free treatment in the special subcolumn followed by thesymbol "J" or "J*" in parentheses is afforded to eligible articles from designated beneficiarycountries under the Andean Trade Preference Act (ATPA), enacted as title II of Public Law102-182 (effective July 22, 1992; see HTS gen. note 11) and renewed through December 31,2006, by the Andean Trade Promotion and Drug Eradication Act of 2002.
Preferential free rates of duty in the special subcolumn followed by the symbol "CA" areapplicable to eligible goods of Canada, and rates followed by the symbol "MX" areapplicable to eligible goods of Mexico, under the North American Free Trade Agreement(NAFTA), as provided in general note 12 to the HTS and implemented effective January 1,1994, by Presidential Proclamation 6641 of December 15, 1993. Goods must originate inthe NAFTA region under rules set forth in general note 12(t) and meet other requirementsof the note and applicable regulations.
Preferential rates of duty in the special subcolumn followed by the symbol “JO” areapplicable to eligible goods of Jordan under the United States-Jordan Free Trade AreaImplementation Act, (JFTA) effective as of Dec. 17, 2001; see HTS gen. note 18 andsubchapter IX of chapter 99.
Other special tariff treatment applies to particular products of insular possessions (gen. note3(a)(iv)), products of the West Bank and Gaza Strip (gen. note 3(a)(v)), goods covered bythe Automotive Products Trade Act (APTA) (gen. note 5) and the Agreement on Trade inCivil Aircraft (ATCA) (gen. note 6), articles imported from freely associated states (gen.note 10), pharmaceutical products (gen. note 13), and intermediate chemicals for dyes (gen.note 14).
The General Agreement on Tariffs and Trade 1994 (GATT 1994), pursuant to theAgreement Establishing the World Trade Organization, is based upon the earlier GATT 1947(61 Stat. (pt. 5) A58; 8 UST (pt. 2) 1786) as the primary multilateral system of discipline andprinciples governing international trade. The agreements mandate most-favored-nationtreatment, maintenance of scheduled concession rates of duty, and national treatment forimported goods; GATT provides the legal framework for customs valuation standards,"escape clause" (emergency) actions, antidumping and countervailing duties, disputesettlement, and other measures. Results of the Uruguay Round of multilateral tariffnegotiations are set forth in separate schedules of concessions for each participatingcontracting party, with the U.S. schedule designated as Schedule XX. Pursuant to theAgreement on Textiles and Clothing (ATC) of the GATT 1994, member countries arephasing out restrictions on imports under the prior "Arrangement Regarding InternationalTrade in Textiles" (known as the Multifiber Arrangement (MFA)). Under the MFA, adeparture from GATT 1947 provisions, importing and exporting countries negotiatedbilateral agreements limiting textile and apparel shipments, and importing countries couldtake unilateral action to control shipments. Quantitative limits were established on textilesand apparel of cotton, other vegetable fibers, wool, man-made fibers or silk blends in aneffort to prevent or limit market disruption in the importing countries. The ATC establishesnotification and safeguard procedures, along with other rules concerning the customstreatment of textile and apparel shipments, and calls for the eventual complete integrationof this sector into the GATT 1994 and the phase-out of quotas over a ten-year period, or byJan. 1, 2005.


APPENDIX BSTATISTICAL TABLES
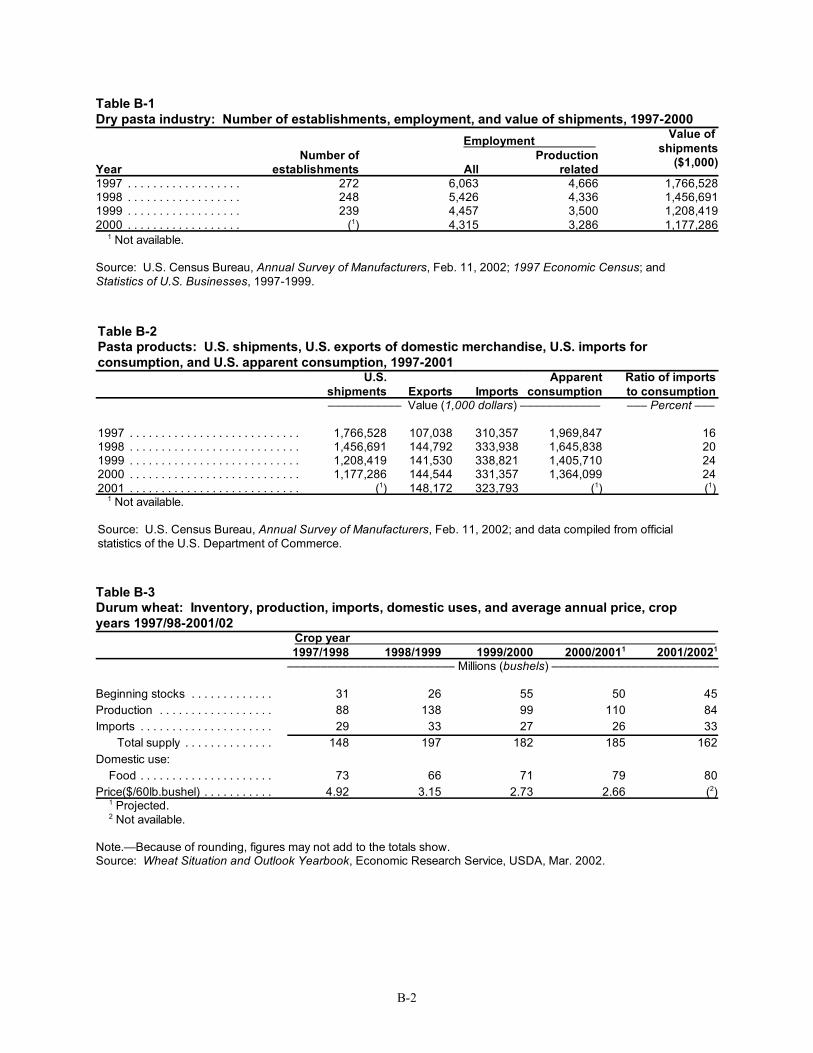
B-2
Table B-1Dry pasta industry: Number of establishments, employment, and value of shipments, 1997-2000
Employment Value of shipments
($1,000)YearNumber of
establishments AllProduction
related1997 . . . . . . . . . . . . . . . . . . 272 6,063 4,666 1,766,5281998 . . . . . . . . . . . . . . . . . . 248 5,426 4,336 1,456,6911999 . . . . . . . . . . . . . . . . . . 239 4,457 3,500 1,208,4192000 . . . . . . . . . . . . . . . . . . (1) 4,315 3,286 1,177,286
1 Not available.
Source: U.S. Census Bureau, Annual Survey of Manufacturers, Feb. 11, 2002; 1997 Economic Census; andStatistics of U.S. Businesses, 1997-1999.
Table B-2Pasta products: U.S. shipments, U.S. exports of domestic merchandise, U.S. imports forconsumption, and U.S. apparent consumption, 1997-2001
U.S.shipments Exports Imports
Apparentconsumption
Ratio of importsto consumption
––––––––––– Value (1,000 dollars) –––––––––––– ––– Percent –––
1997 . . . . . . . . . . . . . . . . . . . . . . . . . . . 1,766,528 107,038 310,357 1,969,847 161998 . . . . . . . . . . . . . . . . . . . . . . . . . . . 1,456,691 144,792 333,938 1,645,838 201999 . . . . . . . . . . . . . . . . . . . . . . . . . . . 1,208,419 141,530 338,821 1,405,710 242000 . . . . . . . . . . . . . . . . . . . . . . . . . . . 1,177,286 144,544 331,357 1,364,099 242001 . . . . . . . . . . . . . . . . . . . . . . . . . . . (1) 148,172 323,793 (1) (1)
1 Not available.
Source: U.S. Census Bureau, Annual Survey of Manufacturers, Feb. 11, 2002; and data compiled from officialstatistics of the U.S. Department of Commerce.
Table B-3Durum wheat: Inventory, production, imports, domestic uses, and average annual price, cropyears 1997/98-2001/02
Crop year 1997/1998 1998/1999 1999/2000 2000/20011 2001/20021
––––––––––––––––––––––––– Millions (bushels) –––––––––––––––––––––––––
Beginning stocks . . . . . . . . . . . . . 31 26 55 50 45Production . . . . . . . . . . . . . . . . . . 88 138 99 110 84Imports . . . . . . . . . . . . . . . . . . . . . 29 33 27 26 33
Total supply . . . . . . . . . . . . . . 148 197 182 185 162Domestic use:
Food . . . . . . . . . . . . . . . . . . . . . 73 66 71 79 80Price($/60lb.bushel) . . . . . . . . . . . 4.92 3.15 2.73 2.66 (2)
1 Projected.2 Not available.
Note.—Because of rounding, figures may not add to the totals show.Source: Wheat Situation and Outlook Yearbook, Economic Research Service, USDA, Mar. 2002.
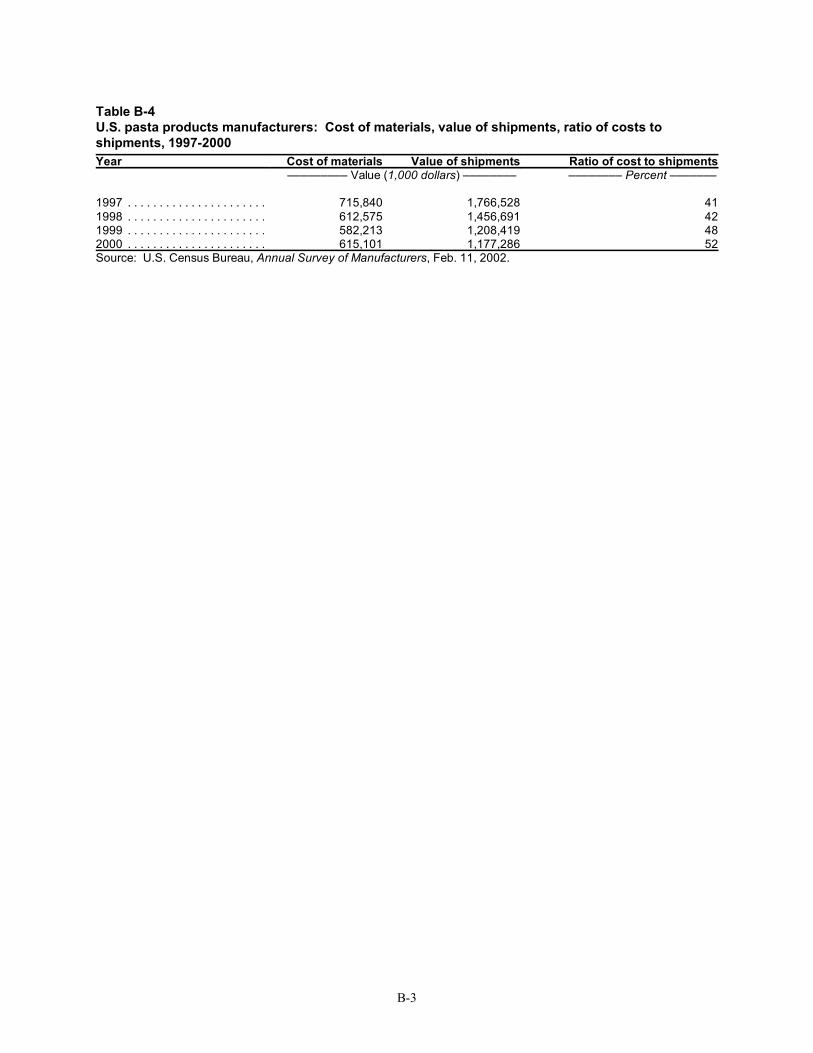
B-3
Table B-4U.S. pasta products manufacturers: Cost of materials, value of shipments, ratio of costs toshipments, 1997-2000Year Cost of materials Value of shipments Ratio of cost to shipments
––––––––– Value (1,000 dollars) –––––––– –––––––– Percent –––––––
1997 . . . . . . . . . . . . . . . . . . . . . . 715,840 1,766,528 411998 . . . . . . . . . . . . . . . . . . . . . . 612,575 1,456,691 421999 . . . . . . . . . . . . . . . . . . . . . . 582,213 1,208,419 482000 . . . . . . . . . . . . . . . . . . . . . . 615,101 1,177,286 52Source: U.S. Census Bureau, Annual Survey of Manufacturers, Feb. 11, 2002.
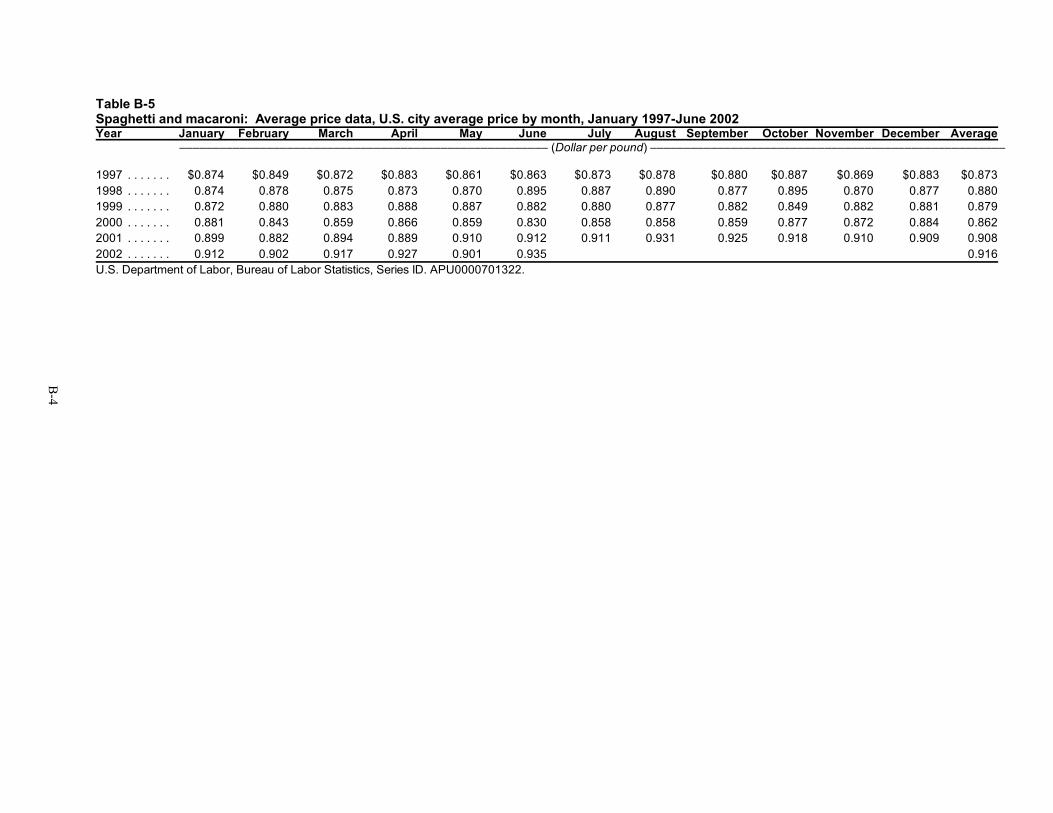
B-4
Table B-5Spaghetti and macaroni: Average price data, U.S. city average price by month, January 1997-June 2002Year January February March April May June July August September October November December Average
––––––––––––––––––––––––––––––––––––––––––––––––––––––– (Dollar per pound) –––––––––––––––––––––––––––––––––––––––––––––––––––––
1997 . . . . . . . $0.874 $0.849 $0.872 $0.883 $0.861 $0.863 $0.873 $0.878 $0.880 $0.887 $0.869 $0.883 $0.8731998 . . . . . . . 0.874 0.878 0.875 0.873 0.870 0.895 0.887 0.890 0.877 0.895 0.870 0.877 0.8801999 . . . . . . . 0.872 0.880 0.883 0.888 0.887 0.882 0.880 0.877 0.882 0.849 0.882 0.881 0.8792000 . . . . . . . 0.881 0.843 0.859 0.866 0.859 0.830 0.858 0.858 0.859 0.877 0.872 0.884 0.8622001 . . . . . . . 0.899 0.882 0.894 0.889 0.910 0.912 0.911 0.931 0.925 0.918 0.910 0.909 0.9082002 . . . . . . . 0.912 0.902 0.917 0.927 0.901 0.935 0.916U.S. Department of Labor, Bureau of Labor Statistics, Series ID. APU0000701322.
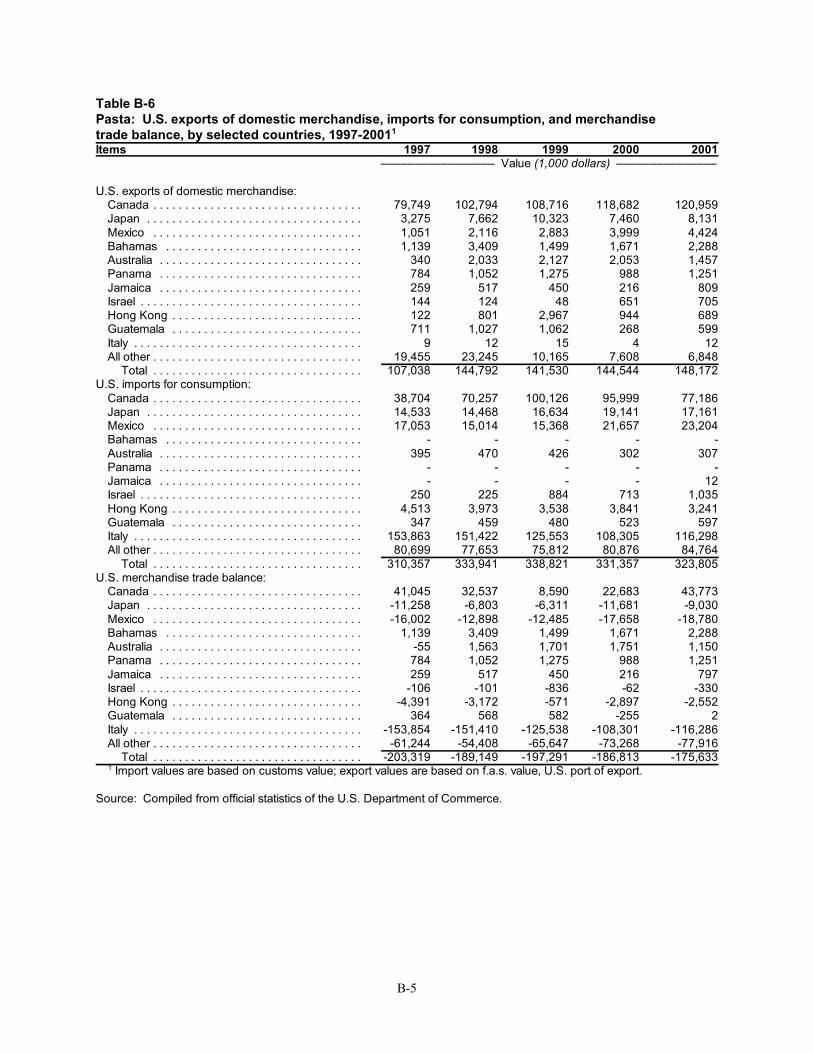
B-5
Table B-6Pasta: U.S. exports of domestic merchandise, imports for consumption, and merchandisetrade balance, by selected countries, 1997-20011 Items 1997 1998 1999 2000 2001
––––––––––––––––– Value (1,000 dollars) –––––––––––––––
U.S. exports of domestic merchandise: Canada . . . . . . . . . . . . . . . . . . . . . . . . . . . . . . . . . 79,749 102,794 108,716 118,682 120,959Japan . . . . . . . . . . . . . . . . . . . . . . . . . . . . . . . . . . 3,275 7,662 10,323 7,460 8,131Mexico . . . . . . . . . . . . . . . . . . . . . . . . . . . . . . . . . 1,051 2,116 2,883 3,999 4,424Bahamas . . . . . . . . . . . . . . . . . . . . . . . . . . . . . . . 1,139 3,409 1,499 1,671 2,288Australia . . . . . . . . . . . . . . . . . . . . . . . . . . . . . . . . 340 2,033 2,127 2,053 1,457Panama . . . . . . . . . . . . . . . . . . . . . . . . . . . . . . . . 784 1,052 1,275 988 1,251Jamaica . . . . . . . . . . . . . . . . . . . . . . . . . . . . . . . . 259 517 450 216 809Israel . . . . . . . . . . . . . . . . . . . . . . . . . . . . . . . . . . . 144 124 48 651 705Hong Kong . . . . . . . . . . . . . . . . . . . . . . . . . . . . . . 122 801 2,967 944 689Guatemala . . . . . . . . . . . . . . . . . . . . . . . . . . . . . . 711 1,027 1,062 268 599Italy . . . . . . . . . . . . . . . . . . . . . . . . . . . . . . . . . . . . 9 12 15 4 12All other . . . . . . . . . . . . . . . . . . . . . . . . . . . . . . . . . 19,455 23,245 10,165 7,608 6,848
Total . . . . . . . . . . . . . . . . . . . . . . . . . . . . . . . . . 107,038 144,792 141,530 144,544 148,172U.S. imports for consumption:
Canada . . . . . . . . . . . . . . . . . . . . . . . . . . . . . . . . . 38,704 70,257 100,126 95,999 77,186Japan . . . . . . . . . . . . . . . . . . . . . . . . . . . . . . . . . . 14,533 14,468 16,634 19,141 17,161Mexico . . . . . . . . . . . . . . . . . . . . . . . . . . . . . . . . . 17,053 15,014 15,368 21,657 23,204Bahamas . . . . . . . . . . . . . . . . . . . . . . . . . . . . . . . - - - - -Australia . . . . . . . . . . . . . . . . . . . . . . . . . . . . . . . . 395 470 426 302 307Panama . . . . . . . . . . . . . . . . . . . . . . . . . . . . . . . . - - - - -Jamaica . . . . . . . . . . . . . . . . . . . . . . . . . . . . . . . . - - - - 12Israel . . . . . . . . . . . . . . . . . . . . . . . . . . . . . . . . . . . 250 225 884 713 1,035Hong Kong . . . . . . . . . . . . . . . . . . . . . . . . . . . . . . 4,513 3,973 3,538 3,841 3,241Guatemala . . . . . . . . . . . . . . . . . . . . . . . . . . . . . . 347 459 480 523 597Italy . . . . . . . . . . . . . . . . . . . . . . . . . . . . . . . . . . . . 153,863 151,422 125,553 108,305 116,298All other . . . . . . . . . . . . . . . . . . . . . . . . . . . . . . . . . 80,699 77,653 75,812 80,876 84,764
Total . . . . . . . . . . . . . . . . . . . . . . . . . . . . . . . . . 310,357 333,941 338,821 331,357 323,805U.S. merchandise trade balance:
Canada . . . . . . . . . . . . . . . . . . . . . . . . . . . . . . . . . 41,045 32,537 8,590 22,683 43,773Japan . . . . . . . . . . . . . . . . . . . . . . . . . . . . . . . . . . -11,258 -6,803 -6,311 -11,681 -9,030Mexico . . . . . . . . . . . . . . . . . . . . . . . . . . . . . . . . . -16,002 -12,898 -12,485 -17,658 -18,780Bahamas . . . . . . . . . . . . . . . . . . . . . . . . . . . . . . . 1,139 3,409 1,499 1,671 2,288Australia . . . . . . . . . . . . . . . . . . . . . . . . . . . . . . . . -55 1,563 1,701 1,751 1,150Panama . . . . . . . . . . . . . . . . . . . . . . . . . . . . . . . . 784 1,052 1,275 988 1,251Jamaica . . . . . . . . . . . . . . . . . . . . . . . . . . . . . . . . 259 517 450 216 797Israel . . . . . . . . . . . . . . . . . . . . . . . . . . . . . . . . . . . -106 -101 -836 -62 -330Hong Kong . . . . . . . . . . . . . . . . . . . . . . . . . . . . . . -4,391 -3,172 -571 -2,897 -2,552Guatemala . . . . . . . . . . . . . . . . . . . . . . . . . . . . . . 364 568 582 -255 2Italy . . . . . . . . . . . . . . . . . . . . . . . . . . . . . . . . . . . . -153,854 -151,410 -125,538 -108,301 -116,286All other . . . . . . . . . . . . . . . . . . . . . . . . . . . . . . . . . -61,244 -54,408 -65,647 -73,268 -77,916
Total . . . . . . . . . . . . . . . . . . . . . . . . . . . . . . . . . -203,319 -189,149 -197,291 -186,813 -175,6331 Import values are based on customs value; export values are based on f.a.s. value, U.S. port of export.
Source: Compiled from official statistics of the U.S. Department of Commerce.
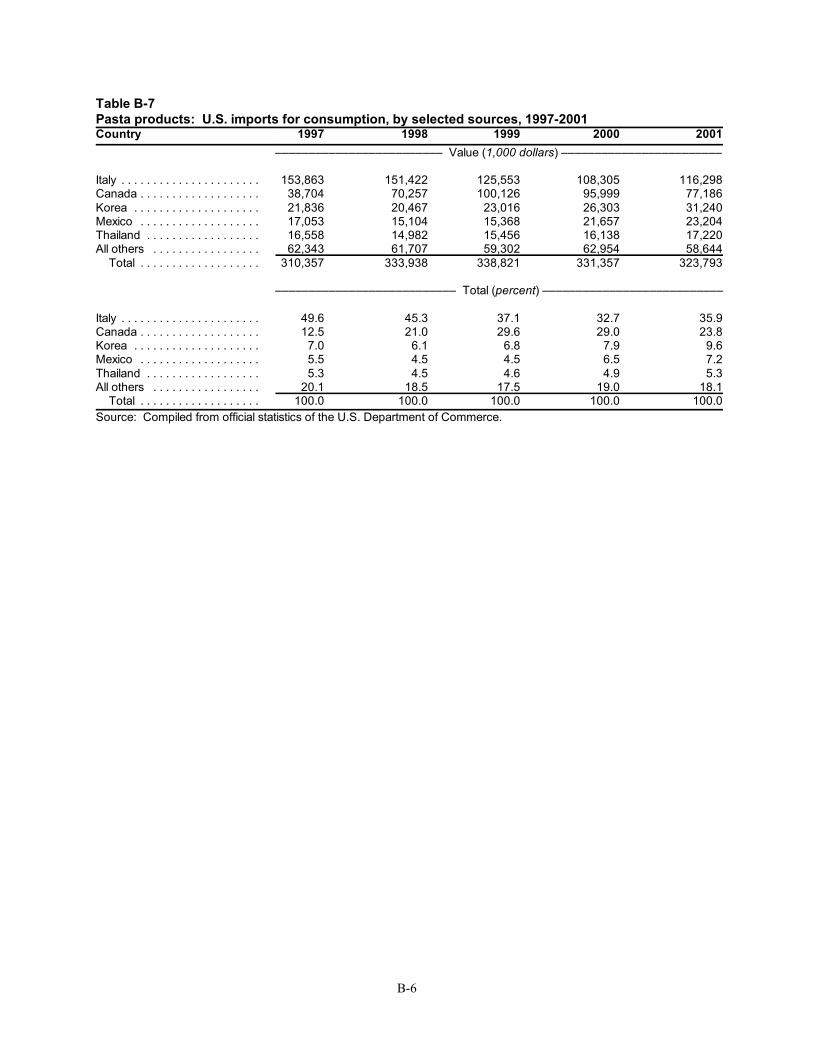
B-6
Table B-7Pasta products: U.S. imports for consumption, by selected sources, 1997-2001Country 1997 1998 1999 2000 2001
––––––––––––––––––––––––– Value (1,000 dollars) ––––––––––––––––––––––––
Italy . . . . . . . . . . . . . . . . . . . . . . 153,863 151,422 125,553 108,305 116,298Canada . . . . . . . . . . . . . . . . . . . 38,704 70,257 100,126 95,999 77,186Korea . . . . . . . . . . . . . . . . . . . . 21,836 20,467 23,016 26,303 31,240Mexico . . . . . . . . . . . . . . . . . . . 17,053 15,104 15,368 21,657 23,204Thailand . . . . . . . . . . . . . . . . . . 16,558 14,982 15,456 16,138 17,220All others . . . . . . . . . . . . . . . . . 62,343 61,707 59,302 62,954 58,644
Total . . . . . . . . . . . . . . . . . . . 310,357 333,938 338,821 331,357 323,793
––––––––––––––––––––––––––– Total (percent) –––––––––––––––––––––––––––
Italy . . . . . . . . . . . . . . . . . . . . . . 49.6 45.3 37.1 32.7 35.9Canada . . . . . . . . . . . . . . . . . . . 12.5 21.0 29.6 29.0 23.8Korea . . . . . . . . . . . . . . . . . . . . 7.0 6.1 6.8 7.9 9.6Mexico . . . . . . . . . . . . . . . . . . . 5.5 4.5 4.5 6.5 7.2Thailand . . . . . . . . . . . . . . . . . . 5.3 4.5 4.6 4.9 5.3All others . . . . . . . . . . . . . . . . . 20.1 18.5 17.5 19.0 18.1
Total . . . . . . . . . . . . . . . . . . . 100.0 100.0 100.0 100.0 100.0Source: Compiled from official statistics of the U.S. Department of Commerce.
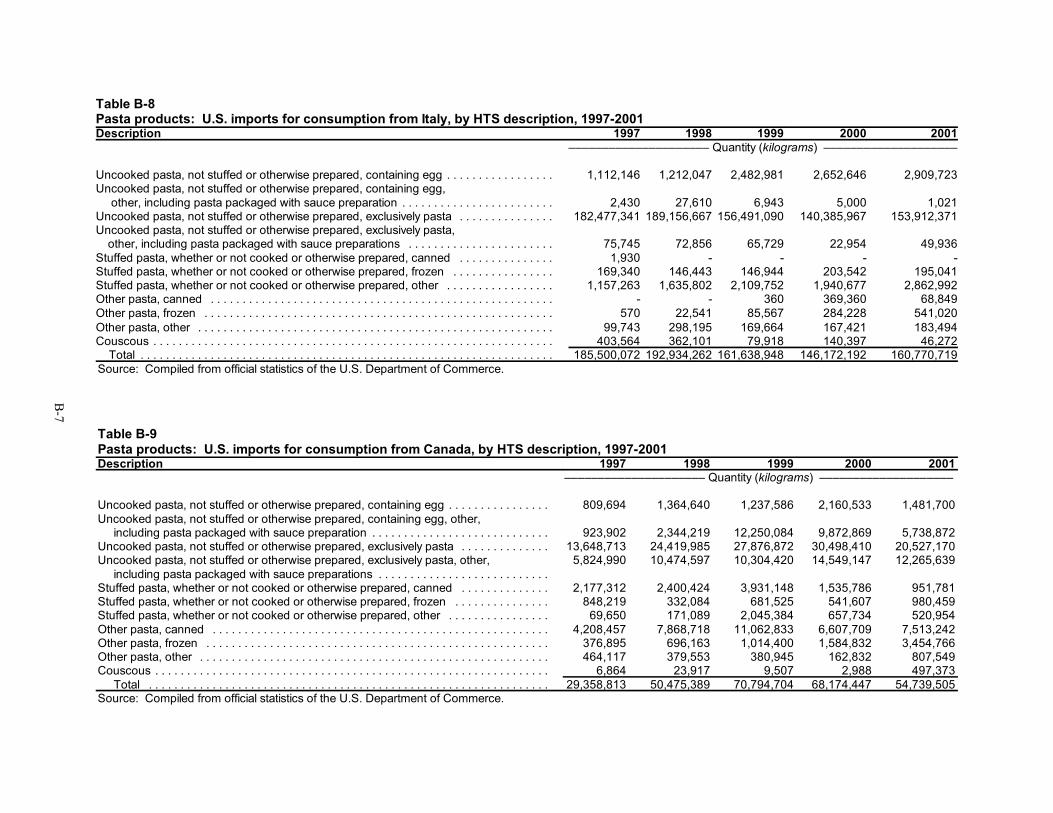
B-7
Table B-8Pasta products: U.S. imports for consumption from Italy, by HTS description, 1997-2001Description 1997 1998 1999 2000 2001
––––––––––––––––––––– Quantity (kilograms) ––––––––––––––––––––
Uncooked pasta, not stuffed or otherwise prepared, containing egg . . . . . . . . . . . . . . . . . 1,112,146 1,212,047 2,482,981 2,652,646 2,909,723Uncooked pasta, not stuffed or otherwise prepared, containing egg,
other, including pasta packaged with sauce preparation . . . . . . . . . . . . . . . . . . . . . . . . 2,430 27,610 6,943 5,000 1,021Uncooked pasta, not stuffed or otherwise prepared, exclusively pasta . . . . . . . . . . . . . . . 182,477,341 189,156,667 156,491,090 140,385,967 153,912,371Uncooked pasta, not stuffed or otherwise prepared, exclusively pasta,
other, including pasta packaged with sauce preparations . . . . . . . . . . . . . . . . . . . . . . . 75,745 72,856 65,729 22,954 49,936Stuffed pasta, whether or not cooked or otherwise prepared, canned . . . . . . . . . . . . . . . 1,930 - - - -Stuffed pasta, whether or not cooked or otherwise prepared, frozen . . . . . . . . . . . . . . . . 169,340 146,443 146,944 203,542 195,041Stuffed pasta, whether or not cooked or otherwise prepared, other . . . . . . . . . . . . . . . . . 1,157,263 1,635,802 2,109,752 1,940,677 2,862,992Other pasta, canned . . . . . . . . . . . . . . . . . . . . . . . . . . . . . . . . . . . . . . . . . . . . . . . . . . . . . . - - 360 369,360 68,849Other pasta, frozen . . . . . . . . . . . . . . . . . . . . . . . . . . . . . . . . . . . . . . . . . . . . . . . . . . . . . . . 570 22,541 85,567 284,228 541,020Other pasta, other . . . . . . . . . . . . . . . . . . . . . . . . . . . . . . . . . . . . . . . . . . . . . . . . . . . . . . . . 99,743 298,195 169,664 167,421 183,494Couscous . . . . . . . . . . . . . . . . . . . . . . . . . . . . . . . . . . . . . . . . . . . . . . . . . . . . . . . . . . . . . . . 403,564 362,101 79,918 140,397 46,272
Total . . . . . . . . . . . . . . . . . . . . . . . . . . . . . . . . . . . . . . . . . . . . . . . . . . . . . . . . . . . . . . . . . 185,500,072 192,934,262 161,638,948 146,172,192 160,770,719Source: Compiled from official statistics of the U.S. Department of Commerce.
Table B-9Pasta products: U.S. imports for consumption from Canada, by HTS description, 1997-2001Description 1997 1998 1999 2000 2001
––––––––––––––––––––– Quantity (kilograms) ––––––––––––––––––––
Uncooked pasta, not stuffed or otherwise prepared, containing egg . . . . . . . . . . . . . . . . 809,694 1,364,640 1,237,586 2,160,533 1,481,700Uncooked pasta, not stuffed or otherwise prepared, containing egg, other,
including pasta packaged with sauce preparation . . . . . . . . . . . . . . . . . . . . . . . . . . . . 923,902 2,344,219 12,250,084 9,872,869 5,738,872Uncooked pasta, not stuffed or otherwise prepared, exclusively pasta . . . . . . . . . . . . . . 13,648,713 24,419,985 27,876,872 30,498,410 20,527,170Uncooked pasta, not stuffed or otherwise prepared, exclusively pasta, other,
including pasta packaged with sauce preparations . . . . . . . . . . . . . . . . . . . . . . . . . . .5,824,990 10,474,597 10,304,420 14,549,147 12,265,639
Stuffed pasta, whether or not cooked or otherwise prepared, canned . . . . . . . . . . . . . . 2,177,312 2,400,424 3,931,148 1,535,786 951,781Stuffed pasta, whether or not cooked or otherwise prepared, frozen . . . . . . . . . . . . . . . 848,219 332,084 681,525 541,607 980,459Stuffed pasta, whether or not cooked or otherwise prepared, other . . . . . . . . . . . . . . . . 69,650 171,089 2,045,384 657,734 520,954Other pasta, canned . . . . . . . . . . . . . . . . . . . . . . . . . . . . . . . . . . . . . . . . . . . . . . . . . . . . . 4,208,457 7,868,718 11,062,833 6,607,709 7,513,242Other pasta, frozen . . . . . . . . . . . . . . . . . . . . . . . . . . . . . . . . . . . . . . . . . . . . . . . . . . . . . . 376,895 696,163 1,014,400 1,584,832 3,454,766Other pasta, other . . . . . . . . . . . . . . . . . . . . . . . . . . . . . . . . . . . . . . . . . . . . . . . . . . . . . . . 464,117 379,553 380,945 162,832 807,549Couscous . . . . . . . . . . . . . . . . . . . . . . . . . . . . . . . . . . . . . . . . . . . . . . . . . . . . . . . . . . . . . . 6,864 23,917 9,507 2,988 497,373
Total . . . . . . . . . . . . . . . . . . . . . . . . . . . . . . . . . . . . . . . . . . . . . . . . . . . . . . . . . . . . . . . 29,358,813 50,475,389 70,794,704 68,174,447 54,739,505Source: Compiled from official statistics of the U.S. Department of Commerce.
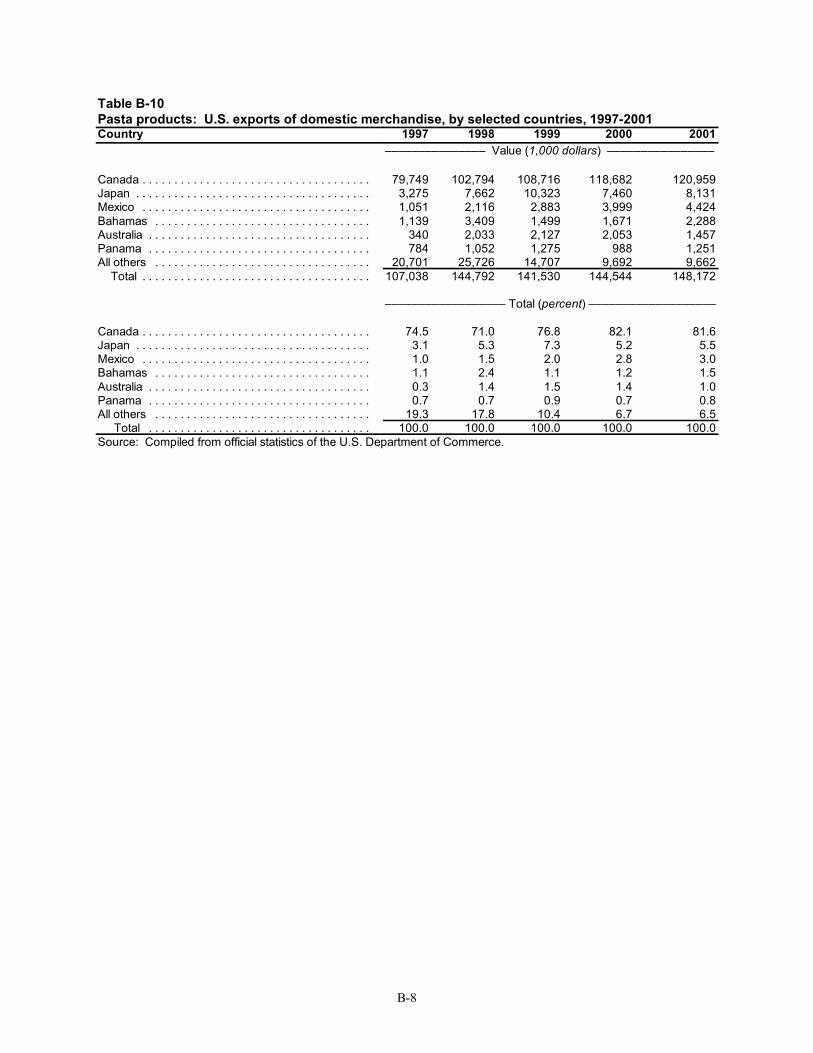
B-8
Table B-10Pasta products: U.S. exports of domestic merchandise, by selected countries, 1997-2001Country 1997 1998 1999 2000 2001
––––––––––––––– Value (1,000 dollars) ––––––––––––––––
Canada . . . . . . . . . . . . . . . . . . . . . . . . . . . . . . . . . . . . 79,749 102,794 108,716 118,682 120,959Japan . . . . . . . . . . . . . . . . . . . . . . . . . . . . . . . . . . . . . 3,275 7,662 10,323 7,460 8,131Mexico . . . . . . . . . . . . . . . . . . . . . . . . . . . . . . . . . . . . 1,051 2,116 2,883 3,999 4,424Bahamas . . . . . . . . . . . . . . . . . . . . . . . . . . . . . . . . . . 1,139 3,409 1,499 1,671 2,288Australia . . . . . . . . . . . . . . . . . . . . . . . . . . . . . . . . . . . 340 2,033 2,127 2,053 1,457Panama . . . . . . . . . . . . . . . . . . . . . . . . . . . . . . . . . . . 784 1,052 1,275 988 1,251All others . . . . . . . . . . . . . . . . . . . . . . . . . . . . . . . . . . 20,701 25,726 14,707 9,692 9,662
Total . . . . . . . . . . . . . . . . . . . . . . . . . . . . . . . . . . . . 107,038 144,792 141,530 144,544 148,172
–––––––––––––––––– Total (percent) –––––––––––––––––––
Canada . . . . . . . . . . . . . . . . . . . . . . . . . . . . . . . . . . . . 74.5 71.0 76.8 82.1 81.6Japan . . . . . . . . . . . . . . . . . . . . . . . . . . . . . . . . . . . . . 3.1 5.3 7.3 5.2 5.5Mexico . . . . . . . . . . . . . . . . . . . . . . . . . . . . . . . . . . . . 1.0 1.5 2.0 2.8 3.0Bahamas . . . . . . . . . . . . . . . . . . . . . . . . . . . . . . . . . . 1.1 2.4 1.1 1.2 1.5Australia . . . . . . . . . . . . . . . . . . . . . . . . . . . . . . . . . . . 0.3 1.4 1.5 1.4 1.0Panama . . . . . . . . . . . . . . . . . . . . . . . . . . . . . . . . . . . 0.7 0.7 0.9 0.7 0.8All others . . . . . . . . . . . . . . . . . . . . . . . . . . . . . . . . . . 19.3 17.8 10.4 6.7 6.5
Total . . . . . . . . . . . . . . . . . . . . . . . . . . . . . . . . . . . 100.0 100.0 100.0 100.0 100.0Source: Compiled from official statistics of the U.S. Department of Commerce.
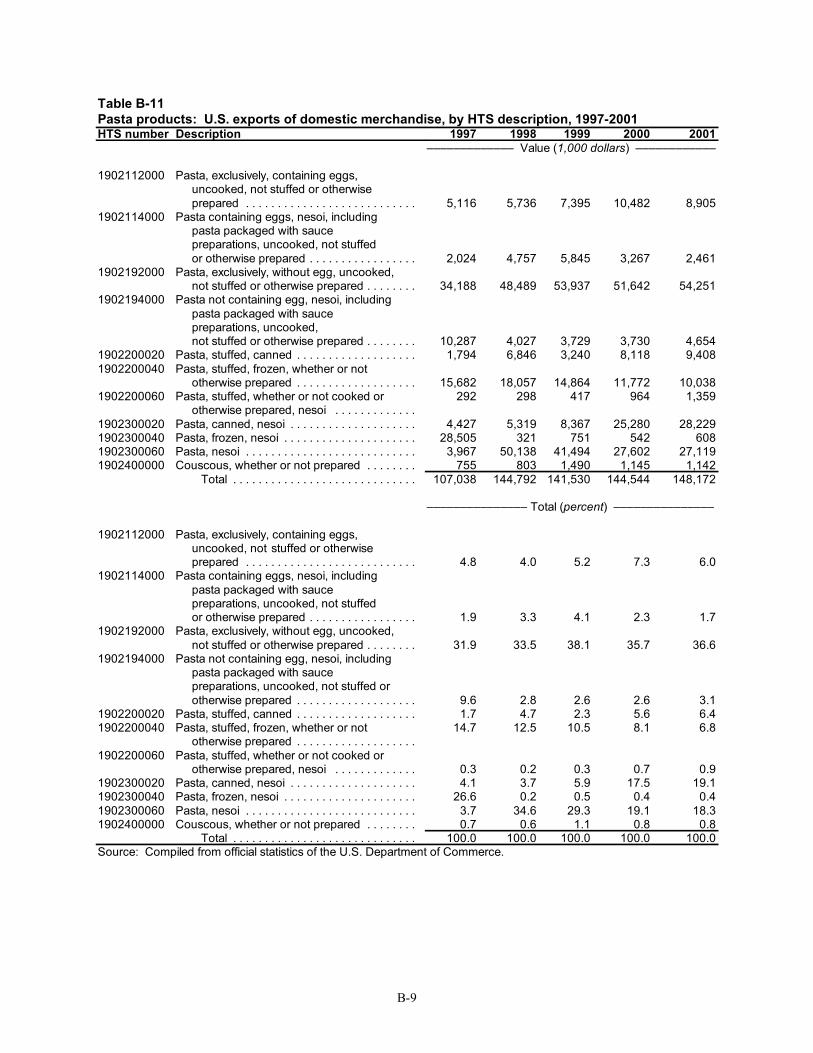
B-9
Table B-11Pasta products: U.S. exports of domestic merchandise, by HTS description, 1997-2001HTS number Description 1997 1998 1999 2000 2001
––––––––––––– Value (1,000 dollars) ––––––––––––
1902112000 Pasta, exclusively, containing eggs,uncooked, not stuffed or otherwiseprepared . . . . . . . . . . . . . . . . . . . . . . . . . . . 5,116 5,736 7,395 10,482 8,905
1902114000 Pasta containing eggs, nesoi, includingpasta packaged with saucepreparations, uncooked, not stuffedor otherwise prepared . . . . . . . . . . . . . . . . . 2,024 4,757 5,845 3,267 2,461
1902192000 Pasta, exclusively, without egg, uncooked,not stuffed or otherwise prepared . . . . . . . . 34,188 48,489 53,937 51,642 54,251
1902194000 Pasta not containing egg, nesoi, includingpasta packaged with saucepreparations, uncooked,not stuffed or otherwise prepared . . . . . . . . 10,287 4,027 3,729 3,730 4,654
1902200020 Pasta, stuffed, canned . . . . . . . . . . . . . . . . . . . 1,794 6,846 3,240 8,118 9,4081902200040 Pasta, stuffed, frozen, whether or not
otherwise prepared . . . . . . . . . . . . . . . . . . . 15,682 18,057 14,864 11,772 10,0381902200060 Pasta, stuffed, whether or not cooked or
otherwise prepared, nesoi . . . . . . . . . . . . .292 298 417 964 1,359
1902300020 Pasta, canned, nesoi . . . . . . . . . . . . . . . . . . . . 4,427 5,319 8,367 25,280 28,2291902300040 Pasta, frozen, nesoi . . . . . . . . . . . . . . . . . . . . . 28,505 321 751 542 6081902300060 Pasta, nesoi . . . . . . . . . . . . . . . . . . . . . . . . . . . 3,967 50,138 41,494 27,602 27,1191902400000 Couscous, whether or not prepared . . . . . . . . 755 803 1,490 1,145 1,142
Total . . . . . . . . . . . . . . . . . . . . . . . . . . . . . 107,038 144,792 141,530 144,544 148,172
––––––––––––––– Total (percent) –––––––––––––––
1902112000 Pasta, exclusively, containing eggs,uncooked, not stuffed or otherwiseprepared . . . . . . . . . . . . . . . . . . . . . . . . . . . 4.8 4.0 5.2 7.3 6.0
1902114000 Pasta containing eggs, nesoi, includingpasta packaged with saucepreparations, uncooked, not stuffedor otherwise prepared . . . . . . . . . . . . . . . . . 1.9 3.3 4.1 2.3 1.7
1902192000 Pasta, exclusively, without egg, uncooked,not stuffed or otherwise prepared . . . . . . . . 31.9 33.5 38.1 35.7 36.6
1902194000 Pasta not containing egg, nesoi, includingpasta packaged with saucepreparations, uncooked, not stuffed orotherwise prepared . . . . . . . . . . . . . . . . . . . 9.6 2.8 2.6 2.6 3.1
1902200020 Pasta, stuffed, canned . . . . . . . . . . . . . . . . . . . 1.7 4.7 2.3 5.6 6.41902200040 Pasta, stuffed, frozen, whether or not
otherwise prepared . . . . . . . . . . . . . . . . . . .14.7 12.5 10.5 8.1 6.8
1902200060 Pasta, stuffed, whether or not cooked orotherwise prepared, nesoi . . . . . . . . . . . . . 0.3 0.2 0.3 0.7 0.9
1902300020 Pasta, canned, nesoi . . . . . . . . . . . . . . . . . . . . 4.1 3.7 5.9 17.5 19.11902300040 Pasta, frozen, nesoi . . . . . . . . . . . . . . . . . . . . . 26.6 0.2 0.5 0.4 0.41902300060 Pasta, nesoi . . . . . . . . . . . . . . . . . . . . . . . . . . . 3.7 34.6 29.3 19.1 18.31902400000 Couscous, whether or not prepared . . . . . . . . 0.7 0.6 1.1 0.8 0.8
Total . . . . . . . . . . . . . . . . . . . . . . . . . . . . . 100.0 100.0 100.0 100.0 100.0Source: Compiled from official statistics of the U.S. Department of Commerce.
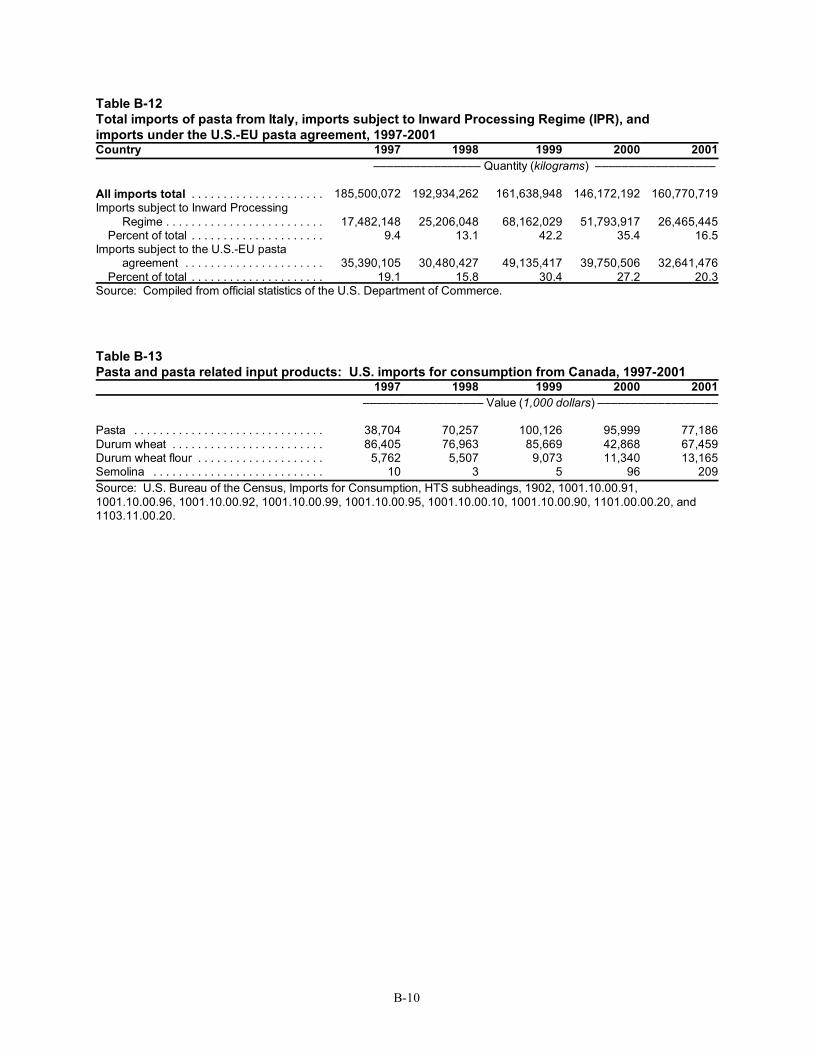
B-10
Table B-12Total imports of pasta from Italy, imports subject to Inward Processing Regime (IPR), andimports under the U.S.-EU pasta agreement, 1997-2001Country 1997 1998 1999 2000 2001
–––––––––––––––– Quantity (kilograms) ––––––––––––––––––
All imports total . . . . . . . . . . . . . . . . . . . . . 185,500,072 192,934,262 161,638,948 146,172,192 160,770,719Imports subject to Inward Processing
Regime . . . . . . . . . . . . . . . . . . . . . . . . . 17,482,148 25,206,048 68,162,029 51,793,917 26,465,445Percent of total . . . . . . . . . . . . . . . . . . . . . 9.4 13.1 42.2 35.4 16.5
Imports subject to the U.S.-EU pastaagreement . . . . . . . . . . . . . . . . . . . . . . 35,390,105 30,480,427 49,135,417 39,750,506 32,641,476
Percent of total . . . . . . . . . . . . . . . . . . . . . 19.1 15.8 30.4 27.2 20.3Source: Compiled from official statistics of the U.S. Department of Commerce.
Table B-13Pasta and pasta related input products: U.S. imports for consumption from Canada, 1997-2001
1997 1998 1999 2000 2001–––––––––––––––––– Value (1,000 dollars) ––––––––––––––––––
Pasta . . . . . . . . . . . . . . . . . . . . . . . . . . . . . . 38,704 70,257 100,126 95,999 77,186Durum wheat . . . . . . . . . . . . . . . . . . . . . . . . 86,405 76,963 85,669 42,868 67,459Durum wheat flour . . . . . . . . . . . . . . . . . . . . 5,762 5,507 9,073 11,340 13,165Semolina . . . . . . . . . . . . . . . . . . . . . . . . . . . 10 3 5 96 209Source: U.S. Bureau of the Census, Imports for Consumption, HTS subheadings, 1902, 1001.10.00.91,1001.10.00.96, 1001.10.00.92, 1001.10.00.99, 1001.10.00.95, 1001.10.00.10, 1001.10.00.90, 1101.00.00.20, and1103.11.00.20.
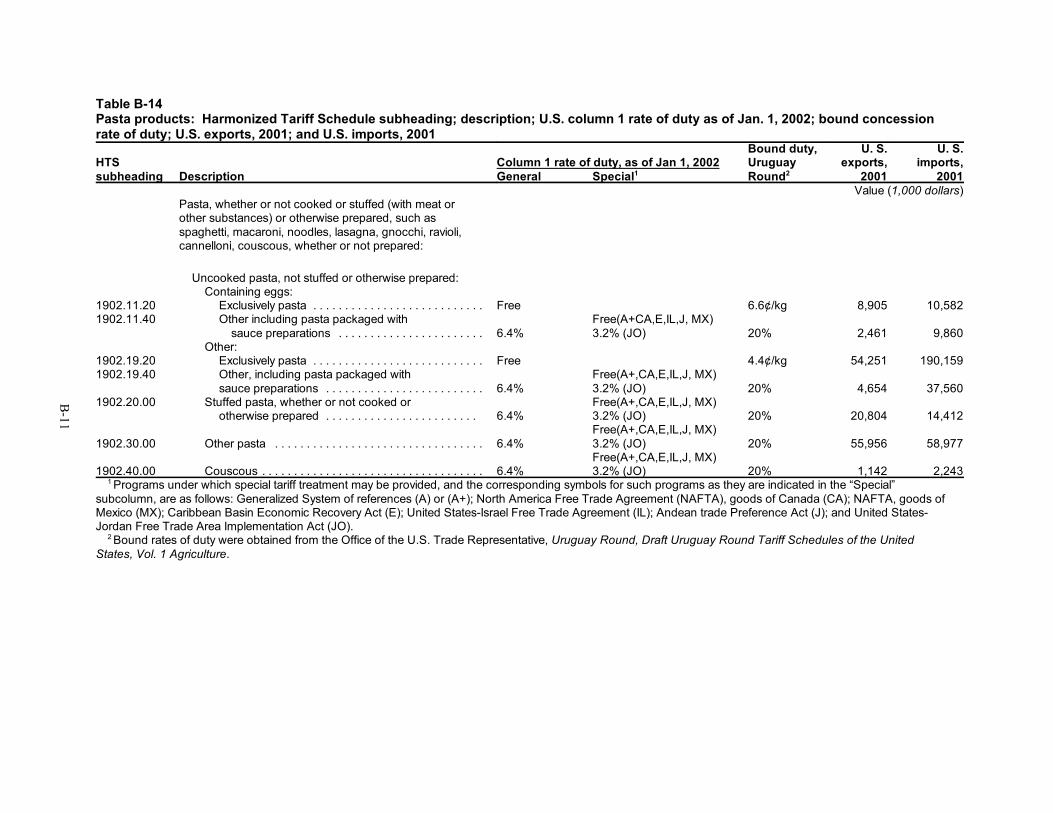
B-11
Table B-14Pasta products: Harmonized Tariff Schedule subheading; description; U.S. column 1 rate of duty as of Jan. 1, 2002; bound concessionrate of duty; U.S. exports, 2001; and U.S. imports, 2001
HTSsubheading Description
Column 1 rate of duty, as of Jan 1, 2002General Special1
Bound duty, UruguayRound2
U. S.exports,
2001
U. S.imports,
2001Value (1,000 dollars)
Pasta, whether or not cooked or stuffed (with meat orother substances) or otherwise prepared, such asspaghetti, macaroni, noodles, lasagna, gnocchi, ravioli,cannelloni, couscous, whether or not prepared:
Uncooked pasta, not stuffed or otherwise prepared: Containing eggs:
1902.11.20 Exclusively pasta . . . . . . . . . . . . . . . . . . . . . . . . . . . Free 6.6¢/kg 8,905 10,5821902.11.40 Other including pasta packaged with
sauce preparations . . . . . . . . . . . . . . . . . . . . . . . 6.4%Free(A+CA,E,IL,J, MX)3.2% (JO) 20% 2,461 9,860
Other:1902.19.20 Exclusively pasta . . . . . . . . . . . . . . . . . . . . . . . . . . . Free 4.4¢/kg 54,251 190,1591902.19.40 Other, including pasta packaged with
sauce preparations . . . . . . . . . . . . . . . . . . . . . . . . . 6.4%Free(A+,CA,E,IL,J, MX)3.2% (JO) 20% 4,654 37,560
1902.20.00 Stuffed pasta, whether or not cooked or otherwise prepared . . . . . . . . . . . . . . . . . . . . . . . . 6.4%
Free(A+,CA,E,IL,J, MX)3.2% (JO) 20% 20,804 14,412
1902.30.00 Other pasta . . . . . . . . . . . . . . . . . . . . . . . . . . . . . . . . . 6.4%Free(A+,CA,E,IL,J, MX)3.2% (JO) 20% 55,956 58,977
1902.40.00 Couscous . . . . . . . . . . . . . . . . . . . . . . . . . . . . . . . . . . . 6.4%Free(A+,CA,E,IL,J, MX)3.2% (JO) 20% 1,142 2,243
1 Programs under which special tariff treatment may be provided, and the corresponding symbols for such programs as they are indicated in the “Special”subcolumn, are as follows: Generalized System of references (A) or (A+); North America Free Trade Agreement (NAFTA), goods of Canada (CA); NAFTA, goods ofMexico (MX); Caribbean Basin Economic Recovery Act (E); United States-Israel Free Trade Agreement (IL); Andean trade Preference Act (J); and United States-Jordan Free Trade Area Implementation Act (JO).
2 Bound rates of duty were obtained from the Office of the U.S. Trade Representative, Uruguay Round, Draft Uruguay Round Tariff Schedules of the UnitedStates, Vol. 1 Agriculture.