subject: apparel merchandising unit 4: dollar merchandise...
TRANSCRIPT
Subject: Apparel Merchandising
Unit 4: Dollar merchandise plan and six months merchandise plan
Quadrant 1 – e-Text
Learning Objectives
The learning objectives of this unit are to:
Explain the planning process from elements of planning to six month merchandise plan.
Describe the six month merchandise plan.
Describe ‘Open To Buy’ (OTB) planning systems.
Examine factors affecting real time OTB.
4.1 Dollar Merchandise Plan
It is a guide for a futuristic period and includes monetary values only. It does not describe units,
assortments or quantities of merchandise. It balances planned sales and planned stocks in
monetary values.
It includes:
1.Cash Discount::
Discounts allowed by vendors for payment of invoices prior to a specified date.
2. Stock Turnover:
Net Sales divided by average inventory at retail.
3. Shortage:
The difference between book inventory in retail dollars and the physical inventory at retail;
stated as a percent of net sales.
4. Average Stock:
Beginning‐of‐the month inventories divided by the number of months in the period.
5. Initial Markup percent:

The difference between the cost of merchandise and the original retail price.
6. Gross Margin Percent: Difference between net sales and total merchandise costs. It must be
high enough to cover all operating expenses and taxes as well as profit.
Elements of the Merchandize Plan
Key elements of the merchandise plan are:
1. Planned Sales: sales in monetary values estimates for the total plan period broken down for
each month of the plan.
2. Planned Stock: Is the estimated money value of the Inventory needed at the beginning of each
month of the plan.
Stock Turnover = Net Sales in terms of value / Average Inventory Values.
3. Planned Markdowns: estimated reductions in terms of monetary values from the retail
value of the goods for each month of the plan.
Markdown % = Markdown in Value / Net sales in Value.
4. Planned Purchases: It is the difference between what is needed and what is on hand. Estimated
money to be spent for purchases for each month of the plan.
Planned Purchases = planned monthly sales + planned end‐of‐the‐month stock + planned
monthly markdowns – planned beginning‐of‐the month stock.
5. Planning Reductions: It is the lowering or marking down the retail price of merchandise.
Reductions are planned because only rarely can all the merchandise purchased be sold at the
originally set retail price. Markdowns are either promotional or permanent and these adjust the
initial retail price downward temporarily or set a new retail respectively.
Markup Cancellation: Adjust the amount of mark‐up that was put on an item originally, thereby
lowering the retail price.
Keystone Markup: It is an amount that equals the cost of the merchandise, or 50% retail mark‐up.
Short‐Markup: It is less than Keystone.
Open-to-Buy
It is used as a control device to see that purchases are made according to the merchandise plan
and the needs exceeds the merchandise available.

OTB = planned sales + planned end‐of‐the‐month stock – present inventory – goods on order.
Controls:
These are the methods employed to help a retailer track the business to see how it is doing and
how effective the merchandising strategies are.
Standards:
Effective control systems have established standards, a means of measuring performance through
accepted guidelines that help to monitor performance.
Periodic Inventory:
It is a method of stock control in which the retailer physically counts merchandise at designated
time period.
Perpetual Inventories:
It is a stock control methods that provide a continuous record of the movement of incoming and
outgoing merchandise.
Vendor Matrix / Key Resources List
These matrices or lists are based on the premise that fewer resources or suppliers are better than
many, in order for the resources to be as beneficial to the retailer as possible.
4.2 Dollar Merchandise Planning
Merchandise management is the analysis, planning, acquisition, handling, and control of the
merchandise investments of a retail operation.
A. Buyers, working with upper management, are responsible for the dollar planning of
merchandise requirements.
1. Inventory is the largest investment that retailers make.
2. Gross margin return on inventory (GMROI) incorporates into a single measure both inventory
turnover and (gross) profit. Its formula is:
(Gross margin/Net sales) x (Net sales/Average inventory at cost) = (Gross margin/Average
inventory at cost)
B. Once planned sales for the period have been determined, the merchandise manager can then
use one of four methods for planning dollars invested in stock.
They are Basic Stock Method, Percentage Variation Method, The Weeks’ Supply Method and
the Stock-to-Sales Method.

Basic Stock Method (BSM) is a technique for planning dollar inventory investment that allows
for a base stock level plus a variable amount of inventory that will increase or decrease at the
beginning of each sales period in the same dollar amount as the period’s expected sales.
BSM can be calculated as follows:
1. Average monthly sales = Total planned sales for season/Number of months in season
2. Average stock for season = Total planned sales for season/Estimated inventory turnover
rate for season
3. Basic Stock = Average stock for the season - average monthly sales for the season
4. Beginning-of-the-Month (BOM) Stock = Planned monthly sales + Basic stock
The basic stock method works best when a retailer has a low turnover rate or sales are erratic.
Percentage variation method (PVM) is a technique for planning dollar inventory investments
that assumes that the percentage fluctuations in monthly stock from average stock should be half
as great as the percentage fluctuations in monthly sales from average sales.
a. It is computed as follows:
BOM Stock = Average Stock for season x 1/2[1+(Planned sales for the month/Average monthly
sales)]
b. This method is used when the retailer has a high annual inventory turnover rate (i.e., six or
more times a year).
The weeks' supply method (WSM) is a technique for planning dollar inventory investments
that states that the inventory level should be set equal to a predetermined number of weeks’
supply, which is directly related to the desired rate of stock turnover.
a. The WSM is calculated as follows:
(1). Number of weeks to be stocked = # weeks in period/stock turnover rate for period
(2). Average Weekly Sales = estimated total sales for period/# weeks in period
(3). BOM Stock = average weekly sales x # weeks to be stocked.
b. This method is used by retailers where inventories are planned on a weekly, not monthly basis,
and where sales do not fluctuate substantially.
Stock-to-Sales Method (SSM) is a technique for planning dollar inventory investments where
the amount of inventory planned for the beginning of the month is a ratio (obtained from trade
associations or the retailer’s historical records) of stock to sales.
4.3 Dollar Merchandise Control

The dollars planned for merchandise need to be controlled, and this can be accomplished with a
technique called open-to-buy (OTB). OTB refers to the dollar amount that a buyer can currently
spend on merchandise without exceeding the planned dollar stocks.
OTB is calculated as follows:
Planned sales for the month.
Plus planned reductions for the month.
Plus end-of-month stock.
Minus beginning-of-month stock.
Equals planned purchases at retail.
Minus commitments at retail for current delivery.
Equals open-to-buy at retail.
Common Buying Errors that Cause Problems with OTB
The OTB should not be thought of as a fixed quantity that cannot be exceeded when consumer
needs arise. However, changes in OTB should be rare. If there are frequent changes, then the
sales planning process is flawed.
Some common buying errors that cause problems with OTB include:
1. Buying merchandise that is priced too high or too low for the store's target market
2. Buying the wrong type of merchandise, or buying merchandise that is too trendy
3. Having too much or too little basic stock on hand
4. Buying from too many vendors
5. Failing to identify the season's hot items early enough in the season
6. Failing to let the vendor assist the buyer by adding new items and/or new colours to the
retailer’s merchandise mix.
4.4 Merchandise Planning
Merchandise planning is a dynamic process subject to many changes.
Consider the implications that could arise in planning your stock levels as a result of:
1. Sales for the previous month being lower or higher than planned

2. Reductions being either higher or lower than planned
3. Shipments of merchandise being delayed in transit.
Understanding the consequences of each of these situations illustrates the relationship between
merchandising activities and the merchandise budget.
4.5 Inventory Planning
The dollar merchandise plan is only the starting point in merchandise management. Once the
retailer has decided how many dollars can be invested in inventory, the dollar plan needs to be
converted into an actual inventory plan. On the sales floor, items, not dollars, are sold. The
assortment of items that will comprise the merchandise mix, must then be planned. An optimal
merchandise mix has three dimensions. Each dimension is describes an aspect of a merchandise
line.
A merchandise line is a group of products that are closely related because they are intended for
the same end use; are sold to the same customer group; or fall within a given price range. Today,
some retailers manage categories, or lines, as a strategic business unit. When using category
management, buyers are no longer concerned with the GMROI of a single product; instead, they
manage the GMROI for an entire line or category.
4.6 Three Dimensions of the Merchandise Mix
The three dimensions of the merchandise mix are: Variety, which refers to the number of
different lines the retailer stocks in the store. Breadth, also called assortment, refers to the
number of merchandise brands found in a merchandise line.
Breadth can be a problem for retailers selling private label brands. A Battle of the Brands occurs
when retailers, in determining the breath of the product assortment, have their own products
competing with the manufacturer's products for shelf space and control over display location.
Depth refers to the average number of SKUs (stock-keeping units) within each brand of the
merchandise line.
A retailer's merchandise mix can, in addition to satisfying customer wants, actually shape those
wants and impact whether and what customers purchase. Therefore, just as the trading areas for
each store in a chain are different, the optimal mix will be different for every store.
Constraining Factors
There are four constraining factors that influence the design of the optimal merchandise mix:
Dollar merchandise constraint:
There seldom will be enough dollars to emphasize all three dimensions of variety, breadth, and
depth.

Space constraint:
If depth or breadth is wanted, space is needed. If variety is to be stressed, enough empty space is
needed to separate the distinct merchandise lines.
Merchandise turnover constraint:
As the depth of the merchandise increases, more and more variations of the product must be
stocked to serve smaller segments; thus, average turnover is likely to decrease.
Market constraints:
The above three dimensions have a profound effect on how the market perceives the store and
the customers the store will attract.
Constraining factors make it impossible to maximize all dimensions of the merchandise mix.
However, if retailer is going to lose customers, it should lose the less profitable ones by properly
mixing its merchandise in terms of variety, breadth, and depth within the dollar, space, turnover,
and market constraints.
When to Order and Reorder
After deciding the relative emphasis to be placed on the three dimensions of the merchandise
mix, the retailer needs to decide when to order and reorder the desired merchandise line items.
Ideally, a retailer would receive the ordered merchandise just as it is needed.
When selling a seasonal item, the retailer would want to be completely sold out of the item on
the planned out-of-stock date. The retailer tries to achieve optimum efficiency on its inventory
dollars by closely monitoring its inventory using UPC or barcode data.
Conflicts
Due to conflicts, unit stock planning is an “exercise in compromise” because everything cannot
be stocked. Several conflicts are summarized here.
Maintain a strong in-stock position on genuinely new items while trying to avoid the 90 % new
products that fail in the introductory stage. Maintain an adequate stock of the basic popular items
while having sufficient inventory dollars to capitalize on unforeseen opportunities. Maintain high
merchandise turnover goals while maintaining high margin goals. Maintain adequate selection
for customers while not confusing them. Maintain space productivity and utilization while not
congesting the store.
4.7 Six Months Merchandising Plan

Step 1 – The Sales Forecast
The projection of achievable sales revenue, based on historical sales data, analysis of market
surveys and trends, and salespersons’ estimates is termed as a sales forecasting. It is also called
sales budget. A sales forecast may be made by the merchandiser, based on the targets given by
the top management or may be handed down by the top management itself depending on the
retail organisation.
Forecasts
Forecasts are typically developed to answer these questions:
How much of each product will need to be purchased?
Should new products be added to the merchandise assortment?
What price should be charged for the product?
Developing forecasts involves four steps:
1. Reviewing past sales.
2. Analysing the economic conditions and the market opportunities.
3. Analysing the changes in the marketing strategies of the retail organisation and the
competition.
4. Creating the sales forecast.
Influences of Developing Sales Forecasts

Step 2 – Determining the Merchandising Requirements
The merchandise budget is the first stage in the planning of merchandise. It is a financial plan,
which gives an indication of how much to invest in product inventories, stated in monetary
terms. The merchandise budget usually comprises of the: Sales plan, stock support plan, planned
reductions, planned purchase levels, gross margins.
The Range Plan
Range plans are at the level of the company and the department level. The aim of the range plan
is to create a balanced range for each category of products that the retailer chooses to offer. The
process of range planning ensures, that the goals of the merchandise plan fall into specific lines,
many a times the Stock Keeping Units.
Good range planning should essentially: Ensure that sufficient number of items / options
available to the customer. Ensure that over buying and under buying is limited and ensure that
sufficient quantities of the product are available.
The six-month merchandise plan is a tool that translates the profit objectives into a framework of
merchandise planning and then control. The main objective of creating this plan is to prepare a
month-by-month purchasing schedule for the retail organisation.
The primary objective of merchandise planning is profit improvement. As the buyers’ plan for
each department unfolds, you can get a better handle on potential profitability. You then have the

opportunity to fine-tune these plans, allowing investment dollars to be redistributed among
departments in order to achieve company goals and objectives.
In preparing the six month merchandising plan, larger retail chains will build from the bottom
up. Starting at the class level, each class of merchandise will have its own plan. Combining
entire subclasses will give us the strategy for each department.
Taking that one step further, the amalgamation of all department strategies will give us the total
company plan. In the case of an individual store, this will produce the store’s overall objective.
Points to Remember
Here are some points to be kept in mind.
1. The merchandise budget should be prepared in advance of the selling season.
2. The language of the budget should be easy to understand.
3. Since, the economy is ever changing the merchandise budget must be planned for a
relatively short period of time. Six months is the normal norm.
4. The budget should be flexible enough to make changes possible.
4.8 Key Components of the Six Month Merchandise Plan
The key components of the six month merchandise plan are: Planned Sales, Planned Purchases,
Planed Reductions, Planned Markdowns, Employee Discounts, Shrinkage, Planned Markup and
Gross Margin.
To Provide Regular Analysis and Reports

Planned Purchases = Planned Sales + Planned Reductions + Planned EOM- Planned BOM
Stock
Planned Reductions
Markdowns, employee discounts and inventory shrinkage come under the heading of planned
reductions.
Planned Markdowns
Markdowns are deductions in prices and may occur because of many reasons ranging from bad
quality of merchandise, competitive products, change in trends, etc.
Employee Discounts
These are discounts given to the employees for buying the company’s products.
Shrinkage
It is the loss of merchandise due to theft or pilferage.
Planned Markup
Markups vary depending on the type of the product, the audience that it is targeted and the
market trends.
Markup in Rupees= Selling price-Cost price
Gross Margin
Planned Sales
Planned Sales are the projected sales for the period that is planned.
Planned Purchases
It represents the merchandise that is to be purchased during any given period.
Planned purchases are calculated by using the following formula:
It is the difference between the selling price and the cost of the product, less reductions for
markdowns, shrinkage and employee discounts. To determine the Gross Margin for each month,
all purchases and inventories must be converted to cost price.
B.O.M and E.O.M Planned Inventory Levels
Planning End-of-Month (E.O.M.) or Beginning-of-Month (B.O.M) inventory levels is another
important element of the six-month merchandising plan. Four methods of Inventory Planning
are: Stock-to-Sales method, Basic Stock method, Percentage Variation method and Week’s
Supply method.
Stock to Sales Method
The Stock-to-Sales (S/S) is a ratio of the amount of inventory on hand at a particular date to the
sales for the same period.
S/S ratio= Stock on hand E.O.M. (at retail value)
Sales for the same month
A pre-requisite for calculating the Stock-to-sales ratio is for the retailer to have a beginning of
the month stock/sales ratio.
Stock-sales ratio= Value of inventory/Actual sales
Planned BOM Inventory= Stock-sales ratio X Planned sales
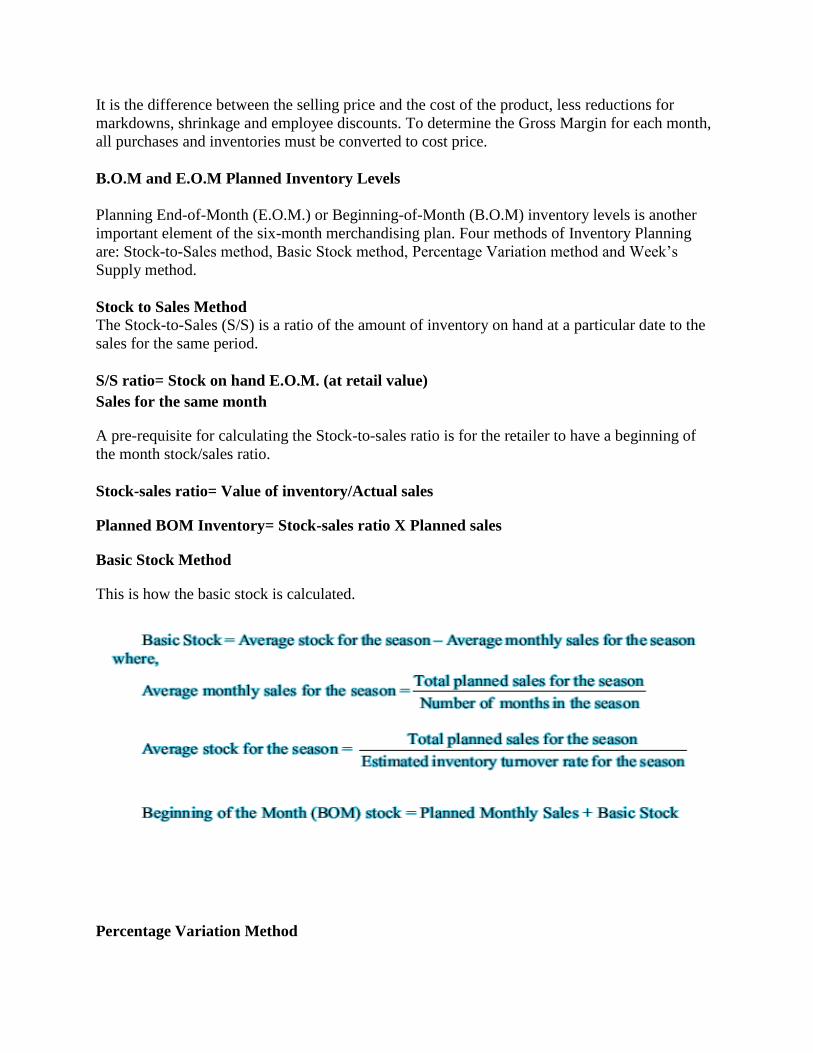
Basic Stock Method
This is how the basic stock is calculated.
Percentage Variation Method

This method of inventory calculation is used in case the stock turnover typically exceeds six
times a year.
It is calculated using the following formula:
BOM Stock= Avg. stock for season*1/2*
[1+ (Planned sales for the month/Average monthly sales)]
Week’s Supply Method
Retailers who need to maintain a control on the inventories on a weekly basis may use this
method. It can be calculated by using the following formula:
Example – Creating the Six Month Merchandise Plan
This table provides the estimated sales for the period January to June.
Example – Creating the Six Month Merchandise Plan

This table gives an example of how to create a six month merchandise plan.
Step 3: Merchandise Control – The Open to Buy
The purpose of the open to buy: Depending on the sales for the month and the reductions the
merchandise buying can be adjusted. The planned relation between the stock and sales can be
maintained.
Open to Buy ensures that the buyer: Limits overbuying and under buying, prevents loss of sales,
due to unavailability of the required stock, maintains purchases within the budgeted limits,
reduces markdowns, which may arise due to excess buying.
Open to Buy is always calculated for current and future periods.
4.9 Completing the Six Month Merchandise Plan
To calculate the open to buy:
Open to Buy= Planned EOM Stock- Projected EOM Stock
9. Gross Margin
Step #1: Assemble Last Year’s Figures
Unless your operation is computerized, however, getting most of the monthly data for your plan
will be impossible. In such cases, simply begin with six month or even annual figures then divide
by the relevant number of months. Or, just take an educated guess. The more times you do this,
the sooner you will develop systems to extract these numbers on a monthly basis.
Step #2: Planned Sales
Sales planning is the most difficult step in the whole process. It would be great, if you could
purchase a retailer's crystal ball and sales forecasts would miraculously appear, after rubbing it
with a cash register tape!
In the real world, however, we start by reviewing last year’s figures and trying to determine what
might affect our performance this year. Some things to consider are:
(a) Sales Performance Coming Into The Season
What percentage increase or decrease is the class, department, or total store expecting coming
into the season compared to the previous year?
There are nine steps to complete the six month merchandise plan.
They are:
1. Assemble last year’s figures
2. Planned Sales
3. Planned Reductions
4. B.O.M. and E.O.M. Planned Inventory Levels
5. Inventory Stock Turns
6. Gross Margin Return On Inventory Investment (GMROII)
7. Planned Purchases
8. Planned Markup

There is no guarantee that it will continue, but if sales are up 15% over last year and the new
season is only three months away, you may be more optimistic than pessimistic in your
forecasting.
(b) Monthly Promotions
Planning your promotions at least six months in advance will be necessary if you hope to have an
effect on performance. A promotional philosophy followed by too many retailers is to run two
clearance sale ads per year, and if sales are soft they might run another ad or two.
This may have been acceptable in the boom years, but a "seat of the pants" approach like this is a
recipe for disaster in today's environment. Advertising and promotion suggests a number of
promotional strategies, one of which is to promote in periods when sales and margins are strong
(e.g. back to-school, Xmas and Mothers-Day).
(c) How are the Customers Changing?
This has more impact when planning at the class level and is most noticeable in areas of fashion.
Are there new styles or markets that pose either an opportunity or a threat to this class of
merchandise?
Consider the case of the family shoe store where western boots, as a class, was expanding. This
style trend will obviously affect our buying plan. Other demographic changes that may affect
your buying include the baby boomer trends (e.g. they’re aging, saving more, spending less,
putting on weight, etc.).
(d) Economic Factors
Unemployment rates, interest rates, dollar value fluctuations and inflation may all have an effect
on the buyer’s crystal ball. If these factors are creating economic drag on our customers, there
will certainly be an effect on what they purchase from us. You may have to move price points
down, source new suppliers, or even adjust your forecasts.
Step #3: Planned Reductions
Markdowns, employee discounts and inventory shrinkage come under the heading of planned
reductions. These three figures affect our ending gross margin, so they must be considered when
calculating department and class profitability. Since, they also affect inventory levels, they must
be projected to ensure enough merchandise is on hand, to attain forecasted sales levels.
Planned Markdowns
Taking any markdowns is a difficult task for most retailers to face. Shoddy merchandise and bad
weather are factors that may be out of the retailer's control. However, the buyer must start by
analyzing last year's markdown numbers very closely. Some factors to consider are: Markdowns
as a percentage of sales by month. How aggressive are this year's pricing policies? When did we
promote last year and how will it change? How were deliveries last year and did they affect our
markdowns?
Employee Discounts
As a percentage of sales, this figure remains relatively constant from one year to the next, unless
company policy changes. Therefore, it is then safe to use last year's dollar figure as a percentage
of sales and apply it to the sales projections for the current period.
Shrinkage
The retailers need to calculate the shrink percentage from past experiences. Like employee
discounts, the acceptable method of calculating the shrinkage dollar amount per month is to use
the year-end shrink percent multiplied by the monthly sales projection.
Step #4: B.O.M. and E.O.M. Planned Inventory Levels
Planning End-of-Month (E.O.M.) or Beginning-of-Month (B.O.M.) inventory levels (one
month’s “ending” is the next month’s “beginning”) is another important element of the six month
merchandise plan. Inventory is by far the number one dollar asset within the company, and
careful planning is required to ensure an adequate return on investment is attained.
Stock-to-Sales Method
The Stock-to-Sales Method is a popular way to forecast how much inventory is required to attain
monthly sales projections. Stock-to-sales (S/S) is a ratio of the amount of inventory on hand at a
particular date to the sales for the same period. It is calculated as follows:
S/S ratio = Stock on hand E.O.M (at retail value) / Sales for the same month
When using the S/S method for planning stock levels, the buyer selects the S/S ratios he desires
each month. Desired S/S ratios are usually obtained by referencing previous seasons. The
selected ratio is then multiplied by the projected period sales to get the desired E.O.M inventory
level. The Stock-to-Sales Ratio also provides you with an estimate of what your Inventory
Turnover will be.
Step #5: Inventory Stock Turns
Inventory stock turns measure the rate at which merchandise is sold from your store compared to
the inventory level on hand. The higher the rate, the more profit the buyer brings to the company
and the better your cash flow will be.

Stock turns are calculated by dividing the total sales for the season by the season’s average
ending inventory (at retail value).
Season Average Inventory = Sum of E.O.M. Inventory / Months in Season
Stock turn rate = Total sales for season / Season average inventory
Step #6: Gross Margin Return on Inventory Investment (GMROII)
While the standard Inventory Turnover ratio tells you how efficiently you are moving your
inventory, it ignores the profitability of this inventory movement.
For example, an item with a low gross margin and high sales will show a higher turnover rate.
However, this is obviously not as desirable as moving inventory with higher (or even average)
gross margins. Basically, it produces a lot of activity, but with fewer financial results.
Gross Margin Return on Inventory Investment has become the standard inventory statistic for
many retailers, because it reflects the movement of inventory relative to profitability, rather than
to sales. This is a better measure of inventory performance because retailers are more interested
in profitability than sales.
Step #7: Planned Purchases
Once sales projections, stock reductions and stock levels have been established, you can
calculate your planned purchases. The planned purchase figure is also the buyer’s first "open-o-
buy" estimate.
Using the August figures from the sample six month plan, the formula for planned purchases is
as follows:
Planned Purchases = EOM Inventory + Sales + Reductions - BOM Inventory
Step #8. Planned Markup
After calculating how much inventory to purchase, retailers must determine the initial markup
for these retailers must determine the initial markup for these goods.

This may fluctuate between different classes of goods within a department. The original markup
must allow for a final profit after paying all operating costs, reductions, cost of goods, etc. Most
retailers have a target markup they want to start with. This markup percentage is calculated by
dividing the markup in dollars by the retail price.
Markup dollars is the difference between the cost price and the selling price. i.e. Our shoe store
buys men's slippers for $10 and follows the manufacturer's suggested retail of $20 which is a
50% markup percentage, otherwise known as gross margin.
Markup dollars = Selling price - Cost price
Step #9. Gross Margin
Gross margin is the difference between the selling price and the cost of the product, less
reductions for markdowns, shrinkage and employee discounts. Hopefully, what is left after these
reductions is enough to pay all operating expenses and leave the retailer with a profit. In our six
month plan, we work in retail dollars. To determine the gross margin for each month, all
purchases and inventories must be converted to cost price.
Example: Using the month of August from the six month plan, we must first convert to cost
figures by multiplying opening/closing inventories and purchases by 50%.
Next, we calculate Cost of Goods Sold (C.O.G.S.) as follows:
C.O.G.S. = B.O.M. Inventory + Purchases - E.O.M. Inventory.
Planned Gross Margin
Preparing a seasonal merchandise plan makes the critical task of buying that much easier. This is
no different from the need for an architect to design a house before he starts building it.
During this process, remember to follow these key suggestions: Become proficient (if you aren’t
already) in the use of a computerized spreadsheet program. Begin with a higher original markup
so your first markdowns can be meaningful without killing gross margin. Plan some markdowns
for each month as you offer instore specials for the “sale- only” buyer. Become proficient at
performing physical inventory counts, so you can obtain accurate figures at least four times per
year.
Using our family shoe store illustration, note that price. Using our family shoe store illustration,
note that we have a 50% markup on all goods. To calculate cost price, multiply the inventories
and purchases by the original markup percent (in this case 50%).
Finally, we determine Planned Gross Margin like this:
Planned Gross Margin = Period sales - C.O.G.S. / Period sales

4.10 Conclusion
To summarize in this unit you have reviewed the planning process from elements of planning to
six month merchandise plan.