sub-grid detection in dna microarray imagessub-grid detection in dna microarray images 249 doneto...
TRANSCRIPT

Sub-grid Detection in DNA Microarray Images
Luis Rueda
Department of Computer ScienceUniversity of Concepcion
Edmundo Larenas 215, Concepcion, 4030000, ChilePhone: +56 41 220-4305, Fax: +56 41 222-1770
Abstract. Analysis of DNA microarray images is a crucial step in gene expres-sion analysis, as it influences the whole process for obtaining biological conclu-sions. When processing the underlying images, accurately separating the sub-grids is of supreme importance for subsequent steps. A method for separating thesub-grids is proposed, which aims to first, detect rotations in the images indepen-dently for the x and y axes, corrected by an affine transformation, and second,separate the corresponding sub-grids in the corrected image. Extensive experi-ments performed in various real-life microarray images from different sourcesshow that the proposed method effectively detects and corrects the underlyingrotations and accurately finds the sub-grid separations.
Keywords: Microarray image gridding, image analysis, image feature anddetectors.
1 Introduction
One of the most important technologies used in molecular biology are microarrays.They constitute a way to monitor gene expression in cells and organisms under specificconditions, and have many applications. Microarrays are produced on a chip (slide) inwhich DNA extracted from a tissue is hybridized with the one on the slide, typically intwo channels. The slide is then scanned at a very high resolution generating an imagecomposed of sub-grids of spots (in the case of cDNA microarrays) [1,2]. Image process-ing and analysis are two important aspects of microarrays, since the aim of obtainingmeaningful biological conclusions depends on how well these stages are performed.Moreover, many tasks are carried out sequentially, including gridding [3,4,5,6,7], seg-mentation [8,9], quantification [2], normalization and data mining [1]. An error in anyof these stages is propagated to the rest of the process. When producing DNA microar-rays, many parameters are specified, such as the number and size of spots, numberof sub-grids, and even their exact location. However, many physical-chemical factorsproduce noise, misalignment, and even deformations in the sub-grid template that it isvirtually impossible to know the exact location of the spots after scanning is performed,at least with the current technology. The first stage in the analysis is to find the loca-tion of the sub-grids (or gridding), which is the focus of our paper. Roughly speaking,gridding consists of determining the spot locations in a microarray image (typically, ina sub-grid). The problem, however, is that microarray images are divided in sub-grids,
D. Mery and L. Rueda (Eds.): PSIVT 2007, LNCS 4872, pp. 248–259, 2007.c© Springer-Verlag Berlin Heidelberg 2007

Sub-grid Detection in DNA Microarray Images 249
done to facilitate the spot locations. While quite a few works have been done on locatingthe spots in a sub-grid, they all assume the sub-grids are known, and this is the problemconsidered in this paper, more formally stated as follows.
Consider an image (matrix) A = {aij}, i = 1, ...., n and j = 1, ...., m, whereaij ∈ Z
+, and A is a sub-grid of a cDNA microarray image1 [1] (usually, aij is in therange [0..65,535] in a TIFF image). In what follows, we use A(x, y) to denote aij . Theaim is to obtain a matrix G (grid) where G = {gij}, i = 1, ...., n and j = 1, ...., m,gij = 0 or gij = 1 (a binary image), with 0 meaning that gij belongs to the grid.This image could be thought of as a “free-form” grid. However, in order to strictly usethe definition of a “grid”, our aim is to obtain vectors v and h, v = [v1, ..., vm]t, h =[h1, ..., hn]t, where vi ∈ [1, m] and hj ∈ [1, n]. Each vertical and horizontal vectors areused to separate the sub-grids. As seen later, rotation correction facilitates finding thistemplate.
Many approaches have been proposed for spot detection and image segmentation,which basically assume that the sub-grids are already identified. That is, they typi-cally work on a sub-grid, rather than on the entire microarray image. The Markovrandom field (MRF) is a well known approach that applies different application spe-cific constraints and heuristic criteria [3,10]. Another gridding method is mathematicalmorphology, which represents the image as a function and applies erosion operatorsand morphological filters to transform it into other images resulting in shrinkage andarea opening of the image, and which further helps in removing peaks and ridges fromthe topological surface of the images [11]. Jain’s [8], Katzer’s [12], and Stienfath’s[13] models are integrated systems for microarray gridding and quantitative analysis.A method for detecting spot locations based on a Bayesian model has been recentlyproposed, and uses a deformable template model to fit the grid of spots in such a tem-plate using a posterior probability model which learns its parameters by means of asimulated-annealing-based algorithm [3,5]. Another method for finding spot locationsuses a hill-climbing approach to maximize the energy, seen as the intensities of thespots which are fit to different probabilistic models [7]. Fitting the image to a mixtureof Gaussians is another technique that has been applied to gridding microarray imagesby considering radial and perspective distortions [6].
All these approaches, though efficient, assume the sub-grids have already been iden-tified, and hence they proceed on a single sub-grid, which has to be specified by theuser. A method used for gridding that does not use this assumption has been proposedin [14,15]. It performs a series of steps including rotation detection based on a simplemethod that compares the running sum of the topmost and bottommost parts of the im-age. It performs rotations locally and applies morphological opening to find sub-grids.This method, which detects rotation angles wrt one of the axes, either x or y, has notbeen tested on images having regions with high noise (e.g. bottommost 1/3 of the imageis quite noisy).
In this paper, we focus on automatically detecting the sub-grids given the entiremicroarray image. The method proposed here uses the well-known Radon transformand an information-theoretic measure to detect rotations (wrt the x and y axes), which
1 The aim is to apply this method to a microarray image that contains a template of rows andcolumns of sub-grids.

250 L. Rueda
are corrected by an affine transformation. Once corrected, the imaged is passed througha mathematical-morphology approach to detect valleys, which are then used to separatethe sub-grids. Section 2 discuss the details of the proposed method, while Section 3presents the experiments on real-life images, followed by the conclusions to the paper.
2 Sub-grid Detection
The proposed sub-grid detection method aims to first correct any rotation of the imageby means of the Radon transform [4,16]. After this, the (x or y-axis) running sum ofpixels is passed through morphological operators to reduce noise, and then the detectedvalleys denote the separation between sub-grids. Note, however, that in order to processthe microarray image in subsequent steps (i.e. gridding and segmentation) the imagedoes not have necessarily to be rotated. Although, the method that we proposed hereinperforms the rotation correction, this can be avoided by generating the horizontal andvertical lines, v and h, for the corrected image, applying the inverse affine transforma-tion to v and h, obtaining the sub-grids in the original image, and hence not degradingthe quality of the image.
Rotations of the image are seen in two different directions, wrt the x and y axes,in the aim at finding two independent angles of rotation for an affine transformation,and for this the Radon transform is applied. Roughly speaking, the Radon transform,which can be seen as a particular case of the Hough transform, is the integral of ann-dimensional function over all types of functions of dimension smaller than n. In twodimensions, like in the case of images, the Radon transform is the integral of the 2Dfunction over all types of real-valued functions, e.g. polynomials, exponentials, etc. Inparticular, when the latter function is a line, the Radon transform can be seen as the pro-jection of the two-variable function (the integral) over a line having a direction (slope)and a displacement (wrt the origin of the coordinate system); this is the case consid-ered in this work. The Radon transform has been found quite useful in the past fewdecades in many applications, including medicine (for the computed axial tomography,or CAT), geology, and other fields of science. In two-dimensional functions projectedonto lines, it works as follows. Given an image A(x, y), the Radon transform performsthe following transformation:
R(p, t) =∫ ∞
−∞A(x, t + px)dx , (1)
where p is the slope and t its intercept. The rotation angle of the image with respect tothe slope p is given by φ = arctanp. For the sake of the notation, R(φ, t) is used todenote the Radon transform of image A. Each rotation angle φ gives a different one-dimensional function, and the aim is to obtain the angle that gives the best alignmentwith the rows and columns. This will occur when the rows and columns are parallel tothe x or y-axis. There are many ways to state this as an optimization problem, and differ-ent objective functions have been used (cf. [3]). In this work, an entropy-based functionis used. Assuming the sub-grids are (or should be2) aligned wrt the y-axis (and x-axis),
2 The aim is to detect the correct alignment. While the assumption made here is to formalize themodel, such an alignment is indeed what is found in the proposed approach.

Sub-grid Detection in DNA Microarray Images 251
the one-dimensional projected function will show well-accentuated peaks, each corre-sponding to a column (row) of spots and deep valleys corresponding to the backgroundseparating the spots and sub-grids. Assuming the experimental setup in the microarrayfabrication considers a reasonable separation between the sub-grids (otherwise it wouldnot be possible to detect such a separation), deeper and wider valleys will be expectedbetween sub-grids, and which are then used to detect the corresponding sub-grids.
To compute the entropy function, the R(φ, t) function is normalized and renamedR′(φ, t), such that
∫t R′(φ, t) = 1. The best alignment will thus occur at the angle
φmin that minimizes the entropy as follows:
H(φ) = −∫ ∞
−∞R′(φ, t) log R′(φ, t)dt . (2)
One of the problems, however, the entropy function has is that, depending on therotation angle φ, the sides of the one-dimensional function tend to diminish the “uni-formity” of the function, and hence bias the entropy measure. This occurs when φ isnear π/4. Since reasonable small rotations are expected to occur, small angles are con-sidered (no more than 10 degrees of rotation). Also, the resulting signal function is ona discrete domain, i.e. φ takes discrete values, and hence the entropy is computed asfollows:
H(φ) = −∞∑
t=−∞R′(φ, t) log R′(φ, t)dt . (3)
Note that R(φ, t) is normalized into R′(φ, t), such that∑
t R′(φ, t) = 1.The image is checked for rotations in both directions, wrt the x and y axes, obtaining
two different angles of rotation φminx and φminy respectively. The positions of thepixels in the new image, [uv] , are obtained as follows:
[uv] = [xy1]T , (4)
where T is the following 3 × 2 matrix:
T =
⎡⎣ α β
β αγ1 γ2
⎤⎦ (5)
The first two parameters, α and β, are given by the best angles of rotation found bythe Radon transform, φminx and φminy , and computed as follows:
α = s cosφminx (6)
β = s sin φminy (7)
where s is a scaling factor (in this work, s is set to 1), and γ1 and γ2 are translationfactors, which are set to 0. The transformed image, A′, is reconstructed by interpolatingthe intensities of pixels x and y and their neighbors; in this work, bicubic is used.

252 L. Rueda
(a) Original. (b) Transformed.
−5 −4 −3 −2 −1 0 1 2 3 4 57.45
7.5
7.55
7.6
7.65
7.7
φ
H(φ
)
(c) Entropy function for rotation angles φ between -5 and 5, wrt the y-axis.
Fig. 1. A sample DNA microarray image (AT-20385-ch1) drawn from the Stanford microarraydatabase, along with the transformed (by means of the affine transformation) image, and theentropy function wrt the y-axis
A sample image from the Stanford microarray database is shown in Fig. 1(a), namelyimage AT-20385-ch1. This image has been reduced in size, and the whole image can

Sub-grid Detection in DNA Microarray Images 253
0 200 400 600 800 1000 1200 1400 1600 1800 20000
0.5
1
1.5
2
2.5
3x 10
7
x
s x(x)
0 200 400 600 800 1000 1200 1400 1600 1800 20000
0.5
1
1.5
2
2.5
3x 10
7
x
s x(x)
(a) Original sx(x) function. (b) Resulting sx(x).
Fig. 2. The original running sum function, sx(x), before and after applying the morphologicaloperators, for image AT-20385-ch1
be found in the database3. This image contains 48 sub-grids arranged in 12 rows and 4columns. This image is rotated -0.8 degrees wrt the y-axis and 1.5 degrees wrt the x-axis (the latter not easily visualized by eye). These rotations are accurately detected bymeans of horizontal and vertical Radon transforms, which are performed independently,and the resulting image after applying the affine transformation as per (4) is shown inFig. 1(b). Fig. 1(c) depicts the entropy function as per (3) for all angles φ between -5and 5 degrees wrt the y-axis. The global minimum at φminy = −0.8 is clearly visiblein the plot.
The next step consists of finding the lines separating the sub-grids. For this, it isassumed that the angles that give the optimal affine transformation are φminx andφminy , and the “transformed” image is A′. To detect the vertical lines4, the runningsum of pixel intensities of A′ is computed for all values of y, obtaining the functionsx(x) =
∑y A′(x, y). To detect the lines separating the sub-grids, the n deepest and
widest valleys are found, where n is the number of columns of sub-grids (parametergiven by the user). The function sx(x) is passed through morphological operators (dila-tion, sx(x) ⊕ b, followed by erosion, sx(x) � b, with b = [0, 1, 1, 1, 1, 0]) to in order toremove noisy peaks. After this, n potential centers for the sub-grids are found by divid-ing the range of sx(x) into nearly-equal parts. Since sx(x) contains many peaks (eachrepresenting a spot), and the aim is to detect sub-grids, the function is passed, again, bymorphological operators (dilation, sx(x) ⊕ b, followed by erosion, sx(x) � b), whereb depends on the spot width in pixels (scanning resolution), and computed as follows.The number of pixels p for each spot is found by means of a “hill-climbing” procedurethat finds the lowest valleys (in this paper, six are found) around the potential centersfor each sub-grid. Averaging the distances between the valleys found gives a resolutionr (width of each spot), and the morphological operand b is set as follows: b = [01r0],
3 The full image is electronically available at smd.stanford.edu, in category “Hormone treat-ment”, subcategory “Transcription factors”, experiment ID “20385”, channel “1”.
4 The details for detecting the horizontal lines are similar and omitted to avoid repetition.

254 L. Rueda
where 1r is a run of r ones. Once the morphological operators are applied, the linesseparating the sub-grids are obtained as the centers of the deepest and widest valleysbetween the potential centers found previously.
Fig. 2 shows the running sum of pixel intensities along the x-axis, for image AT-20385-ch1. The original sx(x) function is plotted in Fig. 2(a), which contains manysharped peaks corresponding to each column of spots, and hence making it difficultto detect the separation between grids (the widest and deepest valleys). The resultingfunction after applying the morphological operators is depicted in Fig. 2(b), in whichthe sharped peaks tend to “disappear”, while the deepest valleys are preserved. Thethree deepest and widest valleys, which can be easily visualized by eye, correspondto the three lines separating the four columns of sub-grids. Note that it is not difficultto detect these three valleys despite the image does not clearly show the separationbetween columns of sub-grids.
3 Experimental Results
For the experiments, two different kinds of cDNA microarray images have been used.The images have been selected from different sources, and have different scanning res-olutions, in order to study the flexibility of the proposed method to detect sub-gridsunder different spot sizes.
The first set of images has been drawn from the Stanford Microarray Database(SMD), and corresponds to a study of the global transcriptional factors for hormonetreatment of Arabidopsis thaliana5 samples. Ten images were selected for testing theproposed method, and they correspond to channels 1 and 2 for experiments IDs 20385,20387, 20391, 20392 and 20395. The list of the images used for the testing are listed inTable 1. The images have been named using AT (which stands for Arabidopsis thaliana),followed by the experiment ID, and the channel number (1 or 2). The images have a res-olution of 1910 × 5550 pixels and are in TIFF format. The spot resolution is 24 × 24pixels per spot, and the separation between sub-grid columns is about 40 pixels, whichis very low. Each image contains 48 sub-grids, arranged in 12 rows and 4 columns.Also, listed in the table are for each image, the angles of rotation wrt to the x and yaxes, φminx and φminy respectively, found by maximizing (3). The last column liststhe accuracy in terms of percentage, which represents the number of sub-grids correctlydetected. All the images are rotated with respect to both x and y axes. Also, the anglesof rotation are different for the two axes, x and y, for all the images. These rotationsare detected and corrected by the proposed method. Note that even when the angles ofrotation are small, e.g. 0.5 and 0.2 for AT-20395 ch1 and ch2, it is critical to detectthese angles and correct them, since the resolution of the images is very high and asmall angle variation will produce a displacement of a vertical line by a large numberof pixels. For example, a rotation angle of 0.8 degrees wrt to the y-axis will producea displacement of 25 pixels (for images AT-20385 ch1 and ch2). Since the separationbetween sub-grids is about 40 pixels, it is quite difficult, though possible, to detect thevertical lines separating the sub-grids, while after detecting and correcting the rotations,
5 The images can be downloaded from smd.stanford.edu, by searching “Hormone treatment” ascategory and “Transcription factors” as subcategory.

Sub-grid Detection in DNA Microarray Images 255
Table 1. Test images drawn from the SMD, angles of rotation and percentage of sub-gridsdetected
Image φminx φminy AccuracyAT-20385-ch1 1.5 -0.8 100%AT-20385-ch2 1.5 -0.8 100%AT-20387-ch1 0.8 -0.1 100%AT-20387-ch2 0.8 -0.1 100%AT-20391-ch1 0.9 -0.2 100%AT-20391-ch2 0.9 -0.2 100%AT-20392-ch1 1.0 -0.2 100%AT-20392-ch2 1.0 -0.2 100%AT-20395-ch1 0.5 0.2 100%AT-20395-ch2 0.5 0.2 100%
it is rather easy to separate the sub-grids – this is observed by the 100% accuracy themethod yields on all the images of the SMD.
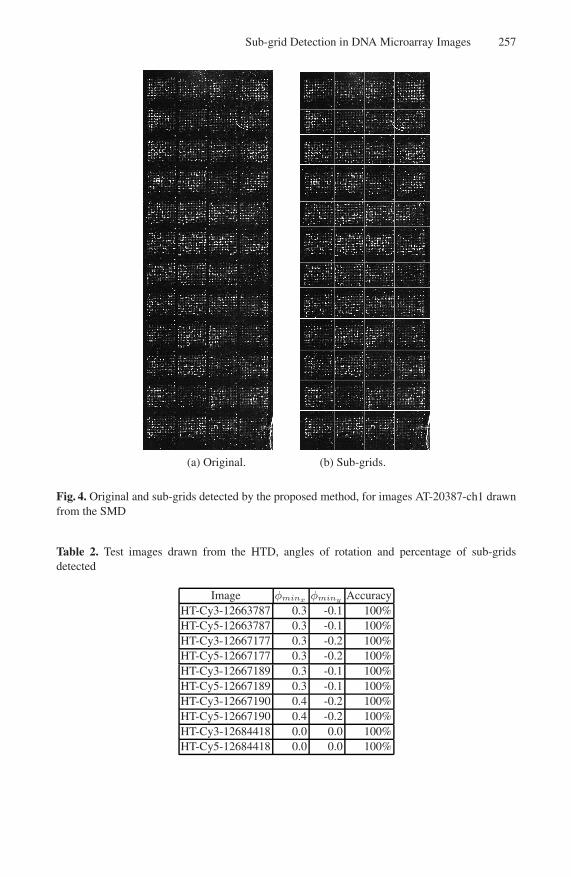
To observe visually how the method performs, Figs. 3 and 4 show two images, AT-20385-ch1 and AT-20387-ch1, in their original form, and the resulting images obtainedafter applying the proposed method (Figs. 3(b) and 4(b)). For AT-20385-ch1, the rota-tion wrt to the y-axis is clearly visible in the picture and it is seen how it is corrected.It is clear also how the sub-grids are accurately detected, specially the vertical linesseparating the grids, despite the image contains many noisy artifacts resulting from themicroarray experimental stages – some sub-grids on the bottom right part of the imageare even quite noisy. For AT-20387-ch1 the angle of rotation wrt to the y-axis is verysmall, φminy = 0.1; however, it is detected and corrected by the proposed method. Itis clear from Figs. 3 and 4 how the sub-grids are detected and well separated by thevertical and horizontal lines.
The second test suite consists of a set of images produced in a microarray study ofa few genes in an experiment where human cultured cell line was used to look at thetoxicogenomic effects of two pesticides that were found in the rural drinking water [17],namely the human toxicogenomic dataset (HTD). Ten images were selected for testingthe proposed method, which correspond to five different experiments in two channels,Cy3 and Cy5. The images are listed in Table 2, and are named by using HT (whichstands for human toxicogenomic), followed by the channel number (Cy3 or Cy5) andthe experiment ID. The images have a resolution of 7013×3514 pixels, and are in TIFFformat. The spot resolution is 40 × 40 pixels per spot, and the separation between sub-grid columns and rows is about 400 pixels. Each image contains 32 sub-grids, arrangedin 8 rows and 4 columns. The second, third and fourth columns have the same meaningas in Table 1. As in the other set of images, all the sugrids are detected with 100% ac-curacy, denoting the efficiency of the proposed method. While the angles of rotation forthe images of the HTD are quite small, they are detected and corrected by the proposedmethod. However, a small angle for these images produce a large displacement in termsof pixels, since their resolution is higher than that of the images of the SMD. For exam-ple, for image HT-Cy3-12667177, a rotation of -0.2 degrees produces a displacementof 8 pixels, which in turn, affects the process of detecting the sub-grid separation.

256 L. Rueda
(a) Original. (b) Sub-grids.
Fig. 3. Original and sub-grids detected by the proposed method, for images AT-20385-ch1 drawnfrom the SMD
An image, HT-Cy5-12663787, drawn from the HTD is shown in Fig. 5. The originaland sub-grids detected are shown in (a) and (b) respectively. Even though the sub-grids are well separated by a large number of pixels, the image contains a lot of noisein the separating area, and thus, making it difficult to detect the sub-grid separation(accurately done by the proposed method). The noise present in the separating area,however, does produce a displacement of the separating lines, but each box perfectlyencloses the corresponding sub-grid. All the 20 images tested can be downloaded fromthe corresponding links given above.
To conclude the paper, the advantages of using the proposed method are summarizedas follows. First, the proposed method allows to automatically detect angles of rotation(independently for the x and y axes), and performs a correction based on an affine trans-formation. Second, rotations are detected by mathematically sound principles involvingthe Radon transform and information-theoretic measures. Third, once the affine trans-formation is performed, the method allows to detect the sub-grids accurately, as shownin two sets of images from different sources and having different parameters (resolution,
Sub-grid Detection in DNA Microarray Images 257
(a) Original. (b) Sub-grids.
Fig. 4. Original and sub-grids detected by the proposed method, for images AT-20387-ch1 drawnfrom the SMD
Table 2. Test images drawn from the HTD, angles of rotation and percentage of sub-gridsdetected
Image φminx φminy AccuracyHT-Cy3-12663787 0.3 -0.1 100%HT-Cy5-12663787 0.3 -0.1 100%HT-Cy3-12667177 0.3 -0.2 100%HT-Cy5-12667177 0.3 -0.2 100%HT-Cy3-12667189 0.3 -0.1 100%HT-Cy5-12667189 0.3 -0.1 100%HT-Cy3-12667190 0.4 -0.2 100%HT-Cy5-12667190 0.4 -0.2 100%HT-Cy3-12684418 0.0 0.0 100%HT-Cy5-12684418 0.0 0.0 100%

258 L. Rueda
(a) Original. (b) Sub-grids.
Fig. 5. Original and sub-grids detected for image HT-Cy5-12663787 drawn from the HTD
number of sub-grids, spot width, etc.). Fourth, the method provides the right orienta-tion of the sub-grids detected so that they can be processed in the subsequent stepsrequired to continue the microarray data analysis, namely detecting the spot centers (orgridding), and separating the background from foreground (segmentation).
4 Conclusions
A method for separating sub-grids in cDNA microarray images has been proposed. Themethod performs two main steps involving the Radon transform for detecting rotationswrt the x and y axes, and the use of morphological operators to detect the correspondingvalleys that separate the sub-grids.
The proposed method has been tested on real-life, high-resolution microarray imagesdrawn from two sources, the SMD and the HTD. The results show that (1) the rotationsare effectively detected and corrected by affine transformations, and (2) the sub-gridsare accurately detected in all cases, even in abnormal conditions such as extremely noisyareas present in the images.
Future work involves the use of nonlinear functions for the Radon transform, in orderto detect curvilinear rotations. This is far from trivial as it involves a number of possiblenonlinear functions, e.g. polynomials or exponentials. Another topic to investigate is

Sub-grid Detection in DNA Microarray Images 259
to fit each sub-grid into a perfect box eliminating any surrounding background, andhence providing advantages for the subsequent steps, a problem that is currently beingundertaking.
References
1. Draghici, S.: Data Analysis Tools for DNA Microarrays. Chapman & Hall (2003)2. Schena, M.: Microarray Analysis. John Wiley & Sons, Chichester (2002)3. Antoniol, G., Ceccarelli, M.: A markov random field approach to microarray image gridding.
In: Proceedings of the 17th International Conference on Pattern Recognition, Cambridge,UK, pp. 550–553 (2004)
4. Brandle, N., Bischof, H., Lapp, H.: Robust dna microarray image analysis. Machine Visionand Applications 15, 11–28 (2003)
5. Ceccarelli, B., Antoniol, G.: A deformable grid-matching approach for microarray images.IEEE Transactions on Image Processing 15(10), 3178–3188 (2006)
6. Qi, F., Luo, Y., Hu, D.: Recognition of perspectively distorted planar grids. Pattern Recogni-tion Letters 27(14), 1725–1731 (2006)
7. Rueda, L., Vidyadharan, V.: A hill-climbing approach for automatic gridding of cdna mi-croarray images. IEEE Transactions on Computational Biology and Bioinformatics 3(1),72–83 (2006)
8. Jain, A., Tokuyasu, T., Snijders, A., Segraves, R., Albertson, D., Pinkel, D.: Fully automaticquantification of microarray data. Genome Research 12(2), 325–332 (2002)
9. Noordmans, H., Smeulders, A.: Detection and characterization of isolated and overlappingspots. Computer Vision and Image Understandigng 70(1), 23–35 (1998)
10. Katzer, M., Kummer, F., Sagerer, G.: A markov random field model of microarray gridding.In: Proceedings of the 2003 ACM Symposium on Applied Computing, pp. 72–77 (2003)
11. Angulo, J., Serra, J.: Automatic analysis of dna microarray images using mathematicalmor-phology. Bioinformatics 19(5), 553–562 (2003)
12. Katzer, M., Kummert, F., Sagerer, G.: Automatische auswertung von mikroarraybildern. In:Proceedings of Workshop Bildverarbeitung fur die Medizin, Cambridge, UK (2002)
13. Steinfath, M., Wruck, W., Seidel, H.: Automated image analysis for array hybridization ex-periments. Bioinformatics 17(7), 634–641 (2001)
14. Wang, Y., Ma, M., Zhang, K., Shih, F.: A hierarchical refinement algorithm for fully auto-matic gridding in spotted dna microarray image processing. Information Sciences 177(4),1123–1135 (2007)
15. Wang, Y., Shih, F., Ma, M.: Precise gridding of microarray images by detecting and cor-recting rotations in subarrays. In: Proceedings of the 8th Joint Conference on InformationSciences, Salt Lake City, USA, pp. 1195–1198 (2005)
16. Helgason, S.: The Radon Transform, 2nd edn. Springer, Heidelberg (1999)17. Qin, L., Rueda, L., Ali, A., Ngom, A.: Spot detection and image segmentation in dna mi-
croarray data. Applied Bioinformatics 4(1), 1–12 (2005)