sub-catchment scale monitoring, modelling and extension ... · project 1.8 sub-catchment scale...
TRANSCRIPT
Sub-catchment scale monitoring, modelling and extension design to support reef water quality
improvement in sugarcane catchmentsAaron Davis and Jane Waterhouse
Final Report
Sub-catchment scale monitoring, modelling and extension design to support reef water quality
improvement in sugarcane catchments
Aaron M. Davis1, Jane Waterhouse
1,
1 Centre for Tropical Water & Aquatic Ecosystem Research (TropWATER), James Cook University
Supported by the Australian Government’s
National Environmental Science Programme
Project 1.8 Sub-catchment scale monitoring, modelling and extension design to support reef water quality improvement
© James Cook University, 2016
Creative Commons Attribution
Sub-catchment scale monitoring, modelling and extension design to support reef water quality improvement in sugarcane catchments is licensed by James Cook University for use under a Creative Commons Attribution 4.0
Australia licence. For licence conditions see: https://creativecommons.org/licenses/by/4.0/
National Library of Australia Cataloguing-in-Publication entry:
978-1-925088-96-0
This report should be cited as:
Davis, A.M., Waterhouse, J. (2016). Sub-catchment scale monitoring, modelling and extension design to support
reef water quality improvement in sugarcane catchments: NESP Project 1.8. Report to the National
Environmental Science Programme. Reef and Rainforest Research Centre Limited, Cairns (114 pp.).
Published by the Reef and Rainforest Research Centre on behalf of the Australian Government’s National
Environmental Science Programme (NESP) Tropical Water Quality (TWQ) Hub.
The Tropical Water Quality Hub is part of the Australian Government’s National Environmental Science
Programme and is administered by the Reef and Rainforest Research Centre Limited (RRRC). The NESP TWQ
Hub addresses water quality and coastal management in the World Heritage listed Great Barrier Reef, its
catchments and other tropical waters, through the generation and transfer of world-class research and shared
knowledge.
This publication is copyright. The Copyright Act 1968 permits fair dealing for study, research, information or
educational purposes subject to inclusion of a sufficient acknowledgement of the source.
The views and opinions expressed in this publication are those of the authors and do not necessarily reflect those
of the Australian Government.
While reasonable effort has been made to ensure that the contents of this publication are factually correct, the
Commonwealth does not accept responsibility for the accuracy or completeness of the contents, and shall not be
liable for any loss or damage that may be occasioned directly or indirectly through the use of, or reliance on, the
contents of this publication.
Cover photographs: Aaron Davis
This report is available for download from the NESP Tropical Water Quality Hub website:
http://www.nesptropical.edu.au
Sub-catchment scale monitoring, modelling and extension design
i
CONTENTS List of Tables ........................................................................................................................... iv
List of Figures .......................................................................................................................... vi
Acronyms................................................................................................................................ viii
Acknowledgements ................................................................................................................. ix
Executive Summary ................................................................................................................. 1
1. Introduction ....................................................................................................................... 5
1.1 Background and context ................................................................................................. 5
1.2 Current management goals ............................................................................................ 7
1.3 Water quality issues in the GBR ..................................................................................... 9
1.4 Current GBR catchment monitoring and evaluation ....................................................... 9
1.5 Using monitoring to prioritise management actions ...................................................... 11
1.6 An introduction to the challenges and opportunities of fine-scale monitoring ............... 12
1.7 Project outline ............................................................................................................... 13
2. Monitoring program design ............................................................................................. 14
2.1 Setting Monitoring Program Objectives ........................................................................ 16
2.2 Study Design ................................................................................................................ 19
2.3 Field Sampling Program ............................................................................................... 20
2.4 Laboratory Analysis ...................................................................................................... 21
2.5 Data analysis and interpretation of the data ................................................................. 21
2.6 Reporting and information dissemination ..................................................................... 21
3. Designing a sub-catchment monitoring program for sugarcane catchments in the GBR 23
3.1 Setting monitoring program objectives ......................................................................... 23
3.1.1 Define the issue ..................................................................................................... 23
3.1.2 Define information requirements and compile available information ...................... 24
3.1.3 Define Develop system understanding and relative risks to high-valued receiving
environments ................................................................................................................... 25
3.1.4 Relative risks to GBR ecosystems at a regional scale ........................................... 28
3.1.5 Identification of the primary sources of DIN and PSII herbicide losses from
sugarcane areas at a catchment and sub-catchment scale (monitored and modelled
pollutant loads). ............................................................................................................... 31
3.1.6Knowledge of current adoption of priority management practices that reduce DIN
and PSII herbicide losses from sugarcane ...................................................................... 44
3.1.7Characteristics of the sugarcane areas in terms of the number farmers and farm
sizes which will assist to determine management effort. ................................................ 47
Davis et al.
ii
3.1.8Other regionally specific social and economic characteristics that may influence the
losses of DIN and PSII herbicide loads from sugarcane areas (e.g. costs, farmer
involvement in incentive programs). ................................................................................ 48
3.1.9 Setting objectives ................................................................................................... 51
3.2 Study Design ................................................................................................................ 52
3.2.1 Spatial Boundaries, scale and duration .................................................................. 52
3.2.2 Selection of Sampling Sites ................................................................................... 52
3.2.3 Temporal Scope of Study (monitoring duration) .................................................... 54
3.2.4 Sampling Collection Methods and Sampling Frequency ........................................ 54
3.3 Field sampling program and Laboratory analysis ......................................................... 61
3.4 Data analysis and interpretation ................................................................................... 62
3.5 The challenges of small catchment monitoring ............................................................. 62
3.5.1 Additional datasets required ................................................................................... 64
3.5.2 Local and broader cane industry and grower engagement .................................... 64
3.5.3 Program staffing and capacity ................................................................................ 65
3.5.4 Reporting ................................................................................................................ 65
3.6 Options for integration with related programs ............................................................... 66
3.6.1 Opportunities to link with paddock and catchment modelling ................................ 66
4. Program design options .................................................................................................. 72
5. Pilot Study Design ........................................................................................................... 77
5.1 Case study 1: Sub-catchment Water Quality Monitoring for Pesticides in the Plane
Catchment, Sandy Creek (RP144P). ................................................................................ 77
5.1.1 Project background and description ....................................................................... 77
5.1.2 Program design ...................................................................................................... 78
5.1.3 Initial program results ............................................................................................. 80
5.1.4 Program design recommendations ........................................................................ 83
5.2 Case study 2: Herbert Water Quality Monitoring Program monitoring sites 2011–2015.
............................................................................................................................................ 83
5.2.1 Project background and description ....................................................................... 83
5.2.2 Program design ...................................................................................................... 84
5.2.3 Initial program results ............................................................................................. 86
5.2.4 Program key learnings and design recommendations ........................................... 87
5.3 Case study 3: A Sub Catchment Adaptive Management Approach to Water Quality in
Sugarcane (RP102C) ........................................................................................................ 88
5.3.1 Project background and description ....................................................................... 88
5.3.2 Program design ...................................................................................................... 89
5.3.3 Initial program results ............................................................................................. 90

Sub-catchment scale monitoring, modelling and extension design
iii
5.3.4 Program design recommendations ........................................................................ 92
6. Conclusions and Recommendations ............................................................................... 93
6.1 Conclusions .................................................................................................................. 93
6.2 Where to from here? ..................................................................................................... 93
7. References ...................................................................................................................... 95
Appendix 1 ........................................................................................................................... 105
Appendix 2 ........................................................................................................................... 107
Davis et al.
iv
LIST OF TABLES Table 1: The range of intervention options available for improved water quality
management in the agricultural sector (modified from Barnes et al., 2013). ... 18
Table 2: GBRCA Natural Resource Management regions and constituent river
catchments. Green shading indicated catchments within regions with
sugarcane cultivation as a major land-use. ..................................................... 24
Table 3: Summary of the outcomes of the overall assessment of the relative risk of
water quality in the GBR. Note that the Burnett Mary Region is shaded in grey
to represent the fact that most reefs and seagrass meadows in this region
were not included formally in this GBR wide analysis and thus the validity of
the result has high uncertainty. ....................................................................... 30
Table 4: Estimated annual average DIN loads from the GBR sugarcane catchments,
and proportion of each catchment contribution to the total GBR sugarcane DIN
load. The shading represents the NRM Region: Wet Tropics = Green;
Burdekin = Dark orange; Mackay Whitsunday = Blue; Burnett Mary = Orange.
Source: Derived from Source Catchments model 2013 Baseline loads (DNRM,
2016). .............................................................................................................. 32
Table 5: Summary of priority management areas for reducing the relative risk of
degraded water quality to the Wet Tropics NRM region. Source: Adapted from
Waterhouse et al. (2014). ................................................................................ 33
Table 6: Summary of pollutant generation hotspots identified through the Source
Catchments modelling for the Wet Tropics region. Reproduced from Hateley et al. (2014), Appendix K. .................................................................................... 34
Table 7: The relative risk of pesticides, DIN and suspended sediment runoff from
sugarcane in the Lower Burdekin catchment to receiving aquatic
environments. Reproduced from NQ Dry Tropics (2016). ............................... 37
Table 8: Summary of sub-catchment areas relevant to managing the relative risk of
degraded water quality to the Lower Burdekin floodplain. Source: Adapted
from Dight (2009a; 2009b). ............................................................................. 38
Table 9: Summary of priority management areas for reducing the relative risk of
degraded water quality to the Mackay-Whitsunday NRM region. Source:
Adapted from Folkers et al. (2014). ................................................................. 41
Table 10: P2R classification of management practices in the sugarcane industry. ........ 45
Table 11: Data requirements and utility for Bronze standard integration of paddock-
catchment modelling with sub-catchment monitoring program. ...................... 69
Table 12: Data requirements and utility for Silver standard integration of paddock-
catchment modelling with sub-catchment monitoring program. ...................... 70
Table 13: Data requirements and utility for Gold standard integration of paddock-
catchment modelling with sub-catchment monitoring program. ...................... 71
Table 14: ‘Gold Standard’ scientific vision for spatially targeted monitoring, modelling
and extension program. .................................................................................. 74
Table 15: ‘Silver Standard’ scientific vision for spatially targeted monitoring, modelling
and extension program. Black font colours indicate program elements retained
from ‘Gold standard’ program, grey font indicates program element dropped
from ‘Gold standard’ monitoring program design. ........................................... 75

Sub-catchment scale monitoring, modelling and extension design
v
Table 16: ‘Bronze Standard’ scientific vision for spatially targeted monitoring, modelling
and extension program. Black font colours indicate program elements retained
from ‘Gold standard’ program, grey font indicates program element dropped
from ‘Gold standard’ monitoring program design. ........................................... 76
Davis et al.
vi
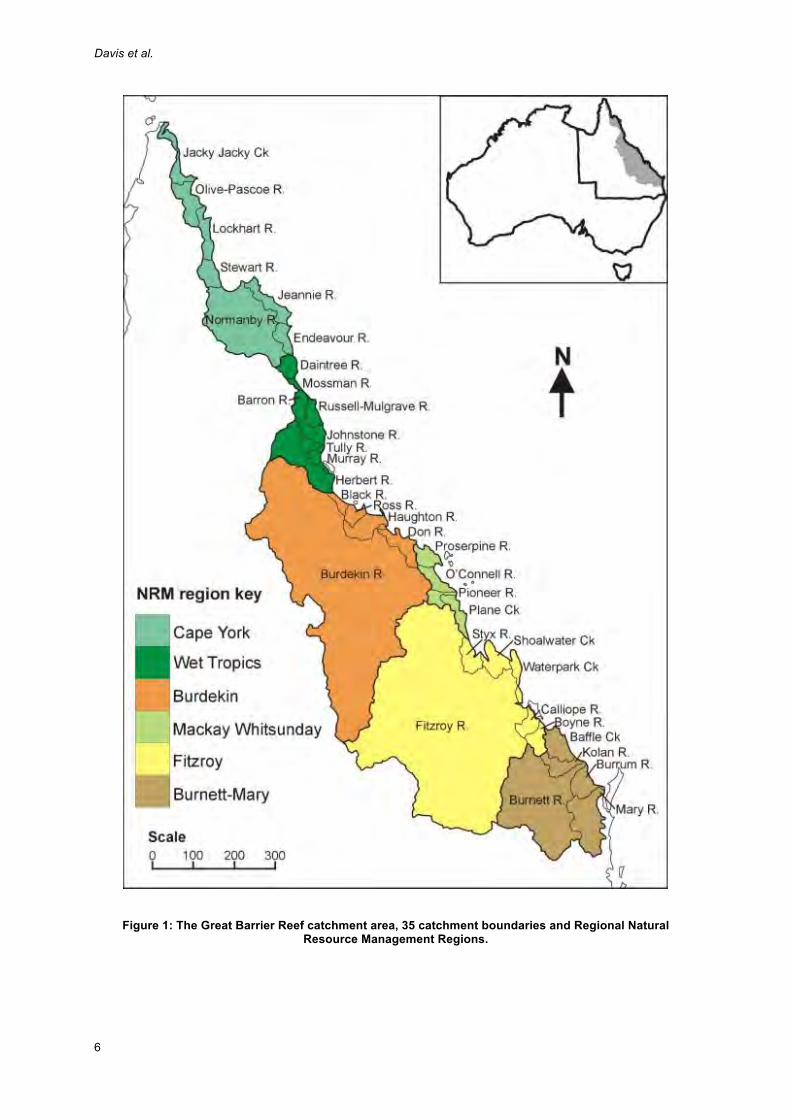
LIST OF FIGURES Figure 1: The Great Barrier Reef catchment area, 35 catchment boundaries and
Regional Natural Resource Management Regions. .......................................... 6
Figure 2: Progress toward Reef Plan 2013 management practice adoption targets.
Source: Reef Plan Report Card (2013-2014), Queensland Government,
(2015a). ............................................................................................................. 8
Figure 3: Progress toward Reef Plan 2013 pollutant load reduction targets. Source:
Reef Plan Report Card (2013-2014), Queensland Government, (2015a). ........ 8
Figure 4: P2R conceptual overview of monitoring and modelling from the paddock to
reef to measure and report on progress towards Reef Plan goals and targets.
........................................................................................................................ 10
Figure 5: Framework for a water quality monitoring program from the NWQMS
Monitoring and Reporting guidelines document (ANZECC and ARMCANZ,
2000). The boxes on the right identify the sections of this report where the
design is discussed for the GBR sub-catchment design. ................................ 15
Figure 6: Framework for setting monitoring program objectives (ANZECC and
ARMCANZ, 2000). .......................................................................................... 16
Figure 7: Framework for designing a monitoring study (ANZECC and ARMCANZ, 2000).
........................................................................................................................ 19
Figure 8: Sample 1-year hydrographs for a perennial wet-tropical (blue) and an
intermittent dry-tropical (red) stream system, illustrating key water quality risk
periods and instream processes occurring through the year. Intermittently
disconnected lagoons in wet tropical and dry tropical regions are also
represented by the red line. Dotted lines outline key hydrological periods
relating to temporal water quality processes. .................................................. 26
Figure 9: Conceptual model for dynamics of pollutant delivery (i.e., inorganic nitrogen –
green dotted line) in relation to hydrology (blue line) in a perennial Wet Tropics
canegrowing catchment (modified from Davis et al., 2016). ........................... 28
Figure 10: Estimated annual average loads of total DIN from sugarcane areas in each
NRM region. The inset shows the regional contributions to the total industry
load. Source: DNRM, 2016; Source Catchments model 2013 Baseline loads.
........................................................................................................................ 29
Figure 11: Estimated catchment contributions to the total regional annual average loads
of total DIN from sugarcane areas. Source: Derived from Source Catchments
model 2013 Baseline loads (DNRM, 2016). .................................................... 33
Figure 12: Map of Wet Tropics NRM region sub-catchment ‘hotspots’ for dissolved
inorganic nitrogen (DIN) generation (kg/yr). Modified from Hateley et al. (2014). ............................................................................................................. 35
Figure 13: Map of Wet Tropics NRM region sub-catchment ‘hotspots’ for photosystem II
herbicide (PSII) generation (kg/yr). Modified from Hateley et al. (2014). ........ 36
Figure 14: Map of Burdekin NRM region sub-catchment ‘hotspots’ for nutrient and
photosystem II herbicide (PSII) generation (kg/yr). Modified from NQ Dry
Tropics (2016). ................................................................................................ 39
Figure 15: Mackay Whitsunday System Repair and Water Quality Management Priority
Locations. Modified from Folkers et al. (2015). ............................................... 43
Figure 16: Adoption of sugarcane best management practices for nutrients and
pesticides in the Wet Tropics region as at June 2014. Source: P2R program,
DAF 2015. ....................................................................................................... 46
Figure 17: Adoption of sugarcane best management practices for nutrients and
pesticides in the Mackay-Whitsunday region as at June 2014. Source: P2R
program, DAF 2015. ........................................................................................ 47
Figure 18: Density plots of farm size (hectares) (top) and individual grower numbers in
individual sub-catchments (bottom) for major Wet Tropics watersheds. ......... 49
Sub-catchment scale monitoring, modelling and extension design
vii
Figure 19: Density plots of farm size (hectares) (top) and individual grower numbers in
individual sub-catchments (bottom) for major lower Burdekin sub-catchments.
........................................................................................................................ 50
Figure 20: GIS plot of catchment boundaries, land use (sugarcane cultivation) and land
tenure (sourced from Qspatial:
http://qldspatial.information.qld.gov.au/catalogue/custom/index.page). .......... 53
Figure 21: Example of ‘lookup table’ style outputs from existing modelling data that links
fertiliser management classes to DIN losses in runoff for a lower Burdekin
sugarcane farming scenario with conventional tillage practices and high
irrigation rates. The response to management is “flat” in this case because of
the ‘D” class irrigation practices used in the example. .................................... 68
Figure 22: Optimal model of monitoring program to integrate water quality, socio-
behavioural and policy research in a target catchment. .................................. 73
Figure 23: Sampling, land use and monitoring locations (numbered) in the Sandy Creek
sub-catchment monitoring project (Mackay-Whitsunday NRM region). .......... 79
Figure 24: Preliminary herbicide monitoring results from Sandy Creek sub-catchment
monitoring program. Data is presented as average diuron concentration
percentiles (from two flow events in January 2016) for each monitored sub-
catchment. Pie charts show the percentage landuse upstream of each
monitoring site. ................................................................................................ 81
Figure 25: Sandy Creek sub-catchment monitoring project sites, average oxidised
nitrogen (NOx) concentration percentiles (from two flow events in January
2016) for each monitored sub-catchment. Pie charts show the percentage land
use upstream of each monitoring site. ............................................................ 82
Figure 26: Locations of the Herbert Water Quality Monitoring Program monitoring sites
2011–2014. Shaded areas indicate National Parks within the catchment. ..... 85
Figure 27: A typical irrigation event (left) and typical flood event from major rainfall (right)
flowing past the monitoring station instream control feature (the elevated
RTWQM station platform is visible in right picture). ........................................ 89
Figure 28: A two month continuous data record of Nitrate-N concentration (mg/L) over
time at the monitoring site weir. Key nitrate spikes relating to on-farm
management activities are highlighted in red (details outlined below). ........... 91
Davis et al.
viii
ACRONYMS BRIA .............. Burdekin River Irrigation Area
CDOM ............ Colored Dissolved Organic Matter
COD ............... Chemical Oxygen Demand
CPA ............... Cane Producing Area
DAFF ............. Queensland Department of Agriculture Fisheries and Forestry
DEHP............. Department of Environment and Heritage Protection
DIN ................ Dissolved Inorganic Nitrogen
DNRM ............ Department of Natural Resources and Mines
DOE ............... Department of the Environment
DSITI ............. Queensland Department of Science, Information Technology and Innovation
DWC .............. Dry Weather Concentration
EC.................. Electrical Conductivity
ECSFDI ......... England Catchment Sensitive Farming Delivery Initiative
EMC ............... Event Mean Concentrations
FTE ................ Full Time Equivalent
GBR ............... Great Barrier Reef
GBRCA ......... Great Barrier Reef Catchment Area
GBRCLMP .... Great Barrier Reef Catchment Loads Monitoring Program
GBRWHA ...... Great Barrier Reef World Heritage Area
GIS ................ Geographic Information System
GM ................. Genetically Modified
GS ................. Gauging Station
HCPSL .......... Herbert Cane Productivity Services Limited
HSC ............... Hinchinbrook Shire Council
HWQMP ........ Herbert Water Quality Monitoring Program
IAWM ............. Integrated Area Wide Management
MAPS ............ Mackay Area Productivity Services
N .................... Nitrogen
NESP ............. National Environmental Science Programme
NIFA .............. National Institute of Food and Agriculture
NRCS ............ Natural Resources Conservation Service
NRM .............. Natural Resource Management
NTU ............... Nephelometric Turbidity Units
NVZ ............... Nitrate Vulnerable Zones
P2R ............... Paddock to Reef
QDAF ............ Queensland Department of Agriculture and Fisheries
RRRC ............ Reef and Rainforest Research Centre Limited
RTWQM ......... Real-time water quality monitoring
SRA ............... Sugar Research Australia
SRDC ............ Sugar Research and Development Corporation
TRC ............... Tablelands Regional Council
TSS................ Total Suspended Solids
TWQ .............. Tropical Water Quality
UV.................. Ultraviolet
WQIP ............. Water Quality Improvement Plan
Sub-catchment scale monitoring, modelling and extension design
ix
ACKNOWLEDGEMENTS The project team acknowledges the funding agencies for this project including the Australian
Government’s National Environmental Science Programme and the Department of
Environment and Heritage Protection (DEHP), with considerable in-kind support from the
Department of Science, Information Technology and Innovation (DSITI), Department of
Natural Resources and Mines (DNRM) and James Cook University.
We would like to acknowledge Tom McShane (BBIFMAC), Rob Milla (Burdekin Productivity
Services), Lawrence DiBella (Herbert Cane Productivity Services Pty Ltd), and Ryan Turner
(DISITI) for their valuable input on learnings from recent sub-catchment monitoring initiatives
in the Great Barrier Reef catchments. We also thank David Waters and Melanie Shaw
(DNRM) for their advice on strategies for integrating sub-catchment monitoring with paddock
and catchment scale modelling efforts, and the project guidance provided by John Bennett
(DEHP). David Thames (DEHP) is thanked for invaluable assistance with mapping and
spatial analysis.
Sub-catchment scale monitoring, modelling and extension design
1
EXECUTIVE SUMMARY The adjacent catchment area of the Great Barrier Reef World Heritage Area (GBRWHA)
contains 35 river basins, with numerous rivers discharging pollutants from agricultural, urban,
mining and industrial activity. Land-derived contaminants in riverine water discharged to the
marine environment have been identified as posing serious risks to the ecosystem health of
parts of the GBR. Dissolved inorganic nitrogen and photosystem II (PS-II) herbicide losses
from sugarcane cultivation have been specifically identified as a contributor to catchment
derived water quality issues for the GBR. Key management responses by the Australian and
Queensland Governments in the Great Barrier Reef Catchment Area (GBRCA) include end-
of-catchment load reduction targets for sediments, nutrients and pesticides, incentive-based
voluntary management initiatives for landholders for adoption of improved land management
practices, and paddock and catchment water quality monitoring and modelling initiatives to
both quantify and/or predict water quality improvements associated with specific
management change (i.e. Reef Water Quality Protection Plan 2009 or ‘Reef Plan’). The
most recent Reef Plan report card results suggest that while landholders have made major
progress in adopting improved land management practices across the Great Barrier Reef
catchment, pesticide and particularly nitrogen reduction trajectories fall well below desired
target reductions.
Recent GBR and global experiences increasingly recognise that despite its ‘diffuse’ nature,
non-point source pollution still often originates in ‘hotspots’ or ‘critical source areas’ from a
small portion of the landscape, areas which can be targeted for maximum intervention
efficiency. Global examples increasingly suggest that unfocused implementation of
catchment scale water quality remediation efforts that miss critical source areas of pollutants,
can provide minimal end-of-catchment water quality responses. Spatial targeting analyses –
which address the question of where scarce resources should be used to achieve natural
resource policy goals – are being increasingly advocated as a vital prioritisation mechanism
for water quality improvements in agricultural watersheds to meet ecological goals. Finer
scale water quality monitoring projects integrating farm up to small watershed-scale
monitoring-management frameworks (with a key emphasis on stakeholder collaboration and
participatory learning processes) linking with this philosophy are now key mechanisms for
achieving water quality improvements in several countries grappling with similar diffuse water
quality pollution issues to the GBRCA. Evidence-based outcomes of these programs (i.e.,
demonstrable water quality benefits from management action) do exist, but so do mixed
outcomes, as well as a range of emergent lessons. Due to issues of scale and monitoring
program objectives, much of the current long-term water quality monitoring in the GBRCA is ,
however, limited in its capacity to identify specific pollutant export ‘hotspots’, where more
targeted extension, incentive or regulation effort could be focussed.
This NESP project broadly outlines the monitoring framework for implementation of finer
scale water quality monitoring in pollutant generation hotspots in sugarcane growing
catchments in the Great Barrier Reef catchment area. It identifies existing hotspots
distinguished on the basis of existing monitoring-modelling work in sugarcane catchments of
the GBRCA, and options to spatially optimise sampling locations within these identified
hotspots. Specific water quality monitoring design options (instrumentation, data sets and
extension-communication strategies) to enable sub-catchment monitoring to support a range
Davis et al.
2
of future water quality monitoring-modelling, and industry extension and engagement
initiatives are also discussed. This monitoring program framework (based on National Water
Quality Management Strategy Guidelines) prescribes a standard water quality monitoring
program structure that can be applied in any sub-catchment in the GBRCA, and provides
some commentary on the practical constraints and design considerations for effective
implementation of these approaches.
Spatial prioritisation of regions-catchments in water quality program implementation A range of recent GBRCA initiatives were used in a hierarchical spatial prioritisation of
pollutant generation hotspots relating to GBR sugarcane cultivation. Recent qualitative and
semi-quantitative assessments associated with the Scientific Consensus Statement were
used to provide initial, regional scale identification of priority NRM regions in which to
implement ‘hot spot’ identification of pollutant sources. At this broader, ‘whole-of-GBR’
catchment area scale, prioritisation of catchment areas for management of specific pollutants
associated with the sugarcane industry identified:
• Nitrogen management is a priority intervention across the Wet Tropics region; and
• Photosystem II inhibiting herbicide management is a priority intervention in the Mackay-
Whitsunday and Burdekin (specifically lower Burdekin) regions.
Following this broader, cross-regional scale prioritisation of catchments and specific water
quality constituents for water quality intervention within these catchments, a range of
initiatives at the NRM regional level, particularly recently developed Water Quality
Improvement Plans (WQIPs), were synthesized to provide spatially explicit data on water
quality ‘hotspots’ at finer, catchment and sub-catchment scales. WQIP methodologies varied
slightly between NRM regions, however, these have identified the major water quality issues
and pollutants, geographical hotspots for pollutant generation, and priority areas for
improving the condition and function of these ecosystems within each NRM region. Once the
priority sub-catchments for water quality improvement within each NRM region have been
identified, specific sampling (monitoring) locations to meeting desired program objectives can
be further discriminated. Examples are provided of the utility of Geographic Information
Systems (GIS) approaches to spatially interrogate map layers and land tenure information
across prospective catchments to optimally locate a limited number of water quality
monitoring sites according to program objectives (i.e., site locations to either maximise or
minimise grower numbers per unit catchment area depending on intervention aims).
Monitoring program design This report highlights the rapidly evolving landscape for water quality monitoring
technologies, and the much greater range and potential applications of water sampling
methodologies. Due to the considerable inherent limitations of traditional discrete sample
collection techniques, many water monitoring programs have shifted towards continuous
measurements using in situ sensors. Recent advances in sensor technologies has greatly
expanded the suite of parameters that can be monitored in ‘real time’, including several (such
as inorganic nitrogen) that have direct relevance to GBRCA environment. Continuous real-
time water quality monitoring (RTWQM) is emerging as an attractive and effective water
quality monitoring approach, and is being increasingly employed for monitoring of both
surface and ground water across multiple spatial scales. From a purely scientific perspective,
the high resolution data observations of RTWQM has been increasingly utilised to provide
Sub-catchment scale monitoring, modelling and extension design
3
previously undocumented knowledge of contaminant trends and dynamics across a range of
spatial scales. RTWQM is also seen, however, as having significant potential to impact
management and control decisions in agricultural contexts, providing a solid basis for
farmers to adjust strategies at any time. If water quality information can be fed back to land
managers in real time, in an autonomous and dynamic manner, there is the potential to
control or minimise the fluxes emanating from a location. Pilot RTWQM deployment projects
already being undertaken in sugarcane districts within the GBRCA have indicated
considerable potential to provide locally relevant and timely information to drive farm practice
changes. While holding considerable potential, RTWQM is still not without its limitations with
regard to issues such as cost, relevant indicator monitoring capacity and additional data that
need to be considered in their implementation.
Maximising small sub-catchment water quality monitoring program value The monitoring design framework presented in this report also provides recommendations on
options for integrating program outcomes into broader, concurrent water quality monitoring
and modelling programs currently underway in the GBRCA. Monitoring that reports only
concentration data can highlight potential catchment hotspots for additional focus, and serve
as a useful communication and engagement tool with local canegrowers, but has limited
utility beyond these applications;
• A key theme emerging from both global and local GBRCA experiences (including
several ‘case studies’) is the considerable additional investment and monitoring effort
required to elevate ‘concentration only’ data collection to a level more applicable to
other water quality monitoring and modelling applications. The collection of additional
data to support concentration data, such as catchment hydrology (streamflow
discharge), requires substantial additional monitoring infrastructure and data collection
and processing. The broader data formats possible from this investment (pollutant
loads, EMCs etc.) are, however, amenable to a diverse range of potential uses such as
trend analyses, pollutant export coefficients, calibration of GBR Source Catchments
modelling platforms etc.
• Collective global and recent GBRCA experiences have identified quantification of on-
farm land use practices in monitored sub-catchments as critical to understanding
linkages between trends in environmental water quality and practice change by
landholders. If project objectives desire, however, to link water quality responses to
specific land treatment changes, on-farm practices and land treatment data must be
monitored as intensively as water quality, and at the same temporal and spatial scales.
Thorough documentation of the timing, rate, and placement of fertilizers and pesticides,
the current crop stages, and other management practices for every field in the
watershed can be even more challenging and resource intensive than water quality
monitoring itself.
• The desired objectives of any sub-catchment scale monitoring program needs to be
clearly understood. Hotspot monitoring in the context of the GBR sugarcane industry
will present many challenges due to climatic variability, as well as the nature of the
target pollutants involved. The dominance of soluble pollutants and groundwater as a
key loss pathway from paddocks poses challenges to any water quality monitoring
program in most GBR sugarcane districts. Any programs with the aim of documenting
Davis et al.
4
water quality trends in association with catchment practice change need to be
particularly aware of the significant data requirements, and the likely extended
timeframes required to detect genuine changes in water quality for several priority
pollutants. Recent global experiences suggest even significant reductions in inputs at a
catchment scale (i.e., fertiliser reductions) can be difficult to consistently detect in local
water quality trends.
• The appropriate mechanisms for industry engagement and ‘buy-in’ is an important
consideration, often overlooked in the design, implementation and communication of
water quality monitoring programs, particularly those aimed at driving behavioural-
practice change in agricultural sectors. Global, and more local experiences emerging
from programs that have achieved apparent practice change or water quality
improvements have stressed the critical importance of agronomic and technical advice
being delivered to involved farmers through high credibility and trusted local contacts
(i.e., key service providers and extension staff, or local peer farmers). Farmer-to-farmer
programs or use of dedicated water quality monitoring program extension agents have
been very effective in delivering conservation practice technical assistance to
encourage adoption of sediment, nutrient and pesticide management best practices.
Given the consistent concerns on the part of the GBRCA canegrowers regarding the
veracity of current catchment modelling-monitoring initiatives, this will be a critical
design consideration for any successful future water quality program delivery in the
GBRCA.
The framework provided in this documents presents a range of different ‘gold, silver and
bronze’ standard monitoring program designs to accommodate different program objectives,
desired levels of integration with other monitoring-modelling initiatives, local capacities and
levels of available investment. These different levels of program design need not be mutually
exclusive, however, and even the implementation of an optimal ‘gold standard’ program will
likely have to start modestly (bronze-silver level), and slowly evolve to a gold standard
through a carefully staged, adaptive approach. The knowledge gained in an iterative
approach to achieve an optimal, locally relevant monitoring design will likely be complex,
requiring a range of integrated initiatives such as; appropriate conceptualisation of the key
indicators; tracking of land management practices in the monitored catchments; spatial and
temporal loss dynamics; catchment hotspot verification and significant industry engagement-
extension effort. A considerable foundation of locally relevant data and capacity will be
required to ensure a water quality monitoring program design is optimally implemented.
Sub-catchment scale monitoring, modelling and extension design
5
1. INTRODUCTION
1.1 Background and context
The Great Barrier Reef (GBR) is a World Heritage Area containing extensive areas of coral
reef, seagrass meadows and fisheries resources. The adjacent GBR catchment area on the
Queensland coastline contains 35 river basins covering an area of approximately 423,144
km2 (Figure 1; Furnas 2003), and numerous rivers discharging pollutants from agricultural,
urban, mining and industrial activity. Land-derived contaminants in riverine water discharged
to the marine environment have been identified as posing serious risks to the ecosystem
health of parts of the GBR (Brodie et al., 2012). The three priority water quality pollutants
derived from anthropogenic land uses identified as posing the greatest threat to GBR
ecosystems are suspended sediment, dissolved inorganic nitrogen (DIN) and photosystem II
(PS-II) herbicides. The sources of these pollutants have been identified and include
suspended sediment from erosion in cattle grazing areas; nitrate from fertiliser application on
crop lands; and herbicides from various land uses (Brodie et al., 2013a, 2013b; Reef Water
Quality Protection Plan Secretariat, 2013).
The main policies for water quality management in the GBR are the joint Australian and
Queensland Government Reef Water Quality Protection Plan (Reef Plan) which was first
established in 2003 and updated in 2009 and 2013, and the recent Reef 2050 Long Term
Sustainability Plan (Reef 2050 Plan).
Key management responses by the Australian and Queensland Governments in the Great
Barrier Reef Catchment Area (GBRCA) include incentive-based voluntary management
initiatives for landholders for adoption of improved land management practices, regulation of
sugarcane and grazing management practices in priority areas, agricultural extension
programs, and paddock and catchment water quality monitoring and modelling initiatives to
both quantify and/or predict water quality improvements associated with specific
management change (Brodie et al., 2012; Carroll et al., 2012).
Davis et al.
6
Figure 1: The Great Barrier Reef catchment area, 35 catchment boundaries and Regional Natural
Resource Management Regions.
Sub-catchment scale monitoring, modelling and extension design
7
1.2 Current management goals
Management goals are defined by end-of-catchment load reduction targets for sediments,
nutrients and pesticides and land management targets outlined in the Reef Water Quality
Protection Plan (Reef Plan). Reef Plan 2013 sets targets designed to achieve the
overarching goal of ensuring that ‘by 2020 the quality of water entering the lagoon from broadscale land use has no detrimental impact on the health and resilience on the GBR’. The
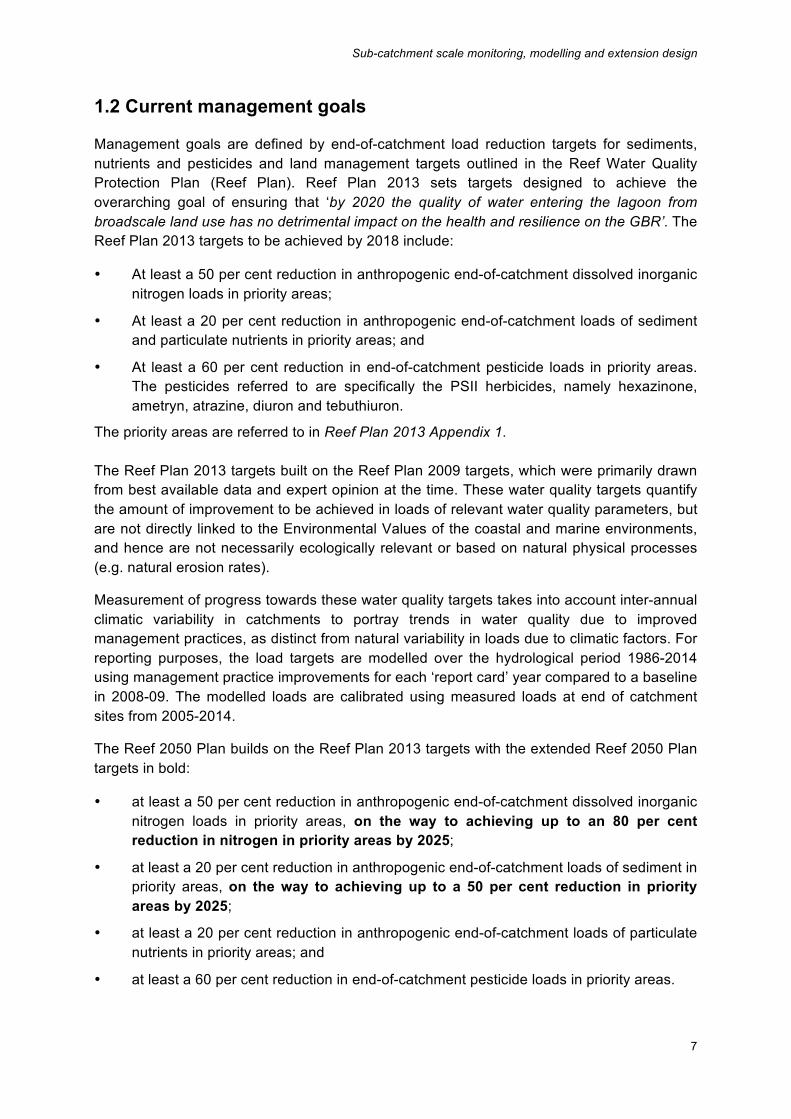
Reef Plan 2013 targets to be achieved by 2018 include:
• At least a 50 per cent reduction in anthropogenic end-of-catchment dissolved inorganic
nitrogen loads in priority areas;
• At least a 20 per cent reduction in anthropogenic end-of-catchment loads of sediment
and particulate nutrients in priority areas; and
• At least a 60 per cent reduction in end-of-catchment pesticide loads in priority areas.
The pesticides referred to are specifically the PSII herbicides, namely hexazinone,
ametryn, atrazine, diuron and tebuthiuron.
The priority areas are referred to in Reef Plan 2013 Appendix 1.
The Reef Plan 2013 targets built on the Reef Plan 2009 targets, which were primarily drawn
from best available data and expert opinion at the time. These water quality targets quantify
the amount of improvement to be achieved in loads of relevant water quality parameters, but
are not directly linked to the Environmental Values of the coastal and marine environments,
and hence are not necessarily ecologically relevant or based on natural physical processes
(e.g. natural erosion rates).
Measurement of progress towards these water quality targets takes into account inter-annual
climatic variability in catchments to portray trends in water quality due to improved
management practices, as distinct from natural variability in loads due to climatic factors. For
reporting purposes, the load targets are modelled over the hydrological period 1986-2014
using management practice improvements for each ‘report card’ year compared to a baseline
in 2008-09. The modelled loads are calibrated using measured loads at end of catchment
sites from 2005-2014.
The Reef 2050 Plan builds on the Reef Plan 2013 targets with the extended Reef 2050 Plan
targets in bold:
• at least a 50 per cent reduction in anthropogenic end-of-catchment dissolved inorganic
nitrogen loads in priority areas, on the way to achieving up to an 80 per cent reduction in nitrogen in priority areas by 2025;
• at least a 20 per cent reduction in anthropogenic end-of-catchment loads of sediment in
priority areas, on the way to achieving up to a 50 per cent reduction in priority areas by 2025;
• at least a 20 per cent reduction in anthropogenic end-of-catchment loads of particulate
nutrients in priority areas; and
• at least a 60 per cent reduction in end-of-catchment pesticide loads in priority areas.
Davis et al.
8
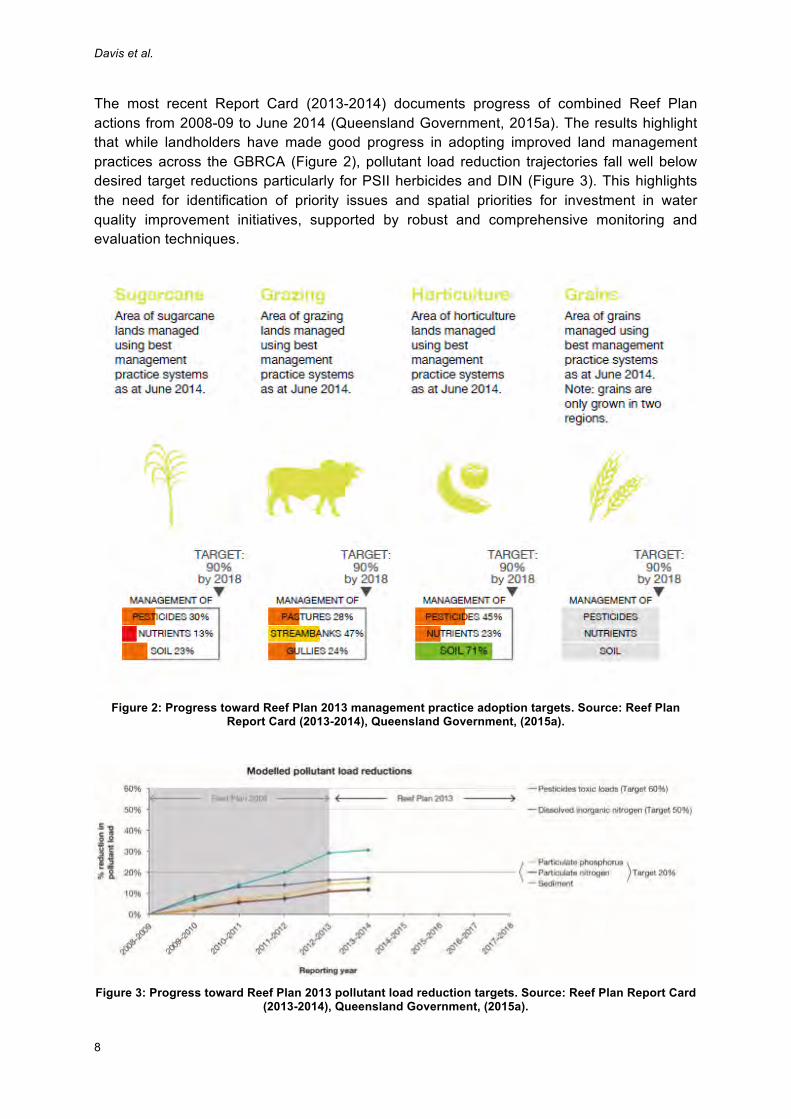
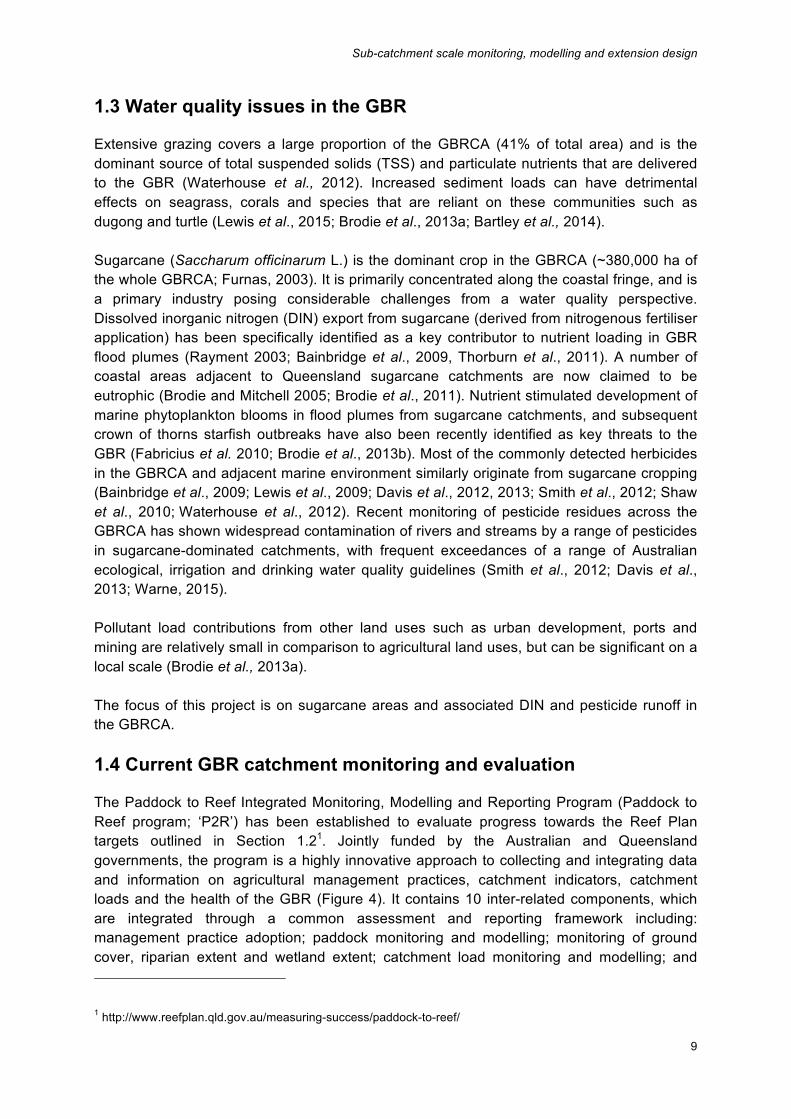
The most recent Report Card (2013-2014) documents progress of combined Reef Plan
actions from 2008-09 to June 2014 (Queensland Government, 2015a). The results highlight
that while landholders have made good progress in adopting improved land management
practices across the GBRCA (Figure 2), pollutant load reduction trajectories fall well below
desired target reductions particularly for PSII herbicides and DIN (Figure 3). This highlights
the need for identification of priority issues and spatial priorities for investment in water
quality improvement initiatives, supported by robust and comprehensive monitoring and
evaluation techniques.
Figure 2: Progress toward Reef Plan 2013 management practice adoption targets. Source: Reef Plan Report Card (2013-2014), Queensland Government, (2015a).
Figure 3: Progress toward Reef Plan 2013 pollutant load reduction targets. Source: Reef Plan Report Card (2013-2014), Queensland Government, (2015a).
Sub-catchment scale monitoring, modelling and extension design
9
1.3 Water quality issues in the GBR
Extensive grazing covers a large proportion of the GBRCA (41% of total area) and is the
dominant source of total suspended solids (TSS) and particulate nutrients that are delivered
to the GBR (Waterhouse et al., 2012). Increased sediment loads can have detrimental
effects on seagrass, corals and species that are reliant on these communities such as
dugong and turtle (Lewis et al., 2015; Brodie et al., 2013a; Bartley et al., 2014).
Sugarcane (Saccharum officinarum L.) is the dominant crop in the GBRCA (~380,000 ha of
the whole GBRCA; Furnas, 2003). It is primarily concentrated along the coastal fringe, and is
a primary industry posing considerable challenges from a water quality perspective.
Dissolved inorganic nitrogen (DIN) export from sugarcane (derived from nitrogenous fertiliser
application) has been specifically identified as a key contributor to nutrient loading in GBR
flood plumes (Rayment 2003; Bainbridge et al., 2009, Thorburn et al., 2011). A number of
coastal areas adjacent to Queensland sugarcane catchments are now claimed to be
eutrophic (Brodie and Mitchell 2005; Brodie et al., 2011). Nutrient stimulated development of
marine phytoplankton blooms in flood plumes from sugarcane catchments, and subsequent
crown of thorns starfish outbreaks have also been recently identified as key threats to the
GBR (Fabricius et al. 2010; Brodie et al., 2013b). Most of the commonly detected herbicides
in the GBRCA and adjacent marine environment similarly originate from sugarcane cropping
(Bainbridge et al., 2009; Lewis et al., 2009; Davis et al., 2012, 2013; Smith et al., 2012; Shaw
et al., 2010; Waterhouse et al., 2012). Recent monitoring of pesticide residues across the
GBRCA has shown widespread contamination of rivers and streams by a range of pesticides
in sugarcane-dominated catchments, with frequent exceedances of a range of Australian
ecological, irrigation and drinking water quality guidelines (Smith et al., 2012; Davis et al., 2013; Warne, 2015).
Pollutant load contributions from other land uses such as urban development, ports and
mining are relatively small in comparison to agricultural land uses, but can be significant on a
local scale (Brodie et al., 2013a).
The focus of this project is on sugarcane areas and associated DIN and pesticide runoff in
the GBRCA.
1.4 Current GBR catchment monitoring and evaluation
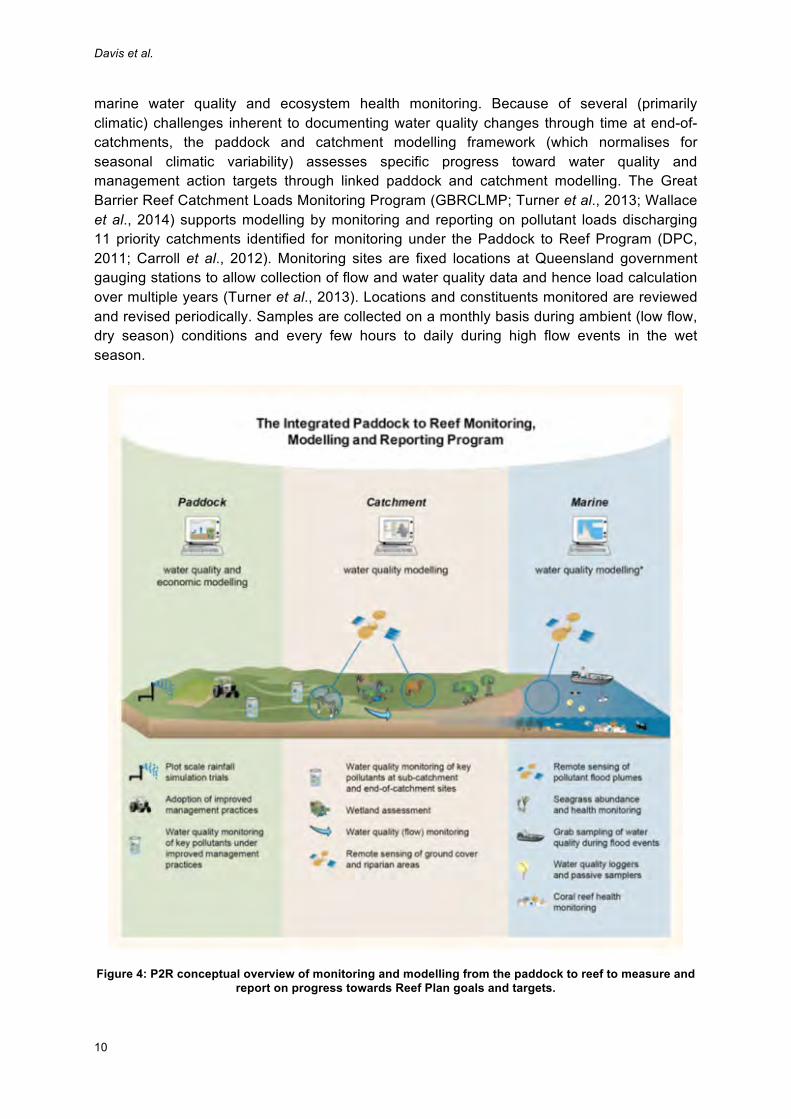
The Paddock to Reef Integrated Monitoring, Modelling and Reporting Program (Paddock to
Reef program; ‘P2R’) has been established to evaluate progress towards the Reef Plan
targets outlined in Section 1.21. Jointly funded by the Australian and Queensland
governments, the program is a highly innovative approach to collecting and integrating data
and information on agricultural management practices, catchment indicators, catchment
loads and the health of the GBR (Figure 4). It contains 10 inter-related components, which
are integrated through a common assessment and reporting framework including:
management practice adoption; paddock monitoring and modelling; monitoring of ground
cover, riparian extent and wetland extent; catchment load monitoring and modelling; and
1 http://www.reefplan.qld.gov.au/measuring-success/paddock-to-reef/
Davis et al.
10
marine water quality and ecosystem health monitoring. Because of several (primarily
climatic) challenges inherent to documenting water quality changes through time at end-of-
catchments, the paddock and catchment modelling framework (which normalises for
seasonal climatic variability) assesses specific progress toward water quality and
management action targets through linked paddock and catchment modelling. The Great
Barrier Reef Catchment Loads Monitoring Program (GBRCLMP; Turner et al., 2013; Wallace
et al., 2014) supports modelling by monitoring and reporting on pollutant loads discharging
11 priority catchments identified for monitoring under the Paddock to Reef Program (DPC,
2011; Carroll et al., 2012). Monitoring sites are fixed locations at Queensland government
gauging stations to allow collection of flow and water quality data and hence load calculation
over multiple years (Turner et al., 2013). Locations and constituents monitored are reviewed
and revised periodically. Samples are collected on a monthly basis during ambient (low flow,
dry season) conditions and every few hours to daily during high flow events in the wet
season.
Figure 4: P2R conceptual overview of monitoring and modelling from the paddock to reef to measure and report on progress towards Reef Plan goals and targets.
Sub-catchment scale monitoring, modelling and extension design
11
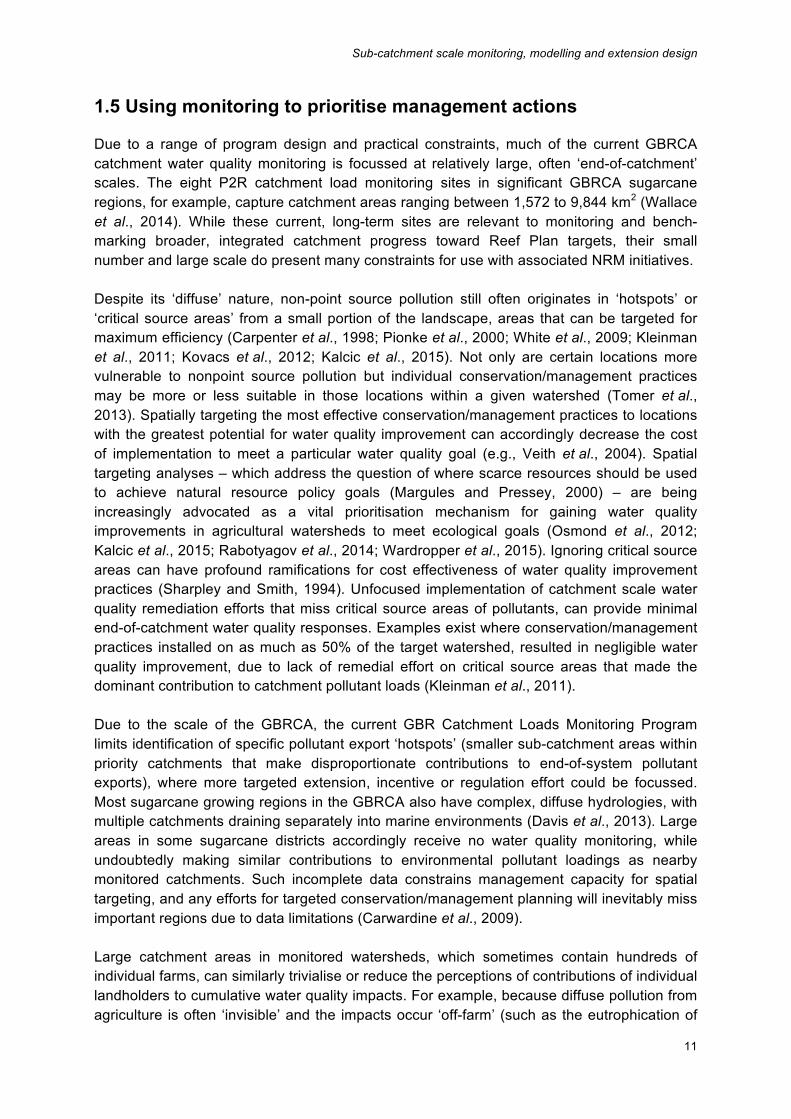
1.5 Using monitoring to prioritise management actions
Due to a range of program design and practical constraints, much of the current GBRCA
catchment water quality monitoring is focussed at relatively large, often ‘end-of-catchment’
scales. The eight P2R catchment load monitoring sites in significant GBRCA sugarcane
regions, for example, capture catchment areas ranging between 1,572 to 9,844 km2 (Wallace
et al., 2014). While these current, long-term sites are relevant to monitoring and bench-
marking broader, integrated catchment progress toward Reef Plan targets, their small
number and large scale do present many constraints for use with associated NRM initiatives.
Despite its ‘diffuse’ nature, non-point source pollution still often originates in ‘hotspots’ or
‘critical source areas’ from a small portion of the landscape, areas that can be targeted for
maximum efficiency (Carpenter et al., 1998; Pionke et al., 2000; White et al., 2009; Kleinman
et al., 2011; Kovacs et al., 2012; Kalcic et al., 2015). Not only are certain locations more
vulnerable to nonpoint source pollution but individual conservation/management practices
may be more or less suitable in those locations within a given watershed (Tomer et al., 2013). Spatially targeting the most effective conservation/management practices to locations
with the greatest potential for water quality improvement can accordingly decrease the cost
of implementation to meet a particular water quality goal (e.g., Veith et al., 2004). Spatial
targeting analyses – which address the question of where scarce resources should be used
to achieve natural resource policy goals (Margules and Pressey, 2000) – are being
increasingly advocated as a vital prioritisation mechanism for gaining water quality
improvements in agricultural watersheds to meet ecological goals (Osmond et al., 2012;
Kalcic et al., 2015; Rabotyagov et al., 2014; Wardropper et al., 2015). Ignoring critical source
areas can have profound ramifications for cost effectiveness of water quality improvement
practices (Sharpley and Smith, 1994). Unfocused implementation of catchment scale water
quality remediation efforts that miss critical source areas of pollutants, can provide minimal
end-of-catchment water quality responses. Examples exist where conservation/management
practices installed on as much as 50% of the target watershed, resulted in negligible water
quality improvement, due to lack of remedial effort on critical source areas that made the
dominant contribution to catchment pollutant loads (Kleinman et al., 2011).
Due to the scale of the GBRCA, the current GBR Catchment Loads Monitoring Program
limits identification of specific pollutant export ‘hotspots’ (smaller sub-catchment areas within
priority catchments that make disproportionate contributions to end-of-system pollutant
exports), where more targeted extension, incentive or regulation effort could be focussed.
Most sugarcane growing regions in the GBRCA also have complex, diffuse hydrologies, with
multiple catchments draining separately into marine environments (Davis et al., 2013). Large
areas in some sugarcane districts accordingly receive no water quality monitoring, while
undoubtedly making similar contributions to environmental pollutant loadings as nearby
monitored catchments. Such incomplete data constrains management capacity for spatial
targeting, and any efforts for targeted conservation/management planning will inevitably miss
important regions due to data limitations (Carwardine et al., 2009).
Large catchment areas in monitored watersheds, which sometimes contain hundreds of
individual farms, can similarly trivialise or reduce the perceptions of contributions of individual
landholders to cumulative water quality impacts. For example, because diffuse pollution from
agriculture is often ‘invisible’ and the impacts occur ‘off-farm’ (such as the eutrophication of
Davis et al.
12
estuaries from excessive nitrogen leaching); it has proved difficult to communicate the
rationale for implementation of European nutrient regulation policies (Blackstock et al., 2010).
Existing monitoring such as the P2R program does not provide the “input/output” analysis to
prove to farmers in specific sub-catchments what is happening to their inputs of fertilisers
and pesticides, and does not occur at the time and spatial scale that can influence farmers’
behaviour. Nor does the P2R program have an explicit or coordinated extension strategy
(instead having a predominantly monitoring/modelling/reporting focus).
Similar water quality issues (nutrient enrichment, sedimentation, pesticide contamination) to
those facing the GBR are evident globally, and a range of management response
experiences can be drawn upon. Frameworks for effective water quality improvement
environmental policy in agricultural catchments are complex regardless of location, as they
deal simultaneously with environmental, economic, and social concerns and the varying
interests of different stakeholders. Finer scale monitoring projects integrating farm up to
small watershed monitoring-management frameworks (with a key emphasis on stakeholder
collaboration and participatory learning processes) are now key mechanisms for achieving
water quality improvements in several countries. These include Nitrate Vulnerable Zones
(NVZs) and the England Catchment Sensitive Farming Delivery Initiative (ECSFDI) in Europe
(Kay et al., 2012), the USA Discovery Farm Program (Stuntebeck et al., 2011, Sharpley et al., 2015 and http://www.uwdiscoveryfarms.org/Home.aspx), and the National Institute of
Food and Agriculture (NIFA) and the Natural Resources Conservation Service (NRCS)
funded small watershed-scale agricultural monitoring frameworks (Conservation Effects
Assessment Project; CEAP) implemented across multiple US states (Osmond et al., 2012).
Evidence-based outcomes of these programs (i.e., demonstrable water quality benefits from
management action) do exist, but so do failures and/or uncertain benefits, as well as a range
of emergent lessons (Osmond et al., 2012; Kay et al., 2012).
More localised experiences in the application of smaller scale, sub-catchment collaborative
monitoring frameworks in achieving water quality improvement outcomes has been
demonstrated in the Australian-Queensland cotton industry, which grappled with similar
water quality issues to the GBRCA in the 1990’s (Kennedy et al., 2013), particularly the
losses of pesticides. Substantial improvements in catchment water quality have emerged
through time, although issues such as variable effects of precipitation patterns on pest
pressures, the advent of genetically modified (GM) cropping systems (which changed
pesticide usage behaviours significantly) also played pivotal roles (Kennedy et al., 2013).
Significant improvements to water quality losses from farms were, however, achieved at least
in part through smaller, sub-catchment, spatially focussed monitoring of water quality, grower
data collections and integrated approaches between farmers, industry support/extension staff
and government (Wolfenden and Evans, 2007; Kennedy et al., 2013).
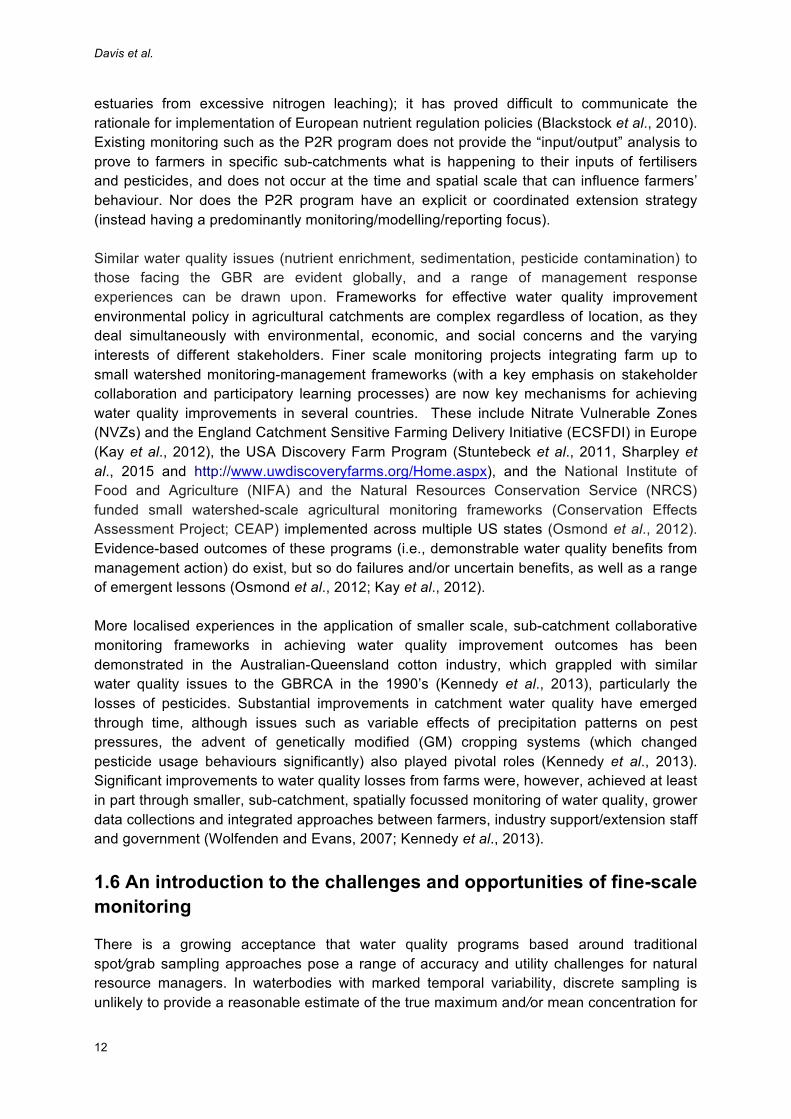
1.6 An introduction to the challenges and opportunities of fine-scale monitoring
There is a growing acceptance that water quality programs based around traditional
spot/grab sampling approaches pose a range of accuracy and utility challenges for natural
resource managers. In waterbodies with marked temporal variability, discrete sampling is
unlikely to provide a reasonable estimate of the true maximum and/or mean concentration for
Sub-catchment scale monitoring, modelling and extension design
13
a particular physicochemical variable. This variability is only likely to be detected through
relatively high-frequency continuous measurements (O’Flynn et al., 2010; Outram et al., 2014). The potential for using real-time water quality monitoring (RTWQM) information is
becoming increasingly possible for many water quality variables because of improvements in
sensor, data recording and communication technologies in recent years. Innovative
monitoring approaches to allow for continuous and immediate water-quality information
available in real-time are increasingly being tested for incorporation into formal water quality
monitoring programs (http://waterwatch.usgs.gov/wqwatch/about, O’Flynn et al., 2010;
Outram et al., 2014). Additionally, increased data-collection frequency provides an improved
understanding of factors that affect water quality for catchment stakeholders, and improves
knowledge and understanding of relations between water quality and changes in hydrology,
geology, and land use and management. The use of expanded RTWQM is accordingly also
suggested to have considerable potential as a natural resource management extension and
communication tool. By providing immediate feedback to landholders of land
use/management-water quality interactions, this information provides scope for landholders
to flexibly adjust on-farm practices (Zia et al., 2013).
However, some challenges still exist with these new technologies. While many systems and
sensor array have been developed in the laboratory, they may or may not have been fully
validated in the field. Also, long-term field deployment of multi-sensor systems poses many
challenges, and limited examples of long-term operational deployments exist. This topic will
be reviewed in section 3.2 of this report. 1.7 Project outline
The concept of spatially targeted monitoring and associated extension programs are yet to
be broadly applied in the GBR catchment context. For various design and logistical reasons,
existing GBRCA monitoring lacks the requisite focus for spatially targeting management
focus, does not occur at the time and spatial scale that can influence farmers’ behaviour, and
often lacks any explicit or coordinated extension strategy (instead having a predominantly
monitoring/modelling focus).
This NESP project outlines the process for the design and implementation of a sub-
catchment scale monitoring, modelling and extension program focussed on the GBRCA
sugar industry. It is based on the nationally agreed monitoring-process framework, end-user
workshops, existing risk assessments, monitoring and modelling programs, and a series of
case-study/pilot implementations to test the design and identify refinements resulting from
the pilot study findings to improve the final design. The ultimate objective is to provide a
broad template for subsequent design and implementation (with industry support) of sub-
catchment water quality monitoring programs, based on identified reef pollutant
“spikes/hotspots”, to help reach local agreement of their causes, and the necessary
responses and extension support to improve management.
This project provides guidance for the development of a monitoring program design based on
a framework that can be applied in any sub-catchment in the GBRCA, and provides
commentary on the practical constraints and design considerations for effective
implementation of these approaches.
Davis et al.
14
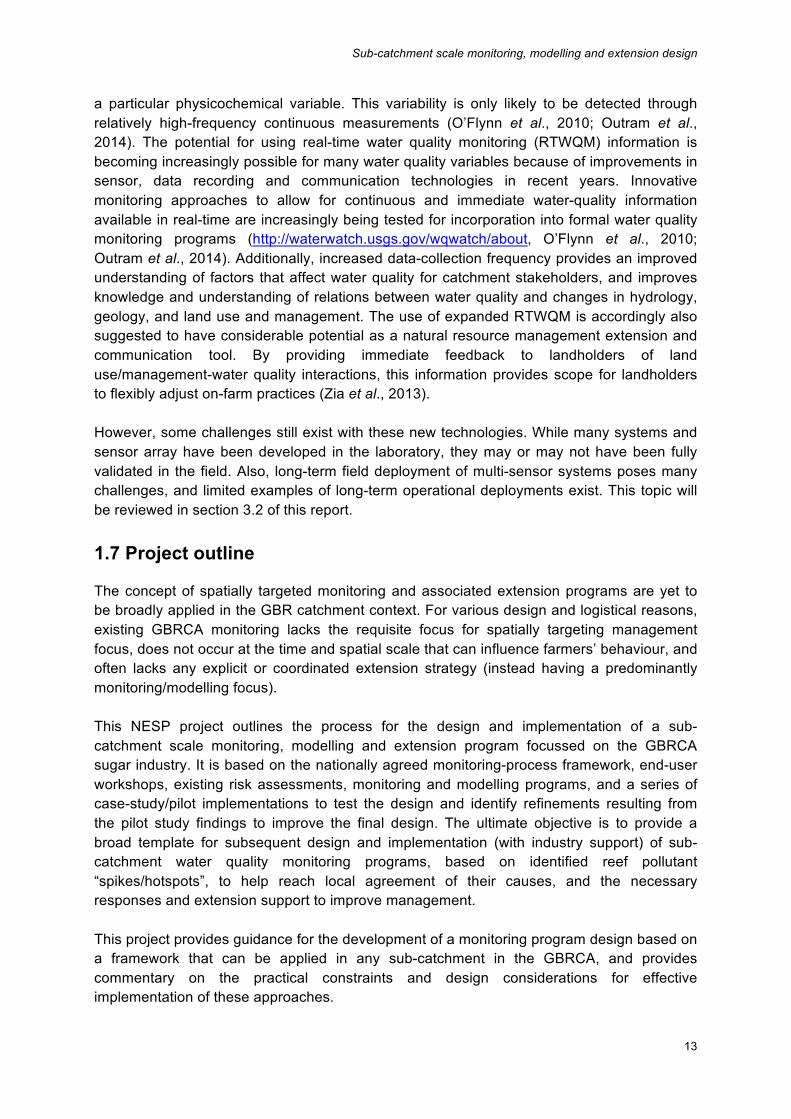
2. MONITORING PROGRAM DESIGN This section presents a theoretical framework for the practical design and implementation of
a monitoring program, which is then applied in the context of sub-catchment scale monitoring
in the GBRCA in Section 3. There are many components that need to be included in a
comprehensive yet practical monitoring network: a holistic appraisal of the monitoring
objectives, representative sampling locations, suitable sampling frequencies, water quality
variable selection, and budgetary and logistical constraints are examples. Effective water
quality investigations should systematically collect physical, chemical or biological
information, and analyse, interpret and report those measurements, all according to a
carefully pre-planned design which follows a basic structure. While there is no universally
accepted methodology for the design of water quality monitoring networks, and monitoring
approaches being employed in watershed management vary greatly (Strobl and Robillard,
2008), there are many frameworks to guide monitoring design. In the Australian context, this
includes the National Water Quality Management Strategy (NWQMS): Australian Guidelines
for Monitoring and Reporting document (ANZECC and ARMCANZ, 2000). This sets out a
standard water quality monitoring framework structure for the design and implementation of a
monitoring program (see Figure 5), which will serve as a broad, guiding template for this
project. The NWQMS chapters sequentially guide the monitoring team through a series of
stages to ultimately design a coordinated and informed monitoring program to achieve its
specific objectives. These chapters include;
• definition of information requirements and underlying objectives for the monitoring
program;
• design of the study, including its type, scale, measurement parameters, sampling
programs, and preferred methods for sampling including preferred methods for
laboratory and field analysis;
• quality assurance and quality control procedures and any occupational health and
safety concerns;
• statistical analysis and interpretation of the data; and
• data and information reporting, dissemination and communication strategies to
various audiences, and collation of feedback.
Each of these stages of the monitoring framework design (Figure 5) has it’s own detailed flow
chart and conceptual underpinning, which is further explored in the NWQMS document
(ANZECC and ARMCANZ, 2000). The monitoring framework presented in this document
follows this same structure, with specific sections dedicated to each of the NWQMS chapters
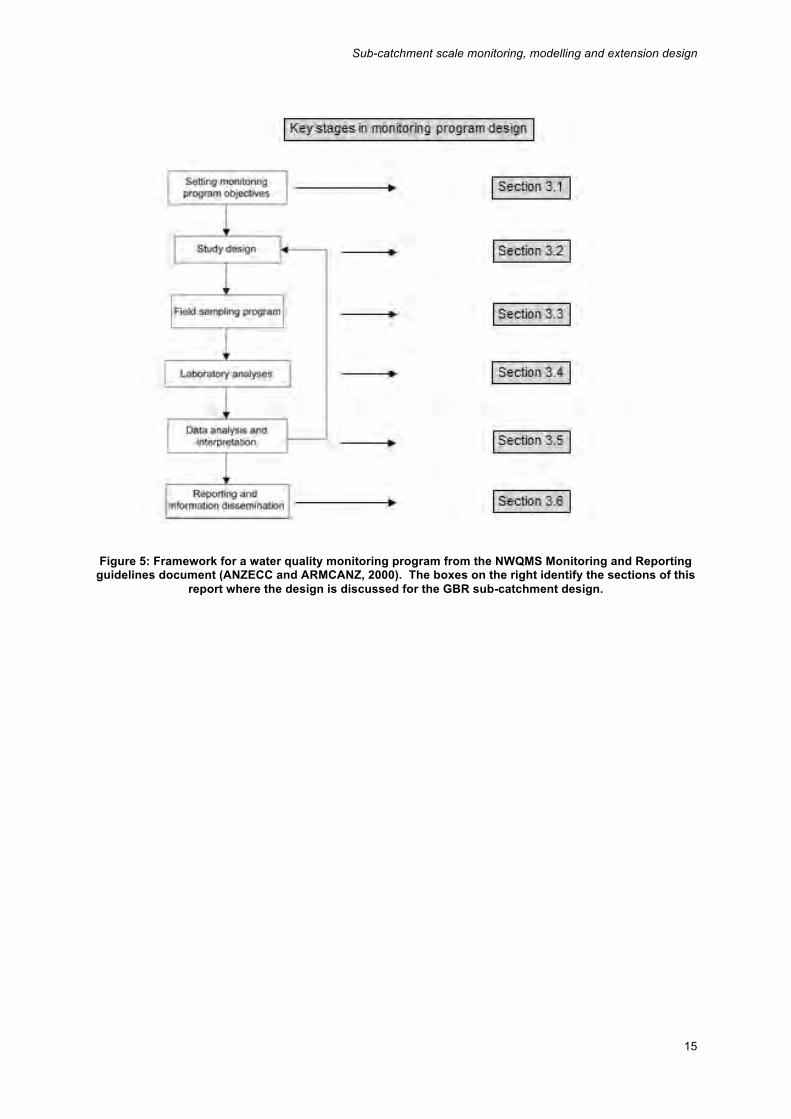
(Figure 5). An important aspect of any monitoring program design is its development as an
iterative (adaptive) process, as indicated in Figure 5, whereby earlier components in the
structure should be refined on the basis of relevant findings in later stages.
Sub-catchment scale monitoring, modelling and extension design
15
Figure 5: Framework for a water quality monitoring program from the NWQMS Monitoring and Reporting guidelines document (ANZECC and ARMCANZ, 2000). The boxes on the right identify the sections of this
report where the design is discussed for the GBR sub-catchment design.
Davis et al.
16
2.1 Setting Monitoring Program Objectives
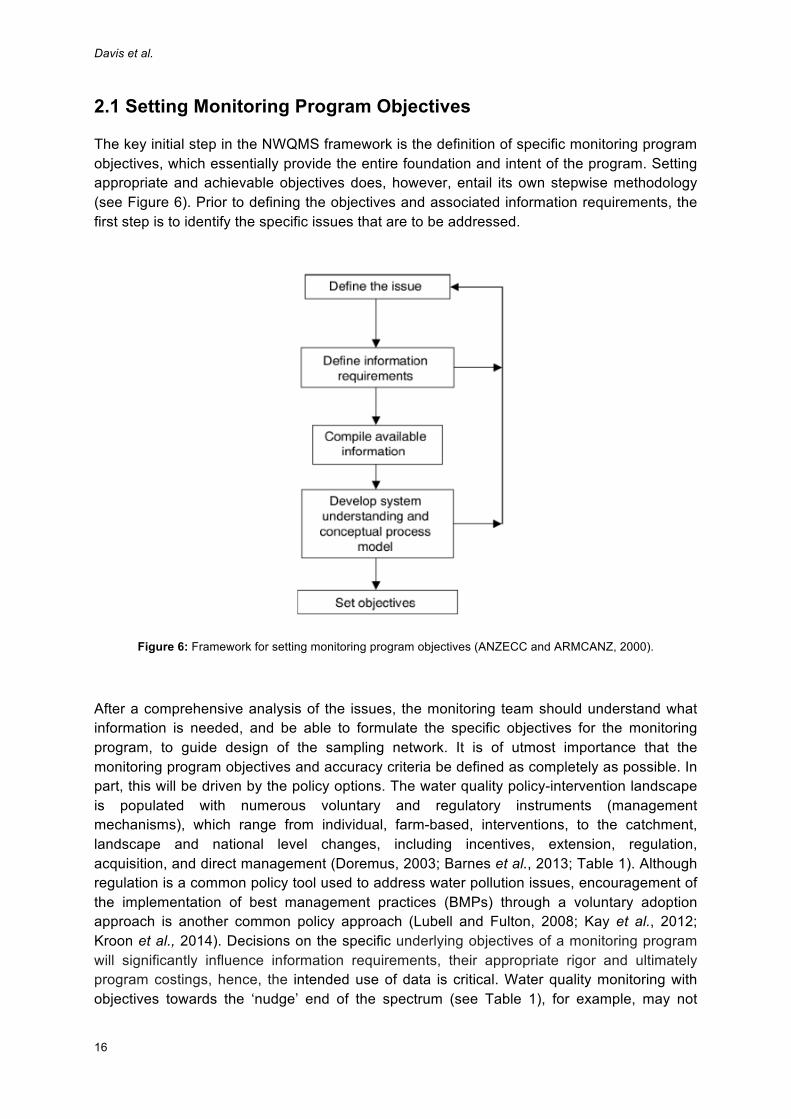
The key initial step in the NWQMS framework is the definition of specific monitoring program
objectives, which essentially provide the entire foundation and intent of the program. Setting
appropriate and achievable objectives does, however, entail its own stepwise methodology
(see Figure 6). Prior to defining the objectives and associated information requirements, the
first step is to identify the specific issues that are to be addressed.
Figure 6: Framework for setting monitoring program objectives (ANZECC and ARMCANZ, 2000).
After a comprehensive analysis of the issues, the monitoring team should understand what
information is needed, and be able to formulate the specific objectives for the monitoring
program, to guide design of the sampling network. It is of utmost importance that the
monitoring program objectives and accuracy criteria be defined as completely as possible. In
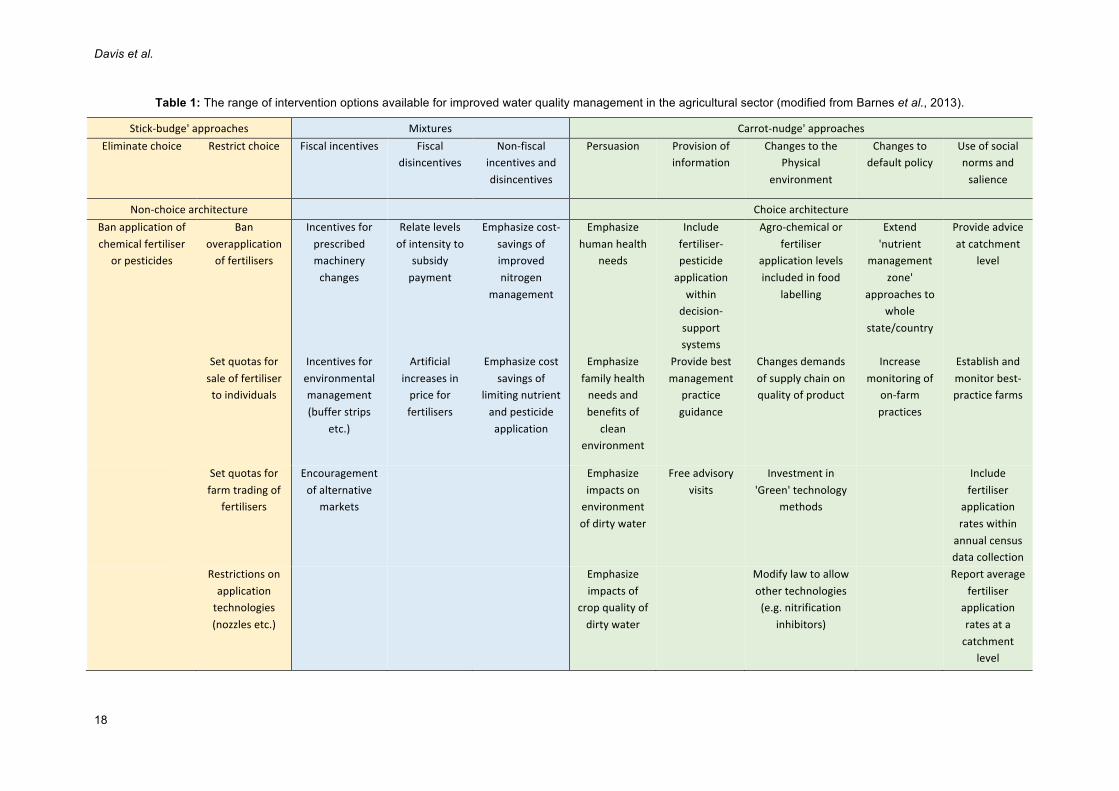
part, this will be driven by the policy options. The water quality policy-intervention landscape
is populated with numerous voluntary and regulatory instruments (management
mechanisms), which range from individual, farm-based, interventions, to the catchment,
landscape and national level changes, including incentives, extension, regulation,
acquisition, and direct management (Doremus, 2003; Barnes et al., 2013; Table 1). Although
regulation is a common policy tool used to address water pollution issues, encouragement of
the implementation of best management practices (BMPs) through a voluntary adoption
approach is another common policy approach (Lubell and Fulton, 2008; Kay et al., 2012;
Kroon et al., 2014). Decisions on the specific underlying objectives of a monitoring program
will significantly influence information requirements, their appropriate rigor and ultimately
program costings, hence, the intended use of data is critical. Water quality monitoring with
objectives towards the ‘nudge’ end of the spectrum (see Table 1), for example, may not

Sub-catchment scale monitoring, modelling and extension design
17
require the level of data collection intensity during monitoring compared to programs with
more regulatory (‘stick-budge’) connotations. Similarly, a program with the objective of
documenting long-term improvements in water quality will require much greater investment in
data collection and analysis. The inevitable residual uncertainty in water quality monitoring
data is notorious for allowing stakeholders to contest the use of monitoring in decision
making (Biber, 2013).
Davis et al.
18
Table 1: The range of intervention options available for improved water quality management in the agricultural sector (modified from Barnes et al., 2013).
Stick-budge'approaches Mixtures Carrot-nudge'approachesEliminatechoice Restrictchoice Fiscalincentives Fiscal
disincentivesNon-fiscal
incentivesanddisincentives
Persuasion Provisionofinformation
ChangestothePhysical
environment
Changestodefaultpolicy
Useofsocialnormsandsalience
Non-choicearchitecture ChoicearchitectureBanapplicationofchemicalfertiliser
orpesticides
Banoverapplicationoffertilisers
Incentivesforprescribedmachinerychanges
Relatelevelsofintensityto
subsidypayment
Emphasizecost-savingsofimprovednitrogen
management
Emphasizehumanhealth
needs
Includefertiliser-pesticideapplicationwithin
decision-supportsystems
Agro-chemicalorfertiliser
applicationlevelsincludedinfood
labelling
Extend'nutrient
managementzone'
approachestowhole
state/country
Provideadviceatcatchment
level
Setquotasforsaleoffertilisertoindividuals
Incentivesforenvironmentalmanagement(bufferstrips
etc.)
Artificialincreasesinpriceforfertilisers
Emphasizecostsavingsof
limitingnutrientandpesticideapplication
Emphasizefamilyhealthneedsandbenefitsof
cleanenvironment
Providebestmanagement
practiceguidance
Changesdemandsofsupplychainonqualityofproduct
Increasemonitoringof
on-farmpractices
Establishandmonitorbest-practicefarms
Setquotasforfarmtradingof
fertilisers
Encouragementofalternative
markets
Emphasizeimpactsonenvironmentofdirtywater
Freeadvisoryvisits
Investmentin'Green'technology
methods
Includefertiliser
applicationrateswithinannualcensusdatacollection
Restrictionsonapplicationtechnologies(nozzlesetc.)
Emphasizeimpactsof
cropqualityofdirtywater
Modifylawtoallowothertechnologies(e.g.nitrification
inhibitors)
Reportaveragefertiliser
applicationratesatacatchment
level
Sub-catchment scale monitoring, modelling and extension design
19
Conceptual models, compiled on the basis of existing information, are a key element in development of environmental water quality monitoring program objectives (ANZECC and ARMCANZ, 2000). They integrate current understanding of system dynamics, identify important processes and indicators, facilitate communication of complex interactions, and illustrate connections between indicators and ecological states or processes. They can also show pressure-state/stressor-ecological response and facilitate discussion about management response for the pressures. Well-constructed conceptual models provide both a scientific framework for the monitoring program, and also justification for the choice of objectives and indicators. Multiple, and hierarchical conceptual models are often required to fully encapsulate program design and methodology; from broader models defining the ‘why’ questions providing the underlying basis for the study, through to more mechanistic, process-based models defining the key processes and linkages-drivers of water quality in the study system.
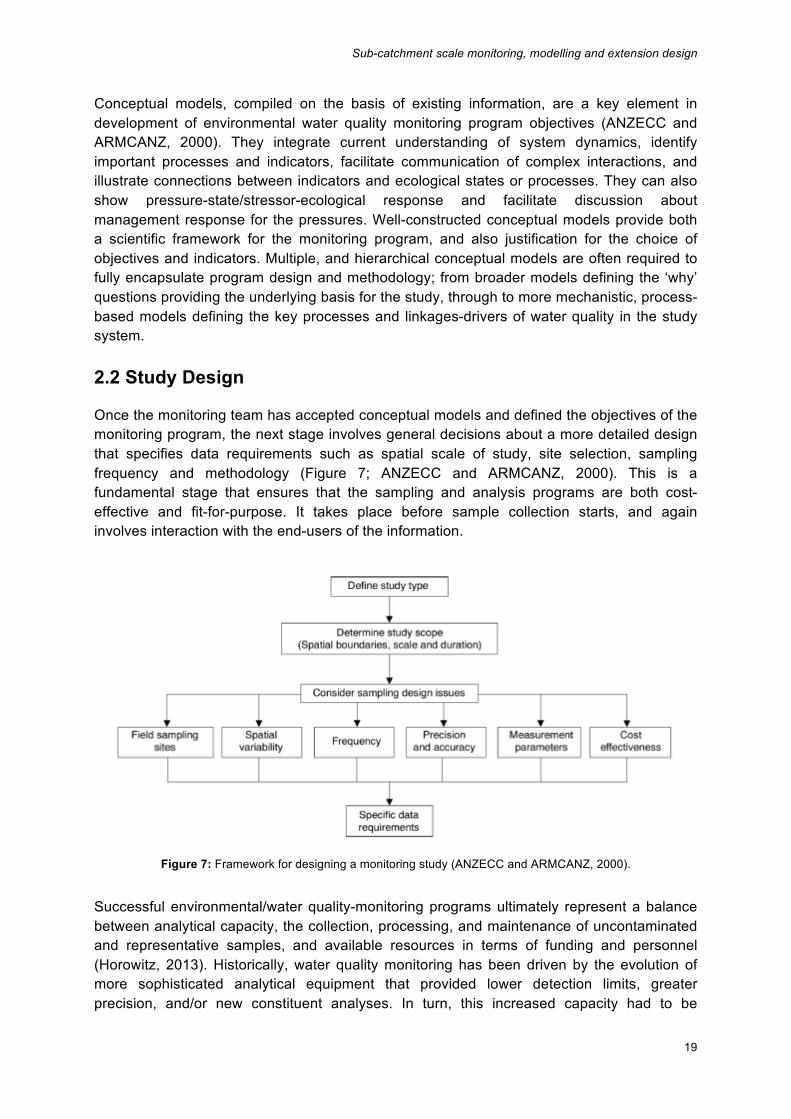
2.2 Study Design
Once the monitoring team has accepted conceptual models and defined the objectives of the monitoring program, the next stage involves general decisions about a more detailed design that specifies data requirements such as spatial scale of study, site selection, sampling frequency and methodology (Figure 7; ANZECC and ARMCANZ, 2000). This is a fundamental stage that ensures that the sampling and analysis programs are both cost-effective and fit-for-purpose. It takes place before sample collection starts, and again involves interaction with the end-users of the information.
Figure 7: Framework for designing a monitoring study (ANZECC and ARMCANZ, 2000).
Successful environmental/water quality-monitoring programs ultimately represent a balance between analytical capacity, the collection, processing, and maintenance of uncontaminated and representative samples, and available resources in terms of funding and personnel (Horowitz, 2013). Historically, water quality monitoring has been driven by the evolution of more sophisticated analytical equipment that provided lower detection limits, greater precision, and/or new constituent analyses. In turn, this increased capacity had to be
Davis et al.
20
balanced against the limitations of field personnel to collect uncontaminated/representative samples. With the diversity of physical, chemical, ecotoxicological and ecological measurement parameters that can be used to provide information on water quality, the selection of measurement parameters is obviously a vital element of the monitoring program design. The specific parameters relevant to this proposed program have already been defined to a large extent (i.e., dissolved inorganic nitrogen, herbicides), and are a well-established component of many monitoring programs both in the GBR and further abroad. Consideration of the measurement-sampling approaches and timing or frequency of data collection are, however, a more complex or challenging aspect of sampling program design. Recent advances in water quality sampling technology relevant to nutrients and pesticides provide much greater flexibility in implementing methods to meet program objectives than have been historically available.
2.3 Field Sampling Program
The previous study design phase, broadly specifies the measurement parameters that are needed for satisfying the monitoring program objectives. Once the basic outline of a sampling program has been settled, the next stage is the implementation of this design in the field. First, the monitoring team defines the indicators that are to be monitored. Then it considers the specific data requirements — measurement parameters, scale and frequency of sampling, accuracy and precision required — and decides whether to measure the parameters in the field or the laboratory. Costs must be planned so that they fall within the agreed budget, remembering the trade-off between maximum statistical power and cost of sampling and analysis (ANZECC and ARMCANZ, 2000). A quality assurance and quality control (QA/QC) program for field sampling is intended to control sampling errors at levels acceptable to the data user. Thus it includes procedures designed to prevent, detect and correct problems in the sampling process and to characterise errors statistically, through quality control samples. Major errors to be avoided are faulty operation of the sampling device, changes in the sample before measurement (contamination, chemical or biological changes), and incorrect sample labelling. Field staff should be competent in sampling and making field measurements even though they may also have qualities, such as vehicle handling or bush skills, unrelated to the assurance of sample integrity. Before sampling staff are permitted to do reportable work, they should demonstrate competence in field procedures. As a minimum this would include being able to adhere to protocols, being able to avoid contaminating samples, and being able to calibrate field instruments and make field observations (ANZECC and ARMCANZ, 2000). All equipment and field instruments should be kept clean and in good working order, and calibrations and preventative maintenance should be recorded carefully. All repairs to equipment and instruments should be noted, as well as any incidents that could affect the reliability of the equipment. When automatic sampling devices are used, their timing mechanisms must be calibrated to ensure that the samples are acquired at the specified
Sub-catchment scale monitoring, modelling and extension design
21
intervals. This is especially important where hydrological or other conditions result in significant short-term concentration variations. 2.4 Laboratory Analysis
The selection of an analytical method for waters, sediments or biota will largely depend on the information and management needs of those undertaking the investigation, and on the analytes themselves. However, limitations such as the financial resources available, laboratory resources, speed of analyses required, matrix type and contamination potential, are also important factors. The choice of an appropriate analytical method is based on four considerations:
• the range of concentrations of the analyte that need to be determined. Detection limits are method specific and the lowest concentration of interest will need to be specified.
• the accuracy and precision required. All results are only estimates of the true value and the greater the accuracy and precision required, the greater the analytical complexity and cost.
• the maximum period between sampling and analysis. On-the-spot field analysis may be required, depending on the use to be made of the data.
Where several methods can achieve the above requirements, the ultimate choice may be dictated by familiarity with the method and/or the availability of necessary analytical instrumentation.
Appropriate procedures for both chemical and biological analyses can be found by reference to accepted published procedures such as Standard Methods for the Examination of Water and Wastewater (APHA 1998)
2.5 Data analysis and interpretation of the data
With a diverse range of options available, data analysis should be viewed as an integral component of the water quality management process. The requisite data types, quantities, and methods of statistical analysis need to be considered collectively by the monitoring team at the early planning stages of any monitoring strategy in order to ensure that data of sufficient quality and quantity are collected for subsequent statistical analysis. Because of the challenges of interpreting monitoring results in an appropriate spatial-temporal context (typically due to climatic-hydrological variability), modelling on the basis of catchment land use and water quality information is becoming an increasingly popular tool to increase the value of monitoring program results (see Carroll et al., 2012). With water quality monitoring a critical complement to catchment modelling and reporting in the GBR context, particular attention is paid in this report in data requirements to facilitate extension of water quality monitoring program results into modelling platforms (section 3.6).
2.6 Reporting and information dissemination
At various stages through the design and implementation of the monitoring program, there will have been interaction with the various end-users of the information, including objective setting, the detailed study design and the laboratory analyses. The monitoring team will have

Davis et al.
22
clearly identified the end-users’ data needs and information requirements. Once results have been obtained and interpreted, the next step is to report the findings to what is likely to be a diverse range of stakeholders including the people who commissioned the study, resource managers, government staff and local landholders. This requires development of an effective framework for appropriate reporting and transmission of collected information.
Sub-catchment scale monitoring, modelling and extension design
23
3. DESIGNING A SUB-CATCHMENT MONITORING PROGRAM FOR SUGARCANE CATCHMENTS IN THE GBR This section attempts to apply the monitoring framework described in Section 2 in the context of sub-catchment scale monitoring in the GBRCA using the framework steps outlined in Figure 5.
3.1 Setting monitoring program objectives
As noted in Section 2.1, having clearly defined program objectives is an essential part of any monitoring design and depends on many factors. The process identified in Figure 6 is followed here to collate the relevant information to design a sub-catchment monitoring program for sugarcane catchments in the GBRCA. However, the ultimate specific objectives will be driven by the purpose of the program and the policy interventions involved in targeting management effort. 3.1.1 Define the issue Considerable information has already been compiled relating to the priority water quality issues and parameters (indicators) of most relevance to the health of the GBR and its catchment area, including Reef Plan Scientific Consensus Statements (Brodie et al., 2008, 2013a), Water Quality Improvement Plans for specific NRM regions (WQIPs; Bennett et al. 2014; Terrain NRM, 2015; Folkers et al., 2015; Higham et al., 2016; NQ Dry Tropics, 2016; Fitzroy Basin Association, 2016), the Paddock to Reef Integrated Monitoring, Modelling and Reporting Program (P2R Program; Carroll et al., 2012), and various research programs (e.g. Reef Rescue Research and Development; RRRD). The primary water quality pollutants (and hence indicators) of concern from GBR sugarcane cultivation are losses of inorganic nitrogen and herbicides (Brodie et al., 2013) and already provide a focus for this program in terms of specific indicators to be monitored (see also Queensland Department of the Premier and Cabinet, 2009). For this program design, the primary issues are associated with declining water quality in the GBR, the contributions of pollutant runoff from sugarcane areas to these issues, and ongoing concerns for the poor status of many the GBR freshwater, coastal and marine ecosystems (GBRMPA, 2014). More specifically, there is a lack of progress towards achieving Reef Plan 2013 water quality targets for ecosystem protection, and the associated lack of a spatially informed monitoring and management framework to effectively focus-prioritise remedial intervention in sugarcane areas in the GBRCA. The GBRCA covers a substantial geographic area, and includes 35 discrete river basins (Figure 1; Furnas 2003), captured by six NRM planning regions (Cape York Peninsula, Wet Tropics, Burdekin, Mackay-Whitsunday, Fitzroy and Burnett-Mary). Only fifteen of these 35 catchments contain sugarcane cultivation as a major land use. These sugarcane growing districts are found in the Wet Tropics, Burdekin, Mackay Whitsunday and Burnett Mary NRM regions (Table 2). The collection NRM region boundaries of the GBRCA constitute an appropriate initial, broad-scale spatial boundary for this monitoring framework.
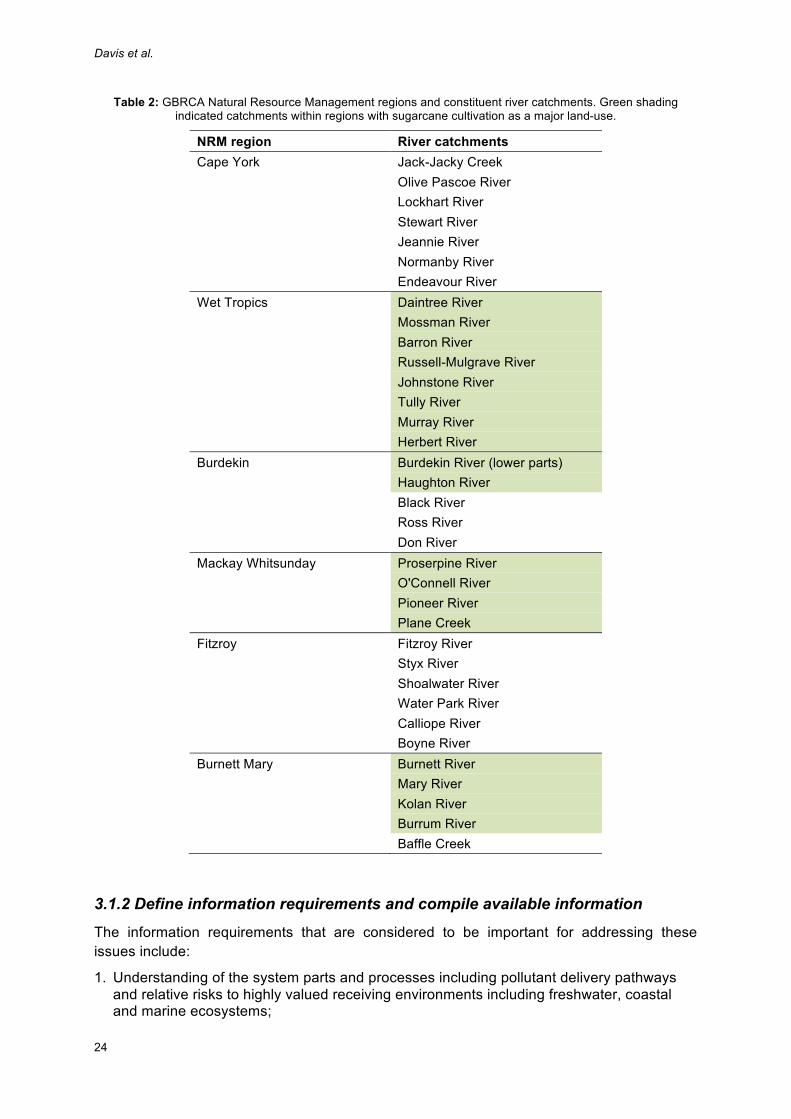
Davis et al.
24
Table 2: GBRCA Natural Resource Management regions and constituent river catchments. Green shading indicated catchments within regions with sugarcane cultivation as a major land-use.
NRM region River catchments Cape York Jack-Jacky Creek
Olive Pascoe River
Lockhart River
Stewart River
Jeannie River
Normanby River
Endeavour River
Wet Tropics Daintree River
Mossman River
Barron River
Russell-Mulgrave River
Johnstone River
Tully River
Murray River
Herbert River
Burdekin Burdekin River (lower parts)
Haughton River
Black River
Ross River
Don River
Mackay Whitsunday Proserpine River
O'Connell River
Pioneer River
Plane Creek
Fitzroy Fitzroy River
Styx River
Shoalwater River
Water Park River
Calliope River
Boyne River
Burnett Mary Burnett River
Mary River
Kolan River
Burrum River
Baffle Creek
3.1.2 Define information requirements and compile available information The information requirements that are considered to be important for addressing these issues include:
1. Understanding of the system parts and processes including pollutant delivery pathways and relative risks to highly valued receiving environments including freshwater, coastal and marine ecosystems;
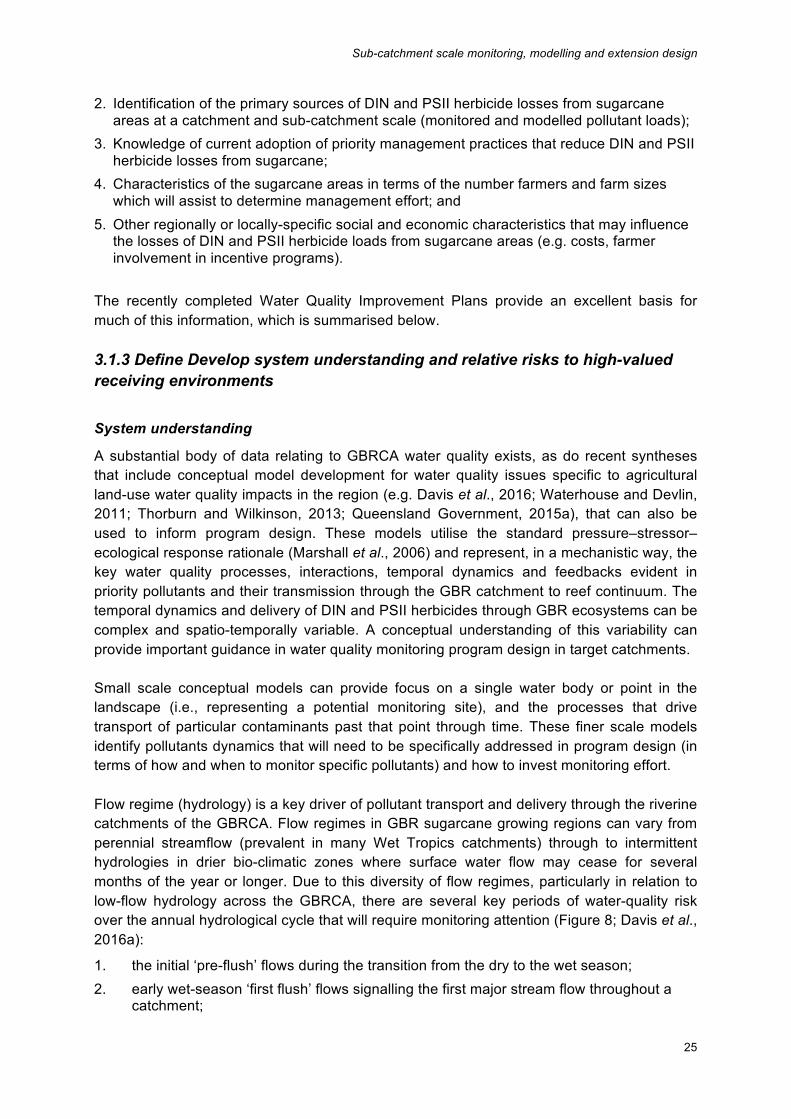
Sub-catchment scale monitoring, modelling and extension design
25
2. Identification of the primary sources of DIN and PSII herbicide losses from sugarcane areas at a catchment and sub-catchment scale (monitored and modelled pollutant loads);
3. Knowledge of current adoption of priority management practices that reduce DIN and PSII herbicide losses from sugarcane;
4. Characteristics of the sugarcane areas in terms of the number farmers and farm sizes which will assist to determine management effort; and
5. Other regionally or locally-specific social and economic characteristics that may influence the losses of DIN and PSII herbicide loads from sugarcane areas (e.g. costs, farmer involvement in incentive programs).
The recently completed Water Quality Improvement Plans provide an excellent basis for much of this information, which is summarised below. 3.1.3 Define Develop system understanding and relative risks to high-valued receiving environments System understanding
A substantial body of data relating to GBRCA water quality exists, as do recent syntheses that include conceptual model development for water quality issues specific to agricultural land-use water quality impacts in the region (e.g. Davis et al., 2016; Waterhouse and Devlin, 2011; Thorburn and Wilkinson, 2013; Queensland Government, 2015a), that can also be used to inform program design. These models utilise the standard pressure–stressor–ecological response rationale (Marshall et al., 2006) and represent, in a mechanistic way, the key water quality processes, interactions, temporal dynamics and feedbacks evident in priority pollutants and their transmission through the GBR catchment to reef continuum. The temporal dynamics and delivery of DIN and PSII herbicides through GBR ecosystems can be complex and spatio-temporally variable. A conceptual understanding of this variability can provide important guidance in water quality monitoring program design in target catchments. Small scale conceptual models can provide focus on a single water body or point in the landscape (i.e., representing a potential monitoring site), and the processes that drive transport of particular contaminants past that point through time. These finer scale models identify pollutants dynamics that will need to be specifically addressed in program design (in terms of how and when to monitor specific pollutants) and how to invest monitoring effort. Flow regime (hydrology) is a key driver of pollutant transport and delivery through the riverine catchments of the GBRCA. Flow regimes in GBR sugarcane growing regions can vary from perennial streamflow (prevalent in many Wet Tropics catchments) through to intermittent hydrologies in drier bio-climatic zones where surface water flow may cease for several months of the year or longer. Due to this diversity of flow regimes, particularly in relation to low-flow hydrology across the GBRCA, there are several key periods of water-quality risk over the annual hydrological cycle that will require monitoring attention (Figure 8; Davis et al., 2016a):
1. the initial ‘pre-flush’ flows during the transition from the dry to the wet season;
2. early wet-season ‘first flush’ flows signalling the first major stream flow throughout a catchment;
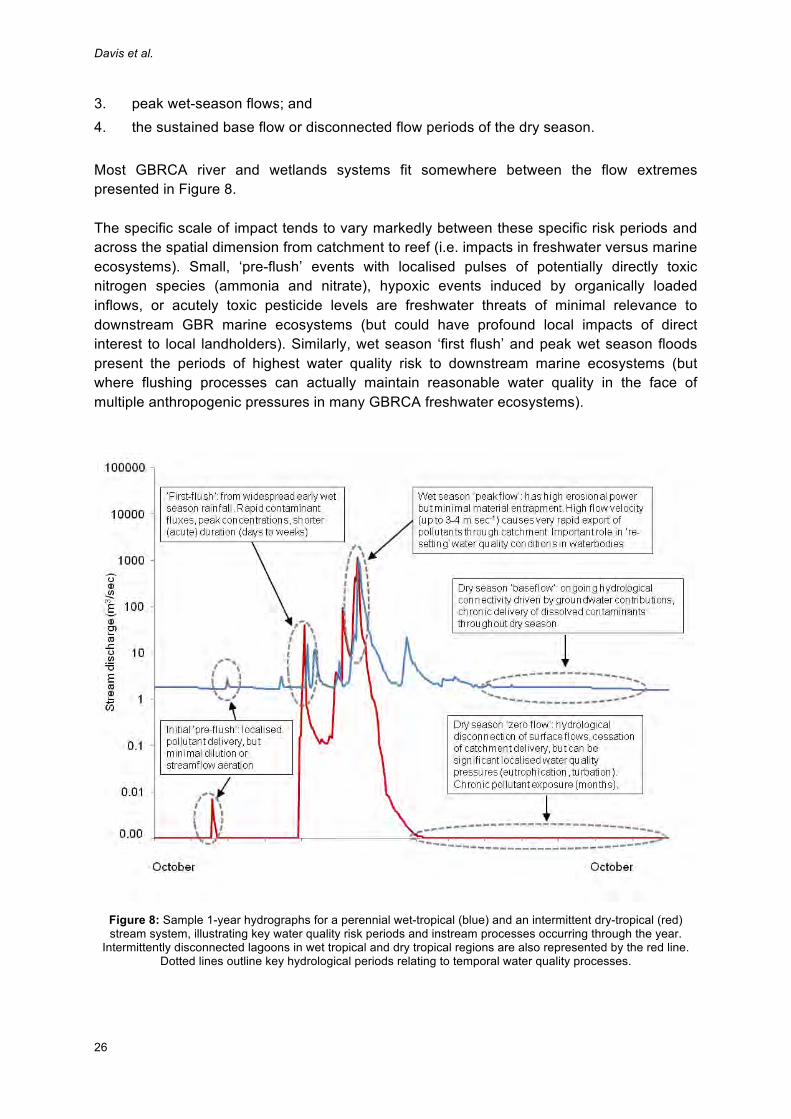
Davis et al.
26
3. peak wet-season flows; and
4. the sustained base flow or disconnected flow periods of the dry season.
Most GBRCA river and wetlands systems fit somewhere between the flow extremes presented in Figure 8. The specific scale of impact tends to vary markedly between these specific risk periods and across the spatial dimension from catchment to reef (i.e. impacts in freshwater versus marine ecosystems). Small, ‘pre-flush’ events with localised pulses of potentially directly toxic nitrogen species (ammonia and nitrate), hypoxic events induced by organically loaded inflows, or acutely toxic pesticide levels are freshwater threats of minimal relevance to downstream GBR marine ecosystems (but could have profound local impacts of direct interest to local landholders). Similarly, wet season ‘first flush’ and peak wet season floods present the periods of highest water quality risk to downstream marine ecosystems (but where flushing processes can actually maintain reasonable water quality in the face of multiple anthropogenic pressures in many GBRCA freshwater ecosystems).
Figure 8: Sample 1-year hydrographs for a perennial wet-tropical (blue) and an intermittent dry-tropical (red) stream system, illustrating key water quality risk periods and instream processes occurring through the year.
Intermittently disconnected lagoons in wet tropical and dry tropical regions are also represented by the red line. Dotted lines outline key hydrological periods relating to temporal water quality processes.
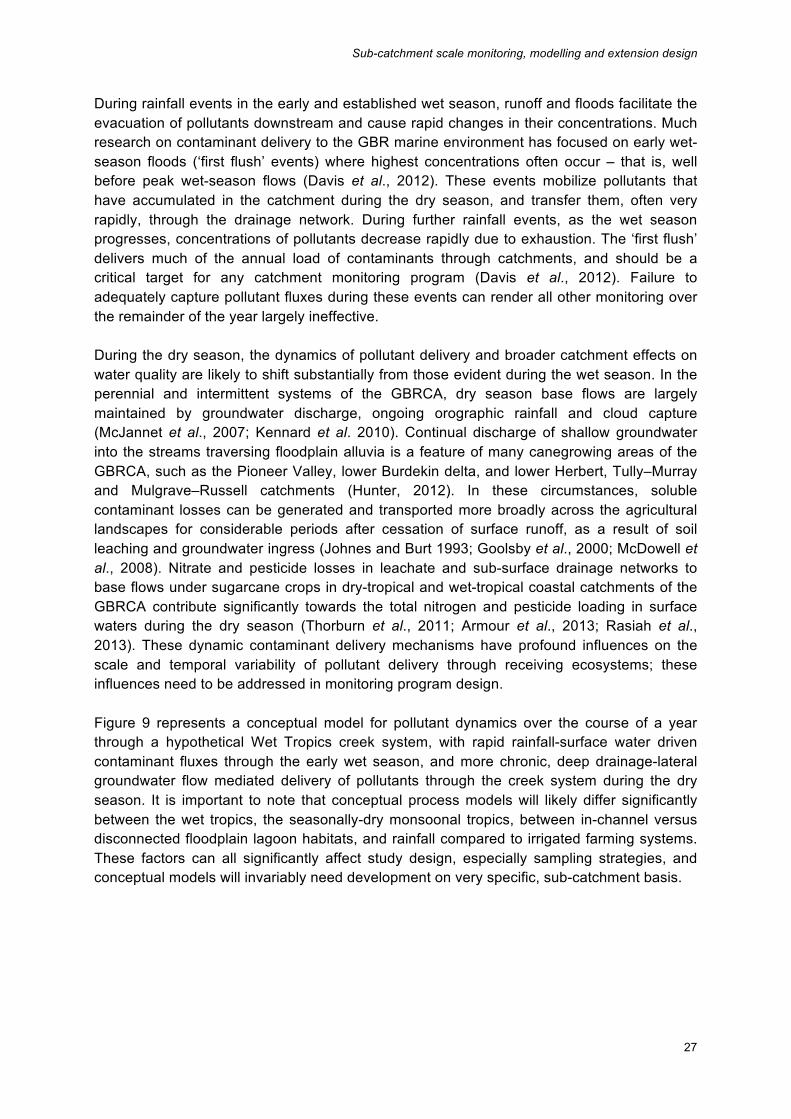
Sub-catchment scale monitoring, modelling and extension design
27
During rainfall events in the early and established wet season, runoff and floods facilitate the evacuation of pollutants downstream and cause rapid changes in their concentrations. Much research on contaminant delivery to the GBR marine environment has focused on early wet-season floods (‘first flush’ events) where highest concentrations often occur – that is, well before peak wet-season flows (Davis et al., 2012). These events mobilize pollutants that have accumulated in the catchment during the dry season, and transfer them, often very rapidly, through the drainage network. During further rainfall events, as the wet season progresses, concentrations of pollutants decrease rapidly due to exhaustion. The ‘first flush’ delivers much of the annual load of contaminants through catchments, and should be a critical target for any catchment monitoring program (Davis et al., 2012). Failure to adequately capture pollutant fluxes during these events can render all other monitoring over the remainder of the year largely ineffective. During the dry season, the dynamics of pollutant delivery and broader catchment effects on water quality are likely to shift substantially from those evident during the wet season. In the perennial and intermittent systems of the GBRCA, dry season base flows are largely maintained by groundwater discharge, ongoing orographic rainfall and cloud capture (McJannet et al., 2007; Kennard et al. 2010). Continual discharge of shallow groundwater into the streams traversing floodplain alluvia is a feature of many canegrowing areas of the GBRCA, such as the Pioneer Valley, lower Burdekin delta, and lower Herbert, Tully–Murray and Mulgrave–Russell catchments (Hunter, 2012). In these circumstances, soluble contaminant losses can be generated and transported more broadly across the agricultural landscapes for considerable periods after cessation of surface runoff, as a result of soil leaching and groundwater ingress (Johnes and Burt 1993; Goolsby et al., 2000; McDowell et al., 2008). Nitrate and pesticide losses in leachate and sub-surface drainage networks to base flows under sugarcane crops in dry-tropical and wet-tropical coastal catchments of the GBRCA contribute significantly towards the total nitrogen and pesticide loading in surface waters during the dry season (Thorburn et al., 2011; Armour et al., 2013; Rasiah et al., 2013). These dynamic contaminant delivery mechanisms have profound influences on the scale and temporal variability of pollutant delivery through receiving ecosystems; these influences need to be addressed in monitoring program design. Figure 9 represents a conceptual model for pollutant dynamics over the course of a year through a hypothetical Wet Tropics creek system, with rapid rainfall-surface water driven contaminant fluxes through the early wet season, and more chronic, deep drainage-lateral groundwater flow mediated delivery of pollutants through the creek system during the dry season. It is important to note that conceptual process models will likely differ significantly between the wet tropics, the seasonally-dry monsoonal tropics, between in-channel versus disconnected floodplain lagoon habitats, and rainfall compared to irrigated farming systems. These factors can all significantly affect study design, especially sampling strategies, and conceptual models will invariably need development on very specific, sub-catchment basis.
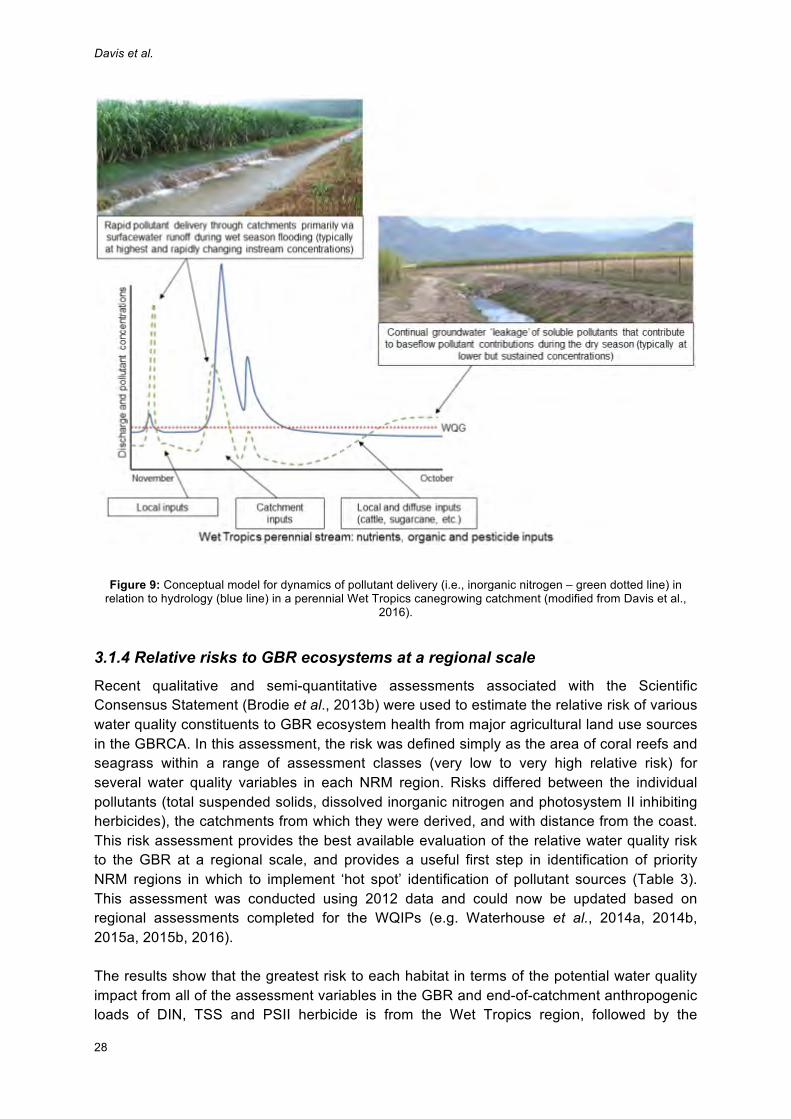
Davis et al.
28
Figure 9: Conceptual model for dynamics of pollutant delivery (i.e., inorganic nitrogen – green dotted line) in relation to hydrology (blue line) in a perennial Wet Tropics canegrowing catchment (modified from Davis et al.,
2016).
3.1.4 Relative risks to GBR ecosystems at a regional scale Recent qualitative and semi-quantitative assessments associated with the Scientific Consensus Statement (Brodie et al., 2013b) were used to estimate the relative risk of various water quality constituents to GBR ecosystem health from major agricultural land use sources in the GBRCA. In this assessment, the risk was defined simply as the area of coral reefs and seagrass within a range of assessment classes (very low to very high relative risk) for several water quality variables in each NRM region. Risks differed between the individual pollutants (total suspended solids, dissolved inorganic nitrogen and photosystem II inhibiting herbicides), the catchments from which they were derived, and with distance from the coast. This risk assessment provides the best available evaluation of the relative water quality risk to the GBR at a regional scale, and provides a useful first step in identification of priority NRM regions in which to implement ‘hot spot’ identification of pollutant sources (Table 3). This assessment was conducted using 2012 data and could now be updated based on regional assessments completed for the WQIPs (e.g. Waterhouse et al., 2014a, 2014b, 2015a, 2015b, 2016). The results show that the greatest risk to each habitat in terms of the potential water quality impact from all of the assessment variables in the GBR and end-of-catchment anthropogenic loads of DIN, TSS and PSII herbicide is from the Wet Tropics region, followed by the
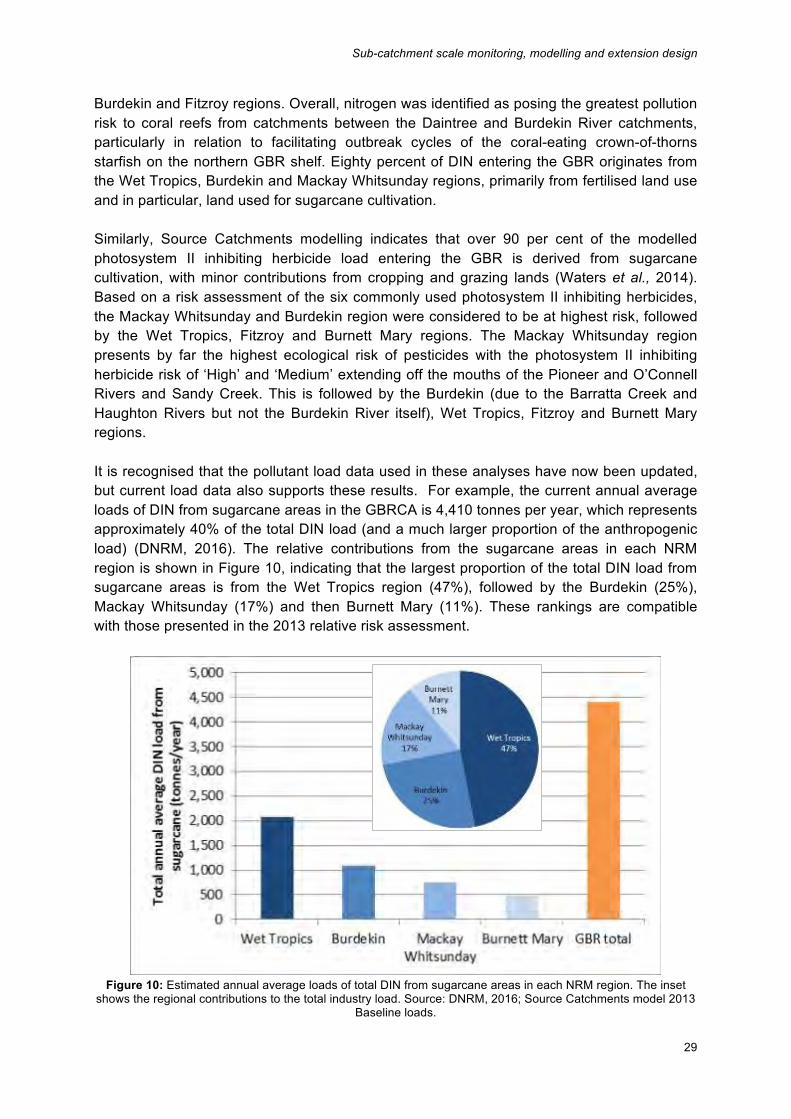
Sub-catchment scale monitoring, modelling and extension design
29
Burdekin and Fitzroy regions. Overall, nitrogen was identified as posing the greatest pollution risk to coral reefs from catchments between the Daintree and Burdekin River catchments, particularly in relation to facilitating outbreak cycles of the coral-eating crown-of-thorns starfish on the northern GBR shelf. Eighty percent of DIN entering the GBR originates from the Wet Tropics, Burdekin and Mackay Whitsunday regions, primarily from fertilised land use and in particular, land used for sugarcane cultivation. Similarly, Source Catchments modelling indicates that over 90 per cent of the modelled photosystem II inhibiting herbicide load entering the GBR is derived from sugarcane cultivation, with minor contributions from cropping and grazing lands (Waters et al., 2014). Based on a risk assessment of the six commonly used photosystem II inhibiting herbicides, the Mackay Whitsunday and Burdekin region were considered to be at highest risk, followed by the Wet Tropics, Fitzroy and Burnett Mary regions. The Mackay Whitsunday region presents by far the highest ecological risk of pesticides with the photosystem II inhibiting herbicide risk of ‘High’ and ‘Medium’ extending off the mouths of the Pioneer and O’Connell Rivers and Sandy Creek. This is followed by the Burdekin (due to the Barratta Creek and Haughton Rivers but not the Burdekin River itself), Wet Tropics, Fitzroy and Burnett Mary regions. It is recognised that the pollutant load data used in these analyses have now been updated, but current load data also supports these results. For example, the current annual average loads of DIN from sugarcane areas in the GBRCA is 4,410 tonnes per year, which represents approximately 40% of the total DIN load (and a much larger proportion of the anthropogenic load) (DNRM, 2016). The relative contributions from the sugarcane areas in each NRM region is shown in Figure 10, indicating that the largest proportion of the total DIN load from sugarcane areas is from the Wet Tropics region (47%), followed by the Burdekin (25%), Mackay Whitsunday (17%) and then Burnett Mary (11%). These rankings are compatible with those presented in the 2013 relative risk assessment.
Figure 10: Estimated annual average loads of total DIN from sugarcane areas in each NRM region. The inset
shows the regional contributions to the total industry load. Source: DNRM, 2016; Source Catchments model 2013 Baseline loads.
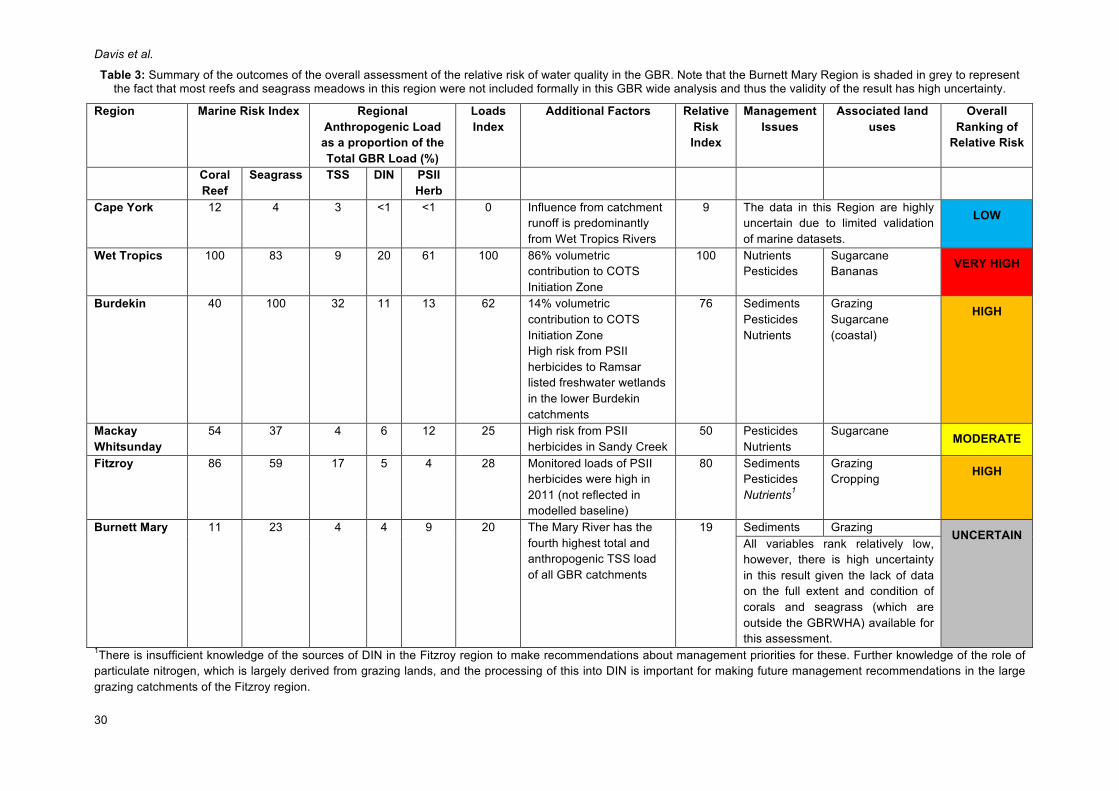
Davis et al.
30
Table 3: Summary of the outcomes of the overall assessment of the relative risk of water quality in the GBR. Note that the Burnett Mary Region is shaded in grey to represent the fact that most reefs and seagrass meadows in this region were not included formally in this GBR wide analysis and thus the validity of the result has high uncertainty.
Region Marine Risk Index Regional Anthropogenic Load as a proportion of the Total GBR Load (%)
Loads Index
Additional Factors Relative Risk Index
Management Issues
Associated land uses
Overall Ranking of
Relative Risk
Coral Reef
Seagrass TSS DIN PSII Herb
Cape York 12 4 3 <1 <1 0 Influence from catchment runoff is predominantly from Wet Tropics Rivers
9 The data in this Region are highly uncertain due to limited validation of marine datasets.
LOW
Wet Tropics 100 83 9 20 61 100 86% volumetric contribution to COTS Initiation Zone
100 Nutrients Pesticides
Sugarcane Bananas VERY HIGH
Burdekin 40 100 32 11 13 62 14% volumetric contribution to COTS Initiation Zone High risk from PSII herbicides to Ramsar listed freshwater wetlands in the lower Burdekin catchments
76 Sediments Pesticides Nutrients
Grazing Sugarcane (coastal)
HIGH
Mackay Whitsunday
54 37 4 6 12 25 High risk from PSII herbicides in Sandy Creek
50 Pesticides Nutrients
Sugarcane MODERATE
Fitzroy 86 59 17 5 4 28 Monitored loads of PSII herbicides were high in 2011 (not reflected in modelled baseline)
80 Sediments Pesticides Nutrients1
Grazing Cropping HIGH
Burnett Mary 11 23 4 4 9 20 The Mary River has the fourth highest total and anthropogenic TSS load of all GBR catchments
19 Sediments Grazing UNCERTAIN All variables rank relatively low, however, there is high uncertainty in this result given the lack of data on the full extent and condition of corals and seagrass (which are outside the GBRWHA) available for this assessment.
1There is insufficient knowledge of the sources of DIN in the Fitzroy region to make recommendations about management priorities for these. Further knowledge of the role of particulate nitrogen, which is largely derived from grazing lands, and the processing of this into DIN is important for making future management recommendations in the large grazing catchments of the Fitzroy region.
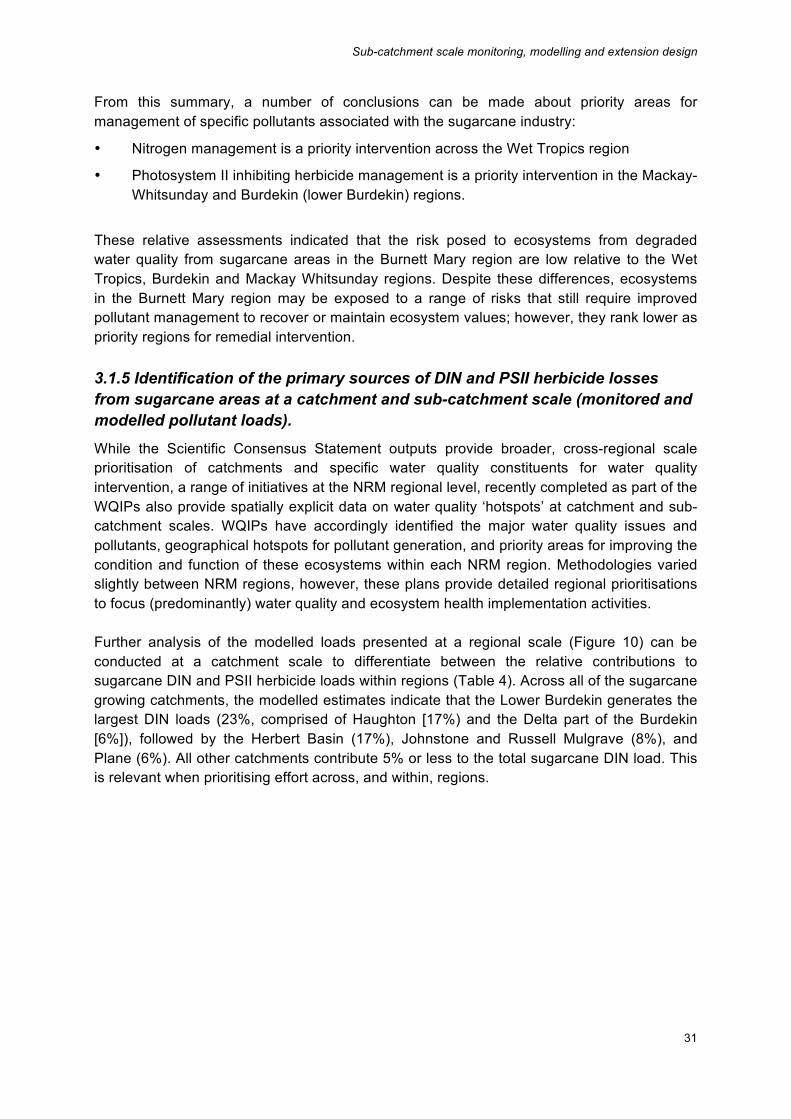
Sub-catchment scale monitoring, modelling and extension design
31
From this summary, a number of conclusions can be made about priority areas for management of specific pollutants associated with the sugarcane industry:
• Nitrogen management is a priority intervention across the Wet Tropics region
• Photosystem II inhibiting herbicide management is a priority intervention in the Mackay-Whitsunday and Burdekin (lower Burdekin) regions.
These relative assessments indicated that the risk posed to ecosystems from degraded water quality from sugarcane areas in the Burnett Mary region are low relative to the Wet Tropics, Burdekin and Mackay Whitsunday regions. Despite these differences, ecosystems in the Burnett Mary region may be exposed to a range of risks that still require improved pollutant management to recover or maintain ecosystem values; however, they rank lower as priority regions for remedial intervention. 3.1.5 Identification of the primary sources of DIN and PSII herbicide losses from sugarcane areas at a catchment and sub-catchment scale (monitored and modelled pollutant loads). While the Scientific Consensus Statement outputs provide broader, cross-regional scale prioritisation of catchments and specific water quality constituents for water quality intervention, a range of initiatives at the NRM regional level, recently completed as part of the WQIPs also provide spatially explicit data on water quality ‘hotspots’ at catchment and sub-catchment scales. WQIPs have accordingly identified the major water quality issues and pollutants, geographical hotspots for pollutant generation, and priority areas for improving the condition and function of these ecosystems within each NRM region. Methodologies varied slightly between NRM regions, however, these plans provide detailed regional prioritisations to focus (predominantly) water quality and ecosystem health implementation activities. Further analysis of the modelled loads presented at a regional scale (Figure 10) can be conducted at a catchment scale to differentiate between the relative contributions to sugarcane DIN and PSII herbicide loads within regions (Table 4). Across all of the sugarcane growing catchments, the modelled estimates indicate that the Lower Burdekin generates the largest DIN loads (23%, comprised of Haughton [17%) and the Delta part of the Burdekin [6%]), followed by the Herbert Basin (17%), Johnstone and Russell Mulgrave (8%), and Plane (6%). All other catchments contribute 5% or less to the total sugarcane DIN load. This is relevant when prioritising effort across, and within, regions.
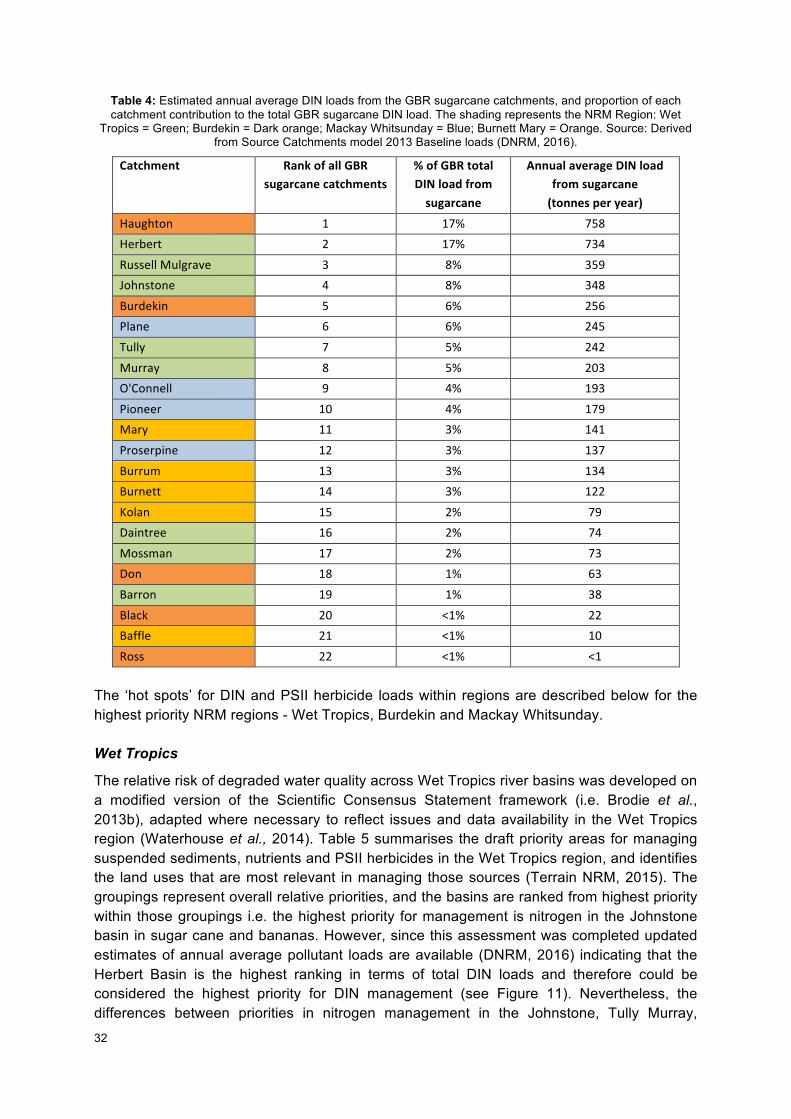
32
Table 4: Estimated annual average DIN loads from the GBR sugarcane catchments, and proportion of each catchment contribution to the total GBR sugarcane DIN load. The shading represents the NRM Region: Wet
Tropics = Green; Burdekin = Dark orange; Mackay Whitsunday = Blue; Burnett Mary = Orange. Source: Derived from Source Catchments model 2013 Baseline loads (DNRM, 2016).
Catchment RankofallGBRsugarcanecatchments
%ofGBRtotalDINloadfromsugarcane
AnnualaverageDINloadfromsugarcane(tonnesperyear)
Haughton 1 17% 758
Herbert 2 17% 734
RussellMulgrave 3 8% 359
Johnstone 4 8% 348
Burdekin 5 6% 256
Plane 6 6% 245
Tully 7 5% 242
Murray 8 5% 203
O'Connell 9 4% 193
Pioneer 10 4% 179
Mary 11 3% 141
Proserpine 12 3% 137
Burrum 13 3% 134
Burnett 14 3% 122
Kolan 15 2% 79
Daintree 16 2% 74
Mossman 17 2% 73
Don 18 1% 63
Barron 19 1% 38
Black 20 <1% 22
Baffle 21 <1% 10
Ross 22 <1% <1
The ‘hot spots’ for DIN and PSII herbicide loads within regions are described below for the highest priority NRM regions - Wet Tropics, Burdekin and Mackay Whitsunday. Wet Tropics
The relative risk of degraded water quality across Wet Tropics river basins was developed on a modified version of the Scientific Consensus Statement framework (i.e. Brodie et al., 2013b), adapted where necessary to reflect issues and data availability in the Wet Tropics region (Waterhouse et al., 2014). Table 5 summarises the draft priority areas for managing suspended sediments, nutrients and PSII herbicides in the Wet Tropics region, and identifies the land uses that are most relevant in managing those sources (Terrain NRM, 2015). The groupings represent overall relative priorities, and the basins are ranked from highest priority within those groupings i.e. the highest priority for management is nitrogen in the Johnstone basin in sugar cane and bananas. However, since this assessment was completed updated estimates of annual average pollutant loads are available (DNRM, 2016) indicating that the Herbert Basin is the highest ranking in terms of total DIN loads and therefore could be considered the highest priority for DIN management (see Figure 11). Nevertheless, the differences between priorities in nitrogen management in the Johnstone, Tully Murray,
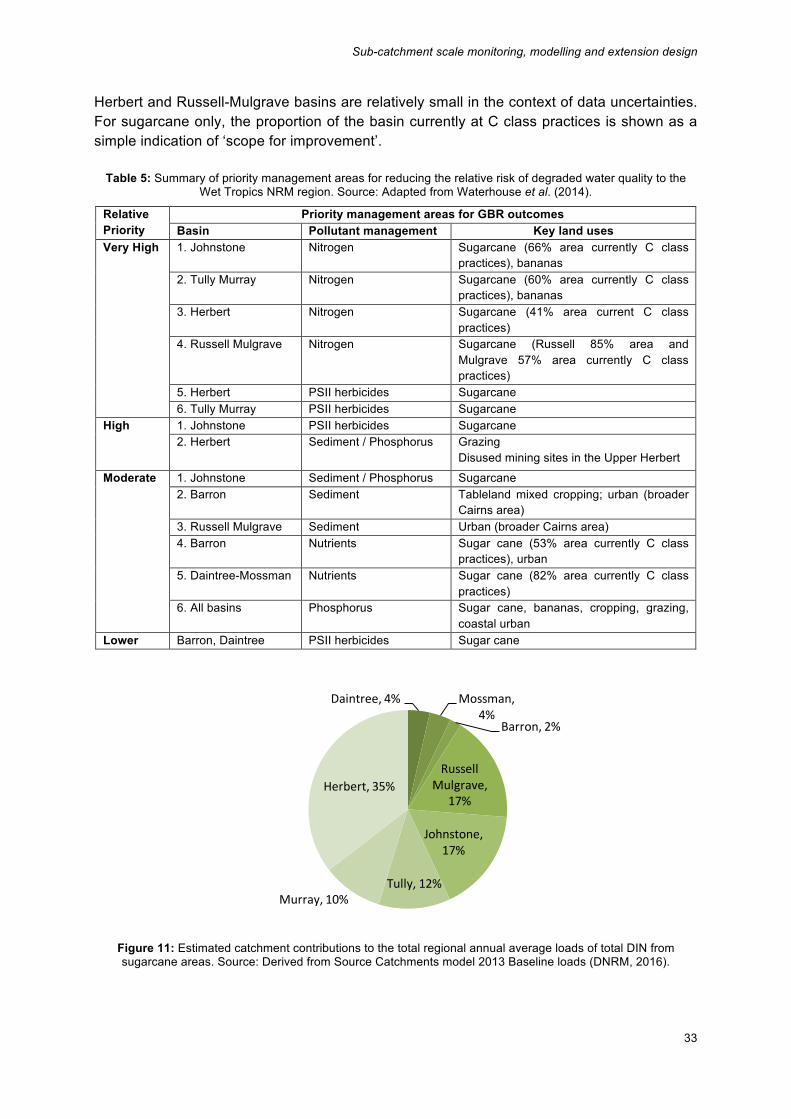
Sub-catchment scale monitoring, modelling and extension design
33
Herbert and Russell-Mulgrave basins are relatively small in the context of data uncertainties. For sugarcane only, the proportion of the basin currently at C class practices is shown as a simple indication of ‘scope for improvement’.
Table 5: Summary of priority management areas for reducing the relative risk of degraded water quality to the Wet Tropics NRM region. Source: Adapted from Waterhouse et al. (2014).
Relative Priority
Priority management areas for GBR outcomes Basin Pollutant management Key land uses
Very High 1. Johnstone Nitrogen Sugarcane (66% area currently C class practices), bananas
2. Tully Murray Nitrogen Sugarcane (60% area currently C class practices), bananas
3. Herbert Nitrogen Sugarcane (41% area current C class practices)
4. Russell Mulgrave Nitrogen Sugarcane (Russell 85% area and Mulgrave 57% area currently C class practices)
5. Herbert PSII herbicides Sugarcane 6. Tully Murray PSII herbicides Sugarcane
High 1. Johnstone PSII herbicides Sugarcane 2. Herbert Sediment / Phosphorus Grazing
Disused mining sites in the Upper Herbert Moderate 1. Johnstone Sediment / Phosphorus Sugarcane
2. Barron Sediment Tableland mixed cropping; urban (broader Cairns area)
3. Russell Mulgrave Sediment Urban (broader Cairns area) 4. Barron Nutrients Sugar cane (53% area currently C class
practices), urban 5. Daintree-Mossman Nutrients Sugar cane (82% area currently C class
practices) 6. All basins Phosphorus Sugar cane, bananas, cropping, grazing,
coastal urban Lower Barron, Daintree PSII herbicides Sugar cane
Figure 11: Estimated catchment contributions to the total regional annual average loads of total DIN from sugarcane areas. Source: Derived from Source Catchments model 2013 Baseline loads (DNRM, 2016).
Daintree,4% Mossman,
4%Barron,2%
Russell
Mulgrave,
17%
Johnstone,
17%
Tully,12%
Murray,10%
Herbert,35%
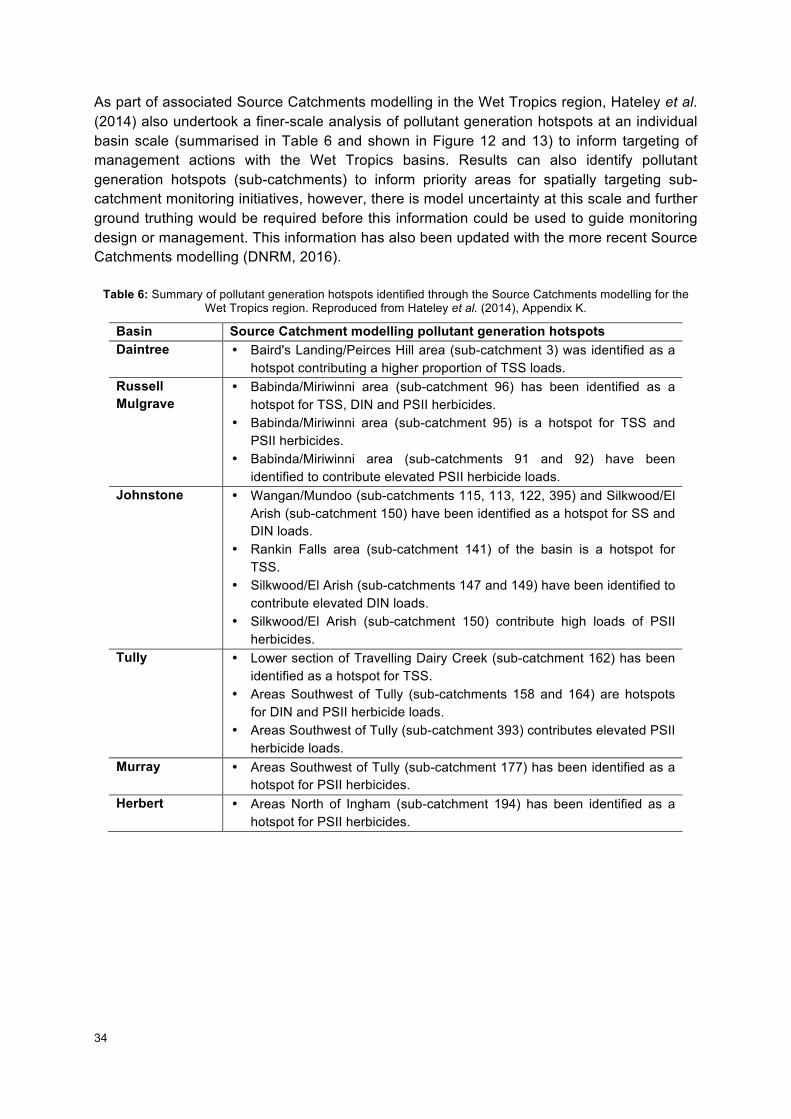
34
As part of associated Source Catchments modelling in the Wet Tropics region, Hateley et al. (2014) also undertook a finer-scale analysis of pollutant generation hotspots at an individual basin scale (summarised in Table 6 and shown in Figure 12 and 13) to inform targeting of management actions with the Wet Tropics basins. Results can also identify pollutant generation hotspots (sub-catchments) to inform priority areas for spatially targeting sub-catchment monitoring initiatives, however, there is model uncertainty at this scale and further ground truthing would be required before this information could be used to guide monitoring design or management. This information has also been updated with the more recent Source Catchments modelling (DNRM, 2016).
Table 6: Summary of pollutant generation hotspots identified through the Source Catchments modelling for the Wet Tropics region. Reproduced from Hateley et al. (2014), Appendix K.
Basin Source Catchment modelling pollutant generation hotspots Daintree • Baird's Landing/Peirces Hill area (sub-catchment 3) was identified as a
hotspot contributing a higher proportion of TSS loads. Russell Mulgrave
• Babinda/Miriwinni area (sub-catchment 96) has been identified as a hotspot for TSS, DIN and PSII herbicides.
• Babinda/Miriwinni area (sub-catchment 95) is a hotspot for TSS and PSII herbicides.
• Babinda/Miriwinni area (sub-catchments 91 and 92) have been identified to contribute elevated PSII herbicide loads.
Johnstone • Wangan/Mundoo (sub-catchments 115, 113, 122, 395) and Silkwood/El Arish (sub-catchment 150) have been identified as a hotspot for SS and DIN loads.
• Rankin Falls area (sub-catchment 141) of the basin is a hotspot for TSS.
• Silkwood/El Arish (sub-catchments 147 and 149) have been identified to contribute elevated DIN loads.
• Silkwood/El Arish (sub-catchment 150) contribute high loads of PSII herbicides.
Tully • Lower section of Travelling Dairy Creek (sub-catchment 162) has been identified as a hotspot for TSS.
• Areas Southwest of Tully (sub-catchments 158 and 164) are hotspots for DIN and PSII herbicide loads.
• Areas Southwest of Tully (sub-catchment 393) contributes elevated PSII herbicide loads.
Murray • Areas Southwest of Tully (sub-catchment 177) has been identified as a hotspot for PSII herbicides.
Herbert • Areas North of Ingham (sub-catchment 194) has been identified as a hotspot for PSII herbicides.
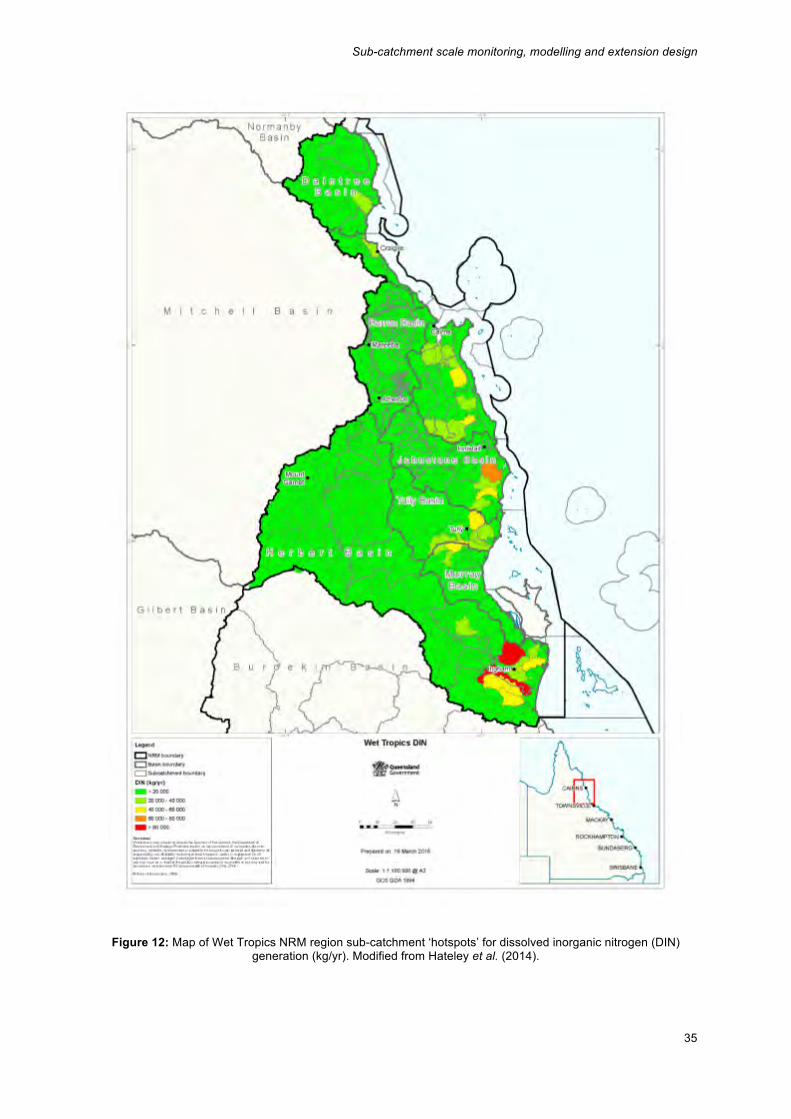
Sub-catchment scale monitoring, modelling and extension design
35
Figure 12: Map of Wet Tropics NRM region sub-catchment ‘hotspots’ for dissolved inorganic nitrogen (DIN) generation (kg/yr). Modified from Hateley et al. (2014).
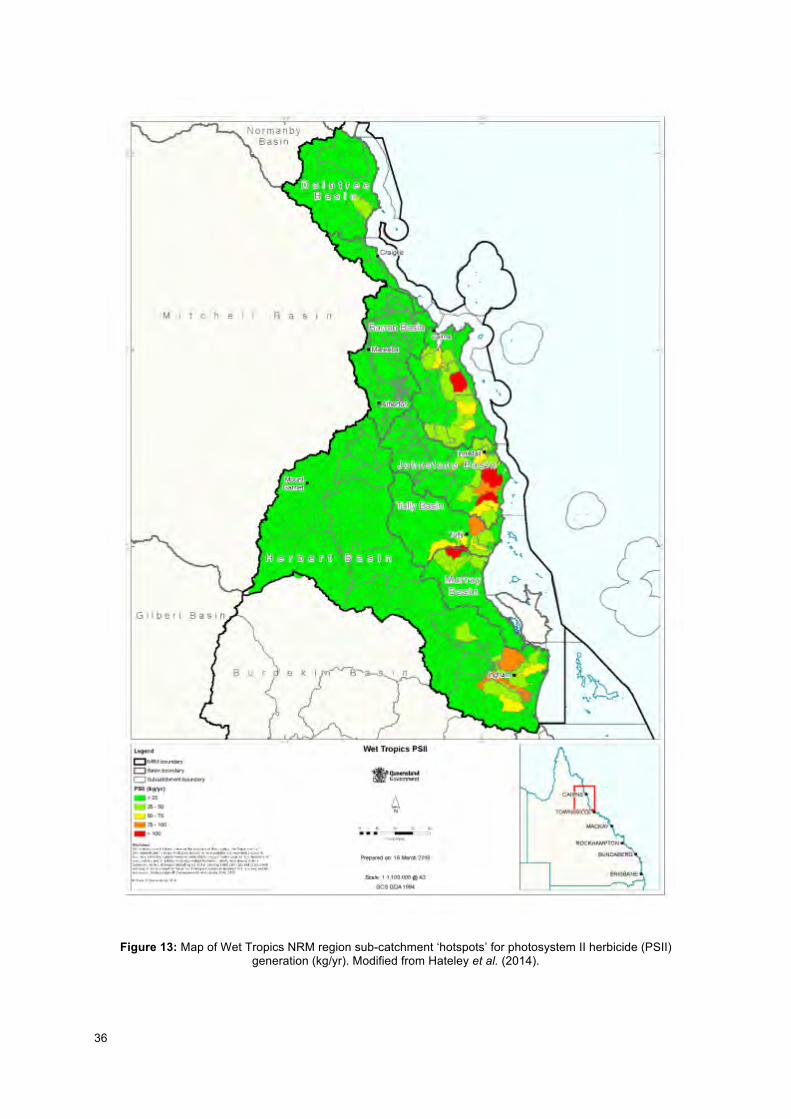
36
Figure 13: Map of Wet Tropics NRM region sub-catchment ‘hotspots’ for photosystem II herbicide (PSII) generation (kg/yr). Modified from Hateley et al. (2014).
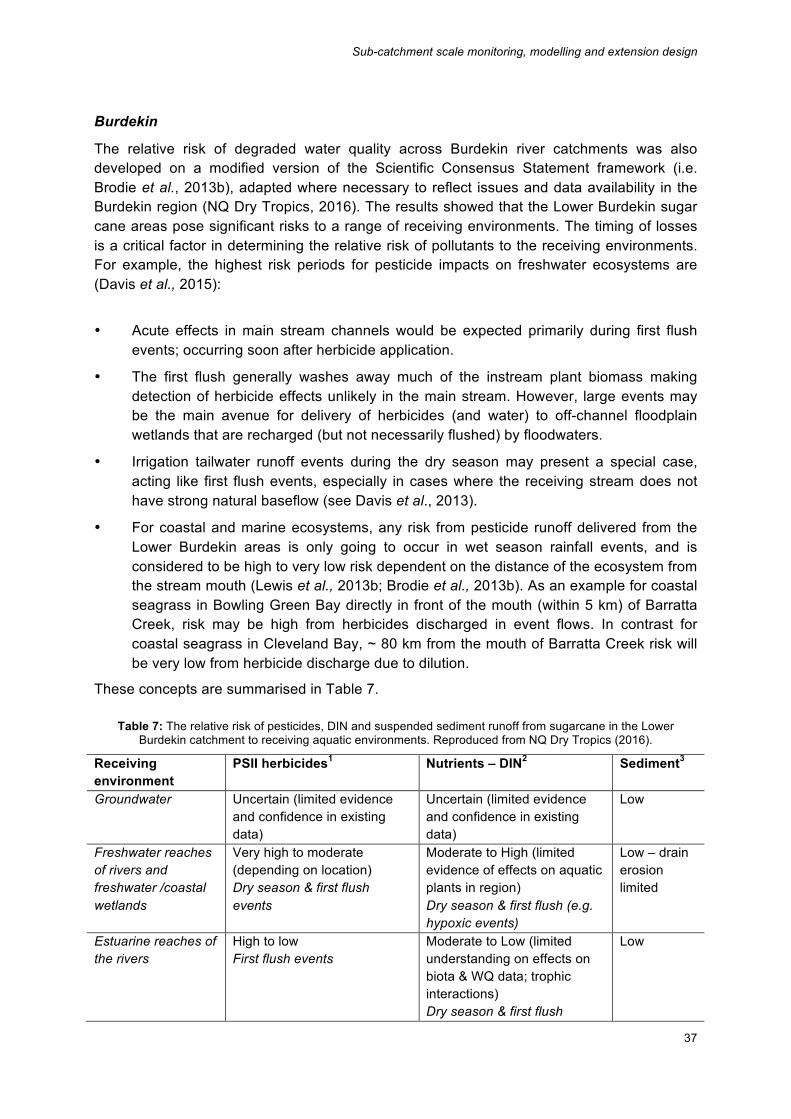
Sub-catchment scale monitoring, modelling and extension design
37
Burdekin
The relative risk of degraded water quality across Burdekin river catchments was also developed on a modified version of the Scientific Consensus Statement framework (i.e. Brodie et al., 2013b), adapted where necessary to reflect issues and data availability in the Burdekin region (NQ Dry Tropics, 2016). The results showed that the Lower Burdekin sugar cane areas pose significant risks to a range of receiving environments. The timing of losses is a critical factor in determining the relative risk of pollutants to the receiving environments. For example, the highest risk periods for pesticide impacts on freshwater ecosystems are (Davis et al., 2015):
• Acute effects in main stream channels would be expected primarily during first flush events; occurring soon after herbicide application.
• The first flush generally washes away much of the instream plant biomass making detection of herbicide effects unlikely in the main stream. However, large events may be the main avenue for delivery of herbicides (and water) to off-channel floodplain wetlands that are recharged (but not necessarily flushed) by floodwaters.
• Irrigation tailwater runoff events during the dry season may present a special case, acting like first flush events, especially in cases where the receiving stream does not have strong natural baseflow (see Davis et al., 2013).
• For coastal and marine ecosystems, any risk from pesticide runoff delivered from the Lower Burdekin areas is only going to occur in wet season rainfall events, and is considered to be high to very low risk dependent on the distance of the ecosystem from the stream mouth (Lewis et al., 2013b; Brodie et al., 2013b). As an example for coastal seagrass in Bowling Green Bay directly in front of the mouth (within 5 km) of Barratta Creek, risk may be high from herbicides discharged in event flows. In contrast for coastal seagrass in Cleveland Bay, ~ 80 km from the mouth of Barratta Creek risk will be very low from herbicide discharge due to dilution.
These concepts are summarised in Table 7.
Table 7: The relative risk of pesticides, DIN and suspended sediment runoff from sugarcane in the Lower Burdekin catchment to receiving aquatic environments. Reproduced from NQ Dry Tropics (2016).
Receiving environment
PSII herbicides1 Nutrients – DIN2 Sediment3
Groundwater Uncertain (limited evidence and confidence in existing data)
Uncertain (limited evidence and confidence in existing data)
Low
Freshwater reaches of rivers and freshwater /coastal wetlands
Very high to moderate (depending on location) Dry season & first flush events
Moderate to High (limited evidence of effects on aquatic plants in region) Dry season & first flush (e.g. hypoxic events)
Low – drain erosion limited
Estuarine reaches of the rivers
High to low First flush events
Moderate to Low (limited understanding on effects on biota & WQ data; trophic interactions) Dry season & first flush
Low
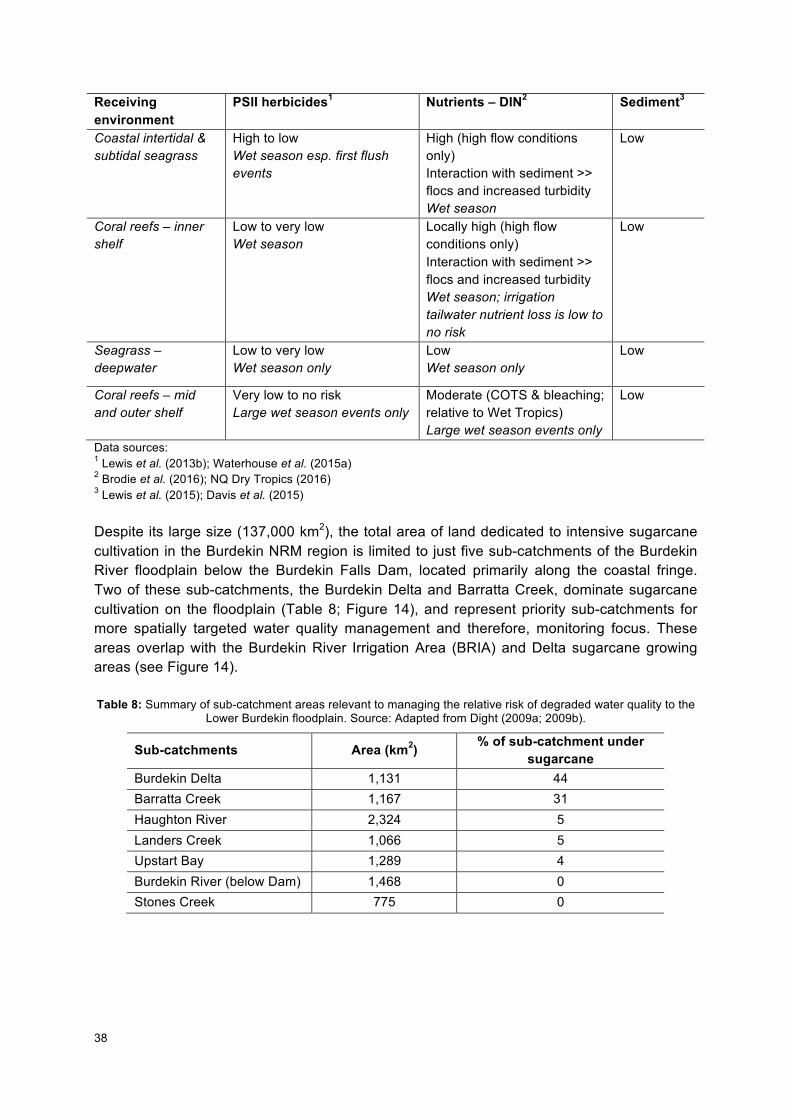
38
Receiving environment
PSII herbicides1 Nutrients – DIN2 Sediment3
Coastal intertidal & subtidal seagrass
High to low Wet season esp. first flush events
High (high flow conditions only) Interaction with sediment >> flocs and increased turbidity Wet season
Low
Coral reefs – inner shelf
Low to very low Wet season
Locally high (high flow conditions only) Interaction with sediment >> flocs and increased turbidity Wet season; irrigation tailwater nutrient loss is low to no risk
Low
Seagrass – deepwater
Low to very low Wet season only
Low Wet season only
Low
Coral reefs – mid and outer shelf
Very low to no risk Large wet season events only
Moderate (COTS & bleaching; relative to Wet Tropics) Large wet season events only
Low
Data sources: 1 Lewis et al. (2013b); Waterhouse et al. (2015a) 2 Brodie et al. (2016); NQ Dry Tropics (2016) 3 Lewis et al. (2015); Davis et al. (2015) Despite its large size (137,000 km2), the total area of land dedicated to intensive sugarcane cultivation in the Burdekin NRM region is limited to just five sub-catchments of the Burdekin River floodplain below the Burdekin Falls Dam, located primarily along the coastal fringe. Two of these sub-catchments, the Burdekin Delta and Barratta Creek, dominate sugarcane cultivation on the floodplain (Table 8; Figure 14), and represent priority sub-catchments for more spatially targeted water quality management and therefore, monitoring focus. These areas overlap with the Burdekin River Irrigation Area (BRIA) and Delta sugarcane growing areas (see Figure 14). Table 8: Summary of sub-catchment areas relevant to managing the relative risk of degraded water quality to the
Lower Burdekin floodplain. Source: Adapted from Dight (2009a; 2009b).
Sub-catchments Area (km2) % of sub-catchment under sugarcane
Burdekin Delta 1,131 44 Barratta Creek 1,167 31 Haughton River 2,324 5 Landers Creek 1,066 5 Upstart Bay 1,289 4 Burdekin River (below Dam) 1,468 0 Stones Creek 775 0
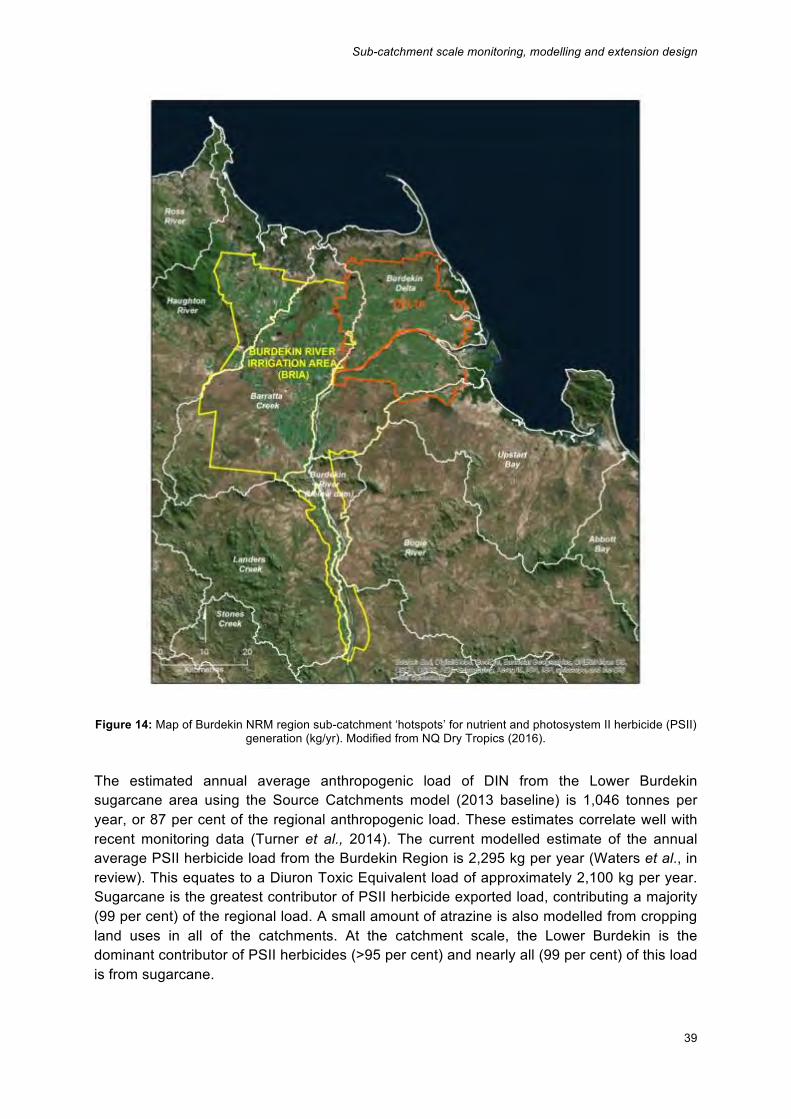
Sub-catchment scale monitoring, modelling and extension design
39
Figure 14: Map of Burdekin NRM region sub-catchment ‘hotspots’ for nutrient and photosystem II herbicide (PSII) generation (kg/yr). Modified from NQ Dry Tropics (2016).
The estimated annual average anthropogenic load of DIN from the Lower Burdekin sugarcane area using the Source Catchments model (2013 baseline) is 1,046 tonnes per year, or 87 per cent of the regional anthropogenic load. These estimates correlate well with recent monitoring data (Turner et al., 2014). The current modelled estimate of the annual average PSII herbicide load from the Burdekin Region is 2,295 kg per year (Waters et al., in review). This equates to a Diuron Toxic Equivalent load of approximately 2,100 kg per year. Sugarcane is the greatest contributor of PSII herbicide exported load, contributing a majority (99 per cent) of the regional load. A small amount of atrazine is also modelled from cropping land uses in all of the catchments. At the catchment scale, the Lower Burdekin is the dominant contributor of PSII herbicides (>95 per cent) and nearly all (99 per cent) of this load is from sugarcane.
40
The BRIA and Delta regions contribute approximately equal loads of DIN (accounting for uncertainties in some of the model input data such as current management adoption), estimated at 460 tonnes/year (44 per cent) and 586 tonnes/year (56 per cent) respectively, with both areas occupying approximately equivalent proportions of the cane producing area (CPA) in the Lower Burdekin catchment (Waters et al., in review). The DIN export rates are slightly higher in the Delta (~14 kg/hectare) compared to the BRIA (~10 kg/hectare). The modelled PSII herbicide toxic equivalent load data for the region also shows that the modelled contributions from the BRIA and Delta are roughly equivalent (within the level of accuracy of the model), estimated at 693 kg/year (55 per cent) and 564 kg/year (45 per cent) respectively. The lack of distinction between regions is likely a result of the reporting of relatively homogenous farming practices across both BRIA and Delta, and the factors that influence pesticides loss processes do not vary significantly across regions. However, it is likely that more residuals are applied in the BRIA as standard practices use less cultivation and therefore weed pressure can be greater (E. Shannon, pers. comm.). Nitrogen losses in runoff and deep drainage vary according to soil type in the BRIA and Delta areas. The dominant loss pathway in the largely clay based soils of the BRIA is through surface water runoff to Barratta Creek, whereas in the highly permeable light soils of the Delta the dominant loss pathway is through deep drainage (Thorburn et al., 2011) and to a lesser extent, surface runoff where the waterways are typically used as water transfer channels and receive limited runoff (Davis et al., 2012). The amount of N leached from the BRIA soils is, on average, much less (<10 per cent of fertiliser applications) than the Delta soils (75 per cent) (Thorburn et al., 2011). Given that the predominant pollutant loss pathway in the BRIA is by surface runoff (and therefore faster response times between pollutant reductions and responses in the receiving environment could be expected), there are less farms in the BRIA, the average farm is larger and practice changes are typically more cost effective, it could be concluded that improving sugarcane management actions in the BRIA may be a higher priority than in the Delta. However, due to variations in current practice adoption, specific site characteristics, proximity to sensitive freshwater waterways, and a range of complex social factors in the region, it may not be feasible to prioritise action in one area over another. Further discussion with industry experts is required before any strong recommendations along these lines could be adopted. Spatial management prioritisation to a smaller scale is difficult at this point due to limitations in our understanding of the hydrological complexities of the system. More detailed information needed includes accurate block-scale yield mapping (to determine nitrogen requirement) and management practice adoption data including current fertiliser and PSII herbicide use (fertiliser use data is available for about one third of the industry). It would then be possible to identify areas with poor nitrogen and PSII herbicide use efficiency to target for management improvements. In addition to this, more frequent and intensive nutrient and PSII herbicide monitoring along major drainage channels and coastal creeks will inform finer scale spatial priorities in both BRIA and Delta regions and provide greater confidence of monitoring data for the local farming community. Knowledge of current practice adoption, farm size and cost effectiveness of practice improvements should be used as a guide for targeting management until other knowledge is
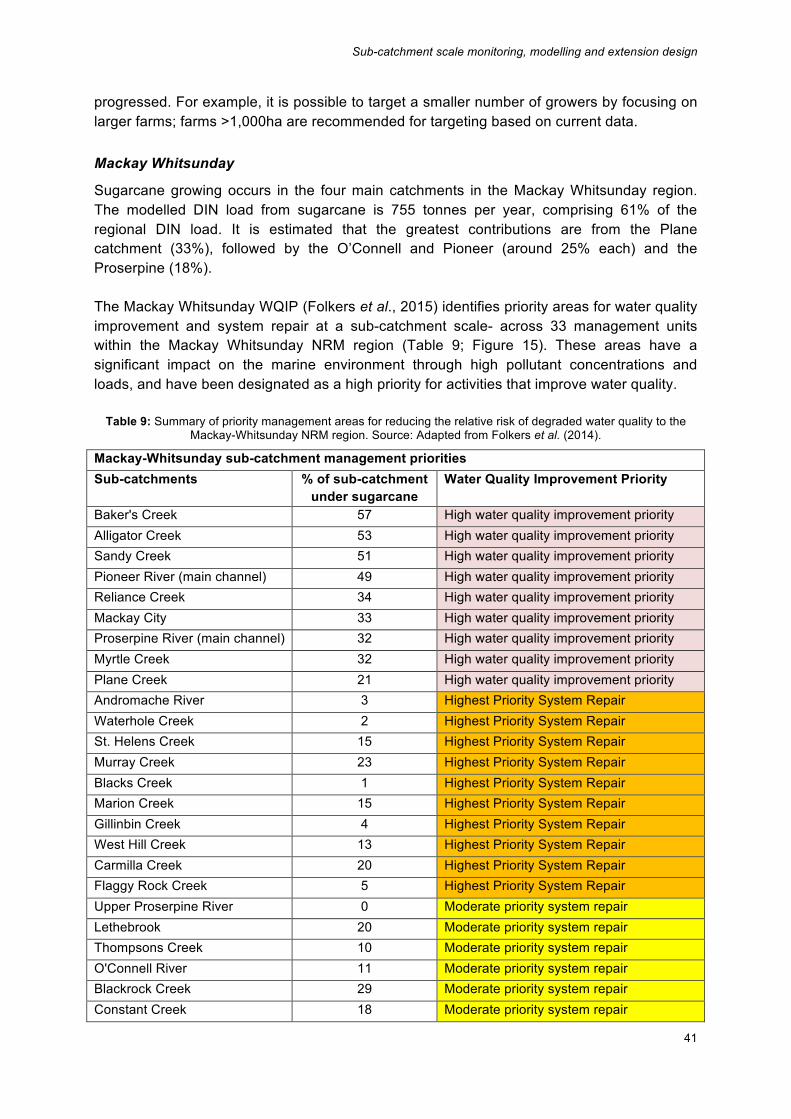
Sub-catchment scale monitoring, modelling and extension design
41
progressed. For example, it is possible to target a smaller number of growers by focusing on larger farms; farms >1,000ha are recommended for targeting based on current data.
Mackay Whitsunday
Sugarcane growing occurs in the four main catchments in the Mackay Whitsunday region. The modelled DIN load from sugarcane is 755 tonnes per year, comprising 61% of the regional DIN load. It is estimated that the greatest contributions are from the Plane catchment (33%), followed by the O’Connell and Pioneer (around 25% each) and the Proserpine (18%). The Mackay Whitsunday WQIP (Folkers et al., 2015) identifies priority areas for water quality improvement and system repair at a sub-catchment scale- across 33 management units within the Mackay Whitsunday NRM region (Table 9; Figure 15). These areas have a significant impact on the marine environment through high pollutant concentrations and loads, and have been designated as a high priority for activities that improve water quality.
Table 9: Summary of priority management areas for reducing the relative risk of degraded water quality to the Mackay-Whitsunday NRM region. Source: Adapted from Folkers et al. (2014).
Mackay-Whitsunday sub-catchment management priorities Sub-catchments % of sub-catchment
under sugarcane Water Quality Improvement Priority
Baker's Creek 57 High water quality improvement priority Alligator Creek 53 High water quality improvement priority Sandy Creek 51 High water quality improvement priority Pioneer River (main channel) 49 High water quality improvement priority Reliance Creek 34 High water quality improvement priority Mackay City 33 High water quality improvement priority Proserpine River (main channel) 32 High water quality improvement priority Myrtle Creek 32 High water quality improvement priority Plane Creek 21 High water quality improvement priority Andromache River 3 Highest Priority System Repair Waterhole Creek 2 Highest Priority System Repair St. Helens Creek 15 Highest Priority System Repair Murray Creek 23 Highest Priority System Repair Blacks Creek 1 Highest Priority System Repair Marion Creek 15 Highest Priority System Repair Gillinbin Creek 4 Highest Priority System Repair West Hill Creek 13 Highest Priority System Repair Carmilla Creek 20 Highest Priority System Repair Flaggy Rock Creek 5 Highest Priority System Repair Upper Proserpine River 0 Moderate priority system repair Lethebrook 20 Moderate priority system repair Thompsons Creek 10 Moderate priority system repair O'Connell River 11 Moderate priority system repair Blackrock Creek 29 Moderate priority system repair Constant Creek 18 Moderate priority system repair

42
Upper Cattle Creek 13 Moderate priority system repair Sarina Beaches 6 Moderate priority system repair Rocky Dam Creek 23 Moderate priority system repair Repulse Creek 0 Protect and Maintain Cape Creek 0 Protect and Maintain Eden Lassie CreeK 0 Protect and Maintain Gregory river 10 Protect and Maintain Whitsunday Coast 1 Protect and Maintain
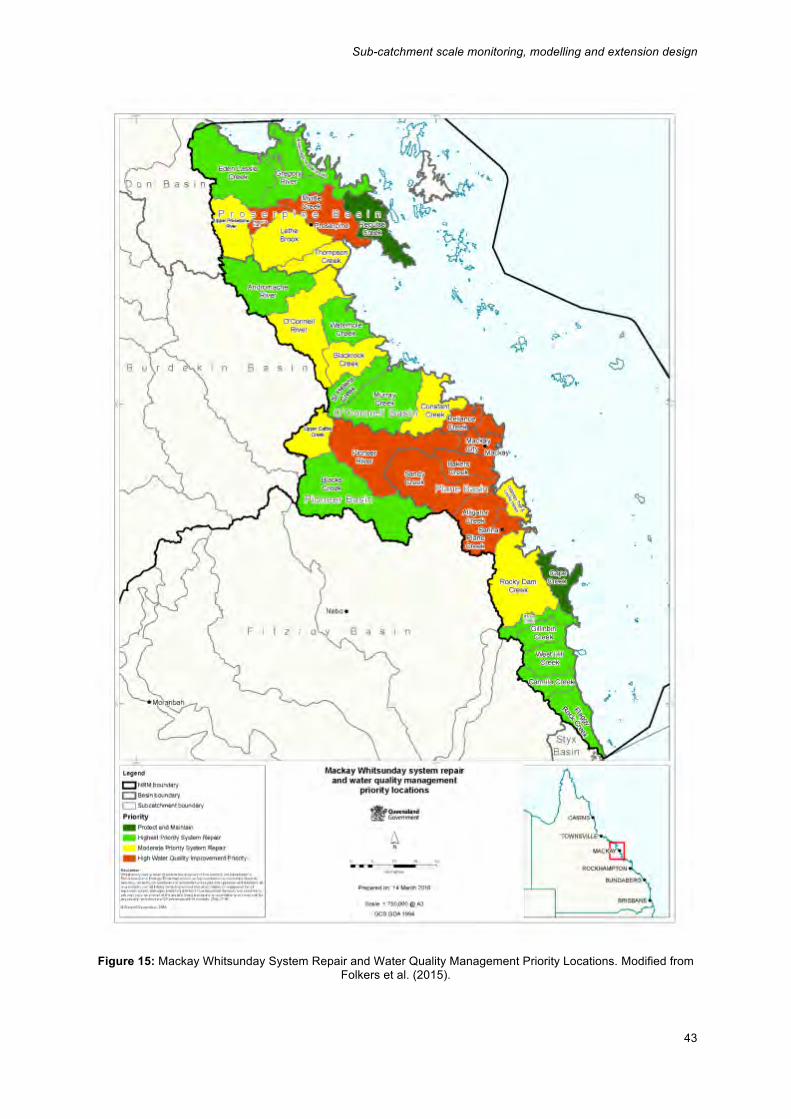
Sub-catchment scale monitoring, modelling and extension design
43
Figure 15: Mackay Whitsunday System Repair and Water Quality Management Priority Locations. Modified from
Folkers et al. (2015).
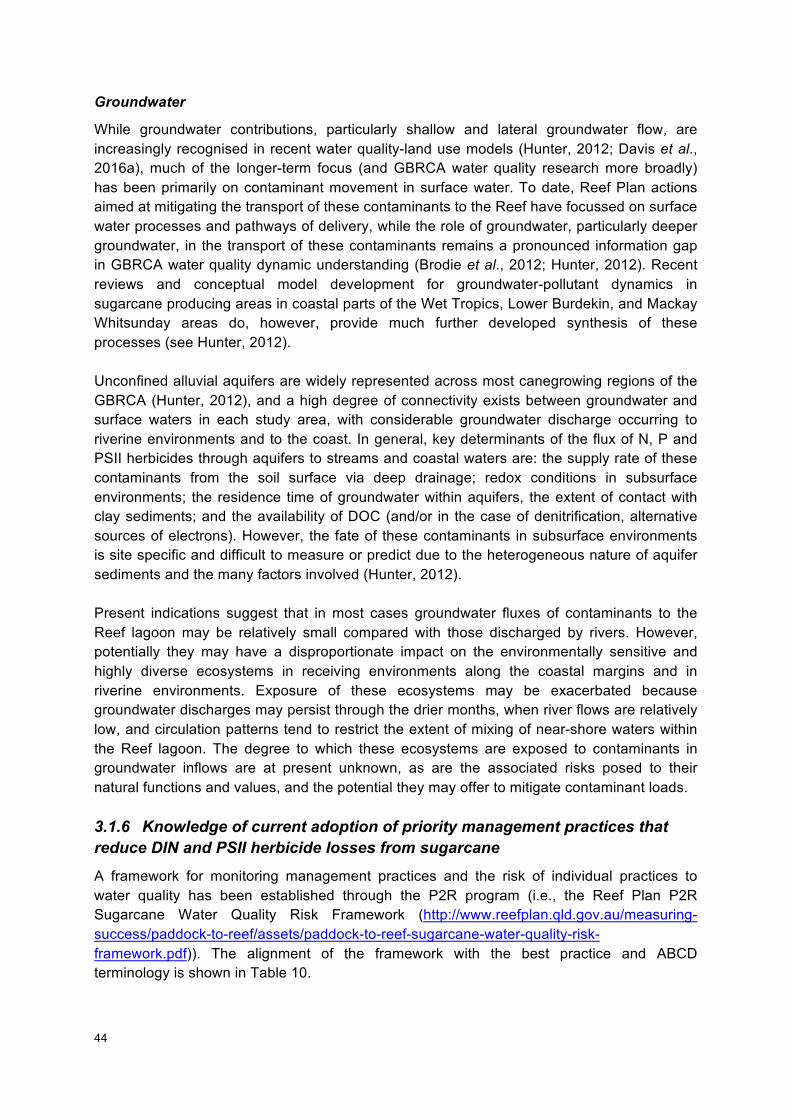
44
Groundwater
While groundwater contributions, particularly shallow and lateral groundwater flow, are increasingly recognised in recent water quality-land use models (Hunter, 2012; Davis et al., 2016a), much of the longer-term focus (and GBRCA water quality research more broadly) has been primarily on contaminant movement in surface water. To date, Reef Plan actions aimed at mitigating the transport of these contaminants to the Reef have focussed on surface water processes and pathways of delivery, while the role of groundwater, particularly deeper groundwater, in the transport of these contaminants remains a pronounced information gap in GBRCA water quality dynamic understanding (Brodie et al., 2012; Hunter, 2012). Recent reviews and conceptual model development for groundwater-pollutant dynamics in sugarcane producing areas in coastal parts of the Wet Tropics, Lower Burdekin, and Mackay Whitsunday areas do, however, provide much further developed synthesis of these processes (see Hunter, 2012). Unconfined alluvial aquifers are widely represented across most canegrowing regions of the GBRCA (Hunter, 2012), and a high degree of connectivity exists between groundwater and surface waters in each study area, with considerable groundwater discharge occurring to riverine environments and to the coast. In general, key determinants of the flux of N, P and PSII herbicides through aquifers to streams and coastal waters are: the supply rate of these contaminants from the soil surface via deep drainage; redox conditions in subsurface environments; the residence time of groundwater within aquifers, the extent of contact with clay sediments; and the availability of DOC (and/or in the case of denitrification, alternative sources of electrons). However, the fate of these contaminants in subsurface environments is site specific and difficult to measure or predict due to the heterogeneous nature of aquifer sediments and the many factors involved (Hunter, 2012). Present indications suggest that in most cases groundwater fluxes of contaminants to the Reef lagoon may be relatively small compared with those discharged by rivers. However, potentially they may have a disproportionate impact on the environmentally sensitive and highly diverse ecosystems in receiving environments along the coastal margins and in riverine environments. Exposure of these ecosystems may be exacerbated because groundwater discharges may persist through the drier months, when river flows are relatively low, and circulation patterns tend to restrict the extent of mixing of near-shore waters within the Reef lagoon. The degree to which these ecosystems are exposed to contaminants in groundwater inflows are at present unknown, as are the associated risks posed to their natural functions and values, and the potential they may offer to mitigate contaminant loads. 3.1.6 Knowledge of current adoption of priority management practices that reduce DIN and PSII herbicide losses from sugarcane A framework for monitoring management practices and the risk of individual practices to water quality has been established through the P2R program (i.e., the Reef Plan P2R Sugarcane Water Quality Risk Framework (http://www.reefplan.qld.gov.au/measuring-success/paddock-to-reef/assets/paddock-to-reef-sugarcane-water-quality-risk-framework.pdf)). The alignment of the framework with the best practice and ABCD terminology is shown in Table 10.
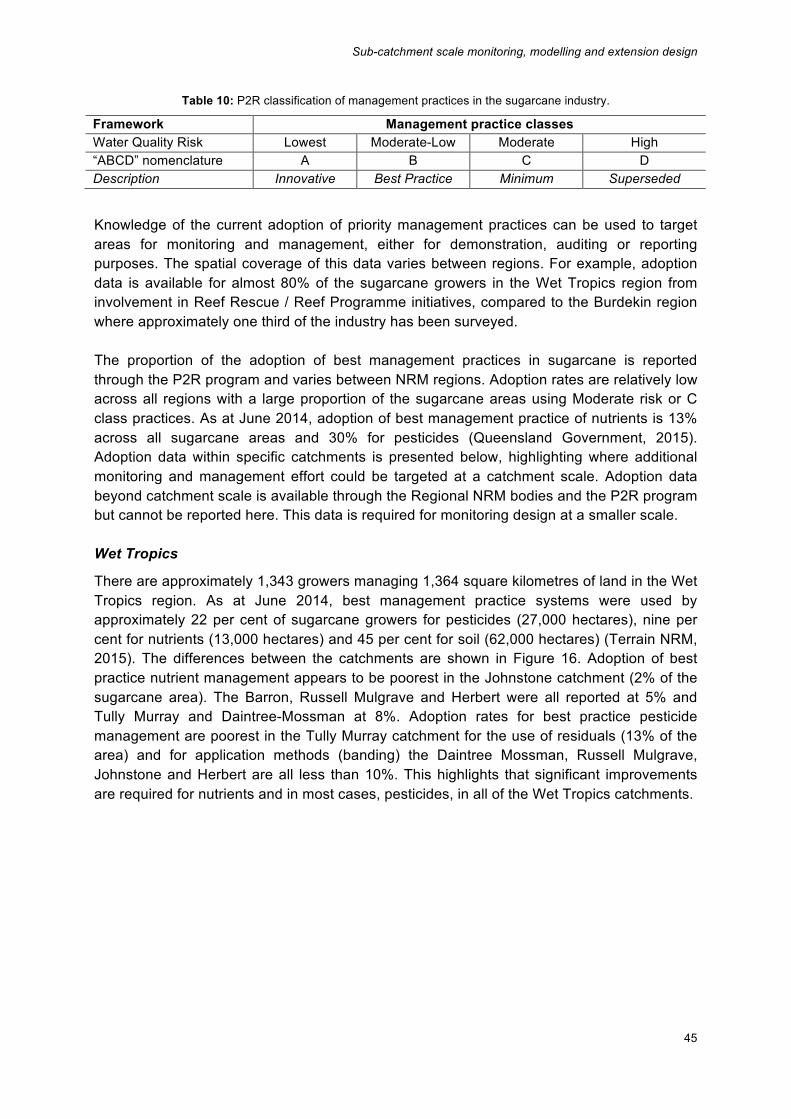
Sub-catchment scale monitoring, modelling and extension design
45
Table 10: P2R classification of management practices in the sugarcane industry.
Framework Management practice classes Water Quality Risk Lowest Moderate-Low Moderate High “ABCD” nomenclature A B C D Description Innovative Best Practice Minimum Superseded
Knowledge of the current adoption of priority management practices can be used to target areas for monitoring and management, either for demonstration, auditing or reporting purposes. The spatial coverage of this data varies between regions. For example, adoption data is available for almost 80% of the sugarcane growers in the Wet Tropics region from involvement in Reef Rescue / Reef Programme initiatives, compared to the Burdekin region where approximately one third of the industry has been surveyed. The proportion of the adoption of best management practices in sugarcane is reported through the P2R program and varies between NRM regions. Adoption rates are relatively low across all regions with a large proportion of the sugarcane areas using Moderate risk or C class practices. As at June 2014, adoption of best management practice of nutrients is 13% across all sugarcane areas and 30% for pesticides (Queensland Government, 2015). Adoption data within specific catchments is presented below, highlighting where additional monitoring and management effort could be targeted at a catchment scale. Adoption data beyond catchment scale is available through the Regional NRM bodies and the P2R program but cannot be reported here. This data is required for monitoring design at a smaller scale. Wet Tropics
There are approximately 1,343 growers managing 1,364 square kilometres of land in the Wet Tropics region. As at June 2014, best management practice systems were used by approximately 22 per cent of sugarcane growers for pesticides (27,000 hectares), nine per cent for nutrients (13,000 hectares) and 45 per cent for soil (62,000 hectares) (Terrain NRM, 2015). The differences between the catchments are shown in Figure 16. Adoption of best practice nutrient management appears to be poorest in the Johnstone catchment (2% of the sugarcane area). The Barron, Russell Mulgrave and Herbert were all reported at 5% and Tully Murray and Daintree-Mossman at 8%. Adoption rates for best practice pesticide management are poorest in the Tully Murray catchment for the use of residuals (13% of the area) and for application methods (banding) the Daintree Mossman, Russell Mulgrave, Johnstone and Herbert are all less than 10%. This highlights that significant improvements are required for nutrients and in most cases, pesticides, in all of the Wet Tropics catchments.
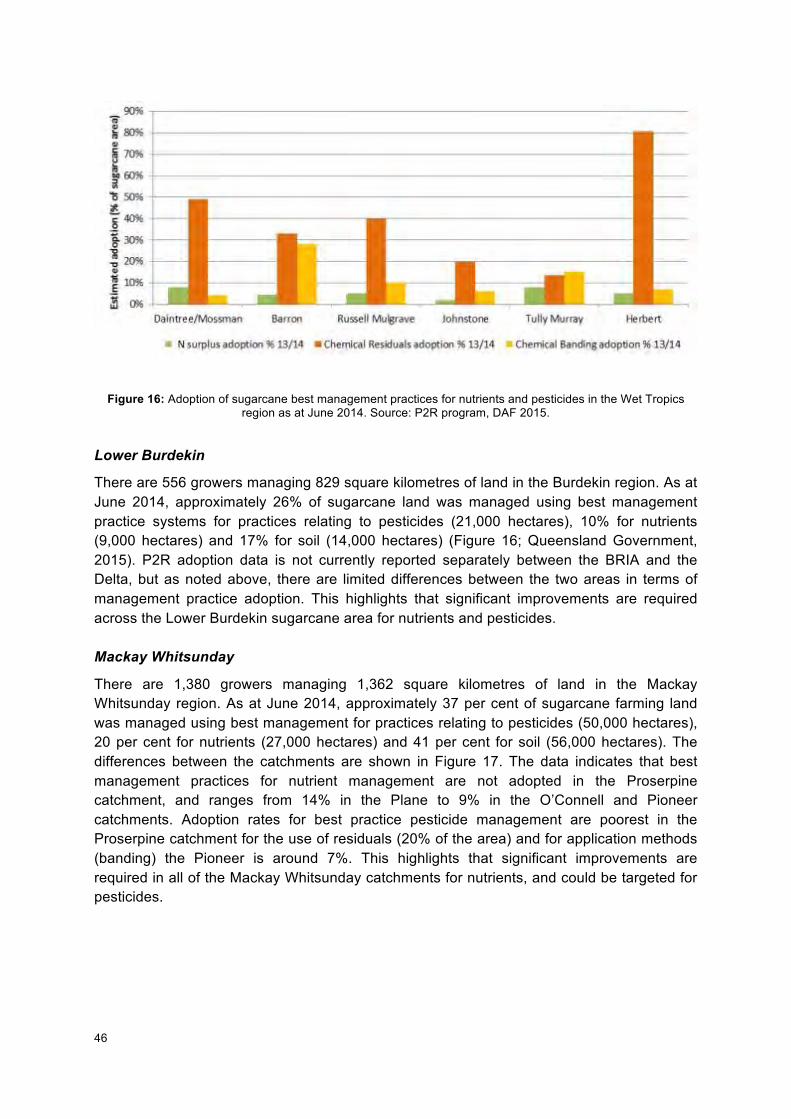
46
Figure 16: Adoption of sugarcane best management practices for nutrients and pesticides in the Wet Tropics region as at June 2014. Source: P2R program, DAF 2015.
Lower Burdekin
There are 556 growers managing 829 square kilometres of land in the Burdekin region. As at June 2014, approximately 26% of sugarcane land was managed using best management practice systems for practices relating to pesticides (21,000 hectares), 10% for nutrients (9,000 hectares) and 17% for soil (14,000 hectares) (Figure 16; Queensland Government, 2015). P2R adoption data is not currently reported separately between the BRIA and the Delta, but as noted above, there are limited differences between the two areas in terms of management practice adoption. This highlights that significant improvements are required across the Lower Burdekin sugarcane area for nutrients and pesticides. Mackay Whitsunday
There are 1,380 growers managing 1,362 square kilometres of land in the Mackay Whitsunday region. As at June 2014, approximately 37 per cent of sugarcane farming land was managed using best management for practices relating to pesticides (50,000 hectares), 20 per cent for nutrients (27,000 hectares) and 41 per cent for soil (56,000 hectares). The differences between the catchments are shown in Figure 17. The data indicates that best management practices for nutrient management are not adopted in the Proserpine catchment, and ranges from 14% in the Plane to 9% in the O’Connell and Pioneer catchments. Adoption rates for best practice pesticide management are poorest in the Proserpine catchment for the use of residuals (20% of the area) and for application methods (banding) the Pioneer is around 7%. This highlights that significant improvements are required in all of the Mackay Whitsunday catchments for nutrients, and could be targeted for pesticides.
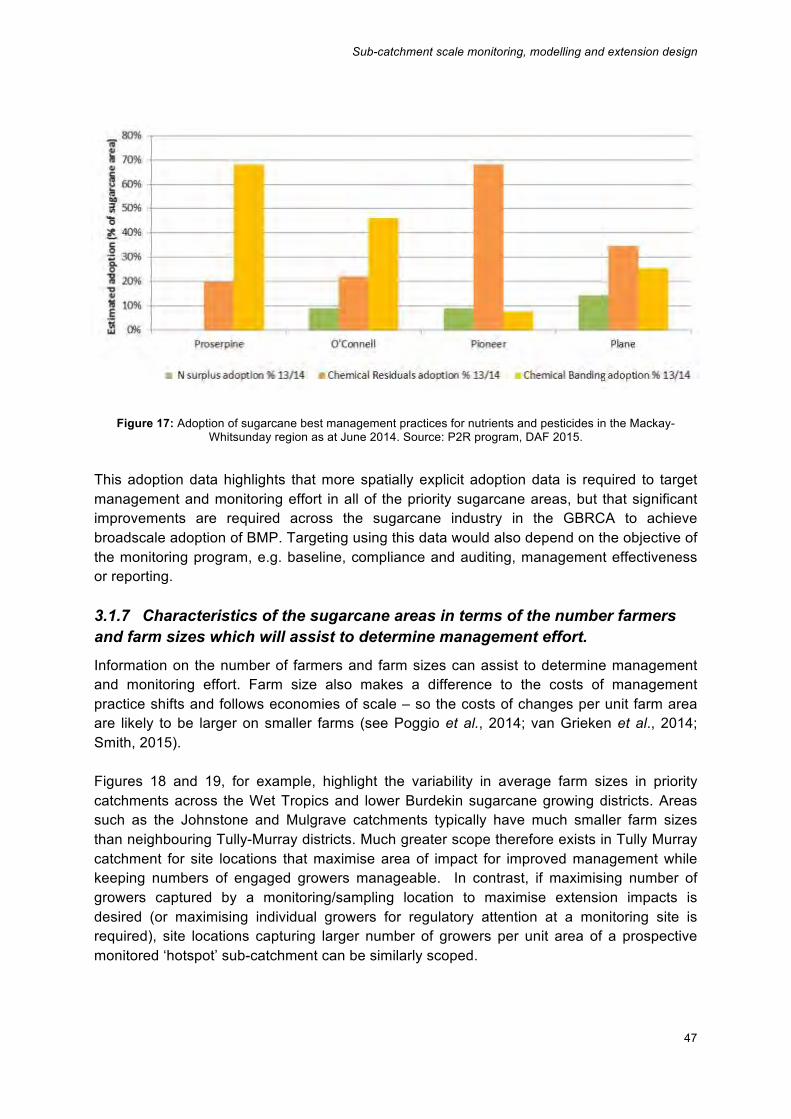
Sub-catchment scale monitoring, modelling and extension design
47
Figure 17: Adoption of sugarcane best management practices for nutrients and pesticides in the Mackay-Whitsunday region as at June 2014. Source: P2R program, DAF 2015.
This adoption data highlights that more spatially explicit adoption data is required to target management and monitoring effort in all of the priority sugarcane areas, but that significant improvements are required across the sugarcane industry in the GBRCA to achieve broadscale adoption of BMP. Targeting using this data would also depend on the objective of the monitoring program, e.g. baseline, compliance and auditing, management effectiveness or reporting. 3.1.7 Characteristics of the sugarcane areas in terms of the number farmers and farm sizes which will assist to determine management effort.
Information on the number of farmers and farm sizes can assist to determine management and monitoring effort. Farm size also makes a difference to the costs of management practice shifts and follows economies of scale – so the costs of changes per unit farm area are likely to be larger on smaller farms (see Poggio et al., 2014; van Grieken et al., 2014; Smith, 2015). Figures 18 and 19, for example, highlight the variability in average farm sizes in priority catchments across the Wet Tropics and lower Burdekin sugarcane growing districts. Areas such as the Johnstone and Mulgrave catchments typically have much smaller farm sizes than neighbouring Tully-Murray districts. Much greater scope therefore exists in Tully Murray catchment for site locations that maximise area of impact for improved management while keeping numbers of engaged growers manageable. In contrast, if maximising number of growers captured by a monitoring/sampling location to maximise extension impacts is desired (or maximising individual growers for regulatory attention at a monitoring site is required), site locations capturing larger number of growers per unit area of a prospective monitored ‘hotspot’ sub-catchment can be similarly scoped.
48
3.1.8 Other regionally specific social and economic characteristics that may influence the losses of DIN and PSII herbicide loads from sugarcane areas (e.g. costs, farmer involvement in incentive programs). There are several factors that may affect a sugarcane farmer’s management adoption decisions. For example, in a recent study by Thompson et al. (2014) (based on the results of 61 farmer surveys in Ayr (30), Ingham (26) and Tully (5)), potential constraints to adoption of variable nutrient rates within blocks included high capital investment and the requirement for new skills, and a perceived negative impact on farm profitability. Perceptions of the impact on farm profitability and compatibility with existing farming practices were critical factors impacting on the adoption decision. Socio-economic factors as well farm characteristics were generally found to be insignificant in determining an adoption decision. However, a proportionally higher amount of younger farmers (aged 45 or less) were found to have adopted best management practices. It is also acknowledged that growers will be unlikely to adopt new practices that import high risks to farm production and profitability (see Smith et al., 2012; Smith et al., 2014; Poggio et al., 2014). Adverse weather conditions, incursions of disease, as well as increases in fixed costs have applied pressure on grower margins which is likely to influence management decisions (Smith et al., 2014). Farm size can also influence management choices and has a bearing on the cost effectiveness of management practice changes. As noted above, targeting monitoring and management using this data would depend on the objective of the monitoring program, e.g. baseline, compliance and auditing, management effectiveness or reporting. For example, in the interest of economic feasibility, the farm size data presented in Figure 18 could be used to target sub-catchments with larger farm sizes and lower number of growers. This would mean a potentially lower expenditure of resources for engagement-extension purposes over the life of the monitoring program, and potentially targeting a larger land area for implementing practice changes. As management change is more cost-effective on larger properties (see Poggio et al., 2014; van Grieken et al., 2014; Smith, 2015), the likelihood of facilitating practice changes by growers that requires significant expenditure will be highest on larger farming enterprises.
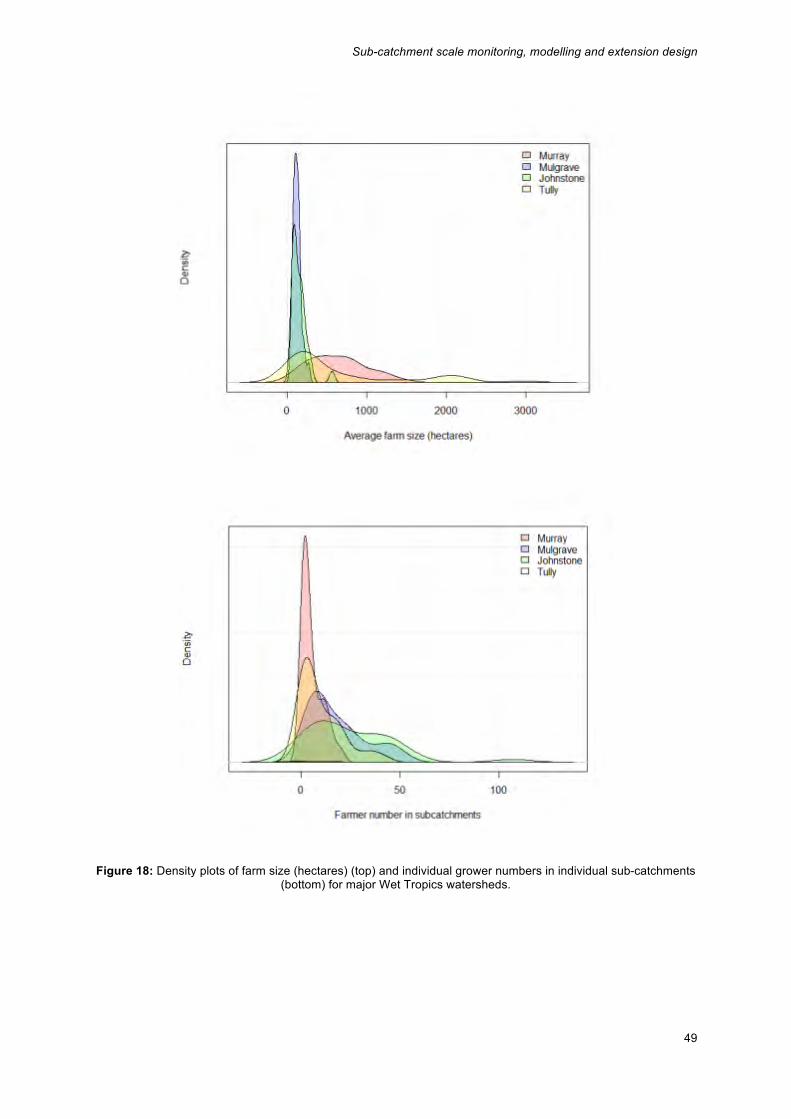
Sub-catchment scale monitoring, modelling and extension design
49
Figure 18: Density plots of farm size (hectares) (top) and individual grower numbers in individual sub-catchments (bottom) for major Wet Tropics watersheds.
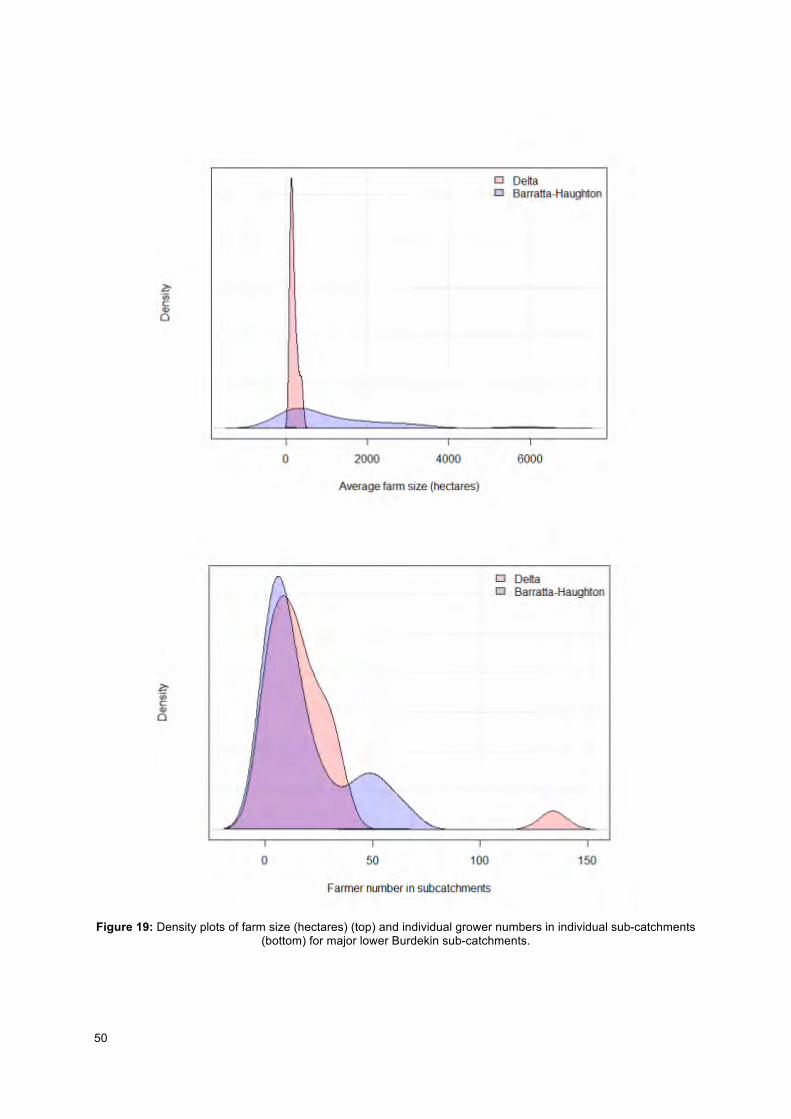
50
Figure 19: Density plots of farm size (hectares) (top) and individual grower numbers in individual sub-catchments
(bottom) for major lower Burdekin sub-catchments.
Sub-catchment scale monitoring, modelling and extension design
51
3.1.9 Setting objectives Using the information summarised above, and given that broader issues, indicators, processes and ecological responses have been largely defined, an overall program objective can be defined as:
To implement finer scale water quality monitoring capable of identifying pollutant generation hotspots in sugarcane growing catchments in the Great Barrier Reef catchment area, and to use this monitoring to support future water quality monitoring-modelling, and industry extension and engagement initiatives.
Specific objectives will depend on the purpose of the monitoring which may include the following activities at a sub-catchment scale:
1. Monitoring carried out to identify (and quantify) site specific sources and runoff of DIN and PSII herbicides from the landscape to waterways for specific waterways (in conjunction with farmers for subsequent extension activities to improve management practices).
2. Monitoring carried out to understand the spatial and temporal range of water quality parameters important to aquatic ecosystem health in water bodies at a range of scales (background / baseline information). This can be used to: Assess natural variability of water quality parameters in time and space; design a monitoring program in which the “management” signal (the result we are seeking) can be separated from the noise (the natural variability); and gather reference site data to design water quality guidelines or criteria.
3. Monitoring carried out to determine whether management intervention to reduce DIN and PSII sources is changing contaminant concentration/ loadings. This normally has a trend or comparison element, such as a comparison data from before the intervention was implemented and may also be used to support extension services.
These monitoring outcomes will need to be coupled with modelling to account for climate variability between years, and to extrapolate the data across larger geographic scales. This integrated monitoring and modelling approach is already embedded in the P2R program design and is discussed further in Section 3.6 of this report.
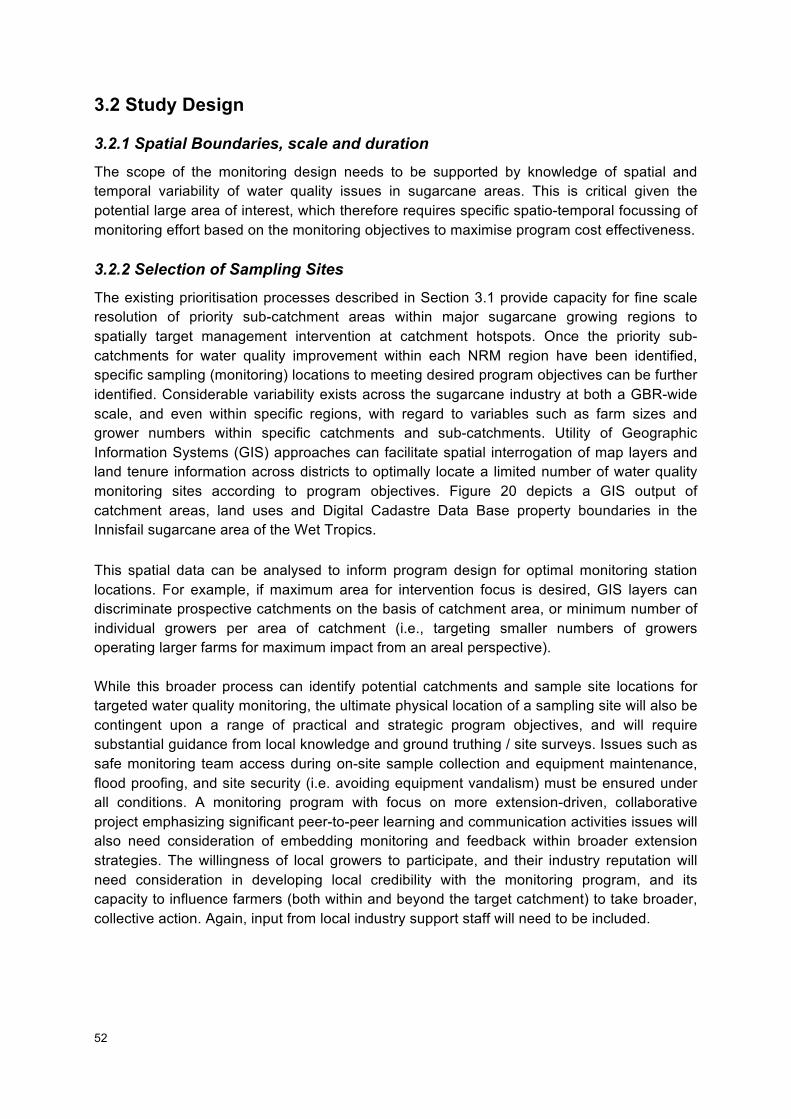
52
3.2 Study Design
3.2.1 Spatial Boundaries, scale and duration The scope of the monitoring design needs to be supported by knowledge of spatial and temporal variability of water quality issues in sugarcane areas. This is critical given the potential large area of interest, which therefore requires specific spatio-temporal focussing of monitoring effort based on the monitoring objectives to maximise program cost effectiveness. 3.2.2 Selection of Sampling Sites The existing prioritisation processes described in Section 3.1 provide capacity for fine scale resolution of priority sub-catchment areas within major sugarcane growing regions to spatially target management intervention at catchment hotspots. Once the priority sub-catchments for water quality improvement within each NRM region have been identified, specific sampling (monitoring) locations to meeting desired program objectives can be further identified. Considerable variability exists across the sugarcane industry at both a GBR-wide scale, and even within specific regions, with regard to variables such as farm sizes and grower numbers within specific catchments and sub-catchments. Utility of Geographic Information Systems (GIS) approaches can facilitate spatial interrogation of map layers and land tenure information across districts to optimally locate a limited number of water quality monitoring sites according to program objectives. Figure 20 depicts a GIS output of catchment areas, land uses and Digital Cadastre Data Base property boundaries in the Innisfail sugarcane area of the Wet Tropics. This spatial data can be analysed to inform program design for optimal monitoring station locations. For example, if maximum area for intervention focus is desired, GIS layers can discriminate prospective catchments on the basis of catchment area, or minimum number of individual growers per area of catchment (i.e., targeting smaller numbers of growers operating larger farms for maximum impact from an areal perspective). While this broader process can identify potential catchments and sample site locations for targeted water quality monitoring, the ultimate physical location of a sampling site will also be contingent upon a range of practical and strategic program objectives, and will require substantial guidance from local knowledge and ground truthing / site surveys. Issues such as safe monitoring team access during on-site sample collection and equipment maintenance, flood proofing, and site security (i.e. avoiding equipment vandalism) must be ensured under all conditions. A monitoring program with focus on more extension-driven, collaborative project emphasizing significant peer-to-peer learning and communication activities issues will also need consideration of embedding monitoring and feedback within broader extension strategies. The willingness of local growers to participate, and their industry reputation will need consideration in developing local credibility with the monitoring program, and its capacity to influence farmers (both within and beyond the target catchment) to take broader, collective action. Again, input from local industry support staff will need to be included.
Sub-catchment scale monitoring, modelling and extension design
53
Figure 20: GIS plot of catchment boundaries, land use (sugarcane cultivation) and land tenure (sourced from Qspatial: http://qldspatial.information.qld.gov.au/catalogue/custom/index.page).
54
Given the high costs associated with water quality monitoring, monitoring programs should be optimised with regard to specific location of sampling site networks. While ideally, all sugarcane growing districts in the GBRCA would be included, funding constraints dictate effort will have to be focused on a smaller number of priority catchments/regions. Again, a range of recent GBRCA initiatives (such as WQIPs) can provide valuable context to a hierarchical spatial prioritisation of pollutant generation hotspots relating to GBR sugarcane cultivation. 3.2.3 Temporal Scope of Study (monitoring duration) Given the variability of natural rainfall and hence streamflow characteristic of the GBRCA (Kennard et al., 2012) (see Figure 8 and 9), the monitoring duration required for appropriate understanding of targeted systems is likely to be substantial, but an important decision in program design. Few hydrologists or water quality scientists would make definitive statements on the quality of water resources with data from only two or three years, yet frequently conclusions from water quality studies are expected in these time frames. Recent global experiences on similar catchment scale monitoring-management programs suggest that unless adequate monitoring is planned for many years, water quality monitoring should not be implemented. Water quality monitoring requires significant technical expertise and financial resources over a long period of time due to the variability of water quality data and lag times associated with pollutant removal from the water resource (Meals et al., 2010). The periodicity of major climatic cycles, as well as market forces and (often slow) rates of farmer BMP adoption means that monitoring programs need to span many years to detect changes caused by farmer actions. As field, farm, and watershed level response to improved practice implementation can take several years to be fully manifested, site monitoring typically occurs for a minimum of five years before reliable water quality response changes can be documented (Osmond et al., 2012; Wilcock et al., 2013; Sharpley et al., 2015). Project resources may be wasted on inadequate monitoring that fails to meet project objectives. Unless adequate water quality and land treatment and use monitoring is planned for many years, including pre-improved practice baseline monitoring, improved practice change implementation projects should not conduct water quality monitoring because they would be unlikely to document ‘typical conditions’, let alone document water quality change (Sharpley et al., 2015).
3.2.4 Sampling Collection Methods and Sampling Frequency
Water quality monitoring can be undertaken through a number of data acquisition methods that vary greatly in their technological requirements and sampling resolution, including:
• collection of a discrete sample by hand (manual sampling);
• collection of discrete samples by automatic or rising stage samplers;
• samplers that collect and integrate samples over a given time (i.e., ‘composited samples’);
• real-time, continuous measurement by automatic means;
• measurements in the field by hand; and
• remote sensing.
Sub-catchment scale monitoring, modelling and extension design
55
The choice of sampling method depends on the objectives of the monitoring program, parameter to be measured and the nature of the information required. The various sampling methods outlined above can provide differing information and have differing advantages and drawbacks (NWQMS, 2003; ANZECC and ARMCANZ, 2003). For decades, both in the GBRCA and more broadly, sample collection and/or field measurements for water quality evaluation have depended upon costly, time- and labour-intensive on-site sampling and data collection. Much sampling in the GBR loads program, for example, has been based on manual and automated discrete sampling at gauging stations, with collected samples then analysed in laboratories (Wallace et al., 2014). This not only gives limited point measurements but also become an expensive method for remote sites (Glasgow et al., 2004). Sampling frequency (samples/unit time during specific events) is a particularly important element of monitoring designs, and usually represents a balance between available resources and acceptable estimation-measurement errors that still permit sound policy/management decisions. Clear linkages exist between many water-quality parameters and discharge, with the greatest fluxes of sediments, nutrients and chemical constituents dominated by high flow events, regardless of river size. Hence, to encompass the range of water-quality conditions extant at a site, and to capture high-flow effects, sampling should cover some 80−85% of the local annual range of discharge, and as many high-flow events as practicable (Horowitz, 2013). As basin size decreases, and high-flow events are of shorter duration (i.e., “flashier”) and changes in discharge and pollutant concentrations occur over shorter periods, sampling frequency also has to increase to generate acceptable flux estimates and/or concentration ranges (Horowitz, 2013), situations which pose considerable challenges to manual sample collection. Increased sampling engenders greater field/laboratory costs, and eventually, sampling frequencies, either because of system size and/or requisite temporal resolution, are beyond the scope of manual sampling. The specific intended usage of collected data also influences appropriate sampling methodology, sample collection frequency and equipment. In circumstances where linking water quality changes to specific on-farm management practices, discrete (grab) sampling approaches with long extended turnaround times between sample collection, laboratory analysis and reporting may limit the ability for water quality data to inform suitable changes on-farm within a short turn-around time, and also limit stakeholder perceptions of farm practice-water quality linkages. Emerging RTWQM technologies
Due to many of these inherent limitations of discrete sample collection techniques (whether manual or automated), many water monitoring programs have shifted towards continuous measurements using in situ sensors (Zia et al., 2013; Pellerin et al., 2016). While continuous in situ monitoring of water quality parameters such as conductivity, pH and temperature has been common for some time, recent advances in sensor and communication technologies has greatly expanded the suite of parameters that can be monitored in ‘real time’. Real-time water quality monitoring (RTWQM) is emerging as an attractive and effective water quality monitoring approach, and is being increasingly employed for monitoring of both surface and ground water across multiple spatial scales (Owen et al., 2012; Outram et al., 2014; Shoda et al. 2015), and have been valuable in advancing the knowledge of contaminant trends through their high resolution observations.
56
RTWQM is also seen as having significant potential to impact management and control decisions in agricultural contexts, providing a solid basis for farmers to adjust strategies at any time. If water quality information is fed back to the identified stakeholder in real time, in an autonomous and dynamic manner, there is the potential to control or minimise the fluxes emanating from a location (Ruiz-Garcia et al., 2009; Zia et al., 2013). There seems considerable potential for leveraging existing networked agricultural monitoring technologies (traditionally focussed on agronomic data such as soil moisture, climate, irrigation management) into an integrated water quality management mechanism (Zia et al., 2013). Pilot GBRCA RTWQM deployment projects, such as ‘Project NEMO’ and ‘A sub-catchment, adaptive management approach to water quality in sugarcane’, are already being undertaken in sugarcane districts within the GBRCA (see Burton et al., 2014). During these projects, key water quality parameters such as nitrate - N (NO3-N), total suspended solids (TSS), chemical oxygen demand (COD), electrical conductivity (EC) and flow volume were monitored by sensor technologies and conveyed via telecommunication to a purpose-built, password protected web site. This water quality information (collected hourly and displayed in ‘real-time’), was reviewed by project staff and any anomalies (spikes) in any of the key parameters were relayed back to the sub-catchment farmers for their information, thus providing them with an opportunity to relate their recent farm management activities with local catchment water quality results. While specific water quality improvements resulting from practice changes were not assessed, a range of on-farm practice improvements were elicited by local landholder engagement with monitoring data (Burton et al., 2014). While promising, these RTWQM applications have yet to explore in depth the implementation and impact of this technology for management and control decisions, to minimise and prevent individual stakeholder’s contributions. They do, however, provide useful ‘proof-of-concept’ and pilot demonstration of the practicalities and project design and management considerations of RTWQM approaches. Despite the considerable opportunities offered by integration of RTWQM capacity into monitoring programs, limitations do exist, particularly with regard to availability of useable sensors for several of key water quality parameters in GBR sugarcane growing catchments. A number of parameters of direct relevance to the GBRCA such as various forms of inorganic nitrogen (nitrate, nitrite; ‘oxidised nitrogen’) and phosphorus are already well established constituents in RTWQM initiatives, including in the GBRCA. Recent research at paddock and catchment scale in the GBRCA suggests expanding the monitoring suite beyond oxidised nitrogen forms may, however, be warranted in future RTWQM initiatives, or the analytical limitations or current technologies at least be recognised. Ammonium, rather than nitrate, for example, is often the dominant inorganic nitrogen form leaving canefields and catchments in some major sugarcane growing regions of the GBRCA, particularly in the Wet Tropics (Pearson et al., 2003; Cowie et al., 2013; O’Brien et al., 2013). This is a parameter for which field deployable sensors are available, and which has already been integrated into some RTWQM program designs (see Di Blasi et al., 2013), but has as yet received little practical attention in the GBRCA. Un-degraded fertiliser urea is similarly another ‘inorganic’ nitrogen form that can dominate dissolved inorganic nitrogen export losses at paddock scales if major rainfall or irrigation occurs soon after fertiliser application (Davis et al., 2016b).
Sub-catchment scale monitoring, modelling and extension design
57
Practical considerations with emerging RTWQM technology applications
While optical sensors are sufficiently developed to warrant broader application, they still represent an emerging-developing technology. Practical guidelines for instrument selection, deployment and collection methods for data quality assurance, control, and management are accordingly still under development, even in countries with comparatively long-standing experiences and broad scale RTWQM deployments (see Snazelle, 2011; 2015; Pellerin et al. 2013; Rozin, 2014). Of particular recent interest is the application of ultraviolet (UV) photometers for the in situ determination of nitrate concentrations in surface waters. UV nitrate sensors have been used during the past few decades for wastewater monitoring, as well as for coastal and oceanographic studies, but are only recently being applied in freshwater monitoring. All the UV nitrate sensors presently available operate on the same basic principle–the absorbance of light by nitrate at a specific wavelength is measured by a photometer and converted to a nitrate concentration. The variety of UV nitrate sensors currently available, however, can vary significantly in several important ways that affect the accuracy of their nitrate concentration measurements, and ultimately their suitability for deployment in different types of natural waters (Pellerin et al., 2013). Several commercially available in situ optical sensors (including the TriOS ProPS, the Hach NITRATAX plus sc, the Satlantic Submersible Ultraviolet (UV) Nitrate Analyzer (SUNA), and the S::CAN Spectrolyser) have been subject to a range of laboratory and field comparisons in recent U.S. studies (Pellerin et al., 2013). Units such as the TriOS ProPS and Satlantic SUNA are also already being deployed in various water quality monitoring applications across the GBRCA (Burton et al., 2014; Wallace et al., 2014). The considerably more advanced state of instrument laboratory and field testing and deployment experiences from other countries can provide useful guidelines for future RTWQM programs in the GBRCA context. The specific path length of the sensor (i.e. the distance from the emitting UV light source lamp to the detecting spectrometer) plays a critical role in determining instrument sensitivity, detection ranges and how well the instrument compensates for interferences such as turbidity. In general, a shorter path length will limit the sensitivity of the analyzer for low concentrations, but will generally increase the nitrate detection range and minimize adverse effects from high turbidity and suspended sediment. A longer path length will conversely provide greater sensitivity for low-level concentrations, but will reduce the detection range and increase the effect of interferences. Analyzers differ in their light sources, optical configuration, communication protocols, antifouling measures, and algorithms used to compute nitrate from the UV absorbance of the water sample. Some instruments have capacity to modify features such as path lengths, some models have fixed path lengths, but some are available with a range of variable, fixed path length options (Pellerin et al., 2013). More detailed and complete overviews of specific sensor instrument performance and comparison are available than will be covered in this report. A range of key outcomes have, however, emerged from US RTWQM experiences. Like many types of analytical equipment, there are trade-offs in instrument performance. Manufacturing specifications may be exaggerated in some areas, and are often derived from optimal unit performance that may not be reproducible in typical field applications. As in the laboratory with variability in analytical performance between instruments, potential inter-sensor differences cannot be disregarded.
58
Some of the more critical learnings relate to instrument performance in field conditions due to the potential confounding influence of other constituents in the water (Pellerin et al., 2013; 2016). To accurately measure nitrate optically in natural waters, it is critical to account for light-absorbing or light-scattering materials present in the sample that interfere with light transmission to a detector. Collectively, these are known as “matrix effects” because they result from properties of the matrix in which the measurement of nitrate is being made. Differences in instrument design (path length, lamp output, and detector wavelengths) and in spectral processing algorithms are key to correcting for particular interferences (Pellerin et al., 2013). The two principal matrix effects—those from dissolved substances and suspended particles—have considerable potential to influence sensor performance. A number of dissolved constituents absorb light in the same UV wavelength range used to calculate nitrate concentrations. These include inorganic constituents, such as bromide, hydrogen sulfide, and nitrite, as well as colored dissolved organic matter (CDOM), such as humic and fulvic acids. The presence of these constituents reduces the transmittance of light through a sample and can result in an overestimate of nitrate if not accounted for because the absolute turbidities at which a UV nitrate sensor can operate depend on the turbidity sensor being used and the type of interfering particles (that is, inorganic versus organic). Scattering of light by inorganic suspended material in the optical path also reduces the light reaching the detector and, therefore, can result in an overestimate of sample absorbance (Roesler, 1998). Scattering by inorganic particles is generally assumed to be uniform across the UV and visible range and, therefore, is unlikely to affect nitrate concentrations calculated from the shape of the absorption curve rather than the absolute magnitude. At high suspended-particle concentrations, however, the signal-to-noise ratio decreases, and transmittance ultimately approaches zero. The effects of particles on nitrate calculations can be significant and varies between instrument types. Laboratory comparisons of UV nitrate sensors in solutions of varying inorganic sediment concentrations showed the tendency to both over and underestimate nitrate concentrations at high turbidity (Pellerin et al., 2013). Laboratory testing has also highlighted failures to detect nitrate in some instruments at higher turbidities (> 500 nephelometric turbidity units (NTU)), presumably due to insufficient light reaching the detector. The solute turbidities at which a UV nitrate sensor can operate are variable, depending on the turbidity sensor being used and the type of interfering particles (that is, inorganic versus organic). Individual sensor selection for a particular study can be determined by the expected range in nitrate and matrix elements (such as DOC and suspended sediments), study specifications, or reporting limits for accuracy and precision, and logistical constraints. Differences among instruments, such as path lengths and wavelengths measured, are critical features that affect data quality and can be considered along with design differences that affect the depth rating, temperature rating, and maintenance. It is important to understand potential matrix interferences and adequately match application to instrument performance when choosing an appropriate method (Rozin et al., 2014). Several recommendations can be made to advance the performance of optical nitrate sensors when met with unspecified matrix effects and optical interferences including turbidity and CDOM. Sensors should certainly be vetted thoroughly in the laboratory prior to field deployment with the expected range of nitrate concentrations and interferences. Ideally, testing should be completed with reference materials that are reflective of natural waters (Pellerin et al., 2013; Rozin, 2014). Users can also consider performing periodic checks with nitrate standard added to matrix waters, which
Sub-catchment scale monitoring, modelling and extension design
59
will be particularly important in systems where matrix effects are expected to vary significantly with time. This approach was adopted as a small adjunct component of this project, with a range of nitrate spikes added to different turbidity waters collected across the GBRCA, with sensor testing conducted under laboratory conditions (detailed results reported in Appendix 1). Testing of this DSITI-owned SUNA sensor across a range of turbidity-nitrate concentrations indicated the sensor typically performed within the manufacturer stated accuracy specifications (±10% of expected reading or ±0.03–0.06 mg/L, whichever is greater). Pre-deployment laboratory testing under likely field conditions (expected nitrate, temperature and turbidity ranges) of sensors is critical, as instrument performance issues likely difficult to diagnose from field results can be identified prior to field deployment (see Snazelle, 2015). Testing should also occur under field conditions, however, the inherent difficulty in performing a controlled matrix spike under field conditions—particularly to evaluate the effects of suspended particles—could preclude this test from being performed in the field by most users. Periodic in situ collections of discrete samples for subsequent laboratory testing and comparisons with RTWQM results should be a critical component of any RTWQM program (Snazelle, 2015). These caveats are not outlined to undermine the application of RTWQM technologies, but simply to highlight (like any monitoring technique), the considerable investment and attention to appropriate protocol required to ensure optimal performance. There is consensus that the real-time capabilities of optical sensors can surpass wet chemical methods on the scale of scientific questions that are possible to address (Rozin et al., 2014). Emerging technologies for pesticide monitoring
Pesticides, particularly herbicides, are the other major parameter of concern in waters draining canelands (Reef Water Quality Protection Plan Secretariat, 2013), and are an analyte that poses a range of methodological, sampling, analytical and financial challenges for water quality monitoring programs. Most previous pesticide monitoring effort in the GBR has relied on traditional discrete manual or automated water sampling (Lewis et al., 2009; Wallace et al., 2014). Due to limitations in sensor technologies, RTWQM approaches for pesticides are entirely absent, and likely to remain so for the foreseeable future. While traditional discrete water sampling has a long-standing role in pesticide monitoring, it can pose interpretive or accuracy issues if the variability of pollutants on a temporal scale is unknown, if concentrations are low, or vary rapidly over time and need to be measured over a long period of time, and can be expensive and require intensive effort. One of biggest recent technological advances in pesticide monitoring is development of passive sampler technologies. Emerging passive sampling techniques provide an alternative in situ technique that can be used for longer periods of time, and can accumulate substances continuously where concentrations are low or variable (Stuer-Lauridsen, 2005; Vrana et al., 2005), and are gaining increasing worldwide acceptance as a pesticide monitoring tool. Passive samples have the advantage of continuously absorbing all pesticide moving past the monitoring point through time, providing detailed capacity for more comprehensive insights into the temporal dynamics of herbicide usage in the monitored catchment (O’Brien et al., 2016). The advantages of passive sampler technology have seen considerable usage of this
60
technology in the monitoring of pesticide dynamics in Great Barrier Reef marine and freshwaters (Shaw and Muller, 2005; Gallen et al., 2014; O’Brien et al., 2016). Passive pesticide samplers can be deployed for long periods (i.e.,) months by staff with minimal collection protocol training. They can also be deployed with minimal requirement for additional monitoring instrumentation or equipment, and offer a level of sampling redundancy for the inevitable failures or limitations associated with automated or manual discrete sampling approaches. Combined approaches employing a combination of discrete grab samples with passive sampler deployments have recently provided valuable insights into catchment pesticide management behaviours in GBR canegrowing districts (O’Brien et al., 2016). A major limitation of passive sampling technologies is they provide only a time-integrated ‘average’ concentration for the deployment period, with no indication of true contaminant peak concentrations. For toxicants like pesticides, this is an important element of risk assessment (comparing actual concentrations to water quality guidelines) in many catchment monitoring programs. Traditional discrete sampling (particularly manual collection) are still, however, prone to this limitation, or if requisite sample collection frequency is achieved to reliably quantify pollutant maxima, can be prohibitively expensive. Passive sampler results can however, still be assessed against guideline values, and provide useful risk assessment capacity to monitoring programs (O’Brien et al., 2016). Used in combination with discrete sampling (automated or manual) targeted height triggers in systems when peaks may occur, they could provide an important emerging technology to develop more spatially (and particularly temporally) comprehensive monitoring of pesticide usage behaviours and dynamics in target catchments. Regardless of the ultimate technique used to quantify pesticide dynamics in the environment, the requirement for discrete or passive samples to be analysed at a laboratory does invariably impose time delays between sample collection and data availability. Groundwater monitoring
Information currently available suggests that water quality monitoring at GBRCLMP end-of-catchment sites would not adequately account for any contaminants in groundwater inflows from aquifers to respective river systems. Groundwater dynamics is a complex field of study, particularly in light of its relative state of infancy in the GBRCA (compared to surface water). Hunter (2012) noted that the fate of contaminants in subsurface environments is likely to be very site specific and difficult to measure or predict due to the heterogeneous nature of aquifer sediments and the many factors involved. Significant enhancements to the P2R monitoring and modelling programs would be required to integrate groundwater monitoring in a robust and meaningful way (Hunter, 2012). Identification of locations and patterns of groundwater recharge, flow and discharge in each of the monitored catchments, characterisation of aquifer hydro-geochemistry, and determination of the appropriate spatial coverage and sampling times would all need to be quantified and mapped, to adequately capture groundwater dynamics. The inevitable lag times between implementing on-farm changes and detecting a responses in water quality at the end of a large catchment are even more pronounced when groundwater processes are involved, as these may take decades to respond (Hunter, 2012). Any responses in groundwater would likely take much longer to manifest in groundwater dynamics.
Sub-catchment scale monitoring, modelling and extension design
61
There is considerable diversity of aquifer size, complexity and groundwater–surface water connectivity across the wet tropics, lower Burdekin, and Mackay–Whitsunday areas, with unconfined alluvial aquifers widely represented and confined or semi-confined aquifers present in some areas (Hunter 2012). Regardless of region, there is a high degree of connectivity between groundwater and surface waters in all three areas. Paddock leaching losses to groundwater are dominant off-site loss mechanisms in many GBR canegrowing catchments. Artificial drainage networks have been constructed in some areas (e.g., wet tropics) to lower water tables and prevent waterlogging of sugarcane (Hunter 2012), a practice which facilitates shallow, lateral flow of groundwater to surfacewater systems. Nitrate losses in leachate and sub-surface drainage networks to base flows under sugarcane crops in dry-tropical and wet-tropical coastal catchments of the GBRCA accordingly contribute significantly towards the total nitrogen loading in surface waters during the dry season (Thorburn et al., 2011; Armour et al., 2013; Rasiah et al., 2013). In some cases, shallow groundwater leaching from paddocks is likely to re-emerge to surface drainages even more rapidly (within hours of rainfall), and much shallow groundwater will exfiltrate to nearby surfacewaters within the same wet season (Connor et al., 2012). Groundwater discharge to waterways in the wet tropics far exceeds groundwater discharge directly to the coast; in contrast, groundwater discharge directly to the coast in the lower Burdekin and Mackay–Whitsunday areas represents around 40% of total groundwater discharge from each aquifer (Hunter, 2012). It may, accordingly, be desirable to add some element of groundwater monitoring to some sub-catchment monitoring locations. Capturing pollutant losses to groundwater (or lateral losses to drains) in locations where nutrient and pesticides leaching losses are likely to be high (due to soil type, infiltration rates etc.) will likely be required for useful information on results of on-farm management change. A groundwater-focussed approach will be greatly facilitated if the study area has already been subject to groundwater monitoring and appropriate coverage of monitoring bore network and historical data is available. There may also even be scope to integrate RTWQM into GBRCA groundwater research (see U.S. examples in Pellerin et al. 2016). Use of continuous nutrient sensors for monitoring water quality in groundwater is currently an area of promising application given that some groundwater systems show chemical variability at time scales much shorter than the typical annual cycles for groundwater monitoring (Pellerin et al., 2016). This capacity will, however, have to be assessed on a case-by-case basis, ideally in consultation with local groundwater hydrology expertise. 3.3 Field sampling program and Laboratory analysis
The specifics of field and laboratory analysis and appropriate QA/QC protocols will have to be tailored to each water quality monitoring program. This is a topic too broad for detailed attention in this report, but pragmatic conceptual and technical guidance can be readily found in the NWQMS framework (ANZECC and ARMCANZ, 2000), Australian National Association of Testing Authorities (NATA: http://www.nata.com.au/nata/), as in accepted published procedures such as Standard Methods for the Examination of Water and Wastewater (APHA 1998). As previously mentioned, field and laboratory protocols for emerging technological such as RTWQM sensors are also relatively well developed (see Pellerin et al., 2013), and will not be discussed in great detail here.
62
3.4 Data analysis and interpretation
The desired objectives of a water quality monitoring program with regard to data analysis will dictate practical set-up, collection and monitoring methodologies and statistical approaches to data analysis. Qualitative assessment of concentration data can be utilised at the most basic level of water quality analysis. Assessment of concentration data against relevant water quality guidelines, for example, can be a basic option for monitoring programs with more industry engagement extension focus. This approach has been utilised in some existing GBRCA monitoring programs focussing on management of water quality and grower engagement in sugarcane catchments (O’Brien et al., 2013; Di Bella et al., 2015, R. Milla, Burdekin Productivity Services pers. comm.). Statistical approaches for assessing long-term trends in concentration data are available (if more robust statistical approaches are desired to assess changes in concentrations through time in response to catchment practice change for example). Hydro-meteorological conditions often cause significant natural seasonal fluctuation in parameter concentration time series, which must be removed for detection of a human induced trend through time (Hirsch et al., 1982). The inherent climatic variability in the GBRCA will always confound trend detection (especially due to management change) in concentration data time series, or at least necessitate long monitoring periods to reliably detect genuine change. It is also possible to account for such climatic fluctuations, but this requires the incorporation of explanatory (e.g., meteorological or hydrological) variables in the analysis as co-variates (Libiseller and Grimvall, 2002). The collection of additional data to support concentration data, such as hydrology (streamflow discharge), is possible, but requires additional monitoring infrastructure such as flumes and height loggers, as well as development of rating (stream height-discharge) relationships. The major benefit of this approach is it allows calculation of contaminant loads through systems (e.g., kg/Ha of inorganic nitrogen lost per year from a defined catchment area). Loads represent a data format that is less prone (but not entirely) to hydrological variability, more amenable to trend detection, and can also be more interpretable by local landholders. Assessment of loads is also an approach with considerable relevance to the over-arching long-term load reduction targets of Reef Plan, which outline specific load reduction targets desired for particular contaminants. Installation of flumes, or situating monitoring sites at locations with uniform control features (e.g., culverts) can allow relatively achievable load calculation at monitoring stations. This has been incorporated into some current pilot RTWQM projects in the GBRCA (Burton et al., 2014; R. Milla pers. Comm.), but would have to be assessed on a local basis. 3.5 The challenges of small catchment monitoring
Given some of the information presented in this framework, how amenable the concept of sugarcane ‘hotspot’ monitoring is relative to other priority land-uses such as grazing merits some discussion, at least in the context of some potential program objectives and expectations. The key water quality indicators and the temporal dynamics of pollutant delivery vary substantially between these major land uses (Davis et al., 2016). Several of the key pollutants for rangeland grazing in the GBRCA (suspended sediment and particulate nitrogen and phosphorus) are generated and delivered through catchments almost exclusively from erosive processes and landscape surface runoff during rainfall events.
Sub-catchment scale monitoring, modelling and extension design
63
Issues of monitoring significance, such as substantial groundwater delivery, are expected to be minimal in the GBR rangeland grazing context. The dissolved pollutants (DIN and PSII herbicides) characterising pollutant exports from GBR sugarcane production, however, and dominance of groundwater losses as a paddock loss pathway adds considerable complexity to monitoring programs and the likely achievability of many potential program objectives (i.e., trend detection relating to practice change). The likely longer timeframes for management change-water quality responses (due to landscape recovery) and the higher climatic variability characteristic of much GBR rangeland grazing will, however, still pose major challenges and constraints for potential finer, sub-catchment scale monitoring programs in rangeland grazing. Any program with specific objectives to detect water quality improvements in response to land-use practice change need to be tempered with recognition of the times frames likely necessary to detect significant change. There is typically a nested hierarchy of time lags associated with tangible water quality improvements; times lags for total adoption of practice changes; subsequent time lags for practice changes to produce results; and finally time lags to statistically identifying these water quality changes. These time lags will vary significantly depending on the pollutant of interest, specific catchment storage, release and removal mechanisms, and the relative scale of practice improvement occurring at farm-subcatchment scales. Global experiences suggest smaller, sub-catchment scale water quality responses to major practice changes in catchment pesticide application (such as banning application of certain herbicides, including several of the PSIIs relevant to Reef Plan objectives) can apparently be detected within relatively ‘short’ times of several years (Rabiet et al., 2010; Hermosin et al., 2013; Pesce et al., 2016). Even without regulation of that scale (total application bans), the water quality improvements documented with certain improved pesticide management evident a paddock scale (50-90% load reductions; see Masters et al., 2013; Oliver et al., 2014; Davis and Pradolin, 2016) may conceivably be similarly responsive, and detectable, at similar time frames at smaller catchment scales within the GBRCA. The detectability of trends in other sugarcane industry priority pollutants such as DIN are potentially much longer. Relatively quick water quality responses to the enforcement of nitrogen application regulation (manure application rates) to reduce agriculture-related eutrophication of water resources have been documented (Kronvang et al., 2008; Rozemeijer et al., 2014), although datasets were often >20 years duration. Decidedly mixed results have emerged from other European nitrogen regulation experiences using datasets with similar timeframes. Recent assessment of the effectiveness of the ‘Nitrate Vulnerable Zone’ scheme documented minimal evidence for any consistent improvement in water quality following regulation across a range of catchment datasets spanning 12-15 years (Worrall et al., 2010). In some cases the detection of significant trends is hindered by natural interannual weather-related variability, combined with too short time series (Raïke et al., 2003). Some of this variable capacity to detect responses may also be attributed to variability in transit times of infiltrated water through the subsurface and the continuing contribution of legacy stores of nitrogen that have accumulated in soils over several decades of intensive agricultural land use (Stalnacke et al., 2003; Rozemeijer and Broers, 2007; Rozemeijer et al., 2014). Differing contributions of near-surface versus deeper groundwater flow routes may explain the variable delays in responses to practice change, a point relevant to the often significant and complex groundwater hydrologies in many GBRCA sugarcane catchments.
64
The capacity to detect water quality responses is also likely to also vary in direct relation to the scale of management impact being implements. Data from relatively predictable river systems suggest that while substantial decreases in catchment nutrient inputs (>30% reductions across the entire catchment) could be detectable in 4-5 years, smaller reductions (<20%) will take substantially longer to detect, if even detectable at all (Stow et al., 2001). Given that many of the fertiliser application reductions associated with shifts between GBR sugarcane ABCD management practice classes are not large (<20%), even whole of catchment shifts toward reduced fertiliser applications may not be detectable in the comparatively hydrologically variable catchments of the GBRCA for very long periods of time (i.e., decades). 3.5.1 Additional datasets required Experiences gained from small, sub-catchment monitoring programs elsewhere have identified knowledge-quantification of on-farm land use practices as critical to understanding linkages between trends in environmental water quality and practice change by landholders (Kay et al., 2012; Osmond et al., 2012). If program objectives are simply to develop a water quality education and extension tool to provide enhanced awareness and capacity of local industry to understand land use-water quality linkages, specific farm practice data in the monitored catchment may not be critical. If project objectives are, however, to link water quality responses to specific land treatment changes, on-farm practices and land treatment data must be monitored as intensively as water quality and at the same temporal and spatial scales, an endeavour that can be even more challenging and resource intensive than water quality monitoring itself. For instance, if the objective is to relate N reductions to nutrient management, then it is essential to know the timing, rate, and placement of the fertilizer, the current crop, and other management practices for every field in the watershed. To obtain this level of detailed information, at least a representative sample of farmers will need to be surveyed annually, which is expensive and may cause survey fatigue among landowners (Kay et al., 2012; Osmond et al., 2012). Where such data are needed, cooperation of farmers is essential, and the likely level of cooperation must be considered in monitoring site selection. 3.5.2 Local and broader cane industry and grower engagement The ‘who’ in terms of appropriate personnel is an important consideration, often overlooked in the design and implementation of water quality monitoring programs. It is likely to be a particularly critical component of the long-term success of programs aimed at driving behavioural-practice change in agricultural sectors. Global and more local experiences emerging from programs that have achieved apparent water quality improvements have stressed the critical importance of agronomic and technical advice being delivered to involved farmers through trusted local contacts (i.e., key service providers and extension staff, or local peer farmers) as a key driver of change. High credibility sources are particularly important when messages are complex, there is little available experience, and/or a message carries a high personal risk (Blackstock et al., 2010). This is often the case with water quality and farm practice change in agricultural situations. As experience and occupation are key factors that convince people of the reliability of the source; and people are more inclined to process in-group messages, the use of people from farming backgrounds or trusted networks is likely to enhance message uptake.
Sub-catchment scale monitoring, modelling and extension design
65
Farmer-to-farmer programs in Canada and the US have been very effective in delivering conservation practice technical assistance, but usually required additional funding, as did the use of dedicated extension agents to work directly with small groups of farmers to encourage the adoption of nutrient management (Blackstock et al., 2010; Osmond et al., 2012). Establishment of an ‘Integrated Area Wide Management’ (IAWM) working groups with local farmers, key service providers (selected peak industry representatives, extension staff and government agency personnel) were also a cornerstone of cotton industry efforts in achieving demonstrable water quality improvements in central Queensland (Wolfenden and Evans, 2007; Kennedy et al., 2012). A key feature of the Emerald (successful) IAWM project was the control of data confidentiality and data dissemination by the industry stakeholders. 3.5.3 Program staffing and capacity Water quality monitoring is not a field that lends itself to cursory workload commitments. As well as considerable water quality science expertise requirements in data analysis and interpretation, the on-ground staffing requirements required to address routine site maintenance, sample collection and quality assurance, freight and analysis and data management and storage are substantial. If significant landholder engagement in monitored catchments are a key component of program design, liaison with growers (especially on-farm practice recording) can also be substantial. Capacity requirements emerging from recent small-scale, collaborative monitoring programs with industry suggest 1.0 full time equivalents (FTEs) are required to handle relatively small monitoring networks (i.e. 2 full-time RTWQM monitoring sites and their maintenance, or a small catchment pesticide monitoring program with associated grower engagement and record-keeping documentation; R. Milla pers comm.; R. Turner pers comm.). 3.5.4 Reporting Water quality monitoring data can be a contentious topic, particularly for a primary industry concerned with public perceptions, and which has been subject to a range of regulatory policy approaches in recent years. These sensitivities become magnified in situations where monitoring may be limited to a small catchment of growers within a broader industry, where water quality linkages to small, identifiable sub-sets of growers may emerge. Appropriate information confidentiality, dissemination and data sharing frameworks will undoubtedly need to be a critical consideration in study design, particularly if grower engagement and collaboration are desired (as opposed to a purely regulatory design). Recent experiences within the sugar and similar industries highlight that a safe learning environment is essential for data sharing partnerships to emerge, and it may be best in the first instance to limit project delivery and information sharing to directly involved farmers and their advisors. A key finding from recent cotton industry initiatives developing collaborative approaches to integrated catchment management is that it is critical to allow time for trust to develop between researchers, landholders and government policy staff (Wolfenden and Evans, 2007). As a part of the recent (and ongoing) Herbert Water Quality Monitoring Program (Di Bella et al., 2015), for example, an extension strategy was similarly developed whereby the various project stakeholders were provided water quality monitoring results six months prior to the information being made public. This allowed the various project stakeholders the opportunity to be informed of pending issues, and proactively develop strategies and implement activities when issues arose.
66
3.6 Options for integration with related programs
Considering the significant investment associated with any water quality monitoring program, particularly in long-term studies, opportunities for monitoring data integration with related programs should be another critical consideration in adding value to overall program design. Given the breadth and scale of water quality monitoring and research currently underway in the GBRCA, a range of these opportunities undoubtedly exist. One of the key policy instruments to emerge under Reef Plan, for example, is the Paddock to Reef Integrated Monitoring, Modelling and Reporting Program (P2R; Carroll et al., 2012). The Paddock to Reef program is an extensive monitoring-modelling collaboration involving governments, industry bodies, regional natural resource management bodies, landholders and research organisations. Funded across several levels of government, the P2R program is a highly innovative approach to collecting and integrating data and information on agricultural management practices, catchment indicators, catchment loads and the water quality and health of the Great Barrier Reef. The program uses cutting-edge monitoring and modelling tools that link across each of the scales (paddock, catchment and marine) to enable reporting in the short-to-medium term. There are a range of inter-related components of the program (management practice adoption; paddock monitoring and modelling, catchment loads monitoring and modelling, ground cover, riparian vegetation and wetland extent monitoring and marine program, which are integrated through a collective assessment and reporting framework (Figure 4). Elements of the program relating to paddock and catchment monitoring and modelling in particular offer opportunities for monitoring program integration. Due to climatic variability (rates, timing and amounts) and dynamism in antecedent conditions such as ground cover and on-ground land management practices, detecting changes in water quality at end-of-catchment to assess progress towards targets using monitoring alone is extremely challenging. Therefore the Paddock to Reef (P2R) program uses catchment modelling as one of multiple lines of evidence to report on progress towards Reef Plan 2009 targets. The eWater CRC Source Catchments modelling framework is used to simulate sediment, nutrient and pesticide loads entering the GBR lagoon and the subsequent reductions in loads associated with monitored levels of improved management practice adoption. A Source Catchments model has been produced for each of the six NRM regions. Two paddock-scale models (HowLeaky and APSIM) are used to generate the daily pollutant loads and the subsequent reductions in loads due to the adoption of improved land management practices for cropping and cane land uses respectively. Management changes utilised in models are based on practice adoption data provided by regional Natural Resource Management (NRM) groups and industry. 3.6.1 Opportunities to link with paddock and catchment modelling A current challenge for P2R paddock-scale and Source Catchments (SC) modelling is the limited paddock and particularly sub-catchment scale monitoring data currently available across such a large landscape to validate paddock and catchment models (D. Waters, DNRM pers. comm.). Datasets currently used in model development consist primarily of GBRCMLP ‘end-of-catchment sites’, and some upland monitoring sites generally draining large areas. Smaller sub-catchment scale datasets at multiple scales filling that information
Sub-catchment scale monitoring, modelling and extension design
67
gap between upland environments and ‘end-of-catchment sites’ would be of considerable value to modelling efforts in a number of ways:
• Nested monitoring (with sub-catchment sites located specifically to feed into downstream GBRCLMP sites) would broadly improve understanding of pollutant delivery processes from generation at the paddock through to sub-catchment scales. This information would allow more informed model refinement of losses and decay rates applied in the models currently for nutrients and pesticides, and whether current values are appropriate to the target catchment. At present there is very little field data available for the majority of the GBR catchments.
• Monitoring data from sub-catchments with a relatively dominant landuse are lacking. For example sugarcane cultivation is a priority land use for modelling attention, but monitoring data is also needed from similar catchments with minimal anthropogenic land-uses (i.e., low intensity grazing areas) to provide sensible comparative (pre- development) numbers to parameterise and or validate models.
• Data from catchments largely dominated by extremes of management practice ratings are similarly sparse. If there are areas that have had major BMP investment and are in or at the upper end of best practice (i.e., A Class catchments), this would provide valuable ‘best case scenario’ modelling information. Alternatively, the reverse case of sub-catchments dominated by D class farming would provide valuable model calibration capacity for ‘worst case’ water quality scenarios. The concept of a longer term monitoring program in a catchment transitioning from a poor practice ‘hotspot’ towards A or B class management through targeted NRM investment would be particularly valuable. The aim would be to assess whether water quality changes could actually be measured and over what timeframe, and if so, the magnitude of the improvement in water quality. This data would be critical for model validation at different scales.
While the P2R program is world-leading from the perspective of multi-scale, integrated water quality monitoring and modelling, it has limited underpinning with how its outputs (particularly modelling) can be communicated with or inform target industries. The overall concept of the program for example, is largely biophysical (see Figure 4), with little in the way of explicit linkages and communication with specific industries. A recurrent theme repeatedly emerging in recent sugarcane industry water quality engagement are consistent industry concerns about the validity of paddock and sub-catchment scale modelling outputs, and whether they represent the reality of water quality dynamics and relative contributions from the diversity of sugarcane farming environments found across the GBRCA (Burton et al., 2014; DiBella et al., 2015, Project 25). A range of projects are already planned under imminent Reef funding programs which will attempt to utilise P2R paddock and catchment modelling outputs in more industry relevant extension platforms. The ‘Cane Calculator’, for example, is a proposed project to develop a user-friendly, web based tool which will estimate the current water quality risk of a farm and the water quality benefits of adopting improved farm management practices. This project will allow NRM staff (and possibly into the future primary producers (i.e., canegrowers) and their support agents) to perform their own assessments of discrete projects, and/or intervention scenarios which will deliver the desired returns on investment. The Calculator will enable a
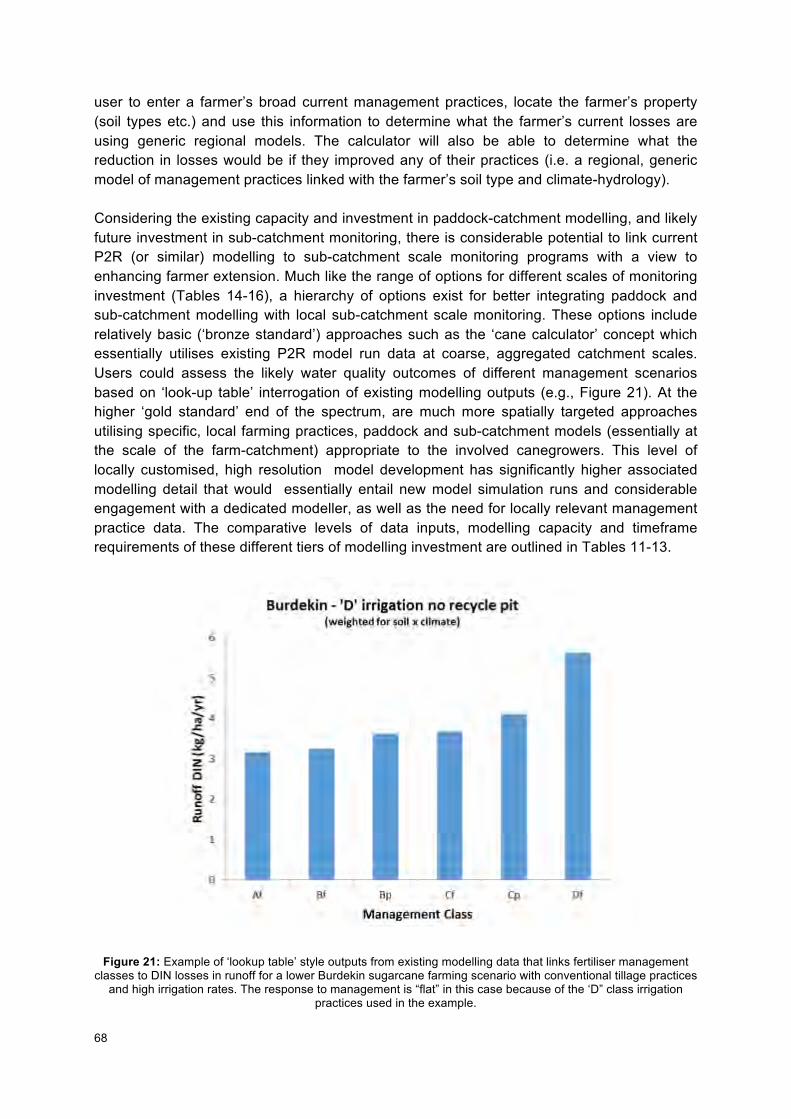
68
user to enter a farmer’s broad current management practices, locate the farmer’s property (soil types etc.) and use this information to determine what the farmer’s current losses are using generic regional models. The calculator will also be able to determine what the reduction in losses would be if they improved any of their practices (i.e. a regional, generic model of management practices linked with the farmer’s soil type and climate-hydrology). Considering the existing capacity and investment in paddock-catchment modelling, and likely future investment in sub-catchment monitoring, there is considerable potential to link current P2R (or similar) modelling to sub-catchment scale monitoring programs with a view to enhancing farmer extension. Much like the range of options for different scales of monitoring investment (Tables 14-16), a hierarchy of options exist for better integrating paddock and sub-catchment modelling with local sub-catchment scale monitoring. These options include relatively basic (‘bronze standard’) approaches such as the ‘cane calculator’ concept which essentially utilises existing P2R model run data at coarse, aggregated catchment scales. Users could assess the likely water quality outcomes of different management scenarios based on ‘look-up table’ interrogation of existing modelling outputs (e.g., Figure 21). At the higher ‘gold standard’ end of the spectrum, are much more spatially targeted approaches utilising specific, local farming practices, paddock and sub-catchment models (essentially at the scale of the farm-catchment) appropriate to the involved canegrowers. This level of locally customised, high resolution model development has significantly higher associated modelling detail that would essentially entail new model simulation runs and considerable engagement with a dedicated modeller, as well as the need for locally relevant management practice data. The comparative levels of data inputs, modelling capacity and timeframe requirements of these different tiers of modelling investment are outlined in Tables 11-13.
Figure 21: Example of ‘lookup table’ style outputs from existing modelling data that links fertiliser management classes to DIN losses in runoff for a lower Burdekin sugarcane farming scenario with conventional tillage practices
and high irrigation rates. The response to management is “flat” in this case because of the ‘D” class irrigation practices used in the example.
Sub-catchment scale monitoring, modelling and extension design
69
Regardless of the eventual nature of any potential utility of paddock modelling-monitoring in industry engagement there are a range of potential opportunities for sub-catchment scale monitoring programs to inform and enhance existing GBR monitoring-modelling programs. While the paddock/Source Catchments modelling framework, for example, is a world-leading modelling platform, like any model, the spatial and temporal input data underpinning its development is constrained by existing water quality monitoring datasets, and particularly local management practice data. Collection of high quality sub-catchment scale data can provide valuable capacity to better ground-truth existing model outputs, with any model calibration likely to improve overall model performance. Table 11: Data requirements and utility for Bronze standard integration of paddock-catchment modelling with sub-
catchment monitoring program.
‘Bronze Standard’
Approach: the ‘Cane Calculator’; use a lookup approach to communicate benefits of different generic land management options from existing modelling work for the Great Barrier Reef catchments in the Paddock to Reef program.
Data Requirements Basic metadata for the target sub-catchment (location, soil types etc.) to identify most appropriate pre-existing modelling scenario.
Advantages
• Generic modelling scenarios are already available
• Existing modelling staff within state government could provide the data and interpretation to support this approach.
Disadvantages
• Limited range of already defined and modelled management scenarios (may have limited applicability to the grower’s specific situation).
• Not linked to sub-catchment
scale monitoring except that trends should be in the same direction (i.e. greater adoption of better management should improve water quality); some idea of the increment of change depending on the increment of adoption.
Example Outputs Lookup table with pre-existing scenarios already broadly developed for regional soil types and generic local practices.
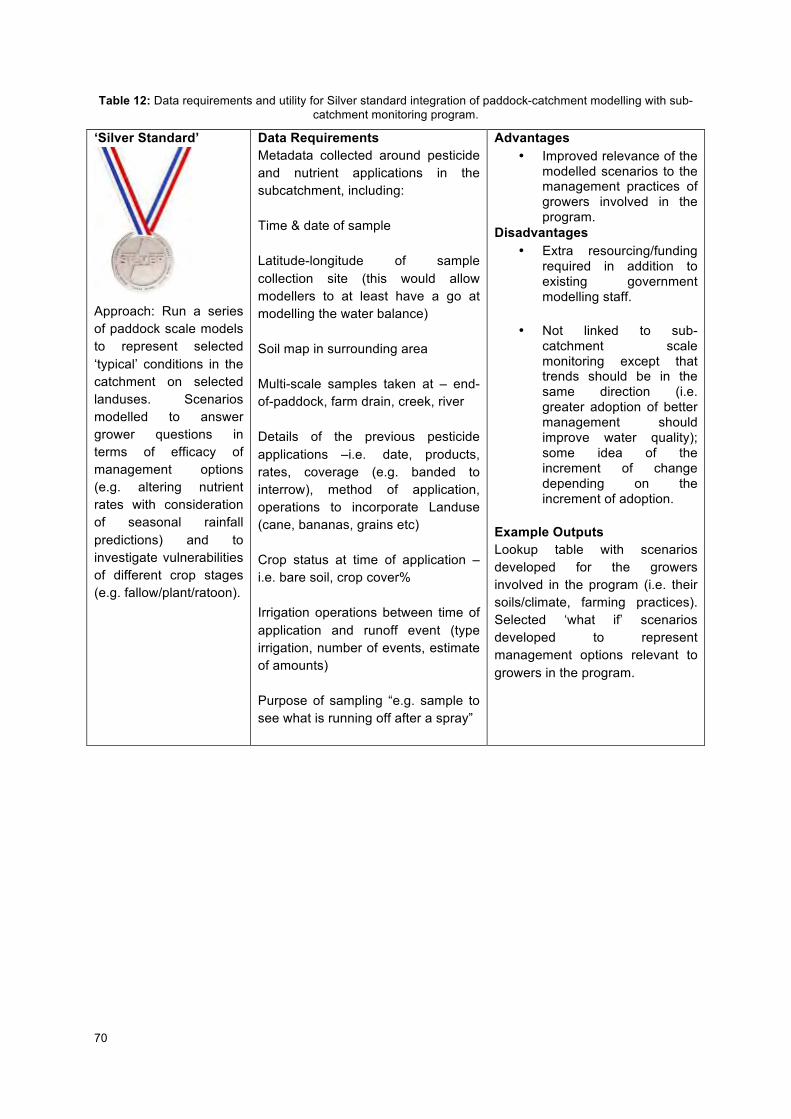
70
Table 12: Data requirements and utility for Silver standard integration of paddock-catchment modelling with sub-catchment monitoring program.
‘Silver Standard’
Approach: Run a series of paddock scale models to represent selected ‘typical’ conditions in the catchment on selected landuses. Scenarios modelled to answer grower questions in terms of efficacy of management options (e.g. altering nutrient rates with consideration of seasonal rainfall predictions) and to investigate vulnerabilities of different crop stages (e.g. fallow/plant/ratoon).
Data Requirements Metadata collected around pesticide and nutrient applications in the subcatchment, including: Time & date of sample Latitude-longitude of sample collection site (this would allow modellers to at least have a go at modelling the water balance) Soil map in surrounding area Multi-scale samples taken at – end-of-paddock, farm drain, creek, river Details of the previous pesticide applications –i.e. date, products, rates, coverage (e.g. banded to interrow), method of application, operations to incorporate Landuse (cane, bananas, grains etc) Crop status at time of application –i.e. bare soil, crop cover% Irrigation operations between time of application and runoff event (type irrigation, number of events, estimate of amounts) Purpose of sampling “e.g. sample to see what is running off after a spray”
Advantages • Improved relevance of the
modelled scenarios to the management practices of growers involved in the program.
Disadvantages • Extra resourcing/funding
required in addition to existing government modelling staff.
• Not linked to sub-
catchment scale monitoring except that trends should be in the same direction (i.e. greater adoption of better management should improve water quality); some idea of the increment of change depending on the increment of adoption.
Example Outputs Lookup table with scenarios developed for the growers involved in the program (i.e. their soils/climate, farming practices). Selected ‘what if’ scenarios developed to represent management options relevant to growers in the program.
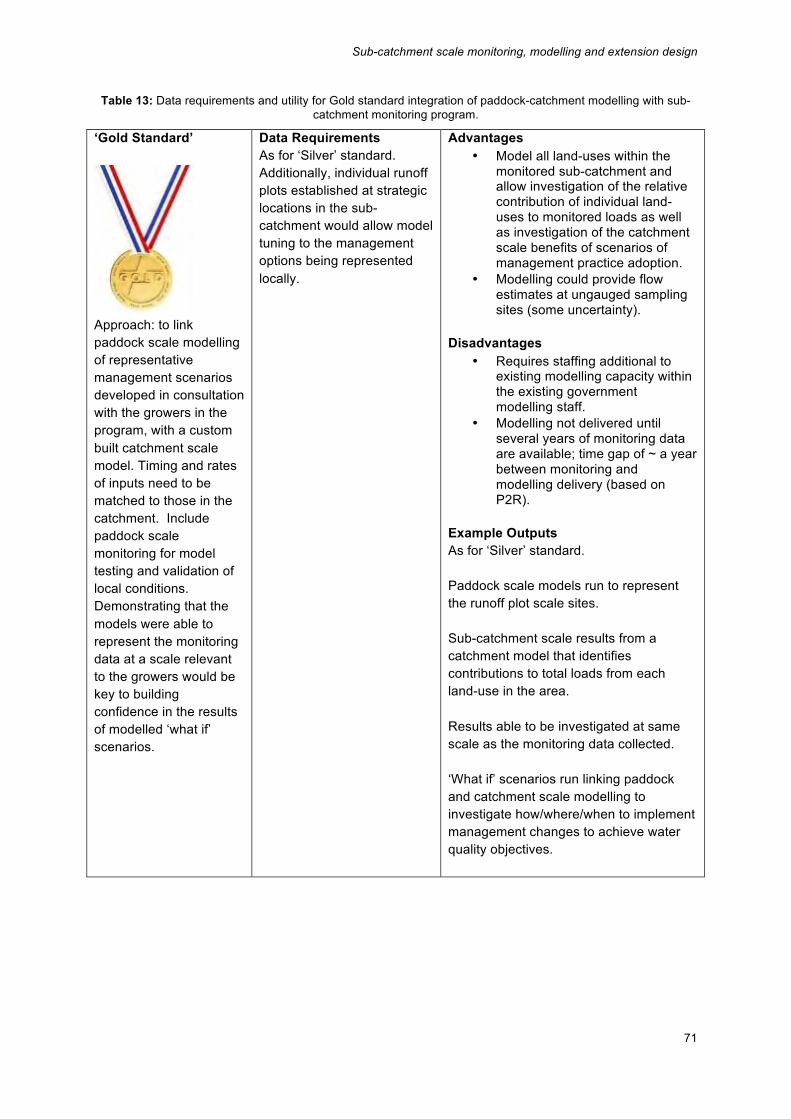
Sub-catchment scale monitoring, modelling and extension design
71
Table 13: Data requirements and utility for Gold standard integration of paddock-catchment modelling with sub-catchment monitoring program.
‘Gold Standard’
Approach: to link paddock scale modelling of representative management scenarios developed in consultation with the growers in the program, with a custom built catchment scale model. Timing and rates of inputs need to be matched to those in the catchment. Include paddock scale monitoring for model testing and validation of local conditions. Demonstrating that the models were able to represent the monitoring data at a scale relevant to the growers would be key to building confidence in the results of modelled ‘what if’ scenarios.
Data Requirements As for ‘Silver’ standard. Additionally, individual runoff plots established at strategic locations in the sub-catchment would allow model tuning to the management options being represented locally.
Advantages • Model all land-uses within the
monitored sub-catchment and allow investigation of the relative contribution of individual land-uses to monitored loads as well as investigation of the catchment scale benefits of scenarios of management practice adoption.
• Modelling could provide flow estimates at ungauged sampling sites (some uncertainty).
Disadvantages
• Requires staffing additional to existing modelling capacity within the existing government modelling staff.
• Modelling not delivered until several years of monitoring data are available; time gap of ~ a year between monitoring and modelling delivery (based on P2R).
Example Outputs As for ‘Silver’ standard. Paddock scale models run to represent the runoff plot scale sites. Sub-catchment scale results from a catchment model that identifies contributions to total loads from each land-use in the area. Results able to be investigated at same scale as the monitoring data collected. ‘What if’ scenarios run linking paddock and catchment scale modelling to investigate how/where/when to implement management changes to achieve water quality objectives.
72
4. PROGRAM DESIGN OPTIONS Given all these considerations, there is obviously considerable scope for flexibility in water quality monitoring program design and monitoring rigour that can be developed depending on ultimate program objectives, intended utility of data, staffing and funding capacity and on-ground practical constraints. As well as the specific aspects of water quality monitoring itself, there may well be scope to incorporate additional aspects of science research into the program. The utility of RTWQM, for example, is an emerging approach with considerable scope to influence landholder behavioural change, and that lends itself to concurrent, socio-behavioural research. The integration of continuous water quality data collection technologies into other monitoring programs has also provided additional, previously unanticipated, insights into the dynamics of contaminant movement through catchments (Mellander et al., 2012). Thus, there is significant potential for considered implementation of RTWQM technologies at smaller, sub-catchment scales to better inform a range of key GBR monitoring and modelling initiatives. With this in mind, it is possible to outline a hierarchy of program design, spanning optimal program roll-out that integrates diverse biophysical, socio-behavioural and extension – communication themes (integrated over multiple spatial scales), through to less rigorous program designs with much more modest objectives (but obviously lower concomitant funding and capacity requirements). In the ‘Gold standard’ of this hierarchy (Figure 22, Table 14), the program would entail a stakeholder-guided collaborative approach that uses multiple targeted monitoring sites through a catchment to help research and policy personnel to understand water quality perceptions of key stakeholders, and to integrate stakeholder engagement in both the decision-making process and in the implementation of water quality management strategies. Feedback loops to industry allow farmers to recognise themselves as part of the problem, but also part of the solution. Robust water quality data emerging from the program would also inform a number of concurrent Reef Plan programs (i.e., Paddock to Reef Integrated Monitoring and Modelling Program, paddock/Source Catchment modelling).
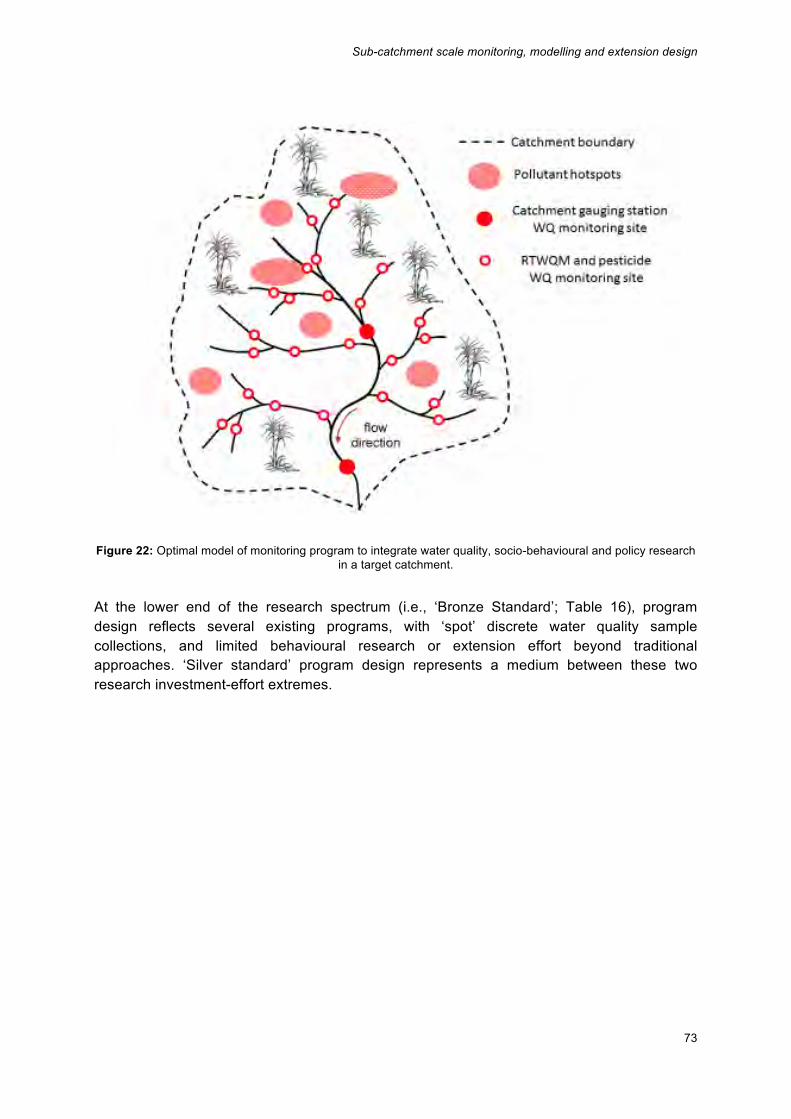
Sub-catchment scale monitoring, modelling and extension design
73
Figure 22: Optimal model of monitoring program to integrate water quality, socio-behavioural and policy research
in a target catchment. At the lower end of the research spectrum (i.e., ‘Bronze Standard’; Table 16), program design reflects several existing programs, with ‘spot’ discrete water quality sample collections, and limited behavioural research or extension effort beyond traditional approaches. ‘Silver standard’ program design represents a medium between these two research investment-effort extremes.
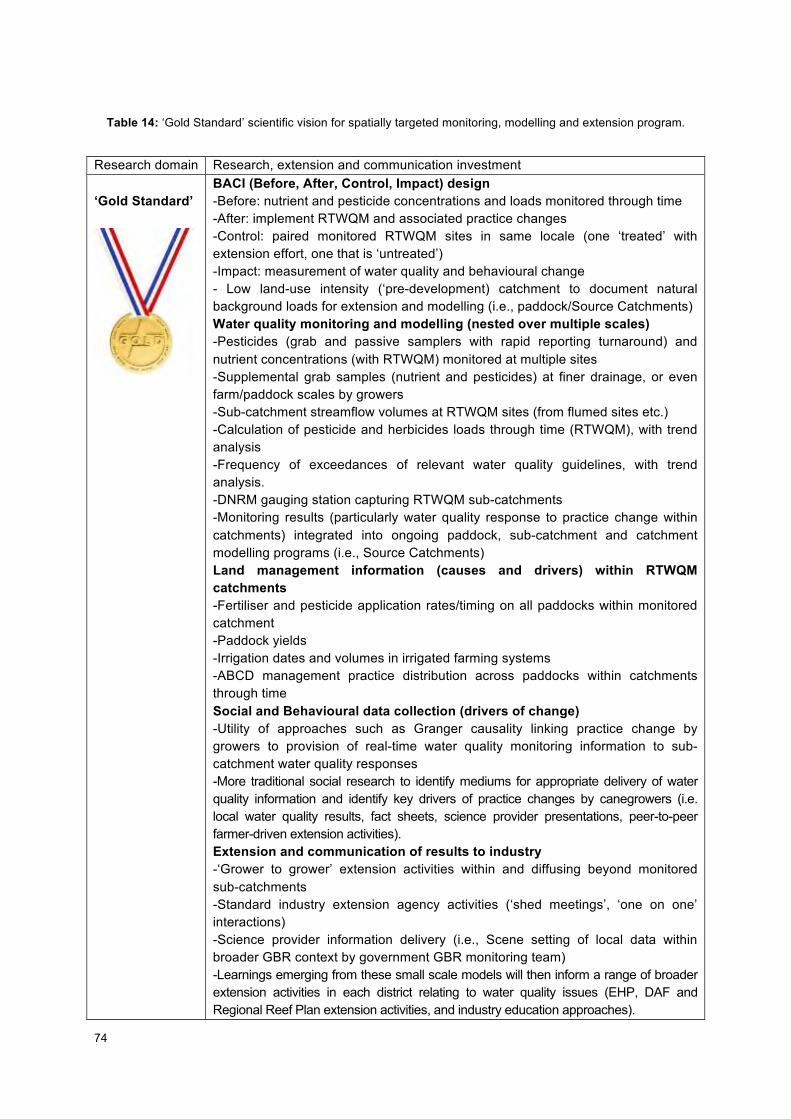
74
Table 14: ‘Gold Standard’ scientific vision for spatially targeted monitoring, modelling and extension program.
Research domain Research, extension and communication investment ‘Gold Standard’
BACI (Before, After, Control, Impact) design -Before: nutrient and pesticide concentrations and loads monitored through time -After: implement RTWQM and associated practice changes -Control: paired monitored RTWQM sites in same locale (one ‘treated’ with extension effort, one that is ‘untreated’) -Impact: measurement of water quality and behavioural change - Low land-use intensity (‘pre-development) catchment to document natural background loads for extension and modelling (i.e., paddock/Source Catchments) Water quality monitoring and modelling (nested over multiple scales) -Pesticides (grab and passive samplers with rapid reporting turnaround) and nutrient concentrations (with RTWQM) monitored at multiple sites -Supplemental grab samples (nutrient and pesticides) at finer drainage, or even farm/paddock scales by growers -Sub-catchment streamflow volumes at RTWQM sites (from flumed sites etc.) -Calculation of pesticide and herbicides loads through time (RTWQM), with trend analysis -Frequency of exceedances of relevant water quality guidelines, with trend analysis. -DNRM gauging station capturing RTWQM sub-catchments -Monitoring results (particularly water quality response to practice change within catchments) integrated into ongoing paddock, sub-catchment and catchment modelling programs (i.e., Source Catchments) Land management information (causes and drivers) within RTWQM catchments -Fertiliser and pesticide application rates/timing on all paddocks within monitored catchment -Paddock yields -Irrigation dates and volumes in irrigated farming systems -ABCD management practice distribution across paddocks within catchments through time Social and Behavioural data collection (drivers of change) -Utility of approaches such as Granger causality linking practice change by growers to provision of real-time water quality monitoring information to sub-catchment water quality responses -More traditional social research to identify mediums for appropriate delivery of water quality information and identify key drivers of practice changes by canegrowers (i.e. local water quality results, fact sheets, science provider presentations, peer-to-peer farmer-driven extension activities). Extension and communication of results to industry -‘Grower to grower’ extension activities within and diffusing beyond monitored sub-catchments -Standard industry extension agency activities (‘shed meetings’, ‘one on one’ interactions) -Science provider information delivery (i.e., Scene setting of local data within broader GBR context by government GBR monitoring team) -Learnings emerging from these small scale models will then inform a range of broader extension activities in each district relating to water quality issues (EHP, DAF and Regional Reef Plan extension activities, and industry education approaches).
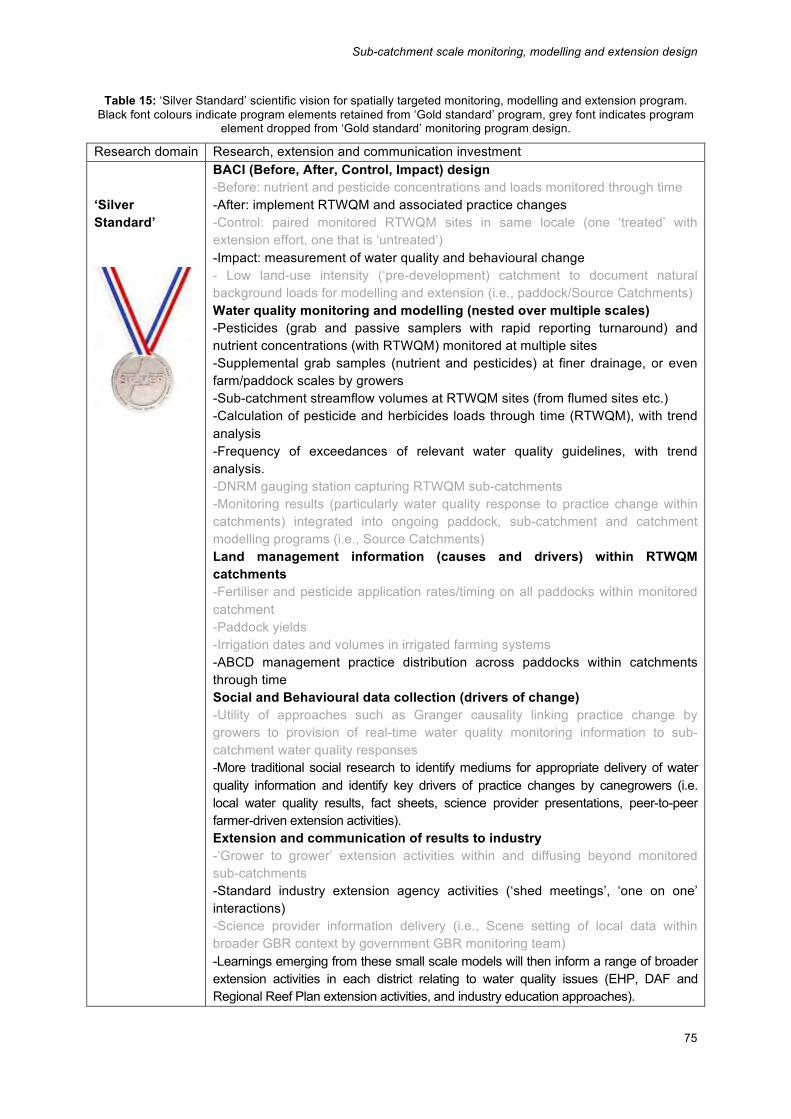
Sub-catchment scale monitoring, modelling and extension design
75
Table 15: ‘Silver Standard’ scientific vision for spatially targeted monitoring, modelling and extension program. Black font colours indicate program elements retained from ‘Gold standard’ program, grey font indicates program
element dropped from ‘Gold standard’ monitoring program design.
Research domain Research, extension and communication investment ‘Silver Standard’
BACI (Before, After, Control, Impact) design -Before: nutrient and pesticide concentrations and loads monitored through time -After: implement RTWQM and associated practice changes -Control: paired monitored RTWQM sites in same locale (one ‘treated’ with extension effort, one that is ‘untreated’) -Impact: measurement of water quality and behavioural change - Low land-use intensity (‘pre-development) catchment to document natural background loads for modelling and extension (i.e., paddock/Source Catchments) Water quality monitoring and modelling (nested over multiple scales) -Pesticides (grab and passive samplers with rapid reporting turnaround) and nutrient concentrations (with RTWQM) monitored at multiple sites -Supplemental grab samples (nutrient and pesticides) at finer drainage, or even farm/paddock scales by growers -Sub-catchment streamflow volumes at RTWQM sites (from flumed sites etc.) -Calculation of pesticide and herbicides loads through time (RTWQM), with trend analysis -Frequency of exceedances of relevant water quality guidelines, with trend analysis. -DNRM gauging station capturing RTWQM sub-catchments -Monitoring results (particularly water quality response to practice change within catchments) integrated into ongoing paddock, sub-catchment and catchment modelling programs (i.e., Source Catchments) Land management information (causes and drivers) within RTWQM catchments -Fertiliser and pesticide application rates/timing on all paddocks within monitored catchment -Paddock yields -Irrigation dates and volumes in irrigated farming systems -ABCD management practice distribution across paddocks within catchments through time Social and Behavioural data collection (drivers of change) -Utility of approaches such as Granger causality linking practice change by growers to provision of real-time water quality monitoring information to sub-catchment water quality responses -More traditional social research to identify mediums for appropriate delivery of water quality information and identify key drivers of practice changes by canegrowers (i.e. local water quality results, fact sheets, science provider presentations, peer-to-peer farmer-driven extension activities). Extension and communication of results to industry -‘Grower to grower’ extension activities within and diffusing beyond monitored sub-catchments -Standard industry extension agency activities (‘shed meetings’, ‘one on one’ interactions) -Science provider information delivery (i.e., Scene setting of local data within broader GBR context by government GBR monitoring team) -Learnings emerging from these small scale models will then inform a range of broader extension activities in each district relating to water quality issues (EHP, DAF and Regional Reef Plan extension activities, and industry education approaches).
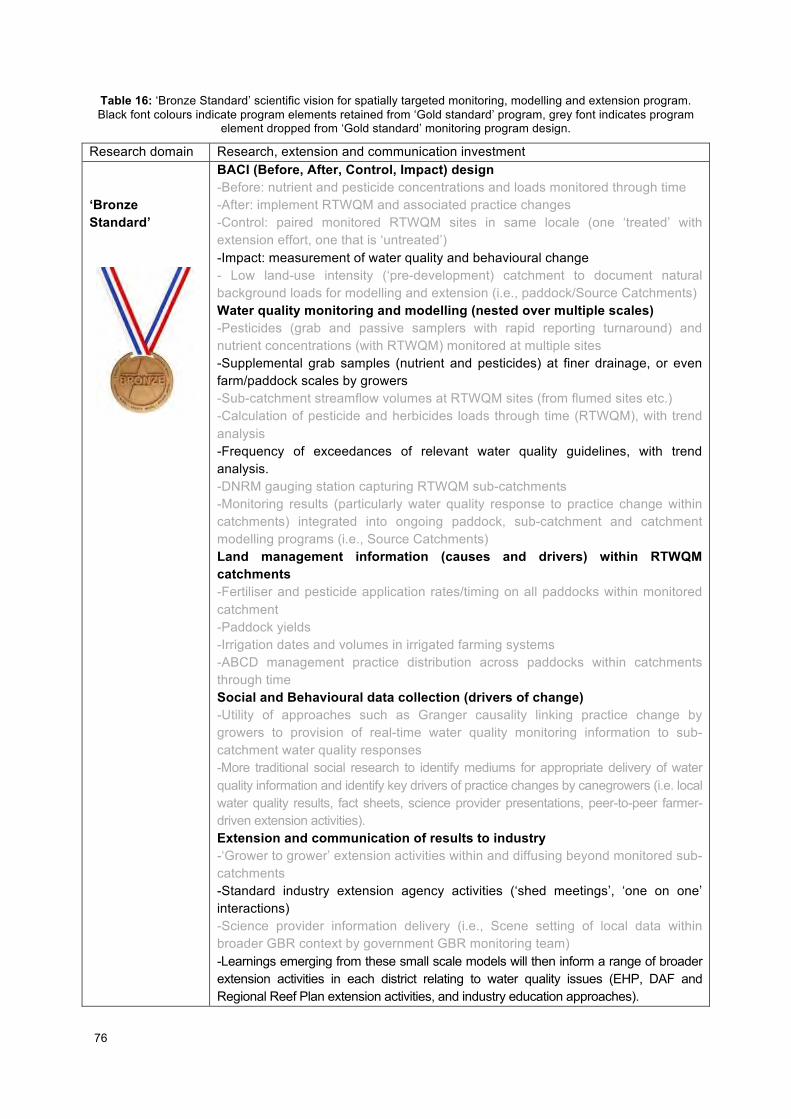
76
Table 16: ‘Bronze Standard’ scientific vision for spatially targeted monitoring, modelling and extension program. Black font colours indicate program elements retained from ‘Gold standard’ program, grey font indicates program
element dropped from ‘Gold standard’ monitoring program design.
Research domain Research, extension and communication investment ‘Bronze Standard’
BACI (Before, After, Control, Impact) design -Before: nutrient and pesticide concentrations and loads monitored through time -After: implement RTWQM and associated practice changes -Control: paired monitored RTWQM sites in same locale (one ‘treated’ with extension effort, one that is ‘untreated’) -Impact: measurement of water quality and behavioural change - Low land-use intensity (‘pre-development) catchment to document natural background loads for modelling and extension (i.e., paddock/Source Catchments) Water quality monitoring and modelling (nested over multiple scales) -Pesticides (grab and passive samplers with rapid reporting turnaround) and nutrient concentrations (with RTWQM) monitored at multiple sites -Supplemental grab samples (nutrient and pesticides) at finer drainage, or even farm/paddock scales by growers -Sub-catchment streamflow volumes at RTWQM sites (from flumed sites etc.) -Calculation of pesticide and herbicides loads through time (RTWQM), with trend analysis -Frequency of exceedances of relevant water quality guidelines, with trend analysis. -DNRM gauging station capturing RTWQM sub-catchments -Monitoring results (particularly water quality response to practice change within catchments) integrated into ongoing paddock, sub-catchment and catchment modelling programs (i.e., Source Catchments) Land management information (causes and drivers) within RTWQM catchments -Fertiliser and pesticide application rates/timing on all paddocks within monitored catchment -Paddock yields -Irrigation dates and volumes in irrigated farming systems -ABCD management practice distribution across paddocks within catchments through time Social and Behavioural data collection (drivers of change) -Utility of approaches such as Granger causality linking practice change by growers to provision of real-time water quality monitoring information to sub-catchment water quality responses -More traditional social research to identify mediums for appropriate delivery of water quality information and identify key drivers of practice changes by canegrowers (i.e. local water quality results, fact sheets, science provider presentations, peer-to-peer farmer-driven extension activities). Extension and communication of results to industry -‘Grower to grower’ extension activities within and diffusing beyond monitored sub-catchments -Standard industry extension agency activities (‘shed meetings’, ‘one on one’ interactions) -Science provider information delivery (i.e., Scene setting of local data within broader GBR context by government GBR monitoring team) -Learnings emerging from these small scale models will then inform a range of broader extension activities in each district relating to water quality issues (EHP, DAF and Regional Reef Plan extension activities, and industry education approaches).
Sub-catchment scale monitoring, modelling and extension design
77
5. PILOT STUDY DESIGN A range of recent (and in some cases ongoing) water quality programs have been conducted across the GBRCA that have explicit hotspot identification and targeted management intervention objectives to improve ‘end-of-catchment’ water quality. These programs can provide valuable ‘pilot program’ examples that fit within the ‘Bronze-Silver-Gold standard’ monitoring framework hierarchy identified in this document, and practical examples of the roll-out of different levels of monitoring investment. They also illustrate the potential ranges and limitations of the datasets and overlying models used in each program. It is important to note that the case studies discussed below each have their own specific origins, objectives, project management structures, timeframes, funding and technical capacities, all of which have placed constraints on the various program designs. None of these programs were ever initially designed to reach complete ‘Gold standard’ monitoring effort (at least initially), but key learnings from each can be used to identify refinements for future broader-scale implementation finer-scale monitoring programs. 5.1 Case study 1: Sub-catchment Water Quality Monitoring for Pesticides in the Plane Catchment, Sandy Creek (RP144P). 5.1.1 Project background and description
The Great Barrier Reef Catchment Loads Monitoring Program (GBRCLMP) monitors and reports on water quality constituents and annual loads of nutrients, sediments and pesticides exiting 14 "priority" Great Barrier Reef catchments as part of Reef Plan 2013 (Turner et al., 2013; Wallace et al., 2014). The GBRCLMP provides high quality data to validate source catchment models which are used to assess progress towards the Reef Plan water quality targets, and also inform extension and policy work; support state and federal investment; and help prioritise regional natural resource management activities. It does this by providing lines of evidence for areas where targeted water quality improvements are needed. GBRCLMP also notifies Queensland Government departments when pesticide concentrations exceed irrigation guidelines in waterways at monitored sites based upon the Australian and New Zealand Water Quality Guidelines. GBRCLMP monitoring in Sandy Creek, part of the Plane Catchment (Mackay-Whitsunday NRM region), has consistently identified multiple exceedances of pesticide irrigation and ecosystem protection guidelines in recent years through monitoring at the Sandy Creek at Homebush gauging station (GS) long-term monitoring site (See Appendix 2). These results from Sandy Creek in many ways encapsulate the monitoring limitations contingent with current broadscale catchment monitoring in the GBRCA identified in section 1.2. Identification of significant catchment water quality issues at broad catchment scales is possible under the current GBRCLMP monitoring framework (from monitoring results obtained at essentially ‘end-of-catchment’ sites). The lack of associated finer sub-catchment scale monitoring data within the catchment, however, limits capacity to identify specific catchment hotspots for pollutant generation-delivery and more effectively target on-ground remedial actions. This pilot study (Project RP144P) represents a collaborative sugarcane industry-Queensland government response to this issue through implementation of a finer, sub-catchment scale monitoring
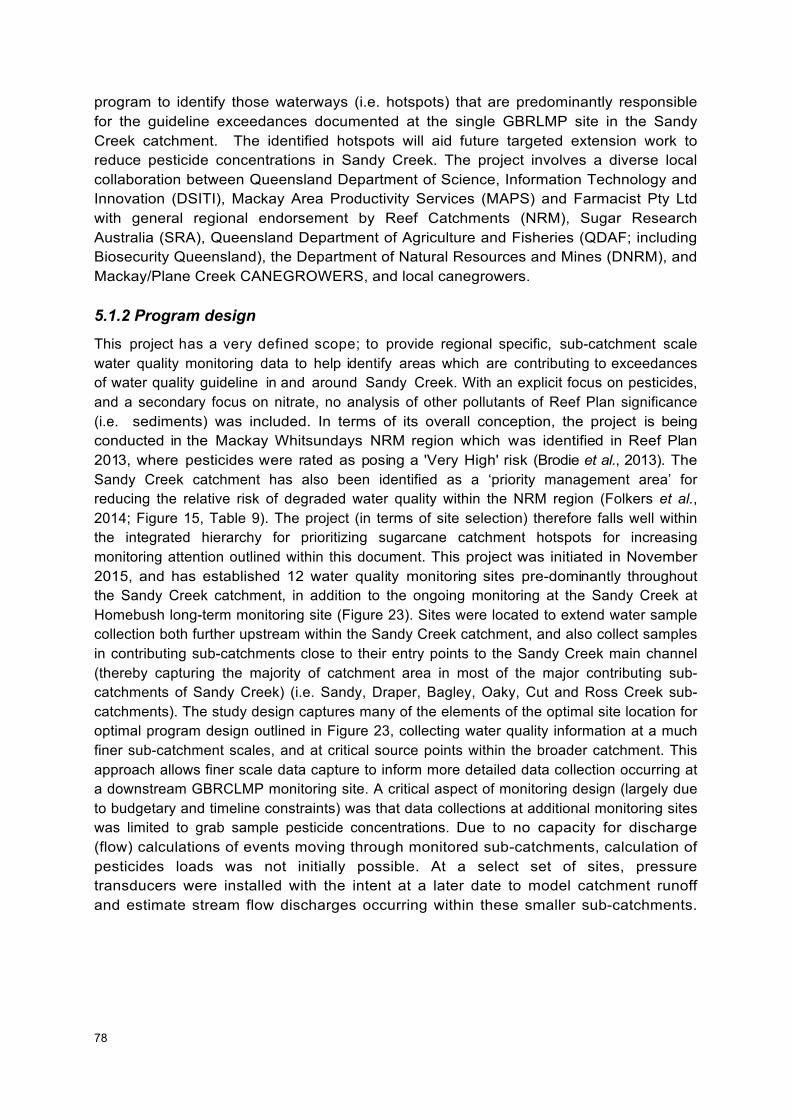
78
program to identify those waterways (i.e. hotspots) that are predominantly responsible for the guideline exceedances documented at the single GBRLMP site in the Sandy Creek catchment. The identified hotspots will aid future targeted extension work to reduce pesticide concentrations in Sandy Creek. The project involves a diverse local collaboration between Queensland Department of Science, Information Technology and Innovation (DSITI), Mackay Area Productivity Services (MAPS) and Farmacist Pty Ltd with general regional endorsement by Reef Catchments (NRM), Sugar Research Australia (SRA), Queensland Department of Agriculture and Fisheries (QDAF; including Biosecurity Queensland), the Department of Natural Resources and Mines (DNRM), and Mackay/Plane Creek CANEGROWERS, and local canegrowers. 5.1.2 Program design This project has a very defined scope; to provide regional specific, sub-catchment scale water quality monitoring data to help identify areas which are contributing to exceedances of water quality guideline in and around Sandy Creek. With an explicit focus on pesticides, and a secondary focus on nitrate, no analysis of other pollutants of Reef Plan significance (i.e. sediments) was included. In terms of its overall conception, the project is being conducted in the Mackay Whitsundays NRM region which was identified in Reef Plan 2013, where pesticides were rated as posing a 'Very High' risk (Brodie et al., 2013). The Sandy Creek catchment has also been identified as a ‘priority management area’ for reducing the relative risk of degraded water quality within the NRM region (Folkers et al., 2014; Figure 15, Table 9). The project (in terms of site selection) therefore falls well within the integrated hierarchy for prioritizing sugarcane catchment hotspots for increasing monitoring attention outlined within this document. This project was initiated in November 2015, and has established 12 water quality monitoring sites pre-dominantly throughout the Sandy Creek catchment, in addition to the ongoing monitoring at the Sandy Creek at Homebush long-term monitoring site (Figure 23). Sites were located to extend water sample collection both further upstream within the Sandy Creek catchment, and also collect samples in contributing sub-catchments close to their entry points to the Sandy Creek main channel (thereby capturing the majority of catchment area in most of the major contributing sub-catchments of Sandy Creek) (i.e. Sandy, Draper, Bagley, Oaky, Cut and Ross Creek sub-catchments). The study design captures many of the elements of the optimal site location for optimal program design outlined in Figure 23, collecting water quality information at a much finer sub-catchment scales, and at critical source points within the broader catchment. This approach allows finer scale data capture to inform more detailed data collection occurring at a downstream GBRCLMP monitoring site. A critical aspect of monitoring design (largely due to budgetary and timeline constraints) was that data collections at additional monitoring sites was limited to grab sample pesticide concentrations. Due to no capacity for discharge (flow) calculations of events moving through monitored sub-catchments, calculation of pesticides loads was not initially possible. At a select set of sites, pressure transducers were installed with the intent at a later date to model catchment runoff and estimate stream flow discharges occurring within these smaller sub-catchments.
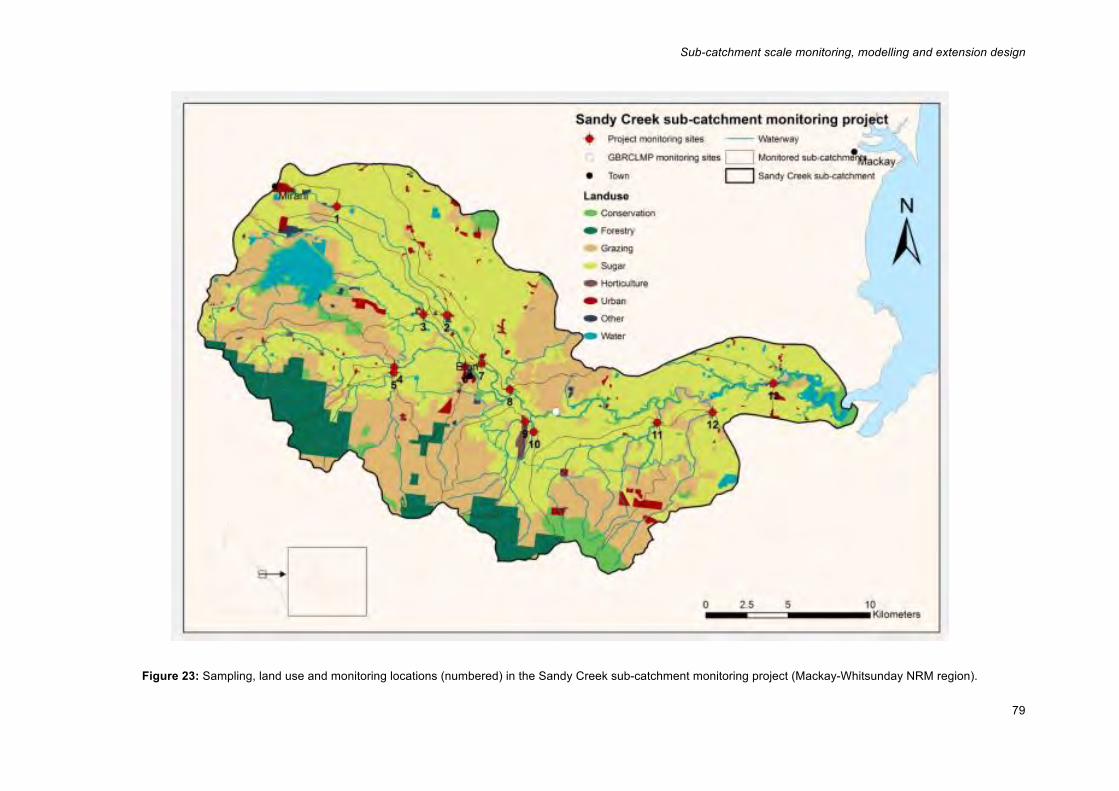
Sub-catchment scale monitoring, modelling and extension design
79
Figure 23: Sampling, land use and monitoring locations (numbered) in the Sandy Creek sub-catchment monitoring project (Mackay-Whitsunday NRM region).
80
Sampling collection at the additional sites was primarily conducted by local cane growers that had been formally trained in correct environmental water sample collection protocols by GBRCLMP (DSITI) staff. Sampling focused on multiple grab samples collected during the first three events of the 2015-16 wet season (as this is when exceedances occur), with sample collection and management coordinated by regional industry representative organisations (MAPS and Farmacist). This approach was specifically designed to foster local ownership of the program and its results, by both regional growers and local industry representative organisations, providing locally relevant data to improve their local waterways. Another important industry engagement aspect of the program design was the effort made to provide more timely (and practice change relevant) feedback to involved growers of sampling/monitoring results. Laboratory pesticide sample analysis often entails delays between sample collection and data reporting of several months (at least), a practical constraint that typically severely limits timely feedback to catchment landholders of the water quality impacts of on-ground management actions. Discussion and collaborations with the laboratory utilized in this case established a rapid analytical turnaround time (results within 10 working days of sample collection), a timeframe much more relevant to landholder opportunity to alter management actions in response to provision of water quality monitoring feedback (at least in the timeframe of the same wet season or for project growers still applying herbicides at the time of reporting). While not providing the almost instantaneous feedback possible with some RTWQM technologies targeting priority pollutants such as nutrients, this approach did allow provision of information to stakeholders in as prompt a timeframe as possible, given the analytical requirements/constraints of pesticides as a water quality indicator. Development and delivery of extension products (apart from two regional presentations) to the community in the Sandy Creek Catchment were also out of the specific scope of this project. 5.1.3 Initial program results
Preliminary results (currently not published and currently in a DRAFT release form possibly subject to change) from samples collected (during two flow events in January 2016) were averaged for diuron and oxidised nitrogen as N (NOx) parameters. This data is pictorially depicted as falling within three categories (Figure 24 and 25): • less than or equal to 25th percentile of data (≤ 25th) • greater than 25th percentile and less than or equal to 75th percentile (>25th & ≤ 75th) • greater than 75th percentile (> 75th) The initial results do highlight possible hot-spot areas above sites 4 and 2 for diuron and sites 4, 8 and the main Sandy Creek branch for nitrate, however interpretation beyond hot spot detection and ecological risk profiles is limited without associated sub-catchment flow data.
Sub-catchment scale monitoring, modelling and extension design
81
Figure 24: Preliminary herbicide monitoring results from Sandy Creek sub-catchment monitoring program. Data is presented as average diuron concentration percentiles (from
two flow events in January 2016) for each monitored sub-catchment. Pie charts show the percentage landuse upstream of each monitoring site.
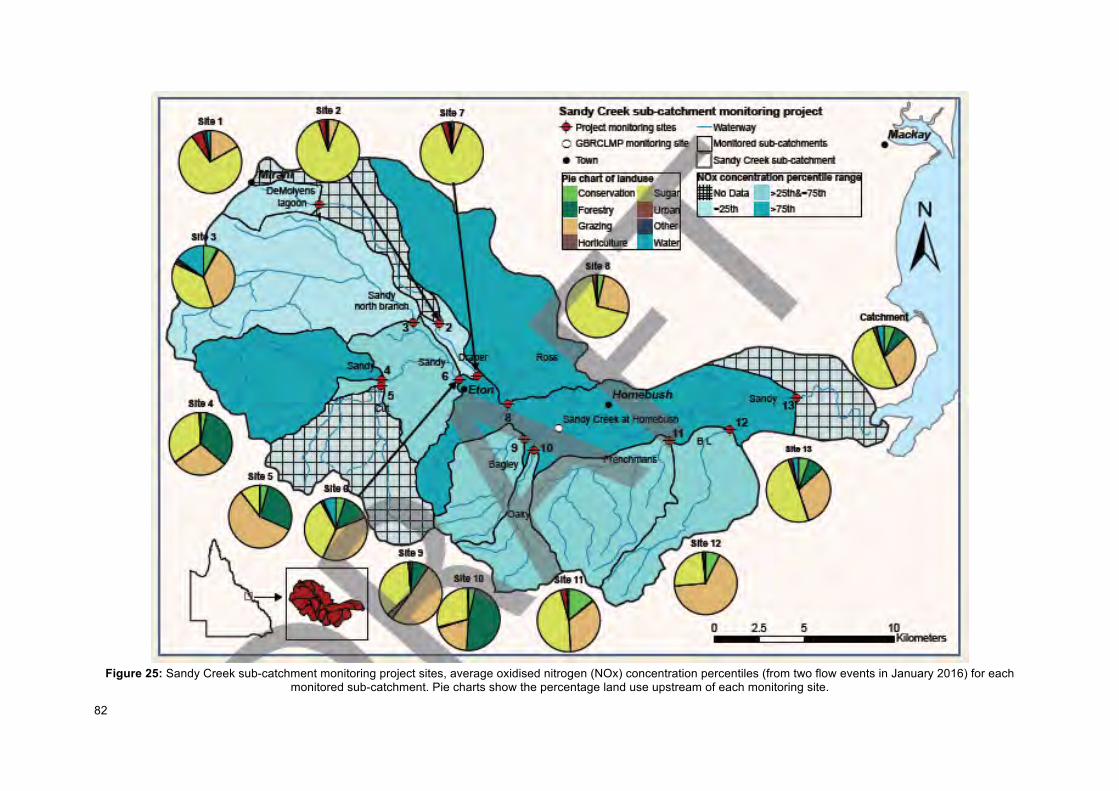
82
Figure 25: Sandy Creek sub-catchment monitoring project sites, average oxidised nitrogen (NOx) concentration percentiles (from two flow events in January 2016) for each
monitored sub-catchment. Pie charts show the percentage land use upstream of each monitoring site.
Sub-catchment scale monitoring, modelling and extension design
83
5.1.4 Program design recommendations
The current program design for project RP144P fits largely within the ‘Bronze’ to ‘Silver standard’.
• Learning from the pilot include particularly the limitations of ‘concentration only’ monitoring approaches in catchments, for example, higher concentrations may occur in smaller flows that do not contribute significantly to annual loads further downstream. Monitoring that reports only concentration data can highlight potential catchment hotspots for additional focus, and serve as a useful communication and engagement tool with local canegrowers. The project is also aligns with and supports non-load aspects of the GBRCLMP such as risk assessments (calculation of ecological risk) which are largely based on monitored concentration data assessed against water quality guidelines based on concentration thresholds. The lack of concurrent streamflow (discharge) data (and associated lack of capacity to calculate pesticide loads) does, however, significantly limit ability to integrate data with catchment load monitoring and modelling initiatives. Strategies to address these program shortcomings are already underway, initially with the use of stream recorded height coupled with rain driven runoff modelling, then with DSITI staff scoping the feasibility of adding streamflow gauging capacity to at least some sites in subsequent years of the program.
• Lack of specific paddock management practice data in targeted catchments (in this case pesticide products and application rates) similarly restricts capacity to translate findings into a form suitable for integration with paddock-catchment scale modelling. More work is needed in this area as there are numerous farmers (between 1 to 55 individual growers) above each monitoring site potentially with different management practices and chemical usage. (http://arcg.is/1UqSwou).
5.2 Case study 2: Herbert Water Quality Monitoring Program monitoring sites 2011–2015.
5.2.1 Project background and description The initial development of the Herbert Water Quality Monitoring Program (HWQMP) was largely driven by Herbert River catchment sugarcane industry representatives who felt that there was insufficient data available on water quality within the Herbert catchment, particularly in relation to the validity of load estimations being calculated as part of the assessment of catchment contributions of pollutants to the Great Barrier Reef (O’Brien et al., 2013). The sugarcane industry did want the ability to gain a better understanding of its impact on regional water quality, the relative contribution of sugarcane land use on the delivery of reef pollutant loads to the receiving waters of the GBR, and investigate ways to address specific issues if they arose. The eventual on-ground project was successful in attracting funding from a range of stakeholders including the Sugar Research and Development Corporation (SRDC), Sugar Research Australia (SRA), Queensland Government Department of Agriculture Fisheries and Forestry (DAFF), Queensland Government Department of Natural Resources and Mines (DNRM), Queensland Government Department of Environment and Heritage Protection (EHP), Hinchinbrook Shire Council (HSC) and the Tablelands Regional Council (TRC).
84
The project monitored sediment, nutrient and pesticide concentrations in surface water samples collected from the various sub-catchments and numerous land uses found in the Herbert River catchment. Specific project objectives established were (O’Brien et al., 2013; 2014):
1. To seek relevant and scientifically robust data to help inform and guide management decisions into the future for land managers within the Herbert Catchment area.
2. Identify sources of pollutants at farm and sub-catchment level to enable issues to be addressed by land managers.
3. Implement a tailored monitoring program to support management decisions, compliment and improve the Paddock to Reef program, compliment grower monitoring and existing research findings.
4. Cross reference the existing grower monitoring activities against a scientifically rigorous monitoring program.
5. Develop appropriate extension strategies to engage growers and industry.
6. Empower industry (especially the sugarcane industry) to drive farm management change practices based upon sound research findings.
5.2.2 Program design Surface water samples were collected from 17 sites which cover the main land uses within the Herbert Catchment – rainforest, mixed cropping, urban, dairy, mining and pastoral grazing in the upper catchment; and sugarcane and urban land uses in the lower catchment (Figure 26). The majority of monitored sub-catchments drained into the Herbert River above long-term gauging stations including the GBRCLMP ‘end-of-catchment’ water quality monitoring site at Herbert River at John Rowe Bridge (GS116001). A number of sites were, however, included that monitored more diffuse streamflow discharge to marine waters (Seymour River, Waterview Creek). Half of all monitoring sites had associated streamflow gauging capacity, and subsequent capability of extending sampled concentration data from the program into sub-catchment load delivery calculation. Much of the project management and on-ground logistical input was conducted by the local TERRAIN NRM group and cane productivity services group (Herbert Cane Productivity Services Limited; HCPSL). The project analytical focus was focussed on Reef Plan priority pollutants such as nutrients, pesticides and total suspended solids (TSS). A number of the monitored sugarcane sub-catchments included priority ‘hotspots’ for inorganic nitrogen and PSII herbicide generation (Table 6; Hateley et al., 2014). While it was not the original intent of the HWQMP, this program, in terms of its overall structure, indicator focus and site selection, falls well within the integrated hierarchy for prioritizing sugarcane catchment hotspots for increased monitoring attention outlined within this document.
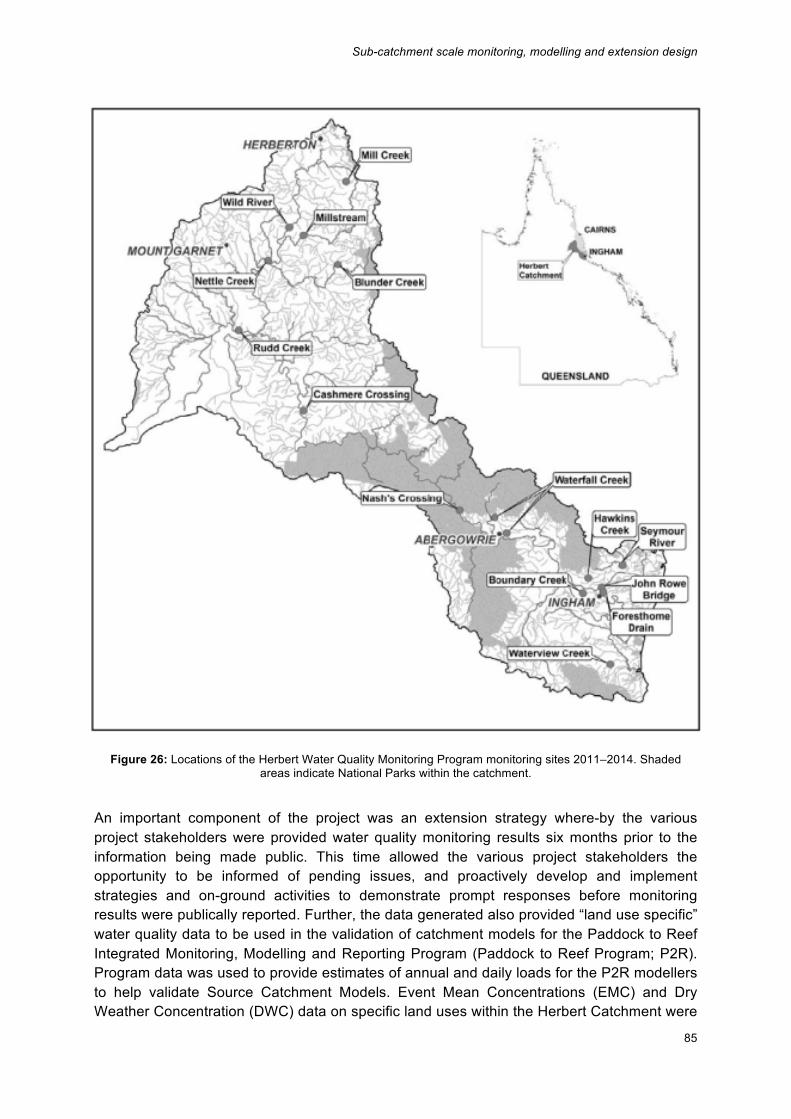
Sub-catchment scale monitoring, modelling and extension design
85
Figure 26: Locations of the Herbert Water Quality Monitoring Program monitoring sites 2011–2014. Shaded areas indicate National Parks within the catchment.
An important component of the project was an extension strategy where-by the various project stakeholders were provided water quality monitoring results six months prior to the information being made public. This time allowed the various project stakeholders the opportunity to be informed of pending issues, and proactively develop and implement strategies and on-ground activities to demonstrate prompt responses before monitoring results were publically reported. Further, the data generated also provided “land use specific” water quality data to be used in the validation of catchment models for the Paddock to Reef Integrated Monitoring, Modelling and Reporting Program (Paddock to Reef Program; P2R). Program data was used to provide estimates of annual and daily loads for the P2R modellers to help validate Source Catchment Models. Event Mean Concentrations (EMC) and Dry Weather Concentration (DWC) data on specific land uses within the Herbert Catchment were
86
also used to validate Source Catchments modelling. By testing pollutant concentrations at a number of existing gauging stations along the length of the Herbert River system, the HWQMP assists with model validation by providing estimates of relative contributions to the end of catchment loads being monitored. The specific sampling methods and monitoring protocols have been described previously (O'Brien et al., 2013). Briefly, all sample collection consisted of manual ‘discrete’ grab water sampling to capture periodic ambient (low flow) conditions and frequent samples as often as was practical over the hydrograph during catchment first flush and major events occurring during the wet season. Because of the constraints posed by lack of sampling instrumentation and site access during floods, local landholders (including several canegrowers) were trained on appropriate sampling protocols, and played an important role in data collection at several sites. Several of the HWQMP sub-catchment water monitoring sites were established in 4 sugarcane sub-catchment areas (Waterfall, Boundary, Waterview and Hawkins Creeks) capturing the spectrum of relatively high to low rainfall gradients and associated farming systems found across the Herbert sugarcane district. On-farm practice data (on pesticide and nutrient applications) was collected by HCSPL from these sub-catchments for the duration of the project. This data provided a useful, quantifiable insight to specific farm practices being undertaken in a sub-catchment and allowed the industry to better understand what impact various farming practices may have on water quality. To ensure that individual grower privacy was maintained, HCPSL only reported on aggregated data to growers, the project stakeholder and technical reference groups. HCPSL did take the opportunity to use aggregated data to engage on a one on one basis with some of its clients seeking opportunities to manage water quality impacts. The DAFF Extension and Education project funded technical agronomic extension staff to provide extension support to the main agricultural commodity groups relevant to the land uses monitored in the HWQMP. This project worked in parallel with the HWQMP, whereby the extension staff reviewed the water quality monitoring results and used it to develop and deliver targeted extension strategies to address water quality issues across the catchment. The project also established a network of extension providers working with the different agricultural commodities and a forum for them to discuss their respective extension projects and assess different extension methodologies and approaches. 5.2.3 Initial program results The specific water quality monitoring results undertaken by the HWQMP, for all land uses have been reported in detail in O’Brien et al., (2013; 2014). With respect to sugarcane industry specific results, nutrient concentrations measured as part of this study were highest in waters draining from sugarcane sites, however the range of concentrations detected and the average concentrations measured in samples collected during event conditions were comparable with concentrations measured in other Australian sugarcane growing regions. A range of sugarcane associated pesticides, including the Reef Plan priority herbicides diuron, hexazinone and atrazine, were frequently measured discharging from sugarcane catchments. Nitrogen levels and some herbicides, including diuron, hexazinone and atrazine, were frequently measured at concentrations exceeding the national guidelines for freshwater
Sub-catchment scale monitoring, modelling and extension design
87
ecosystem protection in waters discharging from sugarcane sites in the Herbert sugarcane sub-catchment area (O’Brien et al., 2014). The project also detected levels of imidacloprid (the primary insecticide used to control sugarcane grubs) just below the Canadian guideline (as there are not currently available Australian water quality guidelines published for this pesticide) for freshwater ecosystem protection in waters discharging from specific sugarcane sub-catchment in the first year of the project (O’Brien et al., 2013). An overview of the range of extension activities engendered by the results (detailed below) underlines the value of locally collected water quality monitoring data (particularly one embedded within a dedicated and explicit extension framework) in highlighting issues and catalysing meaningful on-ground practice changes by primary industries. Extension response to imidacloprid issues In response to frequent detections of imidacloprid in several of the monitored sugarcane catchments, HCPSL conducted a number of grower shed meetings throughout the district to inform growers of the impeding risks associated with the improper use of imidacloprid, its impact on water quality and recommendations for effective grub control with minimal runoff loss (with over 150 growers attending these meetings). Extension engagement and discussion with growers in targeted ‘hotspot’ catchments also highlighted imidacloprid application inefficiencies across several areas, resulting in sub-optimal imidacloprid placement on paddocks. HCPSL and Bayer Crop Science (who have the registered imidacloprid product Confidor®) technical staff reviewed industry practices to investigate ways to minimise imidacloprid impacts on water quality and to better target the pest species. Since the targeted extension approach which commenced in late 2012, there has been a considerable reduction in imidacloprid levels detected in water samples in the sugarcane sub-catchments monitored by the HWQMP, despite increases in area treated with the product (DiBella et al., 2015). Extension response to nitrogen losses In response to the elevated levels of nitrogen in water quality samples collected by the HWQMP and research undertaken by the associated linkage projects (like the Herbert Demonstration Farm and P2R Rainfall Simulation projects), the Herbert industry is now investigating ways to better manage nitrogen losses associated with sugarcane production. The Rainfall Simulation project validated that sub-surface application fertiliser in sugarcane crops had the lowest nitrogen runoff losses when compared to other application methods available to the industry (Cowie et al., 2013). Since the inception of the Australian Government’s Reef Rescue grants program, HWQMP, and reporting of the Rainfall Simulation trial results, there has been a significant shift from surface fertiliser application to sub-surface application, in the Herbert cane growing region. Surface application of fertilisers across the Herbert sugarcane district decreased from 78% of area treated in 2008 to 38 % of area treated in 2013 (unpublished HCPSL data, 2014). This data provided the sugarcane industry an insight into on-farm practices in relation to water quality and allowed the industry to act upon issues as they arose. 5.2.4 Program key learnings and design recommendations The current program design for the HWQMP fits largely within the ‘Bronze’ to ‘Silver standard’.
88
• With an explicit extension focus, the HWQMP has significantly improved ‘human capital’ in the Herbert catchment, with land managers (especially the sugarcane industry) now having a better knowledge concerning water quality pertaining to the various land uses within the Catchment area. The HWQMP framework has been important in bringing together land managers to discuss issues raised by the scientific research and to seek approaches to address issues like the use of nitrogen and products like imidacloprid.
• The collection of specific paddock management practice data in several targeted sugarcane catchments provided important context to local water quality monitoring results. While data was largely aggregated (and not broadly available), there is clear scope to translate findings into a form suitable for integration with paddock-catchment scale modelling initiatives.
• The capacity to integrate gauged streamflow (discharge) data with concentration data at several sites provides considerable potential to integrate program data with concurrent catchment load monitoring and modelling (a significant ‘value-add’ for the program). Locally collected water quality data has also allowed State government Paddock to Reef modellers to use real data generated within the catchment area, instead of implied data from adjacent catchment areas when developing models for managing water quality. The newly acquired knowledge will also allow land managers to be better manage natural resources that they may have an influence upon.
• Institutional capital- The lasting legacy of the HWQMP is that specific land users (like the sugarcane industry) have now invested into long term monitoring of water quality, allowing them to proactively manage issues as they arise. The continued long term monitoring of water quality is done through a collective approach where-by numerous organisations and institutions will work together to collect, collate, report and act upon the data generated.
• The limitations of concentration only data across several sites were quickly apparent. While concentration data can be a useful, simple tool for communication-extension, the lack of capacity to generate catchment load greatly undermines the range of potential uses for the data (trend analyses, input-export quantification etc.). Like the Sandy Creek experiences (section 5.1) strategies to address these program shortcomings are already underway, with DSITI staff currently scoping the feasibility of adding streamflow gauging capacity to at least some sites in subsequent years of the program.
5.3 Case study 3: A Sub Catchment Adaptive Management Approach to Water Quality in Sugarcane (RP102C)
5.3.1 Project background and description This case study project implemented an adaptive management approach to improve water quality in the downstream ecosystems of the Lower Burdekin Irrigation Area by using RTWQM technologies to provide local, almost instantaneous water quality feedback to catchment landholders. The Burdekin River catchment has been identified as one of the catchments, which poses a threat to the Great Barrier Reef. The collaborating sugarcane farmers in the selected sub-catchment were continually supported to assess their farm
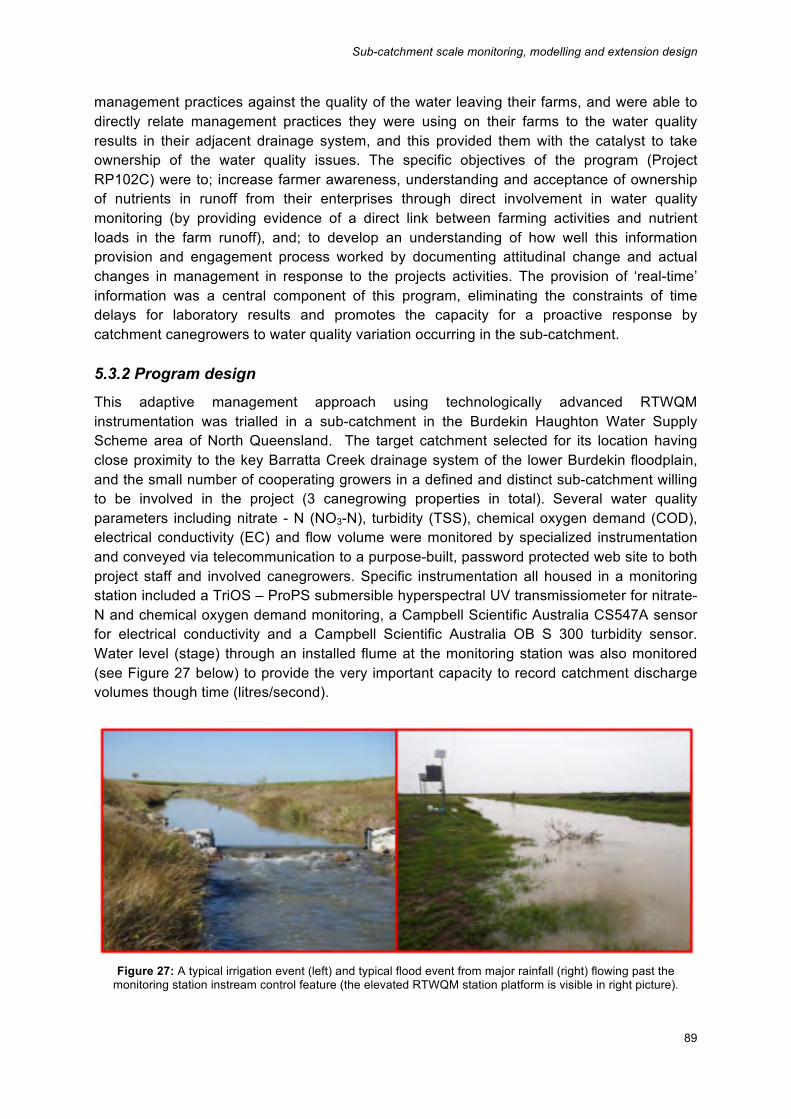
Sub-catchment scale monitoring, modelling and extension design
89
management practices against the quality of the water leaving their farms, and were able to directly relate management practices they were using on their farms to the water quality results in their adjacent drainage system, and this provided them with the catalyst to take ownership of the water quality issues. The specific objectives of the program (Project RP102C) were to; increase farmer awareness, understanding and acceptance of ownership of nutrients in runoff from their enterprises through direct involvement in water quality monitoring (by providing evidence of a direct link between farming activities and nutrient loads in the farm runoff), and; to develop an understanding of how well this information provision and engagement process worked by documenting attitudinal change and actual changes in management in response to the projects activities. The provision of ‘real-time’ information was a central component of this program, eliminating the constraints of time delays for laboratory results and promotes the capacity for a proactive response by catchment canegrowers to water quality variation occurring in the sub-catchment. 5.3.2 Program design This adaptive management approach using technologically advanced RTWQM instrumentation was trialled in a sub-catchment in the Burdekin Haughton Water Supply Scheme area of North Queensland. The target catchment selected for its location having close proximity to the key Barratta Creek drainage system of the lower Burdekin floodplain, and the small number of cooperating growers in a defined and distinct sub-catchment willing to be involved in the project (3 canegrowing properties in total). Several water quality parameters including nitrate - N (NO3-N), turbidity (TSS), chemical oxygen demand (COD), electrical conductivity (EC) and flow volume were monitored by specialized instrumentation and conveyed via telecommunication to a purpose-built, password protected web site to both project staff and involved canegrowers. Specific instrumentation all housed in a monitoring station included a TriOS – ProPS submersible hyperspectral UV transmissiometer for nitrate-N and chemical oxygen demand monitoring, a Campbell Scientific Australia CS547A sensor for electrical conductivity and a Campbell Scientific Australia OB S 300 turbidity sensor. Water level (stage) through an installed flume at the monitoring station was also monitored (see Figure 27 below) to provide the very important capacity to record catchment discharge volumes though time (litres/second).
Figure 27: A typical irrigation event (left) and typical flood event from major rainfall (right) flowing past the
monitoring station instream control feature (the elevated RTWQM station platform is visible in right picture).
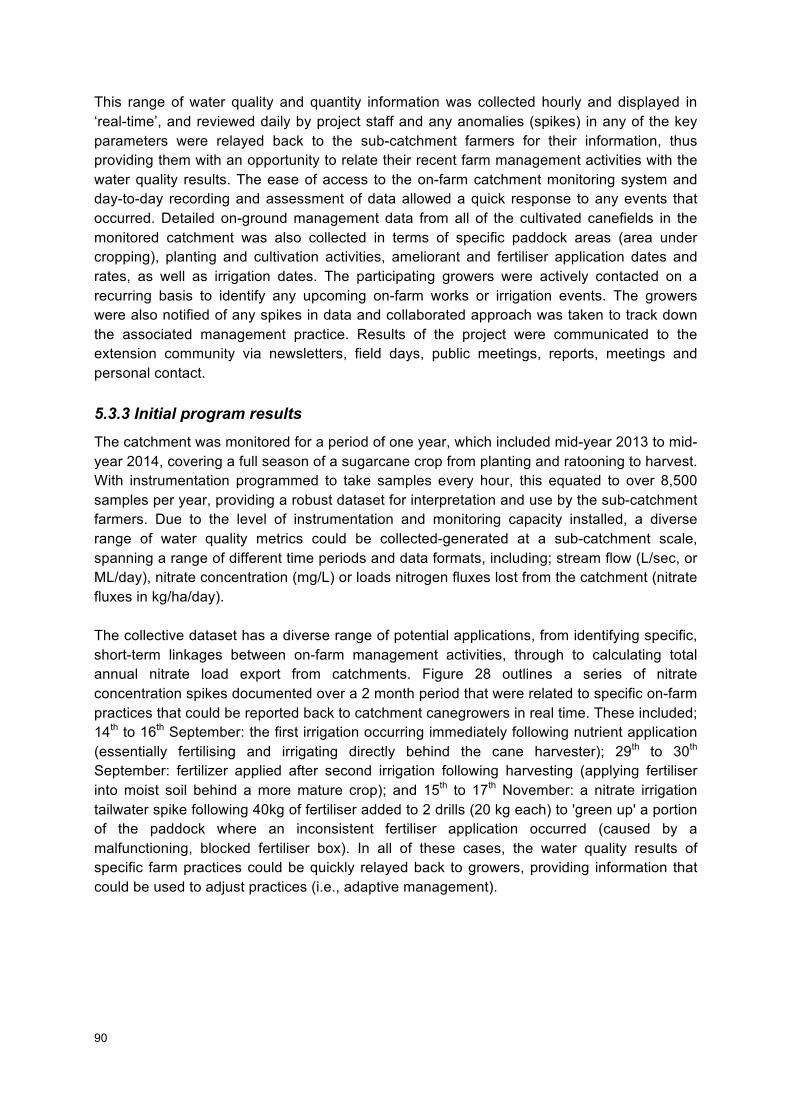
90
This range of water quality and quantity information was collected hourly and displayed in ‘real-time’, and reviewed daily by project staff and any anomalies (spikes) in any of the key parameters were relayed back to the sub-catchment farmers for their information, thus providing them with an opportunity to relate their recent farm management activities with the water quality results. The ease of access to the on-farm catchment monitoring system and day-to-day recording and assessment of data allowed a quick response to any events that occurred. Detailed on-ground management data from all of the cultivated canefields in the monitored catchment was also collected in terms of specific paddock areas (area under cropping), planting and cultivation activities, ameliorant and fertiliser application dates and rates, as well as irrigation dates. The participating growers were actively contacted on a recurring basis to identify any upcoming on-farm works or irrigation events. The growers were also notified of any spikes in data and collaborated approach was taken to track down the associated management practice. Results of the project were communicated to the extension community via newsletters, field days, public meetings, reports, meetings and personal contact. 5.3.3 Initial program results The catchment was monitored for a period of one year, which included mid-year 2013 to mid-year 2014, covering a full season of a sugarcane crop from planting and ratooning to harvest. With instrumentation programmed to take samples every hour, this equated to over 8,500 samples per year, providing a robust dataset for interpretation and use by the sub-catchment farmers. Due to the level of instrumentation and monitoring capacity installed, a diverse range of water quality metrics could be collected-generated at a sub-catchment scale, spanning a range of different time periods and data formats, including; stream flow (L/sec, or ML/day), nitrate concentration (mg/L) or loads nitrogen fluxes lost from the catchment (nitrate fluxes in kg/ha/day). The collective dataset has a diverse range of potential applications, from identifying specific, short-term linkages between on-farm management activities, through to calculating total annual nitrate load export from catchments. Figure 28 outlines a series of nitrate concentration spikes documented over a 2 month period that were related to specific on-farm practices that could be reported back to catchment canegrowers in real time. These included; 14th to 16th September: the first irrigation occurring immediately following nutrient application (essentially fertilising and irrigating directly behind the cane harvester); 29th to 30th September: fertilizer applied after second irrigation following harvesting (applying fertiliser into moist soil behind a more mature crop); and 15th to 17th November: a nitrate irrigation tailwater spike following 40kg of fertiliser added to 2 drills (20 kg each) to 'green up' a portion of the paddock where an inconsistent fertiliser application occurred (caused by a malfunctioning, blocked fertiliser box). In all of these cases, the water quality results of specific farm practices could be quickly relayed back to growers, providing information that could be used to adjust practices (i.e., adaptive management).
Sub-catchment scale monitoring, modelling and extension design
91
Figure 28: A two month continuous data record of Nitrate-N concentration (mg/L) over time at the monitoring site weir. Key nitrate spikes relating to on-farm management activities are highlighted in red (details outlined below).
The long-term, but high resolution dataset generated also provided several insights into longer-term nitrate load export dynamics through time in the monitored sub-catchment. In the 2014 monitoring year for example, more than three-quarters of the nitrate-nitrogen exported from the catchment (kg/ha/year) was lost in rainfall runoff, rather than irrigation events (Burton et al., 2014; data not presented). Data in this format (particularly in associated with the specific nutrient management data collected on each farm-paddock in the monitored catchment) could also be translated into calibration or ‘ground-truthing’ of catchment modelling initiatives currently underpinning much of our current understanding of load exports in the GBRCA. Interviews conducted with collaborating growers highlighted the considerable potential value of targeted RTWQM approaches at small catchment scales. Growers (initially skeptical of their role in water quality issues) were in the majority convinced of a relationship between farm management practices and sub-catchment water quality; were satisfied with the quality (and hence credibility) of the data being collected; and all considered making adjustments to farm practices based on the feedback from the water quality results (i.e. recycling runoff water, changes to irrigation and/or nutrient management practices, use of alternative products). Specific management practices actually implemented following the first year of the project included; delaying fertilizer application until after first irrigation; increased irrigation tailwater recycling capacity by two growers; and adjustment to bed configuration and fertilizer placement to make sure it is more effectively accessed by plants (Burton et al., 2014).
92
5.3.4 Program design recommendations
This RTWQM program (essentially the first to be rolled out in the GBRCA) fits largely within a ‘Silver’ to ‘Gold’ standard for monitoring design (see Tables 14 to 16). Many of the limitations of this particular program within the optimal monitoring program framework outlined in this study are perhaps associated with the lack of spatial replication, rather than specific flaws. While resource and data intensive, the robust datasets collected under a study such as this has a broad and flexible range of potential applications. The capacity for quantification of specific load losses of target pollutants (kg of nitrate-N lost per hectare through time for example) has a range of applications as both an extension tool, but also more robust calibration or integration with sub-catchment monitoring/modelling efforts. Data can be presented in input based (i.e., proportionate losses of xx kg/ha of fertiliser nitrogen applied to paddocks) or Reef Plan load reduction-focussed formats (50% load reduction targets) relevant to engagement or extension with catchment landholders. Data in these formats also have added value in the capacity to be integrated relatively seamlessly with broader GBRCLMP monitoring or informing or calibrating P2R monitoring-modelling initiatives at sub-catchment scales. This project does, however, also highlight the significant investment required to implement this level of monitoring at even a small scale. Some of the specific learnings emerging from recent RTWQM initiatives such as project RP102C in the GBRCA (Tom McShane, BBIFMAC pers. comm.) included;
• The additional time commitments (particularly for more remote sites) where the previously unanticipated requirements for more frequent sensor maintenance and calibrations significantly increased operational workload commitments. These requirements need to be factored into future project budgetary and capacity plans.
• While nitrate sensors can provide high quality datasets, they do have finite deployment lifespans (TriOS ProPS deuterium lamp life is ~1,000 hours), and breakdowns of probes and associated equipment (vacuum pumps etc.) are not uncommon. Sensors probably require routine shipment back to manufacturers every 2 years (possibly more frequently) for servicing, with spare sensors or and other backup equipment needed for breakdowns or sensor rotations to minimise data record losses.
• If streamflow gauging (discharge volume) calculations are required for a small sub-catchment site, streamflow ratings for high flow events are likely to be particularly problematic to accurately quantify, and pose a major challenge for data veracity. In irrigated systems where frequent, small scale runoff events occur throughout much of the year and cane, flow-stream height relations at low streamflow levels can be relatively easily developed. High flow events (i.e. high stream heights) are much more challenging to accurately gauge, an issue which is likely to be especially challenging for rainfall-dominated systems where the majority of pollutant export occurs in high streamflow flood events. There may be requirements at sites to involve specialist capacity (i.e., government hydrographic staff) to target gaugings at specific sites to provide more accurate stream height-flow relationships at monitoring stations.
• Testing and calibration of sensing equipment prior to deployment is essential for robust monitoring results (i.e., knowledge of likely nitrate concentrations to refine deployment calibration and monitoring site-specific sensor scan times).
Sub-catchment scale monitoring, modelling and extension design
93
6. CONCLUSIONS AND RECOMMENDATIONS
6.1 Conclusions
Recent GBR and global experiences increasingly recognise that despite its ‘diffuse’ nature, non-point source pollution still often originates in ‘hotspots’ or ‘critical source areas’ from a small portion of the landscape, areas which can be targeted for maximum intervention efficiency. Global examples increasingly suggest that unfocused implementation of catchment scale water quality remediation efforts that miss critical source areas of pollutants, can provide minimal end-of-catchment water quality responses. Spatial targeting analyses – which address the question of where scarce resources should be used to achieve natural resource policy goals – are being increasingly advocated as a vital prioritisation mechanism for water quality improvements in agricultural watersheds to meet ecological goals. Finer scale water quality monitoring projects integrating farm up to small watershed-scale monitoring-management frameworks (with a key emphasis on stakeholder collaboration and participatory learning processes) linking with this philosophy are now key mechanisms for achieving water quality improvements in several countries grappling with similar diffuse water quality pollution issues to the GBRCA. Due to issues of scale and monitoring program objectives, much of the current long-term water quality monitoring in the GBR catchment is limited in its capacity to identify specific pollutant export ‘hotspots’, where more targeted extension, incentive or regulation effort could be focussed. Nor does it occur at the time and spatial scale that can influence farmers’ behaviour, and often lack an explicit or coordinated extension strategy (instead having a predominantly monitoring/modelling focus). Canegrower concerns over the validity of current catchment monitoring and modelling efforts, and the lack of locally relevant water quality data are also recurrent themes emerging from cane industry engagement across the GBRCA. The concept of spatially targeted monitoring programs is yet to be broadly assessed in the GBR catchment context. This NESP project has outlined the design options for implementation of finer scale water quality monitoring capable of identifying pollutant generation hotspots in sugarcane growing catchments in the GBRCA, and how to use this monitoring to support future water quality monitoring-modelling, and industry extension and engagement initiatives. It is developed on the basis of end-user workshops, existing conceptual models and catchment risk assessments, and monitoring and modelling programs, for subsequent implementation with industry support to identify reef pollutant “spikes/hotspots”, their causes and the necessary areas for extension to improve management. This monitoring program framework (based on National Water Quality Management Strategy Guidelines) prescribes a standard water quality monitoring framework structure that can be applied in any sub-catchment in the GBRCA. 6.2 Where to from here?
Regardless of the ongoing level of investment targeted at sub-catchment scale monitoring in the GBRCA, it is certain to continue in some shape or form into the future. The range of ‘bronze’ to ‘gold’ standard program designs presented here offer some flexibility in the level of investment required to meet different program objectives. The significant variation in the potential range of data uses and scope for integration with other programs concomitant with
94
these different levels of investment also needs to be clearly recognised. If sub-catchment monitoring is to move beyond rudimentary ‘concentration’ only data presentation, toward robust and versatile data collection with a range of uses, it will require major and ongoing investment across different levels of government and industry. Some level of caution is also required with regard to the likely timelines required for program roll-out and delivery. Financial funding and investment issues aside, there are also significant time and local capacity investments required to develop a robust water quality monitoring program, particularly at sub-catchment scale. It may in fact be better to structure the roll-out the ultimate vision of gold standard monitoring as a staged, evolutionary approach, starting at bronze-silver level, and gradually building upon the knowledge base gained through time in an iterative approach to achieve a final monitoring design. Appropriate conceptualisation of the key indicators, spatial and temporal loss dynamics, catchment hotspots (which may not entail initial outlays) will be needed to provide critical, locally relevant data to ensuring ultimate design in terms of requisite instrumentation, sampling location etc is optimally implemented. Another key point is to manage expectations about what fine-scale monitoring can truly achieve with regard to eliciting practice changes. While recent technological advance may represent exciting developments in our capacity to deliver prompt locally relevant data to landholders, and they hold considerable behavioural change potential, the expectations that simply providing local data will always engender significant practice change should be tempered. Emerging sociological studies suggests even provision of genetic data relating to presumably emotive data such as individual’s disease risks does little to provoke behavioural change (Holland et al., 2016). Recent experiences advise against policy reliance on single modes of control or management mechanisms, and small sub-catchment scale monitoring approaches will almost certainly need to be part of a broader, coordinated policy landscape (see Worrall et al., 2009; Osmond et al., 2012).
Sub-catchment scale monitoring, modelling and extension design
95
7. REFERENCES ANZECC and ARMCANZ 2000. Australian guidelines for water quality monitoring and
reporting. National Water Quality Management Strategy Paper No 7, Australian and New Zealand Environment and Conservation Council & Agriculture and Resource Management Council of Australia and New Zealand, Canberra. Australian Capital Territory, Australia.
APHA. 1998. Standard Methods for the Examination of Water and Wastewater. 20th Edition, American Public Health Association, Water Environment Federation, American Water Works Association, Washington, USA.
Armour, J. D., Nelson, P. N., Daniells, J. W., Rasiah, V., and Inman-Bamber, N. G. 2013. Nitrogen leaching from the root zone of sugarcane and bananas in the humid tropics of Australia. Agriculture, Ecosystems and Environment 180, 68-78.
Bainbridge, Z.T., Brodie, J.E., Faithful, J.W., Sydes, D.A., and Lewis, S.E. 2009. Identifying the land-based sources of suspended sediments, nutrients and pesticides discharged to the Great Barrier Reef from the Tully-Murray Basin, Queensland, Australia. Marine and Freshwater Research 60, 1081–1090.
Barnes, A.P., Toma, L., Willock, J., and Hall, C. 2012. Comparing a “budge” to a “nudge”: Farmer responses to voluntary and compulsory compliance in a water quality management regime. Journal of Rural Studies 38, 448–459. doi: 10.1016/j.jrurstud.2012.09.006.
Bartley, R., Bainbridge, Z.T., Lewis, S.E., Kroon, F.J., Wilkinson, S.N., Brodie, J.E. and Silburn, D.M., 2014. Relating sediment impacts on coral reefs to watershed sources, processes and management: A review. Science of the Total Environment 468–469C, 1138-1153, http://dx.doi.org/10.1016/j.scitotenv.2013.09.030.
Bennett, F. Dickson, M., Park, G., Roberts, A. 2015. Water Quality Improvement Plan for the Burnett Mary 2015, Burnett-Mary Regional Group, Bundaberg, Australia. 171 pp. http://www.bmrg.org.au/resources/publications/water-quality-improvement-plans/
Biber, E. 2013. The Challenge of Collecting and Using Environmental Monitoring Data. Ecology And Society, 18, 68. doi:10.5751/es-06117-180468.
Blackstock, K.L., Ingram, J., Burton, R., Brown, K.M., and Slee, B. 2010. Understanding and influencing behaviour change by farmers to improve water quality. Science of the Total Environment 408, 5631-5638.
Brodie, J. E., and Mitchell, A. W. 2005. Nutrients in Australian tropical rivers: changes with agricultural development and implications for receiving environments. Marine and Freshwater Research 56, 279-302.
Brodie, J.E., Devlin, M.J., Haynes, D., and Waterhouse, J. 2011. Assessment of the eutrophication status of the Great Barrier Reef lagoon (Australia). Biogeochemistry 106, 281–302. Online, doi:10.1007/s10533-010-9542-2.
Brodie, J.E., Kroon, F.J., Schaffelke, B., Wolanski, E.C., Lewis, S.E., Devlin, M.J., Bohnet, I.C., Bainbridge, Z.T., Waterhouse, J., and Davis, A.M. 2012. Terrestrial pollutant runoff to the Great Barrier Reef: an update of issues, priorities and management responses. Marine Pollution Bulletin 65, 81-100.
Brodie, J., Waterhouse, J., Schaffelke, B., Johnson, J.E., Kroon, F., Thorburn, P., Rolfe, J., Lewis, S., Warne, M.St.J., Fabricius, K., McKenzie, L., and Devlin, M. 2013a. Reef Water Quality Scientific Consensus Statement 2013. Department of the Premier and Cabinet, Queensland Government, Brisbane.
Brodie, J., Waterhouse, J., Schaffelke, B., Furnas, M., Maynard, J., Collier, C., Lewis, S., Warne, M., Fabricius, K., Devlin, M., McKenzie, L., Yorkston, H., Randall, L., and
96
Bennett, J. 2013b. “Relative risks to the Great Barrier Reef from degraded water quality” in Synthesis of evidence to support the Reef Water Quality Scientific Consensus Statement 2013, Department of the Premier and Cabinet, Queensland Government, Brisbane. http://www.reefplan.qld.gov.au/about/scientific-consensus-statement/assets/scsu-chapter-3-relative-risks.pdf
Burton, E., McShane T.J., and Stubbs, D. 2014. A Sub Catchment Adaptive Management Approach To Water Quality in Sugarcane. Burdekin Bowen Integrated Floodplain Management Advisory Committee (BBIFMAC). 42pp.
Carpenter, S.R., Caraco, N.F., Correll, D.L., Howarth, R.W., Sharpley, A.N., and Smith, V.H. 1998. Nonpoint pollution of surface waters with phosphorus and nitrogen. Ecological Applications 8, 559–568.
Carroll, C., Waters, D., Vardy, S., Silburn, D.M., Attard, S., Thorburn, P.J., Davis, A.M., Halpin, N., Schmidt, M., Wilson, B., and Clark, A. 2012. A paddock to reef monitoring and modelling framework for the Great Barrier Reef: Paddock and catchment component, Marine Pollution Bulletin 65, 136–149.
Carwardine, J., Klein, C. J., Wilson, K. A., Pressey, R. L., and Possingham, H. P. 2009. Hitting the target and missing the point: Target-based conservation planning incontext. Conservation Letters 2, 4–11.
Connor, S., Nelson, P. N., Armour, J. D., and Hénault, C. 2012. Hydrology of a forested riparian zone in an agricultural landscape of the humid tropics. Agriculture, Ecosystems and Environment 180, 111-122.
Cowie, B., Shaw, M., Davison, L., Tang, W., DiBella, L., Benson, A., and Nash, M. 2013. Comparing runoff loss of knockdown and residual herbicides in the Herbert catchment. Reef Water Quality Protection Plan Secretariat, viewed 17-may-2013, <www.reefplan.qld.gov.au/measuring-success/case-studies/case-studies-sugarcane/comparing-runoff-loss.aspx>. Department of Natural Resources and Mines, Herbert Cane Productivity Services Ltd, Terrain Natural Resource Management, Tropwater James Cook University, Queensland.
Davis, A.M., Thorburn, P.J., Lewis, S.E., Bainbridge, Z.T., Attard, S.J., Milla, R., and Brodie, J.E. 2013. Environmental impacts of fully irrigated sugarcane production: Herbicide run-off dynamics from farms and associated drainage systems. Agriculture, Ecosystems and Environment 180, 123-135.
Davis, A.M., Lewis, S.E., Bainbridge, Z.T., Glendenning, L., Turner, R.D.R., and Brodie, J.E. 2012. Dynamics of herbicide transport and partitioning under event flow conditions in the lower Burdekin region, Australia. Marine Pollution Bulletin 65, 182-93.
Davis, A.M., Pearson, R.G., Butler, B. and Brodie, J.E. 2016a. Review and conceptual models of agricultural impacts and water quality in waterways of the Great Barrier Reef catchment area. Marine and Freshwater Research.
Davis, A.M., Tink, M., Rohde, K., and Brodie, J.E. 2016b. Urea contributions to dissolved ‘organic’ nitrogen losses from intensive, fertilised agriculture. Agriculture, Ecosystems and Environment, 223, 190-196. http://dx.doi.org/10.1016/j.agee.2016.03.006
Davis, A.M., and Pradolin, J. 2016. Precision herbicide application technologies to decrease herbicide losses in furrow irrigation outflows in a north-eastern Australian cropping system. Journal of Agricultural and Food Chemistry. In press.
DPC (Department of Premier and Cabinet) 2013. Paddock to Reef Program – Integrated monitoring, modelling and reporting. Program Design 2013-2018. Reef Water Quality Protection Plan Secretariat, Brisbane, Australia.
Sub-catchment scale monitoring, modelling and extension design
97
Di Bella, L., O’Brien, D., Nash, M. and Wegscheidl, C. 2015. Targeted extension strategies to improve water quality outcomes in the Australian sugarcane industry. Rural Extension and Innovation Systems Journal 11, 184-191.
Di Blasi, J. I. P., Martínez Torres, J. García Nieto, P. J. Alonso Fernández, J. R., Díaz Muñiz, C., and Taboada, J. 2013. Analysis and detection of outliers in water quality parameters from different automated monitoring stations in the Miño river basin (NW Spain), Ecological Engineering 60, 60–66,
Dight, I., 2009a. Burdekin Water Quality Improvement Plan. NQ Dry Tropics, Townsville. Dight, I., 2009b. Burdekin Water Quality Improvement Plan Catchment Atlas. NQ Dry
Tropics, Townsville, Queensland. Doremus, H. 2003. A policy portfolio approach to biodiversity protection on private lands.
Environmental Science and Policy 6, 217–232. Fabricius, K.E., Okaji, K., and De’ath, G. 2010. Three lines of evidence to link outbreaks of
the crown-of-thorns seastar Acanthaster planci to the release of larval food limitation. Coral Reefs 29, 593–605.
Folkers, A., Rohde, K., Delaney, K., and Flett, I. 2014. Mackay Whitsunday Water Quality Improvement Plan 2014-2021. Reef Catchments and Australian Government. http://reefcatchments.com.au/files/2015/06/WATER-QUALITY-IMPROVEMENT-PLAN-MACKAY-WHITSUNDAY-ISAAC-2014-2021_DRAFT.pdf
Fitzroy Basin Association 2015. Fitzroy Water Quality Improvement Plan. Online at http://riverhealth.org.au/projects/fba-wqip/. Accessed 1 April 2016.
Furnas, M.J., 2003. Catchments and Corals: Terrestrial Runoff to the Great Barrier Reef. Australian Institute Marine Science, Townsville.
Gallen, C., Devlin, M., Thompson, K., Paxman, C., and Mueller, J. 2014. Pesticide monitoring in inshore waters of the Great Barrier Reef using both time-integrated and event monitoring techniques (2013 - 2014). The University of Queensland, The National Research Centre for Environmental Toxicology (Entox).
Glasgow, H. B., Burkholder, J. M., Reed, R. E., Lewitus, A. J., and Kleinman, J. E. 2004. Real-time remote monitoring of water quality: A review of current applications, and advancements in sensor technology, telemetry, and computing technologies. Journal of Experimental Marine Biology and Ecology 300, 409-448.
Goolsby, D.A., Battaglin, W.A., Aulenbach, B.T., and Hooper, R.P. 2000. Nitrogen flux and sources in the Mississippi River Basin. Science of the Total Environment 248, 75–86.
Great Barrier Reef Marine Park Authority. 2014. Great Barrier Reef Outlook Report 2014. GBRMPA, Townsville.
Hateley, L.R., Ellis, R., Shaw, M., Waters, D., and Carroll, C. 2014. Modelling reductions of pollutant loads due to improved management practices in the Great Barrier Reef catchments – Wet Tropics NRM region, Technical Report, Volume 3, Queensland Department of Natural Resources and Mines, Cairns, QLD (ISBN: 978-0-7345-0441-8).
Hermosín, M.C., Calderón, M.J., Real, M., and Cornejo, J., 2013. Impact of herbicides used in olive groves on waters of the Guadalquivir river basin (Southern Spain). Agriculture, Ecosystems and Environment 164, 229–243.
Higham W., Howley C., Carroll J., Shellberg J., and Price J. 2016. Eastern Cape York Water Quality Improvement Plan, Cape York Natural Resource Management and South Cape York Catchments, Cooktown, Queensland, Australia.
Hirsch, R.M., Slack, J.R., and Smith, R.A. 1982. Techniques of trend analysis for monthly water quality data. Water Resources Research 18, 107–121.
98
Hollands, G.J., French, D.P. Griffin, S.J., Toby Prevost, A., Sutton, S., King, S., and Marteau, T.M. 2016. The impact of communicating genetic risks of disease on risk-reducing health behaviour: systematic review with meta-analysis. BMJ 2016; 352 doi: http://dx.doi.org/10.1136/bmj.i1102
Horowitz, A.J. 2013. A review of selected inorganic surface water quality-monitoring practices: are we really measuring what we think, and if so, are we doing it right? Environmental Science and Technology 47, 2471–2486. http://dx.doi.org/10.1021/es304058q.
Hunter, H.M. 2012. Nutrients and herbicides in groundwater flows to the Great Barrier Reef lagoon: processes, fluxes and links to on-farm management. ISBN: 978-1-7423-0969.
Johnes, P.J., and Burt, T.P. 1993. Nitrate in surface waters. T.P. Burt, A.L. Heathwaite, S.T. Trudgill (Eds.), Nitrate: Processes, Patterns and Management, John Wiley and Sons, Chichester, UK (1993), pp. 269–317.
Kalcic, M.M., Frankenberger, J., Chaubey, I., Prokopy, L., and Bowling, L. 2015. Adaptive Targeting: Engaging Farmers to Improve Targeting and Adoption of Agricultural Conservation Practices. Journal of the American Water Resources Association 51, 973-991. DOI: 10.1111/1752-1688.12336
Kay, P., Grayson, R., Phillips, M., Stanley, K., Dodsworth, A., Hanson, A., Walker, A., Foulger, M., McDonnell, I. and Taylor, S. 2012. The Effectiveness of Agricultural Stewardship for Improving Water Quality at the Catchment Scale: Experiences from an NVZ and ECSFDI Watershed. Journal of Hydrology, 422-423, 10-16.
Kennard, M., Pusey, B., Olden, J., Mackay, S., Stein, J. and Marsh, N. 2010. Ecohydrological classification of natural flow regimes to support environmental flow assessments: an Australian case study. Freshwater Biology 55, 171–193.
Kennedy, I., Rose, M., Crossan, A., and Burns, M. 2013. Research and practice: environmental action for improving water quality in cotton catchments since 1990. Crop and Pasture Science 64, 1095-1111.
Kleinman, P.J.A., Sharpley, A.N., McDowell, R.W., Flaten, D.N., Buda, A.R., Tao, L., Bergstrom, L., and Zhu, Q., 2011. Managing agricultural phosphorus for water quality protection: principles for progress. Plant Soil 349, 169-182.
Kronvang, B., Andersen, H. E., Børgesen, C., Dalgaard, T., Larsen, S. E., Bøgestrand, J., and Blicher-Mathiasen, G. 2008. Effects of policy measures implemented in Denmark on nitrogen pollution of the aquatic environment. Environmental Science and Policy 11, 144–152.
Kovacs, A., Honti, M., Zessner, M., Eder, A., Clement, A., and Blöschl, G. 2012. Identification of Phosphorus Emission Hotspots in Agricultural Catchments. Science of the Total Environment 433, 74–88.
Kroon, F.J., Schaffelke, B. and Bartley, R. 2014. Informing policy to protect coastal coral reefs: Insight from a global review of reducing agricultural pollution to coastal ecosystems. Marine Pollution Bulletin 85, 33–41.
Lewis, S.E., Brodie, J.E., Bainbridge, Z.T., Rohde, K., Davis, A.M., Masters, B., Maughan, M., Devlin, M.J., Mueller, J. and Schaffelke, B. 2009. Herbicides: a new threat to the Great Barrier Reef. Environmental Pollution 157, 2470-2484.
Lewis, S.E. Bainbridge, Z.T. Kuhnert, P.M. Sherman, B.S. Henderson, B. Dougall, C. Cooper, M. and Brodie, J.E. 2013a. Calculating sediment trapping efficiencies for reservoirs in tropical settings: a case study from the Burdekin Falls Dam, NE Australia. Water Resources Research 49, 1017-1029.
Sub-catchment scale monitoring, modelling and extension design
99
Lewis, S., Smith, R., O’Brien, D., Warne, M.St.J., Negri, A., Petus, C., da Silva, E., Zeh, D. Turner, R.D.R., Davis, A., Mueller, J., and Brodie, J. 2013b. Chapter 4: Assessing the risk of additive pesticide exposure in Great Barrier Reef ecosystems. In: Assessment of the relative risk of water quality to ecosystems of the Great Barrier Reef: Supporting Studies. A report to the Department of the Environment and Heritage Protection, Queensland Government, Brisbane. TropWATER Report 13/30, Townsville, Australia.
Lewis S., Bartley R., Bainbridge Z., Wilkinson, S., Burton J., and Bui, E. 2015. Burdekin sediment story. Report No. 15/50 for the NQ Dry Tropics NRM, Centre for Tropical Water & Aquatic Ecosystem Research (TropWATER) Publication, James Cook University, Townsville, 42 pp.
Libiseller, C., and Grimvall, A., 2002. Performance of partial Mann-Kendall tests for trends detection in the presence of covariates. Environmetrics 13, 71–84.
Lubell, M. and Fulton, A. 2008. Local Policy Networks and Agricultural Watershed Management. Journal of Public Administration Research and Theory, 18, 673-696. http://dx.doi.org/10.1093/jopart/mum031
Margules, C. R., and Pressey, R. L. 2000. Systematic conservation planning. Nature 405, 243–253.
Marshall, J., McGregor, G., Marshall, S., Radcliffe, T., and Lobegeiger, J. 2006. Development of conceptual pressure-vector-response models for Queensland riverine ecosystems, Queensland Department of Natural Resources, Mines and Water, Indooroopilly.
Masters, B., Rohde, K., Gurner, N., and Reid, D. 2013. Reducing the risk of herbicide runoff in sugarcane farming through controlled traffic and early-banded application. Agriculture, Ecosystems, and Environment 180, 29–39.
McDowell, R.W. , Houlbrooke, D.J., Muirhead, R.W., Muller, K., Shepherd, M., and Cuttle S.P. 2008. Grazed Pastures and Water Quality. Nova Science Publishers, New York, USA.
McJannet, D., Wallace, J., Fitch, P., Disher, M., and Reddell, P. 2007. Water balance of tropical rainforest canopies in north Queensland, Australia. Hydrolological Processes 21, 3473–3484.
Meals, D.W., Dressing, S.A., and Davenport, T.E. 2010. Lag time in water quality response to best management practices: A review. Journal of Environmental Quality 39, 85-89.
Melland, A. R., Ryan, D., Shortle, G., and Jordan, P. 2012. A cost:benefit evaluation of in-situ high temporal resolution stream nutrient monitoring, World Congress on Water, Climate and Energy, Dublin, 13–18 May 2012.
Mellander, P.-E., Melland, A.R., Jordan, P., Wall, D.P., Murphy, P.N.C., and Shortle, G. 2012. Quantifying nutrient transfer pathways in agricultural catchments using high temporal resolution data. Environmental Science and Policy 24, 44–7, http://dx.doi.org/10.1016/j.envsci.2012.06.004
NQ Dry Tropics, 2016. NQ Dry Tropics Water Quality Improvement Plan 2016. Better Water for the Burdekin. NQ Dry Tropics, Townsville.
O'Brien, D., Davis, A. M., Nash, M., Di Bella, L., Turner, R. D. R., Reghenzani, J., and Brodie, J.E. 2013. Water quality within the Herbert River Catchment associated with specific land use. Proceedings of the 35th Conference of the Australian Society of Sugar Cane Technologists. 16-18 April 2013, Townsville, QLD, Australia.
O’Brien, D., Lewis, S., Davis, A., Gallen, C., Smith, R., Turner, R., Warne, M., Turner, S., Carswell, S., Mueller, J.F., and Brodie, J. 2016. Spatial and temporal variability in
100
pesticide exposure downstream of a heavily irrigated cropping area: application of different monitoring techniques. Journal of Agricultural and Food Chemistry http://dx.doi.org/10.1021/acs.jafc.5b04710
O'Brien, D., Davis, A.M., Nash, M., Di Bella, L. and Brodie, J.E. 2014. Herbert water quality monitoring project: 2011–2013 results. Proceedings of the 36th Conference of the Australian Society of Sugar Cane Technologists. In: ASSCT 2014: 36th Annual Conference of the Australian Society of Sugar Cane Technologists, 28 April - 1 May 2014, Broadbeach, QLD, Australia
O’Flynn, B., Regan, F., Lawlor, A., Wallace, J., Torres, J., and O’Mathuna, C., 2010. Experiences and recommendations in deploying a real-time, water quality monitoring system. Measurement Science and Technology 21, 124004 doi:10.1088/0957-0233/21/12/124004.
Oliver, D.P., Anderson, J.S., Davis, A., Lewis, S., Brodie, J., and Kookana, R. 2014. Banded applications are highly effective in minimising herbicide migration from furrow-irrigated sugar cane. Science of the Total Environment 466–467, 841–848.
Osmond, D., Meals, D., Hoag, D., Arabi, M., Luloff, A., Jennings, G., McFarland, M., Spooner, J., Sharpley, A., and Line, D. 2012. Improving conservation practices programming to protect water quality in agricultural watersheds: Lessons learned from the National Institute of Food and Agriculture-Conservation Effects Assessment Project. Journal of Soil and Water Conservation 67, 122A-127A.
Owen, G. J., Perks, M. T., Benskin, C. M. H., Wilkinson, M. E., Jonczyk, J. and Quinn, P. F. 2012. Monitoring agricultural diffuse pollution through a dense monitoring network in the River Eden Demonstration Test Catchment, Cumbria, UK. Area 44, 443–453. doi: 10.1111/j.1475-4762.2012.01107.x
Outram, F.N., Lloyd, C.E.M., Jonczyk, J., Benskin, C.M.H., Grant, F., Perks, M.T., Deasy, C., Burke, S.P., Collins, A.L., Freer, J., Haygarth, P.M., Hiscock, K.M., Johnes, P.J., and Lovett, A.L. 2014. High-frequency monitoring of nitrogen and phosphorus response in three rural catchments to the end of the 2011–2012 drought in England. Hydrology and Earth System Sciences 18, 3429–3448. DOI: 10.5194/hess-18-3429-2014.
Pearson, R. G., Crossland, M., Butler, B., and Manwaring, S. 2003. Effects of cane-field drainage on the ecology of tropical waterways. ACTFR Report No. 03/04-1. James Cook University, Townsville.
Pellerin, B. A., Bergamaschi, B. A., Downing, B. D., Saraceno, J. F., Garrett, J. A., and Olsen, L. D. 2013. Optical techniques for the determination of nitrate in environmental waters: Guidelines for instrument selection, operation, deployment, maintenance, quality assurance, and data reporting, U.S. Geological Survey Techniques and Methods, 1-D5, 37 pp.
Pellerin, B.A., Stauffer, B.A., Young, D.A., Sullivan, D.J., Bricker, S.B., Walbridge, M.R., Clyde, G.A. Jr., and Shaw, D.M. 2016. Emerging Tools for Continuous Nutrient Monitoring Networks: Sensors Advancing Science and Water Resources Protection. Journal of the American Water Resources Association 1-16. DOI: 10.1111/1752-1688.12386
Pionke, H.B., Gburek, W.J. and Sharpley, A.N. 2000. Critical Source Area Controls on Water Quality in an Agricultural Watershed Located in the Chesapeake Basin. Ecological Engineering 14, 325–335.
Poggio, M., Smith, M., van Grieken, M., Shaw, M. and Biggs, J. 2014. The Economics of Pesticide Management Practices Leading to Water Quality Improvement on
Sub-catchment scale monitoring, modelling and extension design
101
Sugarcane Farms. Department of Agriculture, Fisheries and Forestry (DAFF), Queensland.
Queensland Department of the Premier and Cabinet, 2009. Reef Water Quality Protection Plan 2009: For the Great Barrier Reef World Heritage Area and adjacent catchments, Queensland Department of Premier and Cabinet, Brisbane.<http://www.reefplan.qld.gov.au/resources/assets/reef-plan-2009.pdf>.
Queensland Government, 2015. Reef Water Quality Protection Plan: Report Card 2013 and 2014. State of Queensland, 2015.
Queensland Government, 2016. Reef protection initiatives for cane farmers and graziers. Queensland Government website. https://www.qld.gov.au/environment/agriculture/sustainable-farming/reef-initiatives/. Accessed March 2016.
Rabiet, M., Margoum, C., Gouy, V., Carluer, N. and Coquery, M. 2010. Assessing pesticide concentrations and fluxes in the stream of a small vineyard catchment—effect of sampling frequency. Environmental Pollution 158, 737–748.
Rabotyagov, S., Campbell, T., Jha, M., Gassman, P.W., Arnold, J., Kurkalova, L., Secchi, S., Feng, H.L., and Kling, C.L. 2010. Least-cost control of agricultural nutrient contributions to the Gulf of Mexico hypoxic zone. Ecological Applications 20, 1542-1555.
Rabotyagov, S.S., Campbell, T.D., White, M., Arnold, J.G. , Atwood, J. Norfleet, M.L., Kling, C.L., Gassman, P.W., Valcu, A., Richardson, J. , Turner, E.R., and Rabalais, N.N. 2014. Cost-effective targeting of conservation investments to reduce the north Gulf of Mexico hypoxic zone. Proceedings of the National Academy of Sciences 111, 18530-18535.
Räike, A., Pietiläinen, O.-P., Rekolainen, S., Kauppila, P., Pitkänen, H., Niemi, J., Raateland, A., and Vuorenmaa, J. 2003. Trends of phosphorus, nitrogen and chlorophyll a concentrations in Finnish rivers and lakes in 1975–2000. Science of the Total Environment 310, 47–59.
Rasiah, V., Armour, J. D., and Nelson, P. N. 2013. Nitrate in shallow fluctuating groundwater under sugarcane: Quantifying the lateral export quantities to surface waters. Agriculture, Ecosystems and Environment 180, 103-110.
Rayment, G. E. 2003. Water quality in sugar catchments in Queensland. Water Science and Technology 48, 35–47.
Reef Water Quality Protection Plan Secretariat. 2013. Scientific Consensus Statement. Land use impacts of Great Barrier reef water quality and ecosystem condition. Queensland Department of Premiers and Cabinet, Brisbane, 2013.
Rodriguez, H.G., Popp, J., Gbur, E., and Pennington, J. 2014. A Stakeholder-Guided Collaborative Approach to Improve Water Quality in a Nutrient Surplus Watershed. Journal of Water Resource and Protection 6, 571-582. http://dx.doi.org/10.4236/jwarp.2014.66056
Rozemeijer, J. C., and Broers, H. P. 2007. The groundwater contribution to surface water contamination in a region with intensive agricultural land use (Noord-Brabant, The Netherlands). Environmental Pollution, 148, 695–706.
Rozemeijer, J.C., Klein, J., Broers, H.P., van Tol-Leenders, T.P., and van der Grift, B. 2014. Water quality status and trends in agriculture-dominated headwaters; a national monitoring network for assessing the effectiveness of national and European manure legislation in The Netherlands. Environmental Monitoring and Assessment 186, 81–95
102
Rozemeijer, J.C., and Van der Velde, Y. 2014. Temporal variability in groundwater and surface water quality in humid agricultural catchments; driving processes and consequences for regional water quality monitoring. Fundamental and Applied Limnology 184, 195–209.
Rozin, A. G. 2014. In situ optical sensors for measuring nitrate in Florida waters. Masters of Science Thesis. University of Florida. 78 pp.
Ruiz-Garcia, L., Lunadei, L., Barreiro, P., and Robla, I, 2009. A review of wireless sensor technologies and applications in agriculture and food industry: state of the art and current trends. Sensors 9, 4728–4750.
Sharpley, A., Daniels, M., Berry, L., Hallmark, C., and Hesselbein, J. 2015. Arkansas Discovery Farms: documenting water quality benefits of on-farm conservation management and empowering farmers. Acta Agriculturae Scandinavica, Section B — Soil & Plant Science 65, 186–198., DOI: 10.1080/09064710.2014.960444
Shaw, M. and Müller, J.F. 2005. Preliminary evaluation of the occurrence of herbicides and PAHs in the wet tropics region of the Great Barrier Reef, Australia, using passive samplers. Marine Pollution Bulletin, 51, 876-881.
Shaw, M., Furnas, M.J., Fabricius, K., Haynes, D., Carter, S., Eaglesham, G., and Mueller, J.F. 2010. Monitoring pesticides in the Great Barrier Reef. Marine Pollution Bulletin 60, 113–122.
Shoda, M.E., Lathrop, T.R., and Risch, M.R. 2015. Real-time, continuous water-quality monitoring in Indiana and Kentucky: U.S. Geological Survey Fact Sheet 2015–3041, 4 p., http://dx.doi.org/10.3133/fs20153041.
Smith, R., Middlebrook, R., Turner, R., Huggins, R., Vardy, S., and Warne, M. 2012. Large scale pesticide monitoring across Great Barrier catchments – paddock to Reef Integrated Monitoring, Modelling and Reporting Program. Marine Pollution Bulletin 65, 117–127.
Smith, M., Poggio, M. J., Thompson, M. and Collier, A. 2014. The Economics of Pesticide Management Practices on Sugarcane Farms: Final Synthesis Report. Department of Agriculture, Fisheries and Forestry (DAFF), Queensland.
Smith, M. 2015. Evaluating management class transitions between sugarcane production systems within the Burdekin Dry Tropics region. Final Report prepared for NQ Dry Tropics, Townsville as part of the Burdekin Water Quality Improvement Plan 2016.
Snazelle, T. 2011. An Evaluation of Four Field Deployable Nitrate Analyzers: Phase I. U.S. Department of the Interior, U.S. Geological Survey, Water Mission Area. WMA Instrument news. Issue No. 134, Spring 2012, pp. 1-12.
Snazelle, T.T., 2015, Results from laboratory and field testing of nitrate measuring spectrophotometers: U.S. Geological Survey Open-File Report 2015–1065, 35 p., dx.doi.org/10.3133/ofr20151065.
Stalnacke, P., Grimvall, A., Libiseller, C., Laznik, M., and Kokorite I. 2003. Trends in nutrient concentrations in Latvian rivers and the response to the dramatic change in agriculture. Journal of Hydrology 283, 184–205.
Strobl, R.O., and Robillard, P.D. 2008. Network design for water quality monitoring of surface freshwaters: a review. Journal of Environmental Management 87, 639–648.
Stow, C. A., Borsuk, M. E., and Stanley, D. W. 2001. Long-term changes in watershed nutrient inputs and riverine exports in the Neuse River, North Carolina. Water Research 35, 1489–1499.
Stuer-Lauridsen, F. 2005. Review of passive accumulation devices for monitoring organic micropollutants in the aquatic environment. Environmental Pollution 136, 503-524.
Sub-catchment scale monitoring, modelling and extension design
103
Stuntebeck, T.D., Komiskey, M.J., Peppler, M.C., Owens, D.W., and Frame, D.R. 2011. Precipitation-runoff relations and water-quality characteristics at edge-of-field stations, discovery farms and pioneer farm, Wisconsin, 2003–8. US Geological Survey Scientific Investigations Report 2011–5008; Reston (VA): U.S. Geological Survey; 46p. http://pubs.usgs.gov/sir/2011/5008/
Terrain NRM, 2015. Wet Tropics Water Quality Improvement Plan 2015-2020. Terrain NRM, Innisfail. http://www.terrain.org.au/Projects/Water-Quality-Improvement-Plan
Thorburn, P.J., Biggs, J.S., Attard, S.J., Kemei, J., 2011. Environmental impacts of irrigated sugarcane production: nitrogen lost through runoff and leaching. Agriculture, Ecosystems and Environment 144, 1–12.
Thorburn, P.J. and Wilkinson, S.N. 2013. Conceptual frameworks for estimating the water quality benefits of improved agricultural management practices in large catchments. Agriculture, Ecosystems and Environment 180, 192-209.
Tomer, M.D., Porter, S.A., James, D.E., Boomer, K.M., Kostel, J.A. and Mclellan, E. 2013. Combining Precision Conservation Technologies into a Flexible Framework to Facilitate Agricultural Watershed Planning. Journal of Soil and Water Conservation 68, 113A–120A.
Turner, R., Huggins, R., Wallace, R., Smith, R., S., and Warne, M. St.J. 2013. Total suspended solids, nutrient and pesticide loads (2010–2011) for rivers that discharge to the Great Barrier Reef: Great Barrier Reef Catchment Loads Monitoring Program 2010–2011. Department of Science, Information Technology, Innovation and the Arts, Brisbane.
Veith, T.L., Wolfe, M.L. and Heatwole, C.D. 2004. Cost-Effective BMP Placement: Optimization Versus Targeting. Transactions of the American Society of Agricultural Engineers 47, 1585–1594.
Vrana, B., Allan, I. J., Greenwood, R., Mills, G. A., Dominiak, E., Svensson, K., Knutsson, J., Morrison, G., 2005. Passive sampling techniques for monitoring pollutants in water. Trends in Analytical Chemistry 24, 845-868.
Wallace, R., Huggins, R., Smith, R., Turner, R., Vardy, S., and Warne, M. St. J., 2014. Total suspended solids, nutrient and pesticide loads (2011–2012) for rivers that discharge to the Great Barrier Reef – Great Barrier Reef Catchment Loads Monitoring Program 2011–2012. Department of Science, Information Technology, Innovation and the Arts. Brisbane.
Wardropper, C.B., Chang, C., and Rissman, A.R. 2015. Fragmented water quality governance: constraints to spatial targeting for nutrient reduction in a Midwestern USA watershed. Landscape and Urban Planning 137, 64–75
Waterhouse, J., Brodie, J., Tracey, D., Lewis, S., Brinkman, R., Tonin, H., Furnas, M., Fabricius, K., Schaffelke, B., Wolff, N., Devlin, M., and McKenzie, L. 2014. Assessment of the relative risk of water quality to ecosystems of the Wet Tropics Region, Great Barrier Reef. A report to Terrain NRM, Innisfail. TropWATER Report 14/27, Townsville, Australia.
Waterhouse, J., Brodie, J., Lewis, S., and Mitchell, A. 2012. Quantifying the sources of pollutants to the Great Barrier Reef. Marine Pollution Bulletin 65, 394–406.
Waterhouse, J., and Devlin, M. 2011. Managing Water Quality on the Great Barrier Reef: an overview of MTSRF research outputs, 2006-2010. Report. Reef and Rainforest Research Centre, Cairns.
Waterhouse, J., Brodie, J., Tracey, D., Lewis, S., Brinkman, R., Tonin, H., Furnas, M., Fabricius, K., Schaffelke, B., Wolff, N., Devlin, M., and McKenzie, L. 2014.
104
Assessment of the relative risk of water quality to ecosystems of the Wet Tropics Region, Great Barrier Reef. A report to Terrain NRM, Innisfail. TropWATER Report 14/27, Townsville, Australia.
Waterhouse, J., Brodie, J., Tracey, D., Lewis, S., da Silva, E., Coppo, C., Devlin. M., Maynard, J., Heron, S., and Petus, C. 2015a. Assessment of the relative risk of water quality to ecosystems of the Burdekin Region, Great Barrier Reef. A report to NQ Dry Tropics. TropWATER Report 15/69, Townsville, Australia.
Waterhouse, J., Tracey, D., Brodie, J. Lewis, S., da Silva, E., Devlin. M., Wenger, A., O’Brien, D., Johnson, J., Maynard, J., Heron, S., and Petus, C. 2015b. Assessment of the relative risk of water quality to ecosystems of the Fitzroy NRM Region, Great Barrier Reef. Report to Fitzroy Basin Association for the Fitzroy Water Quality Improvement Plan.
Waterhouse, J., Duncanson, P., Attard, S., Bartley, R., Bristow, K., Brodie, J., Coppo, C., Davis, A., Dougall, C., Lewis, S., Smith, M., Star, M., Roberts, A. and Wilkinson, S. 2016. Spatial prioritisation and extension of information to manage sediment, nutrient and pesticide runoff in the Burdekin NRM region. A report for the Department of Environment and Heritage Protection. Prepared on behalf of NQ Dry Tropics, Townsville, Australia.
Waters, D.K., Carroll, C., Ellis, R., Hateley, L., McCloskey, G.L., Packett, R., Dougall, C, and Fentie. 2014.,Modelling reductions of pollutant loads due to improved management practices in the Great Barrier Reef catchments – Whole of GBR, Technical Report, Volume 1, Queensland Department of Natural Resources and Mines, Toowoomba, Queensland (ISBN: 978-1-7423-0999).
White, M.J., Storm, D.E., Busteed, P.R., Stoodley, S.H., and Phillips, S.J. 2009. Evaluating Nonpoint Source Critical Source Area Contributions at the Watershed Scale. Journal of Environmental Quality 38, 1654–1663.
Wilcock, R. J., Monaghan, R. M., Quinn, J. M., Srinivasan, M. S., Houlbrooke, D. J., Duncan, M. J., Wright-Stow, A. E., and Scarsbrook, M. R. 2013. Trends in water quality of five dairy farming streams in response to adoption of best practice and benefits of long-term monitoring at the catchment scale. Marine and Freshwater Research 64, 401–412. doi:10.1071/MF12155
Wolfenden, J., and Evans, M. 2007. Change at the irrigation area scale: an exploration of integrated area wide management (IAWM) for irrigation communities, Toowoomba: CRC for Irrigation Futures.
Worrall, F., Spencer, E., Burt, T.P. 2009. The effectiveness of nitrate vulnerable zones for limiting surface water nitrate concentrations. Journal of Hydrology 370, 21-28.
Zia, H., Harris, N. R., Merrett, G. V., Rivers, M., and Coles, N. 2013. The impact of
agricultural activities on water quality: A case for collaborative catchment-scale management using integrated wireless sensor networks. Computers and Electronics in Agriculture 96, 126-138.
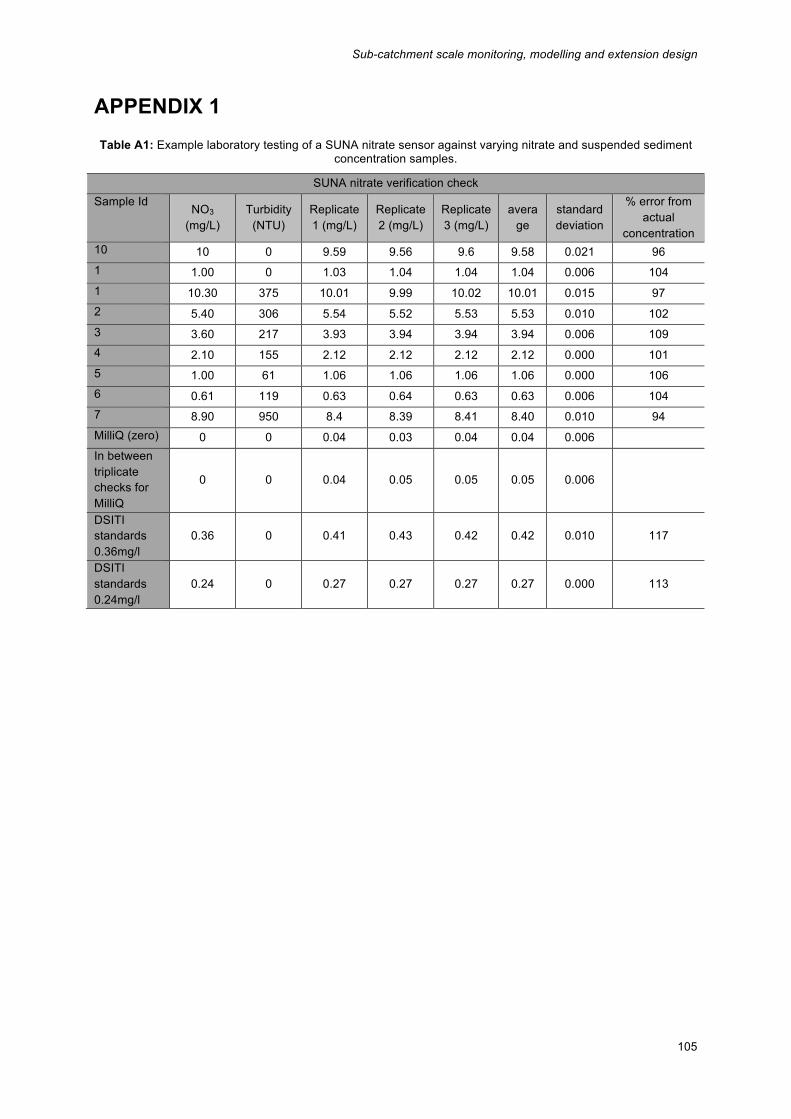
Sub-catchment scale monitoring, modelling and extension design
105
APPENDIX 1 Table A1: Example laboratory testing of a SUNA nitrate sensor against varying nitrate and suspended sediment
concentration samples.
SUNA nitrate verification check Sample Id NO3
(mg/L) Turbidity
(NTU) Replicate 1 (mg/L)
Replicate 2 (mg/L)
Replicate 3 (mg/L)
average
standard deviation
% error from actual
concentration 10 10 0 9.59 9.56 9.6 9.58 0.021 96 1 1.00 0 1.03 1.04 1.04 1.04 0.006 104 1 10.30 375 10.01 9.99 10.02 10.01 0.015 97 2 5.40 306 5.54 5.52 5.53 5.53 0.010 102 3 3.60 217 3.93 3.94 3.94 3.94 0.006 109 4 2.10 155 2.12 2.12 2.12 2.12 0.000 101 5 1.00 61 1.06 1.06 1.06 1.06 0.000 106 6 0.61 119 0.63 0.64 0.63 0.63 0.006 104 7 8.90 950 8.4 8.39 8.41 8.40 0.010 94 MilliQ (zero) 0 0 0.04 0.03 0.04 0.04 0.006 In between triplicate checks for MilliQ
0 0 0.04 0.05 0.05 0.05 0.006
DSITI standards 0.36mg/l
0.36 0 0.41 0.43 0.42 0.42 0.010 117
DSITI standards 0.24mg/l
0.24 0 0.27 0.27 0.27 0.27 0.000 113
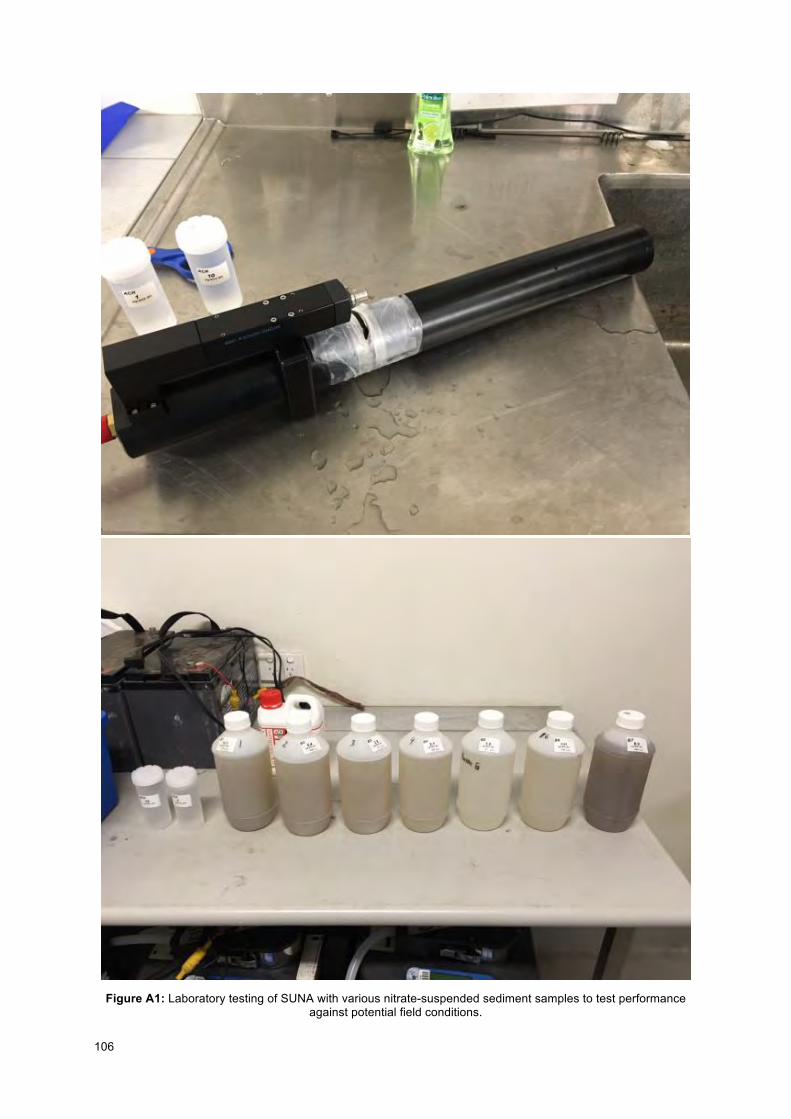
106
Figure A1: Laboratory testing of SUNA with various nitrate-suspended sediment samples to test performance
against potential field conditions.

Sub-catchment scale monitoring, modelling and extension design
107
APPENDIX 2 Example notifications of Reported Exceedances of Pesticide Water Quality Guidelines in 2014–15 in the Sandy Creek-Pioneer River catchments.
Notification of Reported Exceedances of Pesticide Water Quality Guidelines in 2014–15 No.2 Water Quality and Investigations – Great Barrier Reef Catchment Loads Monitoring Program
Recently we received results from the Queensland Health Forensic and Scientific Services (QHFSS) for surface water samples collected on 6 and 7 January 2015 from Sandy Creek (in the Plane catchment) and on 6 January 2015 from Back Creek (in the Sunshine Coast, near Pumicestone Passage). Both sets of samples contained diuron (a herbicide) at concentrations that exceeded the Australian and New Zealand water quality guidelines for irrigation. These exceedances are detailed below.
Sandy Creek Seven samples were collected during an event at Sandy Creek. The measured concentrations of diuron in all seven samples (Table 1) exceeded the irrigation water trigger value (2 µg/L) and the ecosystem protection trigger value (0.2 µg/L) as set out in the Australian and New Zealand Water Quality Guidelines (ANZECC and ARMCANZ, 2000).
Similar exceedances of these trigger values in Sandy Creek have been reported previously.
Back Creek A single sample was collected from Back Creek on 6 January, 2015. The diuron concentration of that sample exceeded both the irrigation water trigger value (2 µg/L) and the ecosystem protection trigger value (0.2 µg/L) as set out in the Australian and New Zealand Water Quality Guidelines (ANZECC and ARMCANZ, 2000). It is also worth noting that there were also high concentrations of bromacil (8 µg/L) and atrazine (5.4 µg/L) in the same sample. The concentrations of all three pesticides were much lower in Coochin Creek (a site located just a few kilometres downstream) - diuron (0.96 µg/L), bromacil (2.2 µg/L) and atrazine (0.31 µg/L).
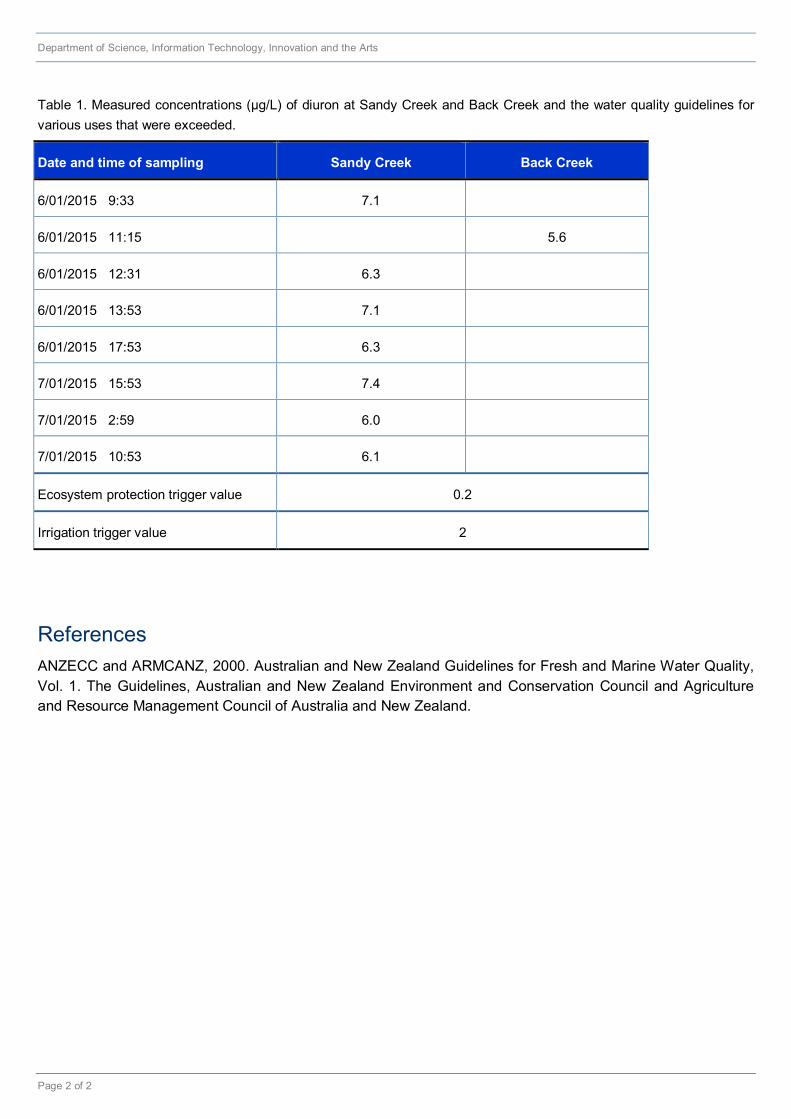
Department of Science, Information Technology, Innovation and the Arts
Page 2 of 2
Table 1. Measured concentrations (µg/L) of diuron at Sandy Creek and Back Creek and the water quality guidelines for various uses that were exceeded.
Date and time of sampling Sandy Creek Back Creek
6/01/2015 9:33 7.1
6/01/2015 11:15 5.6
6/01/2015 12:31 6.3
6/01/2015 13:53 7.1
6/01/2015 17:53 6.3
7/01/2015 15:53 7.4
7/01/2015 2:59 6.0
7/01/2015 10:53 6.1
Ecosystem protection trigger value 0.2
Irrigation trigger value 2
References ANZECC and ARMCANZ, 2000. Australian and New Zealand Guidelines for Fresh and Marine Water Quality, Vol. 1. The Guidelines, Australian and New Zealand Environment and Conservation Council and Agriculture and Resource Management Council of Australia and New Zealand.
Notification of Reported Exceedances of Pesticide Water Quality Guidelines in 2014–15 No.3 Water Quality and Investigations – Great Barrier Reef Catchment Loads Monitoring Program
Recently we received results from the Queensland Health Forensic and Scientific Services (QHFSS) for surface water samples collected on 18, 19 and 20 January 2015 from Sandy Creek (in the Plane catchment). All samples collected over these dates contained diuron (a herbicide) at concentrations that exceeded the Australian and New Zealand water quality guidelines for irrigation. These exceedances are detailed below.
Sandy Creek Eight samples were collected during an event at Sandy Creek. The measured concentrations of diuron in all eight samples (Table 1) exceeded the irrigation water trigger value (2 µg/L) and the ecosystem protection trigger value (0.2 µg/L) as set out in the Australian and New Zealand Water Quality Guidelines (ANZECC and ARMCANZ, 2000).
Similar exceedances of these trigger values in Sandy Creek have been reported previously.
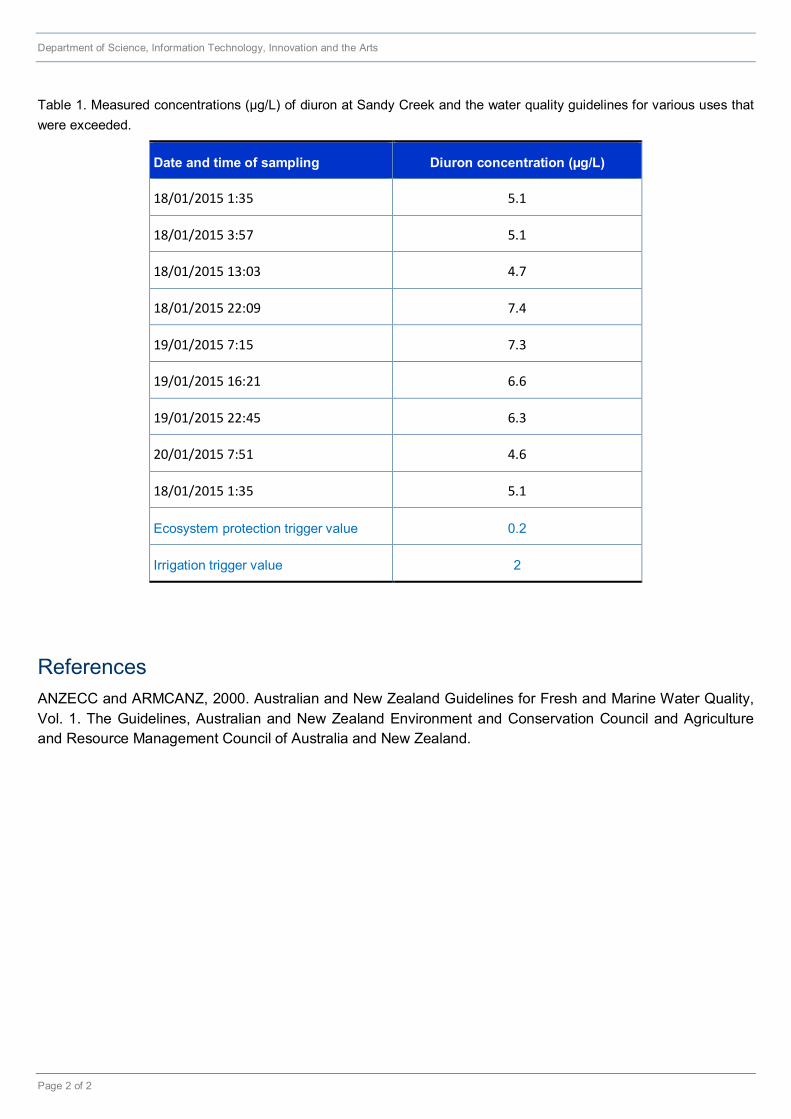
Department of Science, Information Technology, Innovation and the Arts
Page 2 of 2
Table 1. Measured concentrations (µg/L) of diuron at Sandy Creek and the water quality guidelines for various uses that were exceeded.
Date and time of sampling Diuron concentration (µg/L)
18/01/2015 1:35 5.1
18/01/2015 3:57 5.1
18/01/2015 13:03 4.7
18/01/2015 22:09 7.4
19/01/2015 7:15 7.3
19/01/2015 16:21 6.6
19/01/2015 22:45 6.3
20/01/2015 7:51 4.6
18/01/2015 1:35 5.1
Ecosystem protection trigger value 0.2
Irrigation trigger value 2
References ANZECC and ARMCANZ, 2000. Australian and New Zealand Guidelines for Fresh and Marine Water Quality, Vol. 1. The Guidelines, Australian and New Zealand Environment and Conservation Council and Agriculture and Resource Management Council of Australia and New Zealand.
Notification of Reported Exceedances of Pesticide Water Quality Guidelines in 2014–15 No.4 Water Quality and Investigations – Great Barrier Reef Catchment Loads Monitoring Program
Recently we received results from the Queensland Health Forensic and Scientific Services (QHFSS) for surface water samples collected from the 21st – 27th January 2015 from Sandy Creek (in the Plane catchment) and Pioneer River (in the Pioneer catchment). Samples collected over these dates contained diuron (a herbicide) at concentrations that exceeded the Australian and New Zealand water quality guidelines for irrigation. These exceedances are detailed below.
Sandy Creek Twelve samples were collected during an event at Sandy Creek. The measured concentrations of diuron in four samples (Table 1) exceeded the irrigation water trigger value (2 µg/L) and all twelve samples exceeded the ecosystem protection trigger value (0.2 µg/L) as set out in the Australian and New Zealand Water Quality Guidelines (ANZECC and ARMCANZ, 2000).
Similar exceedances of these trigger values in Sandy Creek have been reported previously.
Pioneer River Nine samples were collected during an event at Pioneer River. The measured concentrations of diuron in two samples (Table 2) exceeded the irrigation water trigger value (2 µg/L) and all nine samples exceeded the ecosystem protection trigger value (0.2 µg/L) as set out in the Australian and New Zealand Water Quality Guidelines (ANZECC and ARMCANZ, 2000).
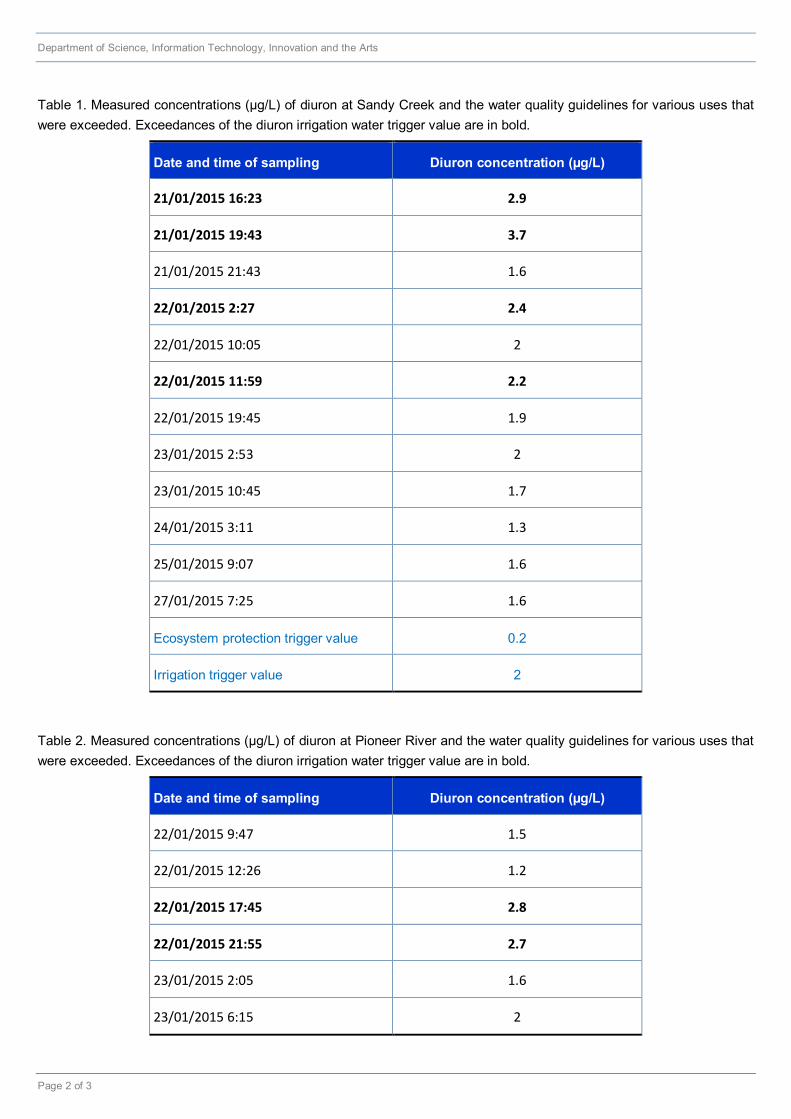
Department of Science, Information Technology, Innovation and the Arts
Page 2 of 3
Table 1. Measured concentrations (µg/L) of diuron at Sandy Creek and the water quality guidelines for various uses that were exceeded. Exceedances of the diuron irrigation water trigger value are in bold.
Date and time of sampling Diuron concentration (µg/L)
21/01/2015 16:23 2.9
21/01/2015 19:43 3.7
21/01/2015 21:43 1.6
22/01/2015 2:27 2.4
22/01/2015 10:05 2
22/01/2015 11:59 2.2
22/01/2015 19:45 1.9
23/01/2015 2:53 2
23/01/2015 10:45 1.7
24/01/2015 3:11 1.3
25/01/2015 9:07 1.6
27/01/2015 7:25 1.6
Ecosystem protection trigger value 0.2
Irrigation trigger value 2
Table 2. Measured concentrations (µg/L) of diuron at Pioneer River and the water quality guidelines for various uses that were exceeded. Exceedances of the diuron irrigation water trigger value are in bold.
Date and time of sampling Diuron concentration (µg/L)
22/01/2015 9:47 1.5
22/01/2015 12:26 1.2
22/01/2015 17:45 2.8
22/01/2015 21:55 2.7
23/01/2015 2:05 1.6
23/01/2015 6:15 2
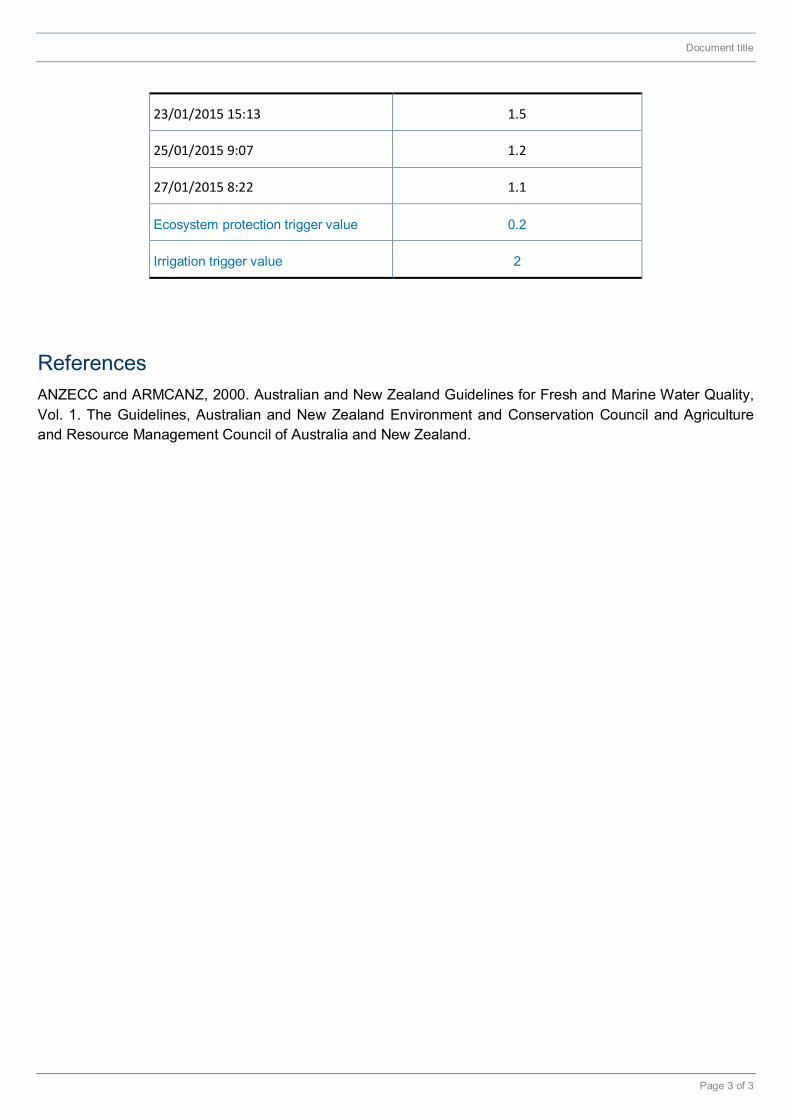
Document title
Page 3 of 3
23/01/2015 15:13 1.5
25/01/2015 9:07 1.2
27/01/2015 8:22 1.1
Ecosystem protection trigger value 0.2
Irrigation trigger value 2
References ANZECC and ARMCANZ, 2000. Australian and New Zealand Guidelines for Fresh and Marine Water Quality, Vol. 1. The Guidelines, Australian and New Zealand Environment and Conservation Council and Agriculture and Resource Management Council of Australia and New Zealand.
www.nesptropical.edu.au