study on the publication of information on goodwill, under
TRANSCRIPT

1
Studies and documents: No. 41 February 2012
Study on the publication of information on goodwill, under IAS 36, in the financial statements of listed companies for the 2010 financial year
Object and purpose of the study
Because of the great importance of the disclosure requirements linked to the IFRS method of handling goodwill, this study investigates how Belgian listed companies with a significant amount of goodwill (5 per cent or more of the balance sheet total) fulfil the various elements of the most important IFRS requirements in this regard.
The most important observations and recommendations
Classification according to cash-generating units (CGUs)
86.5 % of the companies selected for this study have published information about their CGUs. For most companies (78 %), CGUs and operating segments coincide.
The FSMA recommends that the information published on the allocation of goodwill should offer insight into the business units that are expected to generate additional returns as well as into the risk of impairment loss to which their activities are exposed.
Allocation of goodwill to cash-generating units
86 % of the companies selected submitted a complete reconciliation of the carrying amount of goodwill with the carrying amount of the goodwill allocated to the cash-generating units that have been identified.
The FSMA draws attention to the fact that in the absence of such a reconciliation, no insight is available into the correlation between goodwill and the relevant business activity with its associated risk profile.
Determining the recoverable amount of the cash-generating units
Most of the companies selected (83 %) have opted to determine the recoverable amount of their CGUs on the basis of the value in use.

2
Recoverable amount based on value in use
- Key assumptions and assignment of values for cash flow projections
Only a small majority (60 %) of the companies selected disclose sufficient information on the key assumptions of their cash flow projections, while only a significant minority (40 %) provide sufficient information on the methods used to assign values to the key assumptions.
Both as regards the key assumptions and the methods for assigning values to the key assumptions regarding cash flow, the FSMA urges that sufficient attention be paid to the interpretation of the contents, specified, where applicable, for each cash-generating unit to which significant goodwill has been allocated.
- Growth rates for purposes of extrapolation
84 % of the companies selected have published the growth rates used for extrapolating the cash flow projections outside the period to which the budgets and forecasts refer. 54 % of the companies have published only one growth rate (which generally ranges from 0 % to 2 %), while the other 46 % of the companies opted for either a percentage range or a single percentage per CGU in order that the units' specific features may be taken into consideration.
- Discount rate
46 % of the companies selected opted for an overall discount rate, i.e. the same discount rate for all CGUs. 39 % of the companies have decided to use a different discount rate for each CGU identified. A minority of the companies opted for a range of percentages.
Taking into account the diverse approaches and assumptions for determining the weighted average capital cost (WACC), the FSMA recommends that it is not sufficient for the explanatory notes to mention not only the applicable discount rate(s).
Because of the significant impact of the applied growth rates and discount rates on determining value in use, the FSMA urges companies to examine carefully whether it is justifiable to use a single growth rate/discount rate for all the CGUs identified. Moreover, mentioning only a non-specific series of values is not, in the FSMA's view, in compliance with the IFRS requirements.
Recoverable amount based on fair value less costs to sell
16 % of the companies selected have used fair value (less costs to sell) when calculating the recoverable amount of their CGU(s); 4 of the 6 companies concerned have already applied the concept of "fair value" to their CGUs, while the 2 other companies have used two methods (value in use and fair value).
Sensitivity analysis
Only 60 % of the companies selected have published a sensitivity analysis of the key assumptions. For 70 % of those companies, the sensitivity analysis concluded that a reasonably possible change in a key assumption would not result in the carrying amount of the CGUs exceeding their recoverable amount; the other 30 % of the companies came to the conclusion that a change could indeed result in the CGUs' carrying amount exceeding their recoverable amount.

3
The FSMA takes the view that the criterion for performing the sensitivity analysis should not be understood too narrowly. A reasonably possible change need not necessarily mean that this change is also considered probable. Certainly in times of economic uncertainty, clear communication about the key assumptions and their inherent uncertainty is necessary. Thus, independently of the correlation between the various assumptions, it may also be advisable not to limit the sensitivity analysis to just one assumption, but to analyse the combined effect of a change upon a number of related assumptions.

4
Table of contents 1. Introduction 6
2. Data and methodology 7
3. Publishing nformation on goodwill 9
3.1. Goodwill and (group of) cash-generating units 10
3.1.1. Classification according to (groups of) cash-generating units 10
3.1.2. Allocating goodwill to (a group of) cash-generating units 14
3.2. Recoverable amount of the (groups of) cash-generating units 16
3.2.1. Value in use or fair value less costs to sell 16
3.2.2. Determining the recoverable amount 18
3.2.2.1. Recoverable amount based on value in use 18
3.2.2.1.1. Key assumptions for cash flow projection 19
3.2.2.1.2. Methods of allocating values to the key assumptions underlying cash flow projections 20
3.2.2.1.3. Cash flow projection period 22
3.2.2.1.4. Growth rate for extrapolation outside the cash flow projection period 24
3.2.2.1.5. Discount rate 26
3.2.2.2. Recoverable amount based on fair value less costs to sell 31
3.3. Determining recoverable amount 34
4. Recognition of goodwill impairment loss 36
5. Conclusions 38
6. List of published studies 40

5
List of graphs
Graph 1: information on and description of the cash-generating units (CGUs) 11 Graph 2: allocation of goodwill to CGUs 15 Graph 3: description of the key assumptions 19 Graph 4: compliance with the disclosure requirements 21 Graph 5: cash flow projection period 23 Graph 6: cash flow projection: period of max. 5 years vs. period of more than 5 years 23 Graph 7: representation of the cash flow projection period via the CGUs 24 Graph 8: growth rates 25 Graph 9: general growth rate per company 26 Graph 10: discount rates: a single discount rate vs. a range of discount rates vs. general discount
rate 28 Graph 11: discount rates: general discount rate vs. specific discount rate 29 Graph 12: spread of discount rates 30 Graph 13: recoverable amounts: fair value less costs to sell 32 Graph 14: fair value less costs to sell: observable market value vs. cash flow projection 33 Graph 15: sensitivity analysis of the key assumptions 35 Graph 16: publication of information when a reasonably possible change in a key assumption
may result in the carrying amount exceeding the recoverable amount 36 Graph 17: general evaluation of the quality of the information published by companies in the
sample 38 List of tables
Table 1: Presentation of a selected sample group 8 Table 2: Presentation of the number of subsidiaries, segments and CGUs 13 Table 3: Allocation of goodwill to a CGU (expressed in percentages) 16 Table 4: Determining the recoverable amount 17 Table 5: Goodwill impairment losses recognised as at 31 December 2010 37 Table 6: General evaluation of the quality of the information published by the companies in the
sample 38

6
1 Introduction
Pursuant to the European IAS Regulation1, Belgian listed companies are now also required to draw up their consolidated annual financial statements under IFRS.
One of the most important differences with the Belgian law governing annual accounts is the way goodwill is handled. Unlike in the Belgian law on annual accounts, in which goodwill must be amortised after capitalisation over a presumed useful life of five years (or more if justified in the explanatory notes)2, the IFRS require goodwill to be subjected to an impairment test after capitalisation3.
The decision in favour of or against a "permanent" capitalisation of goodwill is related conceptually with divergent views of the financial reports in question. Whereas the Belgian law governing annual accounts concentrates on the income statements, IFRS places the balance sheet front and centre, that is, the so-called "asset-liability" approach in which income is determined on the basis of the valuation of the assets and liabilities recognized in the balance sheet. Equity is the result of the valuation of the remaining balance sheet components, and the difference between the initial and final balance sheet total is the net profit or loss (leaving aside the components allocated directly to equity and contributions by or payments to shareholders).
Under IFRS, goodwill should reflect the following components: on the one hand, the ability of the acquired activity to earn a higher return on all its assets than on these assets separately and, on the other hand, the expected benefits and synergies from combining the acquirer and the target activities4.
IFRS does not opt for a (straight-line) amortisation of goodwill because, first, a reasonable estimate of its useful life and periodic use would be almost impossible, and, secondly, the replacement costs for maintaining the value of goodwill cannot be capitalized because of the prohibition against recognising internally generated goodwill.
An impairment test, by contrast, should provide more useful information by offering the assurance that the goodwill amount recognised at least coincides with the future cash flows that are expected to come from both the goodwill acquired and the goodwill generated internally after the business combination5.
It will be clear from the outset that the recognition of goodwill based on an impairment test stands or falls on the reliability of the estimates used by the management to support the value assigned to goodwill. The most important criticism of the IFRS method of recognising goodwill is thus linked to the difficulty of verifying the estimate of future cash flows.
In order to respond to this criticism, the importance of the disclosures regarding goodwill required by IFRS should not be underestimated. The explanations in question are those concerning the impairment losses identified and those concerning the impairment test performed, and have a twofold purpose: 1 Regulation (EC) No 1606/2002 on the application of international accounting standards 2 Article 141 of the implementing decree for the Belgian Code on Companies 3 IFRS 3.32 and IAS 36.104 4 IFRS 3, BC 313-318 5 IAS 36, BC 131 E-G

7
- providing sufficient insight into the impairment test performed in order to fulfil the objective of annual financial statements as defined by IFRS, that is, to help users decide whether to invest in the entity6;
- make possible comparability in the absence of clear instructions on how to perform the impairment test.
Because of the great importance of the disclosure requirements linked to the IFRS method of handling goodwill, this study investigates how Belgian listed companies with a significant amount of goodwill fulfil the most significant components of the IFRS disclosure requirements.
After describing the sample population and the research methodology, some explanations and recommendations are given along with the results of the research on the IFRS disclosure requirements, and a number of conclusions and expectations are formulated.
2 Data and methodology
IAS 36 specifies the disclosures required on goodwill and on its impairment losses, if any.
Information must be published, on the one hand, for each (group of) cash-generating units for which the carrying amount of the goodwill allocated to the (groups of) units is materially comparable with the total carrying amount of goodwill and, on the other hand, each material impairment loss must be recognized.
The IFRSs have no quantitative materiality limit, but they lay down in general terms that an amount can be said to be material if it could influence the economic decisions of users of the annual financial statements7.
For the purposes of this study it has been deemed that an amount can be said to be material if the carrying amount of goodwill equals 5 % or more of the balance sheet total. On the basis of this criterion8, 37 companies were selected from the EU listed issuers on the regulated market NYSE Euronext Brussels for which Belgium is the home member state. These companies were divided up according to market capitalization and according to area of activity in line with the criteria used by NYSE Euronext.
6 IAS 1, paragraph 9 7 IAS 8, paragraph 5 8 A first selection was made on the basis of the goodwill and the balance sheet totals as at 31 December 2009, in
order not to exclude issuers who in 2010 recognized an impairment loss on their goodwill. Then a second selection was carried out on the basis of the figures as at 31 December 2010, in order to be able to take into account the issuers whose ratio of goodwill / balance sheet total may have increased in the 2010 financial year (as a result of new acquisitions or price rises, etc.).

8
Table 1: Presentation of a selected sample group
Sectors9 Sub-funds Number
Goodwill10 31/12/2009
Balance sheet
31/12/2009
Goodwill / Balance
sheet 31/12/2009
Goodwill 31/12/2010
Balance sheet 31/12/2010
Goodwill / Balance
sheet 31/12/2010
Consumer goods 7 37,538,826 82,027,774 45.76% 39,768,619 87,652,193 45.37%
Blue Chips 1 37,370,949 80,674,649 46.32% 39,600,211 86,250,283 45.91% Mid Caps 1 24,837 226,110 10.98% 25,670 224,731 11.42% Small Caps 5 143,040 1,127,015 12.69% 144,493 1,177,180 12.27%
Industry 7 707,119 4,536,912 15.59% 775,697 4,949,396 15.67%
Mid Caps 3 541,912 3,731,377 14.52% 605,009 4,177,555 14.48% Small Caps 4 165,207 805,535 20.51% 170,688 771,841 22.11%
Basic materials 1 341,000 1,844,000 18.49% 342,000 2,393,000 14.29%
Blue Chips 1 341,000 1,844,000 18.49% 342,000 2,393,000 14.29% Health care 7 5,320,228 11,731,389 45.35% 5,612,933 11,831,702 47.44%
Blue Chips 1 4,552,000 9,120,000 49.91% 4,718,000 8,969,000 52.60% Mid Caps 4 737,372 2,465,016 29.91% 861,922 2,739,190 31.47% Small Caps 2 30,856 146,373 21.08% 33,011 123,512 26.73%
Utilities 1 1,707,800 4,420,000 38.64% 1,707,000 5,904,000 28.91%
Blue Chips 1 1,707,800 4,420,000 38.64% 1,707,000 5,904,000 28.91%
Consumer services 6 4,909,868 19,446,251 25.25% 5,174,945 21,239,480 24.36% Blue Chips 3 4,820,176 18,128,345 26.59% 5,074,398 19,951,780 25.43% Mid Caps 2 83,333 1,289,351 6.46% 93,870 1,258,672 7.46% Small Caps 1 6,359 28,555 22.27% 6,677 29,028 23.00%
Technology 7 159,922 780,574 20.49% 300,634 1,763,583 17.05% Mid Caps 2 56,805 416,641 13.63% 196,128 1,352,159 14.50% Small Caps 5 103,117 363,933 28.33% 104,506 411,424 25.40%
Telecommunications 1 2,088,000 7,450,000 28.03% 2,337,000 8,511,000 27.46%
Blue Chips 1 2,088,000 7,450,000 28.03% 2,337,000 8,511,000 27.46% Grand total 37 52,772,563 132.236900 39.91% 55,994,453 144,244,354 38.82%
Using the above table, the following observations can be made regarding the selection:
- the companies selected represent 28.7 % of the total market capitalisation (Euronext Brussels) (corresponding to 29.4 % of the listed companies, with the exception of real estate investment companies11);
- the total carrying amount of goodwill of the companies selected amounts to 38.82 % of the balance sheet total as at 31 December 2010;
- in 46 % of the companies selected, the carrying amount of goodwill exceeds 20 % of the balance sheet total.
9 The sectors and market segments are presented using the NYSE Euronext classification. 10 The goodwill and balance sheet amounts are expressed in thousands of euros. 11 Real estate investment companies were not considered for purposes of this study because no real estate
investment company fulfilled the materiality criterion used for goodwill of 5 % or more of the balance sheet total.
9
The research method used is twofold: on the one hand, for each company selected, we investigated on the basis of the publicly available information the extent to which the information on goodwill fulfilled the most important IFRS information requirements; on the other hand, the selected companies with a goodwill of 20 % or more of the balance sheet total (17 companies, with a goodwill representing 96.5 % of the total goodwill of all the companies selected) were questioned individually in order to allow them to provide additional insight into the information they publish regarding goodwill.
3 Publication of information regarding goodwill
For the purposes of this study, the IFRS information regarding goodwill published by the companies selected was evaluated in terms of three topics that were deemed especially relevant for evaluating the reliability of the working method set out by the IFRS.
More specifically, these involved:
- the allocation of goodwill to (a group of) cash-generating units;
- the key assumptions for determining the recoverable amount of the (group) of cash-generating units with goodwill;
- the application of a reasonably possible change in a key assumption for determining the recoverable amount (sensitivity analysis).
Two of the companies selected disclosed no information on goodwill, although the latter was of great significance for them (the carrying amount of goodwill came to 41.99 % and 50.07 % of their respective balance sheet totals). These are companies with a limited market capitalisation, one in the health sector and the other in the technology sector. Neither company had any comment or reservation regarding this shortcoming in its audit report.
When questioned about the reason for this significant shortcoming, the companies stated that they were not aware of the detailed information requirements and that their auditor had not drawn their attention to this requirement. At the same time, they emphasized that an impairment test was performed that showed that the carrying amount of goodwill was not lower than the recoverable amount.

10
3.1 Goodwill and (group of) cash-generating units 3.1.1 Subdivision according to (groups of) cash-generating units
Because goodwill can only generate cash flows in combination with other assets or groups of assets, an impairment test can only be performed as part of the (group of) cash-generating unit(s) to which goodwill has been allocated on account of the expected benefits12.
A cash-generating unit is defined as the smallest identifiable group of assets that generates cash inflows that are largely independent of the cash inflows from other assets or groups of assets. The allocation of goodwill is limited, however, to the lowest level within the entity at which goodwill is monitored for internal management purposes and may not be larger than an operating segment as defined by IFRS 8 13.
For purposes of subdivision according to (groups of) cash-generating units, judgement is necessary, giving rise to a certain degree of flexibility. IAS 36, paragraph 39, mentions the following factors for determining the independence of the cash flows: the way in which the management oversees the activities of the entity (per product line, per operating segment, per site, etc.) or the way in which management makes decisions about the continued use or the disposal of assets held by the entity.
It will be clear that the composition of the (group of) cash-generating unit(s) to which goodwill is allocated is very important for the performance of the impairment test. Combining cash-generating units with clearly diverse risk profiles and with cash flows that are not correlated to each other may give rise to compensation between the recoverable amounts of highly performing and of less well-performing units.
The following graph provides an overview of the information published regarding the subdivision into cash-generating units.
12IAS 36, paragraph 81. 13 IAS 36, paragraph 80.

11
Graph 1: information on and description of the cash-generating units (CGUs)
The above graph shows that the majority of the companies (32 out of 37, or 86.5 %) have published information about their CGUs. For the majority of those companies (25 of the 32 that have published information about their CGUs), the CGUs and operational segments coincide. This includes four BEL 20 companies and, in terms of market capitalization, 6 "blue chips", 10 "mid caps" and "8 small caps". The best represented sectors - constituting 19 % each - are those of health care, consumer goods, consumer services and technology.
These are followed by the industrial sector, which represents 16 %. The remaining sectors (basic materials, telecommunication and utilities) represent only 3 % each.
The two companies for which the CGUs are identified as "operational sub-sectors", the number of CGUs is higher than the number of segments. As a result, more detailed information on and more specific characteristics of the CGUs can be published than is the case for the segments. Thus a sector is defined by continent, for example (Segment 1: South America), while any related CGUs are defined per country (CGU 1 of segment 1: Brazil & CGU 2 of segment 1: Bolivia). These 2 companies are blue chips that are part of the BEL 20.
In the case of the other 5 companies, cash-generating units and operational segments cannot always be linked. For these 5 companies, the cash-generating units consist of subsidiaries, shareholdings, activities, business components, etc. None of the 5 companies is on the BEL 20 or is a blue chip: 60 % are mid caps and 40 % are small caps. 60 % of the 5 companies represent the technology sector.
Overall, the companies selected publish little information on the criteria used to determine the (group of) cash-generating units. Although this information is not explicitly required under IAS 36, it is relevant information given the arbitrary nature of the classification process (see above).
5
25
5
2
32
No information on the CGUs
Information on the CGUs
Operational segments
CGUs other than segments
Operational sub-sectors

12
Individual questioning of the selected companies with a carrying amount of goodwill of more than 20 % of the balance sheet total indicates that the most common argument given is that the cash-generating units coincide with the operational segments because the performance, financial position and capital expenditures are managed at the operational segment level only.
It should be noted in this regard that although supervision by management can be an important factor, the identification of the (group of) cash-generating units must be based primarily on the criterion of independent cash flows.
The table below gives an overview of the relationship, within the selected companies, between the number of identified cash-generating units to which goodwill is allocated, the number of operational segments and the number of subsidiaries.

13
Table 2: Presentation of the number of subsidiaries, segments and CGUs
Companies Subsidiaries Segments CGUs Seg = CGUs Seg > CGUs Seg < CGUs
Company 1 47 7 10 0 0 1 Company 2 114 3 3 1 0 0 Company 3 67 4 4 1 0 0 Company 4 45 2 2 1 0 0 Company 5 63 5 5 1 0 0 Company 6 10 3 3 1 0 0 Company 7 69 5 6 0 0 1 Company 8 7 1 1 1 0 0 Company 9 54 4 4 1 0 0 Company 10 4 1 1 1 0 0 Company 11 18 2 2 1 0 0 Company 12 45 5 5 1 0 0 Company 13 36 2 2 1 0 0 Company 14 13 2 6 0 0 1 Company 15 2 2 2 1 0 0 Company 16 33 4 4 1 0 0 Company 17 30 4 4 1 0 0 Company 18 4 1 2 0 0 1 Company 19 72 4 4 1 0 0 Company 20 19 2 2 1 0 0 Company 21 15 8 1 0 1 0 Company 22 29 2 6 0 0 1 Company 23 31 4 4 1 0 0 Company 24 0 1 1 1 0 0 Company 25 23 2 4 0 0 1 Company 26 9 1 1 1 0 0 Company 27 24 2 2 1 0 0 Company 28 8 4 4 1 0 0 Company 29 123 1 1 1 0 0 Company 30 11 2 2 1 0 0 Company 31 30 2 2 1 0 0 Company 32 12 2 4 0 0 1
Total 1067 94 104 24 1 7
Average 33 2.9 3.2 - - -
The sample group was reduced to 32 companies that had published sufficiently clear information about their subsidiaries, operational sectors and CGUs. For 75 % (or 24) of these companies, the number of segments and the number of CGUs are the same.

14
For one company (3 %), the number of CGUs is smaller than the number of segments. In the case of that company, we can see that the goodwill was allocated entirely to the activities of one of the group's 8 identified operational segments. Given that at this time no other goodwill is allocated to other operational segments by the issuer, it is impossible to draw any conclusions about whether all the operational segments and the CGUs coincide. For the other companies, representing the other 2 %, the number of CGUs exceeds the number of operational segments.
Based on the average for the segments and CGUs, there does indeed appear to be a parallelism between operational segments and CGUs: for each issuer, there appears to be an average of 3 operational segments for 3 CGUs.
In accordance with IAS 1, paragraph 112c, companies can be expected to disclose sufficient information in their notes to the financial statements regarding the process they use for identifying cash-generating units. The FSMA recommends that the information published on the allocation of goodwill should offer insight into the business units that are expected to generate additional returns as well as into the risk of impairment loss to which their activities are exposed. 3.1.2 Allocation of goodwill to (a group of) cash-generating units
IAS 36, paragraph 134a, states that the carrying amount must be indicated for the goodwill allocated to each (group of) cash-generating unit(s) that is significant in comparison with the total carrying amount of goodwill.
The following graph provides an overview of the allocation by the companies selected.

15
Graph 2: Allocation of goodwill to CGUs
86 % of the companies selected submitted a complete reconciliation of the carrying amount of goodwill with the carrying amount of the goodwill allocated to the cash-generating units identified.
Yes86%
No14%
16
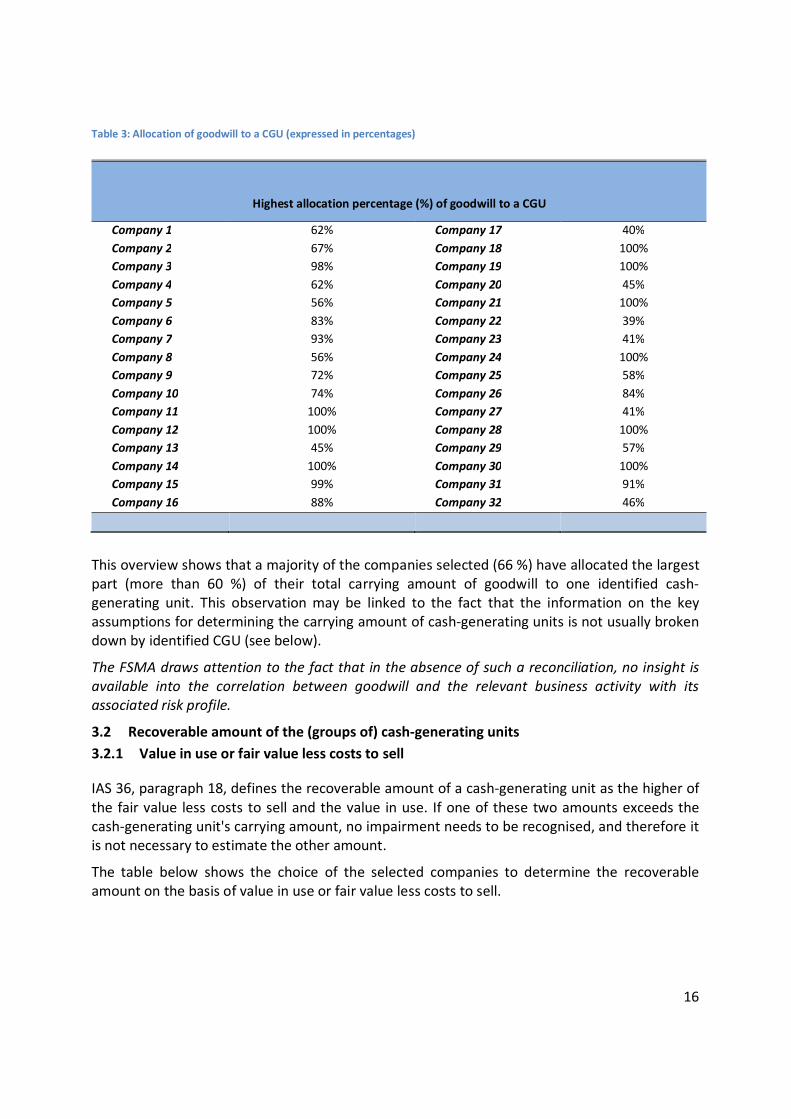
Table 3: Allocation of goodwill to a CGU (expressed in percentages)
Highest allocation percentage (%) of goodwill to a CGU
Company 1 62% Company 17 40% Company 2 67% Company 18 100% Company 3 98% Company 19 100% Company 4 62% Company 20 45% Company 5 56% Company 21 100% Company 6 83% Company 22 39% Company 7 93% Company 23 41% Company 8 56% Company 24 100% Company 9 72% Company 25 58% Company 10 74% Company 26 84% Company 11 100% Company 27 41% Company 12 100% Company 28 100% Company 13 45% Company 29 57% Company 14 100% Company 30 100% Company 15 99% Company 31 91% Company 16 88% Company 32 46%
This overview shows that a majority of the companies selected (66 %) have allocated the largest part (more than 60 %) of their total carrying amount of goodwill to one identified cash-generating unit. This observation may be linked to the fact that the information on the key assumptions for determining the carrying amount of cash-generating units is not usually broken down by identified CGU (see below).
The FSMA draws attention to the fact that in the absence of such a reconciliation, no insight is available into the correlation between goodwill and the relevant business activity with its associated risk profile.
3.2 Recoverable amount of the (groups of) cash-generating units 3.2.1 Value in use or fair value less costs to sell
IAS 36, paragraph 18, defines the recoverable amount of a cash-generating unit as the higher of the fair value less costs to sell and the value in use. If one of these two amounts exceeds the cash-generating unit's carrying amount, no impairment needs to be recognised, and therefore it is not necessary to estimate the other amount.
The table below shows the choice of the selected companies to determine the recoverable amount on the basis of value in use or fair value less costs to sell.

17
Table 4: Determining the recoverable amount
Recoverable amount
Both
Fair value less costs to sell Value in use
No information Total
Consumer goods - 1 6 - 7 Blue Chips - 1
- 1
Mid Caps - - 1 - 1 Small Caps - - 5 - 5
Industry - 1 6 - 7 Mid Caps - 1 2 - 3 Small Caps - - 4 - 4
Basic materials - -
1 1
Blue Chips - -
1 1
Health care - - 7 - 7 Blue Chips - - 1 - 1 Mid Caps - - 4 - 4 Small Caps - - 2 - 2
Utilities - 1 - - 1 Blue Chips - 1 - - 1
Consumer services 1 - 5 - 6 Blue Chips 1 - 2 - 3 Mid Caps - - 2 - 2 Small Caps - - 1 - 1
Technology 1 1 4 1 7
Mid Caps - - 1 1 2 Small Caps 1 1 3 - 5
Telecommunications - - 1 - 1 Blue Chips - - 1 - 1
Total 2 4 29 2 37
Most companies have opted to determine the recoverable amount of their CGUs by determining the value in use (29 companies from the sample), that is, 83 % of the companies that published information on their value in use.
Two companies chose to use fair value (less costs to sell) as well as value in use as the recoverable amount, depending on the CGU in question (i.e., to combine the two methods).
Four companies used fair value to determine the recoverable amount of their CGUs.
Two companies published no information on the recoverable amount (i.e. 5.4 % of the sample). Finally, there are the two companies that published little information about their goodwill.
Why the majority of the selected companies decided in the first instance to use value in use to determine the recoverable amount is not immediately obvious. Although the existence of an active market or of a binding sales agreement is not necessary in order to determine the fair value of a cash-generating unit (IAS 36, paragraph 26), it may be surmised that the choice has to do with the difficulty of obtaining comparable market prices for cash-generating units that are

18
usually not a homogeneous group, or of estimating the market prices on the basis of market expectations.
3.2.2 Determining the recoverable amount
IN BC IAS 36, 201-205, the IAS Board stresses the relevance of the information used to determine the reliability of the estimates used by management to support the carrying amount of goodwill. Nevertheless, balance was sought between the objective of publishing relevant information and the scope of the information to be treated as confidential.
For this reason, it was ultimately decided that the required disclosure should address the objection that detailed calculations of the recoverable amount should not be given since these would generally be too complex (and would lead simply to a series of values) and could be commercially or legally prejudicial.
As a result, IAS 36 does not contain any requirement to publish information about the value attributed to each key assumption used by the management to determine the recoverable amount, unless, in the context of a sensitivity analysis, a reasonably possible change in a key assumption would have the effect of making the carrying amount of goodwill higher than its recoverable amount.
The FSMA stresses that this IFRS decision in favour of descriptive information should not result in the explanatory information on the determination of the recoverable amount becoming a mere "boiler plate" description. A reference to illustrative example 9 given in IAS 3614, which meets the IFRS expectations in this regard, is sufficient for this purpose.
3.2.2.1. Recoverable amount based on value in use
The value in use of a cash-generating unit is defined in IAS 36, paragraph 6, as the present value of the future cash flows that the management expects to be derived from the unit.
Estimates of future cash flows shall15:
- be based on reasonable and supportable assumptions that represent management's best estimate of the economic conditions over the unit's useful life;
- be based on the most recent budgets approved by management, but shall exclude any future restructuring to which the entity is not yet committed;
- not include cash flows arising from financing activities, tax on profits, or investments improving or enhancing performance;
- take account of the day-to-day servicing costs and overheads that can be attributed directly or allocated on a reasonable and consistent basis.
IAS 36, paragraph 134d, determines what information on these cash flow projections must be published for each cash-generating unit for which the carrying amount of goodwill is significant in comparison with the entity's total carrying amount of goodwill.
14 IAS 36 IE, example 9. 15 IAS 36, paragraphs 33-38

19
In what follows, the research results for each component of the required information are set out.
3.2.2.1.1 Key assumptions for cash flow projection
IAS 36, paragraph 134d (i) states that for each cash-generating unit with significant goodwill, information must be published about each key assumption on which the management has based its cash flow projection.
It is reasonable to presume that these assumptions relate to expectations concerning the determining factors of the cash flow projection, such as turnover, operating costs, margins, operating capital, etc.
The graph below provides an overview of compliance with this information requirement. Graph 3: Description of the key assumptions
The research shows that in a number of cases (39 %) an informative description of the key assumptions is lacking and no specific information is published for each cash-generating unit with significant goodwill.
In these cases, the information is generally limited to the following standard phrase: "the cash flow projection is based on a financial plan for the coming x years approved by management"
In the cases (61 %) where a description of the key assumptions is provided, expectations are mentioned concerning volume of sales, margins, market share, EBIT, cost of raw materials, long-term interest rates, exchange rates and operating capital, among other things.
Individual questioning of the selected companies with a carrying amount of goodwill of more than 20 % of balance sheet total revealed that:
- a majority of the companies believe they have provided sufficient insight into their key assumptions;
- a minority of the companies have undertaken to make adjustments to the required information in a future report;
- the required information on key assumptions is often confused with the required information on growth rates and discount rates, because it is deemed that these would have the greatest impact on determining value in use. Key assumptions are indeed defined in IAS 36, paragraph
Yes - 61,29% No - 38,71%
Percentages

20
134d (i), in general terms as assumptions to which the recoverable amount is most sensitive, and yet IAS 36, paragraph 134d (iv) and (v) require that the growth rate and discount rate be reported separately on account of their presumed significance.
In the light of the research results presented here, the FSMA urges the companies concerned to provide sufficient insight into the key assumptions used for cash flow projection, specified, where applicable, for each cash-generating unit to which significant goodwill has been allocated.
3.2.2.1.2 Methods of allocating values to the key assumptions underlying cash flow projections
IAS 36, paragraph 134d (ii), states that for each cash-generating unit with significant goodwill, the company must provide a description of management's approach to determining the value(s) assigned to each key assumption, whether those value(s) reflect past experience or, if appropriate, are consistent with external sources of information and, if not, how and why they differ from past experience or external sources of information.
In order to give the key assumptions substantive content, specifics must be provided as to what management used as a basis for assigning values to the decisive factors of the key assumptions. Thus, for instance, they must describe what determining data were taken into consideration for the expected estimate of the key assumptions, such as turnover, margins, cost management, optimisation of equity, hedging, etc.
Moreover, it must be clearly stated whether account was taken of past experience and external sources of information.
As regards past experience, IAS 36, paragraph 34, states that the causes of differences between past cash flow projections and actual cash flows must be examined and that the cash flow projections must be adjusted, where necessary, based on this examination of differences.
In order to make this information meaningful, the FSMA recommends that where applicable, in accordance with IAS 8, paragraphs 32-39, clarifications be given regarding the effect of the adjustments that were made on the basis of past experience.
As regards consistency with external sources of information, the FSMA notes that this requirement must be understood in the context of value in use as defined in IAS 36: this is not a purely entity-specific value, since market information must be used in order to be able to determine the discount rate to be used. As a result, value in use must reflect how the market would price the cash flows that management expects16. Moreover, for purposes of reliability, greater weight should be given to external evidence (IAS 36, paragraph 33a).
The graphs below provide an overview of compliance with the various information requirements.
16 IAS 36, BC 60.

21
Graph 4: Compliance with the information requirements
From the research it appears that, just as for the information on the key assumptions, in a number of cases insufficient attention was paid to a meaningful description of the most important methods used by management for allocating values, and no specific details were published for each cash-generating unit with significant goodwill.
In cases where the allocated values were adequately described, the parameters used for the key assumptions, such as estimated changes in turnover, margins, market share, long-term interest rates, raw materials, exchange rates, etc., were set out in greater detail.
Individual questioning of the selected companies with a carrying amount of goodwill of more than 20 % of balance sheet total revealed, among other things, that:
- generally there is insufficient explanation as to why the methods for determining the allocated values are not set out more transparently;
- a (limited) number of companies refer to the homogeneous activity and risk profile as the reason why they do not publish specific information per cash-generating unit;
- some companies invoke considerations of competition, strategy or complexity to justify publishing only a limited amount of information.
As regards the methods for allocating values to key cash flow assumptions, the FSMA similarly urges the companies concerned to devote due care to the substantive explanation, where applicable, specified for each cash-generating unit to which significant goodwill has been allocated.
Management approach
Past experience
Consistency with external information
41,94%
45,16%
45,16%
58,06%
54,84%
54,84%
Yes No

22
3.2.2.1.3 Period of the cash flow projection
IAS 36, paragraph 134d (iii) states that for each cash-generating unit with significant goodwill, the period over which management has projected cash flows shall be published and, where a period greater than five years is used, an explanation why that longer period is justified.
This limitation of the period of the cash flow projection to five years originates in the notion that detailed and reliable cash flow projections are generally not available for periods of more than five years (IAS 36, paragraph 35). The graphs below provide an overview of compliance with the information requirements regarding the period of the cash flow projection.

23
Graph 5: Period of the cash flow projection
Graph 6: Cash flow projection: period of maximum 5 years vs. period of more than 5 years
4
21
6
27
No information on the forecast period
Information on the forecast period
Cash flow projection over a period of maximum 5 years
Cash flow projection over a period of more than 5 years
21
1
5
6
Cash flow projection over a period of maximum 5 years
Cash flow projection over a period of more than 5 years
Justification if period is longer than 5 years
No justification

24
Graph 7: Representation of the cash flow projection period via the CGUs
The requirement to publish information for the period of the cash flow projection is on the whole being complied with; only 4 companies have not published this information.
For companies where a cash flow projection period has been defined, more than 78 % have prepared forecasts for a period of maximum 5 years.
The remaining 22 % of the companies prepared forecasts for a period of more than 5 years (mainly for periods of 7, 10 and 20 years). There are 6 companies involved: 1 company that belongs to the BEL 20, 1 "blue chip", 2 "mid caps" and 3 "small caps". They are active mainly in the "health care" (50 %), consumer goods (33 %) and "consumer services" (17 %) sectors.
Justification for a projection for a period of more than 5 years was provided by only 1 company.
The FSMA expects companies with a cash flow projection for more than five years to provide justification for this period.
3.2.2.1.4 Growth rate for extrapolation outside the cash flow projection period
IAS 36, paragraph 134d (iv) states that for each cash-generating unit with significant goodwill, companies must publish the growth rate used to extrapolate cash-flow projections beyond the period covered by the most recent forecasts and, where applicable, provide a justification for using a growth rate that exceeds the long-term average growth rate.
The expected cash flow projections can be estimated only with a certain degree of reliability for a limited period. Given that cash-generating units generally have an indefinite useful life, the cash flows from the most recent projection period are capitalised at a constant rate in perpetuity, often on the basis of the Gordon Growth Model. This residual value constitutes (for the limited projection period and the presumed growth) a very important component of the total amount of the value in use, and therefore the assumptions regarding the cash flow of the
24 2 1
Identical period for each cash-generating unit
One period for each cash-generating unit
Time range

25
most recent projection period and the estimated growth rate should also have a significant impact.
The requirement that justification be given for using a higher than average growth rate is related to the conception that higher than average growth rates can only be sustained over the short term, since such conditions will attract new market entrants and give rise to competition; the growth rate will thus be the same as the overall economic growth rate (IAS 36, paragraph 37).
The graphs below provide an overview of the information published regarding adopted growth rates after the cash flow projection period.
Graph 8: Growth rates
56
14
6
26
No information on the growth rates
Published growth rates
Percentage range
General percentage
Specific percentage per CGU

26
Graph 9: General growth rate per company
Analysis of the growth rates published by companies in the sample group shows that in 84% of the cases, the growth percentages published are those used for the extrapolation of the cash flow projection beyond the period covered by the budgets/ forecasts.
54 % of the entities that have published information about the growth rates used reported an overall growth rate (that usually fluctuates between 0 % and 2 %). The remaining 46 % opted for a range of percentages (23 %) or a specific percentage per CGU (23 %).
The percentages used by most companies to extrapolate the cash flow projections beyond the period covered by the budgets/forecasts are less than or equal to 23 %, a rate that appears to agree with the average long-term growth rates at the time when the annual reports under review were drawn up. The analysis has also shown that not a single company has justified the choice of its growth rates, which could mean that the entities consider that the percentages they use are not higher than the average long-term growth rates relating to the products, activity sectors or country(ies) in which they are active.
Individual questioning of the selected companies with a carrying amount of goodwill of more than 20 % of the balance sheet total revealed that in a majority of cases, the final value is determined by a rate in perpetuity in application of the Gordon Growth Model, and that this value represents on average 70 % of the total estimated value in use.
3.2.2.1.5 Discount rate
IAS 36, paragraph 134d (v) states that for each cash-generating unit with significant goodwill, the discount rate applied to the cash flow projections must be mentioned.
3 3
4
1 1
2
0% 1% 2% 2,30% 3% 5%

27
In accordance with IAS 36, paragraph 55, the discount rate must be a pre-tax discount rate that reflects the current market assessments of the time value of money and of the specific risks for which the future cash flow estimates have not been adjusted.
Where the market does not have a specific discount rate for the cash-generating unit (as will often be the case), in practice the weighted average capital cost (WACC) is most often used. To determine the WACC, the cost of equity and debt must be determined and weighted for the capital structure.
The FSMA recommends that, taking into account the diverse approaches and assumptions used for determining the WACC, the information provided should mention not only the discount rate(s) used. To this end, we refer to the aim already mentioned, namely the impairment test and the verifiable reliability which it requires.
In what follows, we provide an overview of a few of the most important points for consideration.
The cost of equity will often be determined using the "capital asset pricing model" (CAPM), in which assumptions must be made regarding the risk-free rate, market risk premium and the standardised risk contribution (beta).
When choosing the risk-free rate, attention must be paid to correlating it with the inflation assumptions and the time horizon of expected cash flows.
It must be possible to provide a consistent justification for the choice of market risk premium.
To determine the beta, attention must be paid, where applicable, to the presence of changing factors (changing of the cyclicality, etc.), to the specific activity of the cash-generating unit in question and to the conversion of a financing ("levered") beta into a beta for business activities ("unlevered beta") that can be determined in a variety of ways (Harris Pringle, Hamada, Miles-Ezzell, etc.).
The cost of debt capital is the company's financing cost, derived from the sum of the risk-free rate (the same risk-free rate as for determining the cost of equity) and a specific risk premium that must be paid on the balance sheet date in order to conclude a new long-term financing agreement.
The relationship between equity/debt shall, as determined in IAS 36, be independent of the entity's capital structure and of the entity's mode of financing. For this reason, this relationship is derived from the standardised capital structure of a comparable entity.
Ideally, there should be some insight given into how the requirement, in IAS 36, paragraph 55, that a pre-tax discount rate be applied is fulfilled. In practice, the requirement is mostly fulfilled by means of a simplified computation by dividing the post-tax discount rate by 1, less the applicable tax rate. If this simplified method of computation is used, justification must be given as to why the result does not differ materially from an iterative computation, as described in BCZ 85, IAS 36.
Finally, it should be emphasised that particular attention must be paid to the risk profile of the identified cash-generating units. If these risks vary, separate discount rates must also be used.

28
The graphs below provide an overview of the information published regarding the discount rate used by the companies selected.
Graph 10: Discount rates: a single discount rate vs. a range of discount rates vs. general discount rate
3
13
4
11
28
No information on discount rates
Information on discount rates
Specific discount rate per CGU
Range of discount rates
General discount rate

29
Graph 11: Discount rates: general discount rate vs. specific discount rate
Most companies (more than 46 %) opted for a specific discount rate for each CGU, while 39 % opted for a general discount rate, i.e. the self discount rate for all CGUs.
Moreover, a minority of the companies (14 %) chose to publish a range of discount rates
Finally, some 10 % of the companies in question did not publish any information on discount rates.
0,00%
2,00%
4,00%
6,00%
8,00%
10,00%
12,00%
14,00%
16,00%
Specific discount rate per CGU General discount rate

30
Graph 12: Discount rate spread17
The graph shows all the discount rates used for all the CGUs of the companies from the sample. Among the companies that published a range of discount rates for their CGUs, the discount rate for each CGU used for the graph is the arithmetical average of the range. In the case of those issuers as well that published a general discount rate, this is the discount rate that was taken into consideration for each of the issuers' CGUs.
In all there are 70 discount rates, ranging from 6.01 % to 15 %. The ranges 7.01 % - 8 % (in 14 cases), 8/01 % - 9 % (in 19 cases) and 9.01 % - 10 % (in 14 cases) appear most frequently. Together they represent around 70 % of the cases. Two other frequently used ranges are 10.01% - 11 % (in 9 cases) and 11.01 % - 12 % (in 8 cases), which represent 13 % and 11 % respectively (or, taken together, 24 %).
Individual questioning of the selected companies with a carrying amount of goodwill that represents more than 20 % of the balance sheet total showed that for determining the discount rate, the WACC is indeed often used. The data provided did not, however, make it possible to assess the extent to which the determination of the key factors fulfils the IFRS requirements described above.
17 The discount rates used for the "range of discount rates" series are the average discount rates for each range.
0
2
4
6
8
10
12
14
16
18
20
5,01 % - 6 % 6,01 % - 7 % 7,01 % - 8 % 8,01 % - 9 % 9,01 % - 10 % 10,01 % - 11 % 11,01 % - 12 % 12,01 % - 13 % 13,01 % - 14 % 14,01 % - 15 % 15,01 % - 16 %

31
3.2.2.2 Recoverable amount based on fair value less costs to sell
Where the recoverable amount is determined on the basis of fair value less costs to sell, IAS 36, paragraphs 25-29 prescribe the following hierarchy:
- the best indication is a price in a binding sales agreement in an arm's length transaction; - if there is no binding sales agreement but there is an active market, then the market price
must be used (if there is no current bid price available, then the price of the most recent transaction can serve as a basis);
- if none of the aforementioned indicators is present, then the best available information must be used to arrive at the amount that would be obtained from a disposal arising from an arm's length transaction. As is the case for determining value in use, so here a cash flow projection can be used. In doing so, one must ensure that the inputs from such a projection agree with the market expectations in this regard, and not with the company's estimates. Important differences with the cash flow projection for determining value in use may have to do with the expectations of market participants as regards restructuring or capacity building or reduction, expected margins, information about expected synergies, etc.
In times of economic uncertainty, special attention must be paid to consistency between expectations and one's own estimates. If a sufficiently reliable estimate of fair value less costs to sell is not possible, IAS 36, paragraph 20 states that the asset's value in use may be used as its recoverable amount.
The following graph provides an overview of the information on determining fair value less costs to sell that was provided by the selected companies.

32
Graph 13: Recoverable amount: fair value less costs to sell
From the original sample of 37 companies, 6 (i.e., 16 %) reported having used the fair value (less costs to sell) to calculate the recoverable amount of their CGU(s).
4 of the 6 companies (i.e. 67 %) applied the concept of "fair value" to all their CGUs, while the other 2 companies used both methods (value in use and fair value) to estimate the recoverable amount of their CGUs. In this regard it should also be noted that one of those 2 companies used fair value only for certain of its CGUs, while the other used the fair value method to confirm the method of estimates based on value in use.
4 companies used an observable market price when determining fair value less costs to sell. One company reports having used a model for updated cash flow projections.
The analysis did not take account of the last company because the latter clearly indicated it had used the fair value method, while for purely internal purposes they used the value in use method.
2
29
4
2No information on the method for computing recoverable amount
Recoverable amount = value in use
Recoverable amount = fair value
Value in use and fair value

33
Graph 14: Fair value less costs to sell: observable market value vs. cash flow projection
As regards the 4 companies that refer to an observable market price, the analysis shows that:
only one company refers to the concept of "share price" as an observable market value; no other information besides this is provided;
while the 3 other companies mention that they used observable market conditions such as "profit multiples paid on the market in the case of similar companies", "valuations at market price based on the company share price", "market multiples calculated by reference to multiples of listed companies from the sector and compared with recent transactions", they publish a series of assumptions relating to the discount rate for cash flows, a practice that seems inconsistent with the methodology they have chosen. IAS 36, paragraph 134e clearly states that the entity must disclose (i) a description of each key assumption on which management has based its determination of fair value less costs to sell and (ii) a description of management's approach to determining the value(s) assigned to each key assumption... only if the fair value less costs to sell is not determined using an observable market price for the unit (group of units).
Finally, for the last company that opted for a cash flow projection model, the information provided is as follows: (i) the key assumptions such as inflation, exchange rates, volumes of sales, etc., (ii) the management's approach to determining the value of the key assumptions do not appear clearly set out, but it can be noted that past experiences reflect and agree with the external sources of information, (iii) the period for which cash flow projections have been drawn up, i.e. 10 years, (iv) the growth rate that is not disclosed, and (v) the published discount rate that is not specified per CGU but for which a range of percentages between 6 % and 21.2 % is provided.
4
1
1
Observable market value
Cash flow projection
Not applicable

34
3.3 Reasonably possible change in recoverable amount
IAS 36, paragraph 134f states that the following information must be disclosed if a reasonably possible change in a key assumption would result in the carrying amount of the cash-generating unit exceeding its recoverable amount:
- the amount by which the recoverable amount exceeds its carrying amount; - the value assigned to the key assumption; - the amount by which that value must change, after incorporating any consequential effects of that change on the other variables used to measure recoverable value, in order for the recoverable value to be equal to its carrying amount.
The aim of this sensitivity analysis is to explain the sort of change in a key assumption that can lead to the recognition of a goodwill impairment loss.
THE FSMA takes the view that the criterion for performing this sensitivity analysis should not be understood too strictly. A reasonably possible change need not necessarily mean that this change is also considered probable. Certainly in times of economic uncertainty, clear communication about the key assumptions and their inherent uncertainty is necessary. Thus, independently of the correlation between the various assumptions, it may also be advisable not to limit the sensitivity analysis to just one assumption, but to analyse the combined effect of a change upon a number of related assumptions.
Moreover, the FSMA recommends that, in order to provide the necessary insight, the information published should not be limited to the observation that "management has decided that a reasonably possible change in a key assumption would not lead to an impairment loss". In such a case, justification should at least be given as to why a more detailed disclosure of information is not deemed necessary. Otherwise, there would be a lack of insight into the assumed changes in the key assumptions used and in their quantification.
The graphs below provide an overview of the information published regarding the sensitivity analysis performed by the companies selected.

35
Graph 15: Sensitivity analysis of the key assumptions
15 of the 37 companies in the sample (i.e., more than 40 %) did not publish a sensitivity analysis of the key assumptions.
22 other companies stated in the conclusion to their sensitivity analyses that a reasonably possible change in a key assumption would not result in the carrying amount of the CGUs exceeding their recoverable amount.
In the case of the remaining 6 companies (i.e., more than 15 %) such a change would be very likely to result in the carrying amount of the CGUs exceeding their recoverable amount.
15
16
6
22
No sensitivity analysis
Sensitivity analysis
Recoverable value > carrying amount
Recoverable value < carrying amount

36
Graph 16: Publication of information when a reasonably possible change in a key assumption may result in the carrying amount exceeding the recoverable amount
2 of the 6 companies concerned (i.e. more than 30%) have published no additional information at all regarding their sensitivity analysis.
Only one company published all the information requested.
The 3 other companies published very little detailed information, which contains only part of the information required under IAS 36.
Individual questioning of the companies with a carrying amount of goodwill amounting to more than 20% of the balance sheet total showed that it was primarily the key assumptions regarding the growth rate and the discount rate that be subjected to a sensitivity analysis.
4 Recognition of goodwill impairment loss
IAS 36, paragraph 104, states that an impairment loss for a (group of) cash-generating unit(s) must be recognised if the recoverable amount of the (group of) unit(s) is lower than the carrying amount of the (group of) unit(s).
This impairment loss must first be allocated to the carrying amount allocated to goodwill, and subsequently to the other assets of the (group of) unit's) prorated to the carrying amount of each asset in the (group of) unit(s).
IAS 36, paragraphs 126-133 comprise the information requirements in this regard, including a description of the circumstances that have led to the impairment loss and, if substantial, a description of the cash-generating unit in question and the amount of the impairment loss per operational segment.
0% 20% 40% 60% 80% 100%
Amount of the recoverable amount vs carrying amount
Values of the key assumptions
Amount of a key assumption in order that recoverable amount = carrying
amount
1
3
1
3
1
3
2
2
2
Yes No No information
37
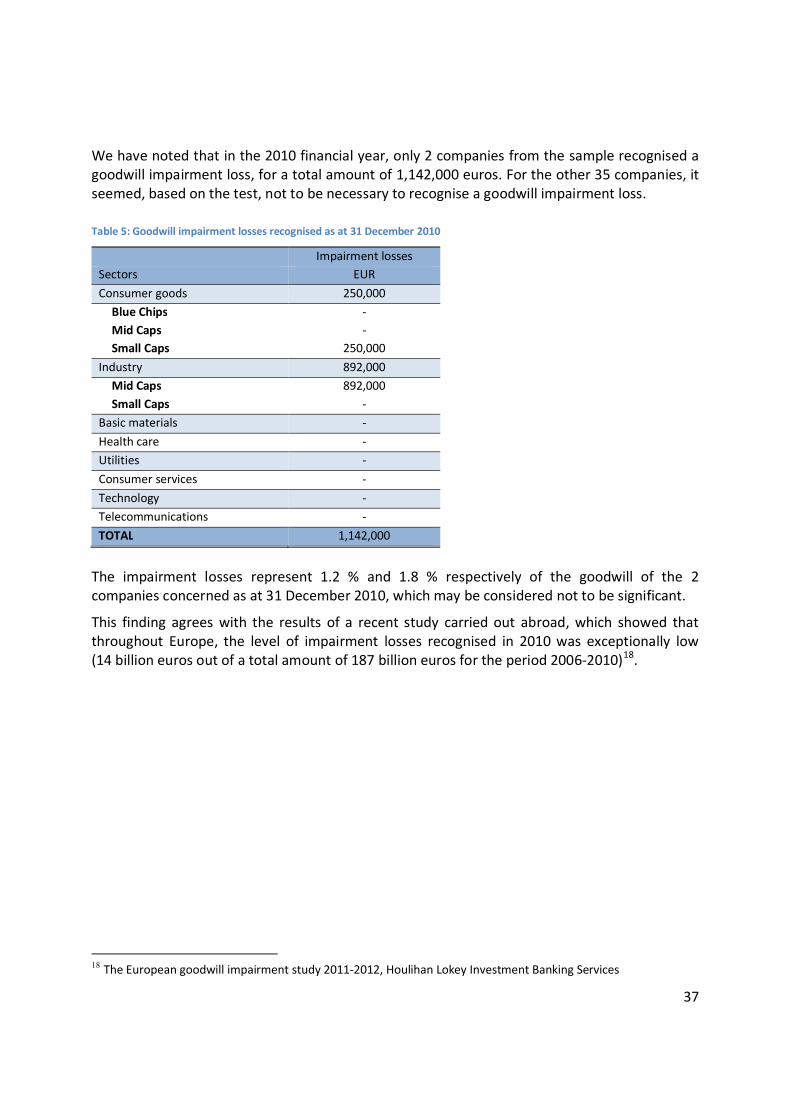
We have noted that in the 2010 financial year, only 2 companies from the sample recognised a goodwill impairment loss, for a total amount of 1,142,000 euros. For the other 35 companies, it seemed, based on the test, not to be necessary to recognise a goodwill impairment loss. Table 5: Goodwill impairment losses recognised as at 31 December 2010
Impairment losses Sectors EUR
Consumer goods 250,000 Blue Chips - Mid Caps - Small Caps 250,000
Industry 892,000 Mid Caps 892,000 Small Caps -
Basic materials -
Health care - Utilities -
Consumer services -
Technology - Telecommunications -
TOTAL 1,142,000
The impairment losses represent 1.2 % and 1.8 % respectively of the goodwill of the 2 companies concerned as at 31 December 2010, which may be considered not to be significant.
This finding agrees with the results of a recent study carried out abroad, which showed that throughout Europe, the level of impairment losses recognised in 2010 was exceptionally low (14 billion euros out of a total amount of 187 billion euros for the period 2006-2010)18.
18 The European goodwill impairment study 2011-2012, Houlihan Lokey Investment Banking Services

38
5 Conclusions
5.1 The findings contained in this study regarding compliance with the IFRS disclosure requirements regarding goodwill agrees, broadly speaking, with similar research by foreign supervisors19. The research shows that only in a limited number of cases does the information published fully meet the IFRS requirements. The most common shortcomings are that the information published is too general (citing or paraphrasing the IFRS provisions), the specificity of the cash-generating units is not taken sufficiently into account, and the sensitivity analysis is inadequate.
5.2 An overall assessment of the information published on goodwill by the companies selected for this study could be expressed as follows: Table 6: General evaluation of the quality of the information published by the companies in the sample
Number of companies Evaluation
8 no or hardly any information
12 very general information
12 useful information on a number of aspects
5 particularly useful information that takes into consideration the specific characteristics of the company
Graph 17: General evaluation of the quality of the information published by the companies in the sample
19 UK, FRC, Review of goodwill impairment disclosures, October 2008. Finland, FSA, Report on IFRS enforcement, October 2009. Norway, Finanstilsynet, certain accounting related issues based on the review of financial. Statements for 2010.
8
12 12
5
No or hardly any information
Very general information Useful information on a number of aspects
particularly useful information + specific
characteristics

39
5.3 The current economic situation constitutes an important challenge to the goodwill impairment test to be performed and the information published regarding that test. The consequences of the less positive prospects and the growing uncertainty will have to be weighed up carefully and, where necessary, give rise to: - publication of appropriate information on the main causes of estimation uncertainty, in
application of IAS 1, paragraphs 125-133; - an adjustment of the key assumptions, in compliance with the disclosure requirements laid
down in IAS 8, paragraph 39; - the recognition of an impairment loss in application of IAS 36, paragraph 104.
Factors which demand special attention include the key assumptions (turnover, margins, costs, etc.), the cash flow used for calculating the final value, the long-term growth rate and the discount rate (market and credit risks).
In this context, the FSMA expects that the auditors will also pay careful attention to the information published regarding the goodwill impairment test. The present study has shown that not a single audit report of the selected companies contained any explanatory paragraph or reservation with regard to significant goodwill, although in some cases the required information was lacking or insufficient.

40
6 List of published studies
1. The half-yearly communiqués for 1997 by companies listed on the First Market and on the New Market (December 1997).
2. Cash-flow statement or financing table: a comparative survey of reporting by companies listed on the Forward Equity Market (February 1998).
3. Publication of specific data intended for investors by companies listed on the Forward Equity Market (March 1998).
4. Communiqués on the 1997 annual results of companies listed on the First Market and on the New Market (May 1998).
5. Comparative survey of corporate governance reporting by Belgian listed companies (October 1998).
6. The half-yearly communiqués for 1998 by companies listed on the First Market and on the New Market (December 1998).
7. Transparency for the securities portfolio (January 1999).
8. Communiqués on the 1998 annual results of companies listed on the First Market and on the New Market (May 1999).
9. Accounting policies (July 1999).
10. Comparative survey on reporting by Belgian listed companies (annual accounts 1998) as regards corporate governance (November 1999).
11. Publication of specific data intended for investors by Belgian companies listed on the First Market (December 1999).
12. The half-yearly communiqués for 1999 by companies listed on the First Market and on the New Market (December 1999).
13. The communiqués on the 1999 annual results as published by companies listed on the First Market and on the New Market (July 2000).
14. The half-yearly communiqués for 2000 by companies listed on the First Market and on the New Market (November 2000).
15. The communiqués published by companies listed on the First Market and on the New Market on their annual results for 2000 (July 2001).
16. The half-yearly communiqués for 2001 by companies listed on the First Market and on the New Market (November 2001).
17. The communiqués on the 2001 annual results of companies listed on the First Market and on the New Market (June 2002).
18. The half-yearly communiqués published in 2002 by companies listed on the First Market and on the New Market (December 2002).

41
19. Quarterly information for Q 3/2002 as published by companies listed on the First Market (February 2003).
20. Information on the internet – Trading units of UCIs on the internet (July 2003).
21. Methods used for UCI risk calculation (July 2003).
22. Communiqués on the annual results for 2002 of companies listed on the First Market and on the New Market (September 2003).
23. The half-yearly communiqués published in 2003 by companies listed on Euronext Brussels (December 2003).
24. The quarterly communiqués published in 2003 by companies listed on Euronext Brussels (February 2004).
25. The annual communiqués for 2003 by companies listed on Euronext Brussels (June 2004).
26. The results of the CBFA’s IAS/IFRS survey of Belgian listed companies (June 2004).
27. Information on corporate governance as disclosed by Belgian companies listed on the First Market of Euronext Brussels - capita selecta (December 2004).
28. The half-yearly communiqués published in 2004 by companies listed on Euronext Brussels (December 2004).
29. Notices to attend general meetings of Belgian listed companies: rules for publication (November 2005)
30. The half-yearly communiqués published in 2005 by companies listed on Eurolist by Euronext Brussels (January 2006).
31. 2005 reporting on the changeover to IFRS by Belgian companies listed on Eurolist by Euronext Brussels and its impact on the own funds and result (March 2006).
32. The yearly communiqués for 2005 by companies listed on Eurolist by Euronext Brussels (August 2006).
33. Comparative survey of information of "corporate governance" reporting by listed companies in the “corporate governance charter” (December 2006).
34. Study on the presentation of the IFRS income statement and compliance with CESR’s recommendation on alternative performance measures (December 2006).
35. Interim statement or quarterly financial report: a new obligation for listed companies (June 2008).
36. Study on the first half-yearly financial reports drawn up in accordance with IAS 34 (December 2008).
37. Study on the half-yearly financial reports drawn up in accordance with IAS 34 (June 2010).
38. Compliance by Belgian listed companies with new disclosure requirements laid down in the Belgian Corporate Governance Code 2009 (December 2010).

42
39. Comparative study regarding the Dealing Codes of listed companies (December 2010).
40. The first corporate governance statements: follow-up on Study no. 38.
All the studies can be downloaded from the FSMA site (www.fsma.be).