stratification ratio of soil organic matter pools as an indicator of carbon sequestration in a...
TRANSCRIPT

Stratification ratio of soil organic matter pools as an indicator of carbonsequestration in a tillage chronosequence on a Brazilian Oxisol
Joao Carlos de Moraes Sa a,*, Rattan Lal b
a Universidade Estadual de Ponta Grossa, Departamento de Ciencia do Solo e Engenharia Agrıcola, Av. Carlos Cavalcanti 4748, Campus de Uvaranas, 84030-900 Ponta Grossa, PR, Brazilb The Ohio State University, Carbon Management and Sequestration Centre, 2021 Coffey Road, Columbus, OH 43210, USA
Soil & Tillage Research 103 (2009) 46–56
A R T I C L E I N F O
Article history:
Received 17 June 2008
Received in revised form 5 September 2008
Accepted 18 September 2008
Keywords:
Chronosequence
No-tillage
Stratification ratio
SOM pools
C sequestration rates
A B S T R A C T
Long-term no-tillage (NT) leads to profile stratification of soil organic matter (SOM) pools, and the soil
organic carbon (SOC) stratification ratio (SR) is an indicator of soil quality. The objective of this report is to
assess the feasibility of using SOC-SR as an index for estimating SOC sequestration in NT soils. The effect
of a plow tillage (PT) and NT chronosequence on the SR of SOM pools was assessed in an Oxisol in
Southern Brazil (508230W and 248360S). The chronosequence consisted of six sites: (i) native field (NF); (ii)
PT of the native field (PNF-1) involving conversion of natural vegetation to cropland; (iii) NT for 10 years
(NT-10); (iv) NT for 20 years (NT-20); (v) NT for 22 years (NT-22); (vi) conventional tillage for 22 years
(CT-22). Soil samples were collected from four depths (0–5 cm; 5–10 cm; 10–20 cm; 20–40 cm layer) and
soil parameters comprised by SOM pools [i.e., C, N, S, particulate organic C (POC), particulate N (PN),
stable C (SC) and stable N (SN), microbial biomass C (MBC) and microbial biomass N (MBN), basal
respiration (BR), dissolved organic C (DOC), total polysaccharides (TP) and labile polysaccharides (LP)]
were measured. In undisturbed NF soil, the SR of all parameters increased with increase in soil depth. In
contrast, the SR decreased in PT, and the SOM was uniformly distributed in the soil profile. All NT
treatments restored the SR, and were characterized with higher values of all measured parameters
compared to NF. The SR for SOC ranged from 1.12 to 1.51 for CT-22 compared with 1.64–2.61 SR for NT
surface and sub-soil layers, respectively. The SR for POC and PN were higher than those for stable C and N.
However, SR for the biological pools (e.g., MBC, MBN and BR) were the highest and strongly correlated
with the rate of SOC sequestration. An increase in SR of SOC was also positively correlated with the rate
and amount of SOC sequestered. Regression analyses indicated a strong correlation between SR of SOC
and all parameters monitored in this study. The data showed that the SR of SOC is an efficient indicator of
C sequestration in long-term NT management.
� 2008 Elsevier B.V. All rights reserved.
Contents lists available at ScienceDirect
Soil & Tillage Research
journa l homepage: www.e lsev ier .com/ locate /s t i l l
1. Introduction
The term soil quality implies ‘‘the capacity of a specific kind ofsoil to function, within natural or managed ecosystem boundaries,to sustain plant and animal productivity, maintain or enhancewater and air quality, and support human health and habitation’’(NRCS, 2008). Soil organic matter (SOM) strongly impacts soilquality, and interacts with soil chemical, physical and biologicalparameters, which determine plant growth. It is widely recognizedthat continuous NT farming leads to stratification of the SOM pool,with the highest accumulation in the surface layer (Dick, 1983;Rasmussen and Parton, 1994; Sa, 1999; Franzluebbers, 2002; Dıaz-Zorita and Grove, 2002; Franzluebbers et al., 2007). In contrast,soils under plow tillage (PT) to 20 cm depth cause a uniform
* Corresponding author. Tel.: +55 42 32203090; fax: +55 42 32203072.
E-mail addresses: [email protected], [email protected] (Sa).
0167-1987/$ – see front matter � 2008 Elsevier B.V. All rights reserved.
doi:10.1016/j.still.2008.09.003
distribution of SOM (Franzluebbers, 2002; Dıaz-Zorita and Grove,2002). The stratification of SOC pools with depths in undisturbedsoil (i.e., natural vegetation) is a natural process governed bycontinuous input of C by litter at the soil surface and less input withsoil depth (Prescott et al., 1995; Franzluebbers, 2002). Thisenrichment of the surface layer with SOM maintains soil qualityby enhancing aggregation and facilitating aeration (Doran andParkin, 1994; Franzluebbers et al., 2007). The conversion of naturalvegetation to agricultural ecosystems based on PT degrades soilquality by mixing surface soil with subsoil and decreasing SOMstratification. Mechanical disturbance by PT disrupts aggregation,exposes SOM protected within the aggregates to microbial attack(Elliott, 1986), and exacerbates erosion-induced soil degradation(Lal, 1997).
The stratification ratio (SR) of SOM can be used as an indicatorof the soil quality under diverse tillage methods (Franzluebbers,2002; Dıaz-Zorita and Grove, 2002; Franzluebbers et al., 2007).Franzluebbers (2002) defined SR as the ratio of parameter values in

J.C.M. Sa, R. Lal / Soil & Tillage Research 103 (2009) 46–56 47
the soil surface with that at a lower depth, such as the bottom of thetillage layer. This lower depth is used to normalize the assessmentand make valid comparisons among soils from different ecoregionsor landscape positions with inherent differences in soil capability.Several studies have shown that SR ranges from 1.1 to 1.9 for CT and2.1 to 4.1 for NT (Blevins et al., 1977; Blevins et al., 1983; Ismail et al.,1994; Dıaz-Zorita and Grove, 2002; Franzluebbers, 2002; Fran-zluebbers et al., 2007). The SR of SOC was proposed as an efficientindicator of soil quality (Franzluebbers, 2002; Dıaz-Zorita and Grove,2002), and its increase can be related to the rate and amount of SOCsequestration (Franzluebbers, 2002; Moreno et al., 2006; Brye et al.,2006).
To date, there are few comparisons in SR of SOC among NT andPT systems over a chronosequence. Such a comparison may beuseful to determine temporal changes in SR caused by tillagemethods. Furthermore, information on long-term impacts on soilproperties, especially those affected by SOM pools, is scant. Yet,research information on SR of SOM pools from chronosequencesfor diverse tillage methods is needed to identify strategies forsustainable management of soil resources. It is hypothesized thatthe SR of SOM pools varies according to the duration of specifictillage methods and the enhancement of the SR for SOC is animportant indicator of C sequestration in NT soils. Therefore, theobjective of this study was to assess temporal changes in SR of SOCamong tillage methods, determine interactions of SR with the rateand amount of SOC sequestered, and assess whether SR can be usedas an index of C sequestration in a Brazilian Oxisol.
2. Materials and methods
2.1. Sites description
Field experiments were conducted at two research sites insouthern Brazil. One site was located near the town of Tibagi (SantaBranca Farm), and the other near Ponta Grossa city (FrankannaFarm), in Parana State, Brazil (508230W and 248360S; 508200W and258200S, respectively). These experimental sites are located 880–910 m above sea level and were characterized by a mesothermic,wet subtropical, type cfb (koeppen classification) climate. Themean annual rainfall of Ponta Grossa (44 years average—IAPAR,1998) and Tibagi city (24 years average—Fundacao ABC, 1998) was1545 and 1532 mm, respectively. The rainfall is distributedthroughout the year without a pronounced dry period. Meantemperature is 22 8C during summer and 15 8C in winter, withfrequent occurrence of frost. The natural vegetation is a subtropical‘‘prairie’’ dominated by C4 species represented by some fireresistant grasses such as Andropogon sp., Aristida sp., Paspalum sp.,Panicum sp., and by subtropical gallery forests, generally located innatural drainage channels (Maack, 1981). The landscape has longgentle slopes ranging from 2 to 7%. The parent material iscomprised of clastic sediments of the Devonian period character-ized by reworked materials called Ponta Grossa shale and Furnassandstone formations. These soils are classified as clayey Dark RedLatosol (Typic Hapludox), have a deep and very well structuredprofile, high porosity (with equal proportion of macro- and micro-porosity) and very good internal drainage. These soils are of lowinherent fertility, have high exchangeable Al3+ content and arelocated on the shoulder slopes. Soil profile of each site was studiedby digging a 1.5 m � 1.5 m pit, and samples were obtained from 0to 20 cm and 20 to 40 cm layers for chemical and mineralogicalanalyses (Table 1). The choice of these sites was based on theexistence of a well-defined age chronosequence starting from theoriginal undisturbed conditions (natural vegetation and soilproperties). This chronosequence provided an opportunity toassess the long-term impacts of PT and NT systems on SR of various
SOM affected parameters, and to evaluate its feasibility as anindicator of C sequestration. The sites were developed on the sameparent material, have the same soil type, the same landscapeposition, and were managed with similar rotation and soil/cropmanagement practices except for tillage. Detailed descriptions ofthese soils are presented in an earlier report (Sa et al., 2001).
2.2. Conversion of natural vegetation to an agricultural system, crop
rotation and cultural practices
The chronosequence treatments are briefly described below.
(a) T
ibagi site (Santa Branca Farm): the previous land use wasnatural vegetation (native field) comprising a climax vegeta-tion of the region and representing the NF treatment. This sitewas converted to cropland in 1969 using a 70-cm disk, plowingto 20-cm depth and disking twice with 60-cm wide disk tobreak clods. Soil acidity was initially corrected with applicationof 3.5 Mg ha�1 of lime, and phosphorus (P) was added at a rateof 117 kg ha�1 of P2O5 (52 kg P). This site was cultivated for 3years with PT for production of rice (Oryza sativa). A 7-yearrotation involving soybean [Glycine max. (L.) Merrill] insummer and wheat (Triticum aestivum) in winter was followedsubsequently. During the 10-year period, lime was incorpo-rated into the plow layer three times at the rate of 2 Mg ha�1. In1979, 20–30% of the total area was converted to a NT systemand this area represents the 20-years NT management (NT-20treatment). From 1979 to 1998, cropping during the summerseason involved 15 crops of soybean and 5 of corn (Zea mays L.).During the winter season, wheat was cultivated seven times,black oats (Avena strigosa, Schreb) 11 times and lupine (Lupinusangustifollios) twice. Both black oats and lupine were grown ascover crops. In 1989, the border area and other plowed areaswere converted to NT system and represent the 10 years of NTmanagement (NT-10 treatment). For the NT treatments, limewas applied on the soil surface four times at the rate of1.5 Mg ha�1. Cropping during the summer consisted of 7 cropsof soybean and 3 of corn, and that during the winter comprised4 crops of wheat and 6 of black oats. Another natural vegetationsite was converted to cropland in June 1996, and represents thePT of native field (PNF-1 treatment), with application of lime(3.5 Mg ha�1) and 140 kg ha�1 of superphosphate (67 kg P)initially incorporated to 20-cm depth with one 70-cm disking,and two 60-cm wide disking. The conversion began 18-monthsprior to sampling, and crops sown were soybean (October,1996), black oats (May, 1997) and corn (September, 1997).
(b) P
onta Grossa site (Frankanna Farm): the previous land use wasnatural vegetation and the conversion to agricultural ecosys-tem was initiated in 1961. In 1976, two plots were identified tocompare 22 years of NT management (NT-22 treatment) and 22years of conventional tillage (CT-22 treatment). The CT-22treatment involved PT with a 70-cm disking after summerharvest, and one after winter harvest to 20 cm depth plus two60-cm wide disking to break the clods). Soil and cropmanagement practices (plowing, crops, lime, and P rates) usedduring 1961–1976 were similar to those of the Tibagi site.Cropping during summer between 1976 and 1998 comprised of15 crops of soybean and 6 of corn, and that during wintercomprised of 10 crops of wheat, 4 of black oats and 1 of lupine,and 4 of winter rye (Lollium multiflorum). This area alsoreceived liquid cattle manure at an approximate rate of 15–20 m3 ha�1 in 1996 and 1997.At both sites, the 3-year crop rotation sequence (winterand summer) was: wheat – soybean/black oats – soybean/black

Table 1Chemical and mineralogical properties of the Typic Hapludox (Dark Red Latosol) collected from the tillage systems in the chronosequence.
Depth (cm) Tillage Systems
NF PNF-1 NT-10 NT-20 NT-22 CT-22
Chemical
pH (1:2.5 soil/water) 0–20 4.9 5.6 6.3 6.3 6.3 6.0
20–40 5.0 4.7 5.7 5.3 5.2 4.9
Potential acidity (cmolc kg�1) 0–20 9.7 13.2 4.2 6.2 5.1 5.3
20–40 8.0 12.7 4.7 7.1 5.8 8.0
Exchangeable Al (cmolc kg�1) 0–20 1.3 2.2 0.07 0.08 0.07 0.15
20–40 9.7 3.7 0.20 0.40 0.30 0.50
Exchangeable Ca (cmolc kg�1) 0–20 0.54 3.4 4.8 5.3 4.7 4.5
20–40 0.16 0.36 1.4 1.2 0.9 1.1
Exchangeable Mg (cmolc kg�1) 0–20 0.17 2.2 1.9 2.2 2.1 2.2
20–40 0.10 0.20 0.70 0.50 0.60 0.60
Exchangeable K (cmolc kg�1) 0–20 0.12 0.34 0.22 0.37 0.46 0.41
20–40 0.03 0.12 0.07 0.11 0.21 0.22
CEC (cmolc kg�1) 0–20 10.5 17.9 10.9 13.7 12.3 12.4
20–40 8.3 13.4 6.9 8.9 7.5 9.9
Available P (mg kg�1) 0–20 6.3 15 24 35 73 27
20–40 3.0 5.0 4.0 4.0 4.0 3.0
Mineralogical
Clay fraction types (X-ray)a Bo1 Kaob Kao Kao Kao Kao –
Gib Gib Gib Gib Gib –
Hem Hem Hem Hem Hem –
Goe Goe Goe Goe Goe –
TDAc (% of clay fraction)
Kaob Ap 17.6 16.8 16.0 11.5 14.1 –
Gib 39.7 17.6 45.2 46.7 44.3 –
Kao Bo1 16.3 15.5 11.8 10.2 10.9 –
Gib 39.4 20.8 38.4 46.4 37.4 –
a The X-ray analyses was applied to samples from the Bo1 horizon.b Kao = Kaolinite, Gib = Gibbsite, Hem = Hematite, Goe = Goethite.c TDA = thermal differential analyses, results in percentage. The TDA was applied to samples from the Ap and Bo1 horizons.
J.C.M. Sa, R. Lal / Soil & Tillage Research 103 (2009) 46–5648
oats – corn. The data for NT treatments on fertilizers used, totaldry biomass (aboveground + root dry biomass), and percentageof dry biomass compared to total dry biomass for each crop werepresented in an earlier report (Sa et al., 2001).
2.3. Experimental design and sampling
The experimental design consisted of six treatments in a NTchronosequence in which duration of plowing and NT wereassigned as whole plots and the sampling depth as subplots. Thechronosequence treatments were: (i) NF; (ii) PNF-1; (iii) NT-10;(iv) NT-20; (v) NT-22; (vi) CT-22. The dimension of eachchronosequence treatment was 200 m � 50 m, with five internalreplicates representing a 40 m � 50 m area. Soil samples werecollected from four sites (NF, PNF-1, NT-10 and NT-20) in May1998 and from two sites (CT-22 and NT-22) in November 1998.Soil samples for each replicate were obtained by digging nine pitsof 20 cm � 50 cm � 50 cm. Soil samples were collected from fourdepths (0–5 cm, 5–10 cm, 10–20 cm and 20–40 cm), and acomposite sample from all replicates was obtained for eachdepth.
2.4. Sample preparation and chemical analyses
Soil samples were air-dried and ground to pass through a 2-mm sieve. A portion of each sample was ground again to passthrough 100 mesh sieve. Soil bulk density (rb) was measured bythe core method (Blake and Hartage, 1986) using a 5.0-cm
diameter and 5.0-cm deep core. Soil pH was measured using twoprocedures: (i) in 1:2.5 soil:water suspension; (ii) in 1N KCl(EMBRAPA, 1979). The potential acidity was determined by themethod of EMBRAPA (1979) and exchangeable Al3+, Ca2+, Mg2+,K+ and available P were extracted using an ion exchange resin(Raij and Quaggio, 1983). The CEC was measured in bufferedsolution at pH 7.0. For each site, the Bo1 horizon was sampled toidentify the clay material by X-ray diffraction technique(Jackson, 1966). The percentage of kaolinite and gibbsite weredetermined using the thermal differential analysis (Jackson,1966) in Ap and Bo1 horizons. Soil texture of different horizonsof all profiles was measured by the pipette method (Gee andBauder, 1986).
2.5. C, N and S contents in whole sample and C and N in the particulate
and stable pool
The C, N and S concentrations were determined by the loss onignition method (Nelson and Sommers, 1982) using a CNS analyzer(LECO1, St. Joseph, MO, USA) in the whole sample, and for theparticulate and stable C and N pools. A 40-g oven-dried subsamplesieved through a 2-mm sieve, from each treatment and each depth,was wetted overnight at 10 8C in 200 mL deionized H2O to separatethe particulate and stable pools. Aggregate disruption wasaccomplished by a rotary shaker at a frequency of 50 rpm withthree agate balls (10-mm diameter) for 4 h. Soil suspension waswet sieved through a 212-mm opening sieve to obtain the 212–2000 mm fraction. The fractions remaining on the sieve were

J.C.M. Sa, R. Lal / Soil & Tillage Research 103 (2009) 46–56 49
washed with deionized water, and the washing was added to thesuspension passed through a 212-mm sieve. The fraction remainedthat was between 53 and 212 mm in size represented theparticulate organic carbon (POC). Soil suspension was passedthrough 53 mm sieves to obtain the fraction that represented thestable C and N pools. Soil suspension in the 1-L glass cylinder wasflocculated with 0.77 g CaCl2.
2.6. Microbial biomass C and N, basal respiration, total and labile soil
polysaccharides, and dissolved organic carbon
For microbial C and N determinations, soil samples werestored at 5–7 8C pending analyses. Prior to analysis soil sampleswere sieved through a 2-mm sieve, adjusted to a 40% of waterholding capacity, and kept at room temperature for 2 days. Soilmicrobial biomass C (SMBC) and soil microbial biomass N (SMBN)concentrations were measured using the fumigation–extractionmethod of Vance et al. (1987) and Brookes et al. (1985) as thedifference in C and N released between fumigated and non-fumigated soils. Soil basal respiration (BR) rate was determined inthe laboratory by the incubation method for 10 days. A 30-gsamples of soil was placed in a 50-mL beaker and incubated in thedark at 25 8C in a 1-L air-tight sealed jar with 20 mL of 1N NaOH inanother 50 mL beaker. The CO2-C released after 10 days ofincubation was determined by titration with 0.5N HCl in a NaOHsolution saturated with BaCl2. The procedure to estimate totalpolysaccharides (TP) and labile polysaccharides (LP) in soil wasbased on release of saccharide monomers by hydrolysis withH2SO4, and followed by colorimetric estimation using the phenol-sulfuric acid reagent (Lowe, 1993). For determining totalpolysaccharides, a 0.5-g sample of soil was weighed into anErlenmeyer flask adding 4.0 mL of 12 M H2SO4 added tocompletely moisten soil by the acid. The hydrolysates werecooled and filtered through a glass fiber filter into a 250-mLErlenmeyer flask and the volume was made up with deionizedH2O. For the labile polysaccharide measurement the sameamount of soil was weighted into a 250-mL Erlenmeyer flask,100 mL of 0.5 M H2SO4 was added, and the mixture wasautoclaved at 1 h under the same conditions. The dissolvedorganic carbon (DOC) was measured in 25-mL aliquot of the claysuspension. The clay suspension was the last phase of the particlesize fractionation. The aliquot was passed through a glass fiberfilter (size pore = 0.45 mm) and total carbon (TC) was measured ina C analyzer (Shimadzu TOC 5000). Data calculations were based
Fig. 1. C, N and S distribution on soil profile. The bars refer the LSD0.05 by
on the amount of sample weighed for particle size fractionation(40 g of soil).
2.7. Stratification ratio calculations and statistical analyses
The SR of various parameters affected by SOM were calculatedby dividing the concentration determined for each SOM pool in 0–5 cm layer by those in 5–10 cm, 10–20 cm and 20–40 cm layers(Franzluebbers, 2002). The data were analyzed for the analysis ofvariance (ANOVA) was applied to the data and means werecompared using the Tukey test (LSD0.05), to characterize thedifference among treatments. Regression equations were com-puted to assess the temporal changes in SR of SOM parameters andthe rate and amount of SOC sequestered using the NF treatment asthe baseline. Regression equations were also used to assess thechanges in SR of different SOC biological parameters, using therates of particulate C and N pools as independent variables.Pearson correlation coefficients were used to assess the relation-ships among variables. Statistical significance among treatmentswere computed at P < 0.05 and P < 0.01, and P < 0.001 repre-sented by *, ** and ***, respectively. The rate of the temporalchanges in SOM pools were calculated by computing the slope ofthe regression line (dy/dx) for each depth (SAS Institute, 1990).Estimates of SR for the new steady state level were computed usinglogarithmic function based on the results reported earlier by Sa etal. (2001).
3. Results and discussion
3.1. Soil organic carbon, nitrogen and sulfur distribution, and the
effect of tillage chronosequence on the stratification ratio
The SOC, TN and TS concentrations decreased with soil depth,and had a differential distribution in the soil profile amongtreatments in the age chronosequence (Fig. 1). In undisturbed NFsoil a natural process of accumulation of SOC, N and S occurred atthe soil surface and increased SR with increase in soil depths (Table2). The process is driven by the input of litter on soil enhancing itsresilience (Prescott et al., 1995; Franzluebbers, 2002). The SR ofSOC differed significantly among depths, while those of TN and TSdiffered only when the comparison was made between the surfaceand lower depth ratios (i.e., 0–5:20–40 cm). Such a trend may beattributed to differences in the litter quality (i.e., type of organiccompounds as polyphenols, wax and lignin), and amount and
Tukey test to compare the means among treatments for each depth.

Table 2Stratification ratio for SOC, total N and total S in a Typic Hapludox (Dark Red Latosol) under a long-term no-tillage chronosequence (means of five replicatesa).
Variable Ratio depth (cm) Tillage systems
NF PNF NT-10 NT-20 NT-22 CT-22
SOC (0–5:5–10) 1.27 bb 1.07 b 1.67 a 1.64 a 1.76 a 1.12 b
(0–5:10–20) 1.48 c 1.23 c 2.14 a 1.87 ab 2.13 a 1.23 c
(0–5:20–40) 1.90 b 1.73 bc 2.49 a 2.26 a 2.61 a 1.51 c
LSD0.05c (Depth) 0.21 0.30 0.23 0.17 0.20 0.29
Total N (0–5:5–10) 1.32 c 1.12 c 1.80 b 1.82 b 1.97 a 1.22 c
(0–5:10–20) 1.55 b 1.25 b 2.71 a 2.40 a 2.77 a 1.48 b
(0–5:20–40) 2.06 b 1.69 bc 3.32 a 3.04 a 3.40 a 1.90 bc
LSD0.05 (Depth) 0.28 0.41 0.29 0.30 0.27 0.42
Total S (0–5:5–10) 1.40 b 0.53 c 1.11 b 1.99 a 2.20 a 1.33 b
(0–5:10–20) 1.59 b 0.61 c 1.50 b 2.43 a 3.63 a 1.79 b
(0–5:20–40) 2.06 b 1.02 d 1.58 c 2.49 b 4.43a 2.42 bc
LSD0.05 (Depth) 0.31 0.33 0.25 0.29 0.28 0.48
a Means of five replicates.b Means followed by the same lowercase letters do not differ by Tukey test at P < 0.05 for the comparison among treatments for each stratification ratio depth.c LSD of Tukey test at P < 0.05 for comparison of means among depths ratio within each treatment.
J.C.M. Sa, R. Lal / Soil & Tillage Research 103 (2009) 46–5650
diversity of root exudates (i.e., polysaccharides) compared with Nand S compounds (Walker et al., 2003; Broeckling et al., 2008). Thevalue of SR for surface and lower depths in NF were similar for SOC,TN and TS (Table 2), and were 1.27, 1.32, and 1.40 for surface layerratio (0–5:5–10 cm) compared with 1.90, 2.06 and 2.06 for surfaceto subsoil layer ratio (0–5:20–40 cm).
There was a different response of SR to conversion of naturalvegetation to cropland under PT and NT systems. The SR of SOC inthe CT-22 treatment was significantly lower (P < 0.05) than allNT treatments for all depths ratio (Table 2). However, the long-term PT management decreased the SR, and it was distributeduniformly up to 20 cm depth (Table 2). The SR for TS in thesurface to lower depth ratio (i.e., 0–5:20–40) was >2.0 anddiffered significantly among treatments. The intensive PTmanagement decreased the natural SR in CT-22 treatment,because of aggregate disruption and exposure of the SOM to themicrobial biomass process (Elliott, 1986; Frey et al., 1999).However, the impact of soil erosion was minimal on plots withslope < 1%. The SR for CT-22 treatment ranged from 1.12 forsurface (0–5:5–10 cm) to 1.51 for surface to lower depths (0–5:20–40 cm). These results are similar to those reported byothers (Franzluebbers, 2002; Dıaz-Zorita and Grove, 2002; Bryeet al., 2006), and indicate that PT management decreases the SRirrespective of the climate and soil type. The SR for both SOC andTN was uniformly distributed in PNF-1, and the incorporation offresh organic material over 18-months caused abrupt decline inSR of the TS. The data show that even 1 year of PT significantlyreduced the natural SR with maintenance of the trend with long-term PT management. These data are important to the landmanagers for developing local and regional strategies of adoptingNT farming because: (i) decline in soil quality commences soonafter conversion of natural vegetation to cropland ecosystems;(ii) the time required to restore degraded soils increases withincrease in the duration of PT management; (iii) managementstrategies must be identified for restoring SOC pool, improvingsoil quality and achieving agronomic and environmentalsustainability.
In contrast to PT management, the SR in long-term NT treatmentsfor SOC, TN and TS were significantly higher for all depths andincreased with increase in soil depth compared with NF, PNF-1 andCT-22. However, there were no significant differences among NTtreatments and 10 years of NT restored the SR even thoughthe cumulative and annual (in parenthesis) C input through
crop residues was 4.01 kg m�2 (e.g., 0.40 kg m�2 yr�1) forNT-10, 7.76 kg m�2 (e.g., 0.39 kg m�2 yr�1) for NT-20 and7.31 kg m�2 (0.33 kg m�2 yr�1) for NT-22. The average SR for NTtreatments ranged from 1.69 for 0–5:5–10 cm depth to 2.45 for 0–5:20–40 cm depth for SOC, and 1.86 for 0–5:5–10 cm to 3.4 for TN,and 1.11–4.43 for TS. Assuming a SR of 2.5 as a reference point for soilquality (Franzluebbers, 2002), these data represent differences of150% between the surface 0–5:5–10 cm and the 0–5:20–40 cm. Thecomparison of SR between surface and lower depths among NF, NT-22 and CT-22 (Fig. 2) show an increase in SR with increase in depthsfor NT-22 treatment, and it was more than that of the NF. Thecumulative total input of 7.31 kg C m�2 over 22 years in continuousNT restored SOC concentration above the level observed in the NFand increased its SR. The SR for SOC in NT treatment exceeded that ofNF by 38.5% in the 0–5:5–10 cm depth, 43.3% in the 0–5:10–20 cmdepth, and 37.6% in the 0–5:20–40 cm depth. The enrichment of TNand TS was even more than SOC: 49.0, 78.4, 65.0% for TN and 57.2,128.4 and 114.9% for TS in the respective SR depths, respectively. Thelong-term NT with continuous crop residues mulch leads to build upof a thick surface layer indicating the importance of SR as a goodindicator of C sequestration.
Regression equations to assess temporal changes with regardsto the duration of NT (X, axis) and the SR of SOC, TN, and TS (Y, axis),indicated a significant linear relationship (Fig. 3). The annual rateof change in SR of SOC, TN and TS increased from the surface tolower depth ratio (i.e., 0–5:5–10 cm, 0–5:10–20 cm; 0–5:20–40 cm SR) and was 1.8, 2.1 and 2.3% yr�1 for SOC, was 2.5, 4.3 and4.9% yr�1 for TN, and was 3.9, 7.9 and 8.3% yr�1 for TS, respectively.The highest increase was observed for TS, and NT management,and off-set the significant impact of PNF-1 through the conversionof natural vegetation to crop land. The continuous enrichmentindicates that these parameters are still aggrading and have not yetreached soil C saturation and the stratification may increase withtime. Sa et al. (2001) concluded that the SOC pool stabilization inthese sites may be attained in about 40 years after NT adoption.The present data show that over the same period (i.e., 40 years) thesame C input, and using the same methodology, the SR can increaseby 1.72 units for SOC in the 0–5:5–10 cm ratio depth, 2.09 units for0–5:10–20 cm ratio depth, and 2.50 units for 0–5:20–40 cm ratiodepth. These changes imply an enormous enhancement in the SOCconcentration with continuous use of NT, and the predicted SR mayincrease to 3.48, 4.22 and 5.11 for surface to lower ratio depths,respectively. The predicted values are more than those reported by

Fig. 2. Comparison of stratification ratio of SOC, TN, and TS among native field (NF),
no-tillage 22 years (NT-22) and conventional tillage 22 years (CT-22). The upper
case letters represents the comparisons by Tukey test (LSD0.05) between SR for 0–
5:5–10 cm and 0–5:20–40 cm ratio depth within each treatment and the lower case
letters represents the comparisons among tillage systems within each ratio depth.
Fig. 3. Regression analyses between temporal changes (X, axis as a age of NT) and
stratification ratio (Y, axis as a SOC, TN, and TS) for three ratio depths (0–5:5–10 cm;
0–5:10–20 cm; 0–5:20–40 cm).
J.C.M. Sa, R. Lal / Soil & Tillage Research 103 (2009) 46–56 51
other researchers (Franzluebbers, 2002; Dıaz-Zorita and Grove,2002; Brye et al., 2007). The enrichment of SR for TN and TS, evenmore than that of SOC, was 1.91, 2.73 and 3.36 units for SR of TN atthe surface to lower ratio depths. Similarly, the enrichment in SRfor TS was 2.95, 2.64 and 2.95 units at the surface to lower ratiodepths. The predicted SR in the new steady state level proposed bySa et al. (2001) for SOC, TN and TS for surface ratio depths would be3.68, 4.68 and 5.07 for 0–5:5–10 cm compared with 5.45, 5.12 and5.26 for 0–5:20–40 cm depth, respectively.
3.2. Particulate organic C and N and stable C and N affected by tillage
chronosequence
The C and N concentrations in the POC and the stable poolresponded differently (Table 3) among the tillage chronose-quence. In the undisturbed soil (NF treatment), the SR increasedwith increase in soil depth (Table 3). The average SR for POC andparticulate nitrogen (PN) was greater than that for stable C (SC)and stable nitrogen (SN). These trends indicate that a naturalprocess is governed by soil resiliency, and creates a C and N fluxinto the stable pool by long-term input of biomass on the soilsurface (Prescott et al., 1995). Released organic compounds bythe decomposition process, enrich POC and PN fractions, and
increase flux into the stable C and N pools. Lorenz et al. (2007)observed that the breakdown of organic bio(macro)molecules isa process moderated by the residence time of each group oforganic compounds with specific functions in the entiretransformation process. The SR of POC and PN in NF weresignificantly higher than that in PNF-1 and CT-22 indicating thatthe disturbance caused by PT management in these fractions is afirst step towards decline in soil quality. Exposure and looseningof soil surface by tillage exacerbate soils susceptibility to erosionand increase the losses of C by disruption of aggregates, therebyprolonging the time required to restoration. Decline in POC andPN reduces SC and SN accentuating the emission of C to theatmosphere by decomposition and reducing C storage as a stablepool (Chatskikh and Olesen, 2007). In contrast to NF, CT-22treatment caused a uniform distribution of SR with depthindicating significant differences in SR between the surface andsub-soil. A similar trend was observed in the PNF-1 treatmentand explains changes in the total SOM pool among tillagechronosequence treatments.
In contrast, the response of the NT-10, NT-20 and NT-22treatments differed than those of CT-22, PNF-1 and NF treatments(Table 3). There was a significant increase in POC, PN, SC and SN inthe SR depths. The highest SR for PN and SN is an important

Table 3Concentration and stratification ratio for particulate organic carbon (POC), particulate nitrogen (PN), stable C (SC) and stable N (SN) in a Typic Hapludox (Dark Red Latosol)
under a long-term no-tillage chronosequence.
SOM pool Depth Sampled (cm) Tillage Systems
NFa PNF-1 NT-10 NT-20 NT-22 CT-22
Concentration
POC (g kg�1) 0–5 27.3 cb 36.7 a 23.3 c 32.8 b 41.8 a 28.3 c
5–10 20.9 b 37.6 a 13.1 c 16.8 c 24.5 b 26.4 ab
10–20 18.2 b 31.2 a 10.0 c 14.7 c 20.9 b 25.6 b
20–40 15.0 bc 25.4 a 9.3 c 13.2 bc 18.1 b 20.9 b
LSD (P < 0.05)c Depth 3.2 4.1 3.8 3.1 3.7 3.9
Stable C (g kg�1) 0–5 41.8 b 35.9 c 41.6 b 46.1 b 58.3 a 43.8 b
5–10 35.8 b 34.5 b 31.4 b 34.9 b 42.7 a 43.0 a
10–20 30.1 b 31.0 b 26.7 c 31.2 b 36.0 a 36.9 a
20–40 22.6 b 25.1 b 20.6 b 24.9 b 30.6 a 35.2 a
LSD (P < 0.05) Depth 4.0 3.4 3.7 3.9 3.5 4.1
PN (g kg�1) 0–5 1.55 c 2.20 b 1.60 c 2.20 b 3.05 a 1.85 c
5–10 1.10 c 2.20 a 0.90 c 1.10 c 1.60 b 1.60 b
10–20 0.90 c 1.80 a 0.60 c 0.80 c 1.10 b 1.30 b
20–40 0.70 b 1.40 a 0.50 c 0.70 b 0.90 b 1.00 b
LSD (P < 0.05) Depth 0.31 0.34 0.29 0.30 0.33 0.42
SN (g kg�1) 0–5 2.48 c 2.20 d 3.10 b 3.07 b 4.35 a 2.87 c
5–10 1.97 bc 2.17 b 2.17 b 2.23 b 2.70 a 2.73 a
10–20 1.60 a 1.90 a 1.60 a 1.77 a 1.90 a 2.07 a
20–40 1.20 b 1.53 a 1.17 b 1.37 b 1.70 a 2.07 a
LSD (P < 0.05) Depth 0.31 0.34 0.30 0.34 0.33 0.40
Stratification ratio
POC (0–5:5–10) 1.30 b 0.97 b 1.77 a 1.95 a 1.71 a 1.07 b
(0–5:10–20) 1.50 b 1.17 c 2.33 a 2.23 a 2.00 a 1.18 c
(0–5:20–40) 1.82 b 1.44 c 2.50 a 2.48 a 2.31 a 1.45 c
LSD (P < 0.05) Ratio depth 0.29 0.32 0.27 0.26 0.28 0.30
Stable C (0–5:5–10) 1.17 ab 1.04 b 1.33 a 1.32 a 1.36 a 1.02 b
(0–5:10–20) 1.39 b 1.16 c 1.56 a 1.48 a 1.62 a 1.19 c
(0–5:20–40) 1.85 a 1.43 b 2.02 a 1.85 a 1.90 a 1.24 b
LSD (P < 0.05) Ratio depth 0.23 0.24 0.21 0.20 0.22 0.25
PN (0–5:5–10) 1.41 b 1.00 c 1.78 a 2.00 a 1.91 a 1.16 c
(0–5:10–20) 1.72 b 1.22 c 2.67 a 2.75 a 2.77 a 1.42 c
(0–5:20–40) 2.21 b 1.57 c 3.20 a 3.14 a 3.39 a 1.85 b
LSD (P < 0.05) Ratio depth 0.30 0.32 0.34 0.33 0.35 0.34
Stable N (0–5:5–10) 1.26 b 1.02 c 1.43 a 1.37 b 1.61 a 1.05 c
(0–5:10–20) 1.55 b 1.16 c 1.94 a 1.74 b 2.29 a 1.39 bc
(0–5:20–40) 2.07 b 1.43 c 2.66 a 2.24 a 2.56 a 1.39 c
LSD (P < 0.05) Ratio depth 0.29 0.32 0.34 0.31 0.30 0.33
a Means of five replicates.b Means followed by the same lowercase letters do not differ by Tukey test at P < 0.05 for the comparison among treatments for each stratification ratio depth.c LSD of Tukey test at P < 0.05 for comparison of means among depths ratio within each treatment.
J.C.M. Sa, R. Lal / Soil & Tillage Research 103 (2009) 46–5652
indication of C sequestration because N influences C stabilizationwithin the SOM pool (Moran et al., 2005). The increase in SR of POCand PN is one of the explanations of improvement in quality ofsurface soil and subsequent translocation to lower depths. Thecontinuous replacement of crop residues on the soil surface createsa favorable environment for cycling of C and formation ofmacroaggregates. Further, POC and PN act as cementing agentsto stabilize macroaggregates, and in intraggregate C protection asPOM (Six et al., 2002; Denef et al., 2004). Increase in soil biologicalactivity increases the availability of temporary binding agents(Franzluebbers, 2002; Abiven et al., 2007) that encapsulate Cwithin the newly formed and stable aggregates (Six et al., 2006).The NT soil is protected by a mulch cover throughout the yearcreating ideal conditions for continuous flux of C and N into thesoil, and to sequester C.
Comparisons among contrasting treatments (NF, CT-22 and NT-22) indicate the ability of long-term NT to restore SR, increasethickness of the surface layer, and improve soil quality (Fig. 4). Thequantity and quality of crop residues added to soil surfaceinfluences the turnover time and the stability of the SOM (Paustianet al., 1997; Kong et al., 2005; Razabimbelo et al., 2008).
Increase in SR in the NT treatments for POC from 0–5:5–10 cmto 0–5:20–40 cm ratio depths were 47.1% for NT-10, 27.2% for NT-20 and 35.1% for NT-22. Increase in SR for PN was more than thatfor POC and was 79.8, 57.0 and 77.5%, respectively. Considering thenew steady state values estimated by Sa et al. (2001), there was adrastic increase in values of POC, PN, SC and SN (Table 4). Such anincrease is attributed to the continuous C input and a permanentsoil cover throughout the year. The estimated average of SR in NTtreatments for POC and PN in 0–5:5–10 cm, 0–5:10–20 cm and

Fig. 4. Comparison of stratification ratio of particulate organic carbon (POC), particulate nitrogen (PN), stable carbon (SC) and stable nitrogen (SN) among native field (NF), no-
tillage 22 years (NT-22) and conventional tillage 22 years (CT-22). The upper case letters represents the comparisons by Tukey test (LSD0.05) between SR for 0–5:5–10 cm and
0–5:20–40 cm ratio depth within each treatment and the lower case letters represents the comparisons among tillage systems within each ratio depth.
J.C.M. Sa, R. Lal / Soil & Tillage Research 103 (2009) 46–56 53
0–5:20–40 cm ratio depth was greater than those reported byFranzluebbers (2002) and Dıaz-Zorita and Grove (2002).
3.3. Stratification ratio of biological and labile pools affected by tillage
chronosequence
The concentrations of biological and labile SOM pool respondeddifferently among the tillage chronosequence (Table 5). Theundisturbed soil in NF increased SR of SOM and labile pools andenhanced soil quality (Table 6). Comparing SR in NF with thecontrasting treatments (NT-22 and CT-22) for the surface to lower
Table 4Estimation of stratification ratio of particulate organic carbon (POC), particulate
nitrogen (PN), stable carbon (SC) and stable nitrogen (SN) in the new steady state
(40 years after adoption of NT) according Sa et al. (2001) using a logarithmic model.
Balance Ratio depth (cm) Stratification ratio
POC PN SC SN
Estimated valuesa (0–5:5–10) 1.87 2.95 1.69 2.02
(0–5:10–20) 2.25 4.73 3.18 3.10
(0–5:20–40) 2.50 5.35 3.42 3.14
Estimated values
+ values of Table 3b
(0–5:5–10) 3.68 5.45 3.03 3.49
(0–5:10–20) 4.68 5.12 4.73 5.09
(0–5:20–40) 5.07 5.26 5.34 5.63
a Values estimated by logarithmic model represents the 18 years after the 22
years in the presented in the chronosequence to reach the new steady after 40 years.b Sum of estimated values by logarithmic model (18 years) and the average of
values of SR for no-tillage treatments (NT-10, NT-22 and NT-22) presented in
Table 3.
depths indicates significant differences in MBC and MBN, BR, DOCand TP and LP, respectively (Table 6). In contrast, the CT-22treatment in the first 20 cm layer was homogeneous and differedsignificantly among the surface to lower layer ratio only in the BR.The continuous PT (twice per year) mixes crop residues, increasesdecomposition, and reduces the SR with increase in soil depth.Thus, PT management also decreases the labile SOC pool, reducesthe principal energy source for MBC and MBN, and decreases C andN fluxes into the macroaggregation (Simpson et al., 2004). Thistrend makes soil susceptible to erosion by interruption of the C andN fluxes into the stable C pools (Conant et al., 2007).
The NT-22 management had a contrasting response comparedwith CT-22 for MBC, MBN, BR, TP and LP (Table 6). The continuousinput of crop residues on the soil surface provided a favorableenvironment to increase biological activity and stimulate themacroaggregation. The bio-products released by decompositionand by root exudation processes enhance aggregation of clay andsilt particles and the temporary binding agents (i.e., fungal hyphae)increase macroaggregation. The enhancement of the SR in the NTtreatments was 26.9% for MBC, 58.9% for MBN and 179.9% for BR inthe 0–5:5–10 cm compared to 0–5:20–40 cm ratio depths,respectively. There existed a significant positive correlationbetween SOC pool (0–10 cm layer) and the SR (0–5:5–10 cm) ofBR (r = 0.76**), MBN (r = 0.66**), TP (r = 0.85***) and LP (r = 0.86***)indicating that the SOC pool is closely associated with the SR of thebiological pools and a significant part of C released from cropresidues is being transformed into the SOC pool (Sa et al., 2001; Sixet al., 2002, 2006). However, the crop rotation in this experimentalternates legume (i.e., soybean) and cereals (i.e., corn, black oatand wheat) with crop residues of different C:N ratio for increasing

Table 5Stratification ratio of SOM biological pools (microbial biomass carbon: MBC; microbial biomas nitrogen: MBN; basal respiration: BR; dissolved organic carbon, DOC; total
polysaccharides: TP; labile polysaccharides: LP) in a Typic Hapludox (Dark Red Latosol) under a long-term no-tillage chronosequence.
SOM pools Ratio depth (cm) Tillage systems
NFa PNF-1 NT-10 NT-20 NT-22 CT-22
MBC (0–5:5–10) 1.52 ab 1.35 b 1.44 b 1.40 b 1.53 a 1.39 b
(0–5:10–20) 1.83 a 1.91 a 1.33 b 1.48 b 1.83 a 1.42 b
(0–5:20–40) 2.41 a 2.68 a 1.59 b 1.80 ab 2.16 a 1.54 b
LSD (P < 0.05)c Ratio depth 0.30 0.35 0.27 0.29 0.30 0.32
MBN (0–5:5–10) 1.60 b 1.07 c 1.40 b 1.82 a 1.96 a 1.45 b
(0–5:10–20) 1.85 a 1.04 c 1.62 b 2.16 a 2.58 a 1.61 b
(0–5:20–40) 2.78 b 2.04 b 2.18 b 2.82 b 3.24 a 1.64 c
LSD (P < 0.05) Ratio depth 0.32 0.30 0.29 0.31 0.33 0.34
BR (0–5:5–10) 2.47 a 1.29 c 2.32 a 2.32 a 2.31 a 1.70 b
(0–5:10–20) 3.30 b 2.55 c 4.31 a 4.31 a 4.36 a 2.34 c
(0–5:20–40) 3.88 c 3.33 c 5.95 b 5.95 b 7.52 a 3.58 c
LSD (P < 0.05) Ratio depth 0.49 0.48 0.45 0.48 0.49 0.53
DOC (0–5:5–10) 1.26 a 1.57 a 1.05 b 1.13 b 1.10 b 0.99 b
(0–5:10–20) 1.64 b 2.35 a 1.09 c 1.21c 1.12 c 1.11 c
(0–5:20–40) 2.02 b 3.44 a 1.31 c 1.39 c 1.26 c 1.34 c
LSD (P < 0.05) Ratio depth 0.31 0.43 0.29 0.28 0.30 0.39
TP (0–5:5–10) 1.10 b 1.00 b 1.22 ab 1.33 a 1.41 a 1.07 b
(0–5:10–20) 1.14 b 1.04 b 1.21 ab 1.38 a 1.45 a 1.10 b
(0–5:20–40) 1.32 a 1.10 b 1.26 ab 1.42 a 1.45 a 1.08 b
LSD (P < 0.05) Ratio depth 0.16 0.10 0.13 0.09 0.18 0.19
LP (0–5:5–10) 1.11 b 1.02 b 1.23 ab 1.35 a 1.42 a 1.08 b
(0–5:10–20) 1.21 ab 1.04 b 1.23 ab 1.36 a 1.45 a 1.09 b
(0–5:20–40) 1.34 a 1.14 b 1.21 ab 1.38 a 1.49 a 1.10 b
LSD (P < 0.05) Ratio depth 0.12 0.13 0.11 0.09 0.08 0.10
a Means of five replicates.b Means followed by the same lowercase letters do not differ by Tukey test at P < 0.05 for the comparison among treatments for each stratification ratio.c LSD of Tukey test at P < 0.05 for comparison of means among depths ratio within each treatment.
J.C.M. Sa, R. Lal / Soil & Tillage Research 103 (2009) 46–5654
N cycling and enhancing soil C sequestration. The significant andhigh correlation with TP and LP is in accord with the publishedreports explaining the role of polysaccharides as a binding agent. Inlong-term NT, the TP and LP are a source of energy for the entiremicrobiota. Being organic, these compounds bind dispersed clayand clay-silt particles into microaggregates (90–250 mm) andmacroaggregates (Tisdall and Oades, 1982; Golchin et al., 1994;Feller et al., 1996; Six et al., 2002, 2006). The biological activityrepresented by SR of BR in the NT-22 was almost twice comparedwith that of NF and CT-22 and rendered the soil surface layer as acontinuous source of bio(macro)molecules to form a bridgebetween the labile SOC and N pools to stable C and N pools. TheSR of MBC, MBN and BR for 0–5:5–10 cm compared to 0–5:20–40 cm ratio depths enhanced by 41, 65 and 226%, respectively.
3.4. SOM pools stratification ratio and C sequestration in a tillage
chronosequence
The SR of the SOM pools in long-term NT treatments had asignificant effect on the SOC sequestered. The SR for SOC alsoenhanced the rate and the amount of SOC sequestered. Thecomparative amount of SOC sequestered in the 0–10 cm layer (i.e.,SOC pool in 0–10 cm layer for each NT treatment—SOC pool for CT-22) was 4.82 Mg ha�1in NT-10, and 12.38 Mg ha�1 in NT-20 and15.77 Mg ha�1 in NT-22. The corresponding sequestration rates(i.e., SOC sequestered divided by years of NT in each treatment)were 0.48, 0.62 and 0.72 Mg ha�1 yr�1, respectively (i.e., average offive replicates). The SR of SOC for 0–5:5–10 cm was significantlycorrelated with the amount of SOC sequestered in 0–10 cm depth
[Y(SOC sequestered, Mg ha�1) = 19.03(Stratification ratio) � 23.9,R2 = 0.70**]. There was also a significant positive correlationbetween SR of SOC for 0–5:5–10 cm layer ratio and sequestrationrates in 0–10 cm depth [Y(SOC sequestration rates,Mg ha�1) = 1.16(Stratification ratio) + 1.31, R2 = 0.92***]. Thesepositive correlations show that SR for SOC is an importantindicator of soil C sequestration. That being the case, there mustalso be a close relationship between SOC sequestered and thebiological and labile pools. Significant positive linear regressionsamong SR of the biological and labile pools (e.g., BR, MBC, MBN,DOC, TP and LP) for 0–5:5–10 cm and SOC sequestration rates for0–10 cm layer (Table 7) indicate the significance of SR as a tool toestimate the rate and amount of C sequestration. The highcorrelation between BR and C sequestration rates indicates that asignificant fraction of the C added in the crop residues is beingconverted into the SOC pool. Also, a significant relationship amongMBC and MBN with SOC sequestration rates indicates that the NTsystem is a sink for C and N. A continuous soil cover createsfavorable conditions for the maintenance of biological activity to acontinuous flow of C and N into the macroaggregation whilestabilizing the C pool. The strong gradient between the surfacelayer and the sub-soil layer in biological activity leads to transfer ofC into the SOC pool.
Preservation of biological C and N pools leads to production oftransient agents which promote aggregation and increase Csequestration. The close relationship between C sequestration ratesand the SR of TP and LB is indicative of the functioning of the systembecause these organic compounds act as binding agents cementingsoil particles and increasing stable aggregation (Six et al., 2006).
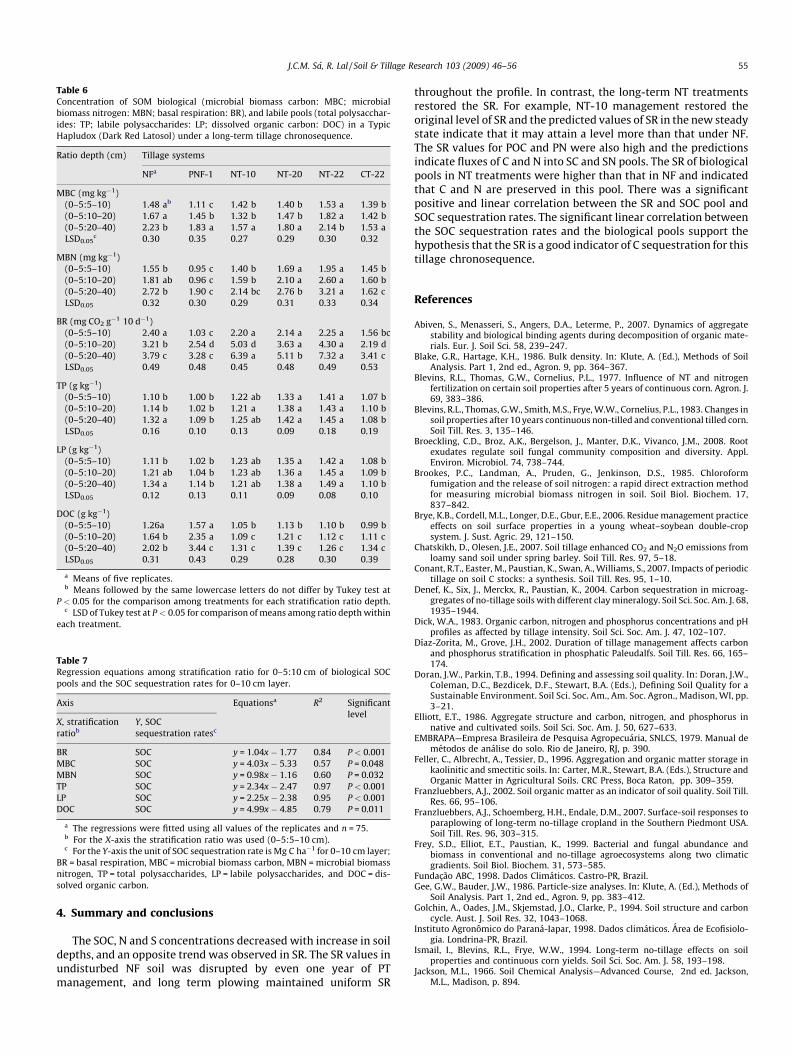
Table 7Regression equations among stratification ratio for 0–5:10 cm of biological SOC
pools and the SOC sequestration rates for 0–10 cm layer.
Axis Equationsa R2 Significant
levelX, stratification
ratiob
Y, SOC
sequestration ratesc
BR SOC y = 1.04x � 1.77 0.84 P < 0.001
MBC SOC y = 4.03x � 5.33 0.57 P = 0.048
MBN SOC y = 0.98x � 1.16 0.60 P = 0.032
TP SOC y = 2.34x � 2.47 0.97 P < 0.001
LP SOC y = 2.25x � 2.38 0.95 P < 0.001
DOC SOC y = 4.99x � 4.85 0.79 P = 0.011
a The regressions were fitted using all values of the replicates and n = 75.b For the X-axis the stratification ratio was used (0–5:5–10 cm).c For the Y-axis the unit of SOC sequestration rate is Mg C ha�1 for 0–10 cm layer;
BR = basal respiration, MBC = microbial biomass carbon, MBN = microbial biomass
nitrogen, TP = total polysaccharides, LP = labile polysaccharides, and DOC = dis-
solved organic carbon.
Table 6Concentration of SOM biological (microbial biomass carbon: MBC; microbial
biomass nitrogen: MBN; basal respiration: BR), and labile pools (total polysacchar-
ides: TP; labile polysaccharides: LP; dissolved organic carbon: DOC) in a Typic
Hapludox (Dark Red Latosol) under a long-term tillage chronosequence.
Ratio depth (cm) Tillage systems
NFa PNF-1 NT-10 NT-20 NT-22 CT-22
MBC (mg kg�1)
(0–5:5–10) 1.48 ab 1.11 c 1.42 b 1.40 b 1.53 a 1.39 b
(0–5:10–20) 1.67 a 1.45 b 1.32 b 1.47 b 1.82 a 1.42 b
(0–5:20–40) 2.23 b 1.83 a 1.57 a 1.80 a 2.14 b 1.53 a
LSD0.05c 0.30 0.35 0.27 0.29 0.30 0.32
MBN (mg kg�1)
(0–5:5–10) 1.55 b 0.95 c 1.40 b 1.69 a 1.95 a 1.45 b
(0–5:10–20) 1.81 ab 0.96 c 1.59 b 2.10 a 2.60 a 1.60 b
(0–5:20–40) 2.72 b 1.90 c 2.14 bc 2.76 b 3.21 a 1.62 c
LSD0.05 0.32 0.30 0.29 0.31 0.33 0.34
BR (mg CO2 g�1 10 d�1)
(0–5:5–10) 2.40 a 1.03 c 2.20 a 2.14 a 2.25 a 1.56 bc
(0–5:10–20) 3.21 b 2.54 d 5.03 d 3.63 a 4.30 a 2.19 d
(0–5:20–40) 3.79 c 3.28 c 6.39 a 5.11 b 7.32 a 3.41 c
LSD0.05 0.49 0.48 0.45 0.48 0.49 0.53
TP (g kg�1)
(0–5:5–10) 1.10 b 1.00 b 1.22 ab 1.33 a 1.41 a 1.07 b
(0–5:10–20) 1.14 b 1.02 b 1.21 a 1.38 a 1.43 a 1.10 b
(0–5:20–40) 1.32 a 1.09 b 1.25 ab 1.42 a 1.45 a 1.08 b
LSD0.05 0.16 0.10 0.13 0.09 0.18 0.19
LP (g kg�1)
(0–5:5–10) 1.11 b 1.02 b 1.23 ab 1.35 a 1.42 a 1.08 b
(0–5:10–20) 1.21 ab 1.04 b 1.23 ab 1.36 a 1.45 a 1.09 b
(0–5:20–40) 1.34 a 1.14 b 1.21 ab 1.38 a 1.49 a 1.10 b
LSD0.05 0.12 0.13 0.11 0.09 0.08 0.10
DOC (g kg�1)
(0–5:5–10) 1.26a 1.57 a 1.05 b 1.13 b 1.10 b 0.99 b
(0–5:10–20) 1.64 b 2.35 a 1.09 c 1.21 c 1.12 c 1.11 c
(0–5:20–40) 2.02 b 3.44 c 1.31 c 1.39 c 1.26 c 1.34 c
LSD0.05 0.31 0.43 0.29 0.28 0.30 0.39
a Means of five replicates.b Means followed by the same lowercase letters do not differ by Tukey test at
P < 0.05 for the comparison among treatments for each stratification ratio depth.c LSD of Tukey test at P < 0.05 for comparison of means among ratio depth within
each treatment.
J.C.M. Sa, R. Lal / Soil & Tillage Research 103 (2009) 46–56 55
4. Summary and conclusions
The SOC, N and S concentrations decreased with increase in soildepths, and an opposite trend was observed in SR. The SR values inundisturbed NF soil was disrupted by even one year of PTmanagement, and long term plowing maintained uniform SR
throughout the profile. In contrast, the long-term NT treatmentsrestored the SR. For example, NT-10 management restored theoriginal level of SR and the predicted values of SR in the new steadystate indicate that it may attain a level more than that under NF.The SR values for POC and PN were also high and the predictionsindicate fluxes of C and N into SC and SN pools. The SR of biologicalpools in NT treatments were higher than that in NF and indicatedthat C and N are preserved in this pool. There was a significantpositive and linear correlation between the SR and SOC pool andSOC sequestration rates. The significant linear correlation betweenthe SOC sequestration rates and the biological pools support thehypothesis that the SR is a good indicator of C sequestration for thistillage chronosequence.
References
Abiven, S., Menasseri, S., Angers, D.A., Leterme, P., 2007. Dynamics of aggregatestability and biological binding agents during decomposition of organic mate-rials. Eur. J. Soil Sci. 58, 239–247.
Blake, G.R., Hartage, K.H., 1986. Bulk density. In: Klute, A. (Ed.), Methods of SoilAnalysis. Part 1, 2nd ed., Agron. 9, pp. 364–367.
Blevins, R.L., Thomas, G.W., Cornelius, P.L., 1977. Influence of NT and nitrogenfertilization on certain soil properties after 5 years of continuous corn. Agron. J.69, 383–386.
Blevins, R.L., Thomas, G.W., Smith, M.S., Frye, W.W., Cornelius, P.L., 1983. Changes insoil properties after 10 years continuous non-tilled and conventional tilled corn.Soil Till. Res. 3, 135–146.
Broeckling, C.D., Broz, A.K., Bergelson, J., Manter, D.K., Vivanco, J.M., 2008. Rootexudates regulate soil fungal community composition and diversity. Appl.Environ. Microbiol. 74, 738–744.
Brookes, P.C., Landman, A., Pruden, G., Jenkinson, D.S., 1985. Chloroformfumigation and the release of soil nitrogen: a rapid direct extraction methodfor measuring microbial biomass nitrogen in soil. Soil Biol. Biochem. 17,837–842.
Brye, K.B., Cordell, M.L., Longer, D.E., Gbur, E.E., 2006. Residue management practiceeffects on soil surface properties in a young wheat–soybean double-cropsystem. J. Sust. Agric. 29, 121–150.
Chatskikh, D., Olesen, J.E., 2007. Soil tillage enhanced CO2 and N2O emissions fromloamy sand soil under spring barley. Soil Till. Res. 97, 5–18.
Conant, R.T., Easter, M., Paustian, K., Swan, A., Williams, S., 2007. Impacts of periodictillage on soil C stocks: a synthesis. Soil Till. Res. 95, 1–10.
Denef, K., Six, J., Merckx, R., Paustian, K., 2004. Carbon sequestration in microag-gregates of no-tillage soils with different clay mineralogy. Soil Sci. Soc. Am. J. 68,1935–1944.
Dick, W.A., 1983. Organic carbon, nitrogen and phosphorus concentrations and pHprofiles as affected by tillage intensity. Soil Sci. Soc. Am. J. 47, 102–107.
Dıaz-Zorita, M., Grove, J.H., 2002. Duration of tillage management affects carbonand phosphorus stratification in phosphatic Paleudalfs. Soil Till. Res. 66, 165–174.
Doran, J.W., Parkin, T.B., 1994. Defining and assessing soil quality. In: Doran, J.W.,Coleman, D.C., Bezdicek, D.F., Stewart, B.A. (Eds.), Defining Soil Quality for aSustainable Environment. Soil Sci. Soc. Am., Am. Soc. Agron., Madison, WI, pp.3–21.
Elliott, E.T., 1986. Aggregate structure and carbon, nitrogen, and phosphorus innative and cultivated soils. Soil Sci. Soc. Am. J. 50, 627–633.
EMBRAPA—Empresa Brasileira de Pesquisa Agropecuaria, SNLCS, 1979. Manual demetodos de analise do solo. Rio de Janeiro, RJ, p. 390.
Feller, C., Albrecht, A., Tessier, D., 1996. Aggregation and organic matter storage inkaolinitic and smectitic soils. In: Carter, M.R., Stewart, B.A. (Eds.), Structure andOrganic Matter in Agricultural Soils. CRC Press, Boca Raton, pp. 309–359.
Franzluebbers, A.J., 2002. Soil organic matter as an indicator of soil quality. Soil Till.Res. 66, 95–106.
Franzluebbers, A.J., Schoemberg, H.H., Endale, D.M., 2007. Surface-soil responses toparaplowing of long-term no-tillage cropland in the Southern Piedmont USA.Soil Till. Res. 96, 303–315.
Frey, S.D., Elliot, E.T., Paustian, K., 1999. Bacterial and fungal abundance andbiomass in conventional and no-tillage agroecosystems along two climaticgradients. Soil Biol. Biochem. 31, 573–585.
Fundacao ABC, 1998. Dados Climaticos. Castro-PR, Brazil.Gee, G.W., Bauder, J.W., 1986. Particle-size analyses. In: Klute, A. (Ed.), Methods of
Soil Analysis. Part 1, 2nd ed., Agron. 9, pp. 383–412.Golchin, A., Oades, J.M., Skjemstad, J.O., Clarke, P., 1994. Soil structure and carbon
cycle. Aust. J. Soil Res. 32, 1043–1068.Instituto Agronomico do Parana-Iapar, 1998. Dados climaticos. Area de Ecofisiolo-
gia. Londrina-PR, Brazil.Ismail, I., Blevins, R.L., Frye, W.W., 1994. Long-term no-tillage effects on soil
properties and continuous corn yields. Soil Sci. Soc. Am. J. 58, 193–198.Jackson, M.L., 1966. Soil Chemical Analysis—Advanced Course, 2nd ed. Jackson,
M.L., Madison, p. 894.

J.C.M. Sa, R. Lal / Soil & Tillage Research 103 (2009) 46–5656
Kong, A.Y.Y., Six, J., Bryant, D.C., Denison, R.F., van Kessel, C., 2005. The relationshipbetween carbon input, aggregation, and soil organic carbon stabilization insustainable cropping systems. Soil Sci. Soc. Am. J. 69, 1078–1085.
Lal, R., 1997. Long-term tillage and monoculture effects on a tropical Alfisol inWestern Nigeria. II. Soil chemical properties. Soil Till. Res. 42, 161–174.
Lorenz, K., Lal, R., Preston, C.M., Nierop, K.G.J., 2007. Strengthening the soil organiccarbon pool by increasing contributions from recalcitrant aliphatic bio(macro)-molecules. Geoderma 142, 1–10.
Lowe, L.E., 1993. Total and labile polysaccharide analysis of soils. In: Carter, M.R.(Ed.), Soil Sampling and Methods Analysis. CRC Press, Lewis Publ., Boca Raton,pp. 73–376.
Maack, R., 1981. Classificacao do clima do Estado do Parana. In: Livraria Jose OlımpioEditora S.A., Geografia Fısica do Parana, 2nd ed., Rio de Janeiro, pp. 175–189.
Moran, K.K., Six, J., Horwath, W.R., van Kessel, C., 2005. Role of mineral-nitrogen inresidue decomposition and stable soil organic matter formation. Soil Sci. Soc.Am. J. 69, 1730–1736.
Moreno, F., Murillo, J.M., Pelegrın, F., Giron, I.F., 2006. Long-term impact of con-servation tillage on stratification ratio of soil organic carbon and loss of total andactive CaCO3. Soil Till. Res. 85, 86–93.
Nelson, D.W., Sommers, L.E., 1982. Total carbon, organic carbon and organic matter.In: Page, A.L., Miller, R.H., Keeney, D.R. (Eds.), Methods of Soil Analysis. Part 2.Chemical and Microbiological Properties, Agron. 9, pp. 539–579.
NRCS—Natural Resources Conservation Service, 2008. Soil quality concept. http://www.soils.usda.gov/sqi/concepts/concepts.html.
Paustian, K., Collins, H.P., Paul, E.A., 1997. Management controls on soil carbon. In:Paul, E.A. (Ed.), Soil Organic Matter in Temperate Agroecosystems: Long-termExperiments in North America. CRC Press, Boca Raton, FL, pp. 15–49.
Prescott, C.E., Weetman, G.F., DeMontigny, L.E., Preston, C.M., Keenan, R.J., 1995.Carbon chemistry and nutrient supply in cedar–hemlock and hemlock–amabilis fir forest floors. In: McFee, W.W., Kelley, J.M. (Eds.), Carbon Formsand Functions in Forest Soils. Soil Sci. Soc. Am., Madison, WI, pp. 377–396.
Raij, B.v., Quaggio J.A., 1983. Metodos de analises de solo para fins de fertilidade,Campinas, Instituto Agronomico, p. 31.
Rasmussen, P.E., Parton, W.J., 1994. Long-term effects of residue management inwheat-fallow. I. Inputs, yield, and soil organic matter. Soil Sci. Soc. Am. J. 58,523–530.
Razabimbelo, T.M., Albrecht, A., Oliver, R., Chevalier, T., Chapuis-Lardy, L., Feller, C.,2008. Aggregate associated-C and physical protection in a tropical clayey soilunder Malagasy conventional and no-tillage systems. Soil Till. Res. 98, 140–149.
Sa, J.C.M., 1999. Manejo da fertilidade do solo no sistema plantio direto. In: Siqueira,J.O., Moreira, F.M.S., Lopes, A.S., Guilherme, L.R.G., Faquin, V., Furtini Neto, A.E.,Carvalho, J.G. (Eds.), Soil Fertility, Soil Biology, and Plant Nutrition Interrelation-ships. Soc. Bras. Ci. Solo. UFLA, Lavras, MG, Brazil, pp. 267–320.
Sa, J.C.M., Cerri, C.C., Dick, W.A., Lal, R., Vesnke-Filho, S.P., Piccolo, M.C., Feigl, B.E.,2001. Organic matter dynamics and carbon sequestration rates for a tillagechronosequence in a Brazilian Oxisol. Soil Sci. Soc. Am. J. 65, 1486–1499.
SAS Institute, 1990. SAS/STAT User’s Guide. Statistics. Version 6, 4th ed. SASInstitute, Cary, NC.
Simpson, R.T., Frey, S.D., Six, J., Thiet, R.K., 2004. Preferential accumulation ofmicrobial carbon in aggregate structures of no-tillage soils. Soil Sci. Soc. Am.J. 68, 1249–1255.
Six, J., Feller, C., Denef, K., Ogle, S.M., Sa, J.C.M., Albrecht, A., 2002. Soil organicmatter, biota and aggregation in temperate and tropical soils—effects of no-tillage. Agronomie 22, 755–775.
Six, J., Frey, S.D., Thiet, R.K., Batten, K.M., 2006. Bacterial and fungal contribuitions tocarbon sequestration in agroecosystems. Soil Sci. Soc. Am. J. 70, 555–569.
Tisdall, J.M., Oades, J.M., 1982. Organic matter and water-stable aggregates in soils.J. Soil Sci. 33, 141–163.
Vance, E.D., Brookes, P.C., Jenkinson, D.S., 1987. An extraction method for measuringsoil microbial biomass-C. Soil Biol. Biochem. 19, 703–707.
Walker, T.S., Bais, H.P., Grotewold, E., Vivanco, J.M., 2003. Root exudation andrhizosphere biology. Plant Physiol. 132, 44–51.