genesis, morphology and classification of soils in an oxisol-ultisol
TRANSCRIPT
GENESIS, MORPHOLOGY AND CLASSIFICATION OF SOILS IN AN OXISOL-ULTISOL
TOPOSEQUENCE IN S. PAULO STATE, BRAZIL
by
IGO FERNANDO LEPSCH
A thesis submitted to the Graduate Faculty of
North Carolina State University at Raleigh
in partial fulfillment of the
requirements for the Degree of
Master of Science
DEPARTMENT OF SOIL SCIENCE
RALEIGH
1973
APPROVED BY:
Chairman of Advisory Committee
ABSTRACT
Genesis, Morphology and Classification of Soils
LEPSCH, IGO FERNANDO.
(Under in An Oxisol-Ultisol Toposequence
in S. Paulo State, Brazil.
BUOL),the direction of STANELY W
Thea 550-m transverse. Four soil profiles were sampled
along
soils were characterized with physical, chemical,,mineralogical
and
micromorphological analyses to establish the nature of difference
among
them, properly classify and develop hypothesis about their genesis.
The two soils on the upper part of the toposequence have an ochric
epipedon over an oxic horizon and are classified as very fine clayey,
The soil below these two oxidic, isothermic Tropeptic Haplorthox.
has an argillic horizon over an oxic horizon and is classified as very
fine clayey, oxidic, isothermic Orthoxic Palehumult. The soil in the
the catena has an argillic horizon over decomposed sedi
lower part of
fine clayey, kaolinitic, isoit is classified as mentary clayey rock;
thermic Typic Paleudult.
The main characteristics distinguishing the profiles from the
upper to the lower part of the catena were the increase in depth and
eventual loss of the oxic horizon, increase in base saturation, decrease
in gibbsite content, increase in 2:1 clay minerals, relative decrease
of fine clay, increase in illuviated clay, relative decrease of fine
clay and increase in bulk density values.
The genesis of these soils appears to be controlled mostly by the
age of the geomorphic surfaces and by the nature of the parent material.

Ii
BIOGRAPHY
The author was born at Petropolis, Rio de Janeiro, Brazil on
October 23, 1937. He received his elementary and secondary education
in Petropolis.
He attended the Escola Nacional de Agronomia,Universidade Rural do
Brasil, Itaguai, Rio de Janeiro, Brazil, from 1958 to 1961 and
received the Engenheiro Agronomo degree in December 1961.
From 1962 to 1966 he worked as a soil conservationist for the
D.E.M.A., Sao Paulo State Government. In 1966 he was transferred to
the Instituto Agronomico at Campinas, Sgo Paulo State where he worked
as a soil survey staff ciember.
In 1970 he was awarded a scholarship from the Fundaggo de Amparo
a Pesquisa do Estado de Sao Paulo, Brazil, which enabled him to enter,
in January 1971, the Graduate School of North Carolina State University
at Raleigh to pursue the Master of Science degree in Soil Science.
iii
ACKNOWLEDGMENTS
The author expresses his sincere appreciation to his major advisor,
course of
Dr. S. W. Buol, for his guidance and assistance during the
this work. Appreciation is also extended to Dr. M. G. Cook and
Dr. W. H. Spence, the other members of his Advisory Committee,for
their
constructive criticism and assistance.
omico do Special acknowledgment is made
to the Instituto Agron'
Estado de Sio Paulo for granting a leave of absence, and to
the
Fundag-ao de Amparo a Pesquisa do Estado de Sio Paulo whose
scholarship
enabled the author to pursue graduate studies at North Carolina
State
University.
The author also expresses his sincere gratitude to Dr. J.
L. I.
Dematte, Dr. F. Grohmann, Mr. J. B. deOliveira, Mr. C. L.
Rotta and
Mr. C. Ivancko for their suggestions and help in the selection and
collection of soil samples.
To the many other faculty, staff and fellow graduate students of
the Department of Soil Science, North Carolina State University at
Raleigh, the autlor extends his thanks for their assistance and
Specific appreciation is extended to Mr. Ellis Edwards,
counsel.
Mrs. Bertha Crabtree, Mrs. .atricia Patrick and Mrs. Betty Ayers for
laboratory work. their assistance in some
iv
TABLE OF CONTENTS
Page
... vi ..........................LIST OF TABLES ..........
vii .....................LIST OF FIGURES ..
...........................INTRODUCTION .......... . ..
. . . . . . . . . . . . 3 . . . . . . . . . .
LITERATURE -REVIEW . .
. 8 SOILS AND SITE DESCRIPTION . . . . . . . . . . . . . . . . . .
. . ..... 11 . . .................CLIMATE . .
14*.....
GEOMORPHOLOGY ...... .....................
. . . ...... 16 GEOLOGY ........ ....................
17 .......................VEGETATION AND LAND USE ........
... 18 .................EXPERIMENTALMETHODS OF ANALYSIS ......
18 Physical Methods ........ ........................
........ ..................Air-Dry Moisture Content ... 18
18 .....................Particle Size Distribution .......
Water-Dispersible Clay ........ .................... ... 20
.20 Clay Content by the 15-Bar Method .............
........... ... 20 Water Retention at 1 and 1/3 Atmosphere
... .. 21 ....................Particle Size Density ........ ... 21 ...........................Porosity ...........
... 21 .................................Chemical Me~hods
21.......................Soil Reaction ............ 21..................2
Organic Carbon 22.......................Exchangeable Acidity...... 22 .................. . . .....Extractable Hydrogen ............ 22 Extractable Bases and Base Saturation
...... . 2.22 ..................
Cation Exchange Capacity ........ 23 .........................Free Iron Oxides .........
.23 ....................Mineralogical Studies .........
.. 23.......... Clay and Fine Silt Mineral Identification
... .......... ... 23
Petrography of Sand and Coarse Silt Fractions
Quantitative Determination of Gibbsite, Kaolinite and Amor
24 ..........................phous Material ........
...... ............. 24 Thin Section Preparation and Analysis
v
TABLE OF CONTENTS (Continued)
Page
. . . . . . .. 26 . .. . . ... . .... .
* * ... . 26
RESULTS AND DISCUSSION
. . . . . . . . . . .....
.0.....26
Physical Properties
Particle "ize Distribution .................... 30 .......... . . .........Water-Dispersible Clay . . . 32 . . . . . .
Bulk Density, Particle Density and Porosity
. . . . .. 32 . . . Water Retention and Maximum Available
Water
35 ......................Chemical Properties
35 .........................Soil Reaction ... 35
. . . . . . .s.eS. n.Organic Carbon .'. . . 38. . . . . .
. . . . . . .. .. 40 Cation Exchange Capacity and Base Saturation
. . . . .. *. . . . ...... ..Mineralogy ..
40 ........... Sand Mineralogy .................. . 45 ...............Clay and Fine Silt Mineralogy .....
61 . . . . . ......... .........SOIL CLASSIFICATION .
61 . . . ........... Diagnostic Horizons and Soil Orders
..... 61 Profile Number 1.... .......................
... 61 ................................Profile Number 2 . . 61 .............................Profile Number 3 . . 62 . . . . . . ........... ...Profile Number 4
... 62 ...................... . .Soil Moisture Regimes 1 62 ...................the Subgroup LevelClassification at . . . . . . . . . . .... . 64
the Family LevelClassification at
.. 64 ...........................Particle Size Classes .64 .......................Mineralogy Classes ... 64
. . . . ..............Soil Temperature Classes
65 . . . . . . ................SU"NNRY AND CONCLUSIONS
. 68 ......................LIST OF REFERENCES .........
73 ............................APPENDICES ............
Soil Profile Description and ClassificationAppendix A. . . . . . . . . . . 74(1960)the Comissao de SolosAccording to . . 83..........
Appendix B. Micromorphological Descriptions ..
vi
LIST OF TABLES
Page
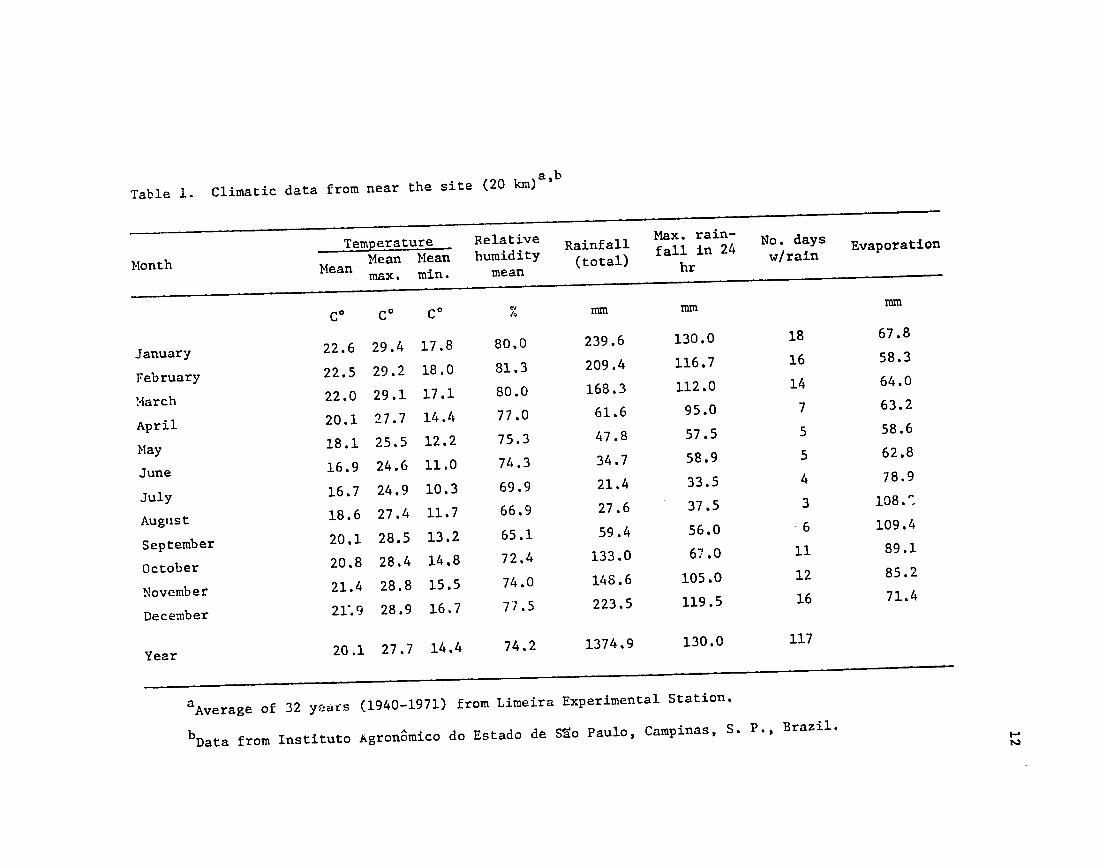
...............1. Climatic data from near the site. 12
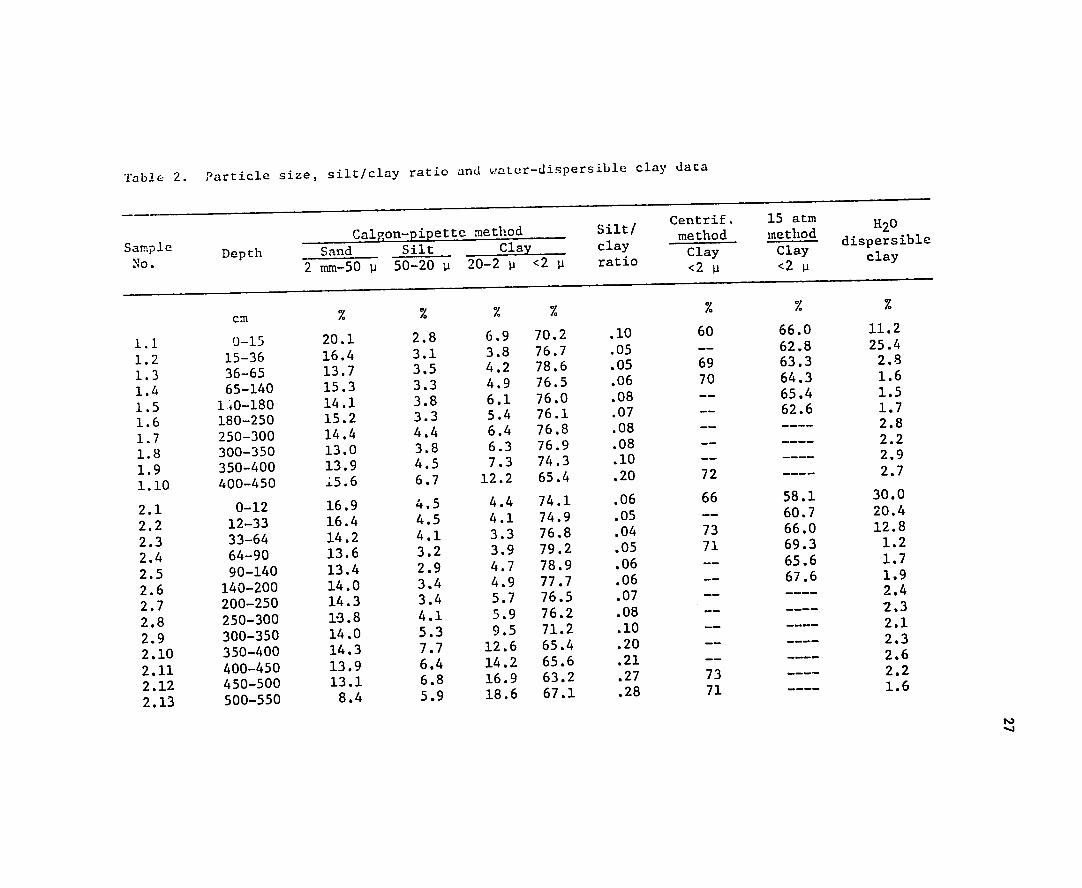
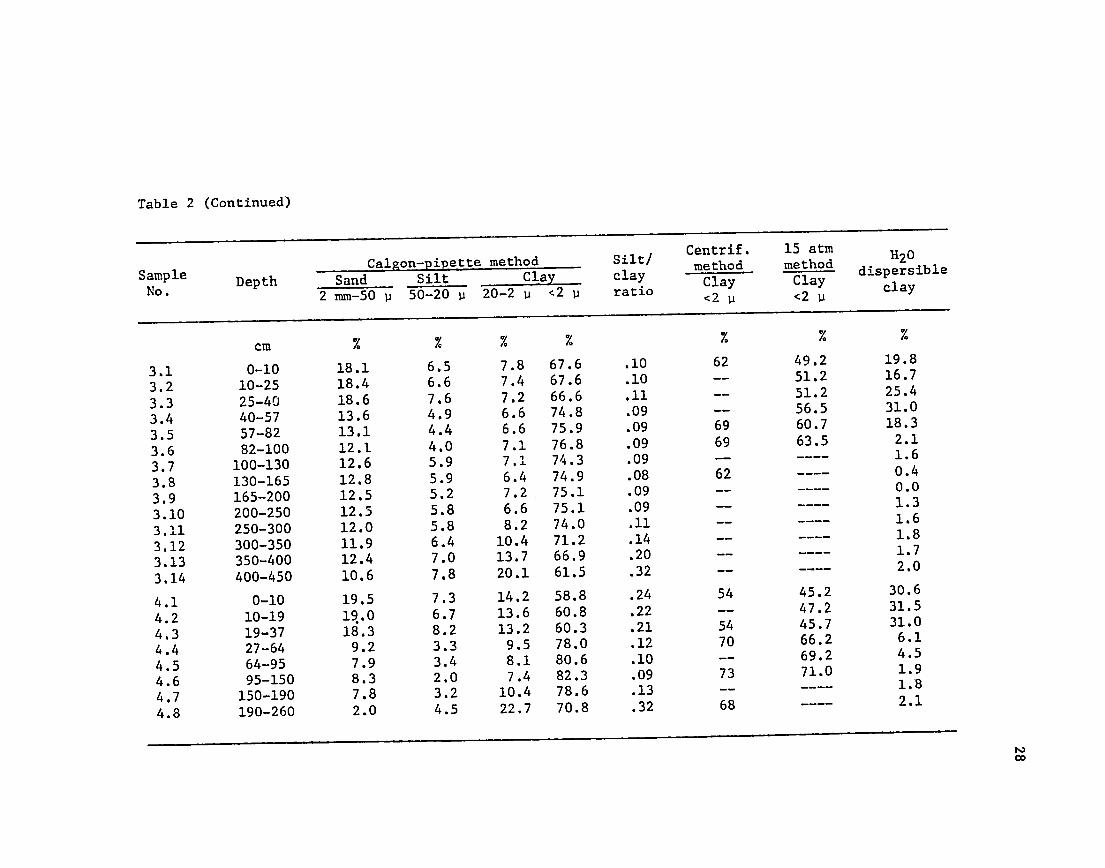
Particle size, silt/clay ratio and water-dispersible clay
2. ... 27 ............................data ...........
3. Particle size as determined by the centrifugation method,
. . ....... 29 with organic matter and free iron removed
. . . 33 Bulk density, particle density and water retention
data 4.
... 36 Chemical properties ........ .....................5.
sand and coarse silt grains . 41 6. Petrographic identification of
. . . . . ... 46 Clay mineralogy estimations by X-ray analysis7.
. . . . . . ... 8. Quantitative estimations of clay mineralogy
53
vii
LIST OF FIGURES
Page
. . . . . ..... 9 1. Topographic map of soil profile locations
2. Semi-schematic cross-section diagram showing the position
of the soil profiles in relation to the landscape, slope
10 . . . . . ........ and substrata .............
6polis3. Rainfall-evapotranspiration balance
at Cordeir
balance calculated according to Thornthwaite. 13
County, S. P.;
Summation of fine clay recovery with successive centrifuga
4. . . 19 .........................tions ..........
. . . . . . . 31 . . . 5. Relative distribution of clay with
depth
. . . . . . . . . 34 . Total pore space with depth.......6.
7. X-ray diffraction patterns of the fine clay of samples from
the B horizon of profile numbers 1 and 2 47.........
8. X-ray diffraction patterns of the fine clay of samples from
... 48......... the B horizon of profile numbers 3 and
4 ..
coarse clay of samples9. X-ray diffraction patterns of the ...... 49
from the B horizons of proi[ile numbers I and 2
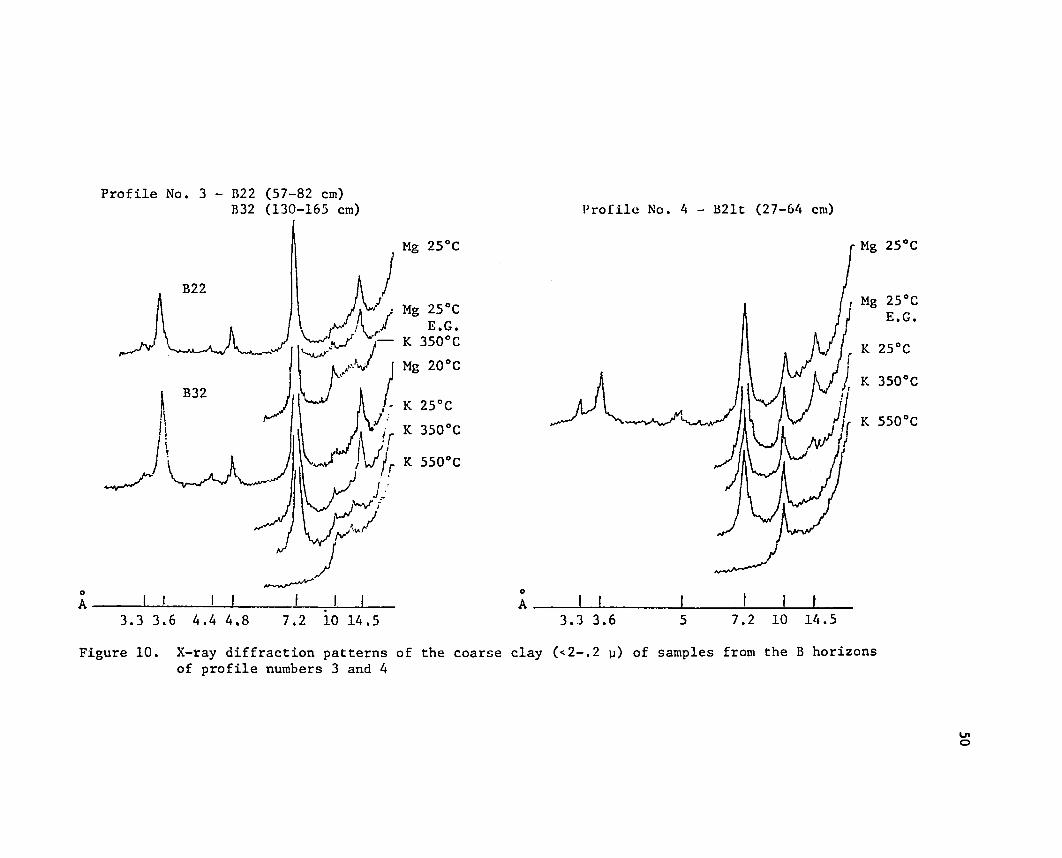
10. X-ray diffraction patterns of the coarse clay of samples
50 from the B horizons of profile numbers
3 and 4.......
11. X-ray diffraction patterns of the coarse clay fraction from
. . . . 51 the weathered bedrock under profile numbers
2 and 4
12. Differential thermograms of the fine clay and coarse clay
fractions from the B horizons of the four studied soil
. 54 . . . . .... ..profiles . . .
a thin section from the B22 horizon of 13. Photomicrograph of . . . ....... 58
profile number 1 (without crossed nicols)
a thin section from the B22 horizon of 14. Photomicrograph of 58...........profile number I (with crossed nicols) ...
a thin section from the B22 horizon of 15. Photomicrograph of 59............profile number 3 (without crossed nicols)
a thin section from the B33 horizon of 16. Photomicrograph of . . . . 59.. .. .
profile number 3 (without crossed nicols)
viii
LIST OF FIGURES (Continued)
Page
17. Photomicrograph of a thin section from the B22t horizon
of profile number 4 (without crossed nicols) . . . . .
18. Photomicrograph of a thin section from the B22t horizon
of profile number 4 (with crossed nicols) . . . . . . .
.
.
.
.
60
60
INTRODUCTION
In the well drained lands of the humid tropics, two
main soil
These soils are classigroups are oftcn found in close
association.
fied in the orders Ultisol and Oxisol according to the
Soil Taxonomy
(Soil Survey Staff, 1960, 1970).
Both Ultipols and Oxisols have been considered soils which
are in
This is interpreted as
a highly weathered stage of genetic evolution.
being a reflection of the great degree of chemical weathering
in the
Oxisols have been interpreted as being more weathered
humid trcpics.
than Ultisols and they indeed differ from the latter in their
composi
tion and morphology,
The differences among Ultisols and Oxisols require that different
a matter of fact the importance of
As management practices be used.
separating these soils in soil surveys of middle and high intensity is
obvious.
It is not normally difficult to distinguish Oxisols from
Ultisols
while doing soil survey work when dealing with the modal
concepts of
The distinction is normally made on the basis of differences
in color and texture seen at different depths and by the examination
of each order.
Modal Ultisols show a perceptible increase in
the subsoil structure.
In clay content with depth and hve
a blocky structure in the subsoil.
contrast, Oxisols do not show a significant increase in clay
content
a structure which with depth and characteristically
the subsoil has
appears massive but is very porous.
At the boundaries between Oxisols and Ultisols, however, their
distinction is somewhat difficult since there is a gradual transformation
2
from one to the other. In such areas laboratory analysis is often
Although all denecessary before a classification can be assigned.
tailed laboratory analysis such as thin section observations and clay
mineralogy are not essential for low intensity soil surveys, they are
important in detailed soil surveys where the soil mapping units have
to be defined within a narrow range of characteristics.
This present study is a characterization of four soil profiles
The region has a relatively highlylocated in S. Paulo State, Brazil.
Thedeveloped agriculture and is requiring detailed soil surveys.
profiles studied were collected in a catena where, according to field
observations, one soil appeared to represent the modal concept of an
Ultisol, other looked like modal Oxisol and the remaining two profiles
were noted to have characteristics intermediate of both orders.
The objectives of this study are to:
1. Describe and compare the four soil profiles, analyzing their
composition, morphology and fabric.
Classify these soils a-cording to one of the more recent2.
systems if classification.
3. Develop an hypothesis to explain the formation of these soils.
3
LITERATURE REVIEW
The early descriptions of soils from the tropics referred to them
The as "Laterites" or Lateritic soils (Marbut,
1927; Glinka, 1931).
term lateritic soil included almost any kind of deep, red colored and
highly weathered soil within the tropics.
Vageler (1930) (quoted from Robinson, 1949) distinguished two
The red groups of tropical soils--the red foams and the
red earths.
boams were defined as the lateritic soils with clay of siliceous type and
the red earths with predominantly sesquioxidic character.
Bennet (1926) identified two main classes of upland clays in
The Central America--the friable and the non-friable
tropical soils.
friable soils were defined as being freely permeable to water, resistant
to erosion and with faint profile zonation. The non-friable soils were
defined as being plastic or stiff, much more impervious and with better
He pointed out that faint zonation through the proprofile zonation.
file is a common characteristic of large areas of soil in the tropics
and stated that (p.353 ):
This seemingly is due, in part at least, to a weakened efficiency
in the process of elutriation and eluviation resulting from
the peculiar nature of the fine particles formed under tropical
conditions, a considerable proportion of which has been found to
That the fine material.clings togetherbe of colloidal nature, to form clusters from which the individual grains are
not readily
detached by water to become suspended and moved through the soil
is evidenced by the physical properties of these soils, such
mass a highly permeable granular structure through which water as
passes rapidly and the usual rapidity which the material suspended
in water by violent agitation falls out of suspension.
In 1938 the U.S.A. soil taxonomy scheme (Baldwin et al., 1938) de
fined five great soil groups pertaining to the zonal soils within the
These were the"lateritic coils of forested warm temperate regions."
4
Yellow Podzolic, Red Podzolic, Yellowish Brown Lateritic, Reddish Brown
The genesis of these soils was Lateritic and the Laterite soils.
explained by the so-called laterization process which was defined by
(1938) as follows (p. 973):Byers et al.
Progressive hydrolysis of rock minerals and its full development
results in their conversion to silicic acid, aluminum hydroxide
less complete dehydrationand iron hydroxide or their more or
the laterites.products:
Laterization in its strict sense was considered by Byers et al. to be a
process of soil parent material development on which a process of
podzolization (or lessivage) could act to form Red and the Red Yellow
Podzolic soils.
The Thorp and Smith (1944) revision of the 1938 U. S. soil classi
fication modified slightly the great groups of Lateritic soils grouping,
the Red Podzolic with the Yellow Podzolic soils under the great soil
group Red Yellow Podzolic soils, and including the Yellowish Lateritic
soils within the Reddish Brown Lateritic great soil group.
The great group definitions in both the 1938 system and in its 1949
revision were quite vague and lacked quantitative data.
Kellogg and Davol (1949) recognized in the Congo three main groups
of Zonal soils, the Latosols, the Chernozemic soils and the Podzolic
Kellogg (1950) used the term Latosol as a suborder category and
soils.
defined these soils according to some of their qualitative morphological
and compositional properties.
Bennema et al. f1959) description of the latosolic B horizon, based
on data from Brazilian soils, agrees with Kellogg's (1950) characteriza
tion of the Latosol suborder while adding a more complete list of
Soil surveys characteristics, some of them quantitatively
expressed.
done in Brazil (Comissao de Solos, 1958, 1960) have been using the terms
5
latosolic B horizon and textural B horizon to classify the well
drained
soils at the most general level of classification.
The new United States soil taxonomy system (Soil Survey Staff, 1960,
1967, 1970) defined the oxic and argillic horizons which corresponds to
tha latosolic B horizons and textural B horizon frwm the Brazilian
classification (Bennema, 1966) although the latter has less detailed
and less quantitative definitions.
Among the well developed soils of the humid tropics, the U. S.
soil taxonomy (Soil Survey Staff, 1960, 1970) identified the three
These classes were defined in orders--Alfisol, Ultisol and Oxisol.
detail and several subgroups were established.
Comparative studies of tropical soils with oxic and argillic
Lemos et al. (Comissao de horizons had beer. made by several
authors.
Solos, 1960) arranged sequentially the soils from S o Paulo State,
according to their stage of development. This arrangement was done
with groups of soil profiles derived from similar parent material and
Two main units were described as being derived
under the same climate.
from argillites--the Red Yellow Podzolic soils, Piracicaba variation and
The Red Yellow Latosol, Piracicaba the Ortho Dark Red Latosols.
variation presented textural B horizon and were considered to be
chronologically less mature than the Ortho Dark Red Latosols which
presented a latosolic B horizon.
Grohmann (1960a) determined aggregate size distribution for pro-
A clayey files with a latosolic B horizon and
a textural B horizon.
latosolic B horizon presented a predominance of aggregates smaller than
I mm and a clayey textural B horizon presented a majority of aggregates
Significant differences were found by Grohmann
greater than 1 mm.
6
(1960b) in the porosity values for these two groups of soils--a clayey
latosolic B horizon presented a total porosity considerably higher than
capilar a sandy clay loam textural B horizon.
The relative values cf
porosity (pores with less than .05 mm in diameter), however, ,ere very
similar to the non-capilar porosities for the former and considerably
A decrease in size aggregates with depth was also
higher for the latter.
noticed in a soil with latosolic B horizon (Grohmann, 1960a).
Stoops (1968) reported micromorphological comparative studies among
tropical soils with oxic and argillic horizons. Ile concluded that the
micromorphological evidence clearly proves the polycylic character of
most kaolisols (Oxisols),
Bei.nema et al. (1970) in a micromorphological comparative study of
soils in South Brazil observed that the limit between the oxic-argil]ic
horizon coincides with an alteration in structure, including the
that this is especially true for the B2 porosity, and pointed out
horizon and valid in a lesser degree for the BI and B3 horizon.
Quantitative clay mineralogical studies of soils with an oxic and
argillic horizon derived from basic rocks were carried by Moniz and
The soils with an oxic horizon Jackson (1967) and by Carvalho (1970).
increase in both gibbsite and kaolinite content and a decrease
showed an
argillic horizon. in amorphous material when compared to the ones with an
(1972) performed mineralogical studies of the clay
Escobar et al.
fraction in four soil profiles located in a toposequence in S-o Paulo
Two of these profiles were classified as Red Xellow
State, Brazil.
Podzolic soils, "Piracicaba variation," and as Ortho Dark Red Latosol.
The Ortho Dark Red Latosol were shoun to have kaolinite in greater
amounts than the Red Yellow Podzolic soil. Significant differences
the coarse clay were not found between the mineralogical composition
of
was tentatively concluded that in (2-.2 p) and fine clay (-.2 W) and it
advanced stages of weathering the composition of these two fractions
shared a closed resemblance.
the study of landscapeRecently much emphasis has been placed on
evolution and on cyclic nature of parent material as main factors to
explain the differences between constrasting soils closely associated
Ollier (1959) pointed out the importance of the within tropical areas.
connection between soils and geomorphology and developed what he called
"the two cycle theory of tropical pedology."
(1962) reported the existence of the Latosols Bennema et al.
(Oxisols) in the older surfaces of the Brazilian and Guiana shields,
these commonly developed from detrital deposits which usually take the
It was also noted that form of very strongly weathered mineral residues.
the soils with textural B horizois occur in association with the Latosols
and on younger erosion surfaces, forming the relatively lowest part of
the landscape, which was found to be covered mostly by relatively
small amounts of detrital waste.
Queiroz Neto (1969) studied the geomorphology and soil properties
an area at Sao Paulo State, Brazil where the occurrence of Oxisols
of
The large occurrence of detrital depositsand Ultisols is common.
It was pointed out originated from pedimentation process was noticed.
that the present climate is not a factor relevant to the explanation of
None of the isolated factors the different soil weathering indexes.
studied (erosion, organisms present and mineralogy) could explain the
absence of argillic horizons in the Oxisols.
8
SOILS AND SITE DESCRIPTION
Four soil profiles located on a toposequence in the southern part
of Rio Claro County, S. Paulo State, Brazil were selected for this
study. The approximate geographic coordinates in the site are 47' 35'
longitude Greenwich and 22' 32' latitude south.
the soils was made through observations ofPreliminary selection of
morphological characteristics on road cuts after which fresh pits were
dug. The soil descriptions were made according to the Soil Survey
Manual (Soil Survey Staff, 1951) and are in Appendix A.
top of the catena presents morphologicalThe profile on the
characteristics considered to be typical for the Oxisols--light dark
surface horizon over a very deep, very friable, fine granular
the other end of the transect presentsThe soil atstructured horizon.
a well developed argillic horizon with strong subangular blocky
The two soils between apparently have structure coated by clay skins.
cm thickness, respectively, over a argillic horizon of 30 and 60
horizon which morphologically looks like an oxic horizon.
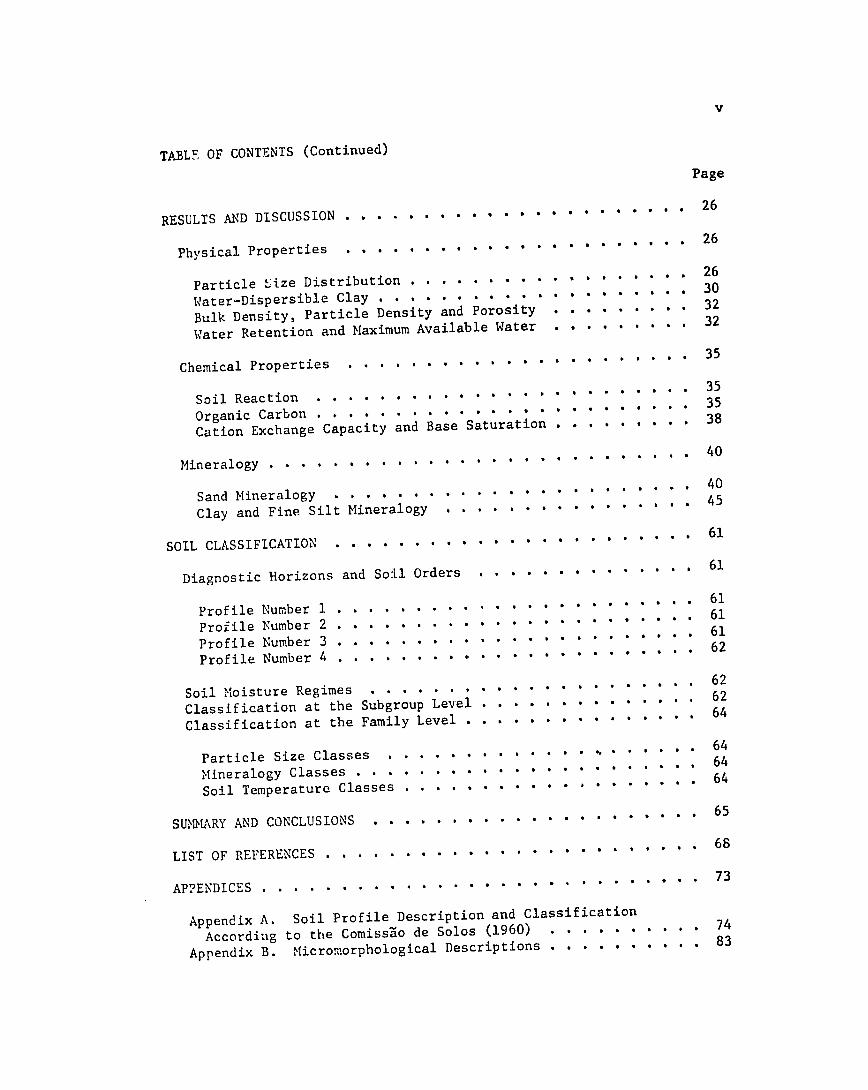
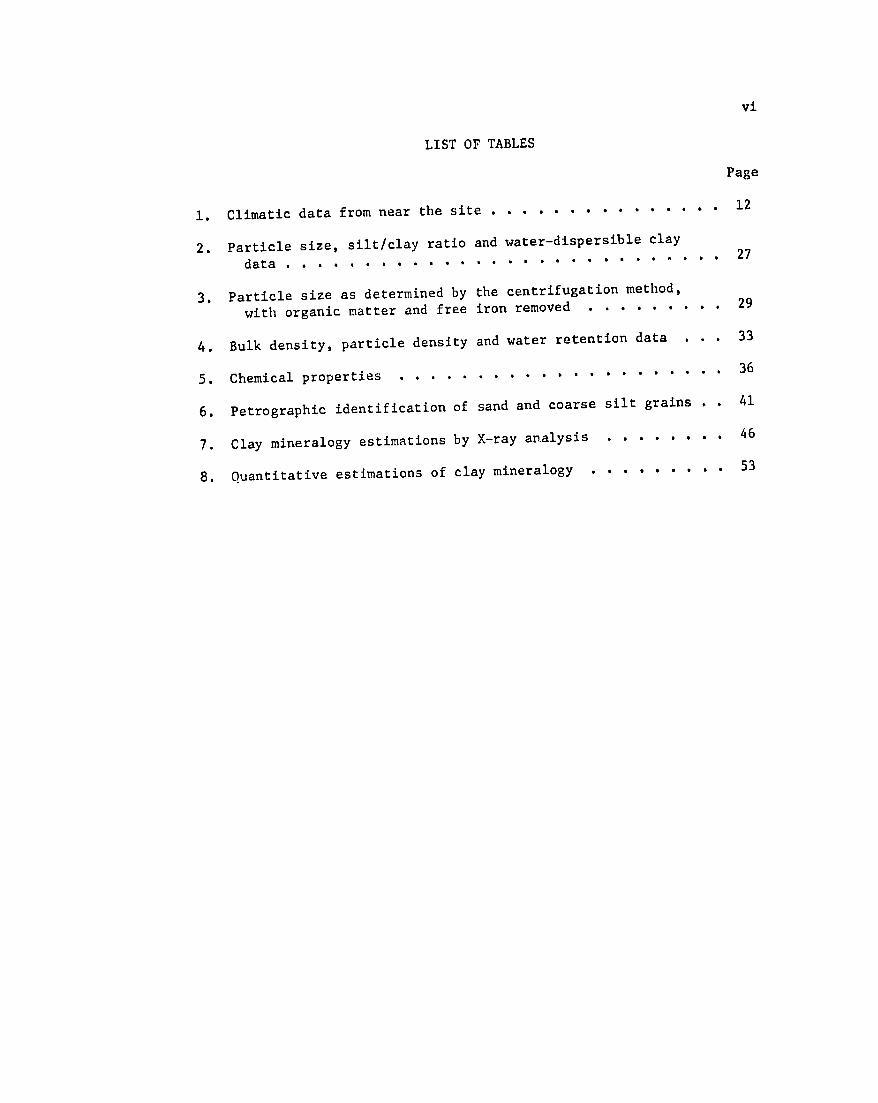
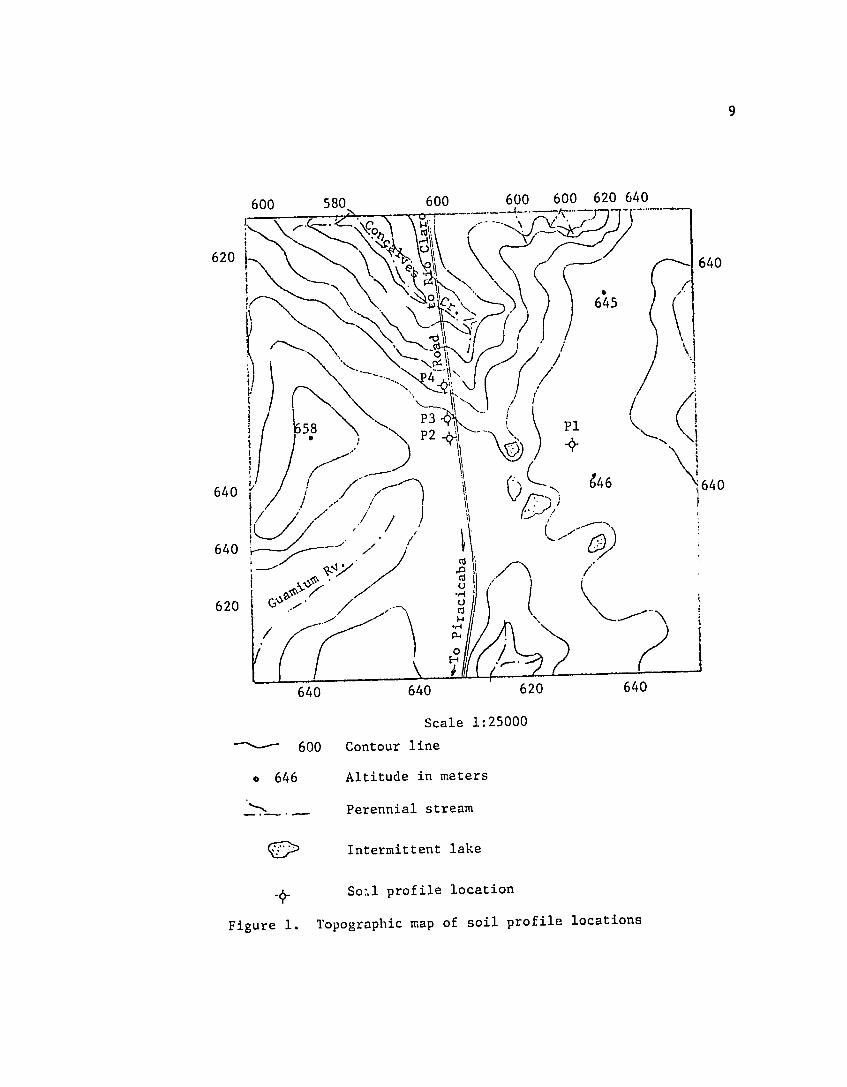
Figure 1 shows the profiles' location on a topographic map.i
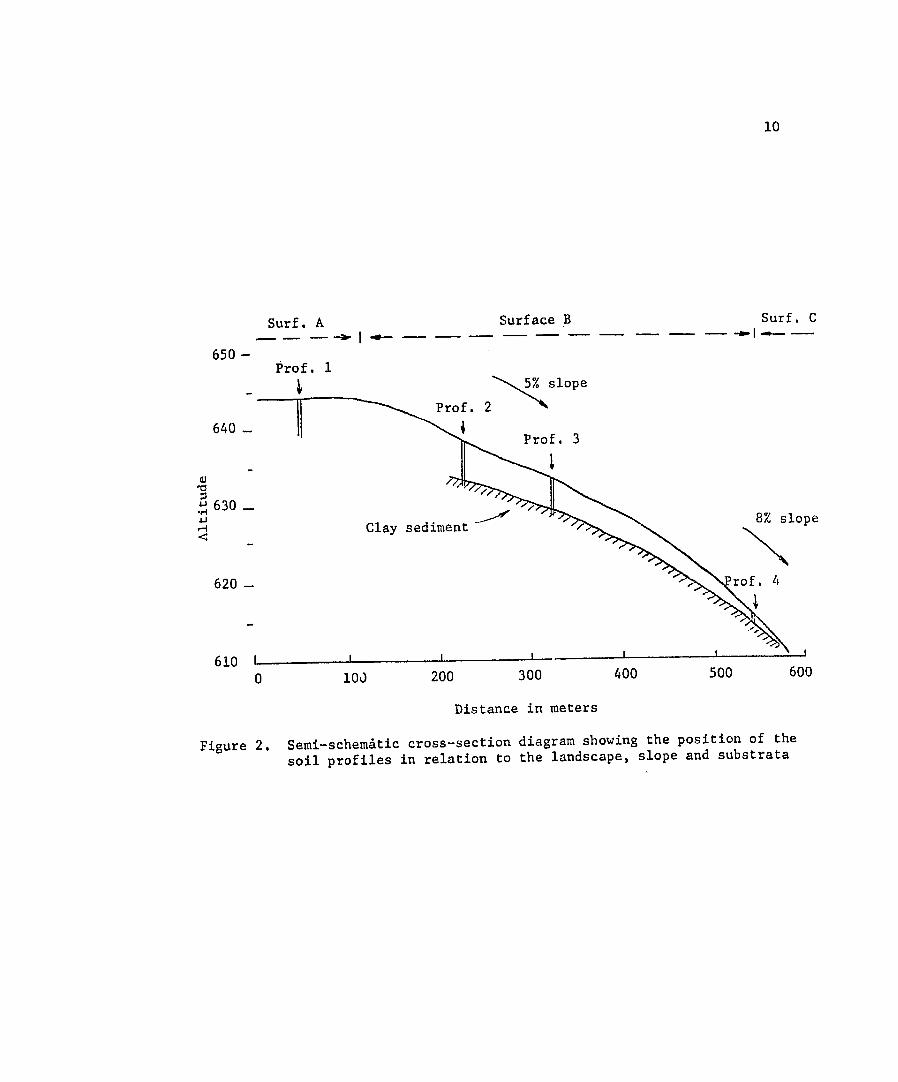
Figure 2, schematically, diagrams the relative position of The soil
profiles in the catena.
1Appreciation is expressed to Mr. P. Donzzeli from the Instituto
Agron8mico, Campinas, S. P., Brazil, for the completion of the topographic
map.
9
600 600 600 620 640600 580
62064
064
! ) 645
I 58 P3 PI , .P2
640i46640 //-* //- , r
640-- " !// "
' ' ;620 i/U'.
. L4
640 640 620 640
Scale 1:25000
600 Contour line
* 646 Altitude in meters
Perennial stream
Intermittent lake
So:,l profile location
Figure 1. Topographic map of soil profile locations
10
Surf. A Surface B Surf. C- I------- b..--------
650 -Prof. 1
5% slope
Prof. 2
640 Prof. 3
630 8% slope4-~1
H Clay sediment
620 rof. 4
i610 I I I I 400 500 6000 i01 200 300
Distance in meters
Figure 2. Semi-schematic cross-section diagram showing the position of the
soil profiles in relation to the landscape, slope and substrata
CLIMATE
The present climate of the area is characterized as being sub-
According to K~ppen (Critchfield, tropical, humid with a winter dry
season.
1960), the climatic classification is Cwa or subtropical of altitude.
This type of climate is the one which comprises the major part of S'o
Paulo State (Comisslo de -solos, 1960).
Rainfall, temperature, relative humidity and evaporation data were
6polis County, available from the Limeira Experimental
Station at Cordeir
The average annual temperature is 20.1C 20 km east of the study area.
(68,2'F). Mean winter temperature (June, July and August) is 17.4°C and
iean summer temperature (December, January and February) is 22.3°C
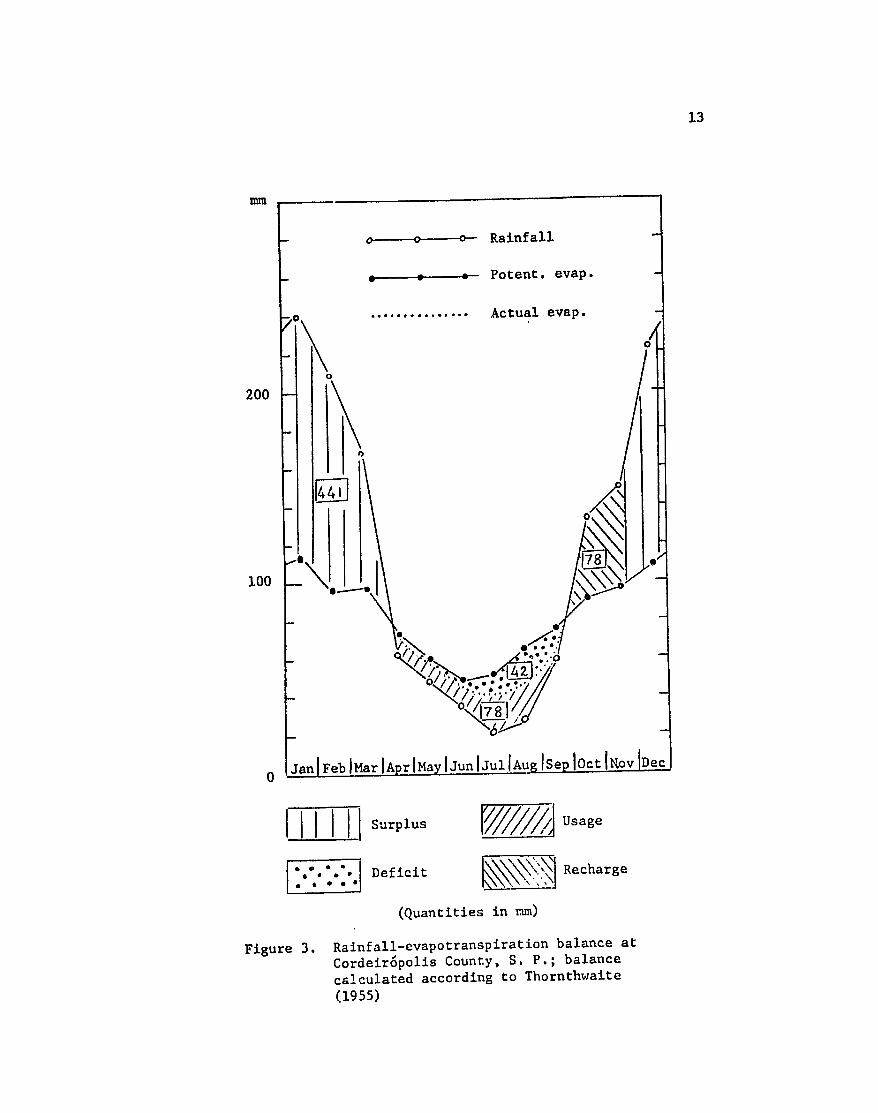
Figure 3 shows the rainfall-evapotranspiration balance,
(Table i).
according to Thornthwaite (1955) and considering a maximum soil moisture
storage of 125 mm1i
IAppreciation is expressed to Dr. A. A. Ortolani from the Instituto
Brazil for the organization and remittance Agrouimico, Campinas, S. P.,
of the climatic data.
vprtoN.dyClimatic data from near the site (20 km)
a b
Max. rain-Table 1.
fallin 2 o. daysTemperature Relative Rainfall w/rainMean humidity (total) fall in 24
Mean MeanMonth hr
max. min. mean
mm C0 W mm mmCoCc
67.818130.0239.622.6 29.4 17.8 80.0
January 58.316116.7209.422.5 29.2 18.0 81.3 February 64.014112.0168.380.022.0 29.1 17.1March 63.2795.061.614.4 77.020.1 27.7April 58.6557.547.812.2 75.318.1 25.5May 5 62.858.934.774.316.9 24.6 11.0June
4 78.9 16.7 24.9 10.3 69.9 21.4 33.5
July 3 108.",37.527.666.918.6 27.4 11.7August *6 109.456.059.465.120.1 28.5 13.2September 89.11167.0133.014.8 72.420.8 28.4October 85.212105.0148.621.4 28.8 15.5 74.0 November 71.416119.5223.577.521.9 28.9 16.7December
117130.074.2 1374.920.1 27.7 14.4Year
aAverage of 32 years (1940-1971) from Limeira Experimental Station.
Brazil. bData from Instituto Agronomico do Estado de Sao Paulo, Campinas,
S. P.,
13
mm
Rainfall
a =- Potent. evap.
............... Actual evap.
0
200
\X 44'J
00 178
100
ovIDec.0 J a n lFebIMar AprIMayIJunIJulIAugISeploct
III IISurplus ~ $//6Usage
Deficit _ _ Recharge
(Quantities in mm)
Figure 3. Rainfall-evapotranspiration balance at
Cordeir6polis County, S. P.; balance
calculated according to Thornthwaite
(1955)

14
GEOMORPHOLOGY
The area is located in the so-called Rio Claro Basin of the
The Rio Claro basin has "depressdo periferica" of the S. Paulo State.
been studied in detail by Penteadc (1968, 1969) and the following con
siderations about this area were based on her work.
The Rio Claro Basin was formed in an inter-plateau area by the
erosion of various sedimentary and basic igneous rocks, under alternation
In a semi-arid period, tentativelyof semi-arid and humid climates.
dated between the Inferior and Middle Pleistocene time epoch, the area
This is was extensively pediplanned in levels between
600 m and 650 m.
the Rio Claro surface which stands mostly over Pleistocene sediments.
The Rio Claro surface was cut down by the drainage system of the
Corumbatai River leaving this surface restricted to the top of the
major watersheds.
the watershed divide line between Profile number 1 is located nea::
It is a the tributaries of the Piracicaba and Corumbatai
Rivers.
relatively high area with smooth topography (0-2% slope), containing
This area is at an altitude some intermintent natural lakes (Figure 1).
this of 644 m on the Rio Claro Basin. According-to Penteado (1969),
particular watershed is "a pedimented surface going from the NE to the
the southern boundary of the Rio Claro Basin." SW direction and is
Profile numbers 2, 3 and 4 are located on surfaces which apparently
the ones referred by Penteado (1969) as being cut on the Rio Claro are
a result of climatic oscillations of humid to dry between
surface as
Middle Pleistocene and the Holocene time epoch.
15
1 o) the area suggest that Observations on aerial photograph3
there are three geomorphic surfaces in the sites where the profiles
The geomorphic surface A, where profile
were sampled (Figure 2).
number 1 is located would probably correspond to the' Rio Claro Surface
Profile numbers 2 and 3 are located on a
of Middle Pleistocene age,
younger geomorphic surface which may or may not have colluvih.
material
Profile number 4, apparently is
from the sediments above surface A.
located on a transitional zone between the surfaces B and C
and is
expected to be the youngest point on the landscape.
IAppreciation is expressed to Dr. R. B. Daniels, Professor of Soil
Science, North Carolina State University and USDA, Soil Conservation
Service, for his assistance in this interpretation.
16
GEOLOGY
A clay, violateous gray material, looking like a decomposed
argillite is present in profile numbers 2, 3 and 4 at a depth of 5.2 m,
This same material was 4.0 m and 1.9 m, respectively (Figure 2).
observed on the lower middle part of the road cut adjacent to the pro-
Alfiles where parallel stratification of
the sediments was noticed.
though there were no efforts to identify more precisely this sediment,
the work of Almeida and Barbosa (1953) and the geologic sketch of the
(1966) indicate that these nearby Piracicaba County made by Ranzani
sediments are probably from the Itapetininga Formation of the Tubar-o
series dated from Permian age.
The parent material from which profiles 2, 3 and 4 originated seems
to be of colluvial origin since a sharp contact with some iron concre
tions was found between the red soil and the grey violateous argillite.
Two hypotheses seem to be possible to explain the origin of parent
material at profile number 1. It could have been developed over the
sediments of the Tubarao series or over more recent sediments, brought
over the Tubarlo series by the pedimentation process during the forma-
In the latter hypothesis the sediments the Rio Claro surface.tion of
would have received contributions from different kinds of rocks, such
as eolian sandstones and basaltic lavas,situated at higher positions.
The geologic sketch of the area made by Penteado (1968) supports this
hypothesis but it should be considered that its small scale of
1:250,000 is not appropriate to give conclusive evidence in the small
area where the profiles were located.

17
VEGETATION AND LAND USE
The native vegetation on the area seems to have been the tropical
broadleaf forest, as indicated by some small remnant areas such as the
one in which profile number 1 is located.
At site numbers 2, 3 and 4 farmers indicate that the primitive
After the clearing, coffee was forest was cleared about 1900 A.D.
cultivated and in 1921 the area was transformed to pastures remaining
like that until around 1960 when sugar cane began to be cultivated.
Lime was used for the sugar cane cropping in amounts of 2 tons per
hectare, applied once before planting. It was also reported that 200
kg per hectare of a fertilizer mixture containing nitrogen, phosphorus
and potassium was applied but data concerning the frequency of the
are not available.fertilizer use

18
EXPERIMENTAL METHODS OF ANALYSIS
Physical Methods
Air-Dry Moisture Content
The percentages of moisture at air dryness were calculated from
the weight of a 10-g air-dry soil after 24 hr in a 105-110*C oven.
These percentages were used to calculate all data on aq oven-dry basis.
Particle Size Distribution
Particle size was determined by two methods--the pipette method
(Kilmer and Alexander, 1949) and by the centrifugation method (Kittrick,
1963).
For the pipette method, 13 g of air-dry soil were treated with
hydrogen peroxide, dispersed with 5 ml of 10% calgon solution (hexameta
phosphate plus sodium carbonate) and stirred for 15 min with a Hamilton
Beach No. 33 stirrer (10,000 rpm).
The sand fractions were separated with a 300-mesh sieve, oven
The clay and silt fractions were determined from dried and weighed.
aliquots pipetted at a depth of 10 cm after the appropriate settling time.
In the centrifugation method, free iron and organic matter were
removed and the sample was centrifuged while suspendpd in a solution of
Five portions were separated--sand (2,000 p to 50 p),NaOl at pH 9.
coarse clay (2 pfine silt (20 p to 2 p),coarse silt (50 p to 20 V),
.2 1) and fine clay (smaller than .2 p).to
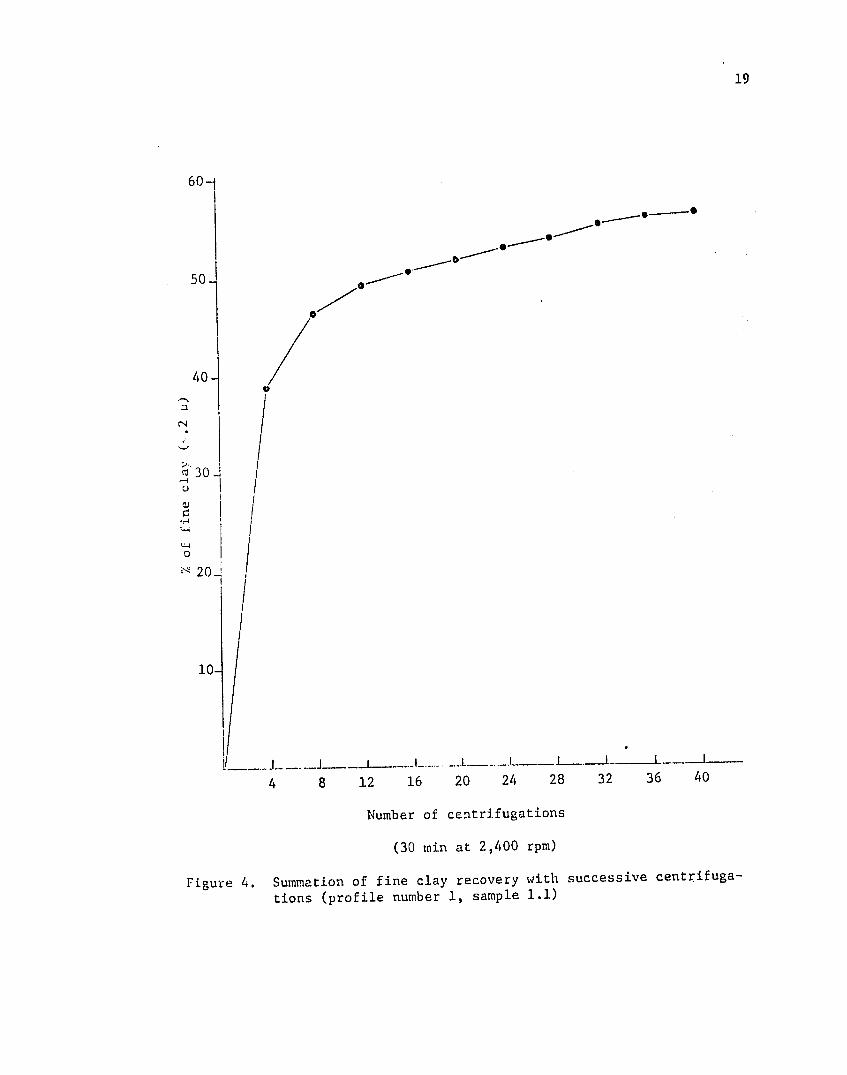
From 30 to 40 centrifugations were needed to separate the less-
It was observed from measurements in one samplethan-.2-p fraction.
to remove 90% of the (Figure 4) that 16 centrifugations were sufficient
19
60
0
50
40
300
30
o
> 202
I
10
20 24 28 32 36 404 8 12 16
Number of centrifugations
(30 min at 2,400 rpm)
Summation of fine clay recovery with successive centrifuga-Figure 4. tions (profile number 1, sample 1.1)
20
fine clay. Only this number of centrifugations was done for samples
from numbers3.5 to 4.8.
Water-Dispersible Clay
A Hamilton Beach No. 33 stirrer was used to stirr 20 g of air-dry
soil in approximately 500 ml of demiiLirelized water for 5 min (Vettori,
1969). The amount of water-dispersible clay was determined from an
aliquot taken by a pipette at a depth of 5 cm after the appropriate
sectling time.
Clay Content by the 15-Bar Method
The water content at 15-bar pressure was determined by pressure
membrane equipment (Richards, 1951). Clay percentages were calculated
by multiplying the weight percentage of water retained by the factor
2.5 (Soil Survey Staff, 1967).
1
Water Retention at 1 and 1/3 Atmosphere
The water content at 1 atmosphere and 1/3 atmosphere was done by
Twenty grams of air-dry soil were placed in a the centrifuge method.
metal box and allowed to saturate with water overnight. The water reten
tion at 1 atmosphere was calculated by weighing the samples after
Centrifugation for 30 min at centrifugation for 30 min at 2,440 rpm.
The maximum1,440 rpm was used to calculate the 1/3 atm values.
available water was considered to be the difference between the water
content at 1/3 atm and 15 atm expressed on a volume basis.
iAnalysis done at the Instituto Agron~mico do Estado de Sio Paulo, Campinas, S. P., Brazil.
21
2 Density
Particle
Particle density was determined by the ethyl alcohol method (Paive
Ten grams of soil were weighed and placed in a
Neto et al., 1961).
filled with a known amount of ethyl l00-ml volumetric flask which was
The volume of the particles was calculated by subtracting the
alcohol.
volume of alcohol filling the flask from 100 ml.
Po.rosity
The total soil porosity was calculated from the particle density
and bulk density values through the following formula:
100 x bulk density Total porosity %
= 100 - particle density
Chemical Methods
Soil Reaction
Values for pH were obtained after allowing 20 g of soil to stand
TI> in a 1:1 soil water and 1:1 soil N KCI solution
mixture for 30 min.
pH values were measured by using a glass electrode pH meter.
2
Organic Carbon
The organic carbon was determined by oxidation with acid dicromate
solution (Allinscn,using external heat and titration with standard FeSo 4
1965).
2Analysis done at the Instituto Agronomico do Estado de Sio Paulo,
S. P., Brazil.C-ampinas,

22
3
Exchangeable Acidit
Exchangeable acidity was determined by extraction with 1 N KCI and
titration of leacheate with NaOH, using bromothymol blue as an indicator.
3
Extractable Hydrogen
Extractable hydrogen was determined by leaching 10 g of air-dry
soil with 1 N sodium acetate, pH 7 and titration of the displaced
aluminum and hydrogen with 0.1 N sodium hydroxide using phenolphtalein
The results were subtracted from the exchangeableas an indicator.
acidity as determined by the KC1 extraction (Paiva Neto et al., 1961).
Extractable Bases and Base Saturation
The extractable bases were extracted by 1 N ammonium acetate as
Calcium and magnesium were determined bydescribed by Chapman (1965).
an atomic absorption spectrophotometer; potassium and sodium were
determined by flame photometry.
The base saturation percentage was calculated as percent of bases
on the cation exchange capacity obtained byretained (Ca, Mg, K and Na),
the sum of cations.
Cation Exchange Capacity
Cation exchange capacity (CEC7) was determined at pH 7 by ammonium
saturation method and determination of the adsorbed NH4 by the acid-
NaCI method (Chapman, 1965). Cation exchange capacity, by the sum of
cations, was obtained by the sum of extractable hydrogen, extractable
bases and exchangeable acidity.
3Analysis done at the Instituto Agrononico do Estado de Slo Paulo, Campinas, S. P., Brazil.
23
Free Iron Oxides
Free iron was extracted by the citrate-dithionite method as
Two dithionite extractions were described by Kittrick and Hope (1963).
atomic absorption spectrophotometerIron was determined with andone.
and expressed as Fe203 .
Mineralogical Studies
Clay and Fine Silt Mineral Identification
The X-ray diffraction analyses of three iron-free separates (<.2 U,
were prepared as oriented specimens on glass slides.
.2-2 u and 2-20 p)
Diffractograms of these particles were obtained for the following treat-
Mg saturation and Mg saturation plus ethylene glycol solvation
ments:
room temperature, and heated at at room temperature; K saturation at
350'C and 500C (Jackson, 1956).
A nickel-filtered copper K radiation at the scanning rate of 20
(20) per minute was used. A semi-quantitative estimation of the
minerals was made by visually comparing the height and width of the
peaks.
Petrography of Sand and Coarse Silt Fractions
A small sample of the fine sand (100-250 p), very fine sand (50
100 p) and coarse silt (20-50 p) was dropped on the surface of a glass
slide, moistened with dilute solution of methyl alcohol, spread evenly
= 1.54) was spread onA refractive index oil (nand allowed to dry.
A polarizing microscopethe grains and covered by a thin cover glass.
was used to identify the grains according to their optical properties
and morphology. Approximately 300 to 400 grains were identified in each
24
sample and their relative amounts were expressed as percentages of the
total number of grains counted.
Quantitative Determination of Gibbsite, Kaolinite and Amorphous
4 Material
Kaolinite and gibbsite were estimated by differential thermal
analysis using calibration curves prepared with mixtures of standard
About 20 mg (± 1 mg) of the iron-free fine kaolinite and gibbsite.
coarse clay (2-.2 -p), equilibrated with a slurry of clay (<.2 ji)and
was heated in a DuPont 900 differential thermal analyzer at a
Mg(N 3)2
temperature rate of 200C per minute in a flowing N2 atmosphere.
The amorphous material was determined according to Hashimoto and
One hundred grams of the iron-free fine clay and coarse Jackson (1960).
The clay fractions were boiled for 2 min with 0.5 N
NaOH solution.
silica and aluminum removed less the gibbsite as estimated by DTA
was recorded as amorphous materials.
Thin Section Preparation and Analysis
Small soil blocks (2-3 cm larger axis) with undisturbed structure
a waterwere impregnated with polyethylene glycol (Carbowax
6000),
Attempts to impregnate qven-dry samplessoluble resin (Mitchel, 1956).
under vacuum with a polyester resin at three different dilutions with
monomeric styrene were uncessful due to lack of complete impregnation
in the central parts of the peds.
4Appreciation is expressed to Dr. S. B. Weed, Professor of Soil
Science, North Carolina State University at Raleigh, for his orienta
tion on these analyses.

25
The carbowax resin was liquefied at 1000C and poured over air-dry
The samples were allowed to soil blocks in small aluminum containers.
be soaked for 8 days in a 60'C oven.
The impregnated soil samples were cut into blocks with a diamond
smoothed using carburundun power (320 A face of each block wassaw.
grit), washed, dried and cemented on a microscopic slide with epoxy
They were then sliced to about 2 mm thickness in a thin section
resin.
cutting saw, ground to 0.3 mm in a thin section grinder and ground to a
final thickness by hand on a glass plate using carburundun power (600
During the process of cutting, grinding and washing,kerozene
grit).
was used in order to prevent solubilization of the carbowax resin.
The thin section was examined with polarizing microscope. Descrip
tions were made following Brewer's terminology (1964), emphasizing the
size and arrangement of primary peds; basic, referred and related
distribution of the fabric; void morphology and plasma concentrations.

26
RESULTS AND DISCUSSION
Physical Properties
Particle Size Distribution
The clay content was over 45% throughout all profiles and the
were higher thanvalues determined by calgon-pipette method (Table 1)
the ones determined by centrifugation with iron and organic matter
on profile number 1 removal (Table 2) except for the deepest layers
and number 2.
Clay content determined by the calgon pipette method was always
higher than the amount estimated by multiplying the moisture content
at 15 atm by 2.5 (Table 1).
Most of the clay, except for the decomposed argillite layer (samples
number 2.13 and 4.8 in Table 3) was found to be less than 0.2 w. The
fine clay/coarse clay ratio (Table 3) decreased from the upper to the
lower soil of the toposequence suggesting a decreasing weathering
stage in this same direction. The fine/coarse clay ratio also decrease
with depth in the soil.
were very low for profilesThe fine silt contents (20 p to 2 p)
Profilenumber 1, 2 and 3. Silt/clay ratios are less than 0.09.
number 3 showed a small increase in the silt/clay ratio in the B
horizons when compared with profiles number 1 and 2.
The lower member of the toposequence (profile number 4) contains
higher silt/clay ratios, being greater than .20 in the uppermost three
The narrow silt clay ratios of profiles number 1, 2 and 3
horizons.
indicate extensive weathering or old age for these soils (Wanbeke,
1962).
--
--
----
--
----
data Particle size, silt/clay ratio and water-dispersible
clayTable 2.
Silt/ Centrif. 15 atm H20Calgon-pipette method C dispersibleClay claySample Depth Sand Silt Clay Clay<2No. 20-2 p <2 p ratio <2 ca
2 mm-50 u 50-20 p
%% %% % %emn %
2.8 6.9 70.2 .10 60 66.0 11.2 1.1 0-15 20.1
62.8 25.4 3.1 3.8 76.7 .05 --
694.2 78.6 .05 1.3 1.2 15-36
36-65 13.7 16.4
3.5 63.3 2.8 70 64.3 1.64.9 76.5 .06
1.4 65-140 15.3 3.3 -- 65.4 1.5
6.1 76.0 .08 1.5 140-180 14.1 3.8
62.6 1.7 3.3 5.4 76.1 .07 --
1.6 180-250 15.2 2.876.8 .08 1.7 250-300 14.4 4.4 6.4
2.26.3 76.9 .08
1.8 300-350 13.0 3.8 2.9 4.5 7.3 74.3 .10 --
13.91.9 350-400 2.7 6.7 12.2 65.4 .20 72
1.10 400-450 i5.6 66 58.1 30.04.4 74.1 .06
2.1 0-12 16.9 4.5 -- 60.7 20.4
4.5 4.1 74.9 .0512-33 16.42.2 66.0 12.8
4.1 3.3 76.8 .04 73 2.3 33-64 14.2 1.269.33.2 3.9 79.2 .05 71 2.4 64-90 13.6
-- 65.6 1.778.9 .06 2.5 90-140 13.4 2.9 4.7
-- 67.6 1.94.9 77.7 .06
2.6 140-200 14.0 3.4 2.476.5 .07 --
14.3 3.4 5.72.7 200-250 2.3
76.2 .08 --4.1 5.9250-300 1-3.82.8 ---- 2.171.2 .1014.0 5.3 9.5
2.9 300-350 ---- 2.3.20 --12.6 65.42.10 350-400 14.3 7.7 2.6.21 --14.2 65.6 2.11 400-450 13.9 6.4 2.2
6.8 16.9 63.2 .27 73 2.12 450-500 13.1
---- 1.6 5.9 18.6 67.1 .28 71
8.42.13 500-550
--
-- --
Table 2 (Continued)
Silt/ Centrif. 15 atm H20Calgon-pipette method clay method method dispersibleSample Depth Sand Silt Clay
<2 cray Clay Clay clayNo. 2 Sand Sil22o.mam-SO 50-20 ' 20-2 U <2 ratio <2 j <2 l
cm % % %
49.2 19.8.10 62 3.1 0-10 18.1 6.5 7.8 67.6
-- 51.2 16.767.6 .103.2 10-25 18.4 6.6 7.4
-- 51.2 25.466.6 .113.3 25-40 18.6 7.6 7.2
-- 56.5 31.074.8 .093.4 40-57 13.6 4.9 6.6
60.7 18.36.6 75.9 .09 69 3.5 57-82 13.1 4.4
69 63.5 2.176.8 .093.6 82-100 12.1 4.0 7.1
---- 1.65.9 7.1 74.3 .09
3.7 100-130 12.6 62 ---- 0.4
5.9 6.4 74.9 .083.8 130-165 12.8
---- 0.05.2 7.2 75.1 .09
3.9 165-200 12.5 1.35.8 6.6 75.1 .09
3.10 200-250 12.5 1.6.11 ------5.8 8.2 74.03.11 250-300 12.0 1.8
6.4 10.4 71.2 .14 --3.12 300-350 11.9
.20 --3.13 350-400 12.4 7.0 13.7 66.9 1.7
---- 2.07.8 20.1 61.5 .32 --
3.14 400-450 10.6 54 45.2 30.614.2 58.8 .24
4.1 0-10 19.5 7.3 -- 47.2 31.513.6 60.8 .22
4.2 10-19 19.0 6.7 54 45.7 31.060.3 .21
4.3 19-37 18.3 8.2 13.2 66.2 6.1
3.3 9.5 78.0 .12 70 4.4 27-64 9.2
-- 69.2 4.53.4 8.1 80.6 .10
4.5 64-95 7.9 73 71.0 1.9
2.0 7.4 82.3 .094.6 95-150 8.3
---- 1.83.2 10.4 78.6 .13 --
4.7 150-190 7.8 68 ---- 2.1
4.5 22.7 70.8 .324.8 190-260 2.0

Particle size as determined by the centrifugation method, with organic matter and free
Table 3. iron removed
Coarse Fine Fine clay/ clay clay coarse claySiltDepthSand
No. 2-.25 mm .25-.05 mm 50-20 P 20-2 P 2-0.2 p <0.2 p ratio
% cm % %
53 7.6 6 13 5 3 7
1.1 0-15 61 7.6 1.3 36-65 6 8 5 3 8
5.34 11 599 41.4 65-140 7
60 5.15 3 12131.10 400-450 2 51 3.46 5 153 172.1 0-12 6.36 10 63
2.3 33-64 2 14 5 4.56 13 5813 62.4 64-90 2
56 3.35 7 172 122.12 450-500 43 1.57 12 28
2.13 500-550 1 7 4.27 12 503 16 83.1 0-10 3.35 16 5312 73.5 57-82 2 2.45 19 4514 73.6 82-100
2 2
13 7 9 23 39 1.7 3.8 130-165
38 2.412 164 15 114.1 0-10 6 19 13 14 40 2.9
4.3 19-27 4 51 2.7
4.4 27-64 2 4 9 8 19 54 2.8
4.6 95-150 1 5 9 6 19 38 1.319 305 34.8 190-260 tr.
30
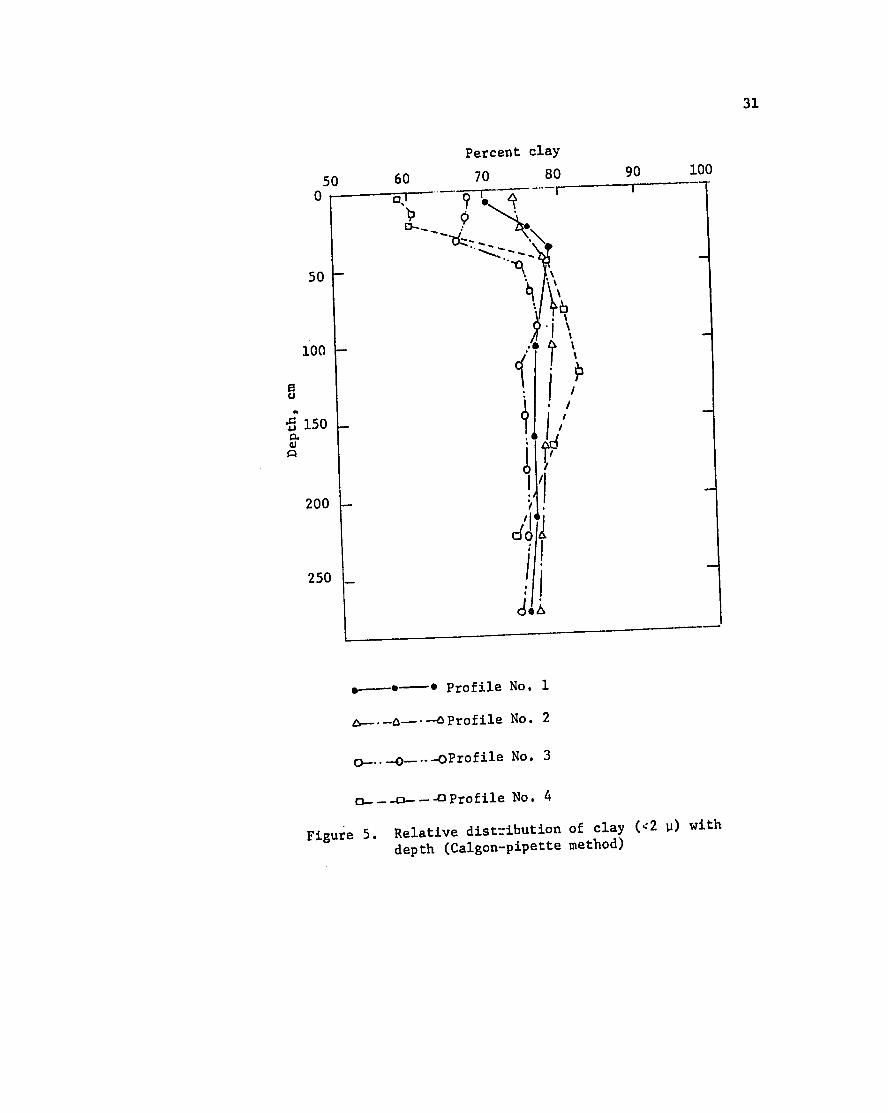
The distribution of clay with depth can be best visualized in
Figure 5. Profile numbers 1 and 2 have a slight increase in clay
This increase is not sufficient to identifycontent in the B horizon.
an argillic horizon on these soils (Soil Survey Staff, 1970).
In profile numbers 3 and 4 the clay content increases more than 8%
cm which is one of thewithin a vertical distance of less than 30
The greater increase in clayrequirements for an argillic horizon.
content observed in profile number 4 suggests that this profile has had
=ore clay illuviation than any of the other three profiles studied.
In profile numbers 1, 2 and 3 there is no significant clay content
Profiledecrease with a depth of more than 300 cm at 190-cm depth.
number 4 has a clay content decrease of 11.5% from its maximum.
Water-Dispersible Clay
Water-dispersible clay content was always found to decrease from
the surface horizons (Al or Ap and A3) to the deepest layers (Table 1).
wasAbrupt decrease in water-dispersible clay content to less than 3%
The depth where the waterfound in profile numbers 1, 2 and 3.
dispersible clay content was less than 3% varies among profiles,
Thiq trendincreasing from profile number 1 to profile number 4.
suggests that the clay fraction increases in mobility from the upper
to the lower member of the toposequence. It also suggests a presence of
argillic horizons in profile numbers 3 and 4 and in the horizon
described as Bl (sample 2.3) in profile number 2.
31
Percent clay
90 100807050 60
0
50
100
150 -Ij~
200
, I+
-h250
o-- Profile No. 1
o--- .0Profile No. 2
0-..-O-..-oProfile No. 3
o-u--o--OProfile No. 4
with Figure 5. Relative distribution of clay
(c2 u) depth (Calgon-pipette method)
32
Bulk Density, Particle Density and Porosity
Table 4 contains the results of bulk density and particle2 density
Profile number 1 has bulk density values of approxi
determinations.
Profile numbers 2, 3 and 4 mately 0.9 g/cm
3 throughout the profile.
have higher bulk density values in the second horizon, just below the
This is probably due to cultivation practices and traffic
plow layer.
of agriculture machinery on these soils.
Profile numbers 2 and 3 also have higher bulk density values in
No apparent significant variation on
the upper part of the B horizon.
bulk density values was noticed in the B horizon of profile number 4.
Bulk density values above 1.0 g/cc, with exception of sample
number 3.6, coincides were subangular blocky structure as described
The values below 1.0 g/cc in field soil descriptions (Appendix
A).
were found for the horizons with friable fine granular structure,
characteristic of most oxic horizons (Soil Survey Staff, 1970).
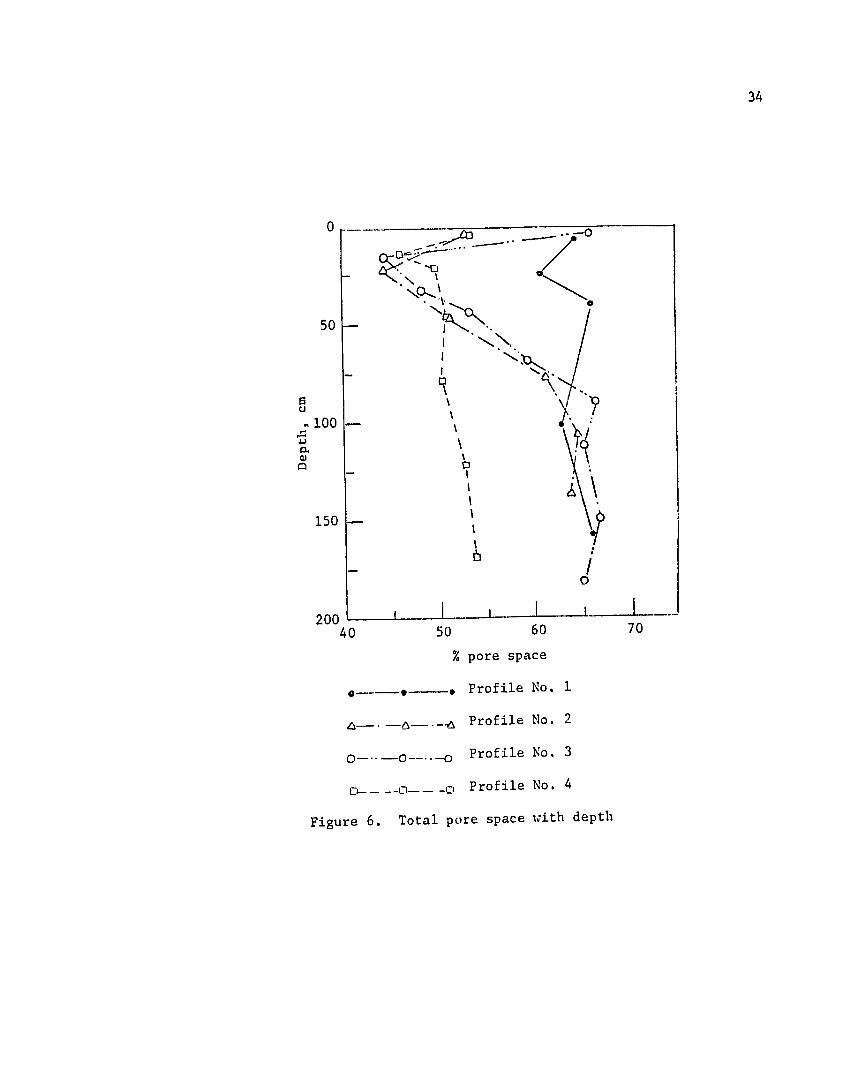
The values of porosity, calculated from bulk density and particle
size density are presented on Figure 6. Figure 6 shows that profile
number 1 has the higher values of total porosity, all horizons having
Porosity in profile number 60 to 70% of their volume occupied
by pores.
A greater variation in porosity was found in
4 ranged from 45 to 55%.
profile numbers 2 and 3 where the upper horizons were somewhat similar
to profile number 4, decreasing gradually with depth to values at about
m that are similar to those found in profile number 1.
Water Retention and Maximum Available Water
Water retention values for 1/3 atm, 1 atm and 15 atm are given on
Table 4. No apparently significant differences were observed on the
1
33
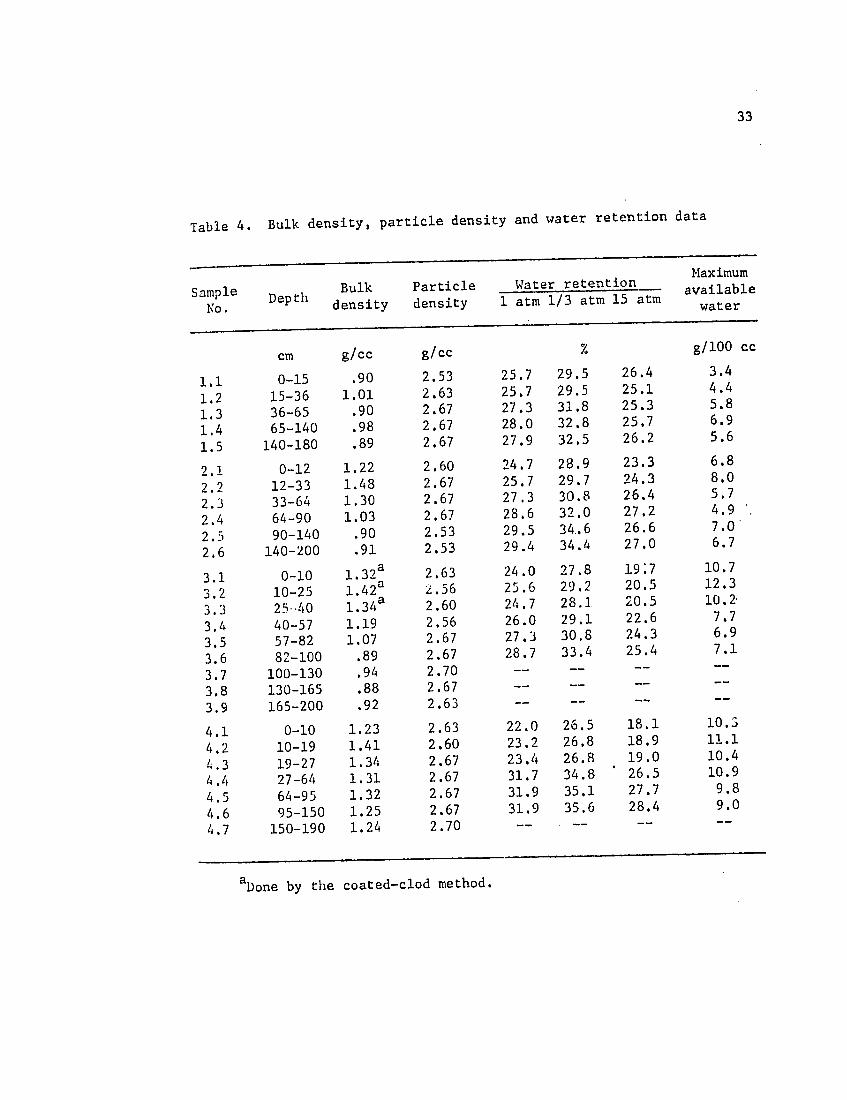
Table 4. Bulk density, particle density and water retention data
Maximum
availableWater retentionParticleSample Bulk
1 atm 1/3 atm 15 atm water o. Depth density density
% g/100 cc cm g/cc g/cc
29.5 26.41.1 0-15 .90 2.53 25.7 3.4
1.01 2.63 25.7 29.5 25.1 4.4 1.2 15-36
31.8 25.3 5.82.67 27.31.3 36-65 .90 28.0 32.8 25.7 6.9.98 2.671.4 65-140
1.5 140-180 .89 2.67 27.9 32.5 26.2 5.6
28.9 23.32.1 0-12 1.22 2.60 24.7 6.8
24.3 8.02.67 25.7 29.72.2 12-33 1.48 2.3 33-64 1.30 2.67 27.3 30.8 26.4 5.7
28.6 32.0 27.2 4.92.672.4 64-90 1.03 .90 2.53 29.5 34.,6 26.6 7.0
2.5 90-140 34.4 27.0 6.72.53 29.42.6 140-200 .91
a 10.727.8 19:72.63 24.03.1 0-10 1.321.42 a 2.56 25.6 29.2 20.5 12.3
3.2 10-25 20.5 10.224.7 28.13.3 25-40 1.34a 2.60
1.19 2.56 26.0 29.1 22.6 7.7 3.4 40-57 6.930.8 24.32.67 27.33.5 57-82 1.07
7.1 3.6 82-100 .89 2.67 28.7 33.4 25.4
3.7 100-130 .94 2.70 .. .. ....
.. ..3.8 130-165 .88 2.67 ..
.. ....3.9 165-200 .92 2.63
4.1 0-10 1.23 2.63 22.0 26.5 18.1 10.3
23.2 26.8 18.9 i.11.41 2.604.2 10-19 1.34 2.67 23.4 26.8 19.0 10.4
4.3 19-27 26.5 10.9
4.4 27-64 1.31 2.67 31.7 34.8
4.5 64-95 1.32 2.67 31.9 35.1 27.7 9.8
4.6 95-150 1.25 2.67 31.9 35.6 28.4 9.0
4.7 150-190 1.24 2.70 .. .. ....
aDone by the coated-clod method.
34
0
-00
50 r~.
\\.100-
Q)
150
15- I
0
200I , I 40 50 60 70
% pore space
- Profile No. 1
&-.__tn_-. Profile No. 2
0 -0o-....- Profile No. 3
D---oJ---- Profile No. 4
Figure 6. Total pore space with depth
35
moisture retention values for profile numbers 1, 2 and 3. Profile
number 4 has somewhat lower values in the surface horizons (A horizons)
and these differences appear related with the clay increase with depth
However, data of the maximum available water expressed
in this profile.
a volume basis (g H20/lO0cc of soil) increased from profile number
in
The apparent increase in water availability1 to profile number 4.
to be correlated with the weathering stage and soil porosity.
seems
The data suggest that highly weathered soils with fine granular struc
ture have lower capacity to supply water to the plants than the less
weathered soils with blocky structure in the B horizon.
Chemical Properties
Soil Reaction
No The results of pH determinations are listed in Table
5.
apparent significant differences in the pH values measured in water
3. Profile number 4 showed found between profiles 1, 2 an,-were
slightly higher pH values.
The pH values determined in KC1 were always lower than the ones
Some differences among profiles are apparent when determined in water.
According to we compare the calculated A pH (pH in KCI-pH in H20).
Mekaru and Uheara (1972), when the A pH value is negative, the soil has
By this calculation, the negativea net negative electrical charge.
charge seems to increase from profile number 1 to profile number 4.
Organic Carbon
The highestOrganic carbon contents are reported in Table 5.
The highercontents were found in the Al horizon of profile
number 1.
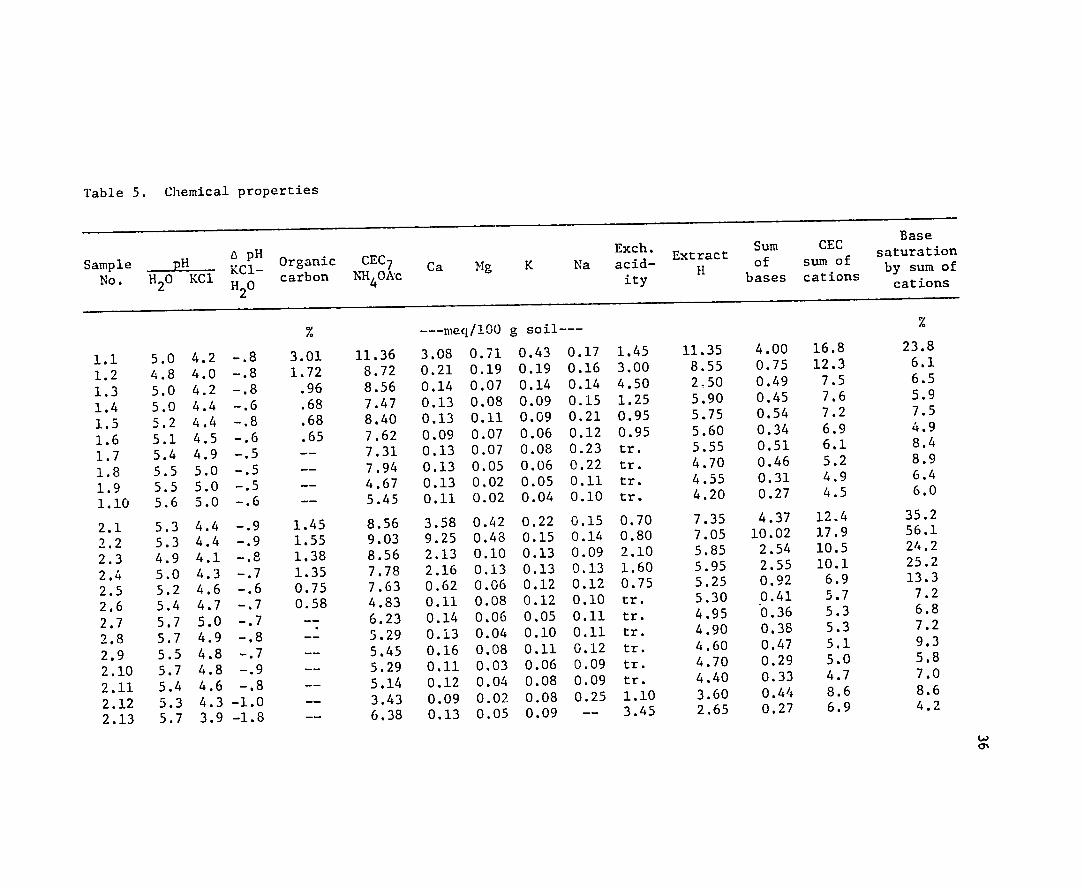
Table 5. Chemical properties
Sample No.
pH H20 KC1
8PH
KC1_ H20
Or a i
Organic carbon
E 7
CEC7 NH4OAc
Ca Mg K Na Exch. acid-ity
Extract
H Sum of bases
CEC Sum of cations
Base saturationsaturumiof
by sum of cations
1.1 1.2 1.3 1.4 1.5 1.6 1.7 1.8 1.9 1.10
2.1 2.2 2.3 2.4 2.5 2.6 2.7 2.8 2.9 2.10 2.11 2.12 2.13
5.0 4.8 5.0 5.0 5.2 5.1 5.4 5.5 5.5 5.6
5.3 5.3 4.9 5.0 5.2 5.4 5.7 5.7 5.5 5.7 5.4 5.3 5.7
4.2 -.8 4.0 -.8 4.2 -.8 4.4 -.6 4.4 -.8 4.5 -.6 4.9 -.5 5.0 -.5 5.0 -.5 5.0 -.6
4.4 -.9 4.4 -.9 4.1 -.8 4.3 -.7 4.6 -.6 4.7 -.7 5.0 -.7 4.9 -.8 4.8 -.7 4.8 -.9 4.6 -.8 4.3 -1.0 3.9 -1.8
%
3.01 1.72 .96 .68 .68 .65 ----
--
--
1.45 1.55 1.38 1.35 0.75 0.58
----
--
--
--
--
--
11.36 8.72 8.56 7.47 8.40 7.62 7.31 7.94 4.67 5.45
8.56 9.03 8.56 7.78 7.63 4.83 6.23 5.29 5.45 5.29 5.14 3.43 6.38
---meq/10 0
3.08 0.71 0.21 0.19 0.14 0.07 0.13 0.08 0.13 0.11 0.09 0.07 0.13 0.07 0.13 0.05 0.13 0.02 0.11 0.02
3.58 0.42 9.25 0.48 2.13 0.10 2.16 0.13 0.62 0.06 0.11 0.08 0.14 0.06 0.13 0.04 0.16 0.08 0.11 0.03 0.12 0.04 0.09 0.02 0.13 0.05
g soil---
0.43 0.17 0.19 0.16 0.14 0.14 0.09 0.15 0.09 0.21 0.06 0.12 0.08 0.23 0.06 0.22 0.05 0.11 0.04 0.10
0.22 0.15 0.15 0.14 0.13 0.09 0.13 0.13 0.12 0.12 0.12 0.10 0.05 0.11 0.10 0.11 0.11 0.12 0.06 0.09 0.08 0.09 0.08 0.25 0.09 --
1.45 3.00 4.50 1.25 0.95 0.95 tr. tr. tr. tr.
0.70 0.80 2.10 1.60 0.75 tr. tr. tr. tr. tr. tr. 1.10 3.45
11.35 8.55 2.50 5.90 5.75 5.60 5.55 4.70 4.55 4.20
7.35 7.05 5.85 5.95 5.25 5.30 4.95 4.90 4.60 4.70 4.40 3.60 2.65
4.00 0.75 0.49 0.45 0.54 0.34 0.51 0.46 0.31 0.27
4.37 10.02 2.54 2.55 0.92 0.41 0.36 0.38 0.47 0.29 0.33 0.44 0.27
16.8 12.3 7.5 7.6 7.2 6.9 6.1 5.2 4.9 4.5
12.4 17.9 10.5 10.1 6.9 5.7 5.3 5.3 5.1 5.0 4.7 8.6 6.9
%
23.8 6.1 6.5 5.9 7.5 4.9 8.4 8.9 6.4 6.0
35.2 56.1 24.2 25.2 13.3 7.2 6.8 7.2 9.3 5.8 7.0 8.6 4.2
0'
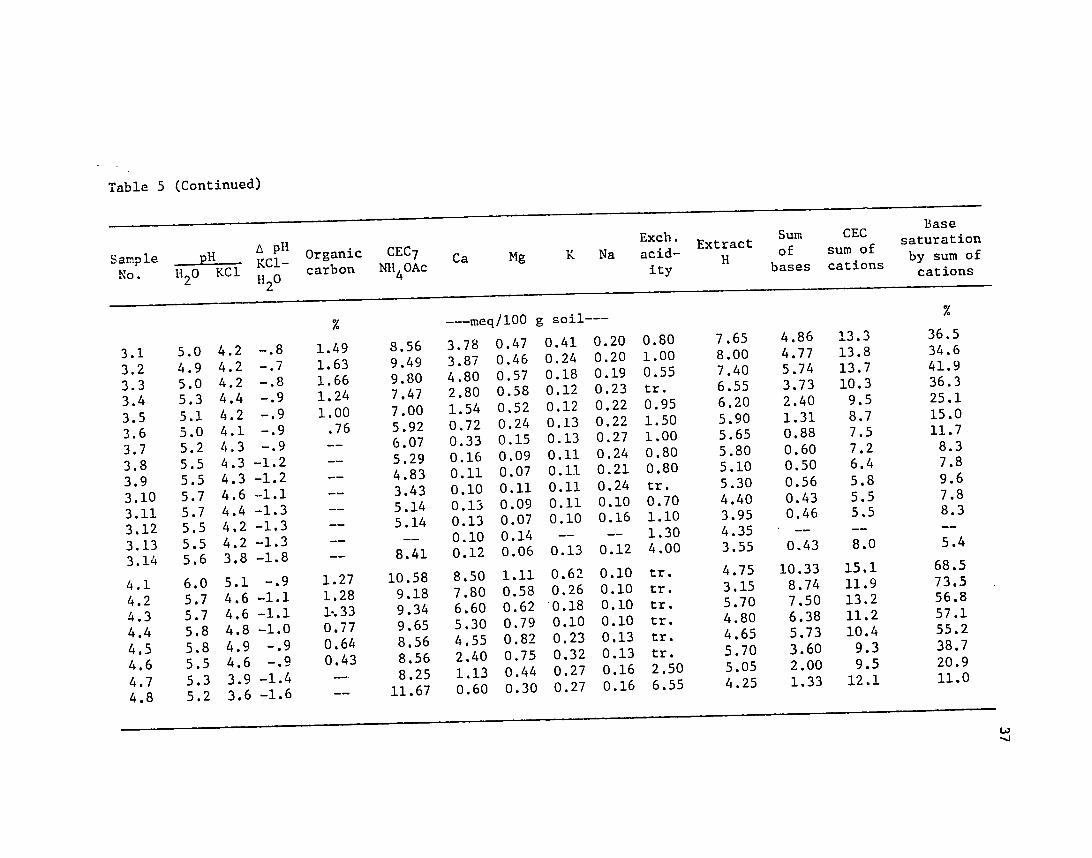
Table 5 (Continued)
Base
Sample 1-
OpHorganic CEC 7
Exch. acid- Extract
Sum of
CEC sum of
saturation by sum of
No. H20 KC1 HO0 carbon NII4OAc ity bases cations cations
% ---meq/lO0 g soil--
3.1 3.2 3.3 3.4 3.5 3.6 3.7 3.8 3.9 3.10 3.11 3.12 3.13 3.14
4.1 4.2 4.3 4.4 4.5 4.6 4.7 4.8
5.0 4.9 5.0 5.3 5.1 5.0 5.2 5.5 5.5 5.7 5.7 5.5 5.5
5.6
6.0 5.7 5.7 5.8 5.8 5.5 5.3 5.2
4.2 -.8
4.2 -.7 4.2 -.8 4.4 -.9
4.2 -.9 4.1 -.9 4.3 -.9 4.3 -1.2 4.3 -1.2 4.6 .-.1 4.4 -1.3 4.2 -1.3 4.2 -1.3
3.8 -1.8
5.1 -.9
4.6 -1.1 4.6 -1.1 4.8 -1.0 4.9 -.9 4.6 -.9
3.9 -1.4 3.6 -1.6
1.49 1.63 1.66 1.24 1.00 .76 ----
--
--
--
--
.----
1.27 1.28 1-.33 0.77 0.64 0.43
--
8.56 9.49 9.80 7.47 7.00 5.92 6.07 5.29 4.83 3.43 5.14 5.14
8.41
10.58 9.18 9.34 9.65 8.56 8.56 8.25
11.67
3.78 3.87 4.80 2.80 1.54 0.72 0.33 0.16 0.11 0.10 0.13 0.13 0.10
0.12
8.50 7.80 6.60 5.30 4.55 2.40 1.13 0.60
0.47 0.46 0.57 0.58 0.52 0.24 0.15 0.09 0.07 0.11 0.09 0.07 0.14
0.06
1.11 0.58 0.62 0.79 0.82 0.75 0.44 0.30
0.41 0.24 0.18 0.12 0.12 0.13 0.13 0.11 0.11 0.11 0.11 0.10
--
0.13
0.62 0.26 0.18 0.10 0.23 0.32 0.27 0.27
0.20 0.20 0.19 0.23 0.22 0.22 0.27 0.24 0.21 0.24 0.10 0.16
--
0.12
0.10 0.10 0.10 0.10 0.13 0.13 0.16 0.16
0.80 1.00 0.55 tr. 0.95 1.50 1.00 0.80 0.80 tr. 0.70 1.10 1.30
4.00
tr. tr. tr. tr. tr. tr. 2.50 6.55
7.65 8.00 7.40 6.55 6.20 5.90 5.65 5.80 5.10 5.30 4.40 3.95 4.35
3.55
4.75 3.15 5.70 4.80 4.65 5.70 5.05 4.25
4.86 4.77 5.74 3.73 2.40 1.31 0.88 0.60 0.50 0.56 0.43 0.46
--.
0.43
10.33 8.74 7.50 6.38 5.73 3.60 2.00 1.33
13.3 13.8 13.7 10.3 9.5 8.7 7.5 7.2 6.4 5.8 5.5 5.5
8.0
15.1 11.9 13.2 11.2 10.4 9.3 9.5 12.1
36.5 34.6 41.9 36.3 25.1 15.0 11.7 8.3 7.8 9.6 7.8 8.3 -
5.4
68.5 73.5 56.8 57.1 55.2 38.7 20.9 11.0

38
organic content in the superficial horizon of profile number 1 reflects
the forest cover on this site. Organic carbon content decreased with
depth in profile number 1.
Profile numbers 2, 3 and 4 have an increase in the organic carbon
content from the Apl to the Ap2 horizon. The higher amounts of organic
matter in the Ap2 horizon may be due both to the influence of the grass
root system and to the low porosity of these layers. It was recorded
that these sites were used as pastures for 40 years. The lower
porosity could preven': organic matter decomposition due to a decrease
in aeration while cultLv'ation has aerated the plow layer and enhanced
organic matter decomposition.
Contents of about 1% organic carbon were determined at depths of
65, 90 and 82 cm, respectively, for profile numbers 1, 2 and 3. In
profile number 4 organic carbon decrease to values of less than 1% at
a depth of 27 cm.
The relatively higher amounts of organic matter at depths of 1 m in
profile numbers 1, 2 and 3 suggest that faunal and floral pedoturbation
(Hole, 1961) either is greater in these profiles or that they had been
exposed longer at these propedoisotropic processes. Pedoturbation
processes probably play a definite role in the genesis of the soils
studied since high activity of ants and termites was noted in the area.
Cation Exchange Capacity and Base Saturation
The results of these determinations are listed in Table 5. Cation
exchange capacity values normally decrease with depth and this seems to
be correlated with a decrease in organic matter content. No apparent
differences were found between profile numbers 1, 2 and 3; they have
39
g of clay in the B horizons. The B2 values between 9 and 10 meq/lO0
horizons of profile number 4 has higher CEC values, in spite of having
The B21 horizon of this profile has relatively less organic carbon.
12.4 meq/100 g of clay which suggests higher activity of the clay
particles in this profile when compared with the three upper members of
the toposequence.
Base saturation values are extremely low in the subsurface
horizons of profile number 1. This soil has a 23.8% base saturation
value for the Al horizon which decreases sharply with depth.
For profile numbers 2, 3 and 4 the base saturation percentages,
the surface layers, also decrease with depth but the
with exception of
rate of decrease varies among profiles. Higher values were found to
greater depths in the lower toposequence members than in the upper
members of the toposequence.
Part of the increase in base content and base saturation among
the profiles is probably due to the use of lime and artificial fertilizers
lower members). However, it seems that in the cultivated sites (i.e.,
the use of lime and fertilizer cannot totally account for the increases
50 cm, nor the trend in base saturation increase. at depths such as
Profile number 4 shows considerably higher base saturation values
in the subsoil reaching 55.2% in the B21 horizon at a depth of 95 cm.
It is possible that, in addition to liming and fertilization,
other factors are involved in the observed base saturation increase
among profiles. Lateral migration of subsuperficial waters enriched in
to be one bases displaced from the upper part of the landscape
seems
The lateral migration of enriched solutions is even possible factor.
40
more apparent when we consider that the deepest samples analyzed in
status which excludes differencesall profiles have a very low base
in parent material composition as an explanation for the trend in base
saturation among profiles.
Mineralogy
Sand Mineralogy
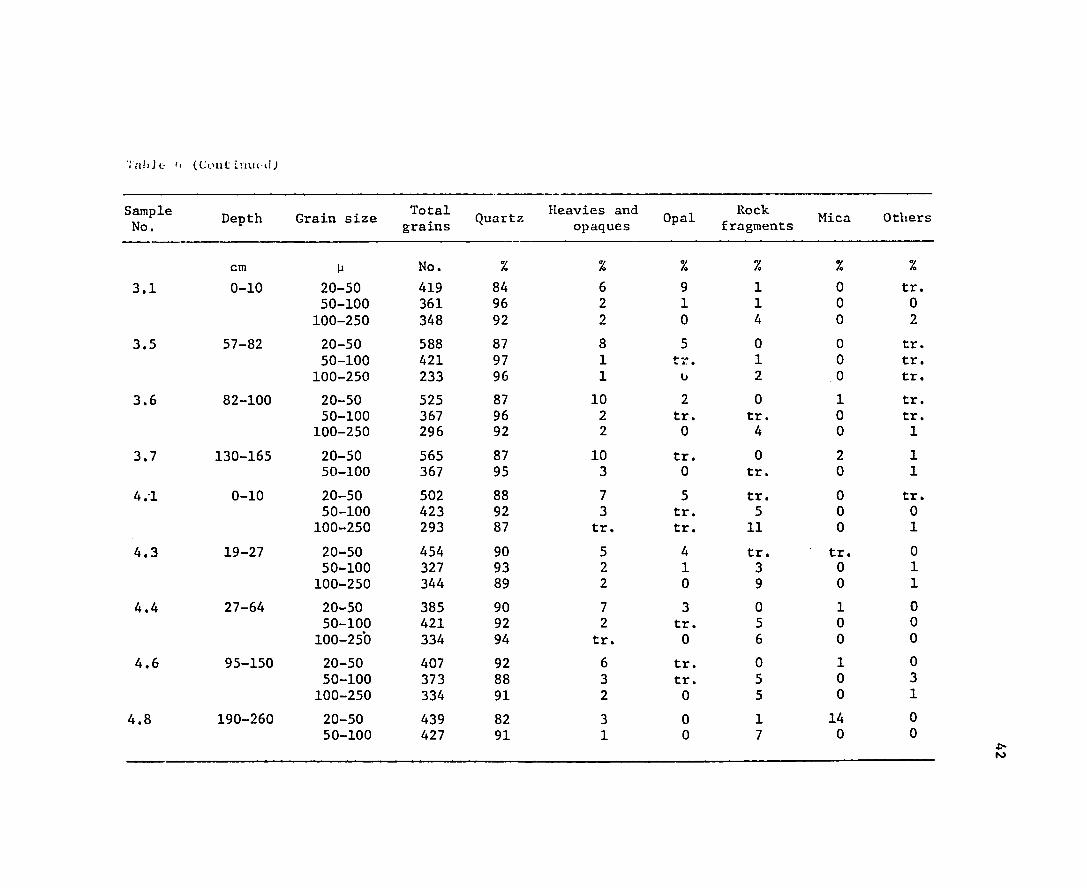
Table 6 presents the results of microscopic examination of fine
sand (100-250 p), very fine sand (50-100 p) and coarse silt (20-50 z)
particles.
Quartz was the dominant mineral in all the analyzed grain frac
tions. The quartz grains were mostly rounded in the fine and very fine
coarse silt grains were mostly angular quartzsands (50-250 p). The
Some of these angular grains can be interpreted as beingparticles.
fragments from larger particle sizes, broken during the repeat shaking
procedures done during the clay separation procedures. The separation
of the sands by sieving just after free iron removal in Kittrick's
method (1963) seems to be a desirable procedure for these soils in
order to avoid breakdown of sand particles.
The grains counted as "heavies plus opaques" were .the second
most common grains found and they were observed mostly in the 20 to 50
It was noticed that the content of these minerals tended tofractions.
It can be observeddecrease from profile number 1 to profile number 2.
also that there is a decrease of about 50% in the "heavies plus opaque
grains" from sample 2.12 to sample 2.13 and fro sample 4.6 to sample
a iithologic dis4.8. This sharp decrease suggests that there is
The presence of this discontinuity iscontinuity between these layers.
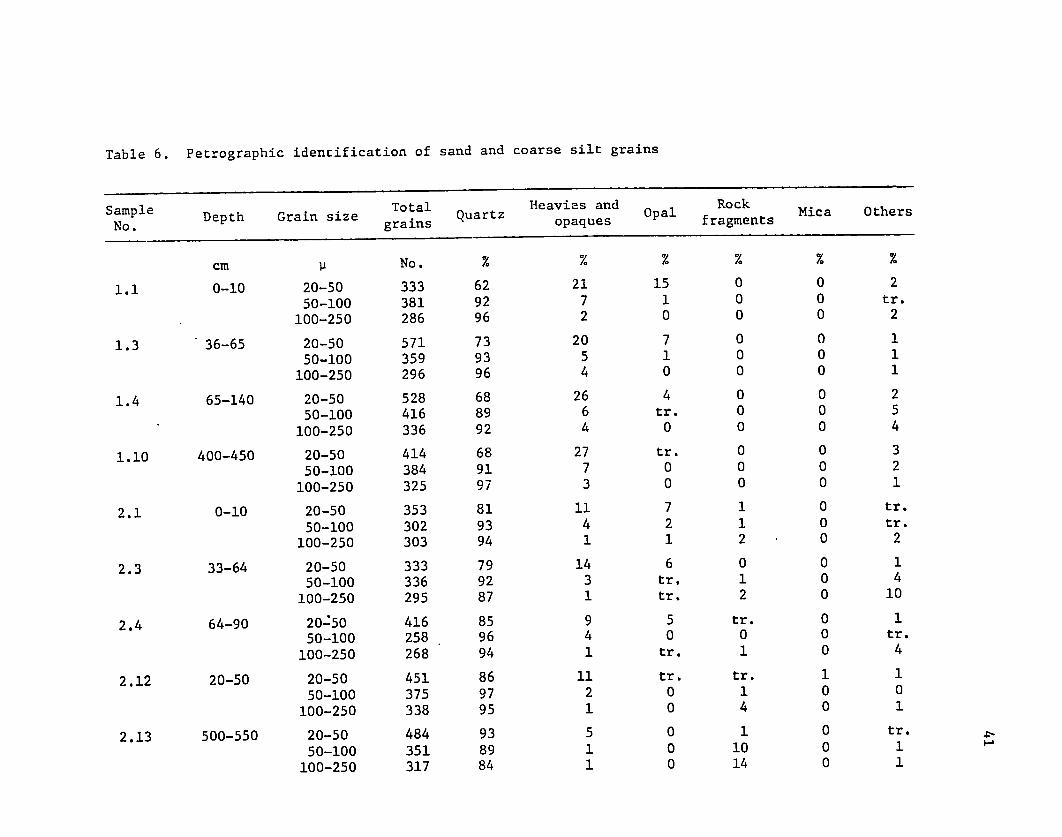
Table 6. Petrographic identification of sand and coarse silt grains
Sample No.
Depth Grain size Total grains
Quartz Heavies and opaques
Rock fragments
Mica Others
cm 1 No. % % % % %
1.1 0-10 20-50 333 62 21 15 0 0 2
50-100 381 92 7 1 0 0 tr.
100-250 286 96 2 0 0 0 2
1.3 36-65 20-50 50-100
571 359
73 93
20 5
7 1
0 0
0 0
1 1
100-250 296 96 4 0 0 0 1
1.4 65-140 20-50 50-100
528 416
68 89
26 6
4 tr.
0 0
0 0
2 5
100-250 336 92 4 0 0 0 4
1.10 400-450 20-50 414 68 27 tr. 0 0 3
50-100 384 91 7 0 0 0 2
100-250 325 97 3 0 0 0 1
2.1 0-10 20-50 353 81 11 7 1 0 tr.
50-100 302 93 4 2 1 0 tr.
100-250 303 94 1 1 2 0 2
2.3 33-64 20-50 50-100
333 336
79 92
14 3
6 tr.
0 1
0 0
1 4
100-250 295 87 1 tr. 2 0 10
2.4 64-90 20'50 50-100
416 258
85 96
9 4
5 0
tr. 0
0 0
1 tr.
100-250 268 94 1 tr. 1 0 4
2.12 20-50 20-50 50-100
451 375
86 97
11 2
tr. 0
tr. 1
1 0
1 0
100-250 338 95 1 0 4 0 1
2.13 500-550 20-50 50-100
484 351
93 89
5 1
0 0
1 10
0 0
tr. 1
100-250 317 84 1 0 14 0 1
Sample Depth No.
cm
3.1 0-10
3.5 57-82
3.6 82-100
3.7 130-165
4.1 0-10
4.3 19-27
4.4 27-64
4.6 95-150
4.8 190-260
Grain size
20-50 50-100 100-250
20-50 50-100
100-250
20-50 50-100
100-250
20-50 50-100
20-50 50-100 100-250
20-50 50-100 100-250
20-50 50-100
100-25b
20-50 50-100
100-250
20-50 50-100
Total grains
No.
419 361 348
588 421 233
525 367 296
565 367
502 423 293
454 327 344
385 421 334
407 373 334
439 427
Quartz
%
84 96 92
87 97 96
87 96 92
87 95
88 92 87
90 93 89
90 92 94
92 88 91
82 91
Heavies and opaques
%
6 2 2
8 1 1
10 2 2
10 3
7 3
tr.
5 2 2
7 2
tr.
6 3 2
3 1
Opal
%
9 1 0
5 tr. U
2 tr. 0
tr. 0
5 tr. tr.
4 1 0
3 tr. 0
tr. tr. 0
0 0
Rock fragments
%
1 1 4
0 1 2
0 tr. 4
0 tr.
tr. 5
11
tr. 3 9
0 5 6
0 5 5
1 7
Mica
%
0 0 0
0 0 0
1 0 0
2 0
0 0 0
tr. 0 0
1 0 0
1 0 0
14 0
Others
tr. 0 2
tr. tr. tr.
tr. tr. 1
1 1
tr. 0 1
0 1 1
0 0 0
0 3 1
0 0
Zs
43
reinforced by the fact that field descriptions (Appendix A) recorded
stone lines and a sharp break in color between the clayey decomposed
rock and the overlying earthy material.
Some elongated angular rock fragments were found in the 100-250 i
fraction in profile numbers 2, 3 and 4. Thin section observation showed
that these grains are composed predominantly of quartz with some amount
of "heavies" and some partially weathered minerals. None of these
grains were found at any depth in profile number 1. The decomposed
clayey sedimentary rdck contained greater amounts of these grains than
was also r :ed that the amount of these rockthe overlying soil. It
fragments increased from profile n-nber 2 to profile number 4.
The upper to the lower member of the toposequence decreases in
content of "heavy plus opaque" grains and increased in content of rock
fragments. Also, the clayey sedimentary rock has less "heavies plus
opaques" and more "rock fragments" than the overlying soil material,
suggesting that profile numbers 2, 3 and 4 have developed in a
When sediments under geomorphic surcolluvial parent material.
face B (Figure 2) were deposited, this colluvial material apparently
received contributions both from the sediments underlying geo
s ur fa ce A and from the clayey sedimentary rock, themorphic
trend in rock fragments and "heavy plus opaques" also suggests that
the parent material of profile numbers 2, 3 and 4 received different
amounts of the clayey sedimentary rock and that these amounts increase
from profile number 2 to profile number 4.
Opaline silica grains were another kind of mineral identified in
most samples, predominantly in the coarse silt fraction. Opaline

44
silica was identified by their isotropic character and also their index
The conof refraction at 1.4, much lower than that of
quartz grains.
Similar figuration of these grains often resembles
plant remains.
grains were described in soils by Smithson (1958, 1959) which referred
them as been opal phytoliths.
The presence of opal phytoliths at any appreciable depth in a
soil profile was suggested by Oberholster (1968) as evidence of pedoturba-
In the profiles studied,plant opal grain contents in the 20-50
tion.
5% for profile64-140 cm for profile number 1;fraction were 4% at
numbers 2 and 3 at 64-90 cm and 57-82 cm, respectively, and 3% at 27-
These data suggest that some form of 64 cm in profile number 4.
a greater depth in the pedoturbation has been more active and to
three upper members of the toposequence since the B3 horizon of profile
number 4 (95-150 cm depth) showed only traces of opal grains.
Most of the grains counted as "others" were rounded light yellow
An X-ray analysis of these grains showed appreciable
aggregates.
amounts of gibbsite, some quartz and kaolinite and several peaks between
17 and 9.8 Angstroms with a maximum intensity at 12.4 Angstroms were
also observed.
Observations of the coarse sand fractions under bionocular micro
scope showed the presence of rounded sesquioxide concretions which
These sesquioxide concretions according were present in all samples.
to Stoops (1968) may be interpreted as pedorelicts and point to a
polycyclic character of formation of the soils studied.
45
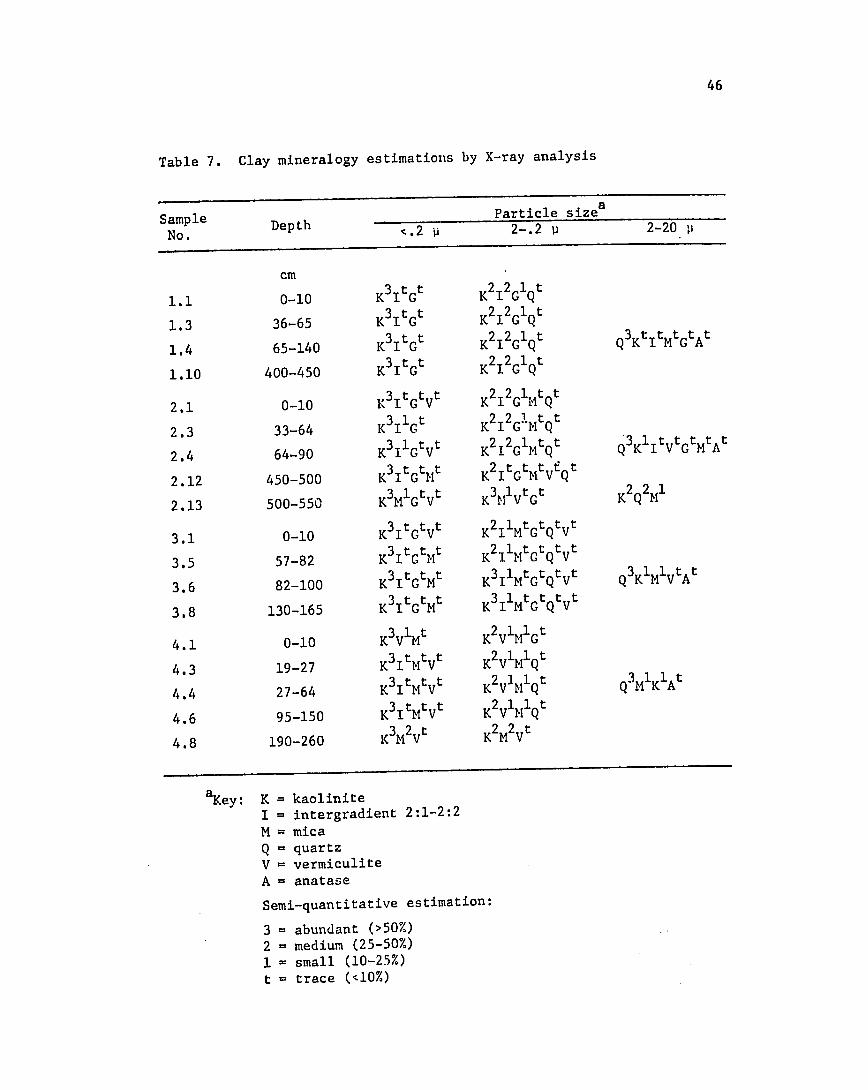
Clay and Fine Silt Mineralga.
Table 7 summarizes the results obtained from the interpretation
of X-ray diffractograms of clays and silt fractions from some selected
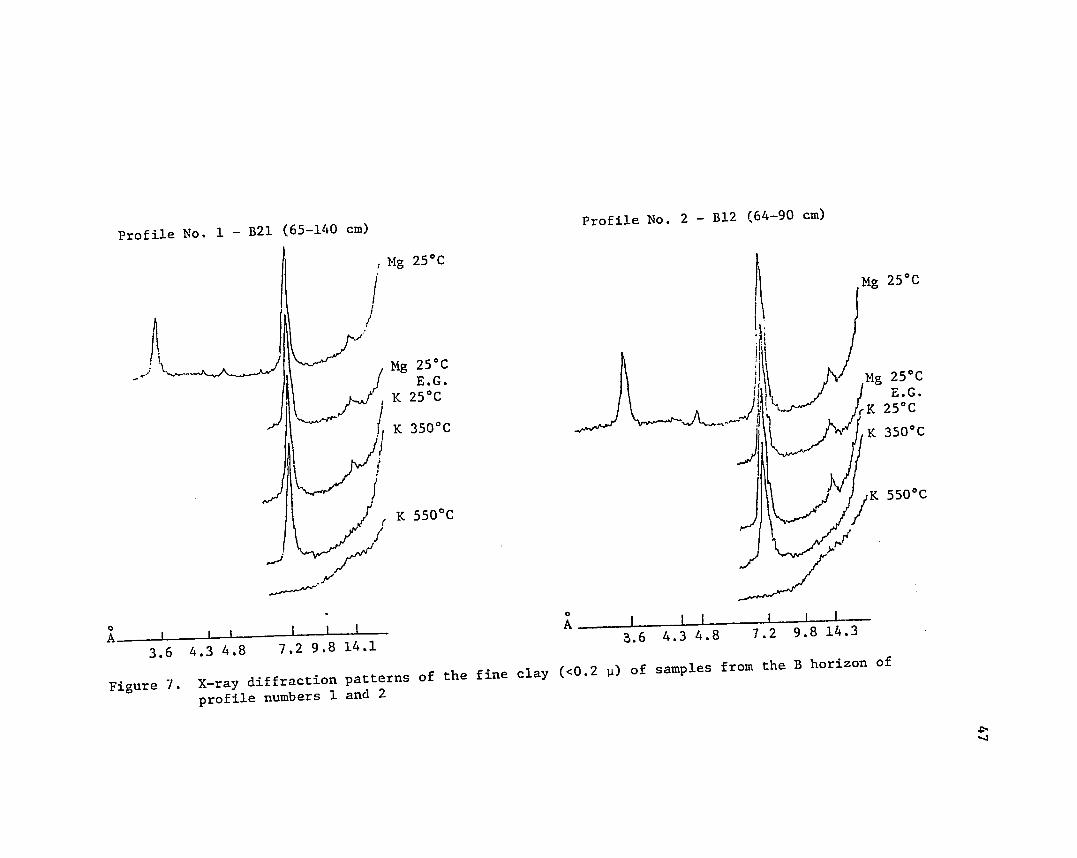
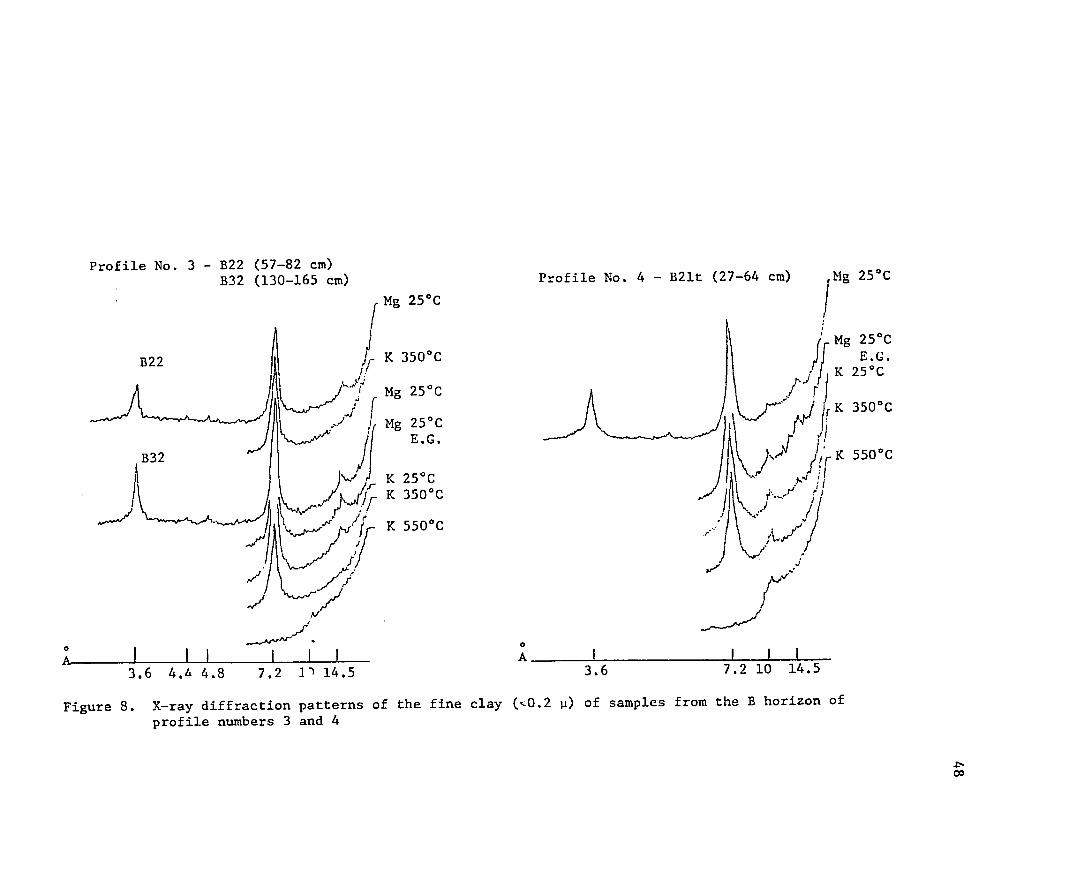
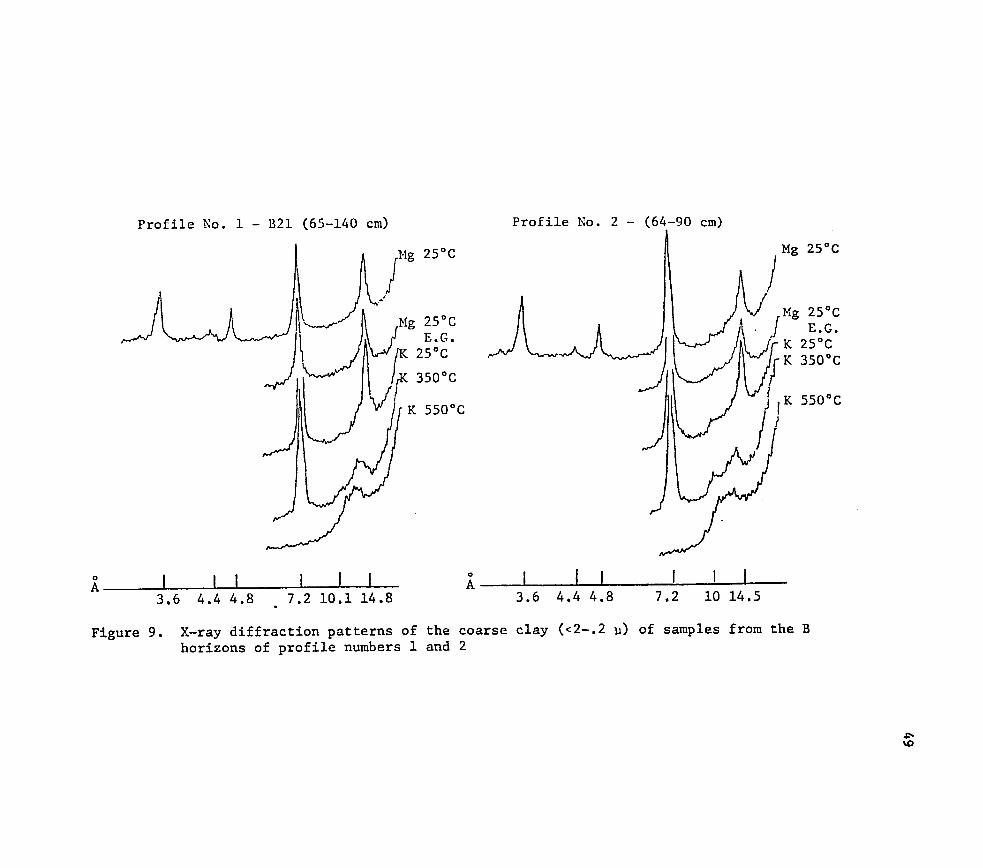
Figures 6, 7, 8 and 9 are diffractograms for the fine coarse
samples.
clay particles for the B horizons and Figure 10 contains diffractograms
for the coarse clay fraction of the clayey sedimentary rock.
Clay mineralogy estimations from the X-ray diffractograms indicate
that kaolinite is the dominant clay mineral in all fractions from all
Other clay minerals estimated to be present in analyzed samples.
amounts between 10 and 50% were the chlorite-vermiculite intergradient
minerals as defined by Jackson (1964), gibbsite and vermiculite.
(less than 10%) in Quartz was detected to be present only as traces
the coarse clay fraction.
Chlorite-vermiculite intergrade minerals were found mainly in the
I and 2 (Figure 8). They were coarse clay fractions of profile numbei
The chloriteestimated to be present in amounts ranging from 25 to 50%.
vermiculite intergrade contents in the total clay fraction of the B2
horizons were estimated to be from 10 to 25% for profile numbers 1 and
The 2, 5 to 10% for profile number 3 and 3 to 6% for profile
number 4.
formation of intergradient 2:1-2:2 layer silicates in highly weathered
acid soils might be explained by the precipitation of hydroxy Al and
sesquioxides in the interlayer space of vermiculite (Jackson, 1964).
The presence of these minerals in considerable amounts in the more
intensively weathered profiles confirms the observations that even under
moist tropical conditions vermiculite withstands severe weathering condi
tions when considerable Al and Fe interlayering is present (Soil Survey
46
2-20
Q3KtItMtGtAt
Q3KItVtGtMtAt
K2Q2MI
Q3K1M1VtAt
Q3MIK1At
Table 7.
Sample No.
1.1
1.3
1.4
1.10
2.1
2.3
2.4
2.12
2.13
3.1
3.5
3.6
3.8
4.1
4.3
4.4
4.6
4.8
Clay mineralogy estimations by X-ray analysis
Depth
cm
0-10
36-65
65-140
400-450
0-10
33-64
64-90
450-500
500-550
0-10
57-82
82-100
130-165
0-10
19-27
27-64
95-150
190-260
sizeac.Particle
.2 i
K31tGt
K31tGt
K31tGt
K31tG t
K31tGtVt
K311Gt
tK311Gtv
K31tG tMt
tVtK3M1G
K31 tGtVt
K31tGtMt
K31tGtMt
K31tGtMt
K3V1Mt
K31tMtVt
K31 tMtvt
K31tMtVt
K3M 2Vt
2-.2
K212G1Q t
K212GIQ t
K212G1Q t
K212G1Qt
QtK212G1
K212GiMtQt
K212GIMtQt
K21tGtMtVfQt
K3M1VtGt
VK211MtGtQt t
K211MtGtQ tvt
K311MtGtQtvt
K311MtGtQtvt
K2V1MIGt
K2VIMIQ t
K2VIM1Q t
K2V 1 Qt
K2M2Vt
aKey: K = kaolinite I = intergradient 2:1-2:2 M = mica Q = quartz V = vermiculite A = anatase
Semi-quantitative estimation:
3 = abundant (>50%) 2 = medium (25-50%)
=1 small (10-25%) t = trace (<10%)
B12 (64-90 cm)Profile No. 2 B21 (65-140 cm)Profile No. 1 -
Mg 25-C
Mg 250C
2 .- /Mg 25C Mg 250C E.G.E E.G.
K25 C 250C
K 350-CK K 3500C
K 300Cr
K 5500C
/ K 5500C
A 0
7.2 9.8 14.33.6 4.3 4.8 7.2 9.8 14.13.6 4.3 4.8
X-ray diffraction patterns of the fine clay (<0.2 U) of samples
from the B horizon of
Figure 7. profile numbers 1 and 2
Profile No. 3 - B22 (57-82 cm) B32 (130-165 cm) Profile No. 4 - B21t (27-64 cm) Mg 25"CJMg2525
E.G.B22 y K 3500C IT Mg 2500
Mg 2 K 350 0C
.) Mg 25-C
5500CB32EK
2500CPKiK K 3500C " rj
7/ "
0 0'
A I I I I I I A I I I
3.6 7.2 10 14.53.6 4.4 4.8 7.2 11 14.5
) of samples from the B horizon ofFigure 8. X-ray diffraction patterns of the fine clay (<0.2
profile numbers 3 and 4
50
Profile No. 1- B21 (65-140 cm) Profile No. 2- (64-90 cm)
Mg 25*CI25-C
Mg 250 C Mg 250 C
- E.G. E.G.
I K 250C/ K 250C K 350 °C
'JI,r, 350-C
K 5500CK 550*C
0 A 0
A II I II 7.2 10.1 14.8 3.6 4.4 4.8 7.2 10 14.53.6 4.4 4.8
Figure 9. X-ray diffraction patterns of the coarse clay (<2-.2 P) of samples from the B
horizons of profile numbers 1 and 2
B22 (57-82 cm)Profile No. 3 -
B32 (130-165 cm) Profile No. 4 - B21t (27-64 cm)
Mg 25-C Mg 250C
B2 g2* Mg 25*C E.G.
E.G. K 250 C3500C K35°
i ,,, Mg 20-C#4 CC~~~~ K K 350J K
B32
K K 350 0 C fK 550C
K550*C
S / ti
I I I I I o.
3.3 3.6 4.4 4.8 7.2 10 14.5 3.3 3.6 5 7.2 10 14.5
Figure 10. X-ray diffraction patterns of the coarse clay (<2-.2 ) of samples from the B horizons of profile numbers 3 and 4
C

Profile No. 4 - (190-260 cm)Profile No. 2 - (520-550 cm)
_ _iA _
3.4 3.6
Figure 11.
Mg 250CMg 25*C
K 25°C
E.G.
K 3500CK 25.C/
K 350*C K 5500C
K 5500C /J
Mg 25*C E.G.
_ _ _ _ _ _ _ _ I I I II 5 7.2 10 14.5 3.3 3.6 5 7.2 10
X-ray diffraction patterns of the coarse clay fraction (--2-.2 u) from the weathered
bedrock under profile numbers 2 and 4
L-.

52
Staff, 1970). Contents of 2:1-2:2 intergradient minerals were reported
for highly weathered soils of the southeastern coastal plains of the
Colombian Llanos Orientale!,United States (Fiskell and Perkins, 1970),
(Guerrero, 1971), Minas Geris State, Brazil (Moura Filho and Buol,
1972) and Panama (Reneau, 1972).
traces in profile numbers 2 and 3Mica and vermiculite appeared as
in the coarse clayand in amounts estimated to be between 10 and 25%
of profile number 4.
Data for quantitative estimation of gibbsite, kaolinite and amor-
Figure 12 shows thermophous aluminous-silicates are given in Table 8.
grams for the fine and coarse clay fractions of one B2 horizon from
each profile.
The D.T.A. data estimates that kaolinite constitutes about 80% of
Inthe fine clay fraction. Profile number 4 presents smaller values.
the coarse clay fraction kaolinite was always present in smaller amounts,
except for sample 4.6, usually about 50%. Profile number 4, again,
showed the lowest values for kaolinite. Kaolinite content varied
among horizons of same profiles but the quantitative limitations of this
determination make any observation on this subject uncertain. It
appears that the only apparent difference in kaolinite pontent among
The decrease in kaoliniteprofiles is a decrease in profile number 4.
in this profile must be followed by an increase in mica and vermiculite
evidenced by the X-ray diffractograms.as
Data for gibbsite content are the best comparisons among profiles
since this mineral can be detected by differential thermal analysis
with good accuracy (MacKenzie, 1957).
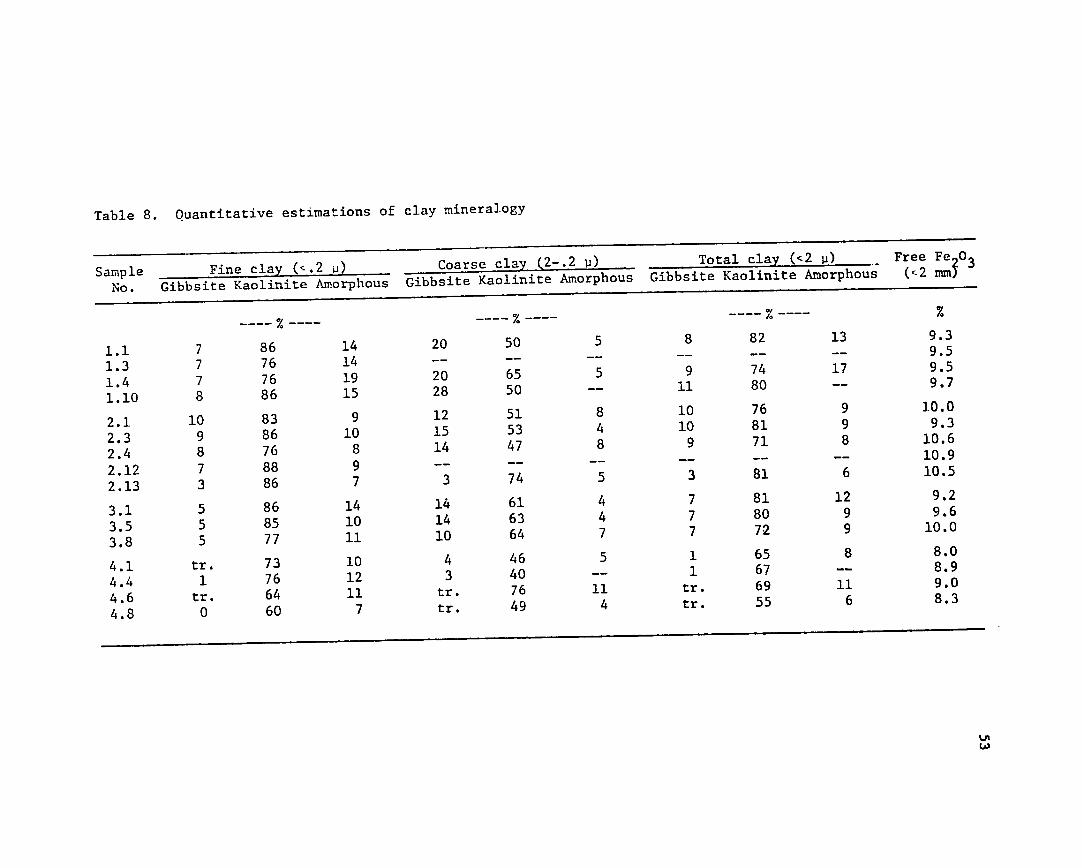
Table 8. Quantitative estimations of clay mineralogy
Sample No.
Fine clay (-.2 P)
Gibbsite Kaolinite Amorphous Coarse clay (2-.2 ji)
Gibbsite Kaolinite Amorphous Total clay (<2 P)
Gibbsite Kaolinite Amorphous Free Fe 0 (,2 mm. 3
1.1 7 86 14 20 50 5 8 o,
82 13 9.3
9.5 1.3
1.4 1.10
2.1 2.3 2.4
7
7 8
10 9 8
76
76 86
83 86 76
14
19 15
9 10 8
--
20 28
12 15 14
65 50
51 53 47
5 --
8 4 8
......
9 11
10 10 9
--
74 80
76 81 71 --
17 --
9 9 8
--
9.5 9.7
10.0 9.3
10.6 10.9
2.12 2.13
7 3
88 86
9 7 3
--
74 --
5 3 81 6 10.5
3.1 3.5 3.8
4.1 4.4 4.6 4.8
5 5 5
tr. 1 tr. 0
86 85 77
73 76 64 60
14 10 11
10 12 11 7
14 14 10
4 3
tr. tr.
61 63 64
46 40 76 49
4 4 7
5 --11 4
7 7 7
1 1
tr. tr.
81 80 72
65 67 69 55
12 9 9
8 --11 6
9.2 9.6
10.0
8.0 8.9 9.0 8.3
LA
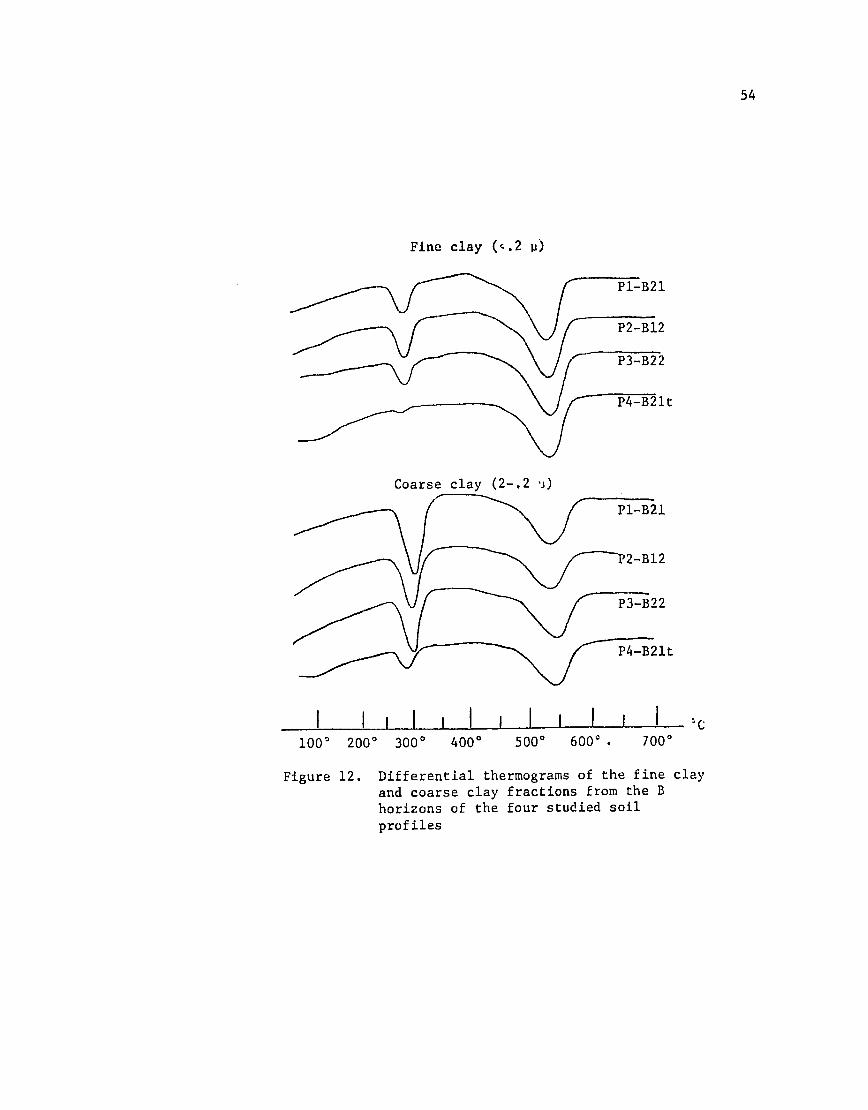
54
Fine clay (<.2 P)
PI-B21
Coarse clay (2-.2 j)
"Pl 21t
P3-B22
I II I I,lC ° 100 2000 3000 4000 5000 6000. 7000
Figure 12. Differential thermograms of the fine clay and coarse clay fractions from the B horizons of the four studied soil profiles
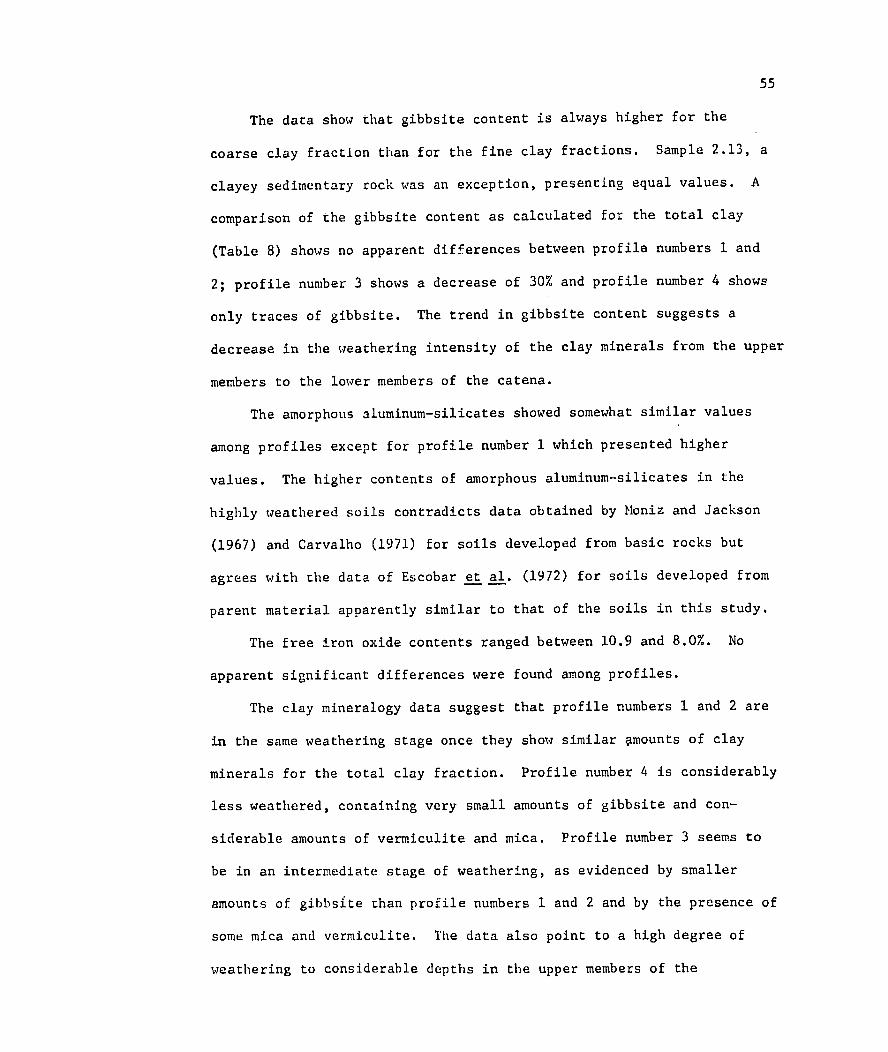
55
The data show that gibbsite content is always higher for the
coarse clay fraction than for the fine clay fractions. Sample 2.13, a
clayey sedimentary rock was an exception, presenting equal values. A
comparison of the gibbsite content as calculated for the total clay
(Table 8) shows no apparent differences between profile numbers 1 and
2; profile number 3 shows a decrease of 30% and profile number 4 shows
only traces of gibbsite. The trend in gibbsite content suggests a
decrease in the weathering intensity of the clay minerals from the upper
members to the lower members of the catena.
The amorphous aluminum-silicates showed somewhat similar values
among profiles except for profile number 1 which presented higher
values. The higher contents of amorphous aluminum-silicates in the
highly weathered soils contradicts data obtained by Moniz and Jackson
(1967) and Carvalho (1971) for soils developed from basic rocks but
agrees with the data of Escobar et al. (1972) for soils developed from
parent material apparently similar to that of the soils in this study.
The free iron oxide contents ranged between 10.9 and 8.0%. No
apparent significant differences were found among profiles.
The clay mineralogy data suggest that profile numbers 1 and 2 are
in the same weathering stage once they show similar 4mounts of clay
minerals for the total clay fraction. Profile number 4 is considerably
less weathered, containing very small amounts of gibbsite and con
siderable amounts of vermiculite and mica. Profile number 3 seems to
be in an intermediate stage of weathering, as evidenced by smaller
amounts of gibbsite than profile numbers 1 and 2 and by the presence of
some mica and vermiculite. The data also point to a high degree of
weathering to considerable depths in the upper members of the
56
toposequence since samples 1.10 and 2.12 at 450 and 500 cm, respectively,
did not show considerable difference in the clay mineralogy when com
pared to the overlying soil. The uniformity in the clay mineralogy
among profile horizons and the high degree of weathering at depths
such as 500 cm suggests that the profiles developed from a parent
material which was brought in place already fairly weathered and that
little variation in the clay mineralogy occurred except for the pos
sible formation of chlorite-vermiculite intergradient minerals in the
three uppermost members and vermiculite in profile number 4. This
hypothesis is reinforced by the increases in mica content between the
red soil material and the immediately overlying clayey sedimentary
rock which suggests lithological discontinuities.
According to the sand mineralogy data, profile numbers 2, 3 and 4
have probably received contributions from the micaceous clayey sedi
mentary rock. This contribution is appareitly greater in profile
number 4 and this could be the explanation for the presence of
vermiculite and mica in this profile. The preservation of mica and
vermiculite is also suggested by the increase in base saturation,
probably due to lateral migration of subsurface waters, and by its
lower porosity. These conditions suggest longer contact of percolating
water with the soil and higher silica concentrations which would enhance
the stability of mica and vermiculite.
None of the analytical data seems to be sufficient to verify
whether or not profile number 1 was developed over the Tubarao series
sediments or over a younger detrital deposit which, according to
Penteado (1969) normally underlies the Rio Claro surface. However,
57
the uniformity in the clay and sand mineralogy data to a depth of 450
the presence of sparse rounded polished sesquioxidiccm, as well as
nodules, interpreted as pedorelicts, seems to indicate that profile
number 1 is developed over a detrital deposit.
58
Figure 13. Photomicrograph of a thin section from the B22 horizon of profile number 1 (without crossed nicols) (IIOX magnification)
Figure 14. Photomicrograph of a thin section from the B22 horizon of profile number 1 (with crossed nicols) (lOX magnification)
59
Figure 15. Photomicrograph of a thin section from the B22 horizon of profile number 3 (without crossed nicols) (43X magnification)
Figure 16. Photomicrograph of a thin section from the B33 horizon of profile number 3 (without crossed nicols) (43X magnification)

60
Figure 17. Photomicrograph of a thin section from the B22t horizon of profile number 4 (without crossed nicols) (ilOX magnification)
Figure 18. Photomicrograph of a thin section from the B22t horizon
of profile number 4 (with crossed nicols) (11OX magnification)
61
SOIL CLASSIFICATION
the U. S. soilThe classification of the soils according to
follows. taxonomy system (Soil Survey Staff, 1970) is as
Diagnostic Horizons and Soil Orders
Profile Number 1
This profile prespats an ochric epipedon over. an oxic horizon.
The ochric epipedon is 36 It is thus classified in the Oxisol order.
cm thick and includes both Al and A3 horizons. The lower epipedon
cm was determined according to the water-dispersibleboundary at 36
clay data (Table 1) which show amounts lower than 5% in the Bl horizon.
Profile Number 2
This profile also presents an ochric epipedon over an oxic
The lower boundary of the ochric horizon and is classified as Oxisol.
epipedon was set at 64 cm depth, as determined by the water-dispersible
are lower than 5% in the B12 horizon.clay data which
Profile Number 3
This profile presents an ociric epipedon over an argillic horizon
at 1.8 m from the soil surface.and base saturation is lower than 35%
The ochric epipedon embraces theIt is thus classified as an Ultisol.
Apl, Ap2 and Bl horizons which did not show any evidence of clay illuvia-
The lower boundary of the argillic horizon was set at the 100 cm
tion.
depth on the basis of clay iluviation evidences from thin section
analysis. Below the argillic horizon there is an oxic horizon with
composition and morphology very similar to the oxic horizons of pro
file numbers 1 and 2.
62
Prefile Number 4
This profile presents an ochric epipedon 27 cm thick over an
argillic horizon which is less than 35% base saturated at 1.8 m below
the surface. It is thus classified in the Ultisol order.
Soil Moisture Regimes
The hydrologic balance (Figure 3) shows that there is a dry season
with a total water deficit of 42 mm and comprising mainly the months of
June, July, August and September.
The definition for the ustic moisture regime says that the soil
has to have the moisture control section dry in some or all parts for
more than 90 cumulative days in most years (Soil Survey Staff, 1970).
According to the Soil Survey Staff (1970) (p. 3--47):
One may assume that a soil at field capacity, with 200 m in storage,will have some part of its control. section dry after 75 mm of evapotranspiration if there is no additional precipitation.
Under the above considerations the moisture regime is udic since
the hydric balance shows that the actual evapotranspiration during the
dryer months is always higher than precipitation (which implies that
there is always some stored moisture) and only in one month (September)
does the difference between evapotranspiration and precipitation for the
dry period :xceeds 75 mm. It is also noted that perennial crops such
as coffee and oranges are grown in the area without irrigation.
Classification at the Subgroup Level
Profile numbers 1 and 2 contain less than 16 kg of organic carbon 2
per m to a depth of 1 m, and have CEC values in the B horizon ranging
between 9 and 10 meq/100 g of clay and classified in the great group
63
These profiles fit all definitiona for the Typic subgroupHaplorthox.
except that they have weak subangular blocky struc ure in the upper
part of the oxic horizon This characteristic sets them apart from
to be classified as Tropeptic Haplorthox.the Typic subgroup
The Trop~ptic Haplorthox being considered a subgroup intergrading
towards the Inceptisol order does not seem to be very well suited for
these soils since they have massive appearance on fresh pits, very
fine granular structure in the major part of the oxic horizon, no
Otherwise profile number weatherable minerals and they are very deep,
2 seems to be intergrading more towards the Ultisol order, because
of a B1 horizon with very few oriented clay bodies and moderate blocky
structure and because its position on the landscape close to less
weathered Ultisols.
Profile number 3 has an argillic horizon containing more than 0.9%
organic carbon in the upper 15 cm and the clay distribution is such that
the percentage of clay does not decrease from its maximum by more than
20% of that maximum within 1.5 m of the soil surface, These character
istics classify this soil as a Palehumult. Because of the CEC less
than 24 meq/100 g of clay, this soil is classified in the Orthoxic
The Orthoxic subgroup being considered one intE:-Palehumult subgroup.
grading towards the Orthox suborder seems to agree from a genetic stand
point with the composition, morphology and position in the toposequence,
Profile number 4 has less than 0.4% of organic carbon in the upper
15 cm of the argillic horizon and the clay distribution does not
that maximum withdecrease from its maximum amount by more than 20% of
in 1.5 m of the mineral surface. These characteristics classify this

64
soil in the Paleudult great group. It fits also in all characteristics
defined for the Typic Paleudult subgroup.
Classification at the Family Level
Particle Size Classes
All profiles have more than 60% clay in the control section and
thus are in the very fine clayey family.
Mineralogy Classes
The ratio of percent extractable iron oxide and gibbsite to per
cent of clay is 0.21 for profile numbers 1 and 2, 0.20 for profile
number 3 and 0.12 for profile number 4. The ratios equal to or
above 0.2 for profile numbers 1, 2 an d 3 place them into the oxidic
mineralogy class. Profile number 4 is classed as kaolinitic due to the
dominance of kaolinite in the clay fraction.
Soil Temperature Classes
Soil temperature a t 5 0 cm depth may be estimated by the mean
annual temperature (Smith, 1964). According to the climatic data
(Table 1), the mean annual temperature is 20.1C and the difference
" between mean summer and mean winter temperature is 4.9*C . These data
place the soils in the isothermic temperature class.
65
SUIMARY AND CONCLUSIONS
This study attempts to characterize four soil profiles located in
The soils were sampled along a 550 transect S'o Paulo State, Brazil.
and field observations indicated that they represent the major members
of an Oxisol-Ultisol toposequence.
located on the upper part of the landscape on Profile number 1 was
a slope of 0-2% and has morphological characteristics of an Oxisol.
Profile number 4 was located in the lower part of the toposequence on
Proa slope of 8% and has morphological characteristics
of an Ultisol.
file numbers 2 and 3 have morphological characteristics of both these
two soil orders.
Geomorphic evidence and petrographic sand studies suggest that all
soils were developed in a detrital material brought in place as pedi
sediment or colluviun. Lithological discontinuities were evident in
profile numbers 2 and 4. The sand mineralogy also suggests that pro
file numbers 2, 3 and 4 have developed from parent material which had
received an increased amount of micaceous clay sedimentary rock from
higher topographic positions.
a decrease in the extent of weathering from thp upper
There is
member to the lower member of the toposequence as revealed by the
increase in the silt/clay ratio, decrease in following evidence:
gibbsite content and increase in mica and vermiculite content.
Profile numbers 1 and 2 did not show any significant increase in
clay content in the B horizons. A very few illuviated clay bodies were
horizon of profile number 2. Profile numbers 3 and detected in the B
66
4 exhibited significant amounts of clay illuviation. The greatest
degree of clay illuviation was found in profile number 4.
According to field descriptions and thin section analysis, a trend
in structural definitions was found among the profiles. The develop
ment of blocky structure was maximal in the lower member and minimal
in the upper member of the toposequence which contained predominantly
very fine granular and mammilated blocks in the B horizons. These
changes in structure appear to be correlated with the bulk density
values which were below 1.0 g/cc for the very friable horizons with
very fine granular structure.
Chlorite-vermiculite intergradient clay minerals, gibbsite, mica
and vermiculite were found to be concentrated in the coarse clay frac
tions. The fine clay fraction is made up predominantly of kaolinite
clay minerals. The chlorite-vermiculite intergradient was found mainly
in the two upper members of the toposequence and mica and vermiculite
in the lower member. This suggests that the chlorite-vermiculite inter
gradient minerals are formed and preserved under highly weathering
conditions as a result of the precipitation of aluminum and iron oxides
in the interlayer space of vermiculite.
Although all the soils presented similar textures, they differ in
other physical properties such as probable maximum available water
holding capacity, structure and porosity.
Profile numbers 1 and 2 have an oxic horizon and are classified
as very fine, clayey, oxidic, isothermic Tropeptic IHaplortox. Profile
number 3 has an argillic horizon which overlies an oxic horizon. It is
classified as a very fine clayey, oxidic, isoLhermic Orthoxic
Palehumult. Profile number 4 has an argillic horizon and was
67
a very fine clayey, kaolinitic, isothermic Typicclassified as
Palehudult.
Clay illuviation is more pronounced in the less weathered lower
member of the toposequence than in the upper members of the toposequence
None of the datum obwhich is reverse in the weathering sequence.
tained seem to clearly explain the absence of clay illuviation in the
The occurrence in the primary peds of more highly weathered profiles.
the oxic horizon of an almost isotropic plasma without any apparent
voids seems to indicate that the main plasma components, fine
kaolinitic clay, iron oxides and aluminum oxides, are highly flocculated
This may preclude any clay dispersion and consequent
and compacted.
illuviation.
The position of the soils on the toposequence shows that there
from the Oxisols to the Ultisols with an increase in is a gradation
an increase in the depth and eventual loss of the oxic horizon and
The oxic horizon has its greatestthe argillic horizon.expression of
degree of expression where the surface is geomorphically older, where
there is a thicker and more weathered soil mantle and in a position
which is not likely to receive any addition of lateral groundwater.
The argillic horizon is more expressed where the surface is geomor
phically younger, the soil mantle shallower and less weathered, and in
more likely to receive lateral migration of grounda position which is
waters.
68
LIST OF REFERENCES
Organic carbon, pp. 1367-1378. Methods of SoilAllison, L. E. 1965. Analysis. Agronomy Series No. 9, Soil Sci. Soc. Amer., Madison,
Wisc.
Almeida, F. F. M. de and 0. Barbosa. 1953. Geologia das quadriculas Divisio dede Piracicaba e Rio Claro, Estado de S~io Paulo.
Geologia e Mineralogia do D.N.P.M. Bol. No. 143. S~o Paulo,
Brazil.
1938. Soil classification,Baldwin, M., C. E. Kellog and J. Thorp. pp. 979-1001. Soils and Men. U. S. Dept. of Agriculture,
U. S. Govt. Print. Ofc., Washington, D. C.
Report toBennema, J. 1966. Classification of Brazilian soils. Food and Agriculture Organization ofthe Government of Brazil.
p. 83.the United Nations, Rome, Italy.
M. N. Camargo and A. C. S. Wright. 1962. Regional con-Bennema, J., trast in South American soil formation in relation to soil classi
fication and soil fertility. Trans. of Joint Meet. Comm.,
IV and V Int. Soil Conf., New Zealand 1962:493-506.
1970. MicromorphologyBennema, J., A. Jongerius and R. C. Lemos.
of oxic and argillic horizons in South Brazil in relation to
Geoderma 4:333-355.weathering sequences.
R. C. Lemos and I. Vettori. 1959. Latosols in Brazil.Bennema, J., Proc. Third Inter-African Soils Conference, Dalaba
1959:273-281.
Some comparison of the properties of humidBennet, H. H. 1926. tropical and humid temperate American soils, with especial
reference to indicated relations between chemical composition
and physical properties. Soil Sci. 21:349-374.
Fabric and Mineral Analysis of Soils. John WileyBrewer, R. 1964.
and Sons, Inc., New York. p. 470.
1938.Byers, H. G., C. E. Kellogg, M. S. Anderson and J. Thorp.
Soils and Men. U. S. Dept. ofFormation of soil, pp. 948-978.
Agriculture, U. S. Govt. Print. Ofc., Washington, D. C.
A study of a Terra Roxa Estruturada and LatosolCarvalho, A. 1960. Roxo on a topographic sequence in Sdo Paulo State, Brazil.
Unpublished M. S. thesis, Department of Agriculture, University
of New Castle Upon Tyne, New Castle, England.
Cation exchange capacity, pp. 891-901.Chapman, H. D. 1965a. In
C. E. Black (ed.), Methods of Soil Analysis. Agronomy Series
Vol. 9. Amer. Soc. of Agron., Madison, Wisc.
69
902-904. InTotal exchangeable bases, pp.Chapman, H. D. 1965b. C. E. Black (ed.), Methods of Soil Analysis. Agronomy Series
Vol. 9. Amer. Soc. of Agron., Madison, Wisc.
Levantamento de reconhecimento1958.Comissao de Solos do S.N.P.A. dos solos do Rio de Janeiro e Distrito Federal. Rio de Janeiro,
p. 350 (Bol. 11).Ministerio da Agricultura, Brazil.
Levantamento de reconhecimento1960.Comissao de Solos do S.N.P.A. Rio de Janeiro, Ministerio da dos solos do Estado de Sgo Paulo.
p. 350 (Bol. 12).Agricultura, Brazil.
1960. General Climatology. Prentice-Hall, Inc. Critchfield, H, J.
Englewood Cliffs, N. J.
1972. Genese e Escobar, E.H., J. L. I. Demate and A. C. Moniz.
classifica9ao de alguns solos da bacia do Ribeirao Tijuco Preto.
S.P.I. Analise mineralogicaMunicipio de Rio das Pedras. Bragantia 30:(in press).quantitativa da fraqgo argila.
1970. Selected coastal plainFiskell, G. A. and H. F. Perkins (ed.).
soil properties. Southern Coop. Bull. No. 148, Univ. of Fla.,
(ainesville. p. 141.
Israel Program forTreatise on soil science.Glinka, K. D. 1931. Scientific Translations, Jerusalem, Israel 1963:674.
Analise de agregados de solos. Bragantia 19: Grohmann, F. 1960a.
201-213.
em tres tiposGrohmann, F. 1960b. Distribuigao e tamanho de poros
Bragantia 19:319-328.de solO's do Estado de S'o Paulo.
Soils of the Colombian Llanos Orientales--Guerrero, R. 1971. Unpublished
Composition and classification of selected profiles.
PhD thesis, Department of Soil Science, N. C. State University
at Raleigh. University Microfilms, Inc., Ann Arbor, Mich.
1960. A rapid dissolution of allo-Hashimoto, I. and I. L. Jackson. phane and kaolinite. Clay and Clay Minerals. Proc. 7th Conf.
1:102-113.
Hole, F. D. 1961. A classification of peduturbation and some other isotropism
processes and factors of soil formation in relation to
Soil Sci. 91:375-377.and anisotropism.
1956. Soil Chemical Analysis--Advanced Course.Jackson, M. L. Madison, Wisc. p. 991.Published by the author.
1964. Chemical composition of soils, pp. 71-141.Jackson, 1.L. 2nd Ed. Reinhold
In F. E. Bear (ed.), Chemistry of the Soil.
Publ. Co., New York.
70
InternationalKellogg, C. E. 1950. Tropical soils. Trans. 4th.
Congr. Soil Sci. Amsterdam 1:266-276.
1949. An exploratory study of soilKellogg, C. E. and F. D. Davol. groups in the Belgian Congo. Publications de l'Institut Nationel
pour l'Etude Agronomique du Congo Belge (I.N.E.A.C.). Serie
p. 73.Scientifique No. 46, Belgium.
Methods of making mechanicalKilmer, V. J. and L. T. Alexander. 1949. Soil Sci. 68:15-24.analysis of soils.
1963. A procedure for the particleKittrick, J. A. and E. W. Hope.
size separation for X-ray diffraction analysis. Soil Sci. 96:
318-325.
The Differential Thermal Investigation of Clays.Mackensie, R. C. 1957. p. 456.Mineralogical Society, London, England.
1st Intern.A scheme for soil classification.Marbut, C. F. 1927. Congr. Soil Sci. Proc. 4:1-31.
Mekaru, T. and G. Uehara. 1972. Anion adsorption in ferruginous
Soil Sci. Soc. Am. Proc. 36:296-300.tropical soils.
The fabric of natural clays and its relation-Mitchel, J. K. 1956. ship to engineering properties. Proc. Highway Res. Board 35:693.
Moniz, A. C. and M. L. Jackson. 1967. Quantitative mineralogical
analysis of Brazilian soils derived from basic rocks and slate.
Soil Sci. Report 212.Univ. of Wisconsin, Madison.
1972. Studies of a Latosol Roxo Moura Filho, W. and S, W. Buol. Clay mineralogy. Experientiae 13:201-217.(Eutrustox) in Brazil:
1968. Opal phytoliths in two soil profiles on the Oberhoster, R. E. South Afr. J. Agr. Sci. 11.743-748.Sprinbock flats.
A two cycle theory of tropical pedology. J. Ollier, C. D. 1959.
Soil Sci. 10:137-148.
R. A. Catani, M. S. Queiroz and A. Kupper. 1950. Paiva Neto, J. E.,
Contribuig'o ao estudo dos metodos analiticos e de extragao para
Anais la. caracterizaao dos solos do Estado de Sgo Paulo.
Reunigo Brasileira de Ciencia do Solo. Rio de Janeiro, Brazil.
pp. 79-108.
Penteado, M. M. 1968. Geomorfologia do Setor Centro Oriental da
Umpublished tese de doutoramento,Depress-o Periferica Paulista. Faculdade de Filosofia Ciencias e Letras de Rio
Claro. Rio
Claro, S. P., Brazil.
1969. A bacia de sedimentagao de Rio Claro, Estado de Penteado, M. M. Rev. Geogr. da Soc. Geogr. de Lisboa 17:38-61.Sgo Paulo.
71
1969. Interpreta;ao dos Solos da Serra de Santana Queiroz Neto, J. P. Umpublished tese de doutoramento,para fins de classificag'o. Piracicaba,
Escola Superior de Agricultura Luiz de Queiroz.
S. P., Brazil.
1966. Carta de solos do 0. Freire and T. Kinjo.Ranzani, G., municrpio de Piracicaba. Piracicaba, Centro de Estudo de Solos.
p. 85.ESALQ-USP, Brazil.
Reneau, R. B. and J. G. Fiskell. 1972. Mineralogical properties of
Soil Sci. Soc. Am. Proc. 36:501-505. clays from Panama soils.
A pressure membrane extraction apparatus for
1951.Richards, L. A. Soil Sci. 51:377-386.soil solutions.
Soils, Their Origin, Constitution & Classifica
1949.Robinson, G. W. Thomas Murby and Co.,tion (An Introduction to Pedology).
London, England. p. 573.
Their characteristics1964. Soil temperature regimes:Smith, G. D. Soil Cons. Serv., U. S. Govt. Print. Ofc., and predictability.
Washington, D. C.
Smithson, F. 1958. J. Soil Sci.Grass opal in British soils.
9:148-154.
Smithson, F. 1959. Opal sponge spicules in soils. J. Soil Sci.
10:105-110.
Soil Survey Staff. 1951. Soil survey manual. Agriculture Handbook
U. S. Dept. of Agriculture, U. S. Govt. Print. Ofc.,No. 18. Washington, D. C. p. 503.
Soil Survey Staff. 1960. Soil classification, a comprehensive system,
U. S. Dept. of Agriculture, U. S. Govt. 7th approximation. p. 207.Print. Ofc., Washington, D. C.
Supplement to the soil classification system Soil Survey Staff. 1967. U. S. Dept. of Agriculture, U. S. Govt. (7th approximation).
Print. Ofc., Washington, D. C.
Soil Survey Staff. 1970. Selected chapters from the unedited text
the Soil Taxonomy of the National Cooperative Soil Survey.of U. S. Dept. of Agriculture, U. S. Govt. Print. Ofc., Washington,
D. C.
Stoops, G. 1968. Micromorphology of some characteristic soils of the
Pedologie 18:110-149.Lower Congo (Kinshasa).
The Water Balance.1955.Thornthwaite, C. W. and J. R. Mather. Vol. 8, No. 1. Certenton,
Publications in Climatology.
N. J. p. 104.
72
Thorp, J. and G. D. Smith. 1949. Higher categories of soil classifica-Soil Sci. 67:117tion: Order, suborder, and great soil groups.
126.
Grundiss der Tropischen and SubtropischenVageler, P. 1930. Berlin, Germany.Bodenkunde. Verlagesgesellschaft fur. Akerban.
Ministgrio daVettori, L. 1969. Merodos de analise do solo. Rio de Janeiro, Brazil.Agricultura. Boletim tcnico No. 7.
Criteria for classifying tropical soils.Wambeke, A. R. Van. 1962. J. Soil Sci. 13:124-132.
73
APPENDICES

74
Appendix A. Soil Profile Description and Classification
According to the Comisslo de Solos (1960)
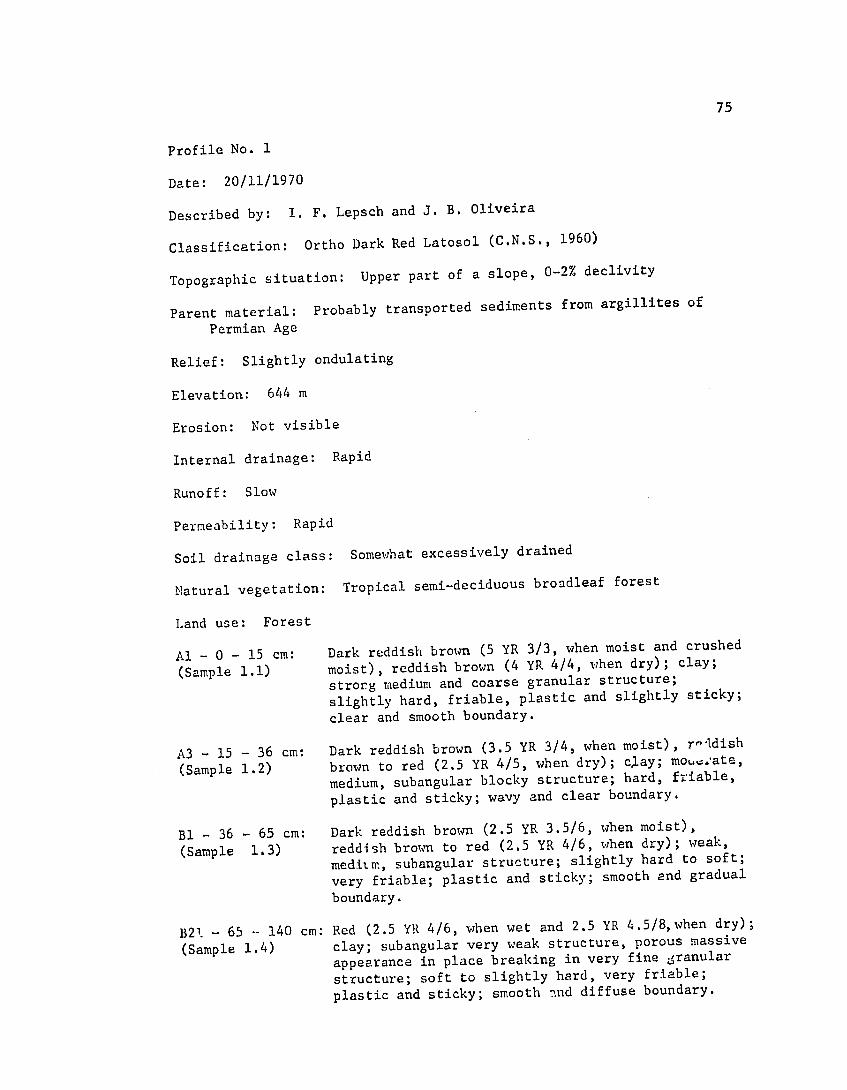
75
Profile No. 1
Date: 20/11/1970
I. F. Lepsch and J. B. OliveiraDescribed by:
Ortho Dark Red Latosol (C.N.S., 1960)Classification:
a slope, 0-2% declivityUpper part ofTopographic situation:
Probably transported sediments from argillites of Parent material: Permian Age
Relief: Slightly ondulating
Elevation: 644 m
Erosion: Not visible
Internal drainage: Rapid
Runoff: Slow
Permeability: Rapid
Somewhat excessively drainedSoil drainage class:
Natural vegetation: Tropical semi-deciduous broadleaf forest
Land use: Forest
Al - 0 - 15 cm: Dark reddish brown (5 YR 3/3, when moist and crushed
(Sample 1.1) moist), reddish brown (4 YR 4/4, when dry); clay;
strorg medium and coarse granular structure;
slightly hard, friable, plastic and slightly sticky;
clear and smooth boundary.
Dark reddish brown (3.5 YR 3/4, when moist), r-ldish A3 - 15 - 36 cm: brown to red (2.5 YR 4/5, when dry); clay; mot,..ate,(Sample 1.2) medium, subangular blocky structure; hard, friable,
plastic and sticky; wavy and clear boundary.
Bl - 36 - 65 cm: Dark reddish brown (2.5 YR 3.5/6, when moist),
red (2.5 YR 4/6, when dry); weak,(Sample 1.3) reddish brown to meditm, subangular structure; slightly hard to soft;
very friable; plastic and sticky; smooth end gradual
boundary.
Red (2.5 YR 4/6, when wet and 2.5 YR 4.5/8,when dry);B21. - 65 --140 cm:
clay; subangular very weak structure, porous massive (Sample 1.4) appearance in place breaking in very fine granular
structure; soft to slightly hard, very friable;
plastic and sticky; smooth 2nd diffuse boundary.
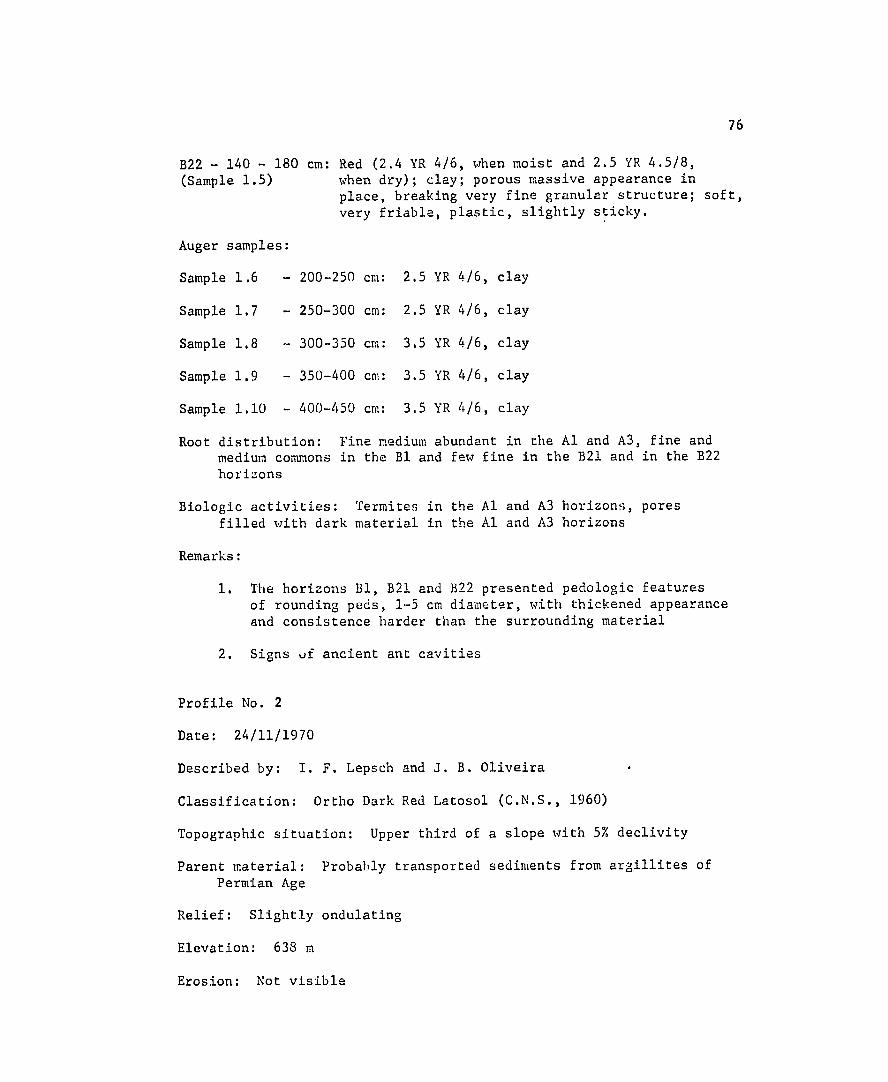
76
B22 - 140 - 180 cm: Red (2.4 YR 4/6, when moist and 2.5 YR 4.5/8,
(Sample 1.5) when dry); clay; porous massive appearance in place, breaking very fine granular structure; soft, very friable, plastic, slightly sticky.
Auger samples:
Sample 1.6 - 200-250 cm: 2.5 YR 4/6, clay
Sample 1.7 - 250-300 cm: 2.5 YR 4/6, clay
Sample 1.8 - 300-350 cm: 3.5 YR 4/6, clay
Sample 1.9 - 350-400 cm: 3.5 YR 4/6, clay
Sample 1.10 - 400-450 cm: 3.5 YR 4/6, clay
Root distribution: Fine medium abundant in the Al and A3, fine and medium commons in the Bl and few fine in the B21 and in the B22 horizons
Biologic activities: Termites in the Al and A3 horizons, pores filled with dark material in the Al and A3 horizons
Remarks:
1. The horizons B1, B21 and B22 presented pedologic features of rounding peds, 1-5 cm diameter, with thickened appearance and consistence harder than the surrounding material
2. Signs uf ancient ant cavities
Profile No. 2
Date: 24/11/1970
Described by: I. F. Lepsch and J. B. Oliveira
Classification: Ortho Dark Red Latosol (C.N.S., 1960)
Topographic situation: Upper third of a slope with 5% declivity
Parent material: Probably transported sediments from argillites of
Permian Age
Relief: Slightly ondulating
Elevation: 638 m
Erosion: Not visible

77
Internal drainage: Rapid
Runoff: Medium
Permeability: Rapid, exception in the Ap2 where it is moderate
Soil drainage class: Somewhat excessively drained
Natural vegetation: Tropical semi-deciduous broadleaf forest
Land use: Sugar cane plantation
Apl - 0 12 cm: Dark reddish brown (3.5 YR 3/4, when moist and
(Sample 2.1) moist crushed), red (2.5 YR 4/6, when dry), yellowish red (5 YR 4/8, when dry crushed); clay; moderate, medium fine and coarse granular structure; slightly hard, friable, plastic and slightly sticky; wavy and abrupt boundary; horizon recently revolved.
Ap2 - 12 - 33 cm: Dark red (2.5 YR 3/6, when moist and moist crushed), (Sample 2.2) red (2.5 YR 4/6, when dry), yellowish red (5 YR
4/8, when dry crushed); clay; massive structure; very hard, firm, plastic and sticky; clear and wavy boundary; thickened horizon.
BIl - 33 - 64 cm: Dark red (2.5 YR 3/6, when moist and moist crushed); (Sample 2.3) reddish brown (2.5 YR 4/6, when dry); clay; moderate,
fine and medium subangular blocky; discontinuous thin cutans; slightly hard, friable, plastic and sticky; gradual and wave boundary.
B12 - 64 - 90 cm: Dark red to red (2.5 YR 3.5/6, when moist and
(Sample 2.4) moist crushed) red (2.5 YR 4/6, when dry); clay; weak, medium subangular blocky structure; slightly hard, friable, plastic and sticky; gradual and wave boundary.
B21 - 90 - 140 cm: Dark red to red (2.5 YR 3.5/6, when moist), red
(Sample 2.5) (2.5 YR 4/6, when dry); clay; porous massive appearance in place, breaking very fine granular structure; soft, very friable, plastic and sticky; smooth and diffuse boundary.
B22 - 140 - 200 cm: Dark red to red (2.5 YR 3.5/6, when moist), red
(Sample 2.6) (2.5 YR 5/7, when dry); clay; porous massive appearance in place, breaking very fine granular; soft, very friable, plastic and sticky.
Auger samples:
Sample 2.7 - 200-250 cm - 2.5 YR 4/6, clay
Sample 2.8 - 250-300 cm - 2.5 YR 4/6, clay
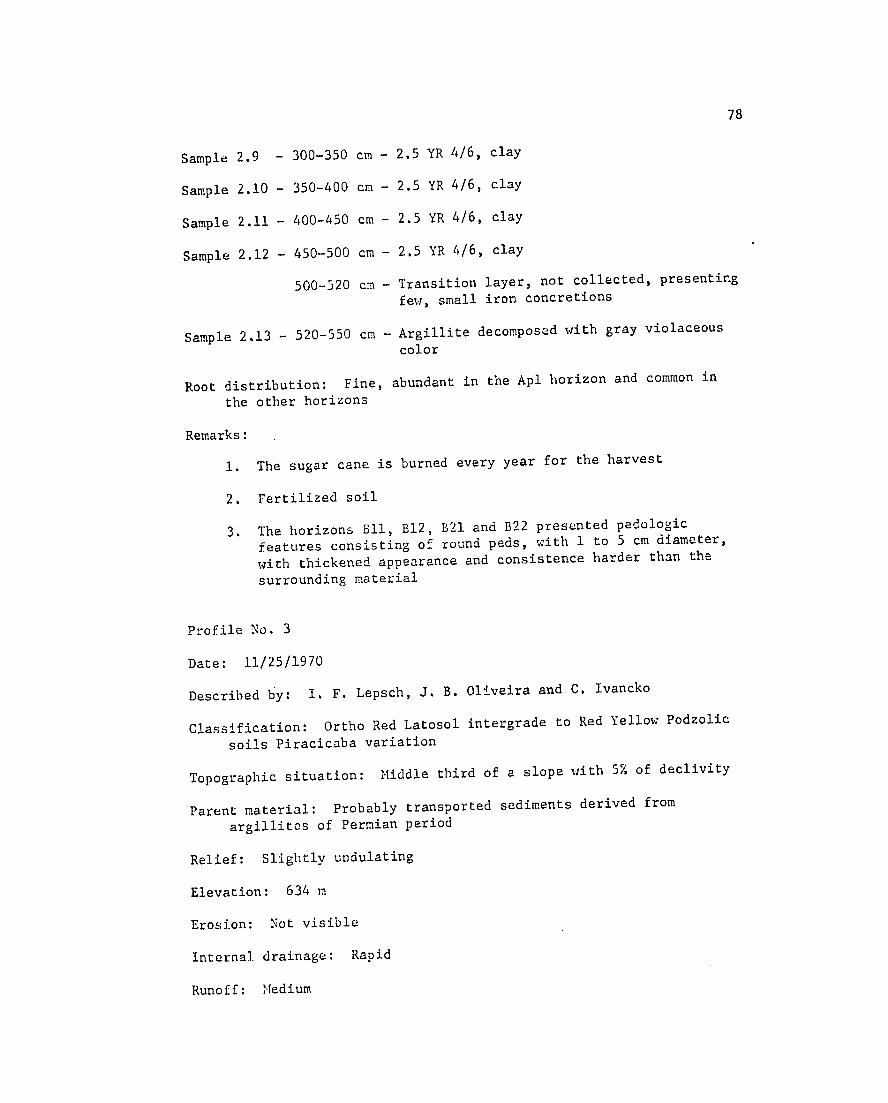
78
Sample 2.9 - 300-350 cm - 2.5 YR 4/6, clay
Sample 2.10 - 350-400 cm - 2.5 YR 4/6, clay
2.5 YR 4/6, claySample 2.11 - 400-450 cm -
Sample 2.12 - 450-500 cm - 2.5 YR 4/6, clay
500-520 cm - Transition layer, not collected, presenting
few, small iron concretions
- 520-550 cm - Argillite decomposed with gray violaceous Sample 2.13 color
Root distribution: Fine, abundant in the ApI horizon and common in
the other horizons
Remarks:
1. The sugar cane is burned every year for the harvest
2. Fertilized soil
B12, B21 and B22 presented pedologic3. The horizons BlI, features consisting of round peds, with 1 to 5 cm diameter,
with thickened appearance and consistence harder than the
surrounding material
Profile No. 3
Date: 11/25/1970
I. F. Lepsch, J. B. Oliveira and C. IvanckoDescribed by:
Ortho Red Latosol intergrade to Red Yellow Podzolic Classification: soils Piracicaba variation
Middle third of a slope with 5% of declivityTopographic situation:
Parent material: Probably transported sediments derived from
argillites of Permian period
Relief: Slightly undulating
Elevation: 634 m
Erosion: Not visible
Internal drainage: Rapid
Runoff: Medium
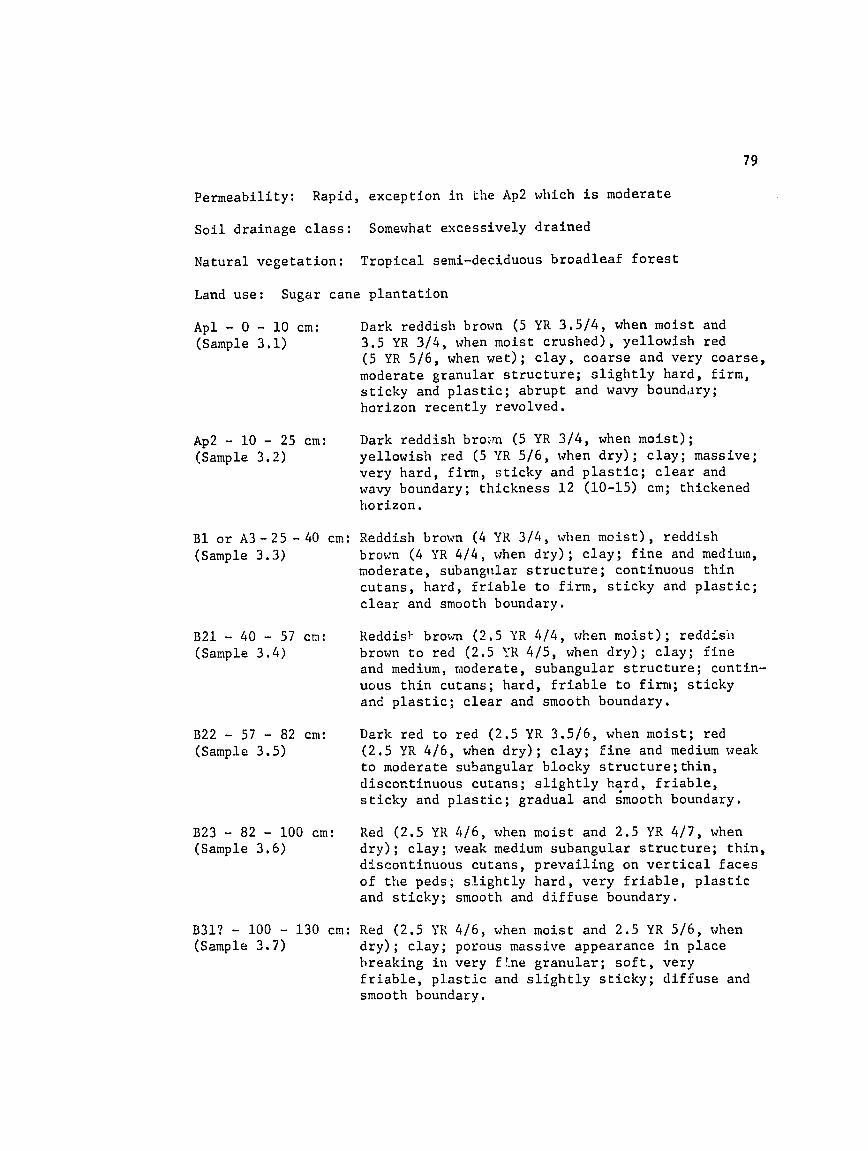
79
Permeability: Rapid, exception in the Ap2 which is moderate
Soil drainage class: Somewhat excessively drained
Natural vegetation: Tropical semi-deciduous broadleaf forest
Land use: Sugar cane plantation
Apl - 0 - 10 cm: Dark reddish brown (5 YR 3.5/4, when moist and
(Sample 3.1) 3.5 YR 3/4, when moist crushed), yellowish red (5 YR 5/6, when wet); clay, coarse and very coarse, moderate granular structure; slightly hard, firm, sticky and plastic; abrupt and wavy boundary; horizon recently revolved.
Ap2 - 10 - 25 cm: Dark reddish broun (5 YR 3/4, when moist);
(Sample 3.2) yellowish red (5 YR 5/6, when dry); clay; massive; very hard, firm, sticky and plastic; clear and wavy boundary; thickness 12 (10-15) cm; thickened horizon.
Bl or A3-25 -40 cm: Reddish brown (4 YR 3/4, when moist), reddish (Sample 3.3) brown (4 YR 4/4, when dry); clay; fine and medium,
moderate, subangular structure; continuous thin cutans, hard, friable to firm, sticky and plastic; clear and smooth boundary.
B21 - 40 - 57 cm: Reddish brown (2.5 YR 4/4, when moist); reddish
(Sample 3.4) brown to red (2.5 YR 4/5, when dry); clay; fine and medium, moderate, subangular structure; continuous thin cutans; hard, friable to firm; sticky and plastic; clear and smooth boundary.
B22 - 57 - 82 cm: Dark red to red (2.5 YR 3.5/6, when moist; red
(Sample 3.5) (2.5 YR 4/6, when dry); clay; fine and medium weak to moderate subangular blocky structure;thin, discontinuous cutans; slightly hard, friable, sticky and plastic; gradual and smooth boundary.
B23 - 82 - 100 cm: Red (2.5 YR 4/6, when moist and 2.5 YR 4/7, when (Sample 3.6) dry); clay; weak medium subangular structure; thin,
discontinuous cutans, prevailing on vertical faces
of the peds; slightly hard, very friable, plastic and sticky; smooth and diffuse boundary.
B31? - 100 - 130 cm: Red (2.5 YR 4/6, when moist and 2.5 YR 5/6, when
(Sample 3.7) dry); clay; porous massive appearance in place breaking in very f.ne granular; soft, very
friable, plastic and slightly sticky; diffuse and smooth boundary.
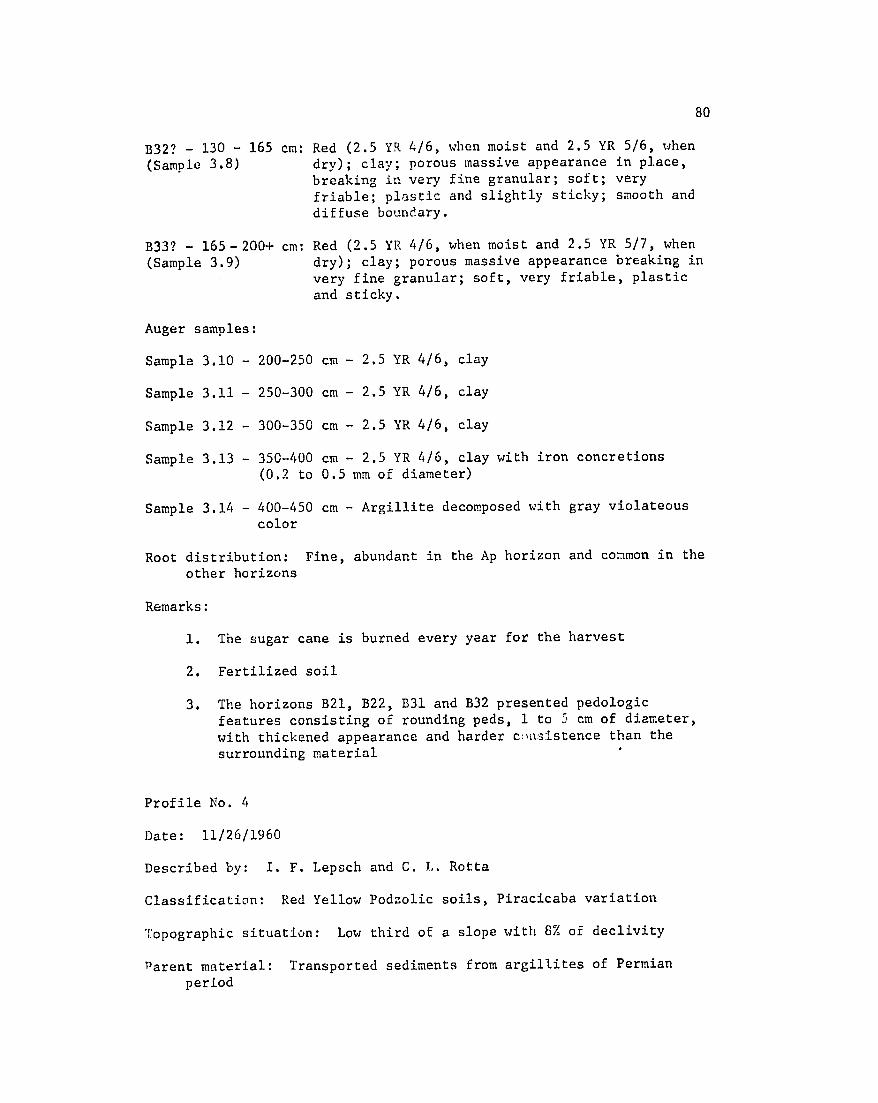
80
B32? - 130 - 165 cm: Red (2.5 YR 4/6, when moist and 2.5 YR 5/6, when
(Sample 3.8) dry); clay; porous massive appearance in place, breaking in very fine granular; soft; very friable; plastic and slightly sticky; smooth and diffuse boundary.
B33? - 165-200+ cm: Red (2.5 YR 4/6, when moist and 2.5 YR 5/7, when (Sample 3.9) dry); clay; porous massive appearance breaking in
very fine granular; soft, very friable, plastic and sticky.
Auger samples:
Sample 3.10 - 200-250 cm - 2.5 YR 4/6, clay
Sample 3.11 - 250-300 cm - 2.5 YR 4/6, clay
Sample 3.12 - 300-350 cm - 2.5 YR 4/6, clay
Sample 3.13 - 350-400 cm - 2.5 YR 4/6, clay with iron concretions
(0.2 to 0.5 mm of diameter)
Sample 3.14 - 400-450 cm - Argillite decomposed with gray violateous color
Root distribution: Fine, abundant in the Ap horizon and common in the other horizons
Remarks:
1. The sugar cane is burned every year for the harvest
2. Fertilized soil
3. The horizons B21, B22, B31 and B32 presented pedologic
features consisting of rounding peds, 1 to 5 cm of diameter,
with thickened appearance and harder c:)iisistence than the
surrounding material
Profile No. 4
Date: 11/26/1960
Described by: I. F. Lepsch and C. I..Rotta
Classification: Red Yellow Podzolic soils, Piracicaba variation
Topographic situation: Low third of a slope with 8% of declivity
Parent material: Transported sediments from argillites of Permian period
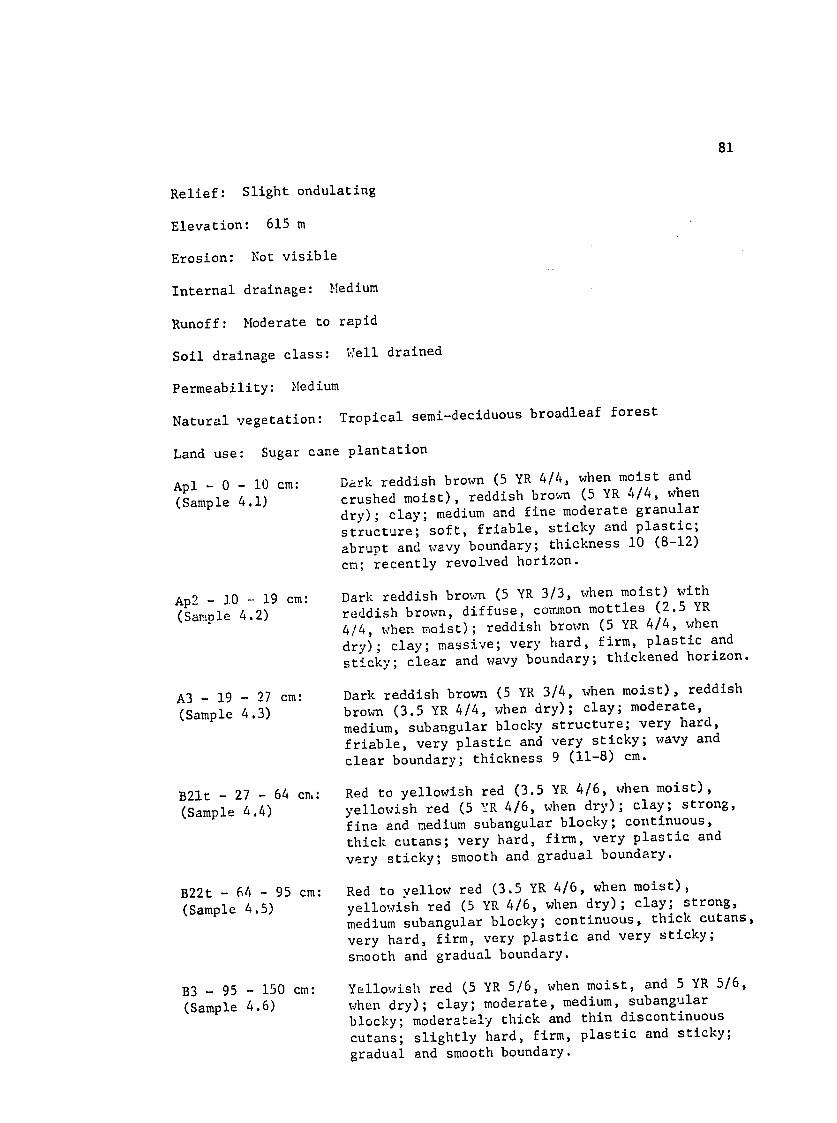
81
Relief: Slight ondulating
Elevation: 615 m
Erosion: Not visible
Internal drainage: Medium
Runoff: Moderate to rapid
Soil drainage class: Well drained
Permeability: Medium
Natural vegetation: Tropical semi-deciduous broadleaf forest
Land use: Sugar cane plantation
Apl - 0 - 10 cm: Dark reddish brown (5 YR 4/4, when moist and
crushed moist), reddish brown (5 YR 4/4, when (Sample 4.1) dry); clay; medium and fine moderate granular
structure; soft, friable, sticky and plastic;
abrupt and wavy boundary; thickness 10 (8-12)
cm; recently revolved horizon.
Ap2 - 10 cm: Dark reddish brown (5 YR 3/3, when moist) with - 19 reddish brown, diffuse, commron mottles (2.5 YR
(Sample 4.2) 4/4, when moist); reddish brown (5 YR 4/4, when
dry); clay; massive; very hard, firm, plastic and
sticky; clear and wavy boundary; thickened horizon.
Dark reddish brown (5 YR 3/4, when moist), reddish A3 - 19 - 27 cm:
brown (3.5 YR 4/4, when dry); clay; moderate,(Sample 4.3) medium, subangular blocky structure; very hard,
friable, very plastic and very sticky; wavy and
clear boundary; thickness 9 (11-8) cm.
B21t - 27 - 64 cn,: Red to yellowish red (3.5 YR 4/6, when moist),
(Sample 4.4) yellowish red (5 YR 4/6, when dry); clay; strong,
fine and medium subangular blocky; continuous,
thick cutans; very hard, firm, very plastic and
smooth and gradual boundary.very sticky;
B22t - 64 - 95 cm: Red to yellow red (3.5 YR 4/6, when moist),
(Sample 4.5) yellowish red (5 YR 4/6, when dry); clay; strong, medium subangular blocky; continuous, thick cutans,
very hard, firm, very plastic and very sticky;
smooth and gradual boundary.
B3 - 95 - 150 cm: Yellowish red (5 YR 5/6, when moist, and 5 YR 5/6,
when dry); clay; moderate, medium, subangular(Sample 4.6) blocky; moderataly thick and thin discontinuous
cutans; slightly hard, firm, plastic and sticky;
gradual and smooth boundary.
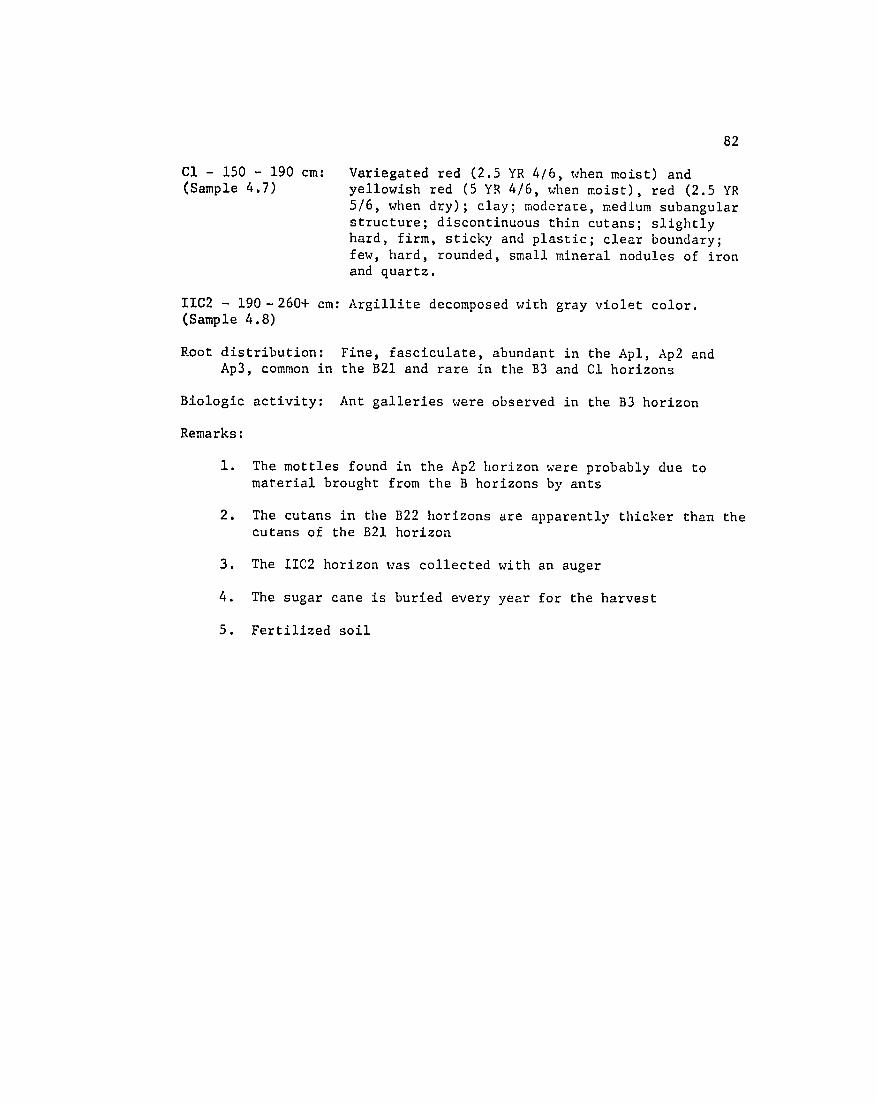
82
Cl - 150 - 190 cm: Variegated red (2.5 YR 4/6, when moist) and (Sample 4.7) yellowish red (5 YR 4/6, when moist), red (2.5 YR
5/6, when dry); clay; moderate, medium subangular structure; discontinuous thin cutans; slightly hard, firm, sticky and plastic; clear boundary; few, hard, rounded, small mineral nodules of iron and quartz.
IIC2 - 190-260+ cm: Argillite decomposed with gray violet color. (Sample 4.8)
Root distribution: Fine, fasciculate, abundant in the Apl, Ap2 and Ap3, common in the B21 and rare in the B3 and Cl horizons
Biologic activity: Ant galleries were observed in the B3 horizon
Remarks:
1. The mottles found in the Ap2 horizon were probably due to material brought from the B horizons by ants
2. The cutans in the B22 horizons are apparently thicker than the cutans of the B21 horizon
3. The IIC2 horizon was collected with an auger
4. The sugar cane is buried every year for the harvest
5. Fertilized soil
83
Appendix B. Micromorphological Descriptions
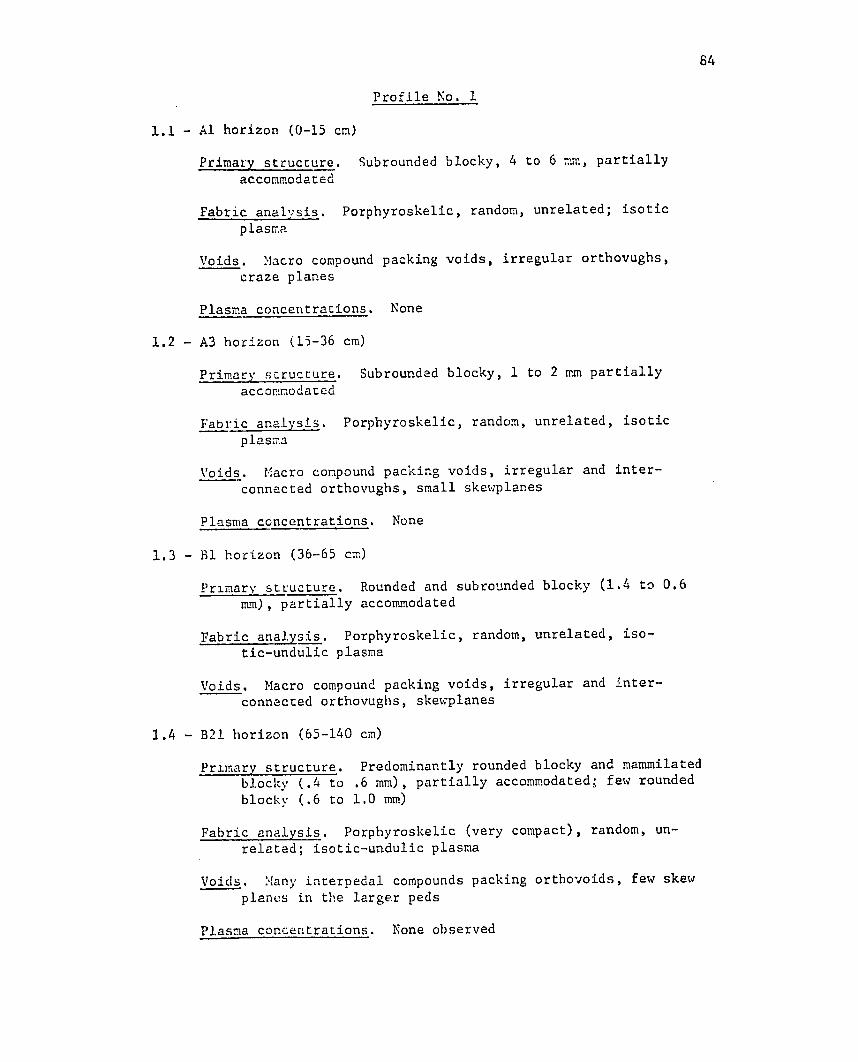
84
Profile No. 1
1.1 - Al horizon (0-15 cm)
Primary structure. Subrounded blocky, 4 to 6 mm, partially accommodated
Fabric analysis. Porphyroskelic, random, unrelated; isotic plasma
Voids. Macro compound packing voids, irregular orthovughs, craze planes
Plasma concentrations. None
1.2 - A3 horizon (15-36 cm)
Primary scructure. Subrounded blocky, 1 to 2 mm partially accommodated
Fabric analysis. Porphyroskelic, random, unrelated, isotic
plasma
Voids. Macro compound packing voids, irregular and inter
connected orthovughs, small skewplanes
Plasma concentrations. None
1.3 - Bl horizon (36-65 cm)
Primary structure. Rounded and subrounded blocky (1.4 to 0.6 mm), partially accommodated
Fabric analysis. Porphyroskelic, random, unrelated, isotic-undulic plasma
Voids. Macro compound packing voids, irregular and interconnected orthovughs, skewplanes
1.4 - B21 horizon (65-140 cm)
Primary structure. Predominantly rounded blocky and mammilated blocky (.4 to .6 mm), partially accommodated; few rounded blocky (.6 to 1.0 mm)
Fabric analysis. Porphyroskelic (very compact), random, unrelated; isotic-undulic plasma
Voids. Many interpedal compounds packing orthovoids, few skew planes in the larger peds
Plasma concentrations. None observed
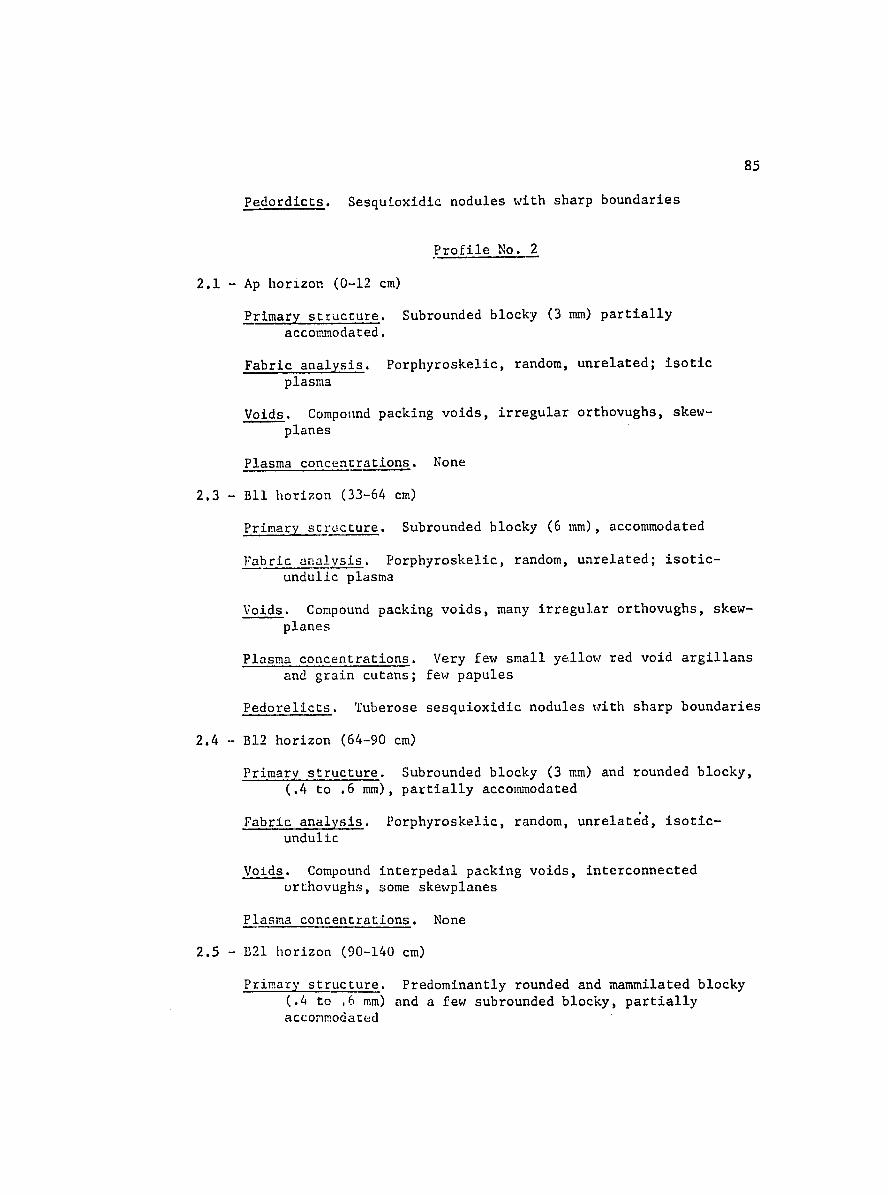
85
Pedordicts. Sesquioxidic nodules with sharp boundaries
Profile No. 2
2.1 - Ap horizon (0-12 cm)
Primary structure. Subrounded blocky (3 mm) partially accommodated.
Fabric analysis. Porphyroskelic, random, unrelated; isotic plasma
Voids. Compound packing voids, irregular orthovughs, skew
planes
Plasma concentrations. None
2.3 - BIl horizon (33-64 cm)
Primary structure. Subrounded blocky (6 mm), accommodated
Fabric analysis. Porphyroskelic, random, unrelated; isoticundulic plasma
Voids. Compound packing voids, many irregular orthovughs, skewplanes
Plasma concentrations. Very few small yellow red void argillans and grain cutans; few papules
Pedorelicts. Tuberose sesquioxidic nodules with sharp boundaries
2.4 - B12 horizon (64-90 cm)
Primary structure. Subrounded blocky (3 mrm) and rounded blocky, (.4 to .6 mm), partially accommodated
Fabric analysis. Porphyroskelic, random, unrelated, isoticundulic
Voids. Compound interpedal packing voids, interconnected
orthovughs, some skewplanes
Plasma concentrations. None
2.5 -B21 horizon (90-140 cm)
Primary structure. Predominantly rounded and mammilated blocky (.4 to .6 mm) and a few subrounded blocky, partially accommodated
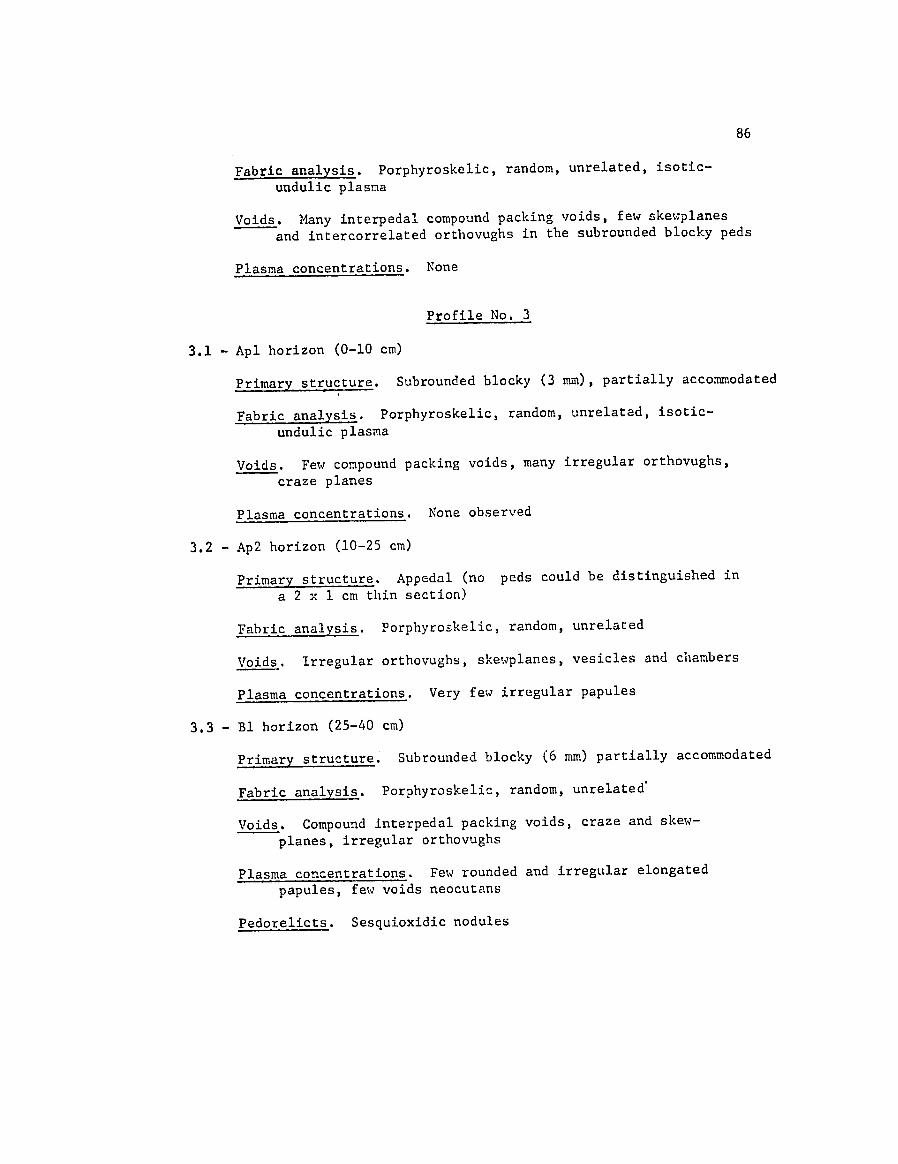
86
Fabric analysis. Porphyroskelic, random, unrelated, isoticundulic plasma
Voids. Many interpedal compound packing voids, few skewplanes
and intercorrelated orthovughs in the subrounded blocky peds
Plasma concentrations. None
Profile No. 3
3.1 - Apl horizon (0-10 cm)
Subrounded blocky (3 mm), partially accommodatedPrimary structure.
Fabric analysis. Porphyroskelic, random, unrelated, isotic
undulic plasma
Few compound packing voids, many irregular orthovughs,Voids.
craze planes
Plasma concentrations. None observed
3.2 - Ap2 horizon (10-25 cm)
Primary structure. Appedal (no peds could be distinguished in
a 2 x 1 cm thin section)
Fabric analysis. Porphyroskelic, random, unrelated
Voids. Irregular orthovughs, skewplanes, vesicles and chambers
Plasma concentrations. Very few irregular papules
3.3 - Bl horizon (25-40 cm)
Subrounded blocky (6 mm) partially accommodatedPrimary structure.
Fabric analysis. Porphyroskelic, random, unrelated'
Voids. Compound interpedal packing voids, craze and skew
planes, irregular orthovughs
Plasma concentrations. Few rounded and irregular elongated
papules, few voids neocutans
Pedorelicts. Sesquioxidic nodules
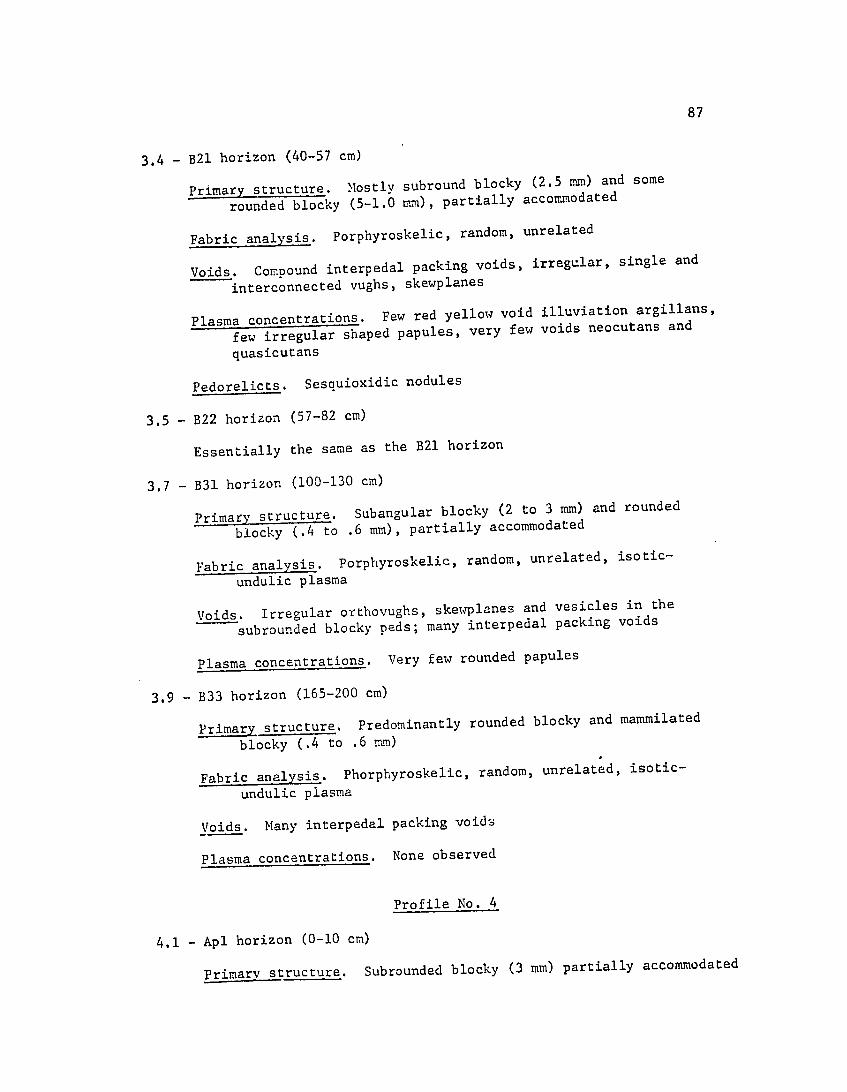
87
3.4 - B21 horizon (40-57 cm)
Mostly subround blocky (2.5 mm) and some Primary structure.
partially accommodatedrounded blocky (5-1.0 m.n),
analysis. Porphyroskelic, random, unrelatedFabric
Compound interpedal packing voids, irregular, single and
Voids. interconnected vughs, skewplanes
Few red yellow void illuviation argillans,Plasma concentrations. few irregular shaped papules, very few
voids neocutans and
quasicutans
Pedorelicts. Sesquioxidic nodules
3.5 - B22 horizon (57-82 cm)
the B21 horizonEssentially the same as
B31 horizon (100-130 cm)3.7 -
Primary structure. Subangular blocky (2 to 3 mm) and rounded
.6 mm), partially accommodatedblocky (.4 to
Fabric analysis. Porphyroskelic, random, unrelated, isotic
undulic plasma
Irregular orthovughs, skewplanes and vesicles in the
Voids. subrounded blocky peds; many interpedal
packing voids
Very few rounded papulesPlasma concentrations.
B33 horizon (165-200 cm)3.9 -
Primary structure. Predominantly rounded blocky and mammilated
blocky (.4 to .6 mm)
analysis. Phorphyroskelic, random, unrelated, isotic-Fabric undulic plasma
Voids. Many interpedal packing voids
None observedPlasma concentrations.
Profile No. 4
4.1 - Apl horizon (0-10 cm)
Subrounded blocky (3 mm) partially accommodated Primary structure.
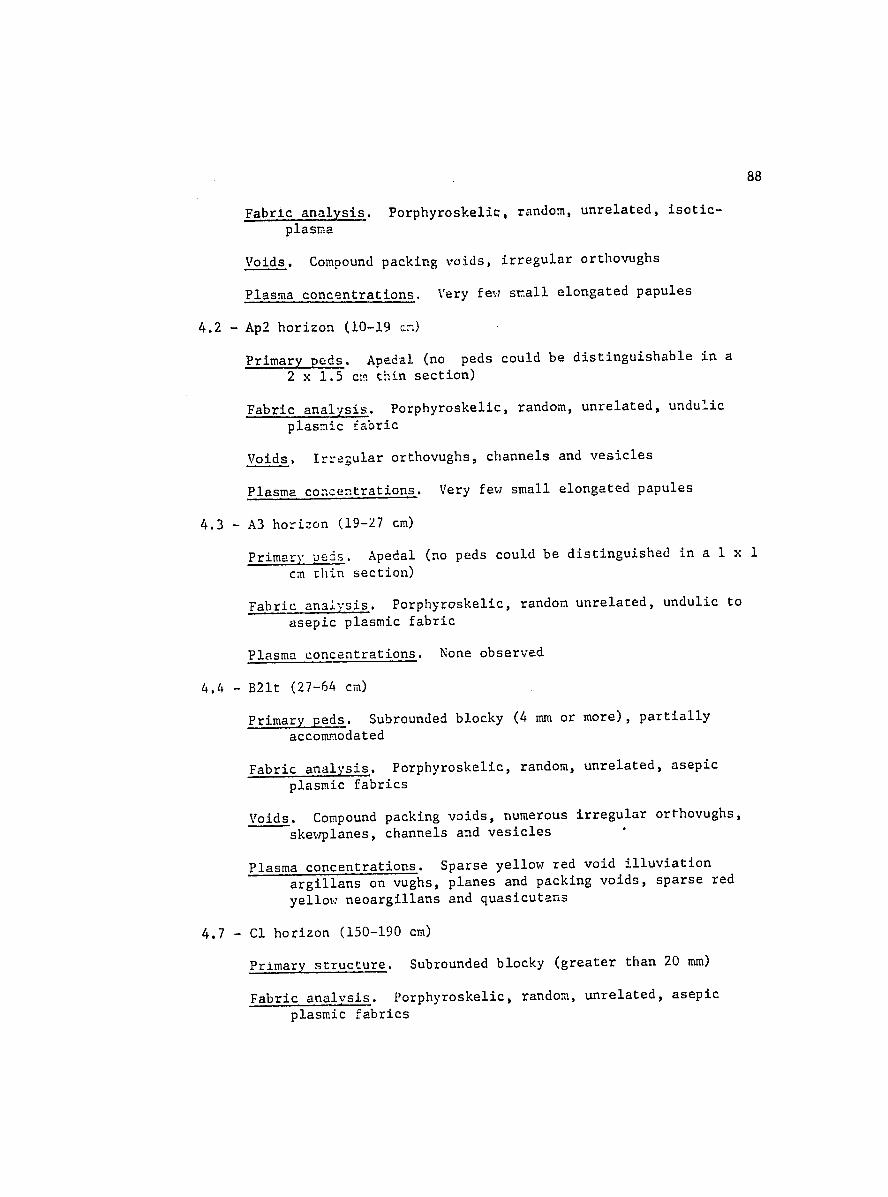
88
Fabric analysis. Porphyroskelic, random, unrelated, isoticplasma
Voids. Compound packing voids, irregular orthovughs
Plasma concentrations. Very few snall elongated papules
4.2 - Ap2 horizon (10-19 cn)
Primary peds. Apedal (no peds could be distinguishable in a
2 x 1.5 cm thin section)
Fabric analysis. Porphyroskelic, random, unrelated, undulic
plasmic fabric
Voids. Irraular orthovughs, channels and vesicles
Plasma concentrations. Very few small elongated papules
4.3 - A3 horizon (19-27 cm)
Primary Deds. Apedal (no peds could be distinguished in a 1 x 1
cm thin section)
Fabric analysis. Porphyroskelic, random unrelated, undulic to
asepic plasmic fabric
Plasma concentrations. None observed
4.4 -B21t (27-64 cm)
Primary peds. Subrounded blocky (4 mm or more), partially
accommodated
Fabric analysis. Porphyroskelic, random, unrelated, asepic
plasmic fabrics
Voids. Compound packing voids, numerous irregular orthovughs, skewplanes, channels and vesicles
Plasma concentrations. Sparse yellow red void illuviation
argillans on vughs, planes and packing voids, sparse red
yellow neoargillans and quasicutans
4.7 - Cl horizon (150-190 cm)
Primary structure. Subrounded blocky (greater than 20 mm)
Fabric analysis. Porphyroskelic, random, unrelated, asepic plasmic fabrics
89
Voids. Packing voids, channels, skewplanes and vesicles
Plasma concentrations. Common yellow void illuviation argillans,few small irregular papules, common red yellow neoargillans and quasicutans