strategic skills assessment for the creative industries - skillset
TRANSCRIPT

Strategic Skills Assessment for the Creative Industries
January 2010

2
Contents 1 Introduction .............................................................................................................. 4
1.1 Research and Data ....................................................................................................... 5
1.2 Sector Overview ........................................................................................................... 6
1.2.1 Economic Contribution ............................................................................................ 6
1.2.2 Product Market Structure ....................................................................................... 7
1.2.4 Industry Profile ........................................................................................................ 8
2 What Drives Skills Demand ................................................................................... 14
2.1 The Economic Situation ............................................................................................. 14
2.2 Globalisation .............................................................................................................. 16
2.3 Technology and Digitisation ...................................................................................... 17
2.3.1 Intellectual Property and Digital Management ..................................................... 18
2.3.2 Lower Cost Technology and User‐Led Innovation and Content ............................ 18
2.4 Convergence and Audience Fragmentation .............................................................. 19
2.5 Characteristics of the Workforce ............................................................................... 20
2.6 Recruitment at Entry Level onwards ......................................................................... 22
2.7 Retention ................................................................................................................... 23
2.8 Government Policy .................................................................................................... 23
3 Current Skills Needs .............................................................................................. 24
3.1 Skills Shortages .......................................................................................................... 25
3.2 Skills Gaps .................................................................................................................. 27
3.3 Skills Supply ................................................................................................................ 29
3.3.1 Skills Supply: The Education System ...................................................................... 29
3.3.2 Skills Supply: Workforce Development ................................................................. 29
3.4.3 Skills Supply: Access to Finance ............................................................................. 31
3.3.4 Skills Supply: Diversity ........................................................................................... 32
4 Anticipating What Lies Ahead ................................................................................ 33
4.1 The Future for the UK’s Creative Industries .............................................................. 33

3
4.2 Growth Potential ....................................................................................................... 34
4.3 Changing Skills Needs ................................................................................................ 36
5 Geographical Differences in Labour and Skill Need .............................................. 38
5.1 Sector Employment across the UK ............................................................................ 38
5.2 Characteristics of the Workforce ............................................................................... 39
5.3 Recruitment and Skills Issues ..................................................................................... 39
Annex A Creative Industries and Gaps in Official Data Sources ............................. 41
Annex B Data Sources ............................................................................................ 56

4
1 Introduction
This report produced by Skillset and Creative and Cultural Skills provides a strategic
skills assessment for the Creative Industries including companies involved in: Film,
Television, Radio, Photo Imaging, Interactive Content Design, Publishing, Animation,
Content for Computer Games, Commercials and Promos, Corporate Production, Post
Production, Visual Special Effects, Other Specialist Facilities, Advertising, Cultural
Heritage, Design, Literature, Music, Performing Arts, Visual Arts, Craft, Fashion and
Textiles.
Three themes are common to these diverse industries; the central importance of
creativity for business success; the ability to communicate; and a focus on clients,
customers, audiences and participants. The Creative Industries are increasingly an
important part of economic development and are also seen to contribute to quality of
life and the environment.
The Industries are bound by common output in the form of creative content and
creative products (including cultural services) that provide both commercial and social
value. For much of the industry, particularly those producing content, the boundaries
between these businesses and sectors are increasingly becoming blurred. Whilst there
are still key distribution platforms including: cinema, TV, books/print media, online,
mobile and billboards, companies creating content are doing so in a way that can be
used for multiple platforms. The business context is providing an opening of channels
for distribution and ‘multi-platform content’ is key. For the remainder of the industry
creativity materialises into physical products from the production of raw materials
through to design, manufacture, wholesale and servicing.
In terms of its global standing, the UK is well regarded as the leader in several sectors
and generally has a reputation for excellence on the world stage, consistently in the top
four achieving countries. The UK specifically:
• Has the largest producer of TV and radio content in Europe, with only the US
generating more value from TV exports;
• Is also second only to the US in the global film market, with increasing box
office receipts: 30 of the top 200 films at the world box office in 2001 – 2007
were based on stories and characters created by British writers, generating £14
billion at the worldwide box office;1
1 UK Film Council (2009) Statistical Yearbook.

5
• Has the largest publishing industry in Europe;2
• Exports more books than any other publishing industry in the world.3
• Has the largest number of computer games studios in Europe and is the third
largest producer in the world;4
• Leads the world’s ranking for advertising excellence and the UK is the third
biggest in the world after the USA and Japan, with London overwhelmingly
chosen as the European hub for major agencies;5
• Is the 4th largest music producer, behind the US, Japan and Germany;6
• Is rated 4th in the world for design behind only the US, Japan and Korea.7
• Holds one of Europe's top 4 fashion cities, London along with Milan, Paris and
Rome.8
‘. . . the force of British creativity is renowned throughout the world. People across the
globe are inspired by the sheer diversity of our creative talent. They recognise Britain
as a hub of creative endeavour, innovation and excellence, and they are drawn to the
strength of our creative economy.’
(The Rt Hon Gordon Brown MP, Prime Minister in the Foreword to ’Creative Britain’
2008) 2008’
1.1 Research and Data
The analysis in this document is based on reliable data from high quality sources.
This includes sector-endorsed primary research from Skillset, Creative and
Cultural Skills and Skillfast-UK and as far as possible secondary data sources
such as the Office of National Statistics’, Annual Business Inquiry (ABI), Labour
Force Survey (LFS), Inter-Departmental Business Register (IDBR) and the
DCMS Creative Industries Economic Estimates Statistical Bulletins. 2 http://www.berr.gov.uk/whatwedo/sectors/publishing/index.html
3 http://www.publishers.org.uk/en/policy_and_advocacy/advocacy.cfm
4 NESTA (2008) Raise the Game. 5 IPA (2009) Social Media Futures: the future of advertising agencies in a networked society. A 10 year perspective. 6 Creative & Cultural Skills research 7 International Design Scoreboard: Initial Indicators of International Design Capabilities, IFM and University of Cambridge
8 Global Language Monitor (2009) Annual Global Survey.
6
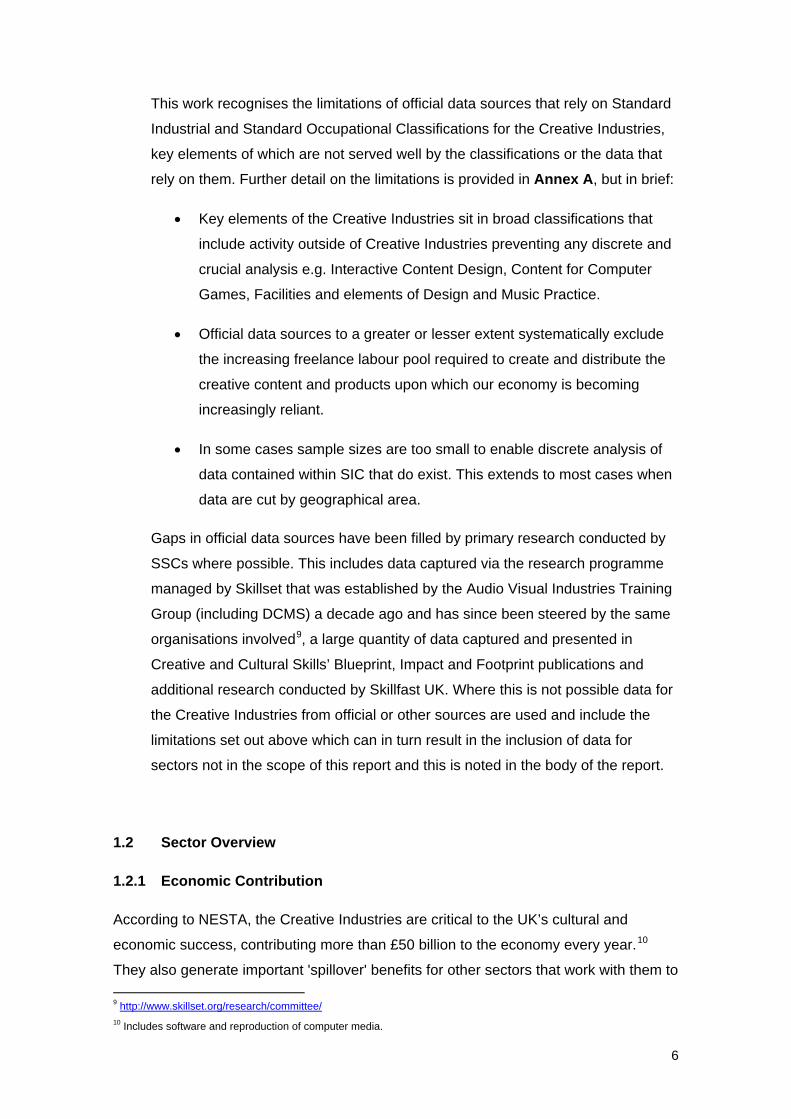
This work recognises the limitations of official data sources that rely on Standard
Industrial and Standard Occupational Classifications for the Creative Industries,
key elements of which are not served well by the classifications or the data that
rely on them. Further detail on the limitations is provided in Annex A, but in brief:
• Key elements of the Creative Industries sit in broad classifications that
include activity outside of Creative Industries preventing any discrete and
crucial analysis e.g. Interactive Content Design, Content for Computer
Games, Facilities and elements of Design and Music Practice.
• Official data sources to a greater or lesser extent systematically exclude
the increasing freelance labour pool required to create and distribute the
creative content and products upon which our economy is becoming
increasingly reliant.
• In some cases sample sizes are too small to enable discrete analysis of
data contained within SIC that do exist. This extends to most cases when
data are cut by geographical area.
Gaps in official data sources have been filled by primary research conducted by
SSCs where possible. This includes data captured via the research programme
managed by Skillset that was established by the Audio Visual Industries Training
Group (including DCMS) a decade ago and has since been steered by the same
organisations involved9, a large quantity of data captured and presented in
Creative and Cultural Skills’ Blueprint, Impact and Footprint publications and
additional research conducted by Skillfast UK. Where this is not possible data for
the Creative Industries from official or other sources are used and include the
limitations set out above which can in turn result in the inclusion of data for
sectors not in the scope of this report and this is noted in the body of the report.
1.2 Sector Overview
1.2.1 Economic Contribution
According to NESTA, the Creative Industries are critical to the UK’s cultural and
economic success, contributing more than £50 billion to the economy every year.10
They also generate important 'spillover' benefits for other sectors that work with them to 9 http://www.skillset.org/research/committee/ 10 Includes software and reproduction of computer media.

7
create innovative products and services.11 Table 1 shows that the Creative Industries
contributed 6.4% to GVA at the last count which is significant considering the relative
small labour pool.
Table 1 Contribution to GVA Industry type Employment Contribution to GVAAerospace12 1,124,000 1.7%#Pharmaceuticals 72,00013 4%Energy 137,80014 4.8%EPES* & ICT15 1,820,000 10%Construction 1,862,00016 1.8%#Financial Services17 1,028,000 7.9%Manufacturing 3,000,000 12%Creative Industries18 1,100,000 6.4%NB: ‘*’ = Electronics, Photonics and Electrical Systems and ‘#’ indicates GDP. Creativity is recognised as an important driver of innovation and the Creative Industries
show significantly higher values of innovation and creativity than other UK enterprises
(70% as against 55%)19. It is perhaps for this reason that Creative functions are also
deeply embedded in other sectors. According to the Technology Strategy Board the
Creative Sector, with Digital Creative Industries at the heart of this sector, is an
important stimulator of innovation in the wider economy, via firms they can work with as
partners and/or suppliers.20 The strong conclusion in a recent NESTA report21 pointed
to the Creative Industries and specifically the talent we have nurtured within it,
becoming a key driver for the UK's recovery from recession and that the industries will
take centre-stage as a major, high growth contributor to the UK economy over the next
5 years.
1.2.2 Product Market Structure
11 http://www.nesta.org.uk/areas_of_work/creative_industries. 12 ONS (2006).
13 Ibid
14 ONS (2007).
15 Ibid.
16 ONS (2006).
17 Ibid
18 Ibid. Includes software and reproduction of computer media.
19 Includes all Creative Industries, DTI Occasional Paper No. 6. Innovation in the UK: Indicators and Insights, July 2006. 20 Work Foundation (2009) Investing in the Creative Industries; A Guide for Local Authorities. 21 Attacking the Recession: How Innovation Can Fight the Downturn, NESTA Discussion Paper, December 2008. Includes software and reproduction of computer media.

8
The core business of the Creative Industries is to create high quality and professionally
produced content and products live and across the full range of platforms from mobile
phones to computer games to film and TV screens. In most sectors of the industry,
there are businesses whose exclusive domain is content creation, others which provide
a supporting role in that process, and others involved in the distribution, transmission or
exhibition of that content. This can be illustrated by reference to the film and music
industry which comprises not only production companies, but significant numbers of
businesses in the facilities sector who provide services such as studio and equipment
hire or post production, and also companies involved in distributing and exhibiting films.
Sectors differ however in terms of the supply chain through which content and products
are created. For example in television, much production is now commissioned by a
small number of broadcasters and undertaken externally in the independent production
sector. In other sectors, in-house production remains the prevailing model. In some
sectors, most creative content produced is for public consumption (such as broadcast,
film, animation, commercials, content for computer games, music, fashion and
performing and visual arts). In others, it is primarily or exclusively for business (such as
corporate production) while sectors such as interactive content design, publishing and
literature produce and disseminate content to both people and businesses.
Increasingly the linear value chain and specific supply relationship in place within the
sub sectors is being supplemented by an opportunity for the creators of products and
content to take control from creation through to distribution. For example interactive or
digital media companies are from the outset creating content for multiple use and not
with a primary use and then to be ‘adapted’ for on-line purposes. In fashion and textiles
this extends even into retail as many brands employ in house teams of people working
in design and creative/technical occupations such as pattern-cutting or garment
technology.
1.2.4 Industry Profile
There are an estimated 157,400 Creative Industry companies (not including sole-
traders)22. The vast majority of companies are small with fewer than 10 people (77% in
22 Skillset (2009) Employment Census, Creative and Cultural Skills (2008) Creative & Cultural Skills (2008) Creative and Cultural Industry: Impact and Footprint, Creative and Cultural Skills and TBR (2008) Sizing the Skillfast-UK Sectors and the contribution of Micro businesses.

9
Creative Media and 90% in Creative and Cultural).23 In addition a further half a million
people are sole-traders or freelance.24
The Creative Industries have suffered at the hands of the recession not least in terms
of employment but remain a significant employer across the UK.25 Including the half a
million sole traders and freelancers there are 1,502,20026 people employed in the
Creative Industries and a further 551,10027 are employed in Creative occupations in
other industries. In addition Creative employment28 has experienced unprecedented
growth in recent years and employment has been growing at 2%, comparing favourably
with a 1% average for the whole economy.29
Table 2a shows that Creative Industry employment is dominated by ‘associate
professional’ and technical roles (43%) followed by ‘managers and senior officials’
(18%). The Creative Industries are reliant on a wide range of occupations creative and
technical such as construction, set crafts, web/interactive content design and visual
effects, through to management and business roles and all benefit from applied
Creative Industry specific knowledge. For examples of Creative Industry specific
occupations please see Table 2b which takes Creative Media for illustrative purposes.
Table 2a Occupational Breakdown
OCCUPATIONAL GROUP %
Managers and Senior Officials 18
Professional occupations 5
Associate Professional and Technical 43
Administrative and Secretarial 8
23 Skillset (2009) Employment Census, Skillset analysis of Experian 2007, Creative & Cultural Skills (2008) Creative & Cultural Skills (2008) Creative and Cultural Industry: Impact and Footprint and UKCES (2009) Almanac. 24 Skillset (2008) Creative Media Workforce Survey, Skillset (2005) Survey of the Audio Visual Industries’ Workforce, Skillset (2003) Workforce Survey, Skillset (2001) Freelance Survey, Creative and Cultural Skills (2008) Creative and Cultural Industry: Impact and Footprint.
25 Evidence includes Skillset’s (2009) ‘From Recession to Recovery’, based on a sample of 262Creative Media employers consulted during 2009 :one third had made or expected to make some staff redundant as a result of the recession and just over one third had not renewed some freelance contracts and ONS (2009) Labour Force Survey April-June. 26 Skillset (2009) Employment Census, secondary analysis of unit lists for 2006 feature film productions (80 minutes or longer and minimum budget of £500K), ONS (2009) LFS ONS April - June, Creative and Cultural Skills (2008) Creative & Cultural Skills (2008) Creative and Cultural Industry: Impact and Footprint, Creative and Cultural Skills and TBR (2008) Sizing the Skillfast-UK Sectors and the contribution of Micro businesses. 27 ONS (2009) LFS April-June. 28 Includes software and reproduction of computer media.
29 Technology Strategy Board (2009) Creative Industries Technology Strategy 2009-2012.

10
Skilled Trades Occupations 5
Personal Service Occupations 2
Sales and Customer Service Occupations 5
Process Plant and Machine Operatives 6
Elementary Occupations 9
Total 100
Source: ONS (2008) LFS average of four quarters.
Table 2b Example of Creative Industry Specific Occupations
OCCUPATIONAL GROUP %
Creative Media (excl. publishing)
Strategic Management 5%
Creative Development 2%
Production 11%
Legal 1%
Broadcast Management 3%
Broadcast Engineering &
Transmission 2%
Editorial, Journalism and Sport 5%
Content Development 1%
Art and Design 9%
Animators 3%
Costume/Wardrobe 1%
Make Up & Hairdressing 1%
Camera/Photography 10%
OCCUPATIONAL GROUP %
Creative Media (excl. publishing)
Lighting 2%
Audio/Sound/Music 3%
Transport *
Studio Operations *
Technical Development 3%
Editing 2%
Laboratories and Imaging Services 5%
Manufacture 1%
Servicing 1%
Retail and Exhibition 10%
Libraries and Archives 2%
Distribution, Sales and Marketing 2%
Business Management 13%
Other 2%
Total Creative Media (excl.
publishing) 100%
Source: Skillset (2009) Employment Census, Skillset/UK Film Council (2008) Feature Film
Production Workforce Survey and ONS (2009) LFS April-June.
NB: Data for publishing are taken from the ONS (2009) LFS Jul-Sep and due to data restrictions
cannot be disaggregated further.
Overall around a third (34%)30 of the available labour pool in the Creative Industries is
‘freelance’ and the remaining operates on an ‘employee’31 basis. It must be born in
30 Skillset (2009) Employment Census, secondary analysis of unit lists for 2006 feature film productions (80 minutes or longer and minimum budget of £500K)., ONS (2009) LFS April-June, Creative and Cultural Skills (2008) Creative & Cultural Skills (2008) Creative and Cultural Industry: Impact and Footprint, Creative and Cultural Skills and TBR (2008) Sizing the Skillfast-UK Sectors and the contribution of Micro businesses.

11
mind that this is a conservative estimate as the full implications of the recession on
freelancing will not be fully understood until further scheduled work is carried out.32
Table 3 below shows that many sectors of the Creative Industries are characterised by
high levels of freelancing, especially those areas most closely involved in the process
of producing the creative content for example film production (80%), visual arts (70%)
literature (65%), independent production for radio (61%), photo imaging (60%),
performing arts (58%), corporate production (54%), animation (46%) and independent
production for TV (44%).33 More than half the workforce in some occupational groups is
freelance such as camera/photography (73%), make up/hairdressing (63%), lighting
(61%), costume/wardrobe (53%) and audio/sound/music (52%).34
31 In Creative Media definitions are as follows: ‘freelance’ = contract of less than 365 days or sole trader and ‘employee’ = contract of 365 days or more; in Creative and Cultural definitions are as follows: ‘sole-trader’ = any individual working for themselves and ‘freelancer’ = a sole trader working directly for another company at the time of the count. 32 for example Skillset’s next Creative Media Workforce Survey which is scheduled to fall in 2010.
33 Skillset (2009) Employment Census, Skillset/UK Film Council (2008) Feature Film Production Workforce Survey, ONS (2009) LFS April-June, Creative & Cultural Skills (2008) Creative & Cultural Skills (2008) Creative and Cultural Industry: Impact and Footprint and UKCES (2009) Almanac. 34 Ibid.

Table 3 % Freelance by Sector
Sector % Sector %Television 28 Manufacture of AV Equipment 7Terrestrial TV 19 Other Services for Film and Television 42Cable & Satellite Television 11 Independent Production (TV) 44 Film 31Community TV Cinema Exhibition 0TV Distribution Film Distribution 21 Film Production 80Radio 23 Broadcast Radio 22 Publishing 13Independent Production (Radio) 61 Book publishing 19 Newspaper publishing 5Animation 46 Journals & periodicals 18 Other publishing 10Interactive Content Design 21 News Agencies 17
Online Content 23 Publishing of Directories & Mailing Lists 17
Offline Multimedia 24 Other info service activities s n.e.c. 27Mobile Content 16 Other Interactive Content Design 9 Photo Imaging 60 Photographic activity 60Content for Computer Games 4 Archives & Libraries 17Other Content Creation 47 Advertising 17Commercials Production and Pop Promos 41 Craft 37Corporate Production 54 Cultural Heritage 4Facilities 29 Design 32Post Production 24 Literature 65Special Physical Effects 44 Music 46Studio & Equipment Hire 40 Performing Arts 58Outside Broadcast 24 Visual Arts 70Processing Laboratories 12 Fashion and Textiles 17Visual FX 12 ALL 34
Source: Skillset (2009) Employment Census, Skillset/UK Film Council (2008) Feature Film
Production Workforce Survey, ONS (2009) LFS April-June, Creative & Cultural Skills (2008)
Creative and Cultural Industry: Impact and Footprint and UKCES (2009) Almanac.
Many in the workforce use their skills across sectors which is unsurprising due to the
convergence of media. Table 4 below illustrates this with the Creative Media sectors of
the Creative Industries. Sectors with a high proportion of people working in another
Creative Media sector tend to be characterised by high levels of freelancing and are
closely involved in the production process.
Table 4 % Work in other Creative Media Sectors35
35 Skillset (2008) Creative Media Workforce Survey. Figures exclude film production, photo imaging and publishing.

13
Sector
% Worked in other Creative
Media industry Sector
% Worked in other Creative
Media industry
Television Facilities Terrestrial TV 34 Post Production 61Cable & Satellite Television 32 Studio & Equipment Hire 43Independent Production (TV) 49 Outside Broadcast 72 Manufacture of AV Equipment 13Radio Other Facilities 40Broadcast Radio and Independent Production (Radio_ 23 Film Animation 57 Cinema Exhibition 3 Interactive Content Design Archives & Libraries 31Online Content 34 Other Interactive Content Design 39 TOTAL 35 Content for Computer Games 19 Other Content Creation 67 Corporate Production 70
Source: Creative Media Workforce Survey, Skillset 2008.

14
2 What Drives Skills Demand
2.1 The Economic Situation
Until very recently, a relatively long period of economic success and growth has been
the norm across the Creative Industries. The current recessionary climate and the
impact of wider changes to the market structure however is having a short term
multiplier effect on the industry. Television has been particularly badly hit, largely due
to the downturn in advertising revenues and shift to online advertising. The Creative
Media sector overall is struggling with reduced revenue and difficulties in accessing
finance. Commercial consultancies have been badly affected, the Advertising industry
suffered the highest rate of business failure (13%) compared to other Creative and
Cultural industries.36
However, all indices point to growth in the medium term; the National Endowment for
Science, Technology and the Arts (NESTA) analysis for 2009-2013 points to growth as
businesses take advantage of digital technologies and develop new business models.37
Indeed, historically, recessions have played a role in triggering new business start-ups.
The 1990s dot.com boom and crash resulted in the birth of the blogosphere and new
technology-enabled services like eBay and Skype, largely because many ‘technological
IT wizards' were made redundant and had time to experiment and create. Technology
is an important driver of innovation and innovation is a way of life for the Creative
Media industries, which show significantly higher values of innovation than other UK
enterprises – (70% as against 55%)38. The previous recession in 1990 – 1992 saw a
fall of jobs in the recreational and cultural sector of 2.5%.39 However, between 1991
and 1995 creative and cultural employment grew by an average of 11% p.a., compared
to, for example, manufacturing, which declined by 1% p.a.40. The manufacturing sector
has struggled to recover ever since (see figure 1).
The underlying reason for optimism in growth for the Creative Industries is the opening
up of new markets and new opportunities globally as a result of digital communications
and global supply networks. In addition, it is expected that spend on creative and
36 Creative & Cultural Skills/TBR (2009) An Assessment of the Creative & Cultural Industries in Periods of Economic Stability: Past Experience and Future Trends
37 Includes software and reproduction of computer media.
38 Includes all Creative Industries, DTI Occasional Paper No. 6. Innovation in the UK: Indicators and Insights, July 2006. 39 NESTA (2008) Creating Innovation
40 Creative & Cultural Skills/TBR (2009) An Assessment of the Creative and Cultural Industries in Periods of Economic Instability: Past Experience and Future Trends

15
cultural products will be similar to expenditure rates across the rest of the economy. In
fact, due to the declining value of the pound, spend on the leisure and tourism sector is
expected to increase as people remain within the UK, rather than travelling abroad.
Current indications also show that consumers are continuing to spend on culture. This
category of consumer spending has been increasing, rising from 5% in 1963 to 7% in
2008. In 2007 ONS statistics for family spending on recreation and culture (£57.40p)
show this was second only to transport as the highest weekly expenditure41. The
Performing Arts sub-sector for example has shown remarkable resilience through the
first part of the recession; statistics from the Society of London Theatre show that in the
first half of 2009 visits were up to 7,627,426 visits, an increase of 2.5% on the same
time period in 2008, which in itself was a record year.42
According to the Work Foundation there is definite opportunity for the creative
industries to be the sector to lead the UK out of the recession43. The Centre for Cities -
Cities Outlook 2009 has flagged UK cities with dense clusters of knowledge industries
as best placed to recover from the recession44.
In order to successfully emerge from the recession stronger and more adaptable, more
competitive skills will be demanded alongside focused support. Indications are that
despite the impact of the recession, training levels are and should remain firm45, albeit
at low levels. The recession is, however, likely to be a barrier to those who would seek
to increase their investment in training. Businesses that do not invest in training and
professional development during a recession are two and a half times more likely to fail
than those who do.46
“We do not know how long this crisis will last and how deep it will become. But when it
is over, those who have invested in creativity and innovation will find themselves well
ahead of the pack.” Jan Figel, EU Commissioner for Education, Training, Culture and
Multilingualism.
41 ONS (2009) Family Spending
42 http://www.guardian.co.uk/stage/2009/aug/06/west-end-plays-more-audiences
43 The Work Foundation (2009) Seminar - ‘How the Creative Industries might come through the recession’
44Centres for Cities (2009) Cities Outlook 2009
45 UKCES (2009) Ambition 2020
46 DIUS (2008) Skills for Business

16
2.2 Globalisation
The world’s creative economy is growing. In the 1990s for OECD countries, the annual
growth rate was more than twice that of the service industries overall.47 In summary the
main implications of globalisation for the sector are:
• Growing potential markets for UK-produced content in all formats, across all
media;
• An increasing range of foreign competitors with access to the UK market;
• Increasing potential for sourcing services from the UK to overseas (‘off shoring’)
to save costs.
In all three cases, it is the emerging economies of India and China that will have
greatest impact on the UK industry.
The growing populations of both countries will help to ensure that they maintain their
emerging roles as both suppliers and markets: by 2010, India is projected to add 83
million workers to the global economy, China 56 million, and the EU just 100,000.48
The global entertainment and media industry is forecast to grow from $1.3 trillion in
2005 to reach 1.8 trillion by 201049. Asia is expected to record the highest growth rate
of all regions in the entertainment and media industry, increasing from $274 billion to
$425 billion (with a 9.2% compound annual growth rate). China will have the fastest
growing industry in the world, with a 26% compound annual growth rate50.
The fashion and textiles sector has already experienced a major contraction in the
sector’s manufacturing activity as production operations have been transferred
offshore. In addition though high level technical functions such as design, product
development, production management and quality control have typically been retained
in the UK by suppliers or retailers, as the capability of overseas producers improves
there is a threat that these functions will also be transferred. This overall picture is
illustrated in the increasing market share of developing nations in textile and fashion
production51 and declining UK performance in both GVA and employment terms within
47 UNCTAD (2008) Creative Economy Report http://www.unctad.org/en/docs/ditc20082cer_en.pdf
48 Deloitte 200 49 UNESCO (2009) Key Role of Creative and Cultural Industries in the Economy
http://www.oecd.org/dataoecd/11/47/38703999.pdf?contentId=38704000
51 World Trade Organisation (2008) International Trade Statistics

17
a European context52. This situation will not be significantly altered by the recent fall in
the value of the pound and consequent upward pressure on the cost of imported
goods. Indeed, this factor will be offset by a continuing process of trade liberalisation.
Perhaps of more concern to the UK’s creative industries is the use by different
governments of tax breaks and other fiscal incentives to lure producers to site their
operations away from the UK. The mooted Irish 5 year tax holiday for example53 for the
games industry has got many UK-based games companies lobbying furiously for the
Government to uphold the suggestion in the Digital Britain report for a ‘cultural tax
break’.54 Other countries such as France and Canada already offer attractive incentives
through their tax system to the games industry and some commentators have claimed
this is offering greater protection to those businesses that are based in Canada and
offering an incentive to UK-based industries to de-camp there.55
The increasing importance of the knowledge economy in the UK is recognised to be
essential to economic growth and wealth creation56. To retain this USP, skills and
wealth generation and manage competition on this global scale, the Creative Industries
require appropriate workforce development, training and skills structures in place to
develop the pool of talented people operating the UK, and to attract the best from
across the world to work in the UK. These mechanisms also need to provide the right
skills to meet the needs of the expanding sector57.
Clearly with global opportunities comes the problem of international sectors, such as
much of the creative media sector, being able to base themselves anywhere.
Government support and encouragement is thus vital for these sectors to remain
indigenous and competitive.
2.3 Technology and Digitisation A key factor driving all sectors of the economy is our intrinsic use of digital technology
52 Vogler-Ludwig and Valente (2008) Skills Scenarios for the textiles, wearing apparel and leather products sector in the European Union, Economix
53 http://www.incgamers.com/News/18919/tiga-on-irish-tax-break-proposals
54 http://www.incgamers.com/News/20017/
55 http://www.ldpcreative.co.uk/2010/01/gaming-industry-repeats-tax-re.html
56 The Work Foundation (2009) Investing in the Creative Industries: A Guide for Local Authorities.
57 DCMS, BERR & DIUS (2008) Creative Britain New Talents for the New Economy.

18
and media. As well as providing the skills to generate creative content and products the
digital future relies heavily on many sectors of the Creative Industries and its capacity
to generate compelling educational, entertainment, commercial and public service
content and services which can engage citizens, learners and consumers around the
world. Creative skills within ‘non-creative’ sectors will also be required. Finding ways to
innovate, within education, the existing workforce and industry is critical. The answer
to which lies in collaboration between creative and technical drivers of the digital work
to research, develop and prototype whilst equipping the workforce of the future and the
workforce of today with the right skills to innovate, create and communicate in a digital
environment.
The transition towards a Digital Britain creates both opportunities and challenges for
the Creative Industries and investment in skills is crucial to industries capitalising on
the former and overcoming the latter.
2.3.1 Intellectual Property and Digital Management
A mass of niche services has been created and with these opportunities come new
challenges – peer sharing and piracy for example – challenging content creators’ ability
to earn from their own intellectual property at a time when budgets have been
squeezed. With format export fees partially replacing lost advertising revenue, the
potential for intellectual property theft has been greatly heightened and poses a serious
threat to many content producers. Creating sustainable businesses in a world where
many expect unlimited access to content without being charged is a major challenge.
2.3.2 Lower Cost Technology and User-Led Innovation and Content
User-led innovation has become increasingly important and several of the UK’s existing
creative businesses such as web content and video games have been cited as
examples of excellence.58 This includes User Generated Content (UGC) through, for
example ‘Twitter’ and other social media sites and blogs. In the US, UGC site visitors
are projected to grow from 69 million in 2006 to 101 million in 2011, with corresponding
growth in advertising revenue from $1 billion in 2007 to $3.3 billion in 2008.59 In the UK,
around 19 million people in the UK (50% of internet users) visit Facebook, spending an
58 NESTA (2009) Annual Review. 59 IPA (2008) User Generated Content, Social Media and Advertising.

19
average of six hours per month in May 2008.60 Social media sites such as Facebook
have also opened up their platforms to individuals and businesses to create widgets
and have created and developed the structure to support the commercialisation of
these applications. However, economic and quality factors suggest that sites that had
to date focused exclusively on User-Generated Content (UGC) may well have to scale
back some of their offerings, and offer content that is more professionally produced,
which can generate revenue.61
2.4 Convergence and Audience Fragmentation
According to figures from the Internet Advertising Bureau, the web in the UK will take in
advertising revenues of £2bn this year, surpassing the combined revenues of the entire
national newspaper sector and making the internet advertising market more than half
that of the TV industry. Advertising revenues from the internet are growing annually at
a far higher rate than from other sources – 40% compared with 10% from the cinema,
2% from TV and actual decreases of 4% from magazines and 0.4% from
newspapers.62
Thus, unlike many sectors of the economy, the current challenge for those in many
sectors of the Creative Media industry is less about the scale of demand, but its
complexion and the ways in which it can be met. In particular, recent years have
witnessed fragmentation of markets on a huge scale, meaning that broadcasters and
publishers in particular have for some time had to rethink their business models
radically. It has long been clear that the traditional media paradigm of broadcasters and
publishers providing advertisers with direct or exclusive access to mass markets and
relying solely on that revenue source has gone for good. The huge decline in
advertising revenue has presented many employers in the sector with profound
business challenges long before the rest of the economy began its slide towards
recession.
Paradoxically though, it is in fact audience fragmentation which is driving growth in
demand – in the last ten years, for example, cable and satellite subscription revenue
has tripled, while DVD revenues have increased fifteen-fold and downloading has
enabled audiences to access content in more personalised ways.63
60 OFCOM (2009) Annual Report. 61 Deloitte (2009) Media Predictions, TMT Trends. 62 The Advertising Forecast, Advertising Association statistics published by www.WARC.com, Nielson Media Research, World Advertising Research Centre. 63 Deloitte (2009) Media Predictions, TMT Trends.

20
It is likely however, that as the processes of convergence progress, competitive
boundaries for many creative sectors will become increasingly blurred. The common
feature of the global opportunities presented by new and developing technology is that
they will be beyond the scope and scale of almost all single companies, even large
established multinationals or conglomerates. Alliances and partnerships will therefore
need to be formed for opportunities to be realised, commonly with companies in
technology and telecoms, and sometimes with companies that will be competitors in
other markets. The Work Foundation have noted that Creative businesses are able to
work with partners and/or suppliers, which can create new markets, productivity
growth, ‘spillovers’ and improved efficiency64. Nevertheless learning how to navigate
through this increasingly complex competitive environment may well be a distinguishing
feature of companies which survive through the increasingly competitive environment
precipitated by the current economic downturn, and those which do not.
2.5 Characteristics of the Workforce
Unlike the UK’s working population as a whole the typical Creative Industry workforce
is white, male, young and highly qualified, with significant variations at sub sector level:
• Representation of women is lower in Creative Industries than across the economy
as a whole (42% in Creative Media65, 40% in Creative and Cultural66 and fashion
and textiles67, compared with 46% across the economy as a whole68).
• Some gender segregation by occupation is evident and women are for example
over-represented in costume/wardrobe, make up/hairdressing and legal in Creative
Media and operative roles in fashion and textiles and under-represented in
predominantly technical and higher level roles.69
64 The Work Foundation (2009) Investing in the Creative Industries: A Guide for Local Authorities
65 Skillset (2009) Employment Census, Skillset/UK Film Council (2008) Feature Film Production Workforce Survey, ONS (2009) LFS April-June, Creative & Cultural Skills (2008) Creative & Cultural Skills (2008) Creative and Cultural Industry: Impact and Footprint and UKCES (2009) Almanac. 66 Creative & Cultural Skills (2008) Creative & Cultural Skills (2008) Creative and Cultural Industry: Impact and Footprint. 67 UKCES (2009) Almanac.
68 Ibid.
69 Skillset (2009) Employment Census, Cultural Leadership Programme/TBR (2009) Women in Leadership, Skillfast (2009) Sector Skills Assessment Summary.

21
• Representation of women in some Creative Media sectors70 is dropping whereas
the opposite is the case for Creative and Cultural sectors71 and the economy as a
whole.72 In Creative Media research has repeatedly shown that representation of
older women in some Creative Media sectors is extremely low and has identified
the cause of this to be the particular challenges of balancing starting and raising a
family with working in the Creative Media industry, for example due to long and
unpredictable hours.73
• Fewer in Creative Media and Creative and Cultural sectors is from a Black Asian or
Minority Ethnic Background (BAME) compared with the economy as a whole (6%74
and 7%75 compared with 9%76) and 24% of London’s economy is from a BAME
background, which is where more than three in ten77 in Creative Media and one in
four78 in Creative and Cultural sectors is based. In fashion and textiles sectors
however representation is relatively higher than other creative sectors and the
economy as a whole at 14%.79
• Evidence shows that for some sectors in Creative Media representation of people
from a BAME background is decreasing for example 7.2% to 4.6% in Commercials
and Pop Promos and 5.9% to 3.5 in Corporate Production.80
• Many in the Creative Industries’ workforce are young; two fifths (42%) in Creative
Media is under 35 years81 and half (52%) in the Creative and Cultural sector is
under 40 years. In some sectors of the Creative Industries the workforce is ageing
and significant proportions fall into older age bands; 29% in photo imaging82 and
70 Skillset (2009) Employment Census. Figures exclude film production freelancers, photo imaging, publishing, creative % cultural and fashion & textiles sectors. 71 Cultural Leadership Programme/TBR (2009) Women in Leadership.
72 ONS (2009) LFS April-June. 73 Skillset (2006) Balancing Children and Work in the Creative Media Industries 74 Creative Media: Skillset (2009) Employment Census, Skillset/UK Film Council (2008) Feature Film Production Workforce Survey, Skillset (2007) Photo Imaging Workforce Survey and ONS (2009) LFS April-June. 75 Creative & Cultural Skills (2008) Creative and Cultural Industry: Impact and Footprint.
76 UKCES (2009) Almanac.
77 Skillset (2009) Employment Census, Skillset/UK Film Council (2008) Feature Film Production Workforce Survey, Skillset analysis of Experian 2007, ONS (2009) LFS April-June.
78 Creative & Cultural Skills (2008) Creative and Cultural Industry: Impact and Footprint.
79 UKCES (2009) Almanac).
80 Skillset (2009) Employment Census. 81 Skillset (2008) Creative Media Workforce Survey, Skillset/UK Film Council (2008) Feature Film Production Workforce Survey, Skillset (2007) Photo Imaging Workforce Survey and ONS (2009) LFS April-June. 82 Skillset 2007 Photo Imaging Workforce Survey

22
34% in publishing83 is 50 years or older and 44%84 in fashion and textiles is 45
years and older much of which is due to the ageing population in manufacturing.
• For the most part the Creative Industries is highly skilled and one of the most highly
qualified in the economy; compared with 35%85 of the population of working age in
57%86 in Creative Media and 54%87 in Creative and Cultural sectors has a degree
or equivalent level 4 qualification.
• In Creative Media and Creative and Cultural sectors freelancers in particular tend to
have degrees (57% compared with 54%88; 57% compared with 50%89) and in some
sectors this is the case for more women than men. In Fashion and Textiles just
13% has a degree and a fifth hold no qualifications compared with only a tenth
(9%) across the wider economy.90
2.6 Recruitment at Entry Level onwards
Most sectors of the Creative Industries have long been characterised by an oversupply
of potential new entrants keen to enter an area commonly seen as glamorous and
exciting. One result of this oversupply has been a high level of voluntary or unpaid
working undertaken in order to get a foot in the door and a first paid job: more than two
fifths (44%) of the workforce in Creative Media report having worked unpaid in order to
get into the industry. Formal recruitment measures such as advertising and recruitment
agents are still relatively uncommon in most sectors of the Creative Media and a third
report entering the industry this way and this reduces to a quarter for those already in
the industry. More people report securing both their first and current job through
informal channels such as word of mouth or personal contact. 91
83 ONS (2009) LFS April-June. 84 UKCES (2009) Almanac.
85 Ibid
86 Skillset (2008) Creative Media Workforce Survey, Skillset/UK Film Council (2008) Feature Film Production Workforce Survey, Skillset (2007) Photo Imaging Workforce Survey and ONS (2009) LFS April-June. 87 UKCES (2009) Almanac. 88 Skillset (2008) Creative Media Workforce Survey, Skillset/UK Film Council (2008) Feature Film Production Workforce Survey, Skillset (2007) Photo Imaging Workforce Survey and ONS (2009) LFS April-June.
89 Creative & Cultural Skills (2008) Creative and Cultural Industry: Impact and Footprint.
90 UKCES (2009) Almanac.
91 Skillset (2008) Creative Media Workforce Survey. Figures include Creative Media apart from film production, photo imaging and publishing.

23
Lack of information on the range of occupational roles also complicates the picture and
employers report that potential new entrants (known as the X Factor generation) have
little knowledge about working in the industry and less about how to enter. This results,
for example, in an oversupply in most general ‘Media roles’ but skills shortages in
areas like Broadcast Technology, Engineering, the more craft orientated occupations
and roles that develop new products and processes in fashion and textiles.
Lack of information getting to new entrants coupled with informal entry routes and high
qualification entry bars are resulting in serious representational issues (socio-
economic, gender and BAME representation). Addressing diversity is a key challenge.
The business case needs to be ‘sold’ to industry. 2.7 Retention
Across most sectors of the Creative Industries the oversupply of people wanting to
enter the industry has also had implications for retention as well as recruitment. As
already noted, people who choose to start a family commonly find it difficult to combine
this with a career in the industry and the problem appears more acute for women. 92 It
is also possible that the perception of ease of replacement overlooks the value of the
skills and experience gained by people leaving the industry typically in their thirties and
forties; the industry thus routinely and avoidably loses a highly skilled segment of its
workforce to other sectors of the UK economy.
This situation is exacerbated by freelancing and ensuring freelancers have skill
currency and are agile (available) at times of work fluctuation, an issue for those
sectors where this freelance pool is a significant part of the workforce. Added to which,
as noted earlier recent research93 has shown that since the recession women and
BAMEs are now less well represented in some sectors of the industry compared with
2006.
Some of these people have (e.g. TV, Advertising) or could end up leaving the sector at
this crucial time, taking their experience and talent with them. The risks these factors
pose need to be monitored through SSC research and addressed to sustain the vitality
of this strategically important sector.
2.8 Government Policy The strong growth of the creative economy has focused Government’s attention on the 92 Skillset (2006) Balancing Children and Work in the Audio Visual Industries. Figures include Creative Media only. 93 Skillset (2009) Employment Census. Figures include Creative Media only.

24
industries in terms of their economic, social and cultural role. The Creative Industries
have a long history of being good at invention and creativity but bad at investment and
management94. These have been identified as key areas for improvement across the
sector - identified in the Sainsbury Report (2007), Innovation Nation (2008), and the
publication of Creative Britain: New Talents for the New Economy (2008):
“Now is the time to recognise the growing success story that is Britain’s creative
economy and build on that. The creative industries must move from the margins to
the mainstream of economic and policy thinking, as we look to create the jobs of
the future” .95
In particular Creative Britain acknowledges the need to engage young people, enabling
the opportunities for them to experience high quality culture within and outside school.
The Government’s recent move towards industrial activism and strategic public
investment in key industry growth sectors also highlights the pivotal role the Creative
Industries hold within the economy.
“In their own right, the three major components of our digital sector – information and
communication technologies (ICT), broadcasting and the creative industries – make a
significant contribution to the UK economy in terms of output and employment… As for
the creative industries forecasts made by PricewaterhouseCoopers before the
economic downturn suggest that the global market would continue to grow strongly
year on year between 2009 and 2012”96.
The review of infrastructure as part of Digital Britain included a review of the UK’s
position globally in terms of both the ‘pipes’ (technology infrastructure and broadband
access) and the poetry (creative content). The report and recommendations identified
the potential for the UK to increase its position in the global league table with the right
strategic focus from both government and industry. Skills and people were very much
at the centre of this analysis and the Digital Economy is now an identified sector of
priority.
3 Current Skills Needs
94 http://www.creative-choices.co.uk/creative-economy/
95 DCMS, BERR & DIUS (2008) Creative Britain: New Talents for the New Economy 96 DBIS (2008) Jobs of the Future

25
Despite the fact the sector is very highly skilled as noted earlier, it is not highly geared
and continued investment is key.
A key unifying feature of the Creative Industries’ recent past, present and future, and
perhaps the greatest single movement in its skills requirements is due to advances in
digital technology, transforming the ways in which creative content and creative
products are generated and distributed. Digital platforms and processes require not
only new technical skills, but also the development of new business models, flexible
and adaptive management and visionary creative leadership. Traditional production
processes are being questioned, and new techniques rapidly move from “cutting edge”
to industry standard. Although the importance of learning the skills to use technology
cannot be overstated, the benefits of a fully digital workflow will only impact when
production staff embrace and adapt to the collaborative working enabled by new
techniques.
A large proportion of roles in all sectors are industry-specific and often highly
specialised. Many roles are esoteric and require up to date skills with particular
machinery or software. There is thus a very wide range of skill areas within the sector,
and often a small labour pool from which to recruit too many of those areas. This can
mean that in spite of the oversupply of potential new entrants to the industry, serious
gaps and shortages can and do occur in particular areas.
Some of the skills issues that have arisen as a result of the above factors are described
below.
3.1 Skills Shortages
Many areas of the Creative Industries have long been characterised by an oversupply
of potential new entrants. One result of this has been a high level of voluntary or unpaid
working, with nearly half the workforce in Creative Media reporting having worked
unpaid in order to get into the industry97. Mismatch of applicants’ skills to the needs of
the job is a common issue, and experience in work is often a much greater priority than
academy qualifications.
97 Skillset (2008) Creative Media Workforce Survey. Figures includes Creative Media apart from film production, photo imaging and publishing.
26
Across many sectors the Creative industries, skills in short supply from new entrants
relate directly to new and digital technology including production skills for multi-
platforms, understanding of intellectual property legislation, management and
leadership, and commercial acumen to monetise content for example. In the Creative
Media industries, the most common areas of training identified by employers are
related to new and digital technology (one in four people). In addition management and
leadership skills to take advantage of and monetise this content are a priority for the
sector (cited by one in ten people)98. Previous research has also found that fashion
graduates though strong on creative ideas are lacking in technical skills and major
skills shortages include design and textile technology.99
Multi-skilling competence is a significant requirement of digital and traditional creative
workflow, from content creation and metadata management to production and
distribution. Yet there is a shortage of new people in the industry equipped with ‘T-
skills’ - highly specialised in one core field, but with broad skills and knowledge to
utilise their specialism across teams and platforms.100
Broadcast engineering has long been recognised as a skills shortage area101. A
combination of lack of new recruits; inappropriateness of training provision in further,
higher and commercial education; an ageing profile of the workforce; lack of a
framework for continuing professional development; and the rapid impact of
technological change has meant that many companies feel this area is a priority for
action102.
Visual Effects (VFX) is dependent on highly specialised technical and artistic skills that
are also in considerably short supply globally. Visual effects companies are recruiting
from all over the world to meet that demand for specialised technical roles, and VFX
has been placed on the Home Office skills shortage list103.
Advertising businesses and employers in visual arts had significantly more difficulty
finding candidates with the appropriate specialist skills, with 74% and 80% of
employers respectively stating this as an issue.
98 Skillset (2009) Archives Skills Strategy, Skillset (2008) Creative Media Workforce Survey. Figures include Creative Media apart from film production, photo imaging and publishing. 99 Skillfast-UK (2008) Survey of Businesses.
100 Skillset (2009) A Skills Review for the TV & Radio Sector; Skillset/UK Film Council (2005 and 2008) Feature Film Production Workforce Surveys. 101 Skillset (2008) Creative Media Workforce Survey, Skillset (2006) Balancing Children and Work in the Audio Visual Industries, Skillset (2005) Survey of the Audio Visual Industries’ Workforce, Skillset (2003) Workforce Survey. 102 Skillset/IABM (2009) Final Summary Report from the M.TEST Project and Recommendations. 103 Skillset Submission to the Development of MAC Shortage Occupation Lists, 2009.

27
Graphic design roles are integral to the success of the Creative Industries, particularly
those with technical knowledge and skills, and are in short supply particularly in
advertising and design businesses reported by 46% and 32% of businesses
respectively.104
Skilled archaeologists and visitor relations occupations are in short supply in cultural
heritage.105
Specific operations in fashion and textiles with skills shortages include sewn products,
textile process, laundry and dry-cleaning.106
Skills shortages have major implications for the productivity of Creative businesses and
in Creative and Cultural sectors alone almost half have since experienced an increased
workload for others, a quarter have lost business and a fifth have needed to turn
business away. 107
3.2 Skills Gaps
In the Creative Media and Creative and Cultural sectors of the Creative Industries skills
gaps are more evident than across the wider economy; one in two companies in the
Creative Media industries reports skills gaps108 and this is the case for almost two fifths
(39%) in Creative and Cultural.109 Just over a tenth of Fashion and Textiles businesses
have skills gaps.110
A major gap in skills (and knowledge) evident across the Creative Industries is working
with and exploiting digital technological advances111 (including specific software
applications). New skills are needed to meet demand for quality content on any
platform; in Creative Media this multi-platform capability is the second highest skills gap
104 Creative & Cultural Skills (2009) Creative and Cultural Industries Workforce Survey.
105 ibid
106 Skillfast-UK (2008) Survey of Businesses.
107 Creative & Cultural Skills (209) Creative and Cultural Industries Workforce Survey.
108 Skillset (2009) From Recession to Recovery. Based on a sample of 262 employers.
109 Creative and Cultural Skills (2009) Creative and Cultural Industries Workforce Survey.
110 UKCES (2009) Almanac.
111 Skillset (2009) From Recession to Recovery, Skillset (2008) Creative Media Workforce Survey, Skillfast (2009) Sector Skills Assessment Executive Summary, Creative and Cultural Skills (2009) Creative and Cultural Industries Workforce Survey.

28
among the workforce112 and one of the top three skills gaps resulting from the
recession, cited by one in four employers113.
Management, leadership and business skills are major development needs across the
workforce in all Creative Industries in order to maximise opportunities at this time of
change including the contribution of the workforce. In Creative Media this is particularly
in relation to project and production management for multi-platform.114 On a senior
management level, gaps in negotiation and leadership skills are frequently associated
with the challenges of managing the change from traditional to digital. In Creative and
Cultural occupations with a relatively high proportion of skills gaps cited by employers
include management (13% of employers) and marketing (14%). Considering
management and marketing together, there are significant issues in the transferable
and business related skill sets of the current workforce115. In Fashion and Textiles
major skills needs are sales and marketing (48%) and management, leadership and
supervisory (47%) skills cited by one in two employers.116
Overall, Creative Industry professionals need to become increasingly multi-faceted.
Ideas often need to be multi-disciplinary and media neutral so that they can be applied
down a number of channels. The increasing importance of digital content has led to a
growth in the value of specialists in this discipline, expanding existing roles and
creating entirely new roles. This has the knock on effect of increasing employee churn
and higher salaries. Across industry, people are required to have a broader
understanding of technologies related to their function, be it software, hardware or
communication technology. In Fashion and Textiles this has implications for team
working skills which are currently lacking.117
Skills shortages have major implications for the productivity of Creative businesses. In
Creative and Cultural sectors alone almost a half (45%) stated that skills shortages
increase the workload of others, a quarter (26%) has since experienced lost business
and a fifth (17%) an increased workload for others.. 118
112 Skillset (2008) Creative Media Workforce Survey. 113 From Recession to Recovery, Skillset 2009. Based on a sample of 262 employers. 114 Skillset (2009) From Recession to Recovery (based on a sample of 262 employers), Skillset (2008) Creative Media Workforce Survey, Skillset (2009) A Skills Review for the TV & Radio Sector. 115 Ibid
116 Skillfast UK (2008) Survey of Businesses (internal report).
117 Skillfast (2009) Sector Skills Assessment Executive Summary.
118 Creative & Cultural Skills (2007) Creative Blueprint

29
3.3 Skills Supply
3.3.1 Skills Supply: The Education System
Considering the education system and the workforce of the future, a suite of issues
affect the success of the Creative Industries. For example:
In Higher and Further Education
• For Creative Media alone there are 13,000 media programmes at Further and
Higher Education levels serving an estimated 50,000 students and there are
180,000 FE and HE courses that relate to the Creative and Cultural sectors.
Although this provides valuable skills into the wider community, too many courses
produce graduates with insufficient specialisms to meet Creative Media employer
needs. Employers in Creative and Cultural and Fashion and Textiles also find skills
lacking from graduates, and along with Creative Media there is a significant gap in
potential new recruits being work ready, for example lacking commercial
awareness.
• Employers are keen to promote greater uptake of Sector Skills Council backed
courses and accreditation services, which identify provision that best meet industry
needs. This includes the Screen, Media and Creative and Cultural Academies, the
Skillset accreditation of degree programmes and the Industry Select kite marking
being developed by Creative & Cultural Skills.
• Work is now also underway to position the Skillset Academies and Accredited
Courses, and the National Skills Academy for Creative & Cultural Skills, as the
suppliers of higher level professional skill development and applied research,
however this needs to be accelerated and the need for brokerage between Industry
and the providers needs to be recognised and funded,
In schools and colleges
There are significant issues with careers advice. Students generally are not receiving
high quality advice to help them understand the opportunities across the Creative
Industries and make appropriate subject choices. The online sites Skillset Careers119
and Creative Choices° have been established to help rectify the gap of relevant careers
information, advice and guidance for the Creative industries.
3.3.2 Skills Supply: Workforce Development 119 www.skillset.org/careers.

30
Despite being highly qualified demand for training remains high in the Creative
Industries. In Creative Media the most common areas of training needed relate to multi-
platform content and new and digital technology (one in four people identify this
need).120 One in two people declared a current need for training. Six in ten had
undertaken training in the previous year, receiving an average of 11 days each (an
increase from 7 days in 2005). Comparing employees with freelancers, freelancers
were more likely to need training (60%). A smaller proportion of freelancers had
undertaken training (43% v. 65%) but those who had taken training had undertaken
more (an average of 13 days v. 9 days).121
Barriers to training are also a challenge for the Creative Industries. In the 2008 survey,
nine in ten in the Creative Media workforce reported barriers or obstacles to training.
Overall, the most common were that fees are too high (40%), employers were unwilling
to pay for training (34%). There were considerable differences between the
experiences of Creative Media employees and freelancers. A far higher proportion of
freelancers than employees reported virtually every type of barrier. For example,
freelancers were more likely to say fees were too high (reported by 62% of freelancers
vs. 34% of employees), and to fear losing work due to committing time to training (37%
vs. 7%). The only barriers more widely reported by employees than freelancers were
difficulty assessing the quality of courses, and employers being unwilling to pay for
training.122 More recently, one in two Creative Media companies said their ability to
deliver training has been affected by the recession.123 In Creative and Cultural sectors
both time and the availability of funds are also major barriers to filling skills needs cited
by almost two fifths (37%) and a quarter of respondents when asked in 2009.124
A particular issue in terms of workforce development for the digital economy is the key
role of leaders and managers in the Creative Media industries in creating new business
models and exploiting the opportunities provided by digital platforms. SMEs in
particular need help, which is not currently widely available, to understand the potential,
find new approaches to content creation and Intellectual Property exploitation, and
develop new business models for growth.
120 Skillset (2008) Creative Media Workforce Survey. Figures include Creative Media apart from film production, photo imaging and publishing.
121 Ibid. 122 Ibid. 123 Skillset (2009) From Recession to Recovery. Based on a sample of 262 employers. 124 Creative & Cultural Skills (2009) Creative and Cultural Industries Workforce Survey.
31
3.4.3 Skills Supply: Access to Finance
As noted above a major barrier to training and development is lack of finance. In
addition, the Creative Industries, despite displaying growth rates above the normal rate
of the economy receive below average funding for training provision; in England for
example, at the last count average spend per person over a twelve month period was
£1,615125, for the Creative Industries this drops to £1,004126.
Accessing financial and strategic support via a simple system which in turn supports
investment in training and development in the Creative Industries is vital. This is
particularly so due to the large proportion of micro-businesses (fewer than 10 people)
and freelancers,127 for whom the resource implications of training and development are
too much of a strain in the short term to even consider the possible benefits in the
medium-long-term. NESTA for example has identified that almost half of creative
businesses depend on personal savings for business set-up costs. 128 The recession
resulted in resources that are even more stretched than they were before. The Creative
Industries’ potential can be realised with sufficient and fit for purpose investment in
skills and development.
The Creative Industries currently enjoy less financial investment compared with other
growth industries. In the Construction Industry for example, through an agreed levy
with employers Construction Skills is able to raise an agreed £120 million a year to
contribute to training provision in the sector129. This does not include either public
sector funding or additional funding from individual employers. Skillset has in place
agreements with the film and TV industry to collect, manage and strategically invest
voluntary contributions with the support and involvement of the industry, to respond to
skills needs. In the year 2008/9 these contributions yielded just over £3 million pounds.
We are working in tough times and finances are limited but as noted earlier businesses
that do not invest in training and professional development during a recession are two
and a half times more likely to fail than those who do.130
Disparities are also evident for example with funding available to deliver
apprenticeships and CPD. In the Creative Industries funds allow apprentices to receive
approximately half the amount enjoyed by an electronics apprentice (£6,000 compared
125 UKCES Almanac (2009)
126 Ibid 127 Including sole-traders. 128 NESTA (2008) Creating Innovation 129 Construction Skills, Sector Skills Assessment for the Construction Sector 2009, page 33, http://www.cskills.org/uploads/ssareportfull2009_tcm17-17996.pdf 130 DIUS (2008) Skills for Business
32
with £13,000). Before 2007, £50 million was being negotiated with Construction Skills
and the LSC for NVQ programs to be rolled out on work sites131. SEMTA also secured
£65 million from the Train 2 Gain fund to feed directly into their industries, with the
focus being on training for people in SME’s132. The equivalent Train to Gain funds
distributed to Skillset ‘s footprint as part of their Sector Compact with the LSC totals
£11 million for a three year period and the Creative Media industries have a large
amount of micro-enterprises that fall out of the boundaries of Train to Gain’s funded
training provision.
3.3.4 Skills Supply: Diversity
A particular issue in terms of skills supply into the Creative Industries is the
demographic profile and particularly the under-representation of women, people from a
BAME background and evidence of people leaving the industry in their thirties and
forties.133 In addition in some Creative Media sectors this problem is exacerbated as
noted earlier representation of women and BAMEs is falling.134 In addition, the
industry’s traditional reliance on an extremely young workforce may in the future be
challenged by the changing demographics of fewer young people coming through the
education system. Sectors experiencing an increasing age profile such as Fashion and
Textiles will require extensive training and development over a prolonged period as
people are brought into replace those who retire.
A workforce representative of our population is key to economic success and
‘…organisations that want to do business with this changing population realise they’ll
have a better chance if the make-up of their own workforce mirrors that of their
potential customers’.135 If this is not addressed fast it could potentially represent a
major gap in qualifications and experienced talent with implications for the industry at
large.
131 Construction Skills, Sector Skills Assessment for the Construction Sector 2009, page 33, http://www.cskills.org/uploads/ssareportfull2009_tcm17-17996.pdf 132 SEMTA Sector Skills Agreement, Electronics, Automotive and Aerospace Industries, page 4, http://www.semta.org.uk/PDF/SSA%20%20elec%20auto%20and%20aero.pdf 133 Skillset (2008) Creative Media Workforce Survey, Skillset (2006) Balancing Children and Work in the Audio Visual Industries, Skillset (2005) Survey of the Audio Visual Industries’ Workforce, Skillset (2003) Workforce Survey. 134 Skillset (2009) Employment Census. 135 From Samir Shah’s address to the audience of a recent RTS Fleming Memorial Lecture.

4 Anticipating What Lies Ahead
4.1 The Future for the UK’s Creative Industries
The current ways of imagining the Creative Industries’ possible future are hide-bound
by path dependency thinking and a lack of fit between supply and demand. As David
Guile says, “The root of the problem that Skillset and C&CS jointly face is the assumed
link that the government believes exists between qualifications and access to the
labour market. This is predicated on a notion that there are functioning Occupational
Labour Markets (OLMs) and firm-specific ‘internal labour markets’ (FILMs) in the C&C
sector, that these labour markets will channel the flow of highly qualified students
towards their preferred occupational destinations, and that employers will use
qualifications as a proxy measure for vocational practice in the recruitment process.
These assumptions are, as we have seen, wide of the mark and, as a consequence,
Skillset and C&CS‟s efforts to support aspiring entrants to gain access to the C&C
sector are floundering.”136
It is thus critical that policymakers understand the granularities of the Creative
Industries and their atypical presentation in the labour market data. This is not a sector
dominated by mature, large employers that can offer secure organisational labour
markets replete with a full suite of in-work and off-site training provision. The strength
of the sector is its diverse provision of atypical employment characterised by a strong,
and in some sub sectors such as film production, primary external labour market
(ELM). The high level of qualifications held by entrants is in stark contrast to the
usefulness of those qualifications in workplace situations. The current VET system
does not work for this sector.
Consequently although the national policy rhetoric affirms the centrality of ‘choice’ and
‘flexibility’, flexibility and choice are sadly lacking in today’s system. The Leitch Review
heralded a much trumpeted change from a supply-side driven skills system to a
demand side driven system, yet what faces the creative media sector is merely an
opportunity to tailor pre-given blueprints rather than endogenously create their own.
Policymakers operate a ‘welfarist’ system of regular targets hit annually accompanied
by ‘fordist’ mechanisms of so-called quality control such as funding FE colleges and
private training providers on the basis of training volumes and training completions.
136 Guile, D (2009) Learning to work in the creative and cultural sector: new spaces, pedagogies and expertise.

34
As a very recent Policy Exchange pamphlet137 articulated, “As a starting point, we
argue that policy will only become truly demand-driven if we scrap these qualifications
targets. Whilst it must be emphasised that the targets are admirable, in intent and
ambition, they have unfortunately damaged the skill system in this country. Learners
and employers will determine whether or not the system is working, based on whether
it successfully meets their needs and demands.”
Such assumptions about labour market operations in the Creative Industries (that there
should be functioning organisational labour markets) are thus strait-jacketing policy and
hampering future growth. Of course most employment in the wider economy remains
permanent and full-time and certainly employment rather than self-employment
remains the choice of the vast majority of UK workers, but as argued above, this is not
true of this sector and nor will it be.
Creative Industries are the frontier of change in the way organisational forms are
evolving. Put another way, in all areas of Creative Industries the ‘external’ is becoming
the ‘internal’. Just because atypical forms of employment contract found in the Creative
Industries are not showing up en masse in the economy as a whole does not mean
they are not very pertinent to this sector’s success. Rather than try and squeeze a
square peg into a round hole, the future must be based in current reality. A sector
dominated in large part by an external labour market needs a far more flexible skills
system. A more differentiated strategy will thus enable, rather than disable, industry
recognised activities that count towards the gaining of experience and social capital
and the development of a personal occupational labour market as the basis for future
success.
4.2 Growth Potential
Pre-recession forecasts suggested that the UK entertainment and media market would
grow by 5.8% compound annual growth rate for the five years to 2012, to reach $152
billion.138 However, since then, the Creative industries have been subject to significant
challenges as set out earlier in this report. Given the turbulence, it is difficult to source
reliable future estimates of industry spend and employment forecasts. In early 2009,
NESTA released a forecast that, between 2009 and 2013, the UK Creative industries,
would grow on average at 4%, more than double the rate of the rest of the economy, 137 http://www.policyexchange.org.uk/assets/Simply_Learning_-_Jan__10.pdf
138 PWC UK (2008) Global Media & Entertainment Outlook 2008-2012.

35
and, by 2013, would employ 1.3 million people.139 In this forecast, the Creative
industries are expected to contribute £85 billion to UK GVA in 2013, up from £57 billion
in 2006. This optimistic medium-term outlook is primarily due to the opportunities for
innovation as increasing numbers of creative businesses take advantage of digital
technologies to develop new business models, for example the digital distribution
model which has been exemplified by the success of ‘iTunes’.140
Major events such as the US Presidential election and the Olympics of 2008 saw
increased use of media but mostly digital media and on these occasions television
dominated in terms of viewing figures and revenue,141 a phenomenon that is set to
increase with major events in the short term for example the UK General Election 2010.
To meet this heightened demand in terms of quantity i.e. the amount across the range
of platforms and crucially in terms of the quality of and sophistication of content, our
digital media industry needs the associated skills and this requires investment.
Many analysts predict that traditional incumbent companies will remain dominant,
sometimes through acquiring companies with a strong digital presence.142 The
opportunities presented by developing technology may be beyond the scope of almost
all single companies, even large established multinationals or conglomerates. Alliances
and partnerships will therefore be formed for opportunities to be realised, commonly
with Technology companies, and sometimes with companies that will be competitors in
other markets.
Though not the case for all sectors e.g. designer fashion, as noted earlier over recent
months the number of people employed in some sectors of the Creative Industries has
been in decline. However the labour pool is likely to increase as demand for creative
content and products continues. Highly skilled freelancers particularly are predicted to
be in demand due to new developments in the industry e.g. digital technology, that are
likely to see businesses needing many skills for short periods before a steady market is
achieved. This will put an increasing pressure on already limited funds for investing in
freelancers’ skills and development. In addition, another consequence of the present
economic climate is that it is becoming increasingly difficult for individuals to secure
mortgages and other types of credit without a permanent employment contract. As a
result, some individuals may be likely to leave the sector entirely, taking their skills and
talent with them. There is a significant danger of losing a highly skilled and 139 Forecast Includes software and reproduction of computer media.
140 ‘UK creative industry to drive significant growth to UK economy’, Press release, NESTA 19/02/2009. 141 Deloitte (2009) Media Predictions, TMT Trends. 142 Skillset (2008, 2009) Strategic Plan 2008-2011.

36
experienced cohort of the workforce in whose development there has been significant
investment.
4.3 Changing Skills Needs
Across all Creative industries, there is recognition of the dramatic changes brought
about by the digital environment and the need to upskill to make the most of it. The
following are of particular importance143:
- Multi-skilling: an understanding of different technology and their impact on
content development, products and digital work flow, and new approaches to
working in cross-functional creative / technical teams within and across
companies.
- Multi-platform skills: the creative and technical skills to develop and produce
creative content for distribution across all potential platforms, and the ability to
understand and exploit technological advances.
- Management, leadership, business and entrepreneurial skills: he hybrid skills
combining effective leadership with innovation, creativity and understanding
of technology, and the analytical skills to understand audience interests and
translate it into business intelligence; and project management for multi-
platform development.
- IP and monetisation of content: understanding of intellectual property
legislation to protect from piracy, and exploiting intellectual property
internationally to take full advantage of emerging markets - with particular
focus on the ability to deal with the problem of illegal downloading and
copyright infringement.
- Broadcast engineering: continuing to be an area of skills shortage.
- Archiving: archiving of digital content being an area which is attracting
increased attention as a challenging issue for the future.
- Sales and marketing: being particularly important in commercial radio, fashion
and textiles and graphic design occupations, and an emerging need in other
sectors.
143 Skillset (2008) Creative Media Workforce Survey, Skillset (2009) A Skills Review for the TV & Radio Sector, Skillset/UK Film Council (2008) Feature Film Production Workforce Survey.

37
- Graphic design roles – in short supply particularly in advertising and design,
and emerging in other sectors.
- Skilled archaeologists and visitor relations experts are in short supply in
cultural heritage.
- Fashion occupations with a combination of both creative ideas and technical
skills and major skills shortages include design and textile technology.144
There needs to be particular recognition of the needs of the freelancers upon whom so
much of the Creative Industries depend.
144 Skillfast-UK (2008) Survey of Businesses

38
5 Geographical Differences in Labour and Skill Need
5.1 Sector Employment across the UK
As is shown in Table 5 below nine tenths of the Creative Industries workforce is found
in England with the greatest concentrations in London, the South East and the North
West.
Table 5 Work base of Creative Industry Workforce145
Nation/English region % of UK total Creative
MediaCreative
and Cultural
Fashion and
Textiles WALES 4% 4% 3% SCOTLAND 5% 7% 7% NORTHERN IRELAND 3% 2% 2% ENGLAND 89% 88% 88%
All London 35% 24% 14%
South East of England (excluding London) 11% 14% 7%
South West of England 9% 9% 8%
West Midlands 4% 6% 6%
East Midlands 4% 7% 15%
North East of England 2% 3% 3%
Yorkshire & the Humber 7% 7% 10%
East of England 7% 9% 8%
North West of England 10% 9% 17%
Source: Skillset (2009) Employment Census, Skillset/UK Film Council (2008) Feature Film Production Workforce Survey, Skillset (2007) Photo Imaging Workforce Survey, ONS (2009) LFS April-June, Creative & Cultural Skills (2008) Creative and Cultural Industry: Impact and Footprint and UKCES (2009) Almanac.
There are considerable differences between sub sectors at a regional level in England.
For example the prominence of regional and local radio within both the BBC and the
commercial sector, and the growth of community radio, radio is distributed more evenly
throughout the UK than many sectors. Conversely, sectors such as independent
production for television, film production, commercials and corporate production all
remain very London-centric. 145 Skillset (2009) Employment Census, Skillset/UK Film Council (2008) Feature Film Production Workforce Survey, Skillset (2007) Photo Imaging Workforce Survey, ONS (2009) LFS April-June.

39
In recent years, there have been some major endeavours and interventions to
redistribute some sectors more evenly throughout the UK. This is illustrated most
clearly in the relocation of large segments of the BBC’s workforce, mainly from London,
to Salford Quays in the North West of England and a corresponding decrease in West
London from 16% to 13%, which is reflected in Skillset’s 2009 Employment Census.146
5.2 Characteristics of the Workforce
Most key occupational groups within the industry operate within a national or
international labour market; people will generally need to be willing to travel to
wherever work is in order to develop or sustain a career in the industry. The profile of
the workforce in each nation or region tends therefore to reflect the profile of the
dominant sectors there rather than the profile of the working population in the area. The
workforce in London contains higher proportions of BAMEs, though this is largely due
to high representation in lower level, generic roles.147
For many of the Creative Industries the qualification level varies only slightly by
geographical area and for example in Creative Media more than half in each nation and
London has a degree. In Creative and Cultural however the qualification level for the
sector as a whole is not reflected; for example 63% of in London compared with 32% in
Northern Ireland has a degree (or equivalent level qualification).148
5.3 Recruitment and Skills Issues
There are few differences across the UK in the levels of reported skills gaps or
shortages given the wide geographical scope of the labour market. In Creative Media
however, considerable debate has taken place around the challenge of nurturing
growth and development in the nations and regions outside London. There is perceived
to be a lack of senior roles outside London in both management and production. For
example in TV a number of industry leaders have pointed to the lack of a critical mass
of production making it difficult either to grow indigenous talent, or to persuade high-
level industry professionals to relocate. The tendency by broadcasters to commission 146 Skillset (2009) Employment Census. Figures include Creative Media apart from film production, photo imaging and publishing.
147 Skillset (2009) Employment Census, Skillset/UK Film Council (2008) Feature Film Production Workforce Survey, Skillset (2007) Photo Imaging Workforce Survey, ONS (2009) LFS April-June. 148 Creative & Cultural Skills (2008) Creative & Cultural Industry : Impact and Footprint

40
single series only has also been cited as holding back the development of a local talent
base as broadcasters tend to want to use known executive producers on programmes,
but it is not feasible to relocate talent on the basis of a single commission.
Commissioners would therefore need to commit to at least two returning shows in a
region in order to facilitate relocating senior talent and to build an indigenous talent
pool at other grades. As such, training schemes outside London can only succeed if
there are job opportunities once training is completed.
For Creative and Cultural sectors a higher proportion of employers in Scotland have
difficulty recruiting (32% compared to 13% across the UK) and those in Wales have
experienced least difficulty, with only 4% experiencing recruitment issues. ICT skills
gaps are seen to have the greatest impact in England and Wales, while in Scotland this
has been through a gap in marketing/advertising/PR skills. Employers in Northern
Ireland concur with the Scotland perspective, with marketing/advertising/PR skills gaps
being perceived as having the greatest impact149. Employers in Wales, Scotland and
Northern Ireland tend to undertake/provide more training than those based in England.
Businesses in Northern Ireland provide the most, with 55% undertaking or providing
some form of training or development in the last 12 months compared to 39% across
the UK150.
149 Ibid 150 Ibid

41
Annex A Creative Industries and Gaps in Official Data Sources
Official data sources that rely on Standard Industrial and Standard Occupational
Classifications are broadly effective for photo imaging and publishing for the purpose of
collecting and representing employment and some skills data but less useful for
capturing data for the rest of the industry. As noted earlier,
• Key elements of the Creative Industries sit in broad classifications that
include activity outside of Creative Industries preventing any discrete and
crucial analysis e.g. Interactive Content Design, Content for Computer
Games, Facilities, elements of Music Practice.
• Official data sources to a greater or lesser extent systematically exclude
the increasing freelance labour pool required to create and distribute the
creative content and products upon which our economy is becoming
increasingly reliant.
• In some cases sample sizes are too small to enable discrete analysis of
data contained within SIC that do exist.
As noted earlier gaps in official data sources have been filled by primary research
conducted by SSCs where possible. This includes data captured via the research
programme managed by Skillset that was established by the Audio Visual Industries
Training Group (including the DCMS) a decade ago and has since been steered by the
same organisations involved151, a large quantity of data captured and presented in
Creative and Cultural Skills’ Blueprint, Impact and Footprint publications and additional
research conducted by Skillfast UK. The table below provides a full breakdown of
employment in the Creative Media and Creative and Cultural industries from SSC
primary research compared with estimates from official data sources and is followed by
a detailed comparative analysis for these sectors.
For more detail on the methodologies adopted please refer to: www.skillset.org,
www.skillfast-uk.org and www.ccskills.org.uk.
151 http://www.skillset.org/research/committee/

Table 6A Labour Force Survey and Skillset Creative Media Employment Estimates
LABOUR FORCE SURVEY152 SKILLSET153
INDUSTRIES INDUSTRIES SIC 2007
Description Total Employed
Main Sector Sub-sector Total Employed
60.2 TV Programming & Broadcasting activities 49,000 Television Broadcast TV 15,750 59.11/3 TV Programme Production activities 23,000 Cable and Satellite 12,700 59.13/3 TV Programme Distribution activities n/a Independent Production 21,700 Sub-total 72,000 Sub-total 50,150 60.1 Radio Broadcasting 13,000 Radio Broadcast Radio 19,900 Independent Production 1,000 Sub-total 13,000 Sub-total 20,900 59.12 MP, V, and TV Programme Post-Production 3,000 Facilities Post production 7,450 Studio and Equipment Hire 5,900 Outside Broadcast 300 VFX 6,900 Special Physical Effects 700 Manufacture of AV Equipment 2,900 Processing Labs 300 Other Services for Film and TV 18,600 Sub-total 3,000 Sub-total 43,050 59.11/1 Motion Picture Production activities 19,000 Film Film Production155 11,300 59.13/1 Motion Picture Distribution activities n/a Film Distribution 1,200 59.14 Motion Picture Projection activities 15,000 Cinema Exhibition 17,650
152ONS Labour Force Survey April-June 2009. 153 Skillset (2009) Employment Census except for Publishing, Photo Imaging, Creative Occupations outside the industry and where otherwise stated. 154 Ibid. 155 Secondary analysis of unit lists for 2006 feature film productions (80 minutes or longer and minimum budget of £500K.

43
LABOUR FORCE SURVEY152 SKILLSET153
Moving Picture Archives and Libraries 300 Sub-total 34,000 Sub-total 30,450 59.11/2 Video production activities 7,000 Other Content Animation 4,300 59.13/2 Video Distribution activities n/a Commercials and Pop Promos 4,100 Corporate Production 3,950 Sub-total 7,000 Sub-total 12,350 Interactive
Content Design Interactive Content Design 34,250
Sub-total 34,250 Content For
Computer Content and Development 7,000
Sub-total 7,000
Additional Available
50,000
74.2 Photographic activities Photo 156
Photographic activities 74.20/1 Portrait Photographic activities 17,000 Portrait Photographic activities 17,000 74.20/2 Other Specialist Photography not Portrait 2,000 Other Specialist Photography not Portrait 2,000 74.20/3 Film processing 3,000 Film processing 3,000 74.20/9 Other Photographic activities; n.e.c. 26,000 Other Photographic activities; n.e.c. 26,000 Sub-total 48,000 Sub-total 48,000 58.11 Book Publishing 38,000 Publishing157 Book Publishing 38,000 58.12 Publishing of Directories & Mailing Lists 3,000 Publishing of Directories & Mailing Lists 3,000 58.13 Publishing of Newspapers 56,000 Publishing of Newspapers 56,000 58.14 Publishing of Journals & Periodicals Publishing of Journals & Periodicals 58.14/1 Publishing of Learned Journals n/a Publishing of Learned Journals n/a
156ONS (2009) LFS April-June. 157 Ibid.

44
LABOUR FORCE SURVEY152 SKILLSET153
58.14/2 Publishing of Consumer, Business and Professional Journals and Periodicals
41,000 Publishing of Consumer, Business and Professional Journals and Periodicals
41,000
63.91 News Agency activities 7,000 News Agency activities 7,000 63.99 Other information Service activities n.e.c. 9,000 Other information Service activities n.e.c. 9,000 58.19 Other Publishing 32,000 Other Publishing 32,000 Sub-total 186,000 Sub-total 186,000 SUB TOTAL 352,500 TOTAL 482,850 OCCUPATIONS OUTSIDE THE CREATIVE MEDIA INDUSTRY158 OCCUPATIONS OUTSIDE THE CREATIVE MEDIA INDUSTRY159 SOC 2000
Description Total employed
SOC 2000 Description Total employed
3432 Broadcasting Associate Professionals 12,000 3432 Broadcasting Associate Professionals 12,000 5244 TV, Video and Audio Engineers 8,000 5244 TV, Video and Audio Engineers 8,000 3434 Photographers & Audio-Visual equipment operators 23,000 3434 Photographers & Audio-Visual equipment operators 23,000 3431 Journalists, Newspaper & Periodical Editors 21,00 3431 Journalists, Newspaper & Periodical Editors 21,000 5421 Originators, Compositors & Print Preparers 2,000 5421 Originators, Compositors & Print Preparers 2,000
3421 Graphic Designers 85,000 3421 Graphic Designers 85,000 TOTAL 151,000 TOTAL 151,000
INDUSTRIES + OCCUPATIONS160 INDUSTRIES + OCCUPATIONS161 TOTAL 482,500 TOTAL 633,850 NB: ‘n/a’ indicates data not available. All LFS data include all people working and not just those of working age. 158 Skillset’s contract with UKCES does not include responsibility for these occupations outside the Creative Media industry. Due to the nature of the Creative Media labour pool it is likely that people working in these occupations will work in the Creative Media industry at some point and will benefit from the service Skillset provides.
159 Ibid.
160 Ibid
161 Ibid.

45

46
Table 6A shows employment estimates from the Labour Force Survey (April-June
2009) using SIC 2007 against those from Skillset sourced employment data where
there is significant incompatibility, using the Skillset coordinated and industry endorsed
classification system. Figures from both sources have been grouped in ways that differ
slightly from their ‘natural’ organisation within the two respective systems in order to
enable comparison: in other words, the sectors as defined within SIC are not listed in
chronological order, and the broad sector groupings used for Skillset data do not in
every case reflect how the sector is usually mapped, defined or presented by Skillset.
The sector groupings used here are intended purely to illustrate where definitions are
compatible and where they are not, and what is and is not included within each
dataset.
Television The LFS estimate of employment in television is considerably higher than Skillset’s
(81,000 compared with 50,150). There are a number of likely explanations for this.
Analysis of the data at sub sector level shows a close fit between the LFS estimate for
59.11/3 (TV Programme Production Activities) and Skillset’s estimate for Independent
Production for TV (23,100 against 23,000). The LFS estimate is a little higher as it
probably includes some in house production staff employed by broadcasters. The real
disparity is between the LFS estimate for SIC 60.2 (TV Programming & Broadcasting
Activities) and Skillset’s combined estimate for Broadcast TV and Cable and Satellite
(49,000 against 28,450). The main reason for this is likely to be the diversification of
activities now undertaken by broadcasters, and difference in the modes of classification
between the LFS and Skillset’s Employment Census. Specifically, the BBC (by far the
largest employer in this area) now undertakes activity not only in television
broadcasting, but also radio, interactive content design and facilities (e.g. post
production and outside broadcast). In the absence of suitable alternative
classifications, it is likely that all or most individuals employed, say by the BBC, who
respond to the LFS will be classified within 60.2. By contrast, the BBC provides Skillset
with employment returns for the four sectors separately (television, radio, interactive
content Design and facilities). Employees and freelancers working in generic roles
across the business are apportioned according the relative size of each main area of
business. Thus some of the workforce represented within 60.2 is counted by Skillset’s
research within the categories of radio, facilities and interactive content design rather
than television.
47
Radio In contrast to television, Skillset’s estimate for radio comes out considerably higher
than that of the LFS – 20,900 compared with 13,000. In large part, this is likely to be
due to the phenomenon, already noted, of BBC employees across all areas of activity
being classified as within 60.2 (TV Programming and Broadcasting Activities) by the
LFS, but within the specific area by Skillset.
Facilities The facilities sector encompasses a wide range of activities that provide support to
television, film and related areas. The only of these areas captured by a discrete
category within SIC is 59.12 (motion picture, video, and television programme post-
production activities). The LFS reports 3,000 people to be employed in that activity,
compared with 7,450 recorded by Skillset as working in post production. This will be
due in part to the classification by the LFS as some individuals in post production within
TV Programming and Broadcasting (60.2), as already noted. Some other individuals
classified in other sub sectors of facilities by Skillset (e.g. Outside Broadcast and VFX),
may also be classified by the LFS as within 60.2. However, many, employed in areas
such as Studio and Equipment Hire and Other Services for Film and TV, are almost
certainly excluded completely from LFS data cut to capture the footprint as they are
probably counted within SICs that are ‘core’ to another SSC. This cohort of people
almost certainly accounts for part of the overall discrepancy between the LFS and
Skillset data.
Film The overall estimate of employment in film from the LFS is 34,000, slightly higher than
Skillset’s figure of 30,450. While Skillset’s estimates of exhibition/projection and
distribution are slightly higher, the LFS estimate of employment in film production is
considerably higher (19,000 compared with 11,300). The likely explanation for this is
the classification by LFS of some individuals in film production who are recorded by
Skillset in areas such as commercials or animation (see below – Other Content
Creation).
Other Content Creation The sum of these areas as recorded by Skillset comes in higher than the LFS estimate
(12,350 compared with 7,000). As noted above, this is probably due to some of those
classified here by Skillset being counted within Film Production by the LFS.

48
Interactive Content Design Interactive content design accounts for employment of 34,250 people but is not
classified as a discrete sector within SIC and therefore does not show up in official data
estimates of Skillset’s footprint from sources such as the LFS.
Content for Computer Games Content for computer games accounts for employment of 7,000 people but is not
classified as a discrete sector within SIC and therefore does not show up in official data
estimates of Skillset’s footprint from sources such as the LFS.
Reconciling the Data As has been noted above, there are some differences between the LFS and Skillset
sources in how sectors are classified within and between television, radio, film, other
content creation, and post production, but the overall estimates for combined
employment in areas covered by SIC fit very closely.

49
TABLE 6B LABOUR FORCE SURVEY AND CCS CREATIVE AND CULTURAL EMPLOYMENT ESTIMATES
LABOUR FORCE SURVEY162 Creative & Cultural Skills163 INDUSTRIES INDUSTRIES
SIC 2007
Description Total Employed
Main Sector Total Employed
73.11 Advertising Agencies 69,100 Advertising Creative Advertising Agencies 15,700 63.99 Media Representation 25,300 Media Advertising Agencies 5,320 Creative Advertising and Media 420 Sub-total 78,700 Sub-total 21,455 18.20/1 Reproduction of Sound Recording 1,100 Music Composition of Musical Works & Music
Publishing 2,890
59.2 Sound Recording & Music Publishing activities 10,600 Production, Retail & Distribution of Musical Instruments / Audio Equipment
21,930
32.2 Manufacture of Musical Instruments 1,200 Promotion, Management & Agency Related Activities
1,300
Live Performance 50,780
Recording 10190
Retail & Distribution of Recordings 15130
Sub-total 12,900 Sub-total 102,210 74.1 Specialised design activities 96,800 Design Communications, Interior & Exhibition 98,110
Product and Industrial Design 82,410
162 ONS (2009) Labour Force Survey April-June.
163 Creative & Cultural Skills (2008) Impact and Footprint.

50
Stage and Set Design
13,450
Sub Total 96,800 Sub Total 193,970
Craft Glass 1,510 Graphic Crafts 32,400 Heritage and Rural Crafts 6,890 Iron and Metal Crafts 4,530 Jewellery 11,590 Pottery and Ceramics 7,460 Stone Crafts 6,130 Textiles Crafts 12,900 Wood Crafts 4,830 Taxidermy * Sub Total Sub Total 88,250 92.52164 Museum Activities and Preservation of Historical
Buildings 45,550 Cultural
Heritage Museums and Archives 33,620
Built Heritage 16,540 Archaeology 6,865 Other membership Organisations * Sub Total 45,550 Sub Total 57,350 92.31165 Artistic and Literary Creation 119,020 Literature Authors / Writers 50,965 Artistic and Literary Creation 23,430 Sub Total 119,020 Sub Total 74,395
164 SIC 2003 from LFS (2006)
165 Ibid

51
92.32166 Operation of Arts Facilities 24,305 Performing Arts Actors / Entertainers 28,545 92.34167 Other Entertainment Activities Not Elsewhere
Classified 49,370 Dancers / Choreographers 6,400
Arts Officers, Produces / Directors 15,180 Arts Facilities 15,130 Other Entertainment Activities 36,335 Sub Total 73,680 Sub Total 101,595 Visual Arts Artists 28,490 Art Retail 8,990 Sub Total 37,480 Other Theatrical Agencies 1,770 Sub Total 1,770 TOTAL 426,650 TOTAL 678,480 NB: A’*’ indicates a figure below 400.
166 Ibid 167 Ibid

52
Table 6B shows employment estimates from the Labour Force Survey (April-June 2009)
using SIC 2007, and Labour Force Survey (2006) using SIC 2003 for cultural heritage,
performing arts, literature and visual arts, against those from Creative & Cultural Skills
sourced employment data. The sector groupings used here are intended purely to illustrate
where definitions are compatible and where they are not, and what is and is not included
within each dataset.
Advertising Advertising is complicated by the fact that ‘official’ statistics are not considered particularly
relevant to the industry itself. The definition of advertising here includes only the core
agencies that plan, create and place advertisements. SIC data for advertising includes a
wide variety of activities that are un-related to creative practice, such as servicing of
advertising placards and billboards.
Music
The music industry includes official data using coefficients taken from a variety of SIC and
SOC codes, and using research published by organisations in the industry itself in particular
to provide employment figures for Promotion, Management & Agency Related Activities and
Royalty Collectors.
Design In order to estimate total design employment coefficients of the following SIC and SOC
codes have been used:
• Other business activities (74.87)168 which includes speciality (74.87/2) and exhibition
design (74.87/3)
• Artistic literary creation which includes stage and set design (92.31)
• Design and development engineers (2126)
• Graphic designers (3421)
• Product, clothing & related designers (3422)
Cultural Heritage The SIC codes used to define employment in Cultural Heritage are:
• Membership Organisations (91.33) 168 Note that the SIC classification system is revised periodically, and the most recent update uses the code ‘7487’ for ‘other business activities’, whereas the previous version of the SIC system uses ‘7484’.

53
• Museum Activities (92.52)
• Preservation of Historical Sites & Buildings (92.52)
The SOC codes used to define employment in Cultural Heritage are:
• Librarians in Museums (2451)
• Archivists/Curators in Museums (2452)
The Institute of Field Architects (IFA) have produced up-to-date (2007-2008) detailed LMI
about the Archaeology profession. Information regarding employment figures was far more
detailed and precise than available through SIC codes and the APS. Therefore, this data
was used to inform the total employment figures created for the Archaeology segment and
therefore the Cultural Heritage sub-sector. Please see;
• Archaeology Labour Market Intelligence: Profiling the Profession 2007-08, Institute
of Field Archaeologists, June 2008
• Archaeology Labour Market Intelligence: Profiling the Profession 2002-03, Cultural
Heritage National Training Organisation and Institute of Field Archaeologists, March
2003
Performing Arts In order to estimate total performing arts employment the following SICS were used:
• Arts Facilities 92.32
• Other Entertainment Activities 92.34 - a proportion (61.8%)
The SOC codes used to define employment in Performing arts were:
• Actors and Entertainers (3413).
• Dancers and Choreographers (3414).
• Arts Officers Producers and Directors (3416).
Visual Arts In order to estimate total Visual arts employment the following SIC’s was used:
• Retail of Art (52.11-52.63) – a proportion (0.31%) of the retail sector - described
within the Labour Force survey as a range of SICs 52.11-52.63 - to identify this
activity.

54
The SOC code used to define employment in Visual arts was:
• Artists (3411)
Literature In order to estimate total Literary arts employment the following SIC was used:
• Artistic and Literary Creation 92.31
The SOC code used to define employment in Literary arts was:
• Authors Writers (3412).
Craft In order to estimate total Craft firms and employment a combination of data from 50 SICs
was used169. Although the SOC system does include some representation for Craft with
‘Hand craft occupations not elsewhere classified’ (5499) the code was not isolated in this
definition.
169 Please visit www.ccskills.org.uk for more details

55
Table 6C Labour Force Survey Employment Estimates – Fashion and Textiles
LABOUR FORCE SURVEY170 INDUSTRIES
SIC 2003 Description Total Employed
Apparel 18 Clothes Manufacture 52,760 5116 Agents Textiles/Clothing/Leather 14,910 5142 Wholesale Footwear and Clothing 49,030 51479* Wholesale other household goods 4,530 5274* Other repair 10,150 5156* Wholesale intermediate products 500 Sub-sector Total 131,880
Textiles 17 Textiles Manufacture 99,060 2470 Man-made fibres manufacture 2,970 5141 Wholesale of textiles 15,990 2124* Wallpaper manufacture 230 24422* Non-medicaments manufacture 240 3310* Medical equipment manufacture 1,470 5111* Agents raw materials 3,920 4543* Floor/wall coverings 7,420 71409* Rent/personal household goods 2,410 Sub-sector Total 133,710
Leather 15113 Fellmongery 900 19 Leather manufacture 14,790 5124 Wholesale hides/leather 1,070 5271 Repair shoes/leather 4,110 Sub-sector Total 20,870
Design 74872 Speciality design 3,770 Sub-sector Total 3,770
Dry 9301 Wash dry/clean 47,280 Sub-sector Total 47,280 Total 337,500
Labour Force Survey employment estimates bound by SIC are a fair match for the fashion and textile sectors.
170UKCES Almanac data 2008 based on LFS/IER estimates

56
Annex B Data Sources
Skillset sources:
• ‘Archives Skills Strategy’, 2009
• ‘A Skills Review for the TV & Radio Sector’, 2009 (internal report).
• ‘Balancing Children and Work in the Audio Visual Industries’, 2006.
• ‘Creative Media LMI Digests’, 2009.
• ‘Creative Media Workforce Survey’, 2008 (in press), 2005, 2003.
• ‘Employment Census, 2009 (in press), 2006, 2004, 2003, 2002, 2001, 2000.
• ‘Employer Survey, 2006 (internal report).
• ‘Feature Film Production Workforce Survey, Skillset/UK Film Council, 2008.
• ‘Film Sector Employers: Skills and Training Needs in Production, Distribution &
Exhibition, Skillset 2009 (in press).
• ‘Final Summary Report from the M.TEST Project and Recommendations,
Skillset/IABM, February 2009 (internal report).
• ‘From Recession to Recovery, 2009 (internal report).
• ‘Photo Imaging Workforce Survey, 2007 (internal report).
• ‘Sector Qualifications Strategy, 2008.
• ‘Strategic Plan, 2008-2011’.
• ‘Submission to the Development of MAC Shortage Occupation Lists’, 2009.
• ‘Survey of the Audio Visual Industries’ Workforce, 2005.
• ‘Understanding the Impact of Online Trading on the Occupations and Skills within the
UK’s consumer facing business sectors’, IFF Research on behalf of Skillset, e-skills
UK, Skillsmart Retail, People 1st, GoSkills and Financial Services, 2008.
Skillfast-UK sources:
• Skillfast-UK (2009), Impact of the economic downturn on the UK fashion and textiles sector and potential interventions, Skillfast-UK
• Skillfast-UK (2009), Roots to Market, Research into the sustainability skills needs of the UK fashion and textiles sector.
• Skillfast-UK (2005), Skills Needs Assessment for apparel, footwear, textiles and related businesses, Skillfast-UK
Creative and Cultural Skills sources:
• ‘The Cultural Heritage Blueprint’, 2008.

57
• ‘Industry and Stakeholders Satisfaction Survey’, 2008.
• ‘Creative & Cultural Skills: Impact and Footprint’, 2008/2009.
• ‘Creative Blueprint’, 2008.
• ‘An Assessment of the Creative & Cultural Industries in Periods of Economic
Stability: Past Experience and Future Trends’, 2009.
• ‘Creative and Cultural Industry Workforce Survey’, 2009.
Third party sources:
• ‘Almanac’, UKCES, 2009.
• ‘Ambition 2020’, UKCES, 2009.
• Annual Review, NESTA, Feb 2009
• ‘Annual Report', Ofcom 2009.
• ‘Attacking the Recession: How Innovation Can Fight the Downturn’, NESTA
Discussion Paper, December 2008.
• ‘Building Britain’s Future: Jobs of the Future’, HM Government September 2009.
• ‘Building Britain’s Future: New Industry, New Jobs’, Department of Business,
Enterprise and Regulatory Reform, April 2009.
• ‘Business Innovation Survey’, DBIS, August 2009.
• ‘Cities Outlook 2009’, Centre for Cities.
• ‘Creating Innovation’, NESTA, 2008.
• ‘Creative Britain – New Talents for the New Economy’, DCMS February 2008.
• ‘Creative Economy Report’, UNCTAD, 2008.
• ‘Creative Industries Economic Estimates Statistical Bulletin’, DCMS January 2009
• ‘Creative Industries Technology Strategy 2009-2012’, Technology Strategy Board
2009.
• ‘Demanding Growth’, NESTA, 2009.
• DTI Occasional Paper No. 6. ‘Innovation in the UK: Indicators and Insights’, July
2006.
• ‘Digital Britain Final Report’, DCMS/BIS June 2009.
• ‘Family Spending 2009’, ONS.
• Global Language Monitor (2009) Annual Global Survey.
• ‘Global Media & Entertainment Outlook 2008-2012’, PWC UK 2008.
• ‘How the Creative Industries might Come Through the Recession’, The Work
Foundation, 2009.
58
• ‘Investing in the Creative Industries; A Guide for Local Authorities’, Work Foundation,
June 2009.
• International Trade Statistics, World Trade Organisation, 2008.
• ‘Key Role of Creative and Cultural Industries in the Economy’, UNESCO, 2009.
• Learning to work in the creative and cultural sector: new spaces, pedagogies and
expertise, Guile. D, 2009.
• Leitch Review of Skills, DIUS, 2006.
• ‘‘Media Predictions', TMT Trends 2009, Deloitte, 2009.
• Music Experience and Behaviour in Young People, UK Music, 2009.
• ‘Raise the Game’, NESTA, 2008.
• ‘Sizing the Skillfast-UK Sectors and the contribution of Micro businesses’, TBR, 2008.
• ‘Skills for Business’, DIUS, 2008.
• ‘Skills for Growth’, BIS, 2009.
• ‘Skills Scenarios for the textiles, wearing apparel and leather products sector in the
European Union’, Vogler-Ludwig and Valente, 2008.
• ‘State of the UK Video Game Development Sector', Tiga January 2009.
• ‘Statistical Yearbook’, UK Film Council, 2008.
• ‘Staying Ahead: The Economic Performance of the UK’s Creative Industries’, The
Work Foundation, 2007.
• ‘The Advertising Forecast’, Advertising Association statistics published by
www.WARC.com. Nielsen Media Research, World Advertising Research Centre.
• ‘The New Inventors: how users are changing the rules of innovation’, NESTA, 2008.
• ‘The UK’s Digital Road to Recovery’, London School for Economics and Political
Science (LSE) and the Information Technology and Innovation Foundation (ITIF)
April 2009.
• ‘Training and Skills Report’, BTSR 2008.
• ‘UK creative industry to drive significant growth to UK economy’, Press release,
NESTA 19/02/2009.
• ‘UK Employment and Skills Almanac’, UKCES, 2009.
• ‘Unleashing Aspiration’, The Panel on Fair Access to the Professions, 2009.
• ‘User Generated Content, Social Media and Advertising’, IPA, April 2008.
• ‘Women in Leadership,’ Cultural Leadership Programme/TBR 2009.
• Work Foundation (2009) Investing in the Creative Industries; A Guide for Local
Authorities.

59
• ‘Working Futures 2007-2017’, Warwick Institute for Employment Research (IER) and
Cambridge Econometrics, December 2008.
Web only sources:
• BIS, 2009 http://www.berr.gov.uk/whatwedo/sectors/publishing/index.html.
• http://www.nesta.org.uk/areas_of_work/creative_industries.
• http://www.publishers.org.uk/en/policy_and_advocacy/advocacy.cfm
• http://www.guardian.co.uk/stage/2009/aug/06/west-end-plays-more-audiences
• http://www.incgamers.com/News/18919/tiga-on-irish-tax-break-proposals
• http://www.incgamers.com/News/20017/
• http://www.ldpcreative.co.uk/2010/01/gaming-industry-repeats-tax-re.html