steve binder hrl investor day 2015
TRANSCRIPT

Hormel Business Units
Steve BinderExecutive Vice President
President, Hormel Business Units
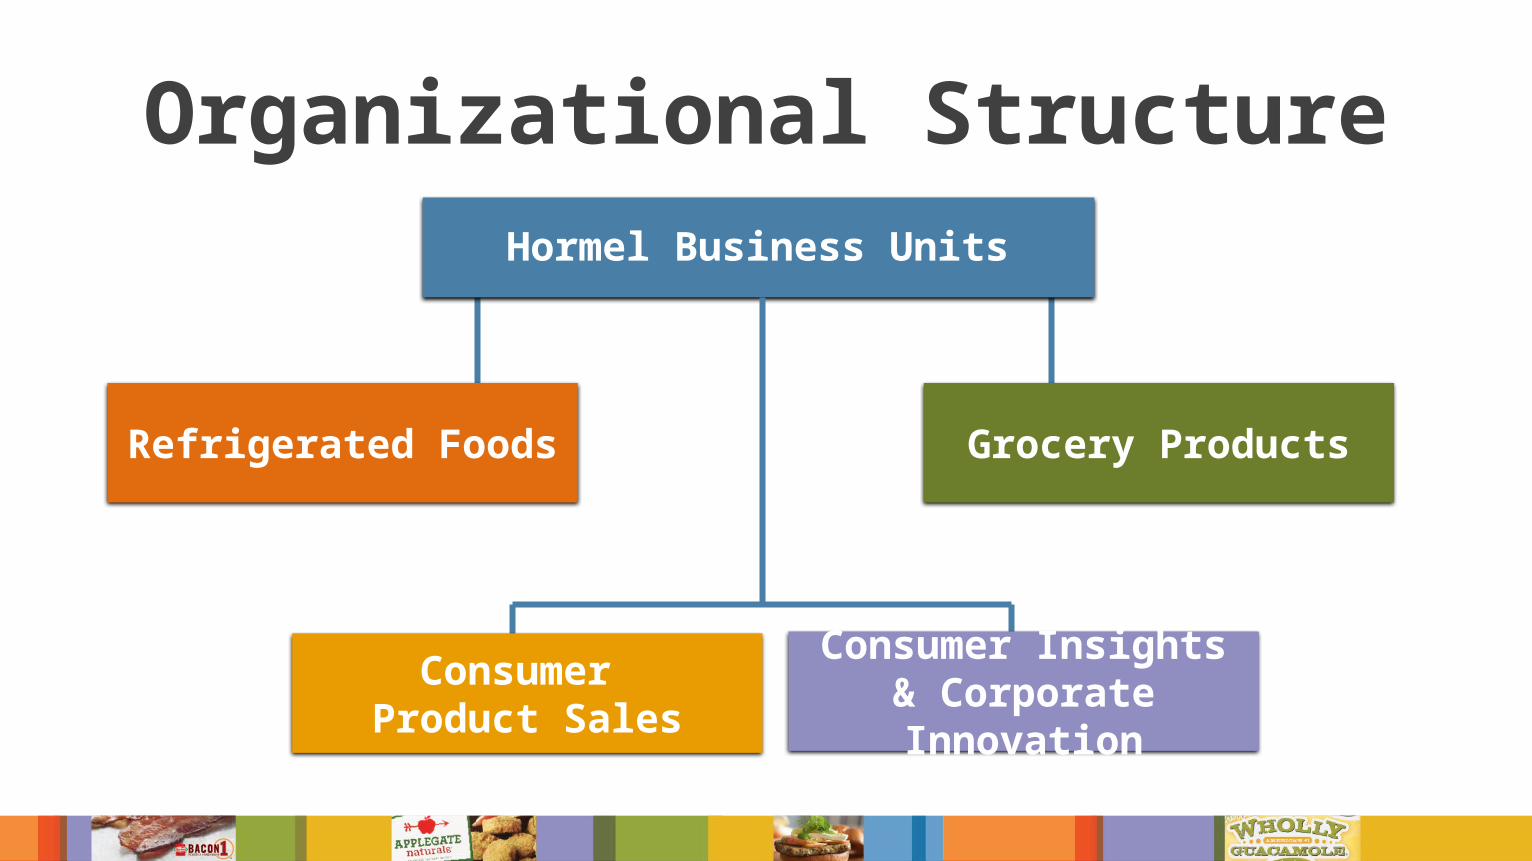
Organizational StructureHormel Business Units
Refrigerated Foods Grocery Products
Consumer Product Sales
Consumer Insights & Corporate Innovation

Consumer/Shopper RevolutionDriving Change

Evolving To Meet Market Driven Demands
Cultural Beliefs
• Create loyalty
• Results matter
• Speak up
• Build bridges
• Grow talent
• Be bold

Aligning Efforts and Resources
• Operations
• Innovation
• Sales
• Brand building

Operational Excellence
• Coordinate and upgrade raw material supply
• Maximize utilization of shared plant assets
• Create efficient, low cost production platforms
• Safety priority – people and food

Pork Packing Market Share
Smithfield Foods 26%
Tyson Foods 17%
JBS 11%
Others 22%
Triumph + Seaboard Farms
8%
Hormel Foods / Farmer John
8%
Cargill 8%
Rank Company Daily Total Harvest
1 Smithfield Foods 117,000
2 Tyson Foods 76,925
3 JBS - Swift 50,000
4 Cargill / Excel 37,800
5 Hormel Foods / Farmer John 37,300
6 Triumph 20,000
7 Seaboard Farms 19,800
8 Indiana Packers 17,000
9 Hatfield Quality Meats 10,400
10 Rantoul Foods 4,800
Top 10 Pork Harvest Companies

Consumer Relevant Innovation
• $3B by 2016
• Data and insights
• Disciplined stage gate approach
• Deliver meaningful new products
• Align with company portfolio strategy

Delivering Results
In millions
2012201020072004 2014
Start of $1B Challenge
Achieved the $1B Challenge
(two years early)
Start the $2B Challenge
Achieved the $2B Challenge
Start the $3B Challenge
The contribution of innovation efforts is accelerating

Using Data to Drive Discovery
Data Conversation
On-the-GoProtein
Innovation Process

Connecting Insights to Design and a Focused Target
Energy
SandwichSnack
Protein
HealthyLifestyle
Innovation Process

Combining Food Science and Technology
Patent Pending
Innovation Process

Data Driven Sales Execution
Innovation Process

Superior Sales Execution• Channel-specific expertise
• Focused, direct sales force
• Branded value-added differentiated portfolio
• Award recognized

Industry Recognized
Foodservice
• Sysco Gold Supplier 2014• UniPro Supplier of the Year 2014• UniPro Innovation 2014

Retail
Industry Recognized
• Walmart New Item of the Year 2014
• Progressive Grocer Magazine Category Captain – Ethnic Foods 2014
• Selling Power Magazine Top 50 Best Companies to Sell For

Supporting Brand Growth

Long Runway for Growth
REV® 4%Category 30%
Party Trays 6%Category 7%
Hormel® Natural Choice® 7%
Category 80%
Refrigerated Guacamole 7%Category 14%
Hormel® COMPLEATS® 9%Category 14%
Pepperoni 22%Category 31%
SPAM® 12%Category 14%
Low Household Penetration (HHP)
Source: 52 week IRI data ending 5/17/15

Operating Margin
Grocery ProductsRefrigerated Foods
Guidance: 5% to 8%
1st half of 2015 actual: 10%
Guidance: 12% to 14%
1st half of 2015 actual: 12%

Hormel Business Units*
*Expected July 2015 Closing