statistical predictability of arctic sea ice volume ... · motivating questions: (1) what is the...
TRANSCRIPT
APPLICATE project has received funding from the European Union´s Horizon 2020 research and innovation programme under grant agreement No 727862.
Statistical predictability of Arctic sea ice volume anomalies:
identifying predictors and optimal sampling locations
www.ap p l ica te .eu
Leandro PonsoniFrançois Massonnet, David Docquier, Thierry Fichefet
APPLICATE Context
WP5 – Improved predictive capacity Task 5.2.4 – Empirical statistical models for benchmarking
WP4 – Support for Arctic observing system designTask 4.2.3 – Optimal sampling
Clustering WP5 and WP4:Using the empirical statistical model developed in WP5 for supporting an optimal sampling strategy in WP4
Motivating questions:
(1) What is the predictability skill of different pan-Arctic predictors, such as SIV, SIA, OHT, SIT, SIC, SST and Ice Drift, for predicting SIV anomalies?
(2) How does model resolution impact the statistical predictability of SIV anomalies?
(3) What are the best in situ locations for sampling predictor variables in order to optimize the statistical predictability of SIV anomalies?
6 different model outputs from PRIMAVERA project:
- HadGEM3-LL- HadGEM3-MM- ECMWF-LR- ECMWF-HR- AWI-LR- AWI-HR
Docquier et al., 2018 (under review)
Building the empirical statistical models for predicting Sea Ice Volume anomalies (no trend; no seasonal variability)
6 different model outputs from PRIMAVERA project:
- HadGEM3-LL- HadGEM3-MM- ECMWF-LR- ECMWF-HR- AWI-LR- AWI-HR
Docquier et al., 2018 (under review)
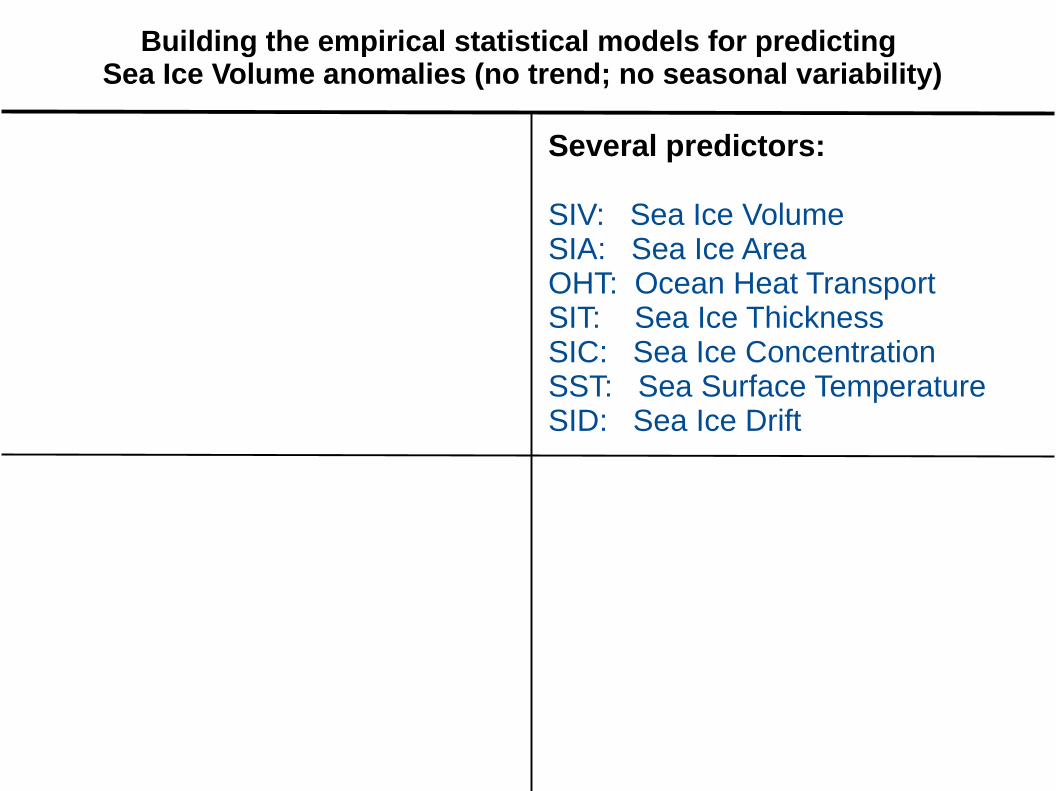
Building the empirical statistical models for predicting Sea Ice Volume anomalies (no trend; no seasonal variability)
Several predictors:
SIV: Sea Ice VolumeSIA: Sea Ice AreaOHT: Ocean Heat TransportSIT: Sea Ice ThicknessSIC: Sea Ice ConcentrationSST: Sea Surface TemperatureSID: Sea Ice Drift
6 different model outputs from PRIMAVERA project:
- HadGEM3-LL- HadGEM3-MM- ECMWF-LR- ECMWF-HR- AWI-LR- AWI-HR
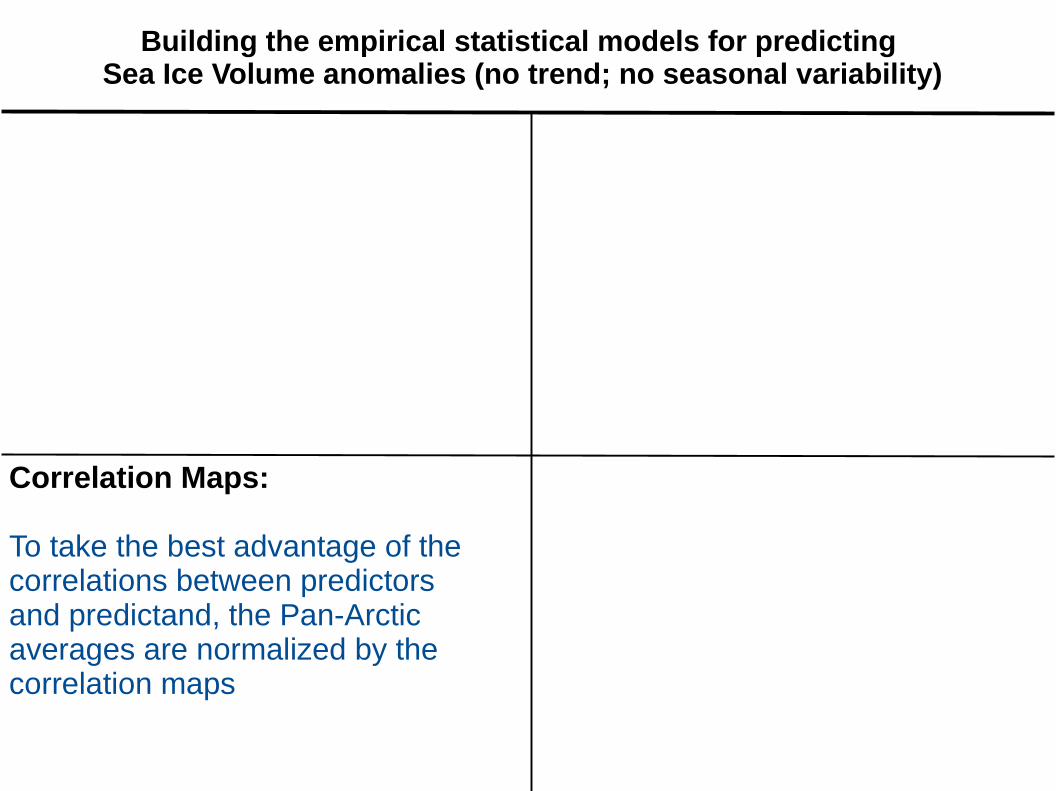
Correlation Maps:
To take the best advantage of the correlations between predictorsand predictand, the Pan-Arcticaverages are normalized by thecorrelation maps
Docquier et al., 2018 (under review)
Building the empirical statistical models for predicting Sea Ice Volume anomalies (no trend; no seasonal variability)
Several predictors:
SIV: Sea Ice VolumeSIA: Sea Ice AreaOHT: Ocean Heat TransportSIT: Sea Ice ThicknessSIC: Sea Ice ConcentrationSST: Sea Surface TemperatureSID: Sea Ice Drift
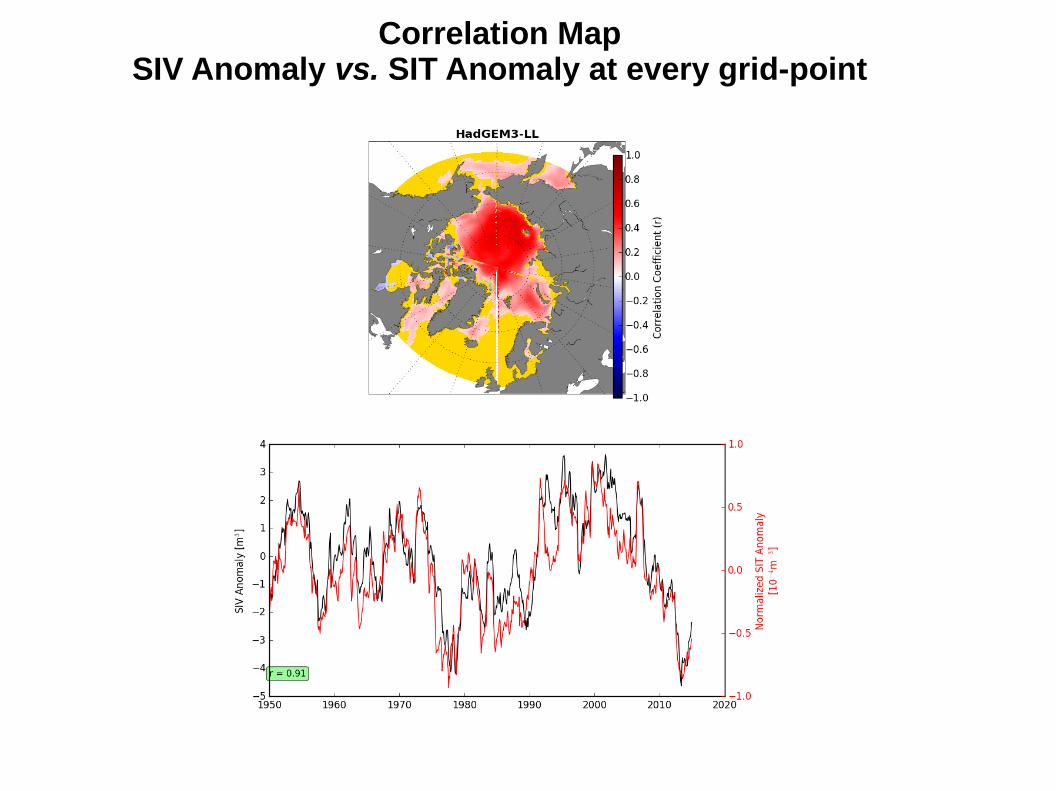
Correlation MapSIV Anomaly vs. SIT Anomaly at every grid-point
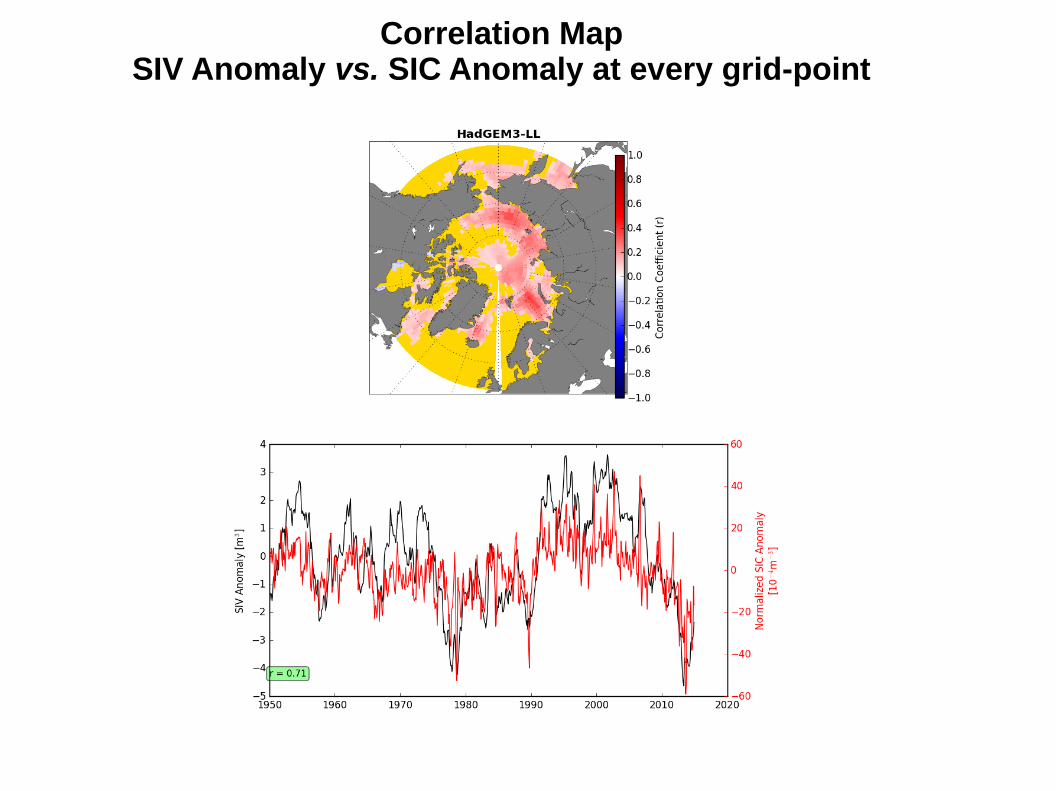
Correlation MapSIV Anomaly vs. SIC Anomaly at every grid-point
6 different model outputs from PRIMAVERA project:
- HadGEM3-LL- HadGEM3-MM- ECMWF-LR- ECMWF-HR- AWI-LR- AWI-HR
Correlation Maps:
To take the best advantage of the correlations between predictorsand predictand, the Pan-Arcticaverages are normalized by thecorrelation maps
Docquier et al., 2018 (under review)
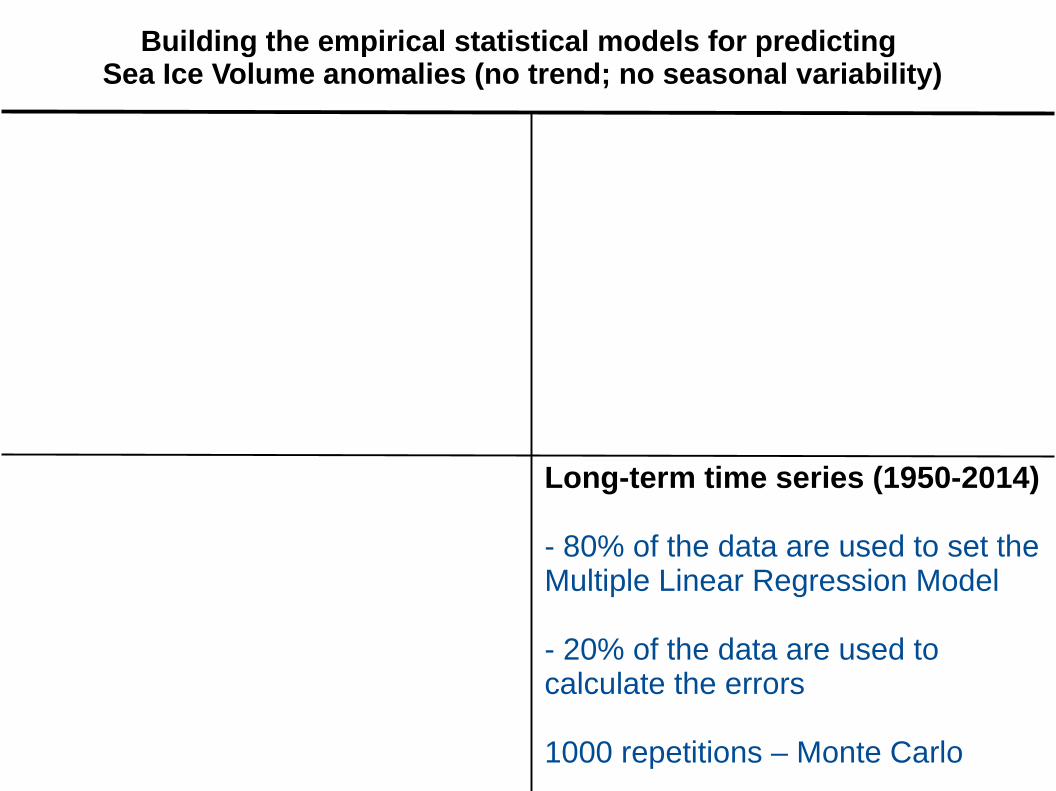
Building the empirical statistical models for predicting Sea Ice Volume anomalies (no trend; no seasonal variability)
Several predictors:
SIV: Sea Ice VolumeSIA: Sea Ice AreaOHT: Ocean Heat TransportSIT: Sea Ice ThicknessSIC: Sea Ice ConcentrationSST: Sea Surface TemperatureSID: Sea Ice Drift
Long-term time series (1950-2014)
- 80% of the data are used to set theMultiple Linear Regression Model
- 20% of the data are used to calculate the errors
1000 repetitions – Monte Carlo
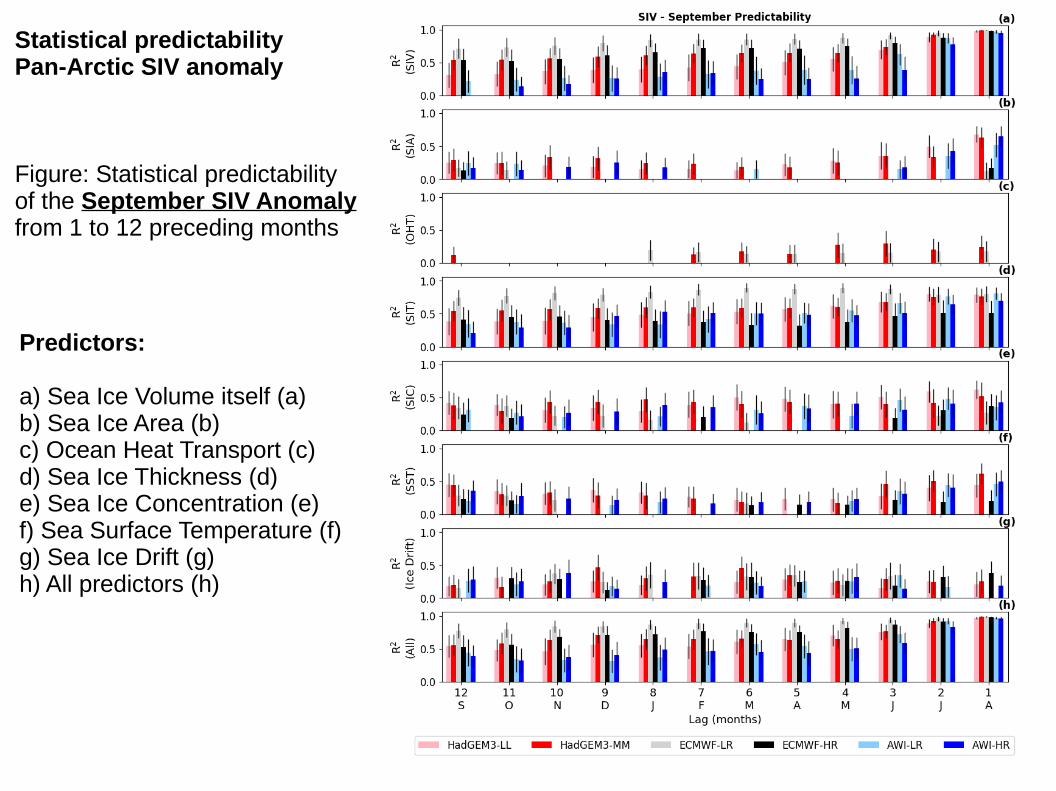
Statistical predictability Pan-Arctic SIV anomaly
Figure: Statistical predictabilityof the September SIV Anomalyfrom 1 to 12 preceding months
Predictors:
a) Sea Ice Volume itself (a)b) Sea Ice Area (b)c) Ocean Heat Transport (c) d) Sea Ice Thickness (d)e) Sea Ice Concentration (e)f) Sea Surface Temperature (f)g) Sea Ice Drift (g)h) All predictors (h)
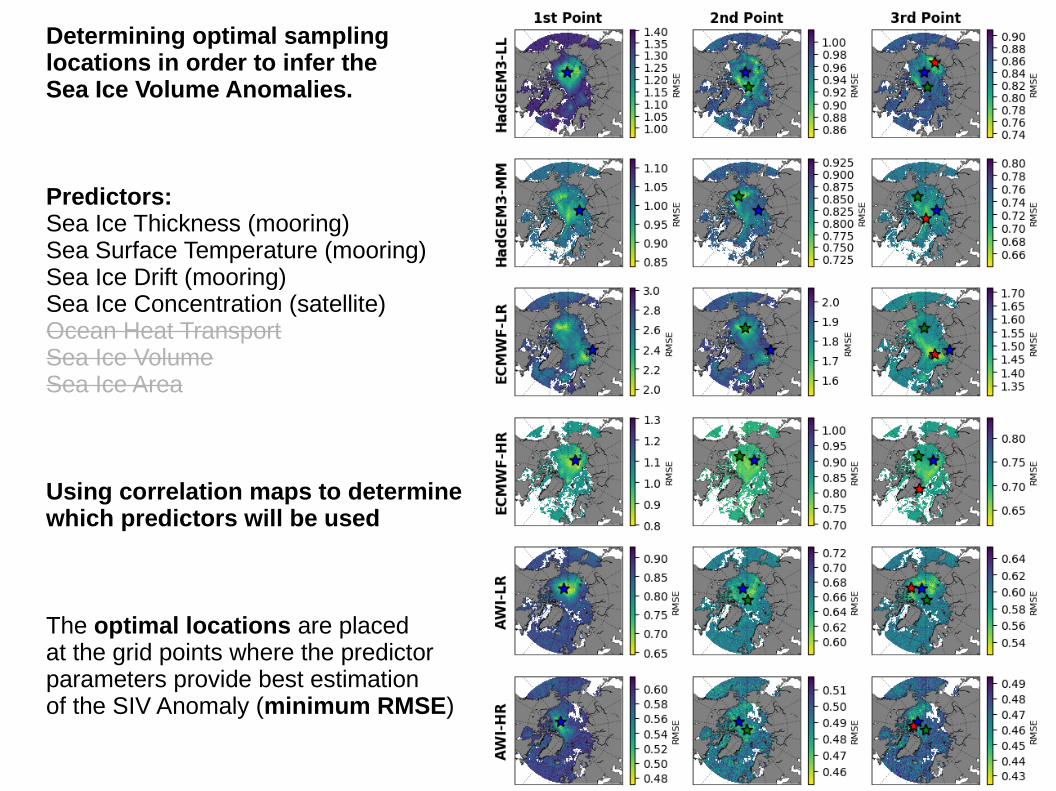
Determining optimal sampling locations in order to infer the Sea Ice Volume Anomalies.
Predictors:Sea Ice Thickness (mooring)Sea Surface Temperature (mooring)Sea Ice Drift (mooring)Sea Ice Concentration (satellite)Ocean Heat TransportSea Ice VolumeSea Ice Area
Using correlation maps to determinewhich predictors will be used
The optimal locations are placed at the grid points where the predictor parameters provide best estimationof the SIV Anomaly (minimum RMSE)
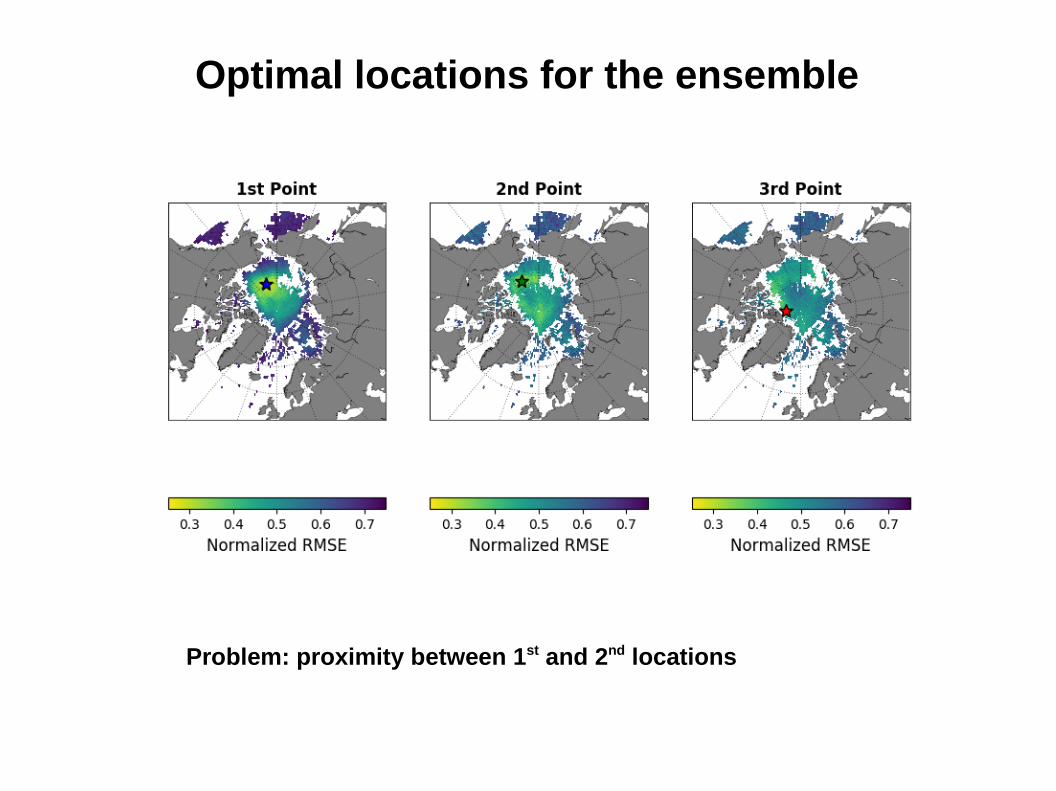
Optimal locations for the ensemble
Problem: proximity between 1st and 2nd locations
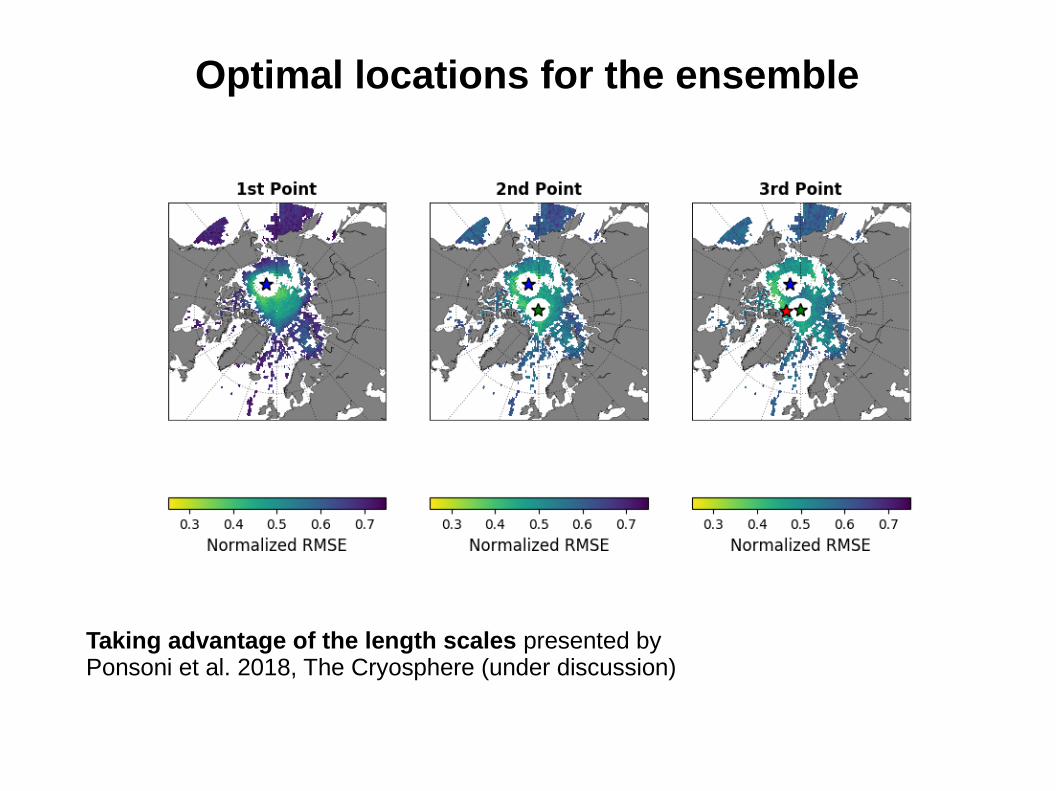
Taking advantage of the length scales presented by Ponsoni et al. 2018, The Cryosphere (under discussion)
Optimal locations for the ensemble
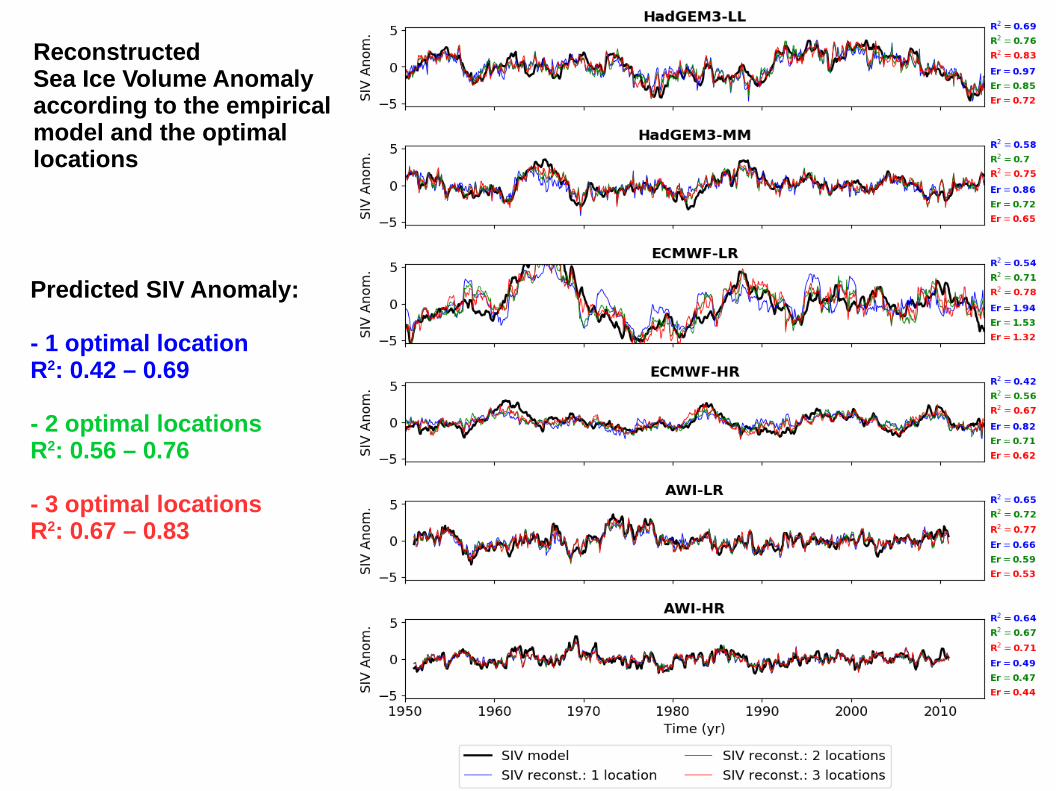
Predicted SIV Anomaly:
- 1 optimal locationR2: 0.42 – 0.69
- 2 optimal locationsR2: 0.56 – 0.76
- 3 optimal locationsR2: 0.67 – 0.83
Reconstructed Sea Ice Volume Anomalyaccording to the empiricalmodel and the optimallocations
Back to the motivating questions:
(1) What is the predictability skill of different pan-Arctic predictors, such as SIV, SIA, OHT, SIT, SIC, SST and Ice Drift, for predicting SIV anomalies?
Apart from SIV itself, the best statistical predictors are SIT and SIC, while SST and Sea Ice Drift are less skillful. On the other hand, the SIA and OHT do not seem to be a good predictor.
Back to the motivating questions:
(2) How does model resolution impact the statistical predictability of SIV anomalies?
For the models used in this work, the versions with finer horizontal resolution are best predictors in terms of RMSE, while models with coarser resolution are best predictors in terms of R2.
Back to the motivating questions:
(3) What are the best in situ locations for sampling predictor variables in order to optimize the statistical predictability of SIV anomalies?
The optimal locations are model-dependent. Nevertheless, for all model outputs, 3 optimal locations are already enough for explaining ~70% of the SIV Anomaly variance.
Back to the motivating questions:
(1) What is the predictability skill of different pan-Arctic predictors, such as SIV, SIA, OHT, SIT, SIC, SST and Ice Drift, for predicting SIV anomalies?Apart from SIV itself, the best statistical predictors are SIT and SIC, while SST and Sea Ice Drift are less skillful. On the other hand, the SIA and OHT do not seem to be a good predictor.
(2) How does model resolution impact the statistical predictability of SIV anomalies?For the models used in this work, the versions with finer horizontal resolution are best predictors in terms of RMSE, while models with coarser resolution are best predictors in terms of R2.
(3) What are the best in situ locations for sampling predictor variables in order to optimize the statistical predictability of SIV anomalies?The optimal locations are model-dependent. Nevertheless, for all model outputs, 3 optimal locations are already enough for explaining ~70% of the SIV Anomaly variance.