statistical analysis of extreme rainfall events over indiana usa
TRANSCRIPT
8/12/2019 Statistical Analysis of Extreme Rainfall Events Over Indiana USA
http://slidepdf.com/reader/full/statistical-analysis-of-extreme-rainfall-events-over-indiana-usa 1/9
1
Statistical Analysis of Extreme Rainfall Events over Indiana, USA
Shih-Chieh Kao1
and Rao S. Govindaraju2
1 School of Civil Engineering, Purdue University, West Lafayette, IN 47907, USA;
email: [email protected]
School of Civil Engineering, Purdue University, West Lafayette, IN 47907, USA;email: [email protected]
AbstractAnalysis of extreme rainfall events is important for hydraulic and hydrologic
studies, and has conventionally been performed by pre-specifying rainfall duration as
a filter to abstract the information of annual maximum rainfall depths for furtherexamination. However, this single-variate approach does not account for dependence
between rainfall properties. To characterize extreme rainfall events, a multi-variate
analysis is conducted in this study using hourly precipitation data from Indiana, USA.
Samples of extreme rainfall events are chosen based on two different criteria: annualmaximum volume, and annual maximum peak intensity. Rainfall properties, such as
total depth, duration, and peak intensity are analyzed using copulas to describe the
dependence structures between rainfall variables and to construct their jointdistribution for extreme rainfall events. Results from the derived multivariate model
are compared to those from conventional single-variate analysis by computing the
corresponding conditional distributions. The proposed stochastic model for extremerainfall is expected to provide better estimates of design rainfall.
Key words: Copulas, multivariate analysis, joint-distribution, extreme rainfall
1. IntroductionIn order to prevent loss of property and human life, designs of hydraulic and
hydrologic structures are based on extreme rainfall events. Since a deterministicrelationship for extreme rainfall events in future cannot be established, statistical
methods are adopted to quantify rainfall by probability of exceedance (for example,
the use of return period and hydrologic risk) as in rainfall frequency analysis.Rainfall frequency analysis is currently performed through single-variate
approaches, i.e. by treating the total rainfall depth as the only variable (for instance,
Bonnin et al., 2004). To relate rainfall depth to duration, a pre-specified duration isdeclared as a filter to find the annual maxima as samples for analysis. In this sense,
stochastic rainfall models are constructed for various “durations”. However, it should
World Environmental and Water Resources Congress 2007: Restoring Our Natural Habitat © 2007 ASCE
pyright ASCE 2 7 World Environmental and Water Resources Congresspyright ASCE 2 7 World Environmental and Water Resources Congress
World Environmental and Water Resources Congress 2007
8/12/2019 Statistical Analysis of Extreme Rainfall Events Over Indiana USA
http://slidepdf.com/reader/full/statistical-analysis-of-extreme-rainfall-events-over-indiana-usa 2/9
2
be noted that this “duration” is artificially prescribed and does not reflect the actual
duration of rainfall events. When using a shorter prescribed duration (say 1-hour), theselected maximum event may be from a longer duration extreme rainfall event, and
possibly represents the peak intensity part. On the other hand, when using a longer
prescribed duration (say 48-hour), the selected maximum may cover several
short-term events with periods of rainfall hiatus. Therefore, the current practiceprovides estimates for various artificial durations, but is not able to truly characterize
the behavior of extreme rainfall events. Rainfall records reveal that rainfall eventsexhibit high variability in their properties such as total depth (volume), duration, and
peak intensity. Clearly, there is a need to perform a muti-variate analysis to construct
a more realistic stochastic model for extreme rainfall events.However, multi-variate frequency analyses are much more complicated than
single-variate procedures. The main challenge is due to the mathematical complexity
of the joint probability distribution that encompasses knowledge of both marginal
distributions and dependence structure. Over the last decade, copulas have emerged asa method for addressing multi-variate problems in several disciplines. Using Sklar’s
(1959) theorem, the analysis of joint distributions can be performed separately for themarginal distributions and for the dependence structure. Nelsen (2006) provides atheoretical background and description on the use of copulas. De Michele and
Salvadori (2003) were perhaps the first to apply copulas in hydrology to analyze the
joint behavior between rainfall duration and average intensity. Grimaldi and Serinaldi(2006) explored the multi-variate relationships among critical rainfall depths, peak
intensity, and total depth. These studies explained the methodology for constructing
multi-variate stochastic rainfall models. However, due to the small sample size
adopted (both studies used 7-year data), the behavior of extreme rainfall events couldnot be studied in either case. Other examples of applications of copulas in hydrology
are Favre et al. (2004), Salvadori and De Michele (2004), De Michele et al. (2005),
Salvadori and De Michele (2006), and Zhang and Singh (2006).In this study, three defining properties of rainfall: total depth (volume) P ,
duration D , and peak intensity I are utilized to perform multi-variate frequency
analysis. Sufficiently long (over 50 years) hourly precipitation datasets are adopted toprovide a more statistically reliable description of extreme rainfall behavior.
Multi-variate frequency analysis based on copula technique is performed somewhat
analogous to the conventional single-variate approach. This new stochastic model is
expected to provide a better understanding of extreme rainfall.
2. Selection of Extreme Events
53 hourly raingauges from Hourly Precipitation Database (TD 3240) of NationalClimate Data Center (NCDC, http://www.ncdc.noaa.gov/oa/ncdc.html) in Indiana are
selected in this study. Each selected station possessed 50 to 55 years of data, which
should be sufficient for performing single-variate at-site frequency analysis (criteriontaken from Bonnin et al., 2004). A minimum rainfall hiatus of six hours between
non-zero records was selected to abstract rainfall events (Huff, 1967). An average of
about 4800 observed events are available for each station.Unlike the definition of annual maximum precipitation series used in
conventional analysis, the definition of annual maximal events for mutli-variate
World Environmental and Water Resources Congress 2007: Restoring Our Natural Habitat © 2007 ASCE
pyright ASCE 2 7 World Environmental and Water Resources Congresspyright ASCE 2 7 World Environmental and Water Resources Congress
World Environmental and Water Resources Congress 2007

8/12/2019 Statistical Analysis of Extreme Rainfall Events Over Indiana USA
http://slidepdf.com/reader/full/statistical-analysis-of-extreme-rainfall-events-over-indiana-usa 3/9

8/12/2019 Statistical Analysis of Extreme Rainfall Events Over Indiana USA
http://slidepdf.com/reader/full/statistical-analysis-of-extreme-rainfall-events-over-indiana-usa 4/9
4
Table 1 – Summary of Chi-square and KS test results for marginal distributions
AMV
events EV1 GEV P3 LP3 GP LN EV1 GEV P3 LP3 GP LN
Depth, P 13.2 17.0 41.5 17.0 100 13.2 0.0 0.0 7.5 0.0 52.8 0.0
Duration, D 13.2 15.1 24.5 37.7 100 22.6 1.9 0.0 7.5 0.0 22.6 0.0
Intensity, I 15.1 17.0 45.3 20.8 100 11.3 0.0 0.0 1.9 0.0 54.7 0.0
Rejection rate (%) of Chi-square test Rejection rate (%) of KS test
AMIevents EV1 GEV P3 LP3 GP LN EV1 GEV P3 LP3 GP LN
Depth, P 5.7 3.8 62.3 3.8 100 1.9 0.0 0.0 11.3 0.0 45.3 0.0
Duration, D 60.4 39.6 88.7 37.7 100 28.3 15.1 0.0 45.3 0.0 45.3 0.0
Intensity, I 15.1 15.1 34.0 18.9 100 15.1 0.0 0.0 5.7 0.0 71.7 0.0
Rejection rate (%) of Chi-square test Rejection rate (%) of KS test
0 50 1000
0.2
0.4
0.6
0.8
1
Depth, P (mm)
C u m u l a t i v e p r o b a b i l i t y , u = F P ( p )
0 20 40 600
0.2
0.4
0.6
0.8
1
Duration, D (hour)
C u m u l a t i v e p r o b a b i l i t y , v = F D ( d )
0 20 40 600
0.2
0.4
0.6
0.8
1
Peak Intensity (mm/hour)
C u m u l a t i v e p r o b a b i l i t y , w = F I ( i )
AMV events
AMI events
Figure 2 – EV1 fitting for marginal distributions of station Alpine 2 NE (COOPID: 120132)
recording unit (hour) used in this study is not fine enough. The marginals (or
cumulative density functions (CDFs)) of depth P , duration D , and peak intensity
I are expressed as ( ) pF u P= , ( )d F v D= , and ( )iF w I = in the following
discussion.
4. Analysis of Dependence Structure Using Copulas
A copula C is a function composed of marginals. Sklar (1959) showed that for
continuous random variable X and Y with marginals ( ) u x F X = and ( ) v yF Y = ,
there exists one unique UV C such that:
( ) ( ) ( )( ) ( ) y x H yF x F C vuC XY Y X UV UV ,,, == (1 )
where XY H is the joint distribution. Since probability measurements are absolutely
increasing (for absolutely increasing continuous random variables) from 0 to 1,
copulas UV C can be regarded as a transformation of XY H from [ ] ,
2
to [ ]1,0
2
.In other words, it simplifies the joint distribution to a bounded domain, and therefore
attentions can be focused on the dependence structure described by copulas.Among various types of copulas, one-parameter Archimedean copulas have
attracted the most attention owing to possessing several convenient properties. For an
Archimedean copula, there exists a generator such that the following relationship
holds:
World Environmental and Water Resources Congress 2007: Restoring Our Natural Habitat © 2007 ASCE
pyright ASCE 2 7 World Environmental and Water Resources Congresspyright ASCE 2 7 World Environmental and Water Resources Congress
World Environmental and Water Resources Congress 2007
8/12/2019 Statistical Analysis of Extreme Rainfall Events Over Indiana USA
http://slidepdf.com/reader/full/statistical-analysis-of-extreme-rainfall-events-over-indiana-usa 5/9
5
( )( ) ( ) ( )vuvuC +=, ( 2 )
In (2), the generator is an absolutely decreasing function defined in [0,1], and
( ) 01 = . A special case is the independent copula ( ) uvvu =, with generator
( ) t t ln= . For Archimedean copulas, several statistical properties can be simply
expressed in terms of , such as the distribution function C K of copulas (i.e.
( ) ( )[ ]t vuC Pt K C = , ) and the concordance measure Kendall’s :
( ) ( )
( )t
t t t K C
' = , [ ]1,0t ( 3 )
( )( )
dt t
t +=
1
0 '41
( 4 )
The distribution function C K offers a cumulative probability measure for the set
( ) [ ] ( ) t vuC vu ,1,0, 2
and therefore can be applied for examining the goodness-
of-fit of copulas onto one single dimension (along t ). By using (3), the theoretical
Kendall’s can be derived as (4). Apart from being a better measurement of
dependence than the traditional correlation coefficient , Kendall’s has also
been extensively used for obtaining a non-parametric estimator for dependence
parameter by equating sample ̂ to theoretical (for example, De Michele
and Salvadori (2003), Favre et al. (2004), Zhang and Singh (2006)). This estimatordoes not rely on prior information of marginal distributions, and hence provides a
more objective measure of dependence structure.
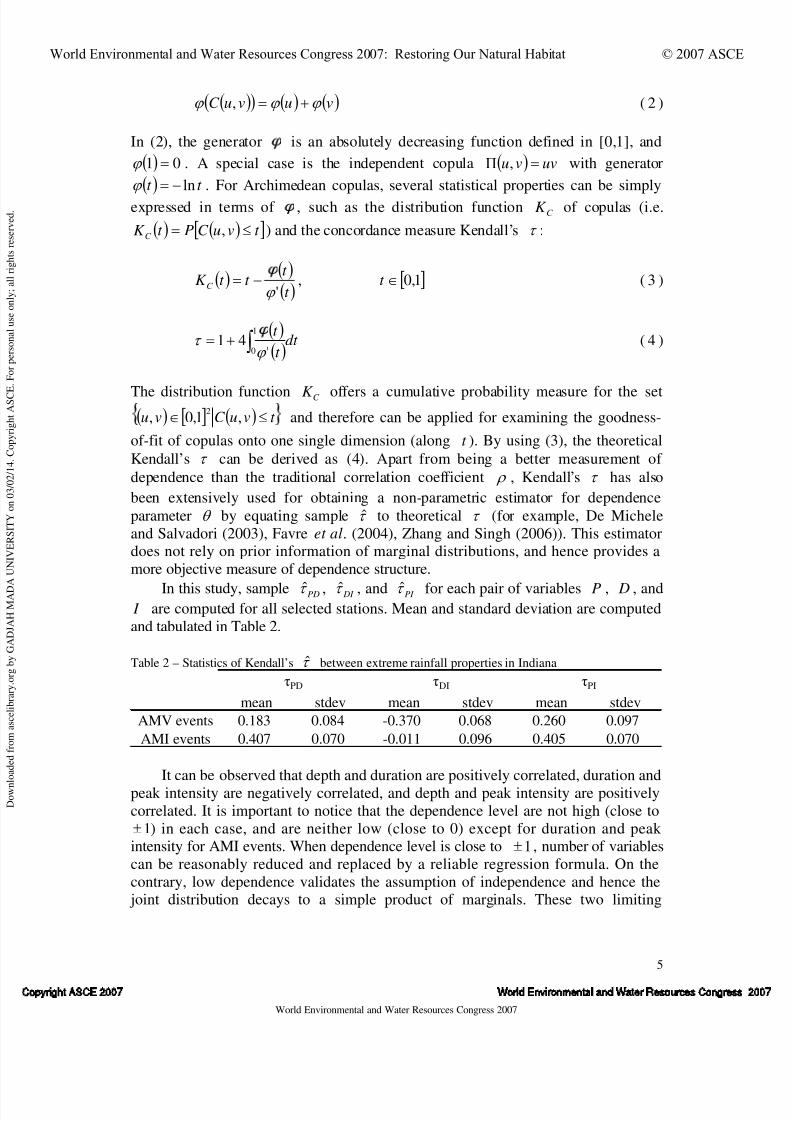
In this study, sample PD ̂ , DI ̂ , and PI ̂ for each pair of variables P , D , and I are computed for all selected stations. Mean and standard deviation are computed
and tabulated in Table 2.
Table 2 – Statistics of Kendall’s ̂ between extreme rainfall properties in Indiana
mean stdev mean stdev mean stdev
AMV events 0.183 0.084 -0.370 0.068 0.260 0.097
AMI events 0.407 0.070 -0.011 0.096 0.405 0.070
PD DI PI
It can be observed that depth and duration are positively correlated, duration and
peak intensity are negatively correlated, and depth and peak intensity are positively
correlated. It is important to notice that the dependence level are not high (close to
1± ) in each case, and are neither low (close to 0) except for duration and peak intensity for AMI events. When dependence level is close to 1± , number of variables
can be reasonably reduced and replaced by a reliable regression formula. On the
contrary, low dependence validates the assumption of independence and hence the joint distribution decays to a simple product of marginals. These two limiting
World Environmental and Water Resources Congress 2007: Restoring Our Natural Habitat © 2007 ASCE
pyright ASCE 2 7 World Environmental and Water Resources Congresspyright ASCE 2 7 World Environmental and Water Resources Congress
World Environmental and Water Resources Congress 2007
8/12/2019 Statistical Analysis of Extreme Rainfall Events Over Indiana USA
http://slidepdf.com/reader/full/statistical-analysis-of-extreme-rainfall-events-over-indiana-usa 6/9
6
approximations are common in engineering applications, but seem not appropriate formid-dependence as in this study. When analyzing important problems like extreme
rainfall behavior, the construction of dependent joint distribution is inevitable. It can
also be observed that the dependence levels for AMV and AMI events are not similar.Not surprisingly, stochastic models based on events selected by different criteria
would lead to different models, and the choice of which one to adopt should be basedon the nature of the problem at hand. For example, rainfall models constructed fromAMV events are likely more suitable for longer durations and larger watersheds,
while AMI events provide better models for shorter durations and smaller watersheds.
The choice of a copula function depends on the range of dependence level it candescribe. Numerous families of Archimedean copulas are available for positive
dependence structure. In this study, four commonly used families of one-parameter
Archimedean copulas are adopted and examined, including: Frank, Clayton,Genest-Ghoudi, and Ali-Mikhail-Haq. All of these are valid both for positive and
negative dependence (note that Ali-Mikhail-Haq is valid only for -0.1807 < <
0.3333). The parameters are estimated by non-parametric procedure using Kendall’s
. For sample size n , empirical copulas nC described by Nelsen (2006) arecomputed for examining goodness-of-fit:
n
a
n
j
n
iC n =
, ( 5 )
where a is the number of pairs ( ) y x , in the sample with ( )i x x and ( ) j y y ,
and ( )i x , ( ) j y , n ji ,1 , is the order statistics from the sample. Similarly,
empirical distribution functionnC
K can be written as:
n
b
n
k K
nC =
( 6 )
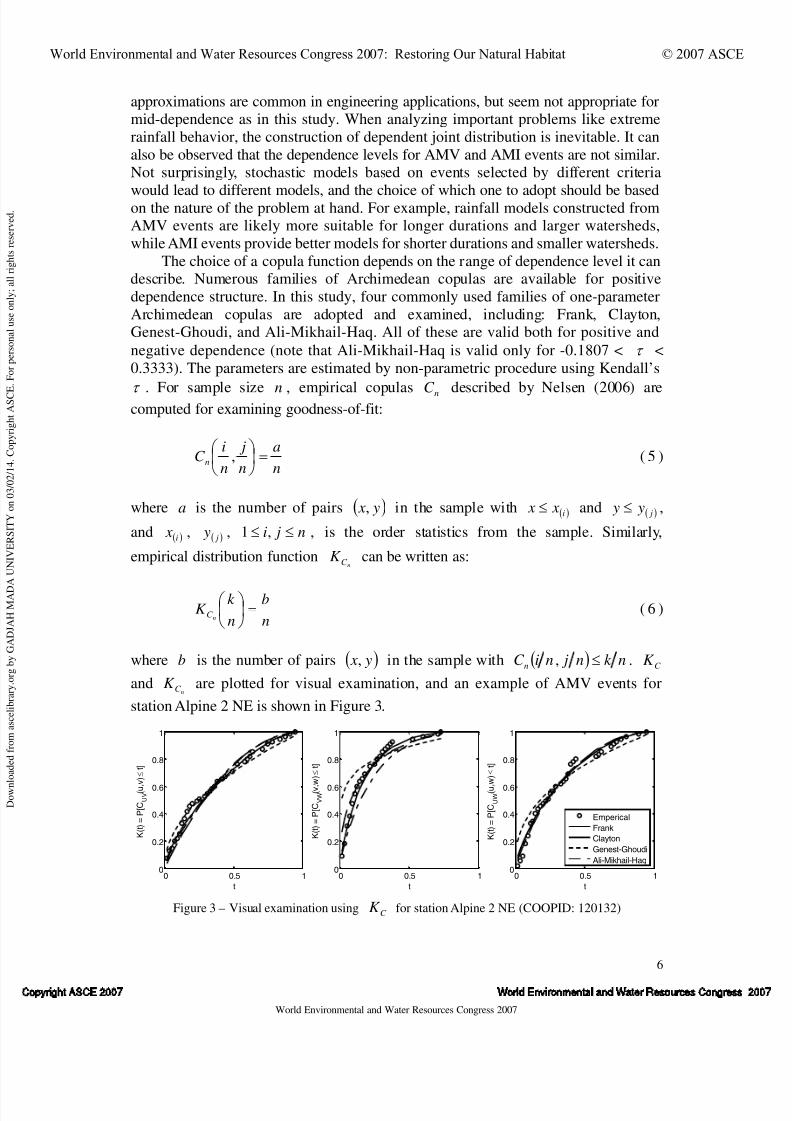
where b is the number of pairs ( ) y x , in the sample with ( ) nk n jniC n , . C K
andnC K are plotted for visual examination, and an example of AMV events for
station Alpine 2 NE is shown in Figure 3.
0 0.5 10
0.2
0.4
0.6
0.8
1
t
K ( t ) = P [ C U V
( u , v )
t ]
0 0.5 10
0.2
0.4
0.6
0.8
1
t
K ( t ) = P [ C V W
( v , w )
t ]
0 0.5 10
0.2
0.4
0.6
0.8
1
t
K ( t ) = P [ C U W
( u , w )
t ]
Emperical
Frank
Clayton
Genest-Ghoudi
Ali-Mikhail-Haq
Figure 3 – Visual examination using C K for station Alpine 2 NE (COOPID: 120132)
World Environmental and Water Resources Congress 2007: Restoring Our Natural Habitat © 2007 ASCE
pyright ASCE 2 7 World Environmental and Water Resources Congresspyright ASCE 2 7 World Environmental and Water Resources Congress
World Environmental and Water Resources Congress 2007
8/12/2019 Statistical Analysis of Extreme Rainfall Events Over Indiana USA
http://slidepdf.com/reader/full/statistical-analysis-of-extreme-rainfall-events-over-indiana-usa 7/9
7
Generally, it is observed that Clayton and Ali-Mikhail-Haq families perform well
for positive dependence cases ( UV C and UW C ), and Frank family performs well for
both positive and negative dependence. In fact, Frank family is the only Archimedean
copula which satisfies radial symmetry, and is suitable for the entire range of dependence. It makes Frank family a popular choice for constructing dependence
structure.
5. Joint Distribution and ApplicationsThe bivariate joint distribution can be constructed by merging marginal
distribution and dependence structure obtained in sections 3 and 4. This bivariate
model can be applied for many purposes, such as risk assessment, flood frequencyderivation, and expectation computation for rainfall-related properties. An application
of conditional distribution is presented here. For a known (measured) d -hour rainfallevent, the conditional cumulative distribution for depth P can be written as:
( )
( ) ( )
( ) ( )1
1,,1
=<
d F d F
d p H d p H d Dd pF
D D
PDPD
P
(7 )
where the joint distribution is constructed by GEV marginals and Frank family of
Archimedean copulas. For given return period T , the T -year, d -hour rainfall
estimate T p will satisfy ( ) T d Dd pF T P 111 =<< . An example for station
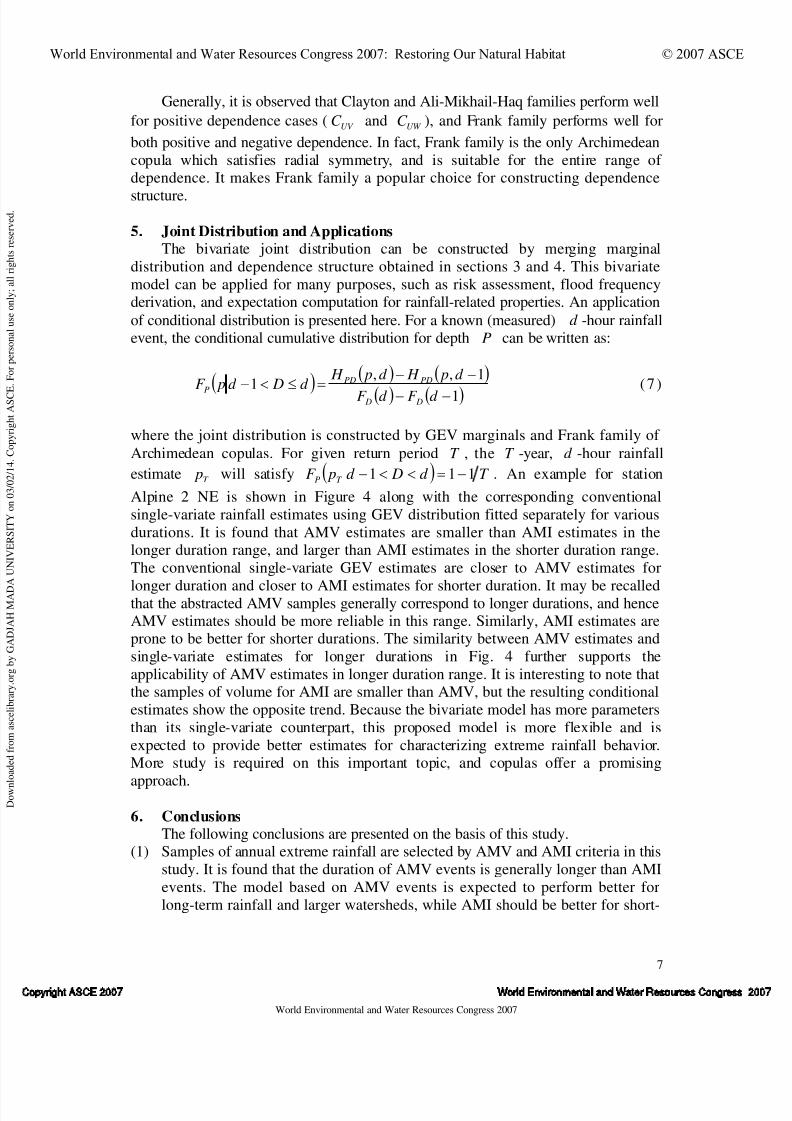
Alpine 2 NE is shown in Figure 4 along with the corresponding conventional
single-variate rainfall estimates using GEV distribution fitted separately for various
durations. It is found that AMV estimates are smaller than AMI estimates in thelonger duration range, and larger than AMI estimates in the shorter duration range.
The conventional single-variate GEV estimates are closer to AMV estimates for
longer duration and closer to AMI estimates for shorter duration. It may be recalledthat the abstracted AMV samples generally correspond to longer durations, and henceAMV estimates should be more reliable in this range. Similarly, AMI estimates areprone to be better for shorter durations. The similarity between AMV estimates and
single-variate estimates for longer durations in Fig. 4 further supports the
applicability of AMV estimates in longer duration range. It is interesting to note thatthe samples of volume for AMI are smaller than AMV, but the resulting conditional
estimates show the opposite trend. Because the bivariate model has more parameters
than its single-variate counterpart, this proposed model is more flexible and is
expected to provide better estimates for characterizing extreme rainfall behavior.More study is required on this important topic, and copulas offer a promising
approach.
6. ConclusionsThe following conclusions are presented on the basis of this study.
(1) Samples of annual extreme rainfall are selected by AMV and AMI criteria in this
study. It is found that the duration of AMV events is generally longer than AMI
events. The model based on AMV events is expected to perform better for
long-term rainfall and larger watersheds, while AMI should be better for short-
World Environmental and Water Resources Congress 2007: Restoring Our Natural Habitat © 2007 ASCE
pyright ASCE 2 7 World Environmental and Water Resources Congresspyright ASCE 2 7 World Environmental and Water Resources Congress
World Environmental and Water Resources Congress 2007
8/12/2019 Statistical Analysis of Extreme Rainfall Events Over Indiana USA
http://slidepdf.com/reader/full/statistical-analysis-of-extreme-rainfall-events-over-indiana-usa 8/9
8
0 5 10 15 2040
60
80
100
120
14010-year
duration (hour)
r a i n f a
l l d e p t h ( m m )
0 5 10 15 2060
80
100
120
140
160
180
200
220100-year
duration (hour)
r a i n f a
l l d e p t h ( m m )
single-variate estimates
AMV estimates
AMI estimates
Figure 4 – Rainfall estimates for various durations for station Alpine 2 NE (COOPID: 120132)
term rainfall and smaller watersheds where the effect of peak intensity is likely
to be more prominent.(2) The total volume (depth), duration, and peak intensity are selected as variables
of interest in this study. EV1, GEV, LP3, and LN are found to be appropriate
marginal models for extreme rainfall. While GP was found to perform well forregular rainfall models in previous studies, it is found to be the weakest in thisstudy for extreme events.
(3) The dependence between volume and duration is found to be positively
correlated, between duration and peak intensity to be negatively correlated, andbetween volume and peak intensity to be positively correlated. The Frank family
of Archimedean copulas was shown to be an appropriate model for
characterizing these dependence structures.
(4) The bivariate joint distribution can be constructed by merging marginaldistribution and dependence structure. The application of conditional distribution
of depth given a known measured duration yields rainfall estimates that are
qualitatively similar to what is obtained through the conventional single-variateapproach. This proposed multi-variate stochastic rainfall model is expected to
provide a better characterization for extreme rainfall behavior in Indiana.
ReferencesBonnin, G. M., Martin, D., Lin, B., Parzybok, T., Yekta, M., and Riley, D. (2004).
“Precipitation-Frequency Atlas of the United States”, NOAA Atlas 14, Volume 2, U.S. Department of Commerce, National Oceanic and Atmospheric Administration,
National Weather Service, Silver Spring, Maryland.
De Michele, C., and Salvadori, G. (2003). “A Generalized Pareto intensity-durationmodel of storm rainfall exploiting 2-Copulas”, Journal of Geophysical Research,
108(D2), ACL 15-1-11.
De Michele, C., Salvadori, G., Canossi, M., Petaccia, A., and Rosso, R. (2005).
“Bivariate Statistical Approach to Check Adequacy of Dam Spillway”, Journal of
Hydrologic Engineering, 10(1), 50-57.
Favre, A.-C., El Adlouni, S., Perreault, L., Thiémonge, N. and Bobée, B. (2004).
“Multivariate hydrological frequency analysis using copulas”, Water Resour. Res.,
40, W01101.
Grimaldi, S. and Serinaldi, F. (2006). “Design hyetograph analysis with 3-copula
World Environmental and Water Resources Congress 2007: Restoring Our Natural Habitat © 2007 ASCE
pyright ASCE 2 7 World Environmental and Water Resources Congresspyright ASCE 2 7 World Environmental and Water Resources Congress
World Environmental and Water Resources Congress 2007
8/12/2019 Statistical Analysis of Extreme Rainfall Events Over Indiana USA
http://slidepdf.com/reader/full/statistical-analysis-of-extreme-rainfall-events-over-indiana-usa 9/9
9
function”, Hydrological Sciences Journal, 51(2), 223-238.Huff, Floyd A. (1967). “Time Distribution of Rainfall in Heavy Storms”, Water
Resources Research, 3, 1007-1019.
Nelsen, R. B. (2006). An Introduction to Copulas, 2nd
edition, Springer-Verlag New
York, Inc., New York, NY.
Rao, A. R., and Hamed, K. H. (2000). Flood Frequency Analysis, CRC Press LLC,FL.
Salvadori, G., and De Michele, C. (2004). “Frequency analysis via copulas:Theoretical aspects and applications to hydrological events”, Water Resour. Resear.,
40, W12511.
Salvadori, G., and C. De Michele (2006), Statistical characterization of temporal
structure of storms, Advances in Water Resources, 29(2006), 827-842.Sklar, A. (1959). “Fonctions de repartition a n dimensions et leurs marges”, Publ. Inst.
Statist. Univ. Paris 8, 229-231.
Zhang, L., and Singh, V. P. (2006). “Bivariate Flood Frequency Analysis Using theCopula Method”, Journal of Hydrologic Engineering, 11(2), 150-164.
World Environmental and Water Resources Congress 2007: Restoring Our Natural Habitat © 2007 ASCE