projected extreme rainfall indices in guinea and …
TRANSCRIPT
Corresponding author: Salihu A. C., Email: [email protected]
IJMS 2020 vol. 7 (1): 32-52
International Journal of Multidisciplinary Studies (IJMS)
Volume 7, Issue 1, 2020
PROJECTED EXTREME RAINFALL INDICES IN GUINEA AND
SUDANO-SAHELIAN ECOLOGICAL ZONES, NIGERIA
Salihu A. C.1*, Abdulkadir A.1, Nsofor G. N.1 and Otache M. Y.2
1Department of Geography, Federal University of Technology, Minna, Nigeria 2Department of Agricultural and Bioresources Engineering, Federal University of Technology, Minna,
Nigeria
ABSTRACT
Drought and Flood episodes are twin issues that are consequences of extreme rainfall events. The
negative impact of extreme rainfall events makes understanding their behaviour under the future climate
change necessary for regional planning. Hence, the objective of the study is to project extreme rainfall
indices in Guinea and Sudano-Sahelian ecological zones, Nigeria. A set of four extreme rainfall indices
namely: maximum 5-day rainfall (Rx5day), heavy rainfall days (R10mm), consecutive wet days (CWD)
and consecutive dry days (CDD) were adopted. The data and computation were done using KNMI
Climate Explorer. Projections were produced for the near-term 2019-2048, mid-term 2049-2078 and
long-term 2079-2100 periods with reference to the 1959-1988 and 1989-2018 baselines. The multi-model
ensemble mean of couple model intercomparison project 5 (CMIP5) under representative concentration
pathways (RCPs) 2.6, 4.5, and 8.5 were used. Mann-Kendal statistical test was adopted to analyze the
trends in extreme rainfall indices at the 0.05 significance level. Based on the results, it can be deduced
that there is a significant positive trend in the whole Guinea and Sudano-Sahelian ecological zone as a
region for maximum 5-day rainfall with respect to all the three RCPs. As for heavy rainfall, itreveals that
there is no significant positive trend for RCP2.6 with respect to the three projected periods under
consideration but significant positive trends with respect to 2049-2078 for RCP4.5 as well as RCP8.5
with respect to 2049-2078 and 2079-2100 periods. Increase in CDD, as well as a decrease in CWD, were
both not significant at the 0.05 confidence level. Therefore, it is expected that this study will aid guidance
to the understanding of the ongoing changes as well as possible changes in rainfall and rainfall-related
extremes. It is also important for future planning of water resources management and agriculture in
Guinea and Sudano-Sahelian ecological zones of Nigeria.
KEYWORDS: Extreme rainfall indices, Guinea, Sudano-Sahelian, Ecological zones, Nigeria
Salihu A. C. et al.
1 INTRODUCTION
Climate change is increasing the frequency
and severity of extreme rainfall events with
devastating consequences such as floods and
droughts around the world (Guoyong et al.,
2016). Under the background of global
warming, extreme events also changed in
frequency and intensity, even more
significantly than the mean climate. From a
global perspective, the wet extremes are
projected to become more severe in many
land areas where the mean precipitation is
projected to increase (Meehl et al., 2007
cited in Li et al., 2016). Extreme
precipitation increases the snow storage and
provides the condition for dangerous spring
flood. According to Deniz et al. (2017),
extreme precipitation in the winter and
summer periods often causes catastrophic
flood in some areas, which increases its risk
on human livelihood, industrial and social
infrastructures. This can critically affect
water supply, wastewater, and stormwater
drain facilities. Moreover, this effect acts
stronger for ageing infrastructure. Drought
and Flood episodes are twin issues that
further aggravate the already tensed water
resources management around the world.
However, Zobel et al. (2018) submitted that
not all flooding events are caused by extreme
rainfall, but there is usually a strong link
between the two. Mamadou et al. (2015)
contend that these consequences are more
severe in regions dominated by arid and
semiarid climate such as West Africa. Africa
as a whole is one of the most vulnerable
continents due to its high exposure and low
adaptive capacity. The negative impact of
extreme rainfall events makes understanding
their behaviour under future climate change
necessary for regional planning (Herold et
al., 2017; Stella et al., 2019). While
Revadekar et al. (2011) posited that changes
in the precipitation extreme events may
require adaption and mitigation measures for
proper water management. Abdullah (2015)
stated that an investigation of climate change
effects on extreme rainfall events can be
roughly grouped into (1) studies on the
existing effects of climate change based on
the analysis of historical rainfall records, and
(2) studies on future effects of climate
change based on the analysis of future
rainfall projections derived from climate
models under greenhouse gas emission
scenarios.
According to Arthur and Christopher (2017)
examples in the literature demonstrated the
extent to which extreme precipitation has
increased from both regional and global
perspectives point to increases in
atmospheric water vapor. This is consistent
with increasing average temperature and
increases in the frequency of local
convective storm events as physical reasons
for these changes. Increase in maximum
atmospheric water vapor due to temperature
rise is a principal factor for increasing the
intensity of individual precipitation events
(Kunkel et al., 2013 cited in Akio and
Hirokazu, 2016). However, in some regions,
linkages to certain atmospheric circulation
patterns have been posed as influencing
changes in precipitation extremes. Given the
populated coastal areas and the importance
of agriculture to the economy, the Southeast
Asia region is considered to be especially
susceptible to the effects of climate change,
including from flooding, tropical cyclones,
heat waves and sea-level rise (Pengpeng et
al., 2017). IPCC (2014) report highlights
potential impacts to health, biodiversity,
PROJECTED EXTREME RAINFALL INDICES IN GUINEA AND SUDANO-SAHELIAN
ECOLOGICAL ZONES, NIGERIA
food security, and aggravation of existing
social, economic and political tensions
(Coffel et al., 2019). That recurrent major
flooding has occurred over the last century,
with flooding typically reaching its peak
towards the end of southwest Thailand.
Similarly, water resources have been
threatened by the persistent impact of
climate change. This is noticeable from the
occurrence of drought to the continuous
decrease in the quality and quantity of water
due to reduced river flows and reservoir
storage, lowering of water tables, drying up
of aquifers and wetlands (Esther et al.,
2012). Lake Chad, for example, has shrinked
from its initial 25,000km2 in the 1960s to
1350km2 in 2005 (Yunana et al., 2017).
Streams in these zones which hitherto were
perennial have now become seasonal so that
water can only be found in them during the
wet seasons with little or no water in dry
seasons.
Nigeria in general and Guinea and Sudano-
Sahelian ecological zones to be specific have
its own share of the extreme rainfall
phenomena. Climate projection in Niger
Delta area of Nigeria demonstrated that the
coastal communities will be more vulnerable
to the effects of climate change, leading to
an increase in frequency and intensity of
flood (Agumagu, 2015). Guinea and
Sudano-Sahelian ecological zones of
Nigeria covered about 79% of the entire
landmass of Nigeria. It is inhabited by over
50% of the country’s 167 million people
(Ojoye et al. 2016) sparsely distributed
across 79% of the country’s total landmass.
It is home to over two-thirds of Nigeria’s
250 ethnic groups (Yunana et al., 2017).
Historical climate records indicate that this
region has experienced significant increases
in rainfall related extremes since the late 20th
to the beginning of the 21stcentury
(Abdussalam, 2015; Ojoye et al, 2016). The
archive of Royal Netherland Meteorological
Institute known as KNMI Climate Explorer
(https://climexp.knmi.nl) is an emerging
source of global climatology data. Many
climate change studies have been
undertaken using data from this source
(Arthur et al., 2016; Nurmohamed and Donk
2017; Jacquelyn et al., 2018 and Mitchell et
al., 2019). In addition, the data also include
extreme rainfall indices. It comprises of
observed and simulated evapotranspiration,
temperature, rainfall and extreme rainfall
indices data. The observed data are that of
Climate Research Unit (CRU TS 4.2) and
the simulated data are that of couple model
intercomparison project 5 (CMIP5) under
the representative concentration pathways
(RCPs) 2.6, 4.5, and 8.5all found in the
KNMI database.Hence, the objective of this
study is to project extreme rainfall indices in
Guinea and Sudano-Sahelian ecological
zones, Nigeria. However, this study used a
set of four extreme rainfall indices
namely:maximum 5-day rainfall(Rx5day),
heavy rainfall days (R10mm), consecutive
wet days (CWD) and consecutive dry days
(CDD).
2 MATERIALS AND METHODS
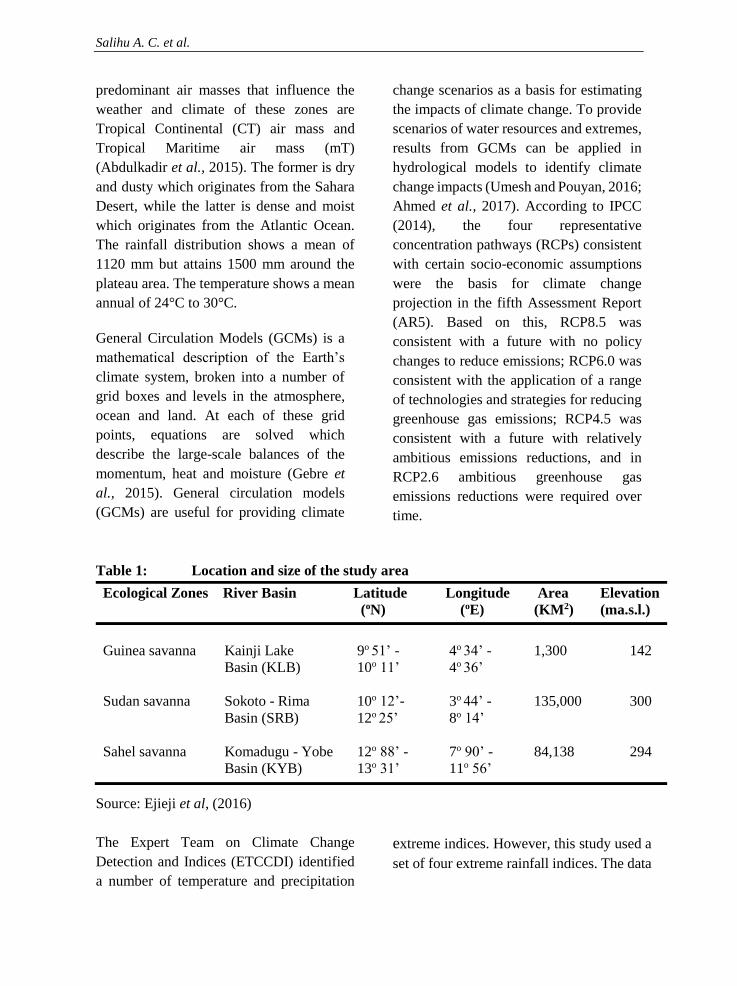
The study area lies between Longitudes 3°E
to 15°E of the Greenwich meridian and
Latitudes 8°N to 14°N of the equator (Table
1). The area covers Guinea and Sudano-
Sahelian ecological zones of Nigeria. It is
bordered to the north by the Niger Republic,
to the east by the Republic of Cameroun, to
the south by the tropical rainforest and to the
west by the Benin Republic. The two
Salihu A. C. et al.
predominant air masses that influence the
weather and climate of these zones are
Tropical Continental (CT) air mass and
Tropical Maritime air mass (mT)
(Abdulkadir et al., 2015). The former is dry
and dusty which originates from the Sahara
Desert, while the latter is dense and moist
which originates from the Atlantic Ocean.
The rainfall distribution shows a mean of
1120 mm but attains 1500 mm around the
plateau area. The temperature shows a mean
annual of 24°C to 30°C.
General Circulation Models (GCMs) is a
mathematical description of the Earth’s
climate system, broken into a number of
grid boxes and levels in the atmosphere,
ocean and land. At each of these grid
points, equations are solved which
describe the large-scale balances of the
momentum, heat and moisture (Gebre et
al., 2015). General circulation models
(GCMs) are useful for providing climate
change scenarios as a basis for estimating
the impacts of climate change. To provide
scenarios of water resources and extremes,
results from GCMs can be applied in
hydrological models to identify climate
change impacts (Umesh and Pouyan, 2016;
Ahmed et al., 2017). According to IPCC
(2014), the four representative
concentration pathways (RCPs) consistent
with certain socio-economic assumptions
were the basis for climate change
projection in the fifth Assessment Report
(AR5). Based on this, RCP8.5 was
consistent with a future with no policy
changes to reduce emissions; RCP6.0 was
consistent with the application of a range
of technologies and strategies for reducing
greenhouse gas emissions; RCP4.5 was
consistent with a future with relatively
ambitious emissions reductions, and in
RCP2.6 ambitious greenhouse gas
emissions reductions were required over
time.
Table 1: Location and size of the study area
Ecological Zones River Basin Latitude Longitude Area Elevation
(oN) (oE) (KM2) (ma.s.l.)
Guinea savanna Kainji Lake 9o 51’ - 4o 34’ - 1,300 142
Basin (KLB) 10o 11’ 4o 36’
Sudan savanna Sokoto - Rima 10o 12’- 3o 44’ - 135,000 300
Basin (SRB) 12o 25’ 8o 14’
Sahel savanna Komadugu - Yobe 12o 88’ - 7o 90’ - 84,138 294
Basin (KYB) 13o 31’ 11o 56’
Source: Ejieji et al, (2016)
The Expert Team on Climate Change
Detection and Indices (ETCCDI) identified
a number of temperature and precipitation
extreme indices. However, this study used a
set of four extreme rainfall indices. The data
PROJECTED EXTREME RAINFALL INDICES IN GUINEA AND SUDANO-SAHELIAN
ECOLOGICAL ZONES, NIGERIA
and computation were done using a web-
based application of Royal Netherland
Meteorological Institute known as KNMI
Climate Explorer (https://climexp.knmi.nl)
developed by Sillmann et al. (2013). Many
climate change studies have been
undertaken using data from this source
(Nurmohamed and Donk 2017; Jacquelyn et
al., 2018 and Mitchell et al., 2019). The
coordinates of each of the three basins were
used to derive the extreme rainfall indices
considered herein (Table 1). Projections
were produced for the three future periods
namely: near-term 2019-2048, mid-term
2049-2078 and long-term 2079-2100 with
reference to the 1959-1988 and 1989-2018
baselines. The multi-model ensemble mean
of couple model intercomparison project 5
(CMIP5) under the representative
concentration pathways (RCPs) 2.6, 4.5, and
8.5 were adopted. Furthermore, climate
change indices regarding the occurrence of
extreme rainfall trend using equation 1.7 and
1.10 were evaluated in order to determine
the future trend at individual and regional
locations. The extremes used in the trend
analysis
(𝑅𝑥5𝑑𝑎𝑦, 𝑅10𝑚𝑚, 𝐶𝑊𝐷𝑎𝑛𝑑 𝐶𝐷𝐷) are as
follows:
𝑅𝑥5𝑑𝑎𝑦𝑗 = max (𝑅𝑅𝑖𝑗) 1.1
𝑅10 𝑚𝑚𝑗 = 𝑑𝑎𝑦𝑠 𝑤ℎ𝑒𝑛 𝑅𝑅𝑖𝑗 ≥ 10mm 1.2
𝐶𝑊𝐷𝑗 = 𝑀𝑎𝑥𝑖𝑚𝑢𝑚 𝑙𝑒𝑛𝑔𝑡ℎ 𝑜𝑓 𝑤𝑒𝑡 𝑠𝑝𝑒𝑙𝑙1.3
𝑤ℎ𝑒𝑟𝑒 𝑅𝑅𝑖𝑗 ≥ 1mm
𝐶𝐷𝐷𝑗 = 𝑀𝑎𝑥𝑖𝑚𝑢𝑚𝑙𝑒𝑛𝑔𝑡ℎ𝑜𝑓𝑑𝑟𝑦𝑠𝑝𝑒𝑙𝑙 1.4
𝑤ℎ𝑒𝑟𝑒 𝑅𝑅𝑖𝑗 < 1mm
Where,
𝑅𝑥5𝑑𝑎𝑦 is the annual maximum
consecutive 5-day rainfall,
𝑅10𝑚𝑚 is the annual count of days when
rainfall is more than 10 mm,
𝐶𝑊𝐷 is the maximum length of wet spell
where daily rainfall is more than 1 mm,
𝐶𝐷𝐷 is the maximum length of dry spell
where daily rainfall is less than 1 mm
𝑅𝑅𝑖𝑗 is the daily rainfall on day 𝑖 in period 𝑗,
𝑅𝑅5𝑖𝑗 is the consecutive 5-day rainfall on
day 𝑖 in period 𝑗
To achieve the stated objective, Mann-
Kendall test (Mann, 1945; Kendall, 1975)
was applied to detect the monotonic trends
in the projected water stress time series. The
Mann-Kendall statistical test has been
frequently used to quantify the significance
of trends in hydro-meteorological time
series (Pervez and Henebry, 2015;
Abdussalam, 2015; Nahlah et al., 2019).
This is calculated as:
S = ∑ ∑ sign ni=k+1
n−1k=1 (xj − xk)1.5
VAR (S) = [𝑛(𝑛−1)(2𝑛+5)−∑ 𝑡𝑖(𝑡𝑖− 1)(2𝑡𝑖+ 5)
𝑚𝑖=1
18
1.6
Where:
S = Mann-Kendall statistics
n = the number of data points
𝑡𝑖 = the number of ties for the i value and
m = the number of tied values (a tied group
is a set of sample data having the same
value)
Salihu A. C. et al.
𝑍𝑠 =
{
𝑆− 1
√𝑉𝐴𝑅(𝑆)𝑖𝑓𝑆 > 0
0 𝑖𝑓𝑆 = 0𝑆 + 1
√𝑉𝐴𝑅(𝑆)𝑖𝑓𝑆 < 0
}
1.7
A positive value of 𝑍𝑠 (standardized test
statistics) indicates increasing trends while
negative 𝑍𝑠value reflects decreasing trends,
while 0 values indicate no trends. The
testing trend was done at specific α
significance level. When |𝑍𝑠 | >𝑍1-α 2⁄ , the
null hypothesis is rejected and a significant
trend exists in the time series. 𝑍1-α 2⁄ is
obtained from the standard normal
distribution table. In this study, the
significance level of α=0.05 was used.
Nahlah et al., 2019 stated that at the 5%
significance level, the null hypothesis of
no trend is rejected if |𝑍𝑠 | > 1.96 and
concludes that there is a significant trend
in the time series.
In order to assess trend at a regional scale,
the Regional Mann-Kendall test was
employed to quantitatively combine
results of the MK test for individual
locations and to evaluate the regional
trends. These statistical techniques have
been adopted by Mohammedet al., (2014);
Michael et al., (2017). In the regional MK
test, the 𝑆𝑟 of regional data is calculated as:
𝑆𝑟 = ∑ 𝑆𝑖𝑛𝑖=1 1.8
Where+
𝑆𝑟 is Kendall’s 𝑆 for the “ith” location in a
region with m locations within the region.
If 𝑆𝑟 is estimated using independent
identically distributed data, 𝑆𝑟 is
approximately normally distributed for
large m with mean equal to 0 and the
variance as noted below.
𝑉𝑎𝑟(𝑆𝑟) = ∑ 𝑉𝑎𝑟𝑛𝑖 = 1 = 𝜎2 1.9
𝑍𝑟 = {
𝑆𝑟− 1
𝜎𝑓𝑜𝑟𝑆𝑟 > 0
0 𝑓𝑜𝑟𝑆𝑟 = 0𝑆𝑟 + 1
𝜎𝑓𝑜𝑟𝑆𝑟 < 0
} 1.10
To determine whether to reject or not the
null hypothesis of no trend, the test
statistics 𝑍𝑟 is assessed against the critical
value Zcrit corresponding to the specific
significance level α of the test. For the two-
tailed test, the critical value is defined as
Φ−1(1 – α/2), where Φ is the cumulative
distribution function of standard normal
distribution (Helsel and Hirsch 2002; cited
in Michael et al., 2017). The null
hypothesis is rejected and the trend is
considered significant statistically if the
value of |𝑍𝑟| ≥ Zcrit.
3 RESULTS & DISCUSSION
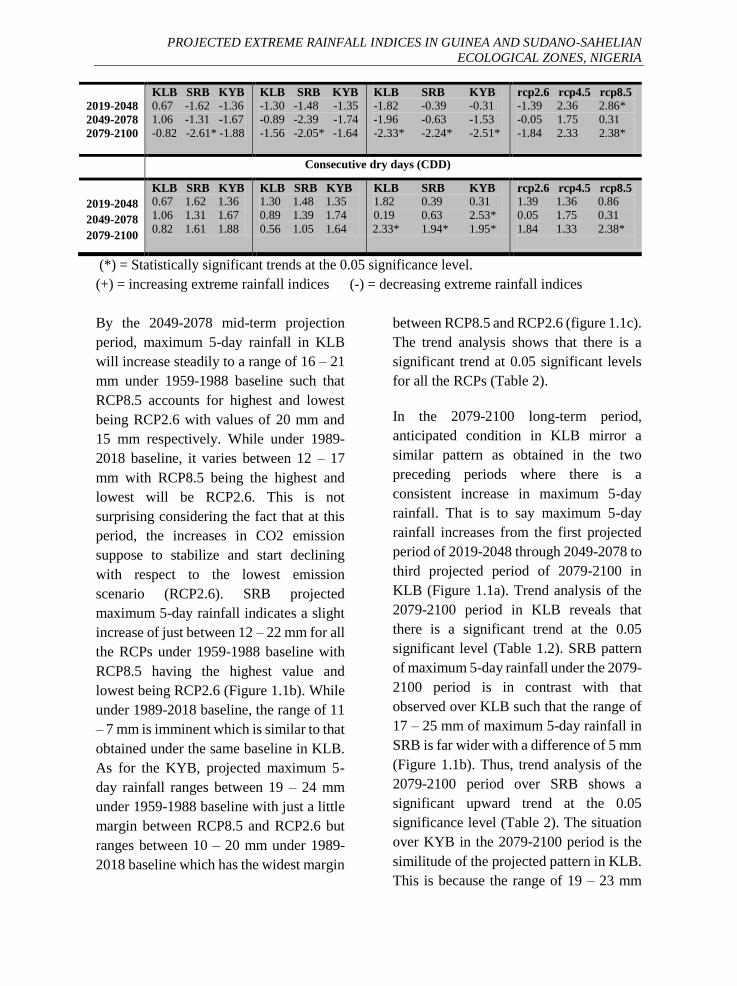
3.1: Changes in Maximum 5-day
Rainfall (RX5day)
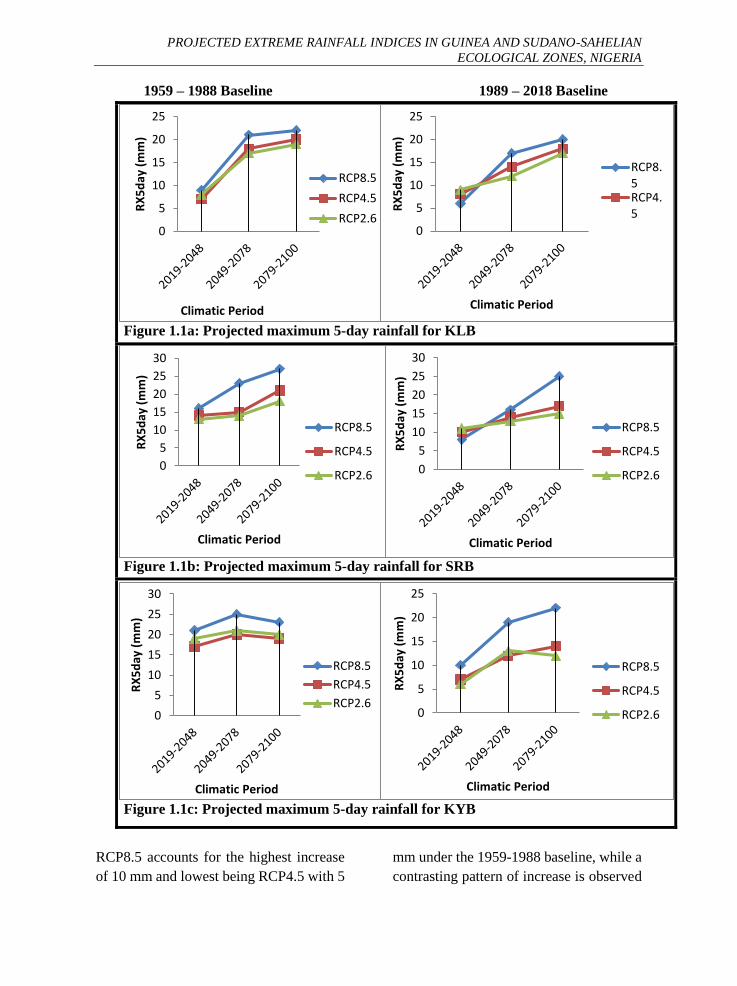
The maximum 5-day rainfall is projected
to change differentially in space and time
over the KLB, SRB and KYB as well as
across the three scenarios between 2019
and 2100. The 2019-2048 near-term period
shows that the maximum 5-day rainfall
will increase within the range of 5 – 10 mm
for all the three RCPs under the two
baseline periods of 1959-1988 and 1989-
2018 over the KLB.
PROJECTED EXTREME RAINFALL INDICES IN GUINEA AND SUDANO-SAHELIAN
ECOLOGICAL ZONES, NIGERIA
1959 – 1988 Baseline 1989 – 2018 Baseline
Figure 1.1a: Projected maximum 5-day rainfall for KLB
Figure 1.1b: Projected maximum 5-day rainfall for SRB
Figure 1.1c: Projected maximum 5-day rainfall for KYB
RCP8.5 accounts for the highest increase
of 10 mm and lowest being RCP4.5 with 5
mm under the 1959-1988 baseline, while a
contrasting pattern of increase is observed
0
5
10
15
20
25
RX
5d
ay (
mm
)
Climatic Period
RCP8.5RCP4.5
0
5
10
15
20
25
RX
5d
ay (
mm
)
Climatic Period
RCP8.5
RCP4.5
RCP2.6
0
5
10
15
20
25
30
RX
5d
ay (
mm
)
Climatic Period
RCP8.5
RCP4.5
RCP2.60
5
10
15
20
25
30
RX
5d
ay (
mm
)
Climatic Period
RCP8.5
RCP4.5
RCP2.6
0
5
10
15
20
25
RX
5d
ay (
mm
)
Climatic Period
RCP8.5
RCP4.5
RCP2.60
5
10
15
20
25
30
RX
5d
ay (
mm
)
Climatic Period
RCP8.5
RCP4.5
RCP2.6
Salihu A. C. et al.
under 1989-2018 baseline where RCP2.6
accounts for the highest with 10 mm and
lowest being RCP8.5 (Figure 1.1a). Trend
analysis of maximum 5-day rainfall within
the 2019-2048 period over KLB indicates
that it is not significant at 0.05 significant
levels for all the three RCPs (Table 2).
SRB maximum 5-day rainfall reveals that
the range of increase is between 12 – 16
mm for all the RCPs under 1959-1988
baseline but decreases to the range of 7 –
10 mm under the 1989-2018 baseline.
RCP8.5 accounts for the highest with 16
mm under 1959-1988 baseline but lowest
with 8mm under 1989-2018 baseline.
While RCP2.6 accounts for the lowest with
12 mm under 1959-1988 baseline but
highest with 10 mm under 1989-2018
baseline (Figure 1.1b).
Trend analysis of maximum 5-day rainfall
in SRB under the 2019-2048 period shows
no significant trend at the 0.05 significance
level for RCPs (2.6 and 4.5) but significant
for RCP8.5 (Table 2). Similarly, maximum
5-day rainfall in KYB reveals 16 – 21 mm
range of increase under the 1959-1988
baseline for all the RCPs, but sharply
decreases to the range of 5 – 10 mm under
1989-2018 baseline with RCP8.5 having
the highest value and least being RCP2.6.
It is important to point out that the range of
increase under 1989-2018 baseline is the
same for KLB and KYB but differ greatly
with SRB. However, the trend analysis of
maximum 5-day rainfall over KYB under
the 2019-2048 period shows that there is a
significant trend for all the three RCPs at
the 0.05 significance level. Therefore,
maximum 5-day rainfallwill be mostly felt
in KYB than the other two basins.
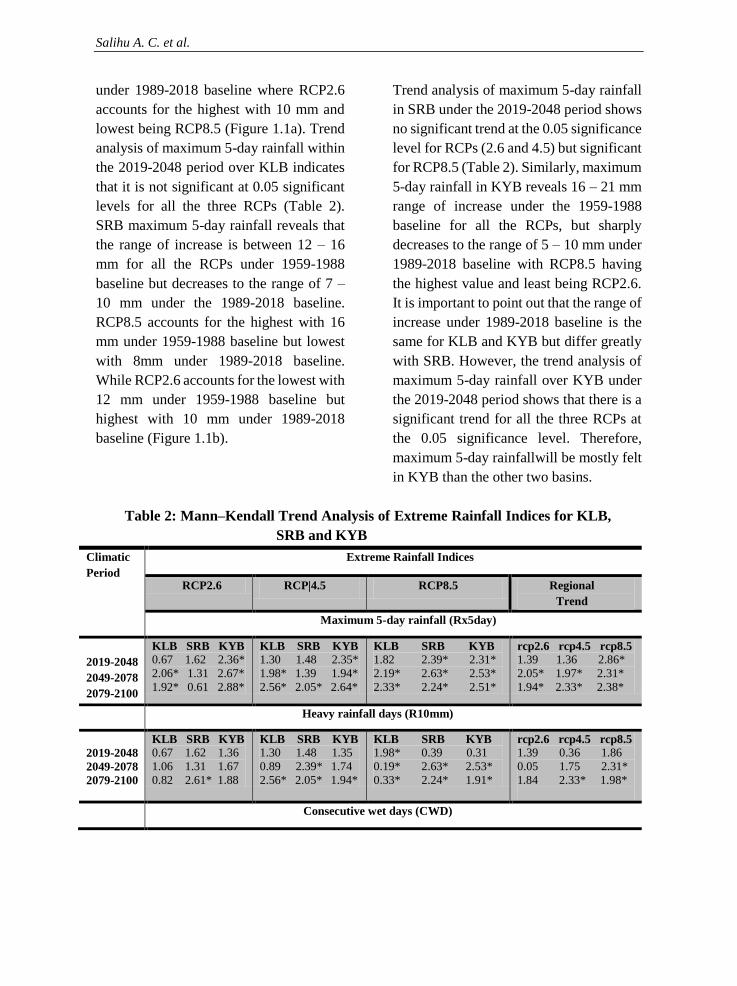
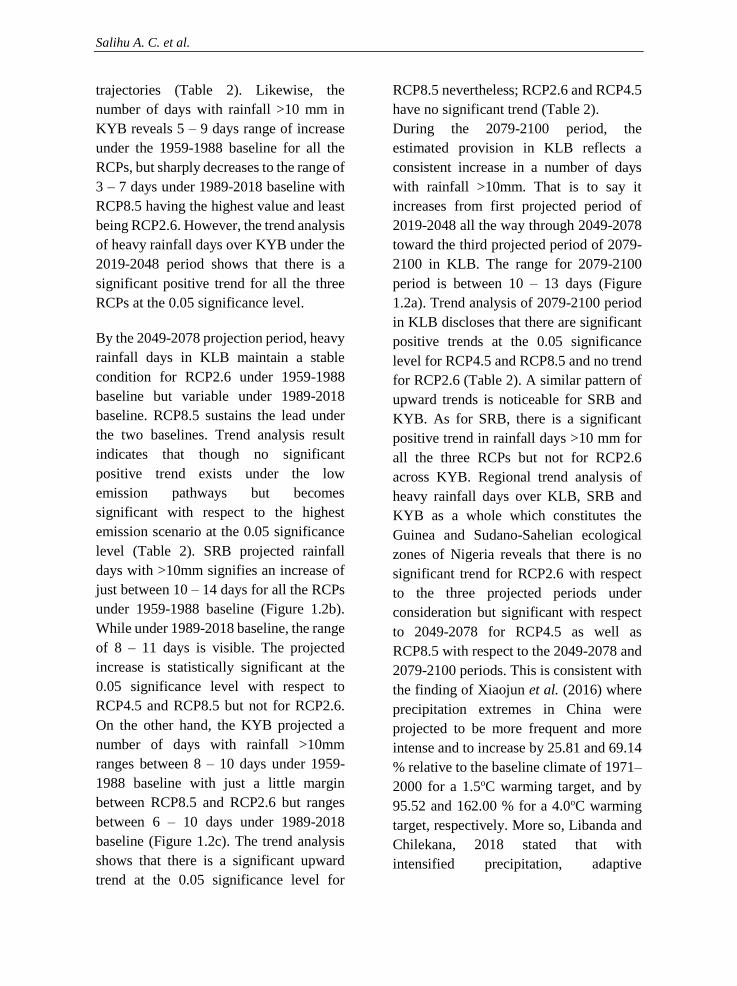
Table 2: Mann–Kendall Trend Analysis of Extreme Rainfall Indices for KLB,
SRB and KYB
Climatic
Period
Extreme Rainfall Indices
RCP2.6 RCP|4.5 RCP8.5 Regional
Trend
Maximum 5-day rainfall (Rx5day)
2019-2048
2049-2078
2079-2100
KLB SRB KYB
0.67 1.62 2.36*
2.06* 1.31 2.67*
1.92* 0.61 2.88*
KLB SRB KYB
1.30 1.48 2.35*
1.98* 1.39 1.94*
2.56* 2.05* 2.64*
KLB SRB KYB
1.82 2.39* 2.31*
2.19* 2.63* 2.53*
2.33* 2.24* 2.51*
rcp2.6 rcp4.5 rcp8.5
1.39 1.36 2.86*
2.05* 1.97* 2.31*
1.94* 2.33* 2.38*
Heavy rainfall days (R10mm)
2019-2048
2049-2078
2079-2100
KLB SRB KYB
0.67 1.62 1.36
1.06 1.31 1.67
0.82 2.61* 1.88
KLB SRB KYB
1.30 1.48 1.35
0.89 2.39* 1.74
2.56* 2.05* 1.94*
KLB SRB KYB
1.98* 0.39 0.31
0.19* 2.63* 2.53*
0.33* 2.24* 1.91*
rcp2.6 rcp4.5 rcp8.5
1.39 0.36 1.86
0.05 1.75 2.31*
1.84 2.33* 1.98*
Consecutive wet days (CWD)
PROJECTED EXTREME RAINFALL INDICES IN GUINEA AND SUDANO-SAHELIAN
ECOLOGICAL ZONES, NIGERIA
2019-2048
2049-2078
2079-2100
KLB SRB KYB
0.67 -1.62 -1.36
1.06 -1.31 -1.67
-0.82 -2.61* -1.88
KLB SRB KYB
-1.30 -1.48 -1.35
-0.89 -2.39 -1.74
-1.56 -2.05* -1.64
KLB SRB KYB
-1.82 -0.39 -0.31
-1.96 -0.63 -1.53
-2.33* -2.24* -2.51*
rcp2.6 rcp4.5 rcp8.5
-1.39 2.36 2.86*
-0.05 1.75 0.31
-1.84 2.33 2.38*
Consecutive dry days (CDD)
2019-2048
2049-2078
2079-2100
KLB SRB KYB
0.67 1.62 1.36
1.06 1.31 1.67
0.82 1.61 1.88
KLB SRB KYB
1.30 1.48 1.35
0.89 1.39 1.74
0.56 1.05 1.64
KLB SRB KYB
1.82 0.39 0.31
0.19 0.63 2.53*
2.33* 1.94* 1.95*
rcp2.6 rcp4.5 rcp8.5
1.39 1.36 0.86
0.05 1.75 0.31
1.84 1.33 2.38*
(*) = Statistically significant trends at the 0.05 significance level.
(+) = increasing extreme rainfall indices (-) = decreasing extreme rainfall indices
By the 2049-2078 mid-term projection
period, maximum 5-day rainfall in KLB
will increase steadily to a range of 16 – 21
mm under 1959-1988 baseline such that
RCP8.5 accounts for highest and lowest
being RCP2.6 with values of 20 mm and
15 mm respectively. While under 1989-
2018 baseline, it varies between 12 – 17
mm with RCP8.5 being the highest and
lowest will be RCP2.6. This is not
surprising considering the fact that at this
period, the increases in CO2 emission
suppose to stabilize and start declining
with respect to the lowest emission
scenario (RCP2.6). SRB projected
maximum 5-day rainfall indicates a slight
increase of just between 12 – 22 mm for all
the RCPs under 1959-1988 baseline with
RCP8.5 having the highest value and
lowest being RCP2.6 (Figure 1.1b). While
under 1989-2018 baseline, the range of 11
– 7 mm is imminent which is similar to that
obtained under the same baseline in KLB.
As for the KYB, projected maximum 5-
day rainfall ranges between 19 – 24 mm
under 1959-1988 baseline with just a little
margin between RCP8.5 and RCP2.6 but
ranges between 10 – 20 mm under 1989-
2018 baseline which has the widest margin
between RCP8.5 and RCP2.6 (figure 1.1c).
The trend analysis shows that there is a
significant trend at 0.05 significant levels
for all the RCPs (Table 2).
In the 2079-2100 long-term period,
anticipated condition in KLB mirror a
similar pattern as obtained in the two
preceding periods where there is a
consistent increase in maximum 5-day
rainfall. That is to say maximum 5-day
rainfall increases from the first projected
period of 2019-2048 through 2049-2078 to
third projected period of 2079-2100 in
KLB (Figure 1.1a). Trend analysis of the
2079-2100 period in KLB reveals that
there is a significant trend at the 0.05
significant level (Table 1.2). SRB pattern
of maximum 5-day rainfall under the 2079-
2100 period is in contrast with that
observed over KLB such that the range of
17 – 25 mm of maximum 5-day rainfall in
SRB is far wider with a difference of 5 mm
(Figure 1.1b). Thus, trend analysis of the
2079-2100 period over SRB shows a
significant upward trend at the 0.05
significance level (Table 2). The situation
over KYB in the 2079-2100 period is the
similitude of the projected pattern in KLB.
This is because the range of 19 – 23 mm
Salihu A. C. et al.
for all the RCPs over KYB is the lowest
among the three periods. Therefore, trend
analysis of the 2079-2100 period over
KYB reveals significant upward trend at
the 0.05 significance level. Regional trend
analysis of the maximum 5-day rainfall
over KLB, SRB and KYB as a whole
which constitutes the Guinea and Sudano-
Sahelian ecological zones of Nigeria
reveals that under the 2019-2048 period
there is no significant positive trend at the
0.05 significance level. This is with respect
to lower emission scenarios (RCP2.6 and
RCP4.5) but significant in higher emission
scenario of RCP8.5 (Table 2). By 2049-
2078 through 2079-2100 periods, there are
significant positive trends in the whole
Guinea and Sudano-Sahelian ecological
zones as a region for maximum 5-day
rainfall time series with respect to all the
three RCPs. This is in tandem with
Abdullah (2015) that reveals in Turkey
statistically significant trends of maximum
5-day. Furthermore, Libanda and
Chilekana (2018) contend that extreme
precipitation exerts a damaging impact on
both society and ecosystems over Zambia.
That understanding projections of extreme
precipitation is part of a resilient response
to its impacts.
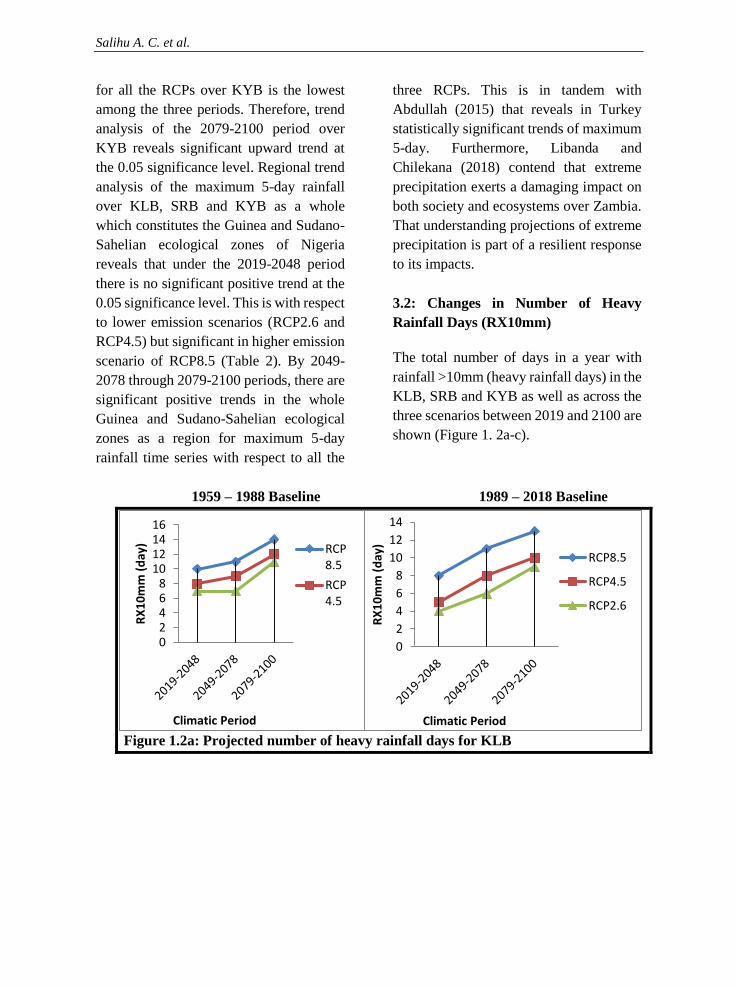
3.2: Changes in Number of Heavy
Rainfall Days (RX10mm)
The total number of days in a year with
rainfall >10mm (heavy rainfall days) in the
KLB, SRB and KYB as well as across the
three scenarios between 2019 and 2100 are
shown (Figure 1. 2a-c).
1959 – 1988 Baseline 1989 – 2018 Baseline
Figure 1.2a: Projected number of heavy rainfall days for KLB
0
2
4
6
8
10
12
14
RX
10
mm
(d
ay)
Climatic Period
RCP8.5
RCP4.5
RCP2.6
02468
10121416
RX
10
mm
(d
ay)
Climatic Period
RCP8.5
RCP4.5
PROJECTED EXTREME RAINFALL INDICES IN GUINEA AND SUDANO-SAHELIAN
ECOLOGICAL ZONES, NIGERIA
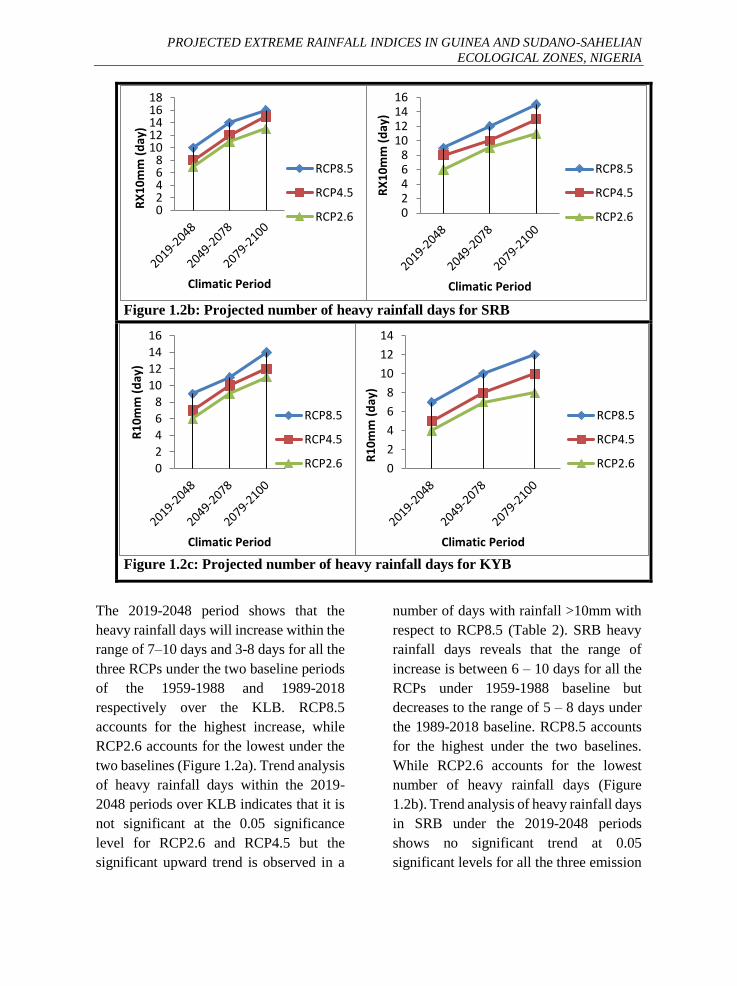
Figure 1.2b: Projected number of heavy rainfall days for SRB
Figure 1.2c: Projected number of heavy rainfall days for KYB
The 2019-2048 period shows that the
heavy rainfall days will increase within the
range of 7–10 days and 3-8 days for all the
three RCPs under the two baseline periods
of the 1959-1988 and 1989-2018
respectively over the KLB. RCP8.5
accounts for the highest increase, while
RCP2.6 accounts for the lowest under the
two baselines (Figure 1.2a). Trend analysis
of heavy rainfall days within the 2019-
2048 periods over KLB indicates that it is
not significant at the 0.05 significance
level for RCP2.6 and RCP4.5 but the
significant upward trend is observed in a
number of days with rainfall >10mm with
respect to RCP8.5 (Table 2). SRB heavy
rainfall days reveals that the range of
increase is between 6 – 10 days for all the
RCPs under 1959-1988 baseline but
decreases to the range of 5 – 8 days under
the 1989-2018 baseline. RCP8.5 accounts
for the highest under the two baselines.
While RCP2.6 accounts for the lowest
number of heavy rainfall days (Figure
1.2b). Trend analysis of heavy rainfall days
in SRB under the 2019-2048 periods
shows no significant trend at 0.05
significant levels for all the three emission
02468
10121416
RX
10
mm
(d
ay)
Climatic Period
RCP8.5
RCP4.5
RCP2.602468
1012141618
RX
10
mm
(d
ay)
Climatic Period
RCP8.5
RCP4.5
RCP2.6
0
2
4
6
8
10
12
14
R1
0m
m (
day
)
Climatic Period
RCP8.5
RCP4.5
RCP2.60
2
4
6
8
10
12
14
16
R1
0m
m (
day
)
Climatic Period
RCP8.5
RCP4.5
RCP2.6
Salihu A. C. et al.
trajectories (Table 2). Likewise, the
number of days with rainfall >10 mm in
KYB reveals 5 – 9 days range of increase
under the 1959-1988 baseline for all the
RCPs, but sharply decreases to the range of
3 – 7 days under 1989-2018 baseline with
RCP8.5 having the highest value and least
being RCP2.6. However, the trend analysis
of heavy rainfall days over KYB under the
2019-2048 period shows that there is a
significant positive trend for all the three
RCPs at the 0.05 significance level.
By the 2049-2078 projection period, heavy
rainfall days in KLB maintain a stable
condition for RCP2.6 under 1959-1988
baseline but variable under 1989-2018
baseline. RCP8.5 sustains the lead under
the two baselines. Trend analysis result
indicates that though no significant
positive trend exists under the low
emission pathways but becomes
significant with respect to the highest
emission scenario at the 0.05 significance
level (Table 2). SRB projected rainfall
days with >10mm signifies an increase of
just between 10 – 14 days for all the RCPs
under 1959-1988 baseline (Figure 1.2b).
While under 1989-2018 baseline, the range
of 8 – 11 days is visible. The projected
increase is statistically significant at the
0.05 significance level with respect to
RCP4.5 and RCP8.5 but not for RCP2.6.
On the other hand, the KYB projected a
number of days with rainfall >10mm
ranges between 8 – 10 days under 1959-
1988 baseline with just a little margin
between RCP8.5 and RCP2.6 but ranges
between 6 – 10 days under 1989-2018
baseline (Figure 1.2c). The trend analysis
shows that there is a significant upward
trend at the 0.05 significance level for
RCP8.5 nevertheless; RCP2.6 and RCP4.5
have no significant trend (Table 2).
During the 2079-2100 period, the
estimated provision in KLB reflects a
consistent increase in a number of days
with rainfall >10mm. That is to say it
increases from first projected period of
2019-2048 all the way through 2049-2078
toward the third projected period of 2079-
2100 in KLB. The range for 2079-2100
period is between 10 – 13 days (Figure
1.2a). Trend analysis of 2079-2100 period
in KLB discloses that there are significant
positive trends at the 0.05 significance
level for RCP4.5 and RCP8.5 and no trend
for RCP2.6 (Table 2). A similar pattern of
upward trends is noticeable for SRB and
KYB. As for SRB, there is a significant
positive trend in rainfall days >10 mm for
all the three RCPs but not for RCP2.6
across KYB. Regional trend analysis of
heavy rainfall days over KLB, SRB and
KYB as a whole which constitutes the
Guinea and Sudano-Sahelian ecological
zones of Nigeria reveals that there is no
significant trend for RCP2.6 with respect
to the three projected periods under
consideration but significant with respect
to 2049-2078 for RCP4.5 as well as
RCP8.5 with respect to the 2049-2078 and
2079-2100 periods. This is consistent with
the finding of Xiaojun et al. (2016) where
precipitation extremes in China were
projected to be more frequent and more
intense and to increase by 25.81 and 69.14
% relative to the baseline climate of 1971–
2000 for a 1.5oC warming target, and by
95.52 and 162.00 % for a 4.0oC warming
target, respectively. More so, Libanda and
Chilekana, 2018 stated that with
intensified precipitation, adaptive
PROJECTED EXTREME RAINFALL INDICES IN GUINEA AND SUDANO-SAHELIAN
ECOLOGICAL ZONES, NIGERIA
strategies against flooding will be of major
importance. Inundation of floodwater into
homes, displacement of people, mudslides
and erosion of stream banks and lakeshores
are common in the wake of intensified
precipitation.
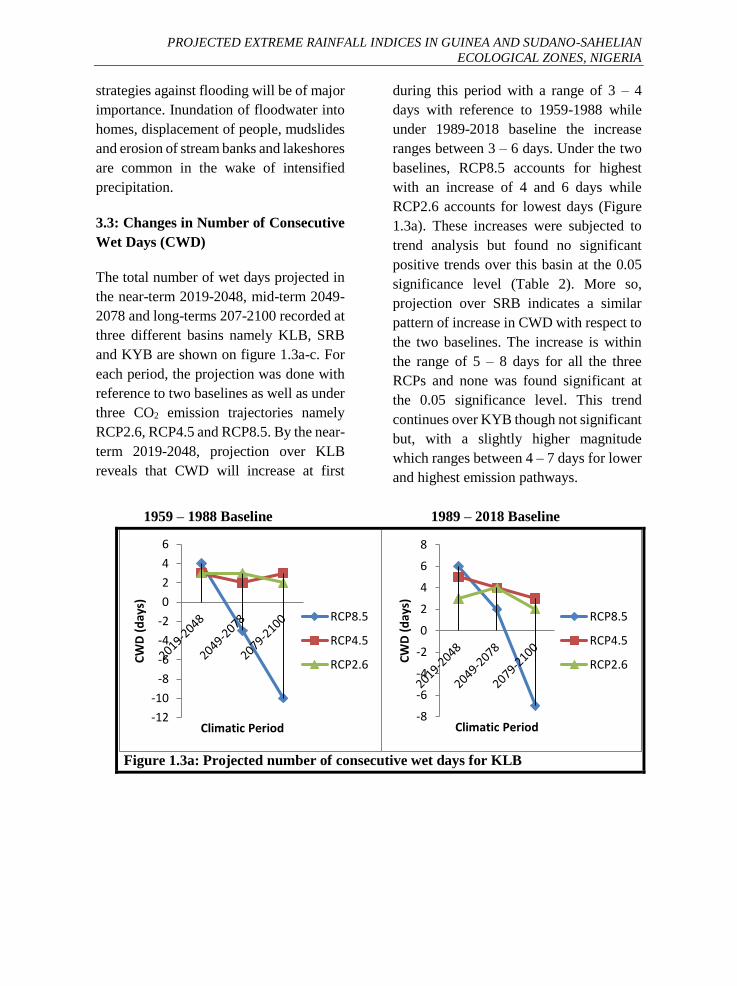
3.3: Changes in Number of Consecutive
Wet Days (CWD)
The total number of wet days projected in
the near-term 2019-2048, mid-term 2049-
2078 and long-terms 207-2100 recorded at
three different basins namely KLB, SRB
and KYB are shown on figure 1.3a-c. For
each period, the projection was done with
reference to two baselines as well as under
three CO2 emission trajectories namely
RCP2.6, RCP4.5 and RCP8.5. By the near-
term 2019-2048, projection over KLB
reveals that CWD will increase at first
during this period with a range of 3 – 4
days with reference to 1959-1988 while
under 1989-2018 baseline the increase
ranges between 3 – 6 days. Under the two
baselines, RCP8.5 accounts for highest
with an increase of 4 and 6 days while
RCP2.6 accounts for lowest days (Figure
1.3a). These increases were subjected to
trend analysis but found no significant
positive trends over this basin at the 0.05
significance level (Table 2). More so,
projection over SRB indicates a similar
pattern of increase in CWD with respect to
the two baselines. The increase is within
the range of 5 – 8 days for all the three
RCPs and none was found significant at
the 0.05 significance level. This trend
continues over KYB though not significant
but, with a slightly higher magnitude
which ranges between 4 – 7 days for lower
and highest emission pathways.
1959 – 1988 Baseline 1989 – 2018 Baseline
Figure 1.3a: Projected number of consecutive wet days for KLB
-8
-6
-4
-2
0
2
4
6
8
CW
D (
day
s)
Climatic Period
RCP8.5
RCP4.5
RCP2.6
-12
-10
-8
-6
-4
-2
0
2
4
6
CW
D (
day
s)
Climatic Period
RCP8.5
RCP4.5
RCP2.6
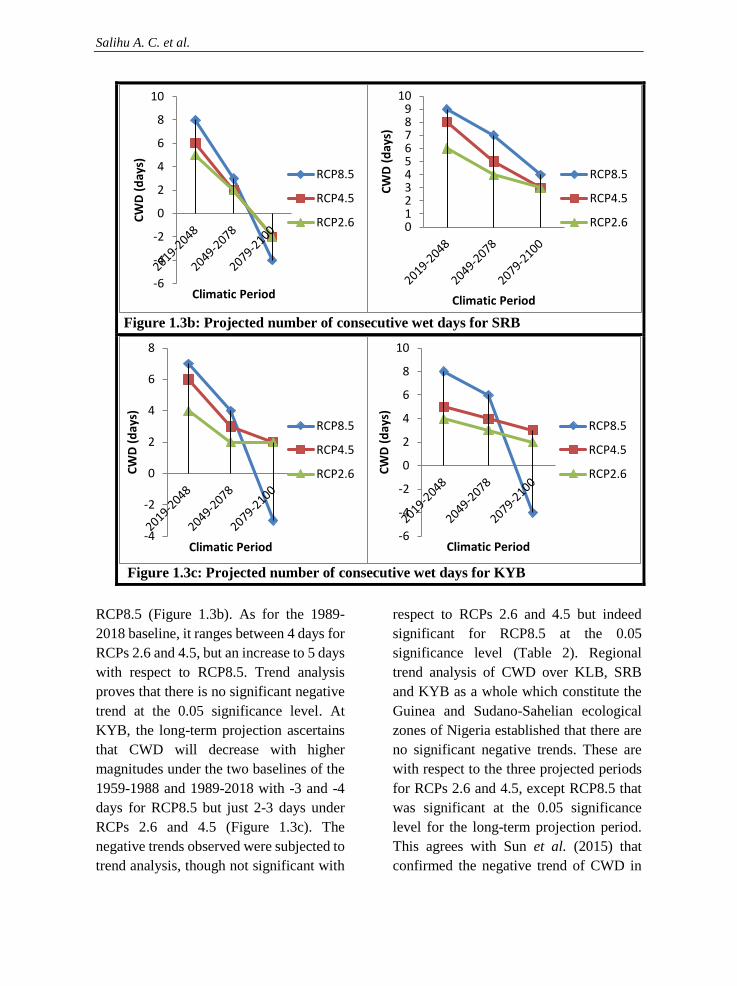
Salihu A. C. et al.
Figure 1.3b: Projected number of consecutive wet days for SRB
Figure 1.3c: Projected number of consecutive wet days for KYB
RCP8.5 (Figure 1.3b). As for the 1989-
2018 baseline, it ranges between 4 days for
RCPs 2.6 and 4.5, but an increase to 5 days
with respect to RCP8.5. Trend analysis
proves that there is no significant negative
trend at the 0.05 significance level. At
KYB, the long-term projection ascertains
that CWD will decrease with higher
magnitudes under the two baselines of the
1959-1988 and 1989-2018 with -3 and -4
days for RCP8.5 but just 2-3 days under
RCPs 2.6 and 4.5 (Figure 1.3c). The
negative trends observed were subjected to
trend analysis, though not significant with
respect to RCPs 2.6 and 4.5 but indeed
significant for RCP8.5 at the 0.05
significance level (Table 2). Regional
trend analysis of CWD over KLB, SRB
and KYB as a whole which constitute the
Guinea and Sudano-Sahelian ecological
zones of Nigeria established that there are
no significant negative trends. These are
with respect to the three projected periods
for RCPs 2.6 and 4.5, except RCP8.5 that
was significant at the 0.05 significance
level for the long-term projection period.
This agrees with Sun et al. (2015) that
confirmed the negative trend of CWD in
0123456789
10
CW
D (
day
s)
Climatic Period
RCP8.5
RCP4.5
RCP2.6
-6
-4
-2
0
2
4
6
8
10
CW
D (
day
s)
Climatic Period
RCP8.5
RCP4.5
RCP2.6
-6
-4
-2
0
2
4
6
8
10
CW
D (
day
s)
Climatic Period
RCP8.5
RCP4.5
RCP2.6
-4
-2
0
2
4
6
8
CW
D (
day
s)
Climatic Period
RCP8.5
RCP4.5
RCP2.6
PROJECTED EXTREME RAINFALL INDICES IN GUINEA AND SUDANO-SAHELIAN
ECOLOGICAL ZONES, NIGERIA
China under the RCP8.5 scenario but that
there were little trends under the RCP2.6
and RCP4.5 scenarios. In addition, Carlos
and Veronica (2017) demonstrated related
trends in Brazil. This, therefore, entails
that Guinea and Sudano-Sahelian
ecological zones of Nigeria will
experience episodes of drought in the near,
mid and long-term future if the rate of
global emission of CO2 maintains a steady
rise with no commensurate policies to
address the issue at stake. However, if
stringent measures are put in place it will
go a long way to curb the imminent
drought devastation that will be ensued.
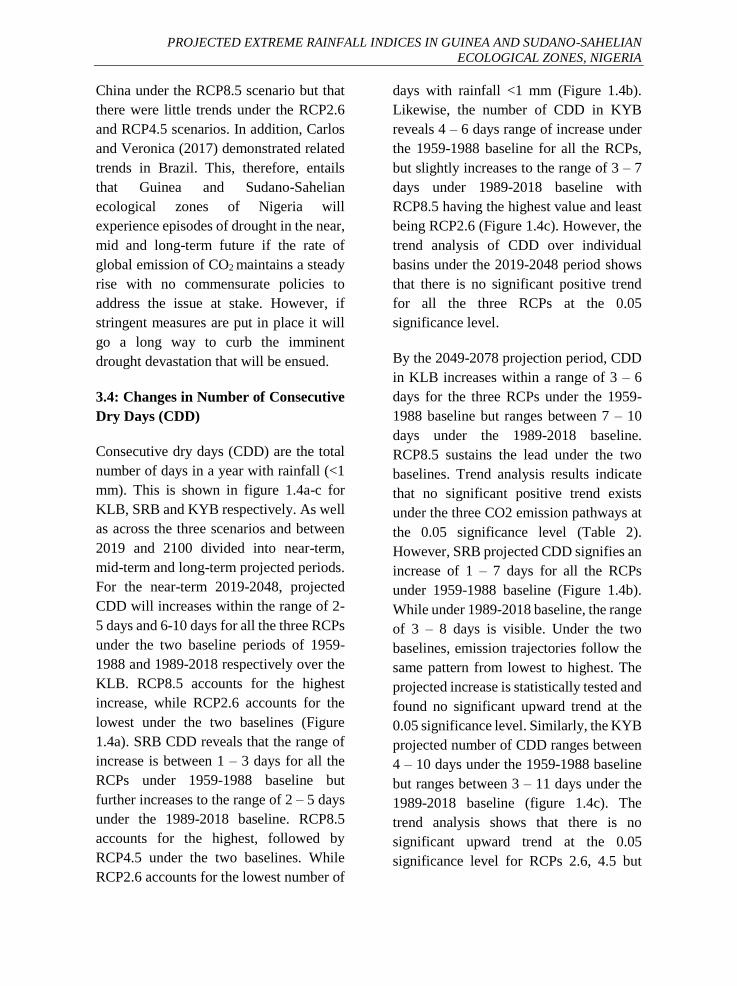
3.4: Changes in Number of Consecutive
Dry Days (CDD)
Consecutive dry days (CDD) are the total
number of days in a year with rainfall (<1
mm). This is shown in figure 1.4a-c for
KLB, SRB and KYB respectively. As well
as across the three scenarios and between
2019 and 2100 divided into near-term,
mid-term and long-term projected periods.
For the near-term 2019-2048, projected
CDD will increases within the range of 2-
5 days and 6-10 days for all the three RCPs
under the two baseline periods of 1959-
1988 and 1989-2018 respectively over the
KLB. RCP8.5 accounts for the highest
increase, while RCP2.6 accounts for the
lowest under the two baselines (Figure
1.4a). SRB CDD reveals that the range of
increase is between 1 – 3 days for all the
RCPs under 1959-1988 baseline but
further increases to the range of 2 – 5 days
under the 1989-2018 baseline. RCP8.5
accounts for the highest, followed by
RCP4.5 under the two baselines. While
RCP2.6 accounts for the lowest number of
days with rainfall <1 mm (Figure 1.4b).
Likewise, the number of CDD in KYB
reveals 4 – 6 days range of increase under
the 1959-1988 baseline for all the RCPs,
but slightly increases to the range of 3 – 7
days under 1989-2018 baseline with
RCP8.5 having the highest value and least
being RCP2.6 (Figure 1.4c). However, the
trend analysis of CDD over individual
basins under the 2019-2048 period shows
that there is no significant positive trend
for all the three RCPs at the 0.05
significance level.
By the 2049-2078 projection period, CDD
in KLB increases within a range of 3 – 6
days for the three RCPs under the 1959-
1988 baseline but ranges between 7 – 10
days under the 1989-2018 baseline.
RCP8.5 sustains the lead under the two
baselines. Trend analysis results indicate
that no significant positive trend exists
under the three CO2 emission pathways at
the 0.05 significance level (Table 2).
However, SRB projected CDD signifies an
increase of 1 – 7 days for all the RCPs
under 1959-1988 baseline (Figure 1.4b).
While under 1989-2018 baseline, the range
of 3 – 8 days is visible. Under the two
baselines, emission trajectories follow the
same pattern from lowest to highest. The
projected increase is statistically tested and
found no significant upward trend at the
0.05 significance level. Similarly, the KYB
projected number of CDD ranges between
4 – 10 days under the 1959-1988 baseline
but ranges between 3 – 11 days under the
1989-2018 baseline (figure 1.4c). The
trend analysis shows that there is no
significant upward trend at the 0.05
significance level for RCPs 2.6, 4.5 but
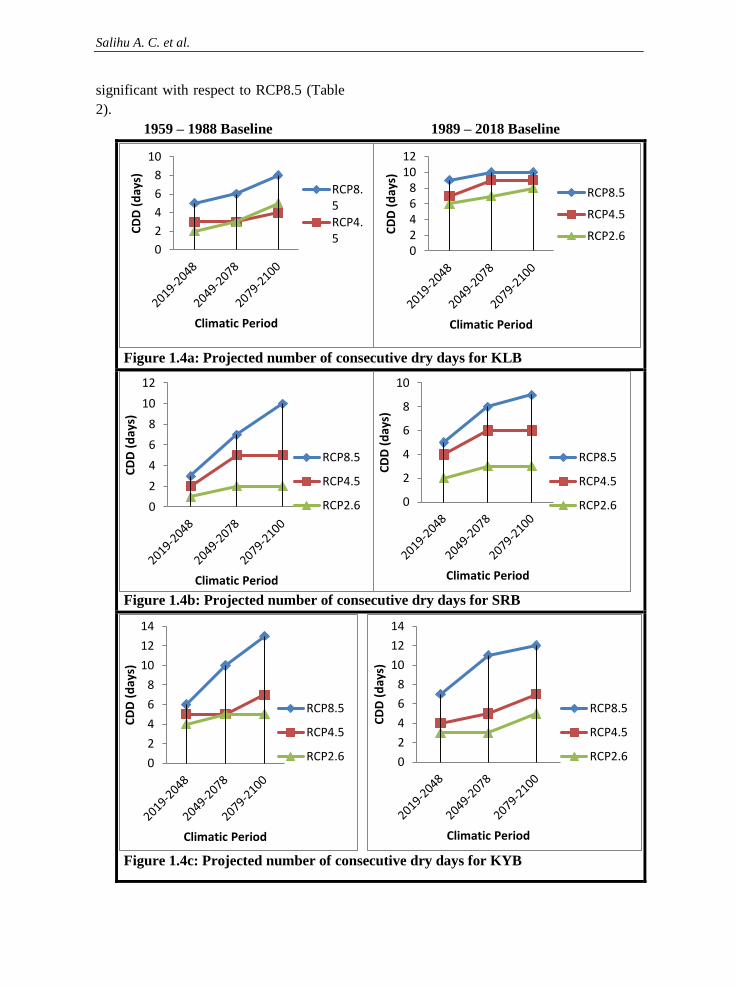
Salihu A. C. et al.
significant with respect to RCP8.5 (Table
2).
1959 – 1988 Baseline 1989 – 2018 Baseline
Figure 1.4a: Projected number of consecutive dry days for KLB
Figure 1.4b: Projected number of consecutive dry days for SRB
Figure 1.4c: Projected number of consecutive dry days for KYB
02468
1012
CD
D (
day
s)
Climatic Period
RCP8.5
RCP4.5
RCP2.60
2
4
6
8
10
CD
D (
day
s)
Climatic Period
RCP8.5
RCP4.5
0
2
4
6
8
10C
DD
(d
ays)
Climatic Period
RCP8.5
RCP4.5
RCP2.60
2
4
6
8
10
12
CD
D (
day
s)
Climatic Period
RCP8.5
RCP4.5
RCP2.6
0
2
4
6
8
10
12
14
CD
D (
day
s)
Climatic Period
RCP8.5
RCP4.5
RCP2.60
2
4
6
8
10
12
14
CD
D (
day
s)
Climatic Period
RCP8.5
RCP4.5
RCP2.6
PROJECTED EXTREME RAINFALL INDICES IN GUINEA AND SUDANO-SAHELIAN
ECOLOGICAL ZONES, NIGERIA
During the 2079-2100 period, the
estimated provision in KLB reflects a
consistent increase in CDD. That is to say,
it increases from the first projected period
of 2019-2048 all the way through 2049-
2078 toward the third projected period of
2079-2100. The range for the 2079-2100
period is between 3 – 8 days (Figure 1.4a).
Trend analysis of the 2079-2100 period in
KLB discloses that there are no significant
positive trends at the 0.05 significance
level for the RCP2.6 and RCP4.5 but
significant for the RCP8.5 (Table 2). A
similar pattern of positive trends is
noticeable for SRB and KYB. These trends
were found not to be significant under
lower CO2 emissions of 2.6 and 4.5 but
become significant with respect to the
RCP8.5. Regional trend analysis of CDD
over KLB, SRB and KYB as a whole
which constitutes the Guinea and Sudano-
Sahelian ecological zones of Nigeria
reveals that there are no significant
positive trends with respect to the three
projected periods and emission pathways
except the RCP8.5 that is significant at the
0.05 significance level for the long-term
projection period. This corroborates with
the work of Chan et al. (2016) that attested
significant increase in CDD for the 21st
century was inevitable in Hong Kong
under RCP8.5 but not with regard to lower
emission trajectories. Abdullah (2015)
discovered similar increasing trends of
CDD in Turkey. While Libanda and
Chilekana (2018) reported results from the
spatial analysis show that the greatest
increase in the number of consecutive dry
days is around Siavonga, Kasama and
Isoka, up to the border of Zambia and
Tanzania.
4 CONCLUSIONS
Based on the results generated from the
analysis of the extreme rainfall indices, it
can be deduced that there are significant
upward trends in the whole Guinea and
Sudano-Sahelian ecological zones as a
region for maximum 5-day rainfall time
series with respect to all the three RCPs.
Heavy rainfall days reveal that there are no
significant positive trends for RCP2.6 with
respect to the three projected periods under
consideration but significant positive trends
with respect to 2049-2078 for RCP4.5 as
well as RCP8.5 with respect to (2049-2078)
and (2079-2100) periods. Increase in CDD,
as well as a decrease in CWD, are both not
significant at the 0.05 confidence level
indicate that extreme rainfall in the region
will become more evenly distributed over
the coming periods. Therefore, it is expected
that this study will aid guidance to the
understanding of the ongoing changes as
well as possible changes in rainfall and
rainfall-related extremes in the study area,
which in turn will help in adopting necessary
adaptation measures to mitigate the negative
impacts of climate change in the Guinea and
Sudano-Sahelian ecological zones of
Nigeria. Therefore, these results are
important for future planning of water
resources management and agriculture been
the sectors that will be adversely affected in
Guinea and Sudano-Sahelian ecological
zones of Nigeria.
Salihu A. C. et al.
REFERENCES
Abbas, N., Wasimi, S.A. and Al-Ansari, N.,
2017. Impacts of Climate Change on Water
Resources of Greater Zab and Lesser Zab
Basins, Iraq, Using Soil and Water
Assessment Tool Model. International
Journal of Environmental, Chemical,
Ecological, Geological and Geophysical
Engineering, 11(10), pp.823-829.
AbdulKadir, A., Usman, M.T. and Shaba,
A.H., 2015. An integrated approach to
delineation of the eco-climatic zones in
Northern Nigeria. Journal of Ecology and
the Natural Environment, 7(9), pp.247-
255.
Abdussalam, A. F., 2015. Changes in indices
of daily temperature and precipitation
extremes in northwest Nigeria. Science
World Journal, 10 (2), pp.18-26.
Aduah, M.S., Jewitt, G.P. and Toucher,
M.L., 2017. Scenario-based impacts of land
use and climate changes on the hydrology of
a lowland rainforest catchment in Ghana,
West Africa. Hydrology and Earth System
Sciences Discussions, pp.1-27.
Agumagu, O. and Todd, M.,
2015.Modelling the climatic variability in
the Niger Delta Region: Influence of climate
change on hydrology. Journal of Earth
Science & Climatic Change, 6(6), p.1.
Al-Kalbani, M.S., Price, M.F., Abahussain,
A., Ahmed, M. and O'Higgins, T.,
2014.Vulnerability assessment of
environmental and climate change impacts
on water resources in Al Jabal Al Akhdar,
Sultanate of Oman. Water, 6(10), pp.3118-
3135.
Chan, H., Tong, H., Lee, S. (2016).
Extreme Rainfall Projection for Hong
Kong in the 21st Century using
CMIP5 Models. The 30th Guangdong-
Hong Kong-Macao Seminar on
Meteorological Science and Technology,
Guangzhou 20-22 April.
Coffel, E. D., Keith, B., Lesk, C., Horton,
R. M., Bower, E., Lee, J., & Mankin, J. S.
(2019). Future hot and dry years worsen
Nile Basin water scarcity despite projected
precipitation increases. Earth's Future, 7,
pp.967–977.
Cooper, R.T., 2019. Projection of future
precipitation extremes across the Bangkok
Metropolitan Region. Heliyon, 5(5),
p.e01678.
Deniz, B., Maisa, R., Juan, P. Boisier., and
Jonas, V. (2017). Climate Change Impacts
on Hydroclimatic Regimes and Extremes
over Andean Basins in Central Chile.
Journal of Hydrology and Earth System
Sciences Discussions, 2017, pp.1-29.
Escarcha, J.F., Lassa, J.A., Palacpac, E.P.
and Zander, K.K., 2018. Understanding
climate change impacts on water buffalo
production through farmers’
perceptions. Climate Risk Management, 20,
pp.50-63.
Fullarton, C., Draper, T.C., Phillips, N., de
Lacy Costello, B.P. and Adamatzky, A.,
2019. Belousov–Zhabotinsky reaction in
liquid marbles. Journal of Physics:
Materials, 2(1), p.015005.
Gebre, S. L., Tadele, K., and Mariam, B.
G. (2015).Potential Impacts of Climate
Change on the Hydrology and Water
PROJECTED EXTREME RAINFALL INDICES IN GUINEA AND SUDANO-SAHELIAN
ECOLOGICAL ZONES, NIGERIA
resources Availability of Didessa
Catchment, Blue Nile River Basin,
Ethiopia Journal of Geology and
Geosciences, pp.4: 193.
Herold, N., Ekstrom, M., Kala, J., Goldie,
J., Evans, J. P. (2018). Australian Climate
Extremes in the 21st Century According to
a Regional Climate Model Ensemble:
Implications for Health and Agriculture.
Weather and Climate Extremes, pp.54-68.
Intergovernmental Panel on Climate
Change (IPCC) (2014). Synthesis Report.
Contribution of Working Groups I, II and
III to the Fifth Assessment Report of the
Intergovernmental Panel on
Climate Change [Core Writing Team, R.K.
Pachauri and L.A. Meyer (Eds.)]. IPCC,
Geneva, Switzerland, p.151
Jia, P., Zhuang, D. and Wang, Y., 2017.
Impacts of temperature and precipitation on
the spatiotemporal distribution of water
resources in Chinese mega cities: the case of
Beijing. Journal of Water and Climate
Change, 8 (4), pp.593-612.
Kara, F., 2014. Effects of Climate Change on
Water Resources in Omerli Basin (Doctoral
dissertation, Ph.D.), Middle East Technical
University, Ankara).
Kitoh, A. and Endo, H., 2016. Changes in
precipitation extremes projected by a 20-
km mesh global atmospheric model.
Weather and Climate Extremes 11: pp.41–
52.
Klutse, N.A.B., Ajayi, V.O., Gbobaniyi,
E.O., Egbebiyi, T.S., Kouadio, K.,
Nkrumah, F., Quagraine, K.A., Olusegun,
C., Diasso, U., Abiodun, B.J. and Lawal,
K., 2018.Potential impact of 1.5 C and 2 C
global warming on consecutive dry and
wet days over West Africa. Environmental
Research Letters, 13(5), p.055013.
Lapidez, John Phillip. "Assessment of
Changes in the Water Resources Budget and
Hydrological Regime of the Pampanga
River Basin (Philippines) due to Climate
Change." United Nations Peace and
Progress 3 (2016): pp.15-31.
Leng, G., Huang, M., Voisin, N., Zhang,
X., Asrar, G.R. and Leung, L.R., 2016.
Emergence of new hydrologic regimes of
surface water resources in the
conterminous United States under future
warming. Environmental Research
Letters, 11 (11), p.114003.
Li, W., Jiang, Z., Xu, J. and Li, L., 2016.
Extreme precipitation indices over China
in CMIP5 models. Part II: probabilistic
projection. Journal Climate, 29 (24),
pp.8989-9004.
Marchane, A., Tramblay, Y., Hanich, L.,
Ruelland, D. and Jarlan, L., 2017. Climate
change impacts on surface water resources
in the Rheraya catchment (High Atlas,
Morocco). Hydrological sciences
journal, 62 (6), pp.979-995.
Ojoye, S., Sulyman, A.O. and Yahaya, T.I.,
2016. Climate change and adaptation
strategies to water resources in some parts of
Sudano-Sahellian zone of
Nigeria. Ethiopian Journal of
Environmental Studies and Management, 9
(3), pp.326-338.
Parish, E. S., Kodra, E., Steinhaeuser, K.
and Ganguly, A.R., 2012. Estimating
Salihu A. C. et al.
future global per capita water availability
based on changes in climate and
population. Computers & Geosciences, 42,
pp.79-86.
Pervez, M.S. and Henebry, G.M., 2015.
Assessing the impacts of climate and land
use and land cover change on the freshwater
availability in the Brahmaputra River
basin. Journal of Hydrology: Regional
Studies, 3, pp.285-311.
Rao, X., Lu, X. and Dong, W.,
2019.Evaluation and Projection of Extreme
Precipitation over Northern China in CMIP5
Models. Atmosphere, 10 (11), p.691.
Revadekar, J.V., Patwardhan, S.K. and
Rupa Kumar, K., 2011. Characteristic
features of precipitation extremes over
India in the warming scenarios. Advances
in Meteorology, 2011.
Riad, N. and Peter, D., 2017. The Impact of
Climate Change and Climate Variability on
The Agricultural Sector in Nickerie
District. Journal of Agriculture and
Environmental Sciences, 6(1), pp.51-65.
Samuels, R., Hochman, A., Baharad, A.,
Givati, A., Levi, Y., Yosef, Y., Saaroni, H.,
Ziv, B., Harpaz, T. and Alpert, P., 2018.
Evaluation and projection of extreme
precipitation indices in the Eastern
Mediterranean based on CMIP5 multi‐
model ensemble. International Journal of
Climatology, 38 (5), pp.2280-2297.
Santos, C.A.C.D. and Oliveira, V.G.D.,
2017. Trends in extreme climate indices
for Pará State, Brazil. Revista Brasileira de
Meteorologia, 32(1), pp.13-24.
Singh, R. and Kumar, R., 2015.
Vulnerability of water availability in India
due to climate change: A bottom‐up
probabilistic Budyko
analysis. Geophysical Research Letters, 42
(22), pp.9799-9807.
Sun, Q., Miao, C. and Duan, Q., 2016.
Extreme climate events and agricultural
climate indices in China: CMIP5 model
evaluation and projections. International
Journal of Climatology, 36(1), pp.43-61.
Todzo, S., Bichet, A. and Diedhiou, A.,
2020. Intensification of the hydrological
cycle expected in West Africa over the
21st century. Earth System Dynamics, 11
(1).
Umesh, A., and Pouyan, N. (2016). Impacts
of Climate Change on Water Resources in
Malawi.Journal of Hydrologic Engineering,
21 (11).
Yilmaz, A.G., 2015. The effects of climate
change on historical and future extreme
rainfall in Antalya, Turkey. Hydrological
Sciences Journal, 60 (12), pp.2148-2162.
Yunana, D. A., Shittu, A. A., Ayuba, S.,
Bassah, E. J. and Joshua, W. K., 2017.
Climate change and lake water resources in
Sub-Saharan Africa: case study of lake Chad
and lake Victoria. Nigerian Journal of
Technology, 36(2), pp.648-654.
Zobel, Z., Wang, J., Wuebbles, D. J. and
Kotamarthi, V.R., 2018. Analyses for
High‐Resolution Projections through the
End of the 21st Century for Precipitation
Extremes over the United States. Earth's
Future, 6 (10), pp.1471-1490.