projected changes in rainfall extremes in southeast asian...
TRANSCRIPT
Projected Changes in Rainfall Extremes in Southeast Asian Cities: Implications for Flood
Risk Assessment
Pradeep MandapakaInstitute of Catastrophe Risk Management
04 August 2017
Outline
Motivation: Flood risk assessment
Data characteristics and indices employed
Future projections of rainfall (and trends?)
Regional analysis
Future projections of discharge: A case study in Jakarta
Summary and final remarks
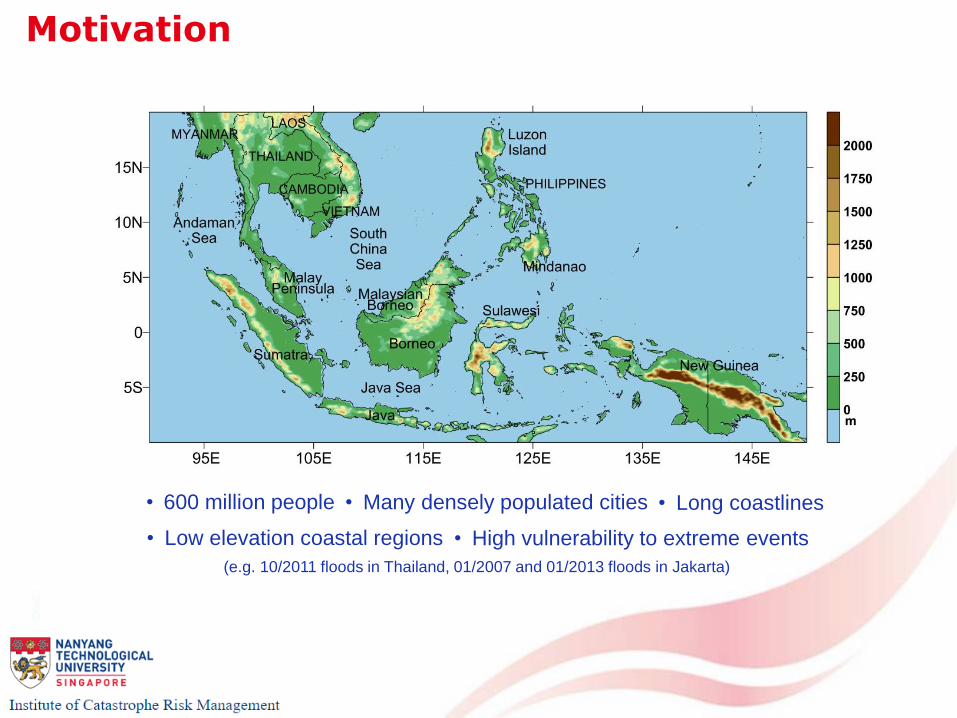
Motivation
• 600 million people • Many densely populated cities • Long coastlines
(e.g. 10/2011 floods in Thailand, 01/2007 and 01/2013 floods in Jakarta)
• High vulnerability to extreme events• Low elevation coastal regions
Current Knowledge and Gaps
Objectives: To assess future changes in rainfall structure in Southeast Asia using high-resolution climate model output
For different geographical subsets such as urban regions, wet/dry regions and low elevation coastal (LEC) regions
Changes in river flows and implications for flood risk
Warming climate
Intensification of hydrologic cycle
Changes in precipitation characteristics
Are changes in precipitation extremes more prominent than annual totals?
Regional heterogeneity in changes in precipitation characteristics?
Dry versus wet
Dry get drier and wet gets wetter?
Quantification of changes in hydrologic cycle in Southeast Asia high-resolution climate model output because of complex land-sea organization and long coastlines

Data
Topography
NOAA ETOPO1 Global Relief Model
Spatial resolution 1-min (~2 km)
Night-time light data
Spatial resolution 30-sec (~1 km)
Year 2010
Global climate model (GCM) projections
NASA Earth Exchange Global Daily Downscaled
Projections (NEX-GDDP)
20 GCMs (From CMIP5)
Spatial resolution 0.25°(~27 km)
Temporal resolution Daily
Historical 1951 – 2005
Future projections 2006 – 2099
(RCP 4.5 and RCP 8.5 scenarios)
All datasets regridded to a common spatial resolution of 0.25°
Representative Concentration Pathways
Description
RCP2.6 Low emission scenario; Rise and decline in radiative forcing levels; Ambitious greenhouse gas emission reductions required over time.
RCP4.5 Intermediate emission scenario; Stabilization without overshoot after 2100; A future with relatively ambitious emissions reductions.
RCP6.0 Intermediate emission scenario; Stabilization without overshoot after 2100; Application of a range of technologies and strategies for reducing greenhouse gas emissions.
RCP8.5 High emission scenario; Rising pathway; A future with no policy changes to reduce emissions.
Adapted from Moss et al (2010), Nature; van Vuuren et al (2011), Climatic Changeand https://www.sei-international.org/mediamanager/documents/A-guide-to-RCPs.pdf
RCPs: Set of greenhouse gas emissions, concentration and land use pathways
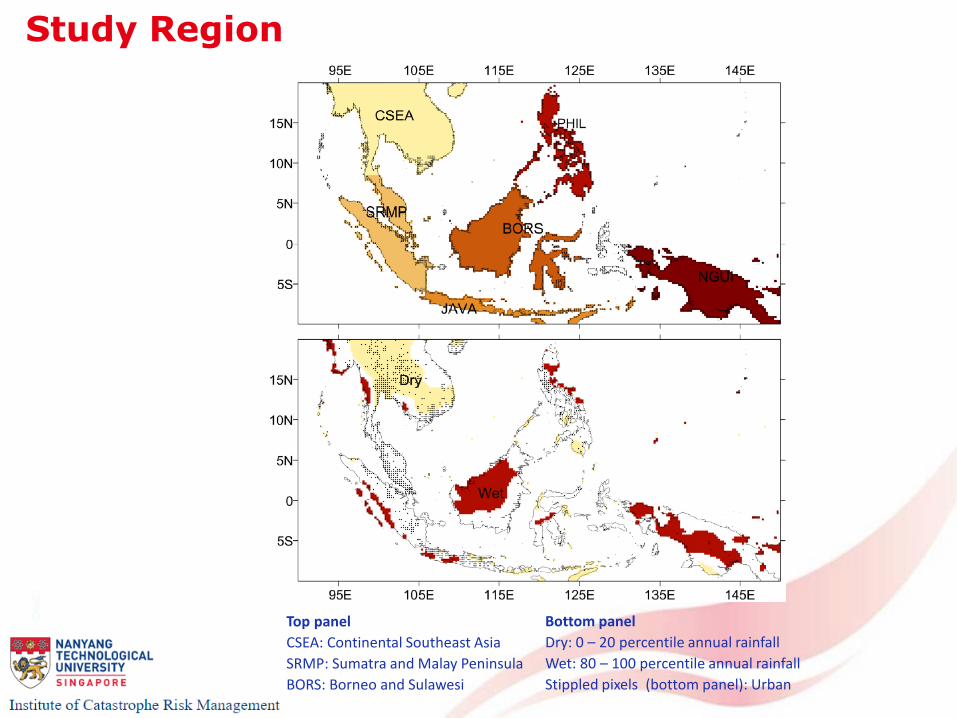
Study Region
Top panel
CSEA: Continental Southeast Asia
SRMP: Sumatra and Malay Peninsula
BORS: Borneo and Sulawesi
Bottom panel
Dry: 0 – 20 percentile annual rainfall
Wet: 80 – 100 percentile annual rainfall
Stippled pixels (bottom panel): Urban
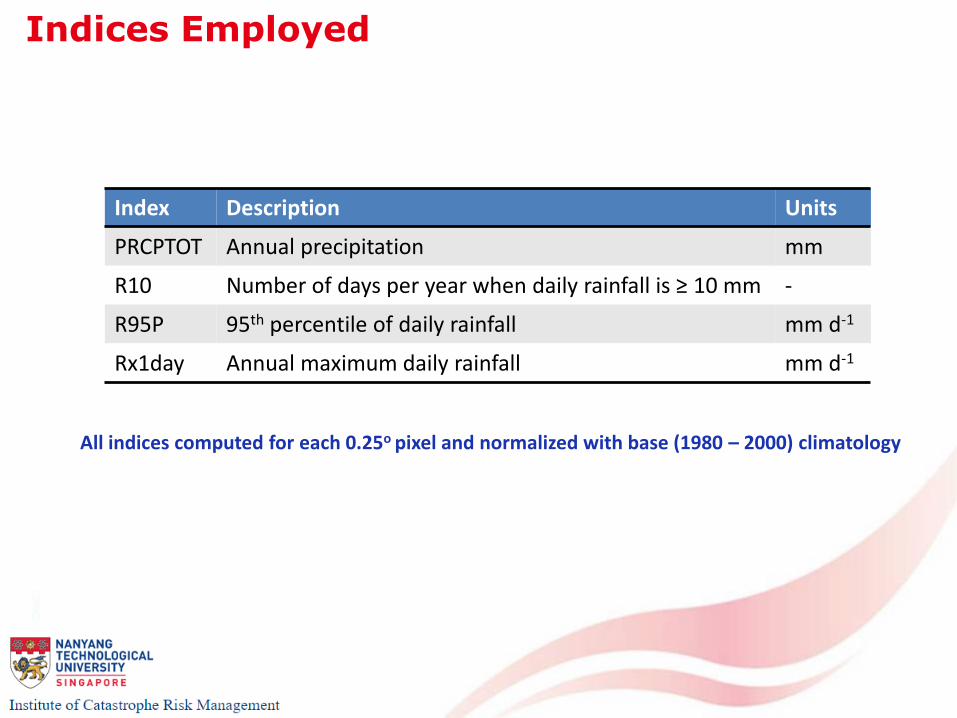
Indices Employed
Index Description Units
PRCPTOT Annual precipitation mm
R10 Number of days per year when daily rainfall is ≥ 10 mm -
R95P 95th percentile of daily rainfall mm d-1
Rx1day Annual maximum daily rainfall mm d-1
All indices computed for each 0.25o pixel and normalized with base (1980 – 2000) climatology
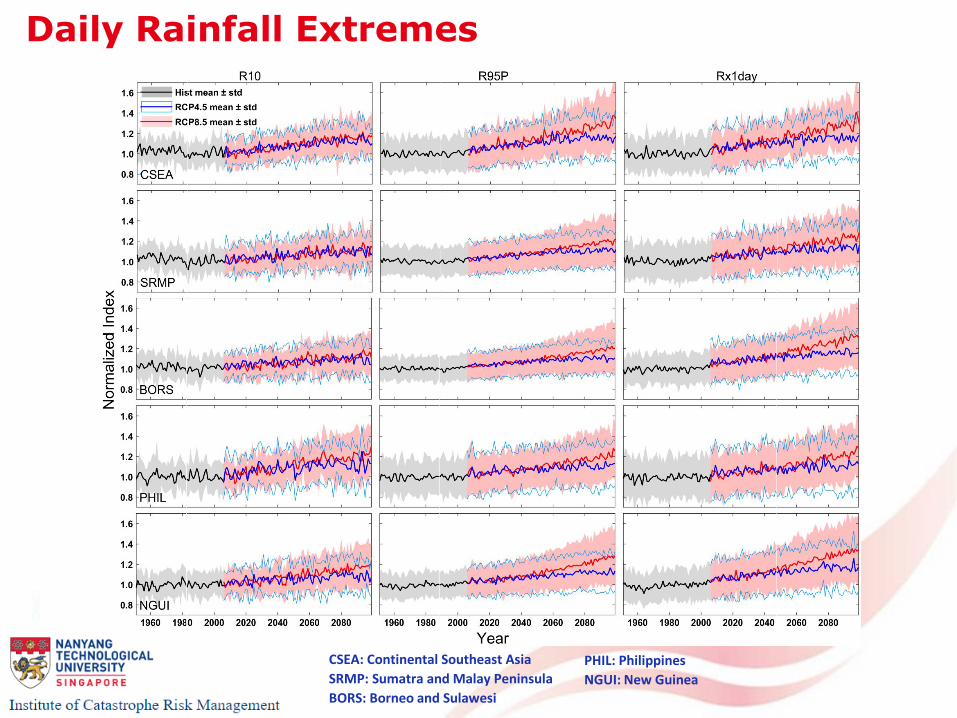
Daily Rainfall Extremes
CSEA: Continental Southeast Asia
SRMP: Sumatra and Malay Peninsula
BORS: Borneo and Sulawesi
PHIL: Philippines
NGUI: New Guinea
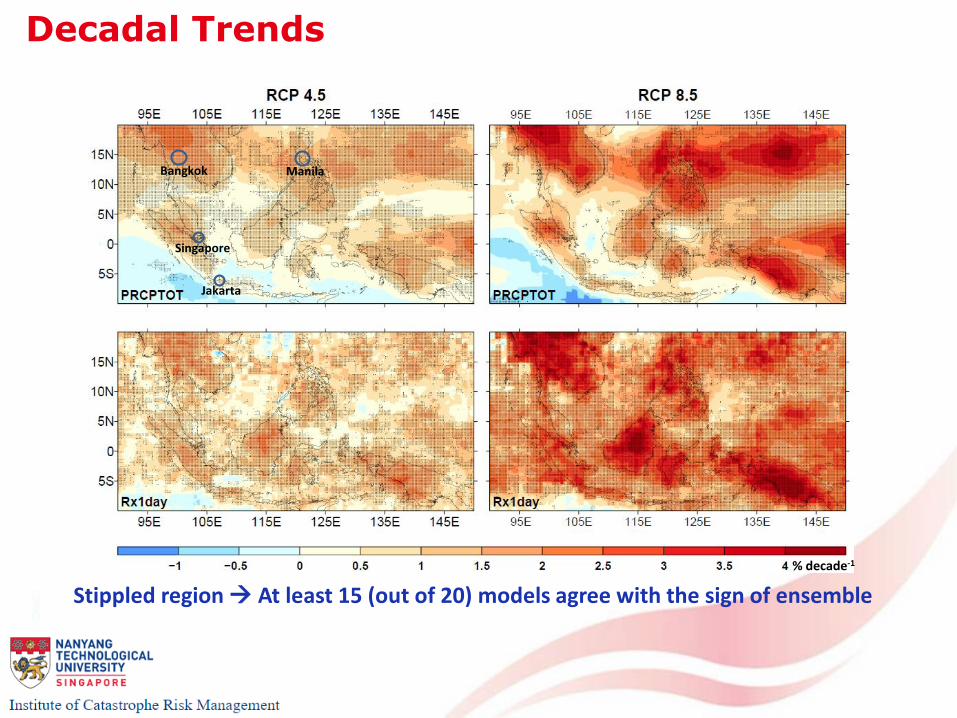
Decadal Trends
% decade-1
Stippled region At least 15 (out of 20) models agree with the sign of ensemble
Bangkok
Singapore
Jakarta
Manila
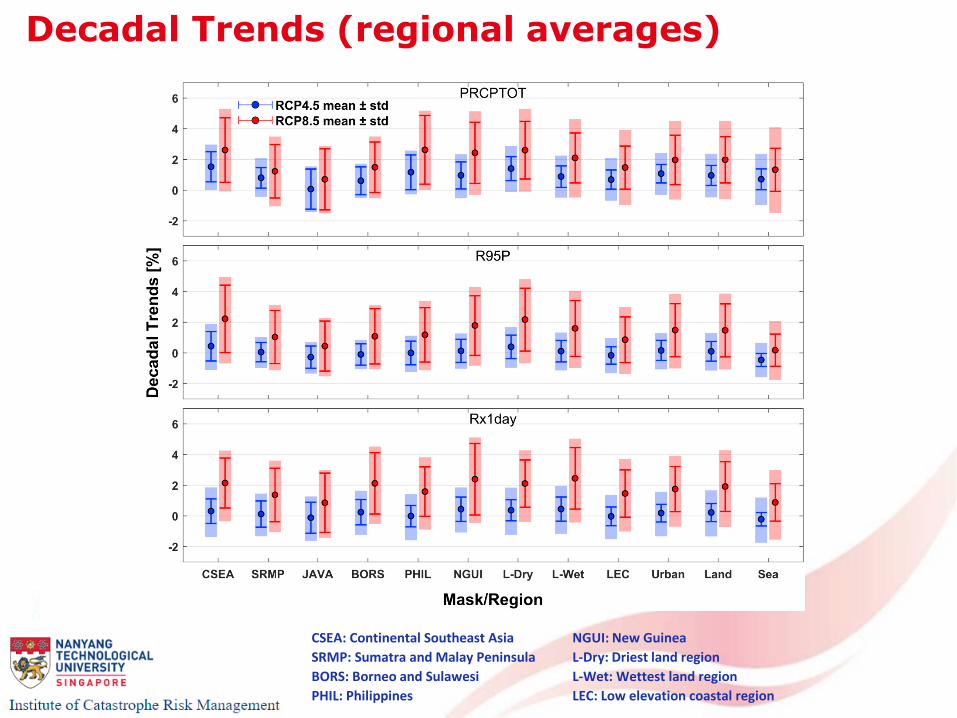
Decadal Trends (regional averages)
CSEA: Continental Southeast Asia
SRMP: Sumatra and Malay Peninsula
BORS: Borneo and Sulawesi
PHIL: Philippines
NGUI: New Guinea
L-Dry: Driest land region
L-Wet: Wettest land region
LEC: Low elevation coastal region
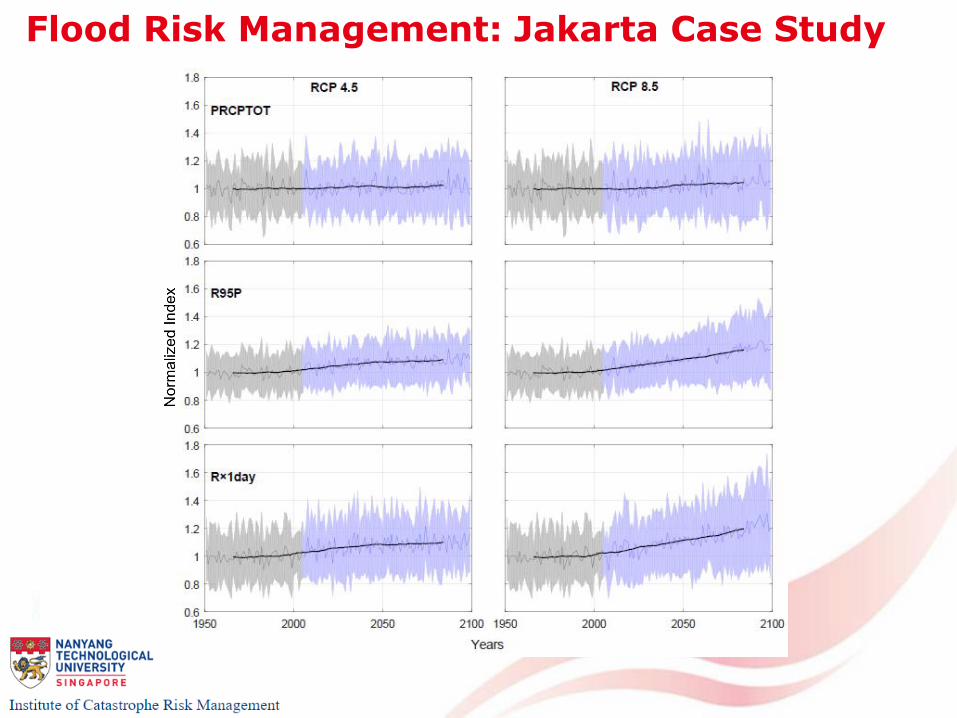
Flood Risk Management: Jakarta Case Study
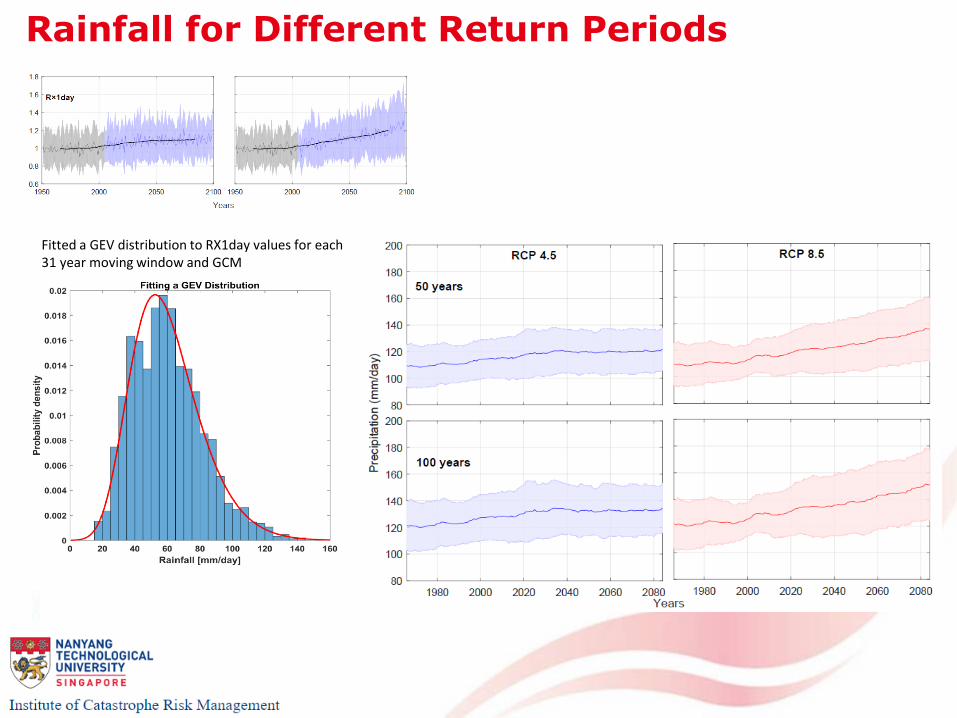
Rainfall for Different Return Periods
Fitted a GEV distribution to RX1day values for each 31 year moving window and GCM
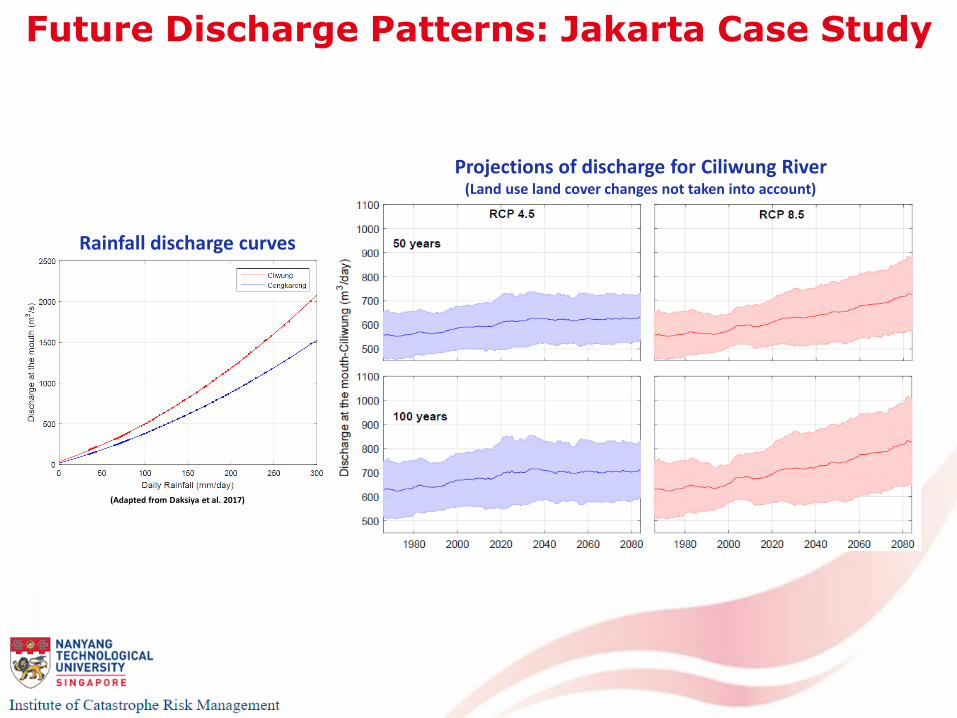
Future Discharge Patterns: Jakarta Case Study
(Adapted from Daksiya et al. 2017)
Rainfall discharge curves
Projections of discharge for Ciliwung River(Land use land cover changes not taken into account)
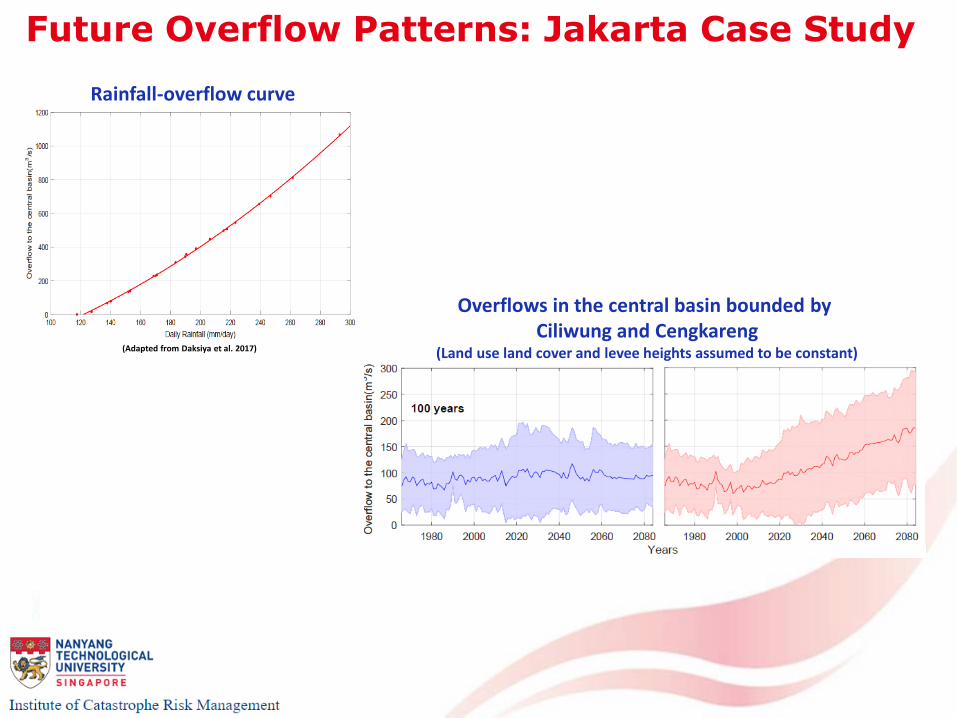
Future Overflow Patterns: Jakarta Case Study
Rainfall-overflow curve
(Adapted from Daksiya et al. 2017)
Overflows in the central basin bounded by Ciliwung and Cengkareng
(Land use land cover and levee heights assumed to be constant)
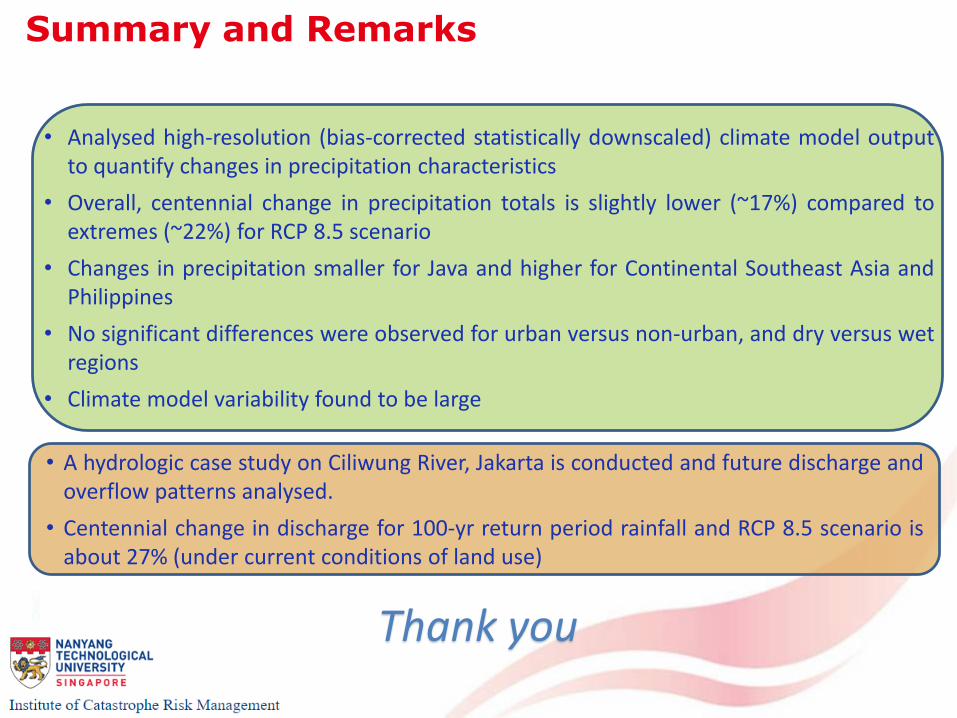
Summary and Remarks
• Analysed high-resolution (bias-corrected statistically downscaled) climate model outputto quantify changes in precipitation characteristics
• Overall, centennial change in precipitation totals is slightly lower (~17%) compared toextremes (~22%) for RCP 8.5 scenario
• Changes in precipitation smaller for Java and higher for Continental Southeast Asia andPhilippines
• No significant differences were observed for urban versus non-urban, and dry versus wetregions
• Climate model variability found to be large
• A hydrologic case study on Ciliwung River, Jakarta is conducted and future discharge andoverflow patterns analysed.
• Centennial change in discharge for 100-yr return period rainfall and RCP 8.5 scenario isabout 27% (under current conditions of land use)
Thank you