static and dynamic analysis of a bistable … · static and dynamic analysis of a bistable plate...
TRANSCRIPT

STATIC AND DYNAMIC ANALYSIS OF A BISTABLE PLATE FORAPPLICATION IN MORPHING STRUCTURES
A. Carrella1, F. Mattioni1, A.A. Diaz1, M.I. Friswell1, D.J. Wagg1 and P.M. Weaver1
1Department of Aerospace EngineeringUniversity of Bristol, Bristol BS8 1TR, UK
e-mail: A. [email protected]
Keywords: Morphing, bistable plate, Duffing
ABSTRACT
The need for better aircraft performance is increasingly prompting designers towards the reali-sation of morphing or shape-adaptable structural systems.One way to achieve this is to employmultistable composites elements. In this paper a square, curved bistable plate is studied. Thefinite element analysis provides the load-deflection characteristic of the bistable plate. A cu-bic expression is then fitted to this curve, and the equation of motion of the plate is reducedto a single-degree-of-freedom (SDOF) system which has the form of the Duffing equation fora double-well potential system. The dynamics of the plate are investigated using bifurcationdiagrams and shows that the qualitative behaviour given by the measured response is predictedwell by the simple SDOF model.
1. INTRODUCTION
Morphing or shape-adaptable structural systems are increasingly being considered as a solutionto the always present need for better aircraft performance.Such systems should simultaneouslyfulfil the contradictory requirements of flexibility and stiffness. So far the solutions adoptedconsist of complex assemblies of rigid bodies hinged to the main structure and actuated. Toenhance the performance of the aircraft as a system, multistable composites could provide aninteresting alternative to traditional designs, thanks totheir multiple equilibrium configurations.Unsymmetric laminates exhibit out-of-plane displacements at room temperature even if curedflat. These displacements are caused by residual stress fields induced during the cool-down pro-cess between the highest curing temperature (∼ 160C) and room temperature (∼ 20C). Thethermal stresses are mainly caused by the mismatch of the coefficients of thermal expansion ofconstituent layers [1–5]. The main feature of a bistable structure is the snap-through mecha-nism which marks the passage from one stable position to the other. It is clear that an analyticaldynamic analysis of the bistable plate would reveal very complicated behaviour. However,the analysis of an accurate Finite Element (FE) model would have a high computational cost.Therefore, in this paper it is proposed to model the dynamicsof the snap-through mechanism
E213

with a SDOF system, as suggested by the work of Mattioniet al.[6] and Arrietaet al. [7]. Thechange from one stable state to the other can be observed fromthe static force-displacementcharacteristic which can been readily obtained with a commercially available Finite Element(FE) package (in this case ABAQUS). The curve shown in Fig. 1 (dashed line) is obtained bypinning the four corners of the plate and applying a quasi-static load in the centre. It showsa displacement range in which the stiffness is negative, andwhere an oscillatory dynamic re-sponse is not possible. It is likely that the plate is able to exhibit a strongly nonlinear dynamicresponse with the potential for chaotic behaviour. Performing a numerical nonlinear analysis ofthe FE model with all its degrees of freedom would be computationally expensive.
In this paper the response of a square, curved bistable plateis analysed by focusing onlyon the snap-through mechanism. This study assumes the platecan be modelled with a SDOFmodel. This can be done if the motion of the plate is referred to the motion of the applica-tion point of the load and only one mode of deformation is considered. The restoring force isobtained numerically by FE analysis (shown as the dashed line in Fig. 1) and can be approx-imated by a cubic polynomial with a negative linear coefficient and a positive cubic term. Indoing so, the dynamics of the snap mechanism is modelled by a system with a double-wellpotential. This is mathematically expressed by the Duffing equation which has been extensivelystudied [8–10] and it is known to exhibit chaotic behaviour.By writing the equation of motionin non-dimensional form, the system dynamics with sinusoidal forcing are determined by twoparameters of the excitation force, namely the amplitude and the frequency, and one parameterof the system, namely the damping coefficient. As expected, the system behaves linearly forsmall amplitudes of excitation, but gives chaotic regions as the amplitude is increased. Finally,experimental results are shown, and a qualitative match between the SDOF model predictionsand the measurements is observed.
2. STATIC ANALYSIS
The dashed line in Fig. 1 represents the force-deflection curve of a square plate (30×30 cm)with 8-ply asymmetric laminate[04 − 904]T obtained with finite element analysis. It is possibleto approximate the numerical load-deflection characteristic with the analytical expression
fk(y) = −k1 y + k3 y3 (1)
where the coefficientsk1 andk3 can be determined by ensuring the function (1) is symmetricand, for example, the values of the maximum and minimum of theanalytical function are thesame as for the numerical curve. In the example shown the coefficients were estimated to bek1 ≈ 1.667 kN/m andk3 ≈ 1.2 MN/m3. The analytical curve, Eqn. (1) is plotted as solidline in Fig. 1. It should be noted that the slope of the curve between the peak and the troughis negative, which means that the stiffness is negative. A SDOF mechanical model that has asimilar restoring force is shown in Fig. 2. Moon and Carrellaet al. [10, 11] showed that therestoring force for this system is
f = 2ko(h0 − x)
√
h20 + a2
√
(h0 − x)2 + a2
− 1
(2)
which, by introducing the variabley = h0 − x and expanding in Taylor’s series abouty = 0,can be approximated by the cubic expression of Eqn. (1).
E213

−40 −20 0 20 40
−20
−10
0
10
20
displacement [mm]
forc
e [N
]
FEAAnalytical
Figure 1: Force-deflection characteristic of a bistable square plate obtained with finite elementanalysis (dashed) and the fitted analytical approximation (solid).
ko
h
a
ko
f
y
x
Figure 2. Single-degree-of-freedom mechanical model for the bistable plate.
3. DYNAMIC ANALYSIS
Having approximated the restoring force of the bistable plate with a cubic polynomial andintroduced a SDOF mechanical model of the snap mechanism, its dynamics can be describedby the nonlinear equation of motion
mm y + c y − k1 y + k3 y3 = F0 cos(ω t) (3)
wheremm is an ‘equivalent’ mass, that is a coefficient that expressesonly that part of the masswhich contributes to the mode considered,c is the viscous damping coefficient andk1 andk3
are the coefficients determined above. Eqn. (3) can be written in non-dimensional form as
y′′ + h y′− y + α y3 = A cos(Ω τ) (4)
where
E213

h = cmmωn
ω2
n = k1
mm
α = k3 d2
k1
A = F0
k1 dΩ = ω
ωn
τ = ωn t
y′′ = y
ω2n
dy′ = y
ωn dy = y/d
and where the ‘′’ denotes differentiation with respect to the non-dimensional timeτ andd is anopportune reference length of the system. In particular, ifthis length is chosen1 so that
d =
√
k1
k3
⇒ α = 1, (5)
then Eqn. (4) can be written as
y′′ + h y′− y + y3 = A cos(Ω τ) (6)
The Duffing equation, Eqn. (6), is often used to demonstrate nonlinear dynamics of systemswith a double-well potential and has been extensively studied [8, 10, 12–15]. It is well knownthat a system with a double well potential can exhibit chaotic behaviour, and here we wish topredict the onset and the boundaries of the chaotic region. Moon [10] illustrated different teststo ascertain the presence of a chaotic region, such as Poincare maps, spectral analysis, and thedetermination of Lyapunov coefficients. In this paper, the dynamic behaviour of the system ischaracterised with bifurcation diagrams. A bifurcation plot is obtained by changing one of thesystem parameters and keeping the others fixed. Because there are two main parameters, theforcing amplitudeA and the forcing frequencyΩ, both of these cases will be considered.
For all the numerical simulations presented, the damping coefficient is assumed to beh =0.3, which corresponds to a damping ratio of 15% and the initial conditions arey = ˆy = 0. Theequation of motion (6) is solved numerically at discrete times. For this study the time is variedbetween 0 and 300 times the periodT = 2 π/Ω with one output sample at every period, i.e.t = 0 : T : 300 T . To ensure that the initial transient has decayed, the first 100 time periods areignored. The bifurcation diagram shows the amplitude of theresponseY at each time sample,and is equivalent to a projection of the Poincare map of the system. After the transients havedecayed, a periodic system response at the forcing frequency (period-1) gives a single responsepoint on the bifurcation diagram. If the response period is twice that of the excitation (period-2)the bifurcation diagram has two points. A chaotic motion results in a large number of responsepoints.
3.1 Bifurcation diagram for the forcing amplitude
If the excitation frequency is kept constant, it is possibleto vary the amplitude of the forceto study its effect on the system’s dynamics. A bifurcation diagram for the forcing amplitudeparameter is shown in Fig. 3. Here, the forcing frequency isΩ = 1.2, whilst the forcingamplitudeA changes between 0.2 and 0.8 with a step of∆ A = 0.02. The value of the frequencyhas been chosen because in reference [8] the same case is considered and thus the simulationscan be verified. Fig. 3 shows that there is a forcing amplituderange,A = 0.27 − 0.73, withinwhich transient chaos alternates with periodic solutions,and this agrees with the discussionpresented in reference [8]. It can be concluded that, for a forcing frequency ofΩ = 1.2, period-1 solutions do not exist if0.27 < A < 0.73.
1Note that settingα = 1 is equivalent to setting the stable position as the reference length, i.e. the distance ofthe equilibrium position from the origin of the reference system.
E213

0.2 0.3 0.4 0.5 0.6 0.7 0.8−1.5
−1
−0.5
0
0.5
1
1.5
A
Y
.73.27
Figure 3: Bifurcation diagram of the response amplitudeY for the amplitude of excitation forceof the Duffing equation (6). The excitation frequency isΩ = 1.2
Fig. 4 shows the bifurcation diagram for a frequency of excitation significantly smaller thanthe linear resonance frequency,Ω = 0.3. Even for such a low frequency of excitation, chaoticregions exist if the forcing amplitude is high.
0.2 0.3 0.4 0.5 0.6 0.7 0.8−1
−0.5
0
0.5
1
1.5
2
A
Y
Figure 4: Bifurcation diagram of the response amplitudeY for the amplitude of excitation forceA of the Duffing equation (6). The excitation frequency isΩ = 0.3
E213

3.2 Bifurcation diagram for the excitation frequency
It can be argued that a more interesting bifurcation diagram, from a practical point of view, isone in which the forcing amplitude is kept constant whilst the frequency is varied. This is be-cause, during measurements, the input signal generally hasa fixed amplitude and the frequencyis changed. Fig. 5 shows the case withA = 0.1, where the frequency,Ω, changes from 0.5 to1.5 with a step of∆ Ω = 0.05. The figure shows that when the amplitude of the applied forceis small the system oscillates periodically at the excitation frequency within one potential well(this is denoted by the amplitude of the responseY ). Furthermore, the maximum amplitude oc-curs atΩ > 1 which denotes a hardening system. When the amplitude of excitation is increased
0.5 0.75 1 1.25 1.50.85
0.9
0.95
1
1.05
1.1
1.15
1.2
Ω
Y
Figure 5: Bifurcation diagram of the response amplitudeY for the excitation frequencyΩ ofthe Duffing equation (6). The amplitude of excitation isA = 0.1.
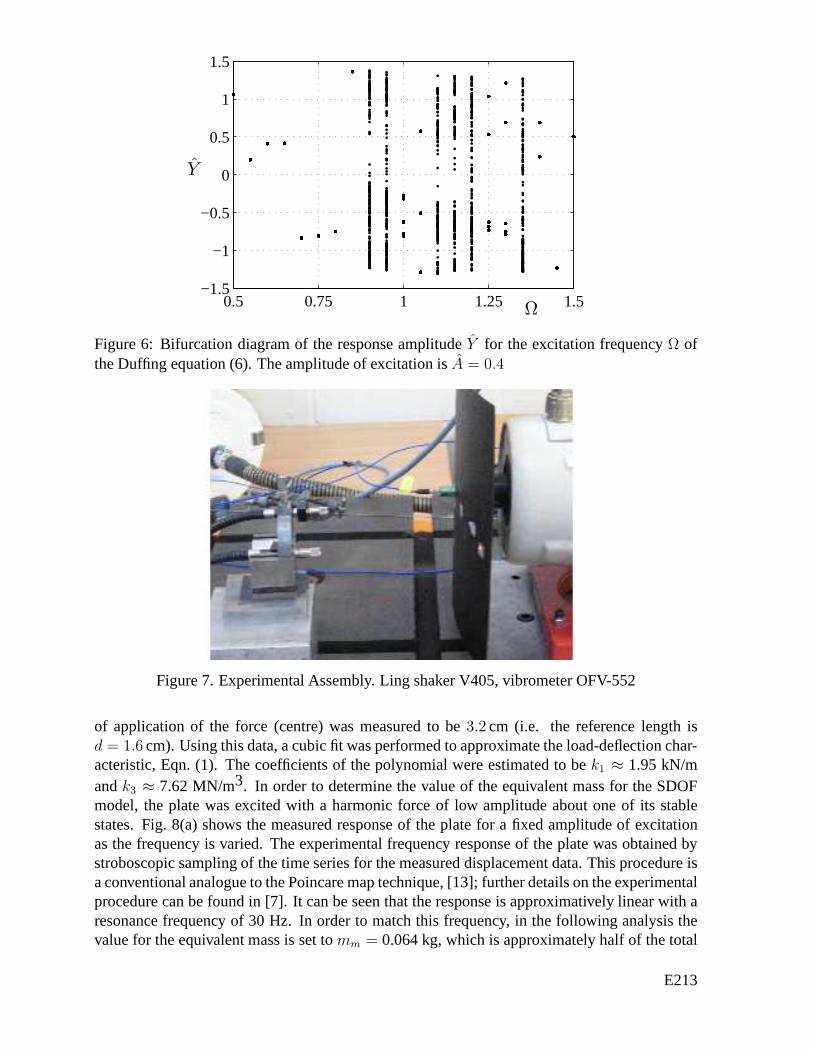
cross well motion is expected to occur. This can be observed in Fig. 6 forA = 0.4.
4. EXPERIMENTAL RESULTS
In this section, experimental results are presented. It is shown that the snap-mechanism of thebistable, curved plate is well described by the SDOF mechanical model.
A 300 by 300 mm carbon-fibre epoxy[04 − 904]T square bi-stable laminate (with a mass of0.128 kg) is used as the experimental specimen. As a result ofthe curing process, the laminateis curved as shown in Fig. 7. The structure was attached to a Ling shaker in order to induce vi-bration in the plate. A differential laser vibrometer measured the relative displacement betweenthe centre and a given point on the laminate. The experimental arrangement was mounted on asteel table with a large mass in order to ensure there is no interaction between the plate and itssurroundings, as shown in Fig. 7.
Note that the plate has the same geometry and material properties as the FE model discussedabove. However, the force at which the plate changed from onestable state to the other wasexperimentally determined to beFsnap ≈ 12 N. Furthermore, the displacement of the point
E213
0.5 0.75 1 1.25 1.5−1.5
−1
−0.5
0
0.5
1
1.5
Ω
Y
Figure 6: Bifurcation diagram of the response amplitudeY for the excitation frequencyΩ ofthe Duffing equation (6). The amplitude of excitation isA = 0.4
Figure 7. Experimental Assembly. Ling shaker V405, vibrometer OFV-552
of application of the force (centre) was measured to be3.2 cm (i.e. the reference length isd = 1.6 cm). Using this data, a cubic fit was performed to approximatethe load-deflection char-acteristic, Eqn. (1). The coefficients of the polynomial were estimated to bek1 ≈ 1.95 kN/mandk3 ≈ 7.62 MN/m3. In order to determine the value of the equivalent mass for the SDOFmodel, the plate was excited with a harmonic force of low amplitude about one of its stablestates. Fig. 8(a) shows the measured response of the plate for a fixed amplitude of excitationas the frequency is varied. The experimental frequency response of the plate was obtained bystroboscopic sampling of the time series for the measured displacement data. This procedure isa conventional analogue to the Poincare map technique, [13]; further details on the experimentalprocedure can be found in [7]. It can be seen that the responseis approximatively linear with aresonance frequency of 30 Hz. In order to match this frequency, in the following analysis thevalue for the equivalent mass is set tomm = 0.064 kg, which is approximately half of the total
E213

(a) F0 = 0.5 N - measured
10 15 20 25 30 35 40 45−0.2
−0.1
0
0.1
0.2
0.3
frequency [Hz]
displa
cem
ent
Y[m
m]
(b) F0 = 0.5 N - analytical model
Figure 8: (a) Measured response and (b) numerical simulation of the SDOF mechanical modelof the experimental plate for an amplitude of the excitationforce of 0.5 N.
mass of the plate. Note that, at this stage of major interest is the frequency, e.g. resonance onsetof chaos, rather than the amplitude. Thus, the damping ratio, which needs to be measured, istaken from the numerical examples illustrated earlier, i.e. ζ = 15%.
Fig. 8(b) shows the bifurcation diagram obtained by numerically solving the equation of
E213

motion given in the previous section when the amplitude of the excitation force was 0.5 N, i.e.the nondimensional amplitude wasA = 0.016, and initial conditions werey0 = 1 andy0 = 0.They-axis gives the displacement from the stable position, and thex-axis gives the frequencyof excitation.
(a) F0 = 6 N - measured
20 25 30 35−40
−30
−20
−10
0
10
frequency [Hz]
displa
cem
ent
X[m
m]
(b) F0 = 12 N - analytical model
Figure 9: (a) Measured response for an amplitude of the excitation force of 6 N; (b) numericalsimulation of the SDOF mechanical for an amplitude of the excitation force of 12 N.
Fig. 9(a) shows the experimental frequency response when the amplitude of the excitationforce is 6 N, and shows three different types of behaviour. Between 20-24 Hz the systembehaves linearly, since there is a single point at each frequency, and hence the response is
E213

periodic. In the frequency range 25-30 Hz, for each driving frequency the displacement of thereference point takes many different values, illustratinga chaotic behaviour. Finally, to the rightof the chaotic range the system response is nonlinear, showing a period-2 response. Fig. 9(b)shows the results of the numerical solution of the equation of motion when the amplitude ofthe excitation force is approximately equal to the value of the measured static snapping load,F0 = 12 N (i.e. A = 0.38)
5. CONCLUDING REMARKS
To enhance the performance of the aircraft as a system, multistable composites could provide aninteresting alternative to traditional designs, thanks totheir multiple equilibrium configurations.In this paper a square composite bistable plate has been considered. The plate can be designedand studied using a finite element model, although a refined model requires a large number ofthe degrees of freedom. Although a static analysis for this model can be readily performed, anonlinear dynamic analysis would prove computationally expensive. Therefore, a single degreeof freedom model of the plate has been proposed. The dynamicsof the plate has been reducedto Duffing’s equation with a double potential well. This equation has been extensively studiedand is known to exhibit chaotic behaviour under certain conditions. Experimental results haveconfirmed a region of chaos. Interestingly, the simple SDOF model has predicted, at leastqualitatively, the dynamic response of the plate tested. Future work will focus on the design andmanufacturing of a bistable plate, together with the test rig, to enable a quantitative validationof the proposed mathematical model.
REFERENCES
[1] M. L. Dano and M. W. Hyer. Thermally-induced deformationbehavior of unsymmetriclaminates.Int. J. Solids Struct., 35:2101–2120, 1998.
[2] M. L. Dano M.W. Hyer. Snap-through of unsymmetric fiber-reinforced composite lami-nates.J. Composite Materials, 39:175–198, 2002.
[3] K. Iqbal and S. Pellegrino. Bi-stable composite shells. In 41stAIAA/ASME/ASCE/AHS/ASC Structures, Structural Dynamics, and Material Con-ference and Exhibit, Atlanta, GA, 3-6 April 2000.
[4] L. Kroll W. Hufenbach, M. Gude. Design of multistable composites for application inadaptive structures.Composites Structures, 55:319–327, 2002.
[5] C. S. Hong W. J. Jun. Effect of residual shear strain on thecured shape of unsymmetriccross-ply thin laminates.Composites Science and Technology, pages 55–67, 1990.
[6] F. Mattioni, P.M. Weaver, K. Potter, and M.I. Friswell. The analysis of cool-down andsnap-through of cross-ply laminates used as multistable structures. InABAQUS UK groupconference, 2006.
[7] A.F. Arrieta, F. Mattioni, S.A. Neild, P.M. Weaver, D.J.Wagg, and K. Potter. Nonlineardynamics of a bi-stable composite laminate plate with applications to adaptive structures.In 2nd European Conference for Aero-Space Sciences, 2007.
E213

[8] D.W. Jordan and P. Smith.Nonlinear Ordinary Differential Equations. Oxford UniversityPress, 1999.
[9] A.H. Nayfeh. Introduction to Perturbation Techniques. John Wiley & Sons, 1981.
[10] F.C. Moon. Chaotic Vibrations - An Introduction for Applied Scientists and Engineers.John Wiley & Sons, 1987.
[11] A. Carrella, M.J. Brennan, and T.P. Waters. Static analysis of a passive vibration isolatorwith quasi-zero-stiffness characteristic.Journal of Sound and Vibration, 307:678–689,2007.
[12] A.H. Nayfeh.Nonlinear Interactions, Analytical, Computational, and Experimental Meth-ods. John Wiley & Sons, 2000.
[13] L.N. Virgin. Introduction to Experimental Nonlinear Dynamics. Cambridge UniversityPress, 2000.
[14] Ueada Y. Stewart H.B. Catastrophes with indeterminateoutcome.Proc. R. Soc. LondonA, 432:113–123, 1991.
[15] W. Szwmplinska-Stupnicka and E. Tyrkiel. Common faeatures of the onset of the persis-tent chaos in nonlinear oscillators: A phenomenological approach.Nonlinear Dynamics,27:271–293, 2002.
E213