a bistable mechanism mediated by integrins controls
TRANSCRIPT
HAL Id: hal-02484711https://hal.archives-ouvertes.fr/hal-02484711
Submitted on 19 Feb 2020
HAL is a multi-disciplinary open accessarchive for the deposit and dissemination of sci-entific research documents, whether they are pub-lished or not. The documents may come fromteaching and research institutions in France orabroad, or from public or private research centers.
L’archive ouverte pluridisciplinaire HAL, estdestinée au dépôt et à la diffusion de documentsscientifiques de niveau recherche, publiés ou non,émanant des établissements d’enseignement et derecherche français ou étrangers, des laboratoirespublics ou privés.
A Bistable Mechanism Mediated by Integrins ControlsMechanotaxis of Leukocytes
Alexander Hornung, Thomas Sbarrato, Nicolas Garcia-Seyda, Laurene Aoun,Xuan Luo, Martine Biarnes-Pelicot, Olivier Theodoly, Marie-Pierre Valignat
To cite this version:Alexander Hornung, Thomas Sbarrato, Nicolas Garcia-Seyda, Laurene Aoun, Xuan Luo, et al.. ABistable Mechanism Mediated by Integrins Controls Mechanotaxis of Leukocytes. Biophysical Journal,Biophysical Society, 2020, 118 (3), pp.565-577. �10.1016/j.bpj.2019.12.013�. �hal-02484711�
1
A Bistable Mechanism Mediated by Integrins Controls Mechanotaxis of
Leukocytes
Alexander Hornung1,§, Thomas Sbarrato1,§, Nicolas Garcia-Seyda1,§, Laurene Aoun1, Xuan Luo1, Martine
Biarnes-Pelicot1, Olivier Theodoly1*, Marie-Pierre Valignat1*
1 LAI, Aix Marseille Univ, CNRS, INSERM, Marseille, France.
§ Equal contributions.
*Corresponding authors: [email protected] or [email protected]
ABSTRACT
Recruitment of leukocytes from blood vessels to inflamed zones is guided by biochemical and
mechanical stimuli, with mechanisms only partially deciphered. Here, we studied the guidance by flow
of primary human effector T lymphocytes crawling on substrates coated with ligands of integrins LFA-
1 (L2) and VLA-4 (41). We reveal that cells segregate in two populations of opposite orientation for
combined adhesion, and show that decisions of orientation rely on a bistable mechanism between
LFA-1-mediated upstream and VLA-4-mediated downstream phenotypes. At the molecular level,
bistability results from a differential front-rear polarization of both integrins affinity, combined with
an inhibiting crosstalk of LFA-1 towards VLA-4. At the cellular level, direction is determined by the
passive, flow-mediated orientation of the non-adherent cell parts, the rear uropod for upstream
migration and the front lamellipod for downstream migration. This chain of logical events provides a
comprehensive mechanism of guiding, from stimuli to cell orientation.
STATEMENT OF SIGNIFICANCE
Cell guidance is crucial to many biological functions, but the precise mechanisms remain unclear. We
have analyzed here an original phenotype of flow-guided cells mimicking leukocytes crawling onto
blood vessels, and show that the controlling parameter of cells decision to migrate upstream or
downstream is the relative number of two specific adhesion molecules, the integrins LFA-1 and VLA-4.
The spatial polarization of these integrins affinity plus a feedback loop between them creates a bistable
system, where cells adhere either by their front or their tail to orient upstream or downstream,
respectively. This mechanism proposes a complete chain of events from stimuli to cell orientation
which differs strongly from the chemotaxis paradigm, because the external stimuli triggers no
signaling.
2
INTRODUCTION
Cell guiding is involved in numerous essential functions of living organisms, however its mechanisms
remain partially understood. Chemical guiding, or chemotaxis, has long been studied and many
mechanistic elements have been identified(1, 2). In contrast, mechanical guiding, or mechanotaxis, has
been acknowledged more recently, and although physiological roles have been identified in
cell/organism swimming(3, 4), differentiation(5), morphogenesis(6, 7), or leukocyte activation(8), its
basic functioning remains largely open. The regulation of immune cells trafficking between lymphoid
organs, blood system, and inflamed or infected zones involves robust guiding mechanisms by chemical
signals(9–11) and also mechanical signals like hydrodynamic shear stress(12–22). The detection of
external force by leukocytes can rely on integrins adhesion proteins(23), which undergo
conformational changes by inside-out (24, 25) and outside-in(26, 27) signaling, and can transduce
intracellular signaling when submitted to force. Integrins, which are known to be key players in the
recruitment of leukocytes from blood flow (20, 28–30), are also good candidates to play a role in
leukocytes mechanotaxis under flow.
Both in vivo and in vitro experiments have reported guiding by flow of leukocytes crawling on the
internal walls of blood vessels. In vivo, on a rat model suffering from autoimmune encephalomyelitis,
effector T cells crawl preferentially upstream on the luminal surface of leptomeningeal vessels
presenting ICAM-1 and VCAM-1(12), ligands of LFA-1 and VLA-4 integrins respectively. In vitro on
surfaces coated with monolayers of endothelial cells, mouse T cells (13) and human hematopoietic
stem and progenitor cells (31) were also crawling upstream in an ICAM-1 required manner. On
substrates coated with cell adhesion molecules (CAMs), upstream crawling was reported for human
effector T lymphocytes (14–16, 32), human hematopoietic stem and progenitor cells (31) on ICAM-1,
and for mouse T-cells on ICAM-1 and ICAM-2 (21), whereas downstream crawling was reported for
neutrophils and metastatic lymphocytes on ICAM-1(13, 14, 21) and for effector T lymphocytes on
VCAM-1 (16, 33). This variety of mechanotaxis responses versus the types of leucocytes and of
integrins suggests the existence of sophisticated mechanosensing mechanisms controlled by integrins.
Two types of orientation mechanisms by flow have been proposed for leukocyte adhering with
integrins. The first consists of an “active” mechanism inspired from the chemotaxis machinery. Cue
detection (shear stress direction) can involve outside-in signaling at anchoring sites mediated by
integrins functioning as molecular force transducers (34–37). Evidences of integrin-based signaling
during migration under flow have been reported for endothelial cells (37, 38) and neutrophils (23).
Such mechanisms are “active” in the sense that cells develop a specific intracellular signaling activity
3
in response to flow and rely therefore on mechanotransduction. Alternatively, a “passive” model was
established for upstream crawling T lymphocytes(15). In this model, flow direction is detected by the
passive orientation of cell tail (or uropod), which is not adherent and rotates in the flow like a wind
vane in a breeze. Reorientation of the whole cell against the flow follows tail orientation via the re-
alignment of the cell’s front by the on-going mechanism of front-rear polarization. This mechanism is
“passive” in the sense that it requires no signaling triggered by the external cue and therefore no
mechanotransduction. Whether the active and passive mechanisms are specific to certain cell types,
or whether they are alternatively triggered by different microenvironments remains unclear.
A fundamental question in leukocyte mechanotaxis concerns therefore the mechanistic role of
integrins in terms of adhesion mediators and/or mechanotransducers. The fact that the mechanotaxis
phenotype of T cells changes from upstream to downstream when the substrates are coated by ligands
of integrins LFA-1 or VLA-4 (16, 21, 32, 33) raises fundamental questions such as what decides
upstream versus downstream guiding of leukocytes, or how different integrins control different
orientations. In this paper, we analyzed T lymphocyte migration on substrates with quantified mixtures
of ICAM-1 and VCAM-1 molecules. We show that a bistable mechanism triggers upstream or
downstream mechanotaxis phenotypes, and that bistability relies on a combination of molecular and
cellular mechanisms. At the molecular level, a crosstalk between integrins LFA-1 and VLA-4 and the
contrary polarization of LFA-1 and VLA-4 affinity sustain a differential adhesion of cells either by their
leading or trailing edge. At the cellular level, this polarized adhesion passively triggers the upstream
phenotype by a mechanism of wind vane uropod or the downstream phenotype by a mechanism of
lamellipod flow focusing. This bistable model presents a complete functioning of mechanotaxis
controlled by integrins, in which the mechanistic elements are identified from molecular to cellular
level and the logical chain of event is continuous from stimulus to cell orientation outcome.
4
RESULTS
Flow fosters a variety of migration phenotypes on mixtures of ICAM-1 and VCAM-1
To examine the respective role of LFA-1 and VLA-4 on the orientation of T lymphocytes crawling under
flow, the concentrations of ICAM-1 and VCAM-1 on substrates were tightly controlled and quantified.
Coatings were prepared by adsorption of Fc-ICAM-1 and Fc-VCAM-1 molecules in a channel pre-coated
with protein-A. The common Fc fragment (ligand of protein A) promoted a similar binding affinity of
ICAM-1 and VCAM-1 with the substrate, and the ratio of ICAM-1/VCAM-1 on the substrates was tuned
by adjusting the concentrations in the adsorbing solution. The absolute amount of each ligand on
surfaces was further quantified by fluorescence (Fig. S1 in the Supporting Material). On these
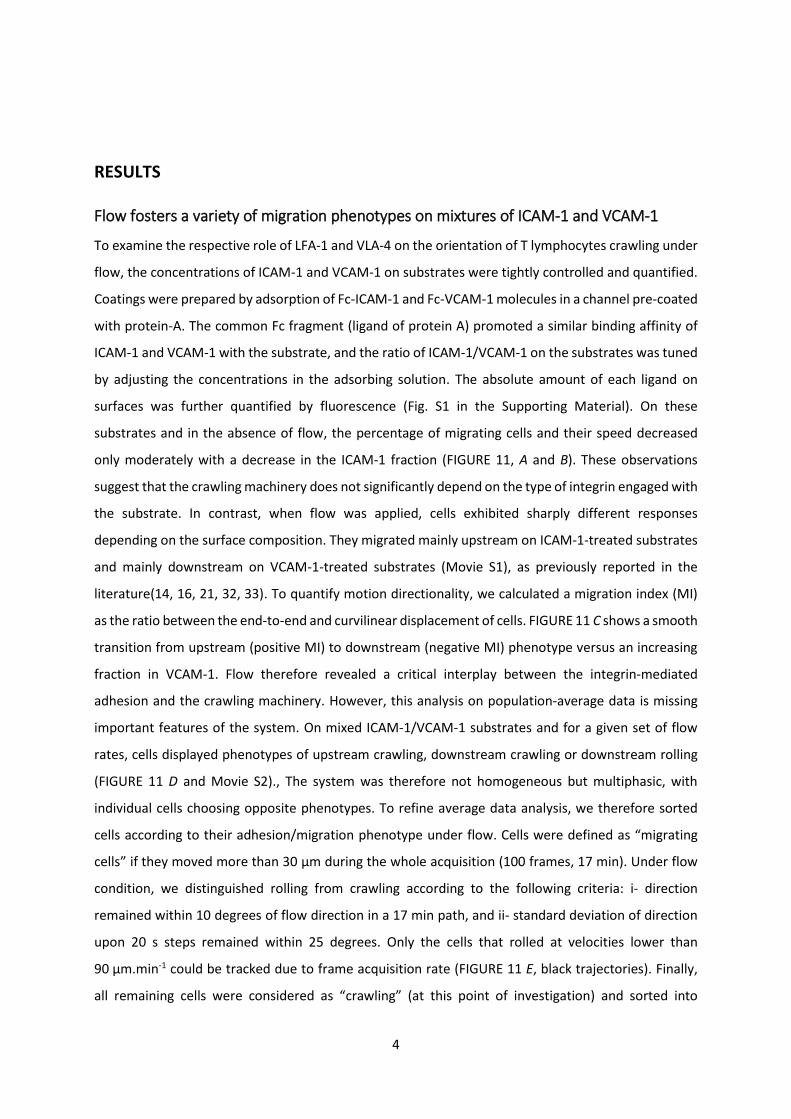
substrates and in the absence of flow, the percentage of migrating cells and their speed decreased
only moderately with a decrease in the ICAM-1 fraction (FIGURE 11, A and B). These observations
suggest that the crawling machinery does not significantly depend on the type of integrin engaged with
the substrate. In contrast, when flow was applied, cells exhibited sharply different responses
depending on the surface composition. They migrated mainly upstream on ICAM-1-treated substrates
and mainly downstream on VCAM-1-treated substrates (Movie S1), as previously reported in the
literature(14, 16, 21, 32, 33). To quantify motion directionality, we calculated a migration index (MI)
as the ratio between the end-to-end and curvilinear displacement of cells. FIGURE 11 C shows a smooth
transition from upstream (positive MI) to downstream (negative MI) phenotype versus an increasing
fraction in VCAM-1. Flow therefore revealed a critical interplay between the integrin-mediated
adhesion and the crawling machinery. However, this analysis on population-average data is missing
important features of the system. On mixed ICAM-1/VCAM-1 substrates and for a given set of flow
rates, cells displayed phenotypes of upstream crawling, downstream crawling or downstream rolling
(FIGURE 11 D and Movie S2)., The system was therefore not homogeneous but multiphasic, with
individual cells choosing opposite phenotypes. To refine average data analysis, we therefore sorted
cells according to their adhesion/migration phenotype under flow. Cells were defined as “migrating
cells” if they moved more than 30 µm during the whole acquisition (100 frames, 17 min). Under flow
condition, we distinguished rolling from crawling according to the following criteria: i- direction
remained within 10 degrees of flow direction in a 17 min path, and ii- standard deviation of direction
upon 20 s steps remained within 25 degrees. Only the cells that rolled at velocities lower than
90 µm.min-1 could be tracked due to frame acquisition rate (FIGURE 11 E, black trajectories). Finally,
all remaining cells were considered as “crawling” (at this point of investigation) and sorted into
5
upstream (FIGURE 11 E, blue trajectories) or downstream crawling (FIGURE 11 E, red trajectories). This
description shows that the transition on mixed substrates from upstream to downstream crawling
phenotypes is biphasic.
6
FIGURE 1: Flow reveals different migration modes on mixed ICAM-1/VCAM-1 substrates. (A) Percentage of migrating cells and (B) Speed versus substrates composition in shear free conditions. XI / YV stands for X % ICAM-1 / Y % VCAM-1. (C) Direction of T-lymphocytes under shear flow expressed as the migration index (positive values indicating motion upstream and negative values indicating motion downstream) versus substrates composition at shear stresses of 4 dyn.cm-2. The migration index was calculated for all cells as the ratio between the end-to-end displacement and the cumulative curvilinear traveled distance. All data are mean + s.e.m, n = 6 independent experiments with at least 500 cells in each experiment, *P < 0.05, **P < 0.001, ***P < 0.001 with respect to substrate composition, 100 % ICAM-1 / 0 % VCAM-1, one way ANOVA with post hoc Dunnett’s test. (D) Bright-field images sequence of cells crawling on pure ICAM-1, pure VCAM-1 and mixed ICAM-1/VCAM-1 substrates. Scale bar 10 µm, time laps 40 s. (E) Trajectories of mobile cells on pure ICAM-1, pure VCAM-1 and mixed ICAM-1/VCAM-1 substrates, with a color code for cells crawling upstream (blue), crawling downstream (red) and rolling (black). Time span 17 min, scale bar 100 µm.
ICAM-1 imposes strong adhesion and crawling whereas VCAM-1 allows transient
adhesion and rolling
To better understand the coupling between integrins and flow mechanotaxis, we further characterized
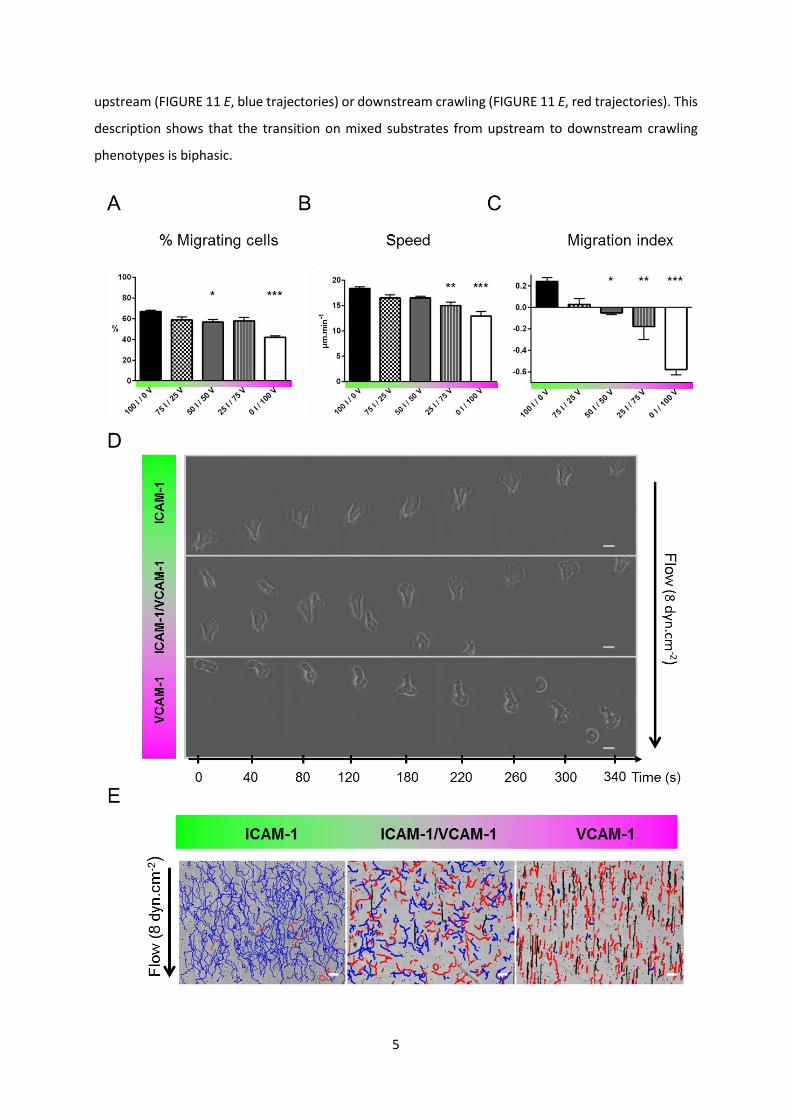
adhesion properties. Focusing on the case of mobile and polarized cells, we saw stronger adhesion on
ICAM-1-rich than on VCAM-1-rich substrates (FIGURE 22 A). This difference was consistent with a larger
expression of LFA-1 than VLA-4 revealed by quantitative flow cytometry (Fig. S2). However, other
parameters are also determinant for adhesion control such as affinity, avidity or clustering properties
of integrins. Interestingly, mobile cells only crawled and never rolled on ICAM-1 (FIGURE 22 B), in line
with a robust adhesion mediated by ICAM-1/LFA-1. In contrast, the fraction of rolling cells increased
with the fraction of VCAM-1, up to a maximum of 25% on pure VCAM-1 substrates, revealing weaker
and potentially transient adhesion. Altogether, these results on adhesion strength of immobile and
7
motile cells support that ICAM-1 promotes strong adhesion and a high propensity for crawling,
whereas VCAM-1 promotes transient adhesion and a coexistence of rolling and crawling cells.
FIGURE 2: ICAM-1 imposes strong adhesion and upstream crawling whereas VCAM-1 allows transient adhesion and downstream crawling/rolling. (A) Adhesion strength of mobile cells, measured as the percentage of cells resistant to a shear stress of 4 dyn.cm-2 with respect to the initial number of mobile cells on the substrate. XI / YV stands for X % ICAM-1 / Y % VCAM-1 (B) Percentages of cells crawling upstream and rolling downstream with respect to the total number of cells migrating on the surface, under a shear stress of 4 dyn.cm-2 and for different substrate composition. (C) Rose plots of cells directions at different substrate composition. (D) Percentage of upstream (blue) and downstream (red) crawling cells, determined here by cumulating data in the blue and red quadrant of the rose plots of cell migration for respectively upstream and downstream crawling cells. All data are mean + s.e.m, n = 6 independent experiments with at least 500 cells in each experiment, *P < 0.05, **P < 0.001, ***P < 0.001 with respect to substrate composition, 100 % ICAM-1 / 0 % VCAM-1, one way ANOVA with post hoc Dunnett’s test.
ICAM-1 promotes upstream crawling while VCAM-1 allows downstream crawling
To further characterize the guiding of crawling cells versus the integrin-ligand pair involved, we then
quantified the population of cells with downstream or upstream phenotype by taking into account
8
trajectories making an angle 45 respectively with and against the flow direction (FIGURE 22, C and
D). Upstream phenotype was maximum on pure ICAM-1 substrates (50 % of crawling cells at 4 dyn.cm-
2, 1 dyn.cm-2 = 0.1 Pa in SI units) and absent on VCAM-1 substrates, which suggests that upstream
phenotype is associated to ICAM-1-mediated cell adhesion. In contrast, the fraction of cells with
downstream phenotype increased with the fraction of VCAM-1 on the substrates up to 100 % on pure
VCAM-1 substrates, which suggests that VCAM-1 mediates downstream phenotype or inhibits
upstream phenotype. While these general trends are robust, they do not explain the biphasic behavior
on mixed substrates. A finer characterization of the properties of upstream and downstream
phenotypes at the single cell level was therefore necessary to shed light on opposite behaviors in a
given population.
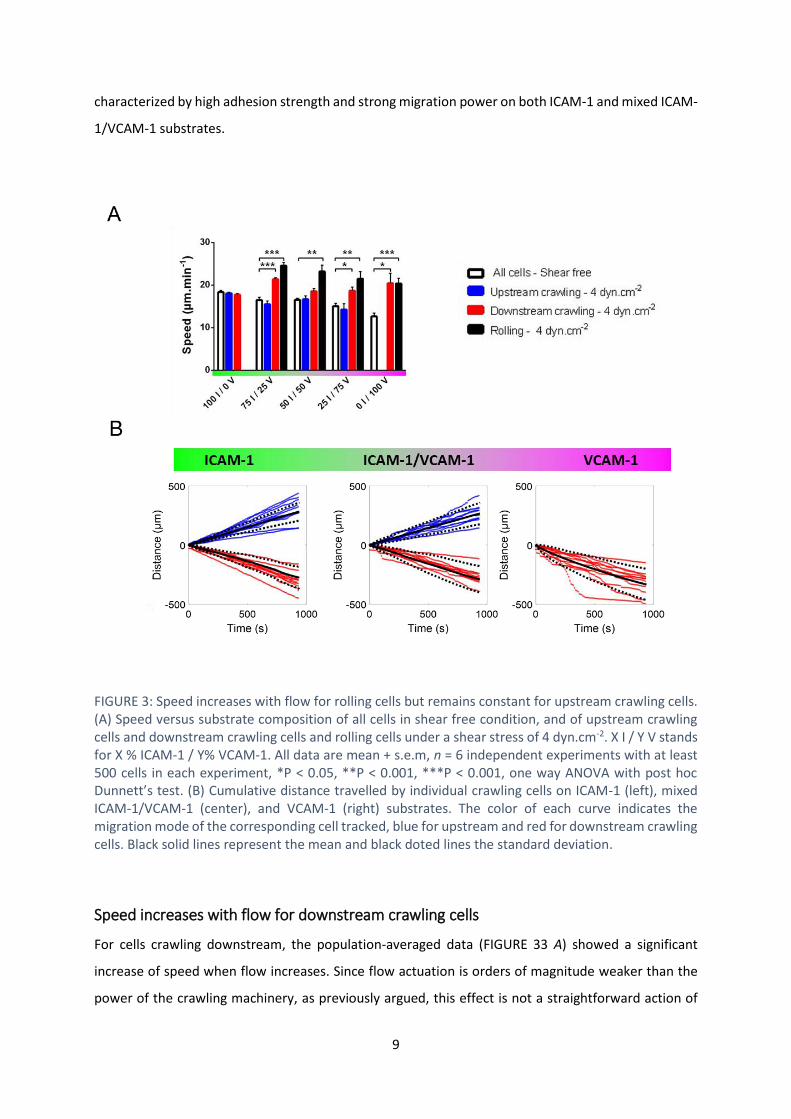
Speed remains constant for upstream crawling cells
FIGURE 33 A shows that the speed of rolling cells increased with shear stress on mixed ICAM-1/VCAM-
1 substrates as well as on VCAM-1 substrates, which is consistent with rolling being passively powered
by the action of flow on transiently adherent cells. In contrast, upstream crawling T cells on ICAM-1
substrates had a constant speed versus shear stress. The apparent slight decrease of speed on ICAM-
1 substrates was previously identified as a population selection effect, and the velocity of single cells
was shown to be constant up to shear stress of 60 dynes.cm-2 (14). Cells crawling upstream on mixed
ICAM-1/VCAM-1 substrates had also a constant velocity versus flow, exactly like on pure ICAM-1
substrate. The hydrodynamic force on cells (< 0.1 nN) is indeed negligible as compared to the force
developed by the cells crawling machinery (several nN)(14). Hence, upstream crawling is generally
9
characterized by high adhesion strength and strong migration power on both ICAM-1 and mixed ICAM-
1/VCAM-1 substrates.
FIGURE 3: Speed increases with flow for rolling cells but remains constant for upstream crawling cells. (A) Speed versus substrate composition of all cells in shear free condition, and of upstream crawling cells and downstream crawling cells and rolling cells under a shear stress of 4 dyn.cm-2. X I / Y V stands for X % ICAM-1 / Y% VCAM-1. All data are mean + s.e.m, n = 6 independent experiments with at least 500 cells in each experiment, *P < 0.05, **P < 0.001, ***P < 0.001, one way ANOVA with post hoc Dunnett’s test. (B) Cumulative distance travelled by individual crawling cells on ICAM-1 (left), mixed ICAM-1/VCAM-1 (center), and VCAM-1 (right) substrates. The color of each curve indicates the migration mode of the corresponding cell tracked, blue for upstream and red for downstream crawling cells. Black solid lines represent the mean and black doted lines the standard deviation.
Speed increases with flow for downstream crawling cells
For cells crawling downstream, the population-averaged data (FIGURE 33 A) showed a significant
increase of speed when flow increases. Since flow actuation is orders of magnitude weaker than the
power of the crawling machinery, as previously argued, this effect is not a straightforward action of
10
flow push. A closer look at tracks of individual cells (FIGURE 33 B) revealed that curvilinear
displacements versus time had a constant slope for cells crawling upstream (on ICAM-1 and mixed
ICAM-1/VCAM-1), but were composed of segments with different slopes for cells crawling downstream
(on VCAM-1 and mixed ICAM-1/VCAM-1). For upstream crawling cells, the speed was different from
one cell to another but constant versus time for each given cell, which is in line with a flow-independent
speed set by the stable motility machinery of each individual cell. In contrast, for downstream
crawling, low speed sequences corresponded to crawling, whereas high speed sequences
corresponded to mixed crawling and rolling with detachment of the cell rear (Movie S3). The
distribution of crawling steps was widened towards large steps corresponding to mixed crawling-
rolling steps (Figure S3). Taking into account the fact that VLA-4 mediates transient and less robust
adhesion than LFA-1, these observations suggest that upstream and downstream crawling cells adhere
mostly via LFA-1 and VLA-4 respectively.
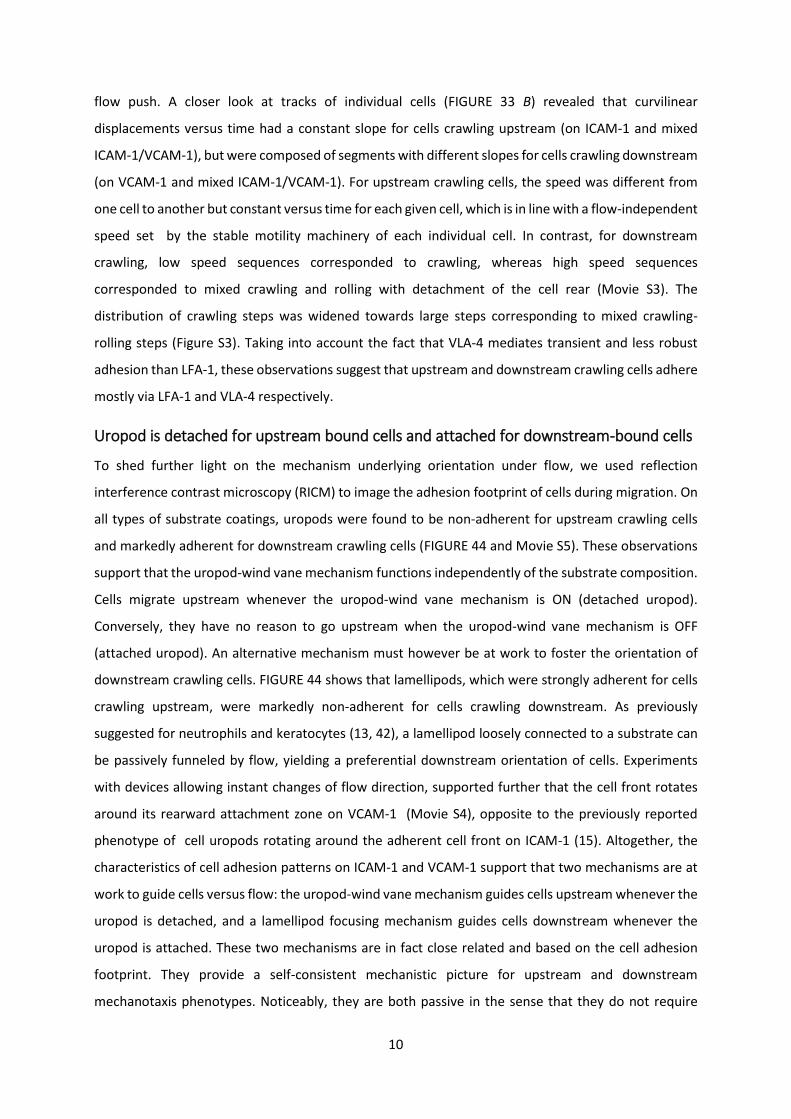
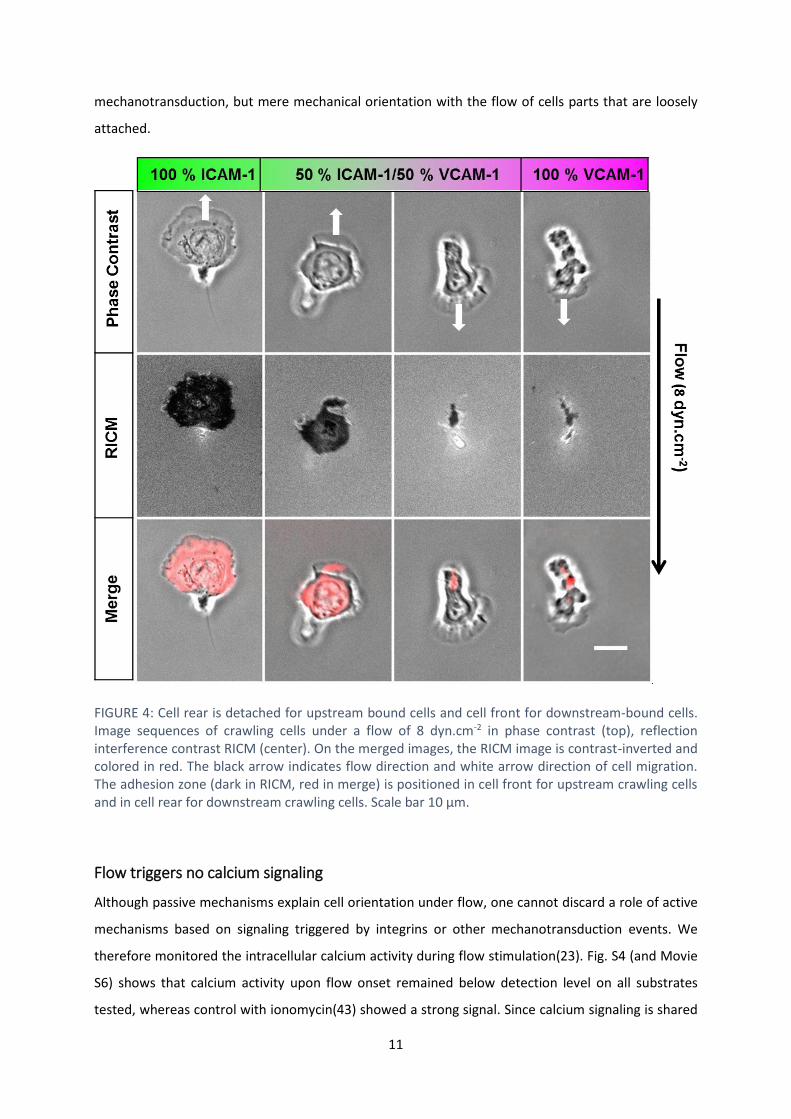
Uropod is detached for upstream bound cells and attached for downstream-bound cells
To shed further light on the mechanism underlying orientation under flow, we used reflection
interference contrast microscopy (RICM) to image the adhesion footprint of cells during migration. On
all types of substrate coatings, uropods were found to be non-adherent for upstream crawling cells
and markedly adherent for downstream crawling cells (FIGURE 44 and Movie S5). These observations
support that the uropod-wind vane mechanism functions independently of the substrate composition.
Cells migrate upstream whenever the uropod-wind vane mechanism is ON (detached uropod).
Conversely, they have no reason to go upstream when the uropod-wind vane mechanism is OFF
(attached uropod). An alternative mechanism must however be at work to foster the orientation of
downstream crawling cells. FIGURE 44 shows that lamellipods, which were strongly adherent for cells
crawling upstream, were markedly non-adherent for cells crawling downstream. As previously
suggested for neutrophils and keratocytes (13, 42), a lamellipod loosely connected to a substrate can
be passively funneled by flow, yielding a preferential downstream orientation of cells. Experiments
with devices allowing instant changes of flow direction, supported further that the cell front rotates
around its rearward attachment zone on VCAM-1 (Movie S4), opposite to the previously reported
phenotype of cell uropods rotating around the adherent cell front on ICAM-1 (15). Altogether, the
characteristics of cell adhesion patterns on ICAM-1 and VCAM-1 support that two mechanisms are at
work to guide cells versus flow: the uropod-wind vane mechanism guides cells upstream whenever the
uropod is detached, and a lamellipod focusing mechanism guides cells downstream whenever the
uropod is attached. These two mechanisms are in fact close related and based on the cell adhesion
footprint. They provide a self-consistent mechanistic picture for upstream and downstream
mechanotaxis phenotypes. Noticeably, they are both passive in the sense that they do not require
11
mechanotransduction, but mere mechanical orientation with the flow of cells parts that are loosely
attached.
FIGURE 4: Cell rear is detached for upstream bound cells and cell front for downstream-bound cells. Image sequences of crawling cells under a flow of 8 dyn.cm-2 in phase contrast (top), reflection interference contrast RICM (center). On the merged images, the RICM image is contrast-inverted and colored in red. The black arrow indicates flow direction and white arrow direction of cell migration. The adhesion zone (dark in RICM, red in merge) is positioned in cell front for upstream crawling cells and in cell rear for downstream crawling cells. Scale bar 10 µm.
Flow triggers no calcium signaling
Although passive mechanisms explain cell orientation under flow, one cannot discard a role of active
mechanisms based on signaling triggered by integrins or other mechanotransduction events. We
therefore monitored the intracellular calcium activity during flow stimulation(23). Fig. S4 (and Movie
S6) shows that calcium activity upon flow onset remained below detection level on all substrates
tested, whereas control with ionomycin(43) showed a strong signal. Since calcium signaling is shared
12
by many intracellular signaling pathways(44), this data supports that mechanotransduction may not
be involved in T cell guidance by flow.
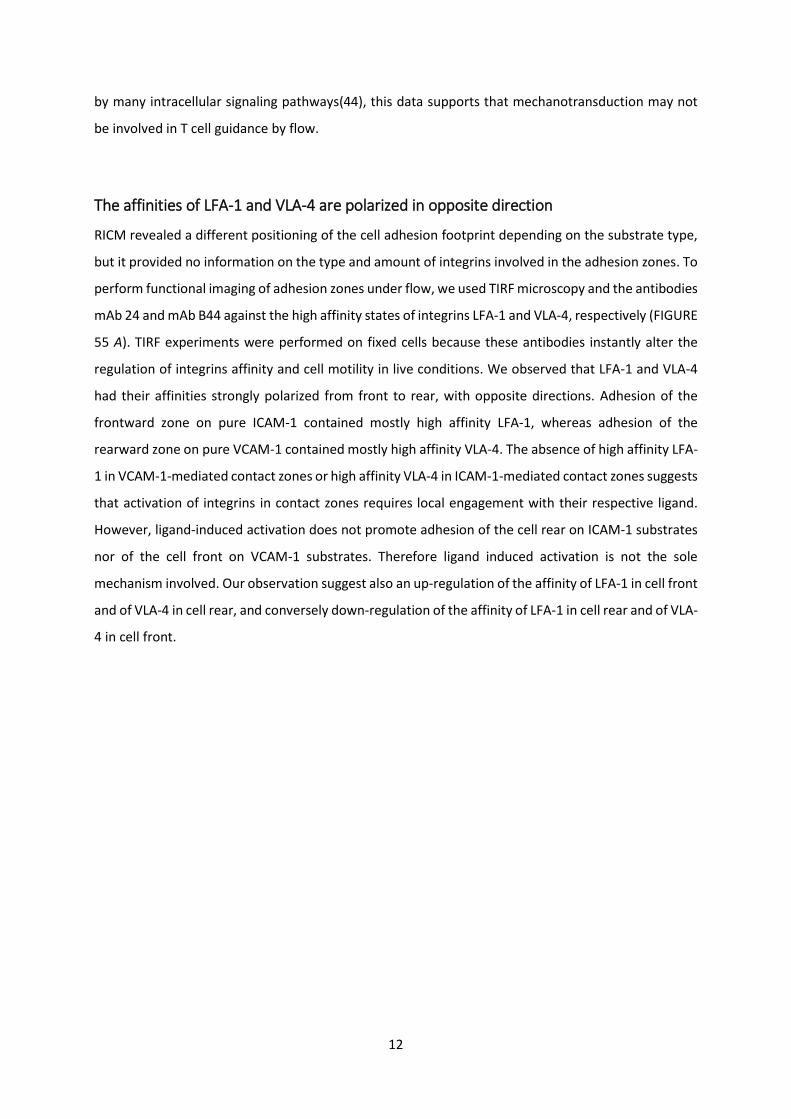
The affinities of LFA-1 and VLA-4 are polarized in opposite direction
RICM revealed a different positioning of the cell adhesion footprint depending on the substrate type,
but it provided no information on the type and amount of integrins involved in the adhesion zones. To
perform functional imaging of adhesion zones under flow, we used TIRF microscopy and the antibodies
mAb 24 and mAb B44 against the high affinity states of integrins LFA-1 and VLA-4, respectively (FIGURE
55 A). TIRF experiments were performed on fixed cells because these antibodies instantly alter the
regulation of integrins affinity and cell motility in live conditions. We observed that LFA-1 and VLA-4
had their affinities strongly polarized from front to rear, with opposite directions. Adhesion of the
frontward zone on pure ICAM-1 contained mostly high affinity LFA-1, whereas adhesion of the
rearward zone on pure VCAM-1 contained mostly high affinity VLA-4. The absence of high affinity LFA-
1 in VCAM-1-mediated contact zones or high affinity VLA-4 in ICAM-1-mediated contact zones suggests
that activation of integrins in contact zones requires local engagement with their respective ligand.
However, ligand-induced activation does not promote adhesion of the cell rear on ICAM-1 substrates
nor of the cell front on VCAM-1 substrates. Therefore ligand induced activation is not the sole
mechanism involved. Our observation suggest also an up-regulation of the affinity of LFA-1 in cell front
and of VLA-4 in cell rear, and conversely down-regulation of the affinity of LFA-1 in cell rear and of VLA-
4 in cell front.
13
FIGURE 5: Imaging of high affinity LFA-1 and VLA-4 in cell contact zone by TIRF reveals complex regulation mechanism of their affinity. (A) Microscopic images in bright field (top) and TIRF (center) of crawling T cells fixed under a shear stress of 8 dyn.cm-2 and stained for high affinity LFA-1 with mAb24 (green) and high affinity VLA-4 with mAb B44 (magenta). Scale bar 10 µm. (B) Intensity profiles performed for each fluorescent channel, to highlight integrin distribution along the cell axis. Values
14
were normalized to the highest value recorded on either condition. White regions indicate the cell body area.
Bistability between upstream crawling with LFA-1 and downstream crawling with VLA-4
On mixed ICAM-1/VCAM-1 substrates, both integrins are stimulated by their ligands in the contact
zones, so that cells with high affinity LFA-1 in their front and high affinity VLA-4 in their rear could a
priori adhere by their two poles. Considering upstream crawling cells, RICM imaging showed that cells
adhered only by their front, and TIRF revealed that such frontal adhesion zones involved almost
exclusively LFA-1 (FIGURE 55 B). This observation cannot be explained straightforwardly. Down-
regulation of VLA-4 affinity by cell polarization signaling, previously evidenced, explains the absence
of activated VLA-4 in the cell front but not the absence of adhesion of cell rear. An additional
mechanism is therefore at play to hamper the adhesion of the cell rear by VLA-4. An inhibiting crosstalk
of activated LFA-1 towards VLA-4 could play this role, and its existence has indeed been reported in
the literature(24). Considering now downstream crawling phenotype, RICM showed that cells were
strongly attached by their rear, and TIRF further revealed that high affinity VLA-4 was dominant in this
posterior adhesion zone. High affinity LFA-1 was mostly present in the cell central zone and partially
also in the cell rear (FIGURE 55 B). These observations go against an inhibiting crosstalk of activated
VLA-4 toward LFA-1 and rather in favor of an activating crosstalk since LFA-1 affinity is usually
downregulated in the cell rear on ICAM-1 substrate. Altogether, these data show that polarization of
integrins and ligand activation alone cannot explain the differential orientation under flow, and other
mechanisms involving crosstalk between integrins must be involved.
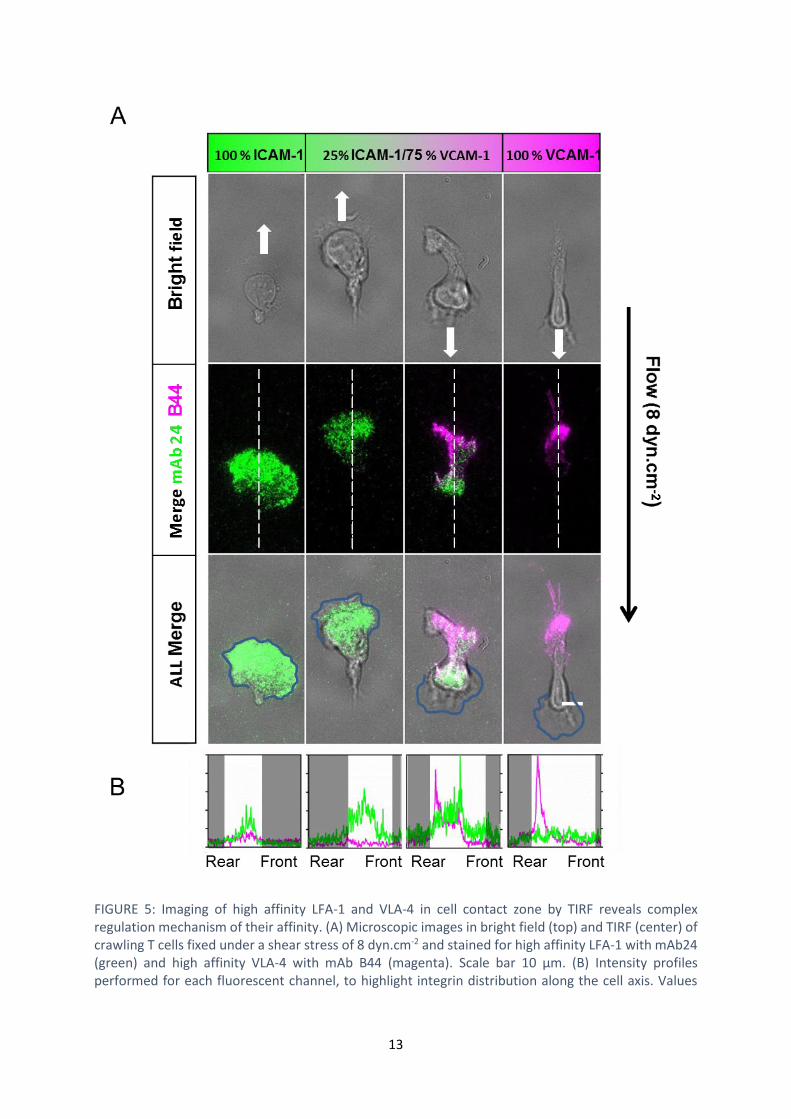
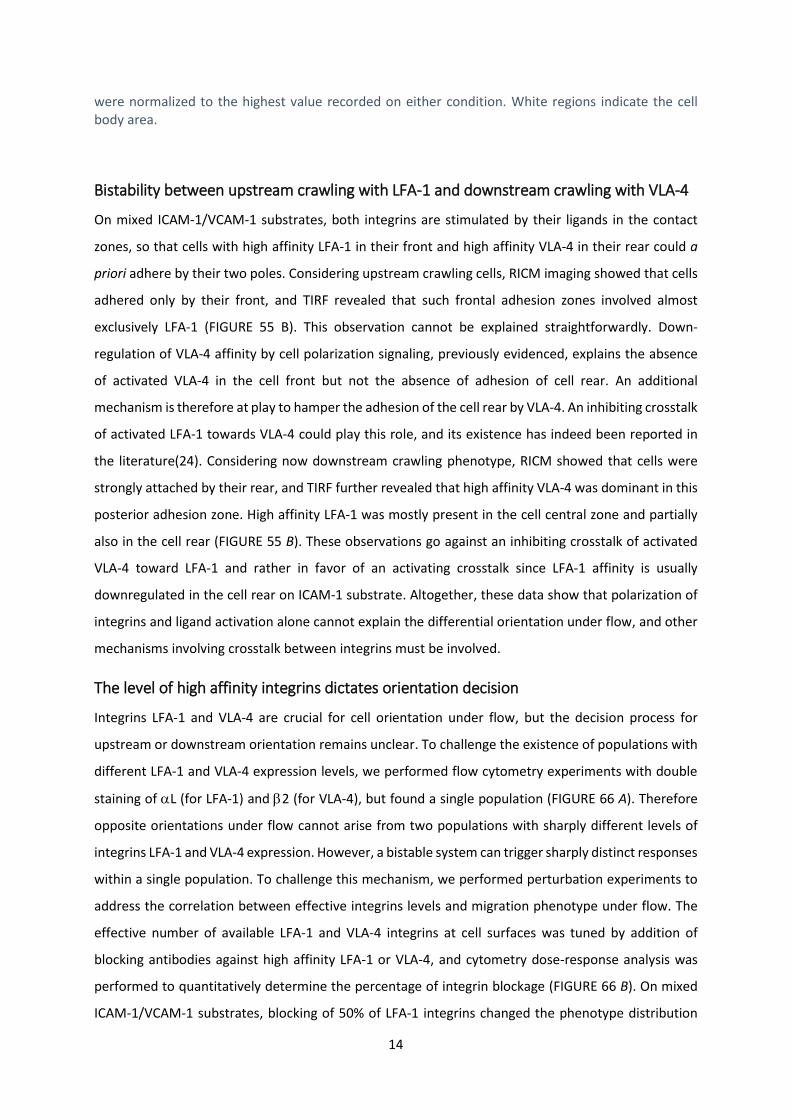
The level of high affinity integrins dictates orientation decision
Integrins LFA-1 and VLA-4 are crucial for cell orientation under flow, but the decision process for
upstream or downstream orientation remains unclear. To challenge the existence of populations with
different LFA-1 and VLA-4 expression levels, we performed flow cytometry experiments with double
staining of L (for LFA-1) and 2 (for VLA-4), but found a single population (FIGURE 66 A). Therefore
opposite orientations under flow cannot arise from two populations with sharply different levels of
integrins LFA-1 and VLA-4 expression. However, a bistable system can trigger sharply distinct responses
within a single population. To challenge this mechanism, we performed perturbation experiments to
address the correlation between effective integrins levels and migration phenotype under flow. The
effective number of available LFA-1 and VLA-4 integrins at cell surfaces was tuned by addition of
blocking antibodies against high affinity LFA-1 or VLA-4, and cytometry dose-response analysis was
performed to quantitatively determine the percentage of integrin blockage (FIGURE 66 B). On mixed
ICAM-1/VCAM-1 substrates, blocking of 50% of LFA-1 integrins changed the phenotype distribution
15
from upstream to downstream migration. Conversely, blocking of 50% of VLA-4 integrins changed the
phenotype distribution from downstream to upstream migration (FIGURE 66 C and Movie S7). This
data supports the hypothesis that the bistable choice for a given cell to go up- or down-stream depends
on its relative amounts of VLA-4 and LFA-1. A cell rich in LFA-1 will adopt the upstream migration
phenotype like T-cells on ICAM-1 substrates, while a cell rich in VLA-4 will adopt the general
downstream migration phenotype like T-cells on VCAM-1 substrates.
FIGURE 6: Perturbation experiments support that integrin expression level dictates decision of orientation versus flow. (A) 2D cytometry graphs of activated T cells versus expression of heterodimer
L (Ab -CD11a) for LFA-1 and 2 (Ab -CD29) for VLA-4 (Stained cells, Blue; Unstained cells, red). (B) Percentages of available integrins on effector T lymphocytes versus concentration of blocking antibodies in solution, as determined by cytometry. Blocking antibodies were TS1/22 for LFA-1 and Natalizumab for VLA-4. (C) Percentages of upstream crawling cells on mixed ICAM-1/VCAM-1 substrates with and without addition of blocking antibodies TS1/22, against integrins LFA-1 (left), and Natalizumab, against VLA-4 (right). Blocking of LFA-1 displaces phenotype distribution towards downstream phenotype, and blocking of VLA-4 towards upstream phenotype.
16
DISCUSSION
Upon recruitment from the blood stream, lymphocytes crawl on the intraluminal surface of blood
vessels presenting ICAM-1 and VCAM-1 adhesion molecules under a shear stress of 5 to 10 dynes.cm-2
(45). Shear stress has recently been recognized in vivo and in vitro as an efficient stimulus to guide
crawling T lymphocytes, albeit the function and mechanism of this guiding phenomenon remains
poorly understood. We confirmed here that lymphocytes display upstream crawling on ICAM-1 (12,
14–16, 46), downstream migration by rolling and crawling on VCAM-1 (16, 28, 32) and that a transition
occurs from upstream to downstream migration when the VCAM-1 to ICAM-1 ratio increases (16). Our
analysis at the single cell level has however shown that individual cells do not adopt intermediate
phenotypes between upstream and downstream migration modes. Instead of a smooth phenotype
transition by a homogenous population, we observed a biphasic system with two distinct populations
of upstream and downstream phenotypes. From a physical point of view, the separation of a system
in two distinct phases may rely on a first order phase transition or on a bistable mechanism. There
seems to be no thermodynamic-like phase transition here because individual cells do not exchange
between the two different states (phenotypes), at least in the time frame of our experiments. A
bistable mechanism is however plausible with individual cells remaining in distinct states. We indeed
deciphered the chain of mechanistic elements at the molecular and cellular level that allow the
emergence of a bistable system.
Integrin regulation plays a central role in cell response to flow, and our results bring new insight in the
spatial distribution of high affinity integrins along polarized migrating T cells. Previous investigations
on ICAM-1 substrates have reported a spatial segregation of LFA-1 affinity state, with intermediate
states exclusively in the lamellipod and high affinity states confined in the central or “focal” zone(47).
In this work, we found that high affinity LFA-1 was strongly present in the focal zone but also in the
lamellipod of T cells that crawled upstream (on ICAM-1 and ICAM-1/VCAM-1 substrates), and in the
central and rear zones of cells that crawled downstream (on ICAM-1/VCAM-1 substrates). This more
precise cartography of integrins affinity was achieved partly from the improvement of staining
protocols with mAB 24 but also from the distinctive analysis of sub-populations of T cells depending
on their phenotypes of mechanotaxis under flow.
Guiding of migrating cells by an external stimulus is generally assumed to result from a sophisticated
mechanism evolved for a specific function. Multiple specific functions are identified for chemotaxis,
which undoubtedly relies on specific cue detection, signal transduction, and complex (although still
unknown) signal processing to trigger cytoskeleton reorganization and cell orientation (1). In the case
of mechanotaxis, various observations support that similar complex mechanisms of signal transduction
17
and processing may be important and linked to integrins. Mechano-signaling by integrins and further
downstream signaling events have been identified, like the dephosphorylation of p130CAS under
tension, and the inactivation of Rho-GTPase Rac1 in the side of cell facing flow(37). Furthermore, CAS
substrate domain was directly identified in vitro as a primary molecular force (36).
Mechanotransduction by integrin adhesion complexes seems therefore to play a key role in
mechanotaxis of cells forming mature focal adhesion complexes, like endothelial cells(38). In the case
of amoeboid cells like leukocytes, migration occurs without maturation of integrin focal contacts, and
the role of mechanotransduction by integrins remains largely questionable. Dixit et al (23)
hypothesized that shear forces used high-affinity LFA-1 transmission to facilitate the cooperation with
the calcium release-activated channel Orai1 in directing localized cytoskeletal activation and
subsequent directed migration. Besides, Artemenko et al35 or Niethammer(44, 48) have shown that
flow could activate internal signalling networks common with chemotaxis. These works support
therefore the hypothesis that leukocyte flow guiding may be mediated by active signal transduction
and processing, like for chemotaxis, but the mechanistic link between mechanotransduction and
mechanotaxis is not fully established.
In contrast, we previously proposed a model without mechanotransduction for upstream migration of
T lymphocytes mediated by one integrin, LFA-1(15). This mechanism was based on two established
properties of crawling effector T cells, a detached tail (or uropod) acting as a wind vane, and a robustly
maintained front-rear polarization. These two elements exist in the absence of flow and the
mechanotaxis mechanism requires no signal triggered by flow. This model was generalized here to a
more complex system of flow mechanotaxis controlled by two integrins, LFA-1 and VLA-4, and of cells
displaying opposite choices between upstream and downstream directions. The wind-vane mechanism
is preserved for cells with a detached uropod and promotes systematically cell migration against the
flow, whereas a flow focusing mechanism explains downstream migration for cells with loosely
adherent lamellipod, as already observed with keratocytes(42). Altogether, upstream and downstream
mechanotaxis of effector T lymphocytes adhering via LFA-1 or VLA-4 integrins can rely on passive
mechanisms without mechanotransduction. Hence, although overwhelming biological processes rely
on sophisticated signaling pathways, passive mechanisms are also emerging to support various
mechanotaxis phenotypes such as flowtaxis(15) and barotaxis(49) of leukocytes, or rheotaxis of
swimming sperm cells(4) and worms(3).
The analysis of cell adhesion footprint at the cellular level explains upstream and downstream
phenotypes with the uropod/wind vane and lamellipod flow focusing mechanisms, however the
understanding of different cell adhesion properties requires analysis at the molecular level. The
bistability of cell adhesion either in the front or in the rear was found to rely in large part on the
18
opposite polarization of LFA-1 and VLA-4 affinities along the cells rear-front axis. Integrins in high
affinity state were found polarized towards the cell front for LFA-1 and towards the cell rear for VLA-
4. This is in agreement with literature data reporting affinity upregulation for LFA-1 in the cell front(47,
50) and of VLA-4 in the cell rear (51) on one hand, and affinity downregulation of LFA-1 in the cell
rear(47, 52, 53) and of VLA-4 in the cell front(24) on the other hand. These opposite polarization of
integrins explained directly the selective anterior adhesion of cells on ICAM-1 (with associated
upstream phenotype), and the selective posterior adhesion of cells on VCAM-1 (with associated
downstream phenotype). On mixed substrates, perturbation experiments with blocking antibodies of
LFA-1 and VLA-4 confirmed a link between the cell orientation under flow and the implication of LFA-
1 or VLA-4 in cell adhesion. Higher levels of high affinity LFA-1 versus VLA-4 on cells and/or of ICAM-1
versus VCAM-1 on substrates favors the upstream state, whereas lower ratios favors the downstream
state (FIGURE 77).
If attachment of a single pole of cells was essential to explain the possibility of different orientations
under flow, polarization of integrins affinity alone could not fully explain bistability. On mixed
substrates, the attachment of cells by their front only, as revealed in our experiments for upstream
cells, required an inhibitory crosstalk of activated LFA-1 toward VLA-4 to detach the uropod. The
existence of this crosstalk, which plays a crucial role in our mechanistic model of upstream guiding, is
also attested in the literature (24, 54). This inhibitory crosstalk acts as an amplifier of integrin
expression imbalance, allowing cells with dominant expression of LFA-1 vs. VLA-4 to behave like cells
bearing only LFA-1 (FIGURE 77). For the case of downstream crawling cells, a symmetric inhibitory
crosstalk effect from VLA-4 toward LFA-1 could promote symmetric orientation versus flow for cells
with a dominant VLA-4 vs. LFA-1 expression. However, we observed the presence of high affinity LFA-
1 and VLA-4 in the cell rear on mixed ICAM-1/VCAM-1. Since Polarization signaling inhibits LFA-1 in cell
rear, these results suggest an activation crosstalk of VLA-4 toward LFA-1 that counterbalances
polarization effect. This conclusion is consistent with literature data showing that VLA-4 promotes
activation of LFA-1(55, 56). Attachment of the cell rear is therefore enhanced by the combined
adhesion of VLA-4 and LFA-1, which reinforces the inhibition of the wind vane mechanism and of the
upstream phenotype. In the end, provided that the cell rear is attached, the extreme front edge of the
lamellipod, before its attachment, can always promote downstream guiding. FIGURE 77 summarizes
the interplay between integrins affinity regulation and crosstalk on cell directed migration under flow.
It illustrates a unique model linking mechanisms from the molecular to the cellular levels. Flow
mechanotaxis decisions and bistability of guidance under flow rely on a polarized inside-out regulation
of integrins LFA-1 and VLA-4 affinity and on an inhibitory crosstalk mechanism between LFA-1 and VLA-
4 at the molecular levels, relayed by a wind vane uropod mechanism and a lamellipod flow focusing at
19
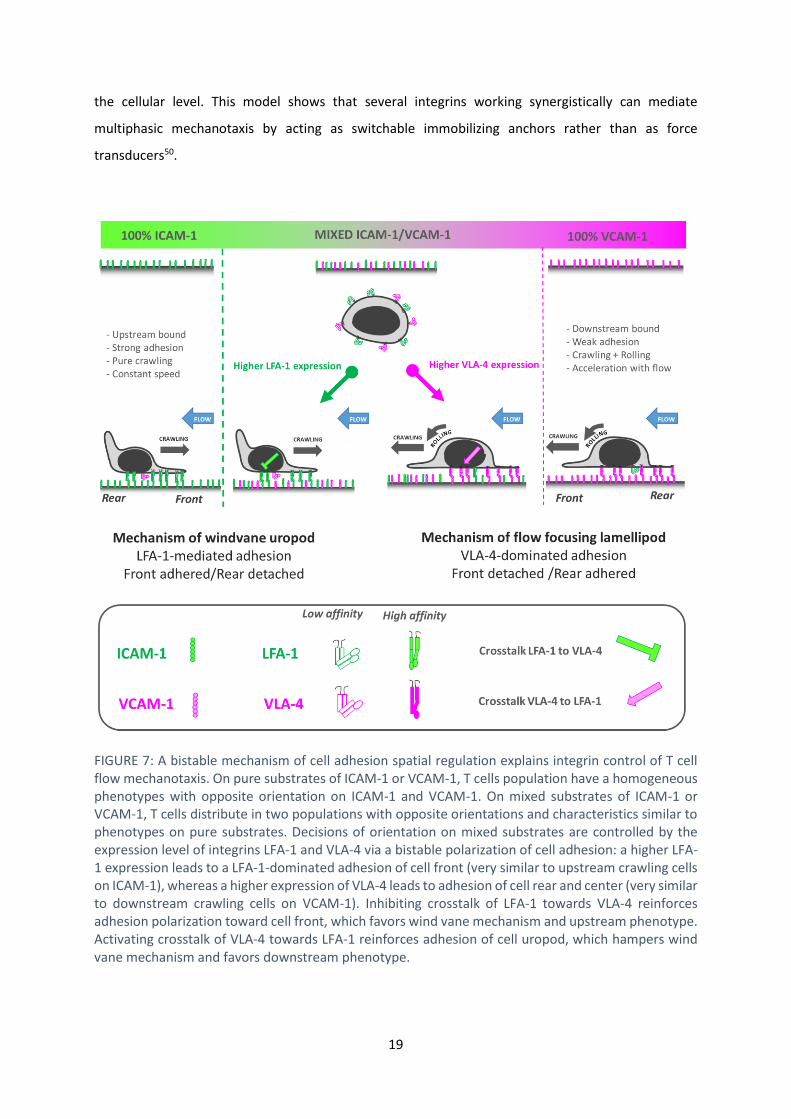
the cellular level. This model shows that several integrins working synergistically can mediate
multiphasic mechanotaxis by acting as switchable immobilizing anchors rather than as force
transducers50.
FIGURE 7: A bistable mechanism of cell adhesion spatial regulation explains integrin control of T cell flow mechanotaxis. On pure substrates of ICAM-1 or VCAM-1, T cells population have a homogeneous phenotypes with opposite orientation on ICAM-1 and VCAM-1. On mixed substrates of ICAM-1 or VCAM-1, T cells distribute in two populations with opposite orientations and characteristics similar to phenotypes on pure substrates. Decisions of orientation on mixed substrates are controlled by the expression level of integrins LFA-1 and VLA-4 via a bistable polarization of cell adhesion: a higher LFA-1 expression leads to a LFA-1-dominated adhesion of cell front (very similar to upstream crawling cells on ICAM-1), whereas a higher expression of VLA-4 leads to adhesion of cell rear and center (very similar to downstream crawling cells on VCAM-1). Inhibiting crosstalk of LFA-1 towards VLA-4 reinforces adhesion polarization toward cell front, which favors wind vane mechanism and upstream phenotype. Activating crosstalk of VLA-4 towards LFA-1 reinforces adhesion of cell uropod, which hampers wind vane mechanism and favors downstream phenotype.
20
During recruitment of leukocytes from the blood system to inflamed zones, integrins are known to
control several crucial functions. First for cell arrest in blood vessels, VLA-4 (41) contributes to rolling
and LFA-1 (L2) is essential for crawling. Then for cell extravasation, endothelial overexpression of
integrins ligands is arguably guiding leukocytes into specialized portals of transmigration(57). Finally
for tissue migration, integrins V condition the proper homing of lymphocytes to inflamed zones. The
mechanism of lymphocyte guidance by flow enriches therefore the panel of integrins functionalities in
the sequence of leukocyte recruitment. Although passive mechanisms suggest the possibility of a
fortuitous phenotype, the robustness and sophistication of a mechanism with synergistic regulation
and crosstalk of multiple integrins supports instead a system evolved for a given function in leukocyte
recruitment(32). More generally, a complete knowledge of integrins functions in leukocyte
recruitment may also be valuable for therapeutic purposes, for instance to modulate the immune
response by integrins blocking antibodies in the treatment of pathologies such as the multiple
sclerosis.
21
MATERIALS AND METHODS
Cell culture
Whole blood from healthy adult donors was obtained from the “Établissement Français du Sang”.
Peripheral blood mononuclear cells (PBMCs) were recovered from the interface of a Ficoll gradient
(Eurobio, Evry, France). T cells were isolated from PBMCs with Pan T cell isolation kit (Miltenyi Biotec,
Bergisch Gladbach, Germany), then were stimulated for 48 h with anti-CD3/anti-CD28 Dynabeads
(Gibco by Thermo Fischer Scientific, Waltham, MA) according to the manufacturer’s instructions. T
lymphocytes were subsequently cultivated in Roswell Park Memorial Institute Medium (RPMI) 1640
supplemented with 25 mM GlutaMax (Gibco, Gibco by Thermo Fischer Scientific, Waltham, MA, USA),
10% fetal calf serum (FCS; Gibco by Thermo Fischer Scientific, Waltham, MA, USA) at 37°C, 5% CO2 in
the presence of IL-2 (50 ng.mL-1; Miltenyi Biotec, Bergisch Gladbach, Germany) and used 6 to 10 days
after stimulation. At the time of use, the cells were >99% positive for pan-T lymphocyte marker CD3
and assessed for activation and proliferation with CD25, CD45RO, CD45RA and CD69 markers as judged
by flow cytometry.
Microscopy
Bright field, Reflection Interference Contrast Microscopy (RICM) and fluorescent images were
performed on a Zeiss Observer Z1 microscope (Carl Zeiss, Oberkachen, Germany) piloted with
μManager(39) . The microscope was equipped with a CoolSnap HQ CCD camera (Photometrics, Tucson,
AZ, USA) and different Zeiss objectives (Plan-Apochromat × 10/0.3, × 20/0.8 and × 63/1.4 and NeoFluar
63/1.25 antiflex . The source was a CoolLED pE-300 (CoolLED, Andover, UK). A narrow band-pass filter
(λ=546 nm ± 12 nm) was used for RICM.
Total Internal Reflection Fluorescence (TIRF) microscopy images were recorded on Nikon Eclipse Ti
microscope (Nikon Instruments, Europe), equipped with an ILas2 system (Roper Scientific, France) and
controlled by Metamorph software (Molecular Devices, San José, CA). Images were taken with an Apo
TIRF 60x/1.49 oil objective (Nikon), a Prime 95TM Scientific CMOS Camera (Photometrics, Tucson, AZ)
and an Obis Coherent/ILAS LASER.
Flow devices and surface treatment
Devices consisted in Ibidi µ-Slide IV0.4 uncoated (Ibidi GMBH, Martinsreid, Germany) and in homemade
flow devices, fabricated using standard soft lithography routines(40). Briefly, a positive mold was
22
created with SU-8 2100-negative resins (Microchem, USA) on silicon wafers (Siltronix, France), then
replicas were molded in polydimethylsiloxane (PDMS) elastomer (Sylgard 184, Dow Corning, USA) and
sealed on glass coverslides via plasma activation (Harricks Plasma, Ithaca, NY, USA). Ports to plug inlet
and outlet reservoirs were punched to a 1-mm outer diameter.
Flow devices (Ibidi µ-slide and homemade) were pre-coated for 1h at 37°C with 50 µg.mL-1 of Protein
A (Sigma-Aldrich, St Louis, MO, USA). Surfaces were then blocked with 2.5% bovine serum album (BSA)
(Axday, Dardilly, France) in PBS (Gibco, Gibco by Thermo Fischer Scientific, Waltham, MA, USA) for
30 min at room temperature. Channels were subsequently functionalized by an overnight incubation
at 4 °C with 10 μg.mL-1 of either human ICAM-1-Fc or VCAM-1-Fc (R&D Systems, Minneapolis, MN,
USA) in PBS or mixture of the CAMs. Channels were rinsed with PBS. Cells were then added in complete
RPMI medium, allowed to equilibrate for 10 min and then rinsed with medium.
Cells in the flow chambers were observed at 37°C with the Zeiss Z1 automated microscope. Flow of
pre-warmed and CO2 equilibrated culture media through the flow chamber was controlled using an
Ibidi pump system (Ibidi GMBH, Martinsreid, Germany). Bright-field images (EC Plan-NEoFluar 10x/0.3
Ph1 objective) were collected every 10 s over the time frame indicated. The field of view represents
1740 × 1300 μm2.
Fluorescence quantification of adhesion molecules
Anti-human CD106-PE and anti-human CD54-PE (eBioscience by Thermo Fischer Scientific, Waltham,
MA) antibody were used for the quantification of substrates coatings with mixed ICAM-1 and VCAM-
1. First we set up bulk calibration data by measuring the fluorescence intensity of 41 µm thick
channels filled with antibody solutions at concentrations of 1.5, 3, 5 and 7 µg.mL-1. Channels were pre-
treated with 1% Pluronic F127 (Sigma-Aldrich, St Louis, MO, USA) fluorescence measured. Samples
with mixed ICAM-1/VCAM-1 were then stained either with CD106-PE or with CD54-PE at 10 µg.mL-1
overnight at 4°C, and fluorescent images were then taken the next day and analyzed with Fiji
software(41). The average intensity at 5 different positions was converted into surface density using
the bulk calibration data.
Cell tracking and data analysis
A home-made program was developed with MATLAB software (The MathWorks, Natick, MA, USA) to
track migrating cells and analyze their pathway properties. In all flow experiments, the flow is directed
from the top to the bottom of the images presented here. To get an indication of the amount of motion
23
in a particular direction, a migration index (MI) is calculated by dividing the distance the cells travel in
the flow direction by the total distance travel by the cells. The average speed of a cell, V, is calculated
as the ratio between the total trajectory length and the corresponding time of migration. All
calculations were performed at least in triplicate for each substrate. Image Analysis was performed
with ImageJ (U. S. National Institutes of Health, Bethesda, USA).
Fixation under flow and Immunofluorescence staining
Cells migrating under flow were instantly fixed by quick injection of PFA 4% (Affymetrix, Cleveland,
Ohio, USA) into the device. After 10 min incubation, the device was rinsed with PBS-Tween 0.1% and
either stained or kept at 4°C until used. For the staining, cells were initially permeabilized with triton
0.5% (Sigma-Aldrich, St Louis, MO, USA) in PBS for 5 min and rinsed 3 times with PBS-Tween 0.1%. Free
FC-binding sites of the Protein A layer were blocked with human serum IgG 100 µg.mL-1 solution for 20
min; samples were then further blocked with BSA 2% for 20 min. After 3 washes with PBS-Tween,
samples were incubated with mAb B44 (antibody at a concentration of 5 µg.mL-1) for 20 min, washed
3 times and then incubated with a secondary anti-mouse antibody (20 µg.mL-1) for another 20 min
prior to imaging mAb B44 alone as a control. For the double staining of mAb B44 and mAb24, free
binding sites of the secondary antibody were blocked by incubating the samples for at least 1hr with
mouse IgG1 isotype control (10 µg.mL-1). Primarily labeled mAb24 antibody was finally added (4 µg.mL-
1) and kept in solution during the imaging process.
The antibodies used were mouse anti-Integrin β1, clone name B44 (Millipore, Temecula, CA, USA); goat
anti-mouse IgG, CF™647 conjugated (Sigma-Aldrich, St Louis, MO, USA); mouse IgG1 isotype control
(Biolegend, San Diego, CA, USA); mouse anti-human CD11a/CD18, AF488 conjugated, clone name
mAb24 (Biolegend, San Diego, CA, USA). All antibodies were diluted in PBS-Tween 0.1%.
For the histograms of Fig. 5 B, raw values were normalized by applying the following formula:
Eq. 1: 𝐼−𝐼𝑚𝑖𝑛
𝐼𝑚𝑎𝑥−𝐼𝑚𝑖𝑛
Where Imin is the minimal value recorded on each image and Imax is the maximum value recorded for
each fluorophore in either condition.
Fluorescent detection of Calcium Flux
For calcium imaging experiments, cells were first seeded in channels with RPMI medium and were
incubated for 10 min at 37°C to allow adhesion, then they were rinsed with HBSS + 1% BSA and
24
incubated with Oregon Green® 488 BAPTA-1, AM (ThermoFisher, Waltham, USA) diluted in HBSS + 1%
BSA (5 µM) for 15 min at 37°C in the dark. After rinsing with HBSS + 1% BSA, the medium was replaced
by HBSS+ 10% SVF. Control experiment was achieved by injection ionomycin (ThermoFisher, Waltham,
USA) at a concentration of 1 µg.mL-1.
Flow Cytometry
One hundred thousand cells were taken from the cultured population and pelleted by centrifugation
for 5 minutes at 1000 rpm. The cells were re-suspended in 100 µL PBS+2% FBS, containing the premixed
antibodies (CD11a-FITC, clone Hi111 (eBioscience by Thermo Fischer Scientific, Waltham, MA, USA)
and CD29-PE, clone TS2/16 (Biolegend, San Diego, CA, USA) to the desired concentration and incubated
for 30 minutes at 4°C in the dark. The cells were washed with PBS+2% FBS and then re-suspended in
0.5 mL of PBS+2% FBS. For dose responses with blocking antibodies against integrins, we used TS1/22
(Thermo Fisher Scientific, Waltham, MA, USA) and a recombinant monoclonal antibody to integrin
alpha 4 (CD49) clone Natalizumab (Absolute Antibody, Boston, MA, USA) to block respectively LFA-1
and VLA-4. Blocked LFA-1 were measured with secondary antibody against TS1/22. Available functional
VLA-4 was measured with antibody against CD49 (Clone HP2/1). All flow cytometry was performed on
a BD LSR II flow cytometer (BD Biosciences, Europe).
Perturbation experiments
Cells were incubated with an anti-CD11a monoclonal antibody clone TS1/22 or a recombinant
monoclonal antibody to integrin alpha 4 (CD49) clone Natalizumab for 10 min at 37°C. Cells were first
seeded in channels with RPMI medium and were incubated for 10 min at 37°C to allow adhesion before
starting the experiment.
Ethics statement
Human subjects: Blood from healthy volunteers was obtained through a formalized agreement with
French Blood Agency (Etablissement Français du Sang, agreement n° 2017-7222). Blood was obtained
by the agency after informed consent of the donors, in accordance with the Declaration of Helsinki. All
experiments were approved by the INSERM Institutional Review Board and ethics committee.
25
AUTHOR CONTRIBUTIONS
Conceptualization, MPV and OT; Flow migration experiments, AH and TS; TIRF experiments, TS and
NGS; Calcium experiments, LA and XL; Cytometry experiments, MBP; Data analysis, TS, NGS and MPV.
Manuscript writing OT and MPV.
ACKNOWLEDGMENTS
The project leading to this publication has received funding from the ANR grant RECRUTE, LABEX
INFORM, the Région PACA, Institute CENTURI, Excellence Initiative of Aix-Marseille University –
A*MIDEX, a French “Investissements d’Avenir” programme and Alveole company. We thank the France
Bioimaging Platform, funded by the French Agence Nationale de la Recherche (ANR–‐10–‐INBS–‐04–‐
01, «Investments for the future»). We are grateful to Laurent Limozin and Alphée Michelot for their
support and advices with TIRF-FRAP imaging, and to Laurence Borge for assistance with the use of the
Cell Culture Platform facility (Luminy TPR2-INSERM).
REFERENCES
1. Swaney, K.F., C.-H. Huang, and P.N. Devreotes. 2010. Eukaryotic Chemotaxis: A Network of Signaling Pathways Controls Motility, Directional Sensing, and Polarity. Annu. Rev. Biophys. 39: 265–289.
2. Insall, R.H. 2010. Understanding eukaryotic chemotaxis: a pseudopod-centred view. Nat. Rev. Mol. Cell Biol. 11: 453–458.
3. Yuan, J., D.M. Raizen, and H.H. Bau. 2015. Propensity of undulatory swimmers, such as worms, to go against the flow. Proc. Natl. Acad. Sci. : 201424962.
4. Zhang, Z., J. Liu, J. Meriano, C. Ru, S. Xie, J. Luo, and Y. Sun. 2016. Human sperm rheotaxis: a passive physical process. Sci. Rep. 6.
5. Engler, A.J., S. Sen, H.L. Sweeney, and D.E. Discher. 2006. Matrix elasticity directs stem cell lineage specification. Cell. 126: 677–689.
26
6. Mitrossilis, D., J.-C. Roper, D. Le Roy, B. Driquez, A. Michel, C. Menager, G. Shaw, S. Le Denmat, L. Ranno, F. Dumas-Bouchiat, N.M. Dempsey, and E. Farge. 2017. Mechanotransductive cascade of Myo-II-dependent mesoderm and endoderm invaginations in embryo gastrulation. Nat. Commun. 8: 13883.
7. Bertet, C., L. Sulak, and T. Lecuit. 2004. Myosin-dependent junction remodelling controls planar cell intercalation and axis elongation. Nature. 429: 667–671.
8. yinnian, F., K.N. Brazin, eiji Kobayashi, robert mallis, ellis reinherz, and matthew J. lang. 2017. Mechanosensing drives acuity of αβ T-cell recognition(1).pdf. Proc. Natl. Acad. Sci. .
9. Weber, M., R. Hauschild, J. Schwarz, C. Moussion, I. de Vries, D.F. Legler, S.A. Luther, T. Bollenbach, and M. Sixt. 2013. Interstitial Dendritic Cell Guidance by Haptotactic Chemokine Gradients. Science. 339: 328–332.
10. Castellino, F., A.Y. Huang, G. Altan-Bonnet, S. Stoll, C. Scheinecker, and R.N. Germain. 2006. Chemokines enhance immunity by guiding naive CD8+ T cells to sites of CD4+ T cell–dendritic cell interaction. Nature. 440: 890–895.
11. Ehrlich, L.I.R., D.Y. Oh, I.L. Weissman, and R.S. Lewis. 2009. Differential Contribution of Chemotaxis and Substrate Restriction to Segregation of Immature and Mature Thymocytes. Immunity. 31: 986–998.
12. Bartholomäus, I., N. Kawakami, F. Odoardi, C. Schläger, D. Miljkovic, J.W. Ellwart, W.E.F. Klinkert, C. Flügel-Koch, T.B. Issekutz, H. Wekerle, and A. Flügel. 2009. Effector T cell interactions with meningeal vascular structures in nascent autoimmune CNS lesions. Nature. 462: 94–98.
13. Smith, L.A., H. Aranda-Espinoza, J.B. Haun, and D.A. Hammer. 2007. Interplay between Shear Stress and Adhesion on Neutrophil Locomotion. Biophys. J. 92: 632–640.
14. Valignat, M.-P., O. Theodoly, A. Gucciardi, N. Hogg, and A.C. Lellouch. 2013. T Lymphocytes Orient against the Direction of Fluid Flow during LFA-1-Mediated Migration. Biophys. J. 104: 322–331.
15. Valignat, M.-P., P. Nègre, S. Cadra, A.C. Lellouch, F. Gallet, S. Hénon, and O. Theodoly. 2014. Lymphocytes can self-steer passively with wind vane uropods. Nat. Commun. 5: 5213.
16. Dominguez, G.A., N.R. Anderson, and D.A. Hammer. 2015. The direction of migration of T-lymphocytes under flow depends upon which adhesion receptors are engaged. Integr Biol. 7: 345–355.
17. Sumagin, R., and I.H. Sarelius. 2010. Intercellular Adhesion Molecule-1 Enrichment near Tricellular Endothelial Junctions Is Preferentially Associated with Leukocyte Transmigration and Signals for Reorganization of These Junctions To Accommodate Leukocyte Passage. J. Immunol. 184: 5242–5252.
18. Phillipson, M., B. Heit, S.A. Parsons, B. Petri, S.C. Mullaly, P. Colarusso, R.M. Gower, G. Neely, S.I. Simon, and P. Kubes. 2009. Vav1 Is Essential for Mechanotactic Crawling and Migration of Neutrophils out of the Inflamed Microvasculature. J. Immunol. 182: 6870–6878.
19. Sumagin, R., H. Prizant, E. Lomakina, R.E. Waugh, and I.H. Sarelius. 2010. LFA-1 and Mac-1 Define Characteristically Different Intralumenal Crawling and Emigration Patterns for Monocytes and Neutrophils In Situ. J. Immunol. 185: 7057–7066.
27
20. Rainger, G.E., C.D. Buckley, D.L. Simmons, and G.B. Nash. 1999. Neutrophils sense flow-generated stress and direct their migration through αVβ3-integrin. Am. J. Physiol. - Heart Circ. Physiol. 276: H858–H864.
21. Steiner, O., C. Coisne, R. Cecchelli, R. Boscacci, U. Deutsch, B. Engelhardt, and R. Lyck. 2010. Differential Roles for Endothelial ICAM-1, ICAM-2, and VCAM-1 in Shear-Resistant T Cell Arrest, Polarization, and Directed Crawling on Blood–Brain Barrier Endothelium. J. Immunol. 185: 4846–4855.
22. Lee, H.J., M.F. Diaz, K.M. Price, J.A. Ozuna, S. Zhang, E.M. Sevick-Muraca, J.P. Hagan, and P.L. Wenzel. 2017. Fluid shear stress activates YAP1 to promote cancer cell motility. Nat. Commun. 8: 14122.
23. Dixit, N., I. Yamayoshi, A. Nazarian, and S.I. Simon. 2011. Migrational Guidance of Neutrophils Is Mechanotransduced via High-Affinity LFA-1 and Calcium Flux. J. Immunol. 187: 472–481.
24. Grönholm, M., F. Jahan, E.A. Bryushkova, S. Madhavan, F. Aglialoro, L.S. Hinojosa, L.M. Uotila, and C.G. Gahmberg. 2016. LFA-1 integrin antibodies inhibit leukocyte α4β1–mediated adhesion by intracellular signaling. Blood. 128: 1270–1281.
25. Ishibashi, M., Y. Miyanaga, S. Matsuoka, J. Kozuka, Y. Togashi, T. Kinashi, and M. Ueda. 2015. Integrin LFA-1 regulates cell adhesion via transient clutch formation. Biochem. Biophys. Res. Commun. 464: 459–466.
26. Nordenfelt, P., H.L. Elliott, and T.A. Springer. 2016. Coordinated integrin activation by actin-dependent force during T-cell migration. Nat. Commun. 7: 13119.
27. Schürpf, T., and T.A. Springer. 2011. Regulation of integrin affinity on cell surfaces. EMBO J. 30: 4712–4727.
28. Alon, R., P.D. Kassner, M.W. Carr, E.B. Finger, M.E. Hemler, and T.A. Springer. 1995. The integrin VLA-4 supports tethering and rolling in flow on VCAM-1. J Cell Biol. 128: 1243–1253.
29. Huttenlocher, A., and A.R. Horwitz. 2011. Integrins in Cell Migration. Cold Spring Harb. Perspect. Biol. 3: a005074–a005074.
30. Verma, N.K., and D. Kelleher. 2017. Not Just an Adhesion Molecule: LFA-1 Contact Tunes the T Lymphocyte Program. J. Immunol. 199: 1213–1221.
31. Buffone, A., N.R. Anderson, and D.A. Hammer. 2018. Migration against the direction of flow is LFA-1-dependent in human hematopoietic stem and progenitor cells. J Cell Sci. 131: jcs205575.
32. Anderson, N.R., A. Buffone Jr., and D.A. Hammer. 2019. T lymphocytes migrate upstream after completing the leukocyte adhesion cascade. Cell Adhes. Migr. : 1–6.
33. Buffone, A., N.R. Anderson, and D.A. Hammer. 2018. Migration against the direction of flow is LFA-1-dependent in human hematopoietic stem and progenitor cells. J Cell Sci. 131: jcs205575.
34. Hoffman, B.D., C. Grashoff, and M.A. Schwartz. 2011. Dynamic molecular processes mediate cellular mechanotransduction. Nature. 475: 316–323.
35. Rio, A. del, R. Perez-Jimenez, R. Liu, P. Roca-Cusachs, J.M. Fernandez, and M.P. Sheetz. 2009. Stretching Single Talin Rod Molecules Activates Vinculin Binding. Science. 323: 638–641.
28
36. Sawada, Y., M. Tamada, B.J. Dubin-Thaler, O. Cherniavskaya, R. Sakai, S. Tanaka, and M.P. Sheetz. 2006. Force Sensing by Mechanical Extension of the Src Family Kinase Substrate p130Cas. Cell. 127: 1015–1026.
37. Zaidel-Bar, R., Z. Kam, and B. Geiger. 2005. Polarized downregulation of the paxillin-p130CAS-Rac1 pathway induced by shear flow. J. Cell Sci. 118: 3997–4007.
38. Urbich, C., E. Dernbach, A. Reissner, M. Vasa, A.M. Zeiher, and S. Dimmeler. 2002. Shear stress-induced endothelial cell migration involves integrin signaling via the fibronectin receptor subunits alpha(5) and beta(1). Arterioscler. Thromb. Vasc. Biol. 22: 69–75.
39. Edelstein, A., N. Amodaj, K. Hoover, R. Vale, and N. Stuurman. 2010. Computer Control of Microscopes Using µManager. In: Ausubel FM, R Brent, RE Kingston, DD Moore, JG Seidman, JA Smith, K Struhl, editors. Current Protocols in Molecular Biology. Hoboken, NJ, USA: John Wiley & Sons, Inc.
40. Xia, Y., and G.M. Whitesides. 1998. Soft lithography. Annu. Rev. Mater. Sci. 28: 153–184.
41. Schindelin, J., I. Arganda-Carreras, E. Frise, V. Kaynig, M. Longair, T. Pietzsch, S. Preibisch, C. Rueden, S. Saalfeld, B. Schmid, J.-Y. Tinevez, D.J. White, V. Hartenstein, K. Eliceiri, P. Tomancak, and A. Cardona. 2012. Fiji: an open-source platform for biological-image analysis. Nat. Methods. 9: 676–682.
42. Bohnet, S., R. Ananthakrishnan, A. Mogilner, J.-J. Meister, and A.B. Verkhovsky. 2006. Weak Force Stalls Protrusion at the Leading Edge of the Lamellipodium. Biophys. J. 90: 1810–1820.
43. Kao, J.P.Y., G. Li, and D.A. Auston. 2010. Practical Aspects of Measuring Intracellular Calcium Signals with Fluorescent Indicators. In: Methods in Cell Biology. Elsevier. pp. 113–152.
44. Artemenko, Y., L. Axiotakis, J. Borleis, P.A. Iglesias, and P.N. Devreotes. 2016. Chemical and mechanical stimuli act on common signal transduction and cytoskeletal networks. Proc. Natl. Acad. Sci. 113: E7500–E7509.
45. Johnston, B., T.B. Issekutz, and P. Kubes. 1996. The alpha(4)-integrin supports leukocyte rolling and adhesion in chronically inflamed postcapillary venules in vivo. J. Exp. Med. 183: 1995–2006.
46. Gorina, R., R. Lyck, D. Vestweber, and B. Engelhardt. 2014. beta(2) Integrin-Mediated Crawling on Endothelial ICAM-1 and ICAM-2 Is a Prerequisite for Transcellular Neutrophil Diapedesis across the Inflamed Blood-Brain Barrier. J. Immunol. 192: 324–337.
47. Smith, A., P. Stanley, K. Jones, L. Svensson, A. McDowall, and N. Hogg. 2007. The role of the integrin LFA-1 in T-lymphocyte migration. Immunol. Rev. 218: 135–146.
48. Niethammer, P. 2016. Neutrophil mechanotransduction: A GEF to sense fluid shear stress. J Cell Biol. 215: 13–14.
49. Moreau, H.D., C. Blanch-Mercader, R. Attia, M. Maurin, Z. Alraies, D. Sanséau, O. Malbec, M.-G. Delgado, P. Bousso, J.-F. Joanny, R. Voituriez, M. Piel, and A.-M. Lennon-Duménil. 2019. Macropinocytosis Overcomes Directional Bias in Dendritic Cells Due to Hydraulic Resistance and Facilitates Space Exploration. Dev. Cell. 49: 171-188.e5.
29
50. Ghandour, H., X. Cullere, A. Alvarez, F.W. Luscinskas, and T.N. Mayadas. 2007. Essential role for Rap1 GTPase and its guanine exchange factor CalDAG-GEFI in LFA-1 but not VLA-4 integrin–mediated human T-cell adhesion. Blood. 110: 3682–3690.
51. Laudanna, C., J.J. Campbell, and E.C. Butcher. 1996. Role of Rho in Chemoattractant-Activated Leukocyte Adhesion Through Integrins. Science. 271: 981–983.
52. Morin, N.A., P.W. Oakes, Y.-M. Hyun, D. Lee, Y.E. Chin, M.R. King, T.A. Springer, M. Shimaoka, J.X. Tang, J.S. Reichner, and M. Kim. 2008. Nonmuscle myosin heavy chain IIA mediates integrin LFA-1 de-adhesion during T lymphocyte migration. J. Exp. Med. 205: 195–205.
53. Pouwels, J., N. De Franceschi, P. Rantakari, K. Auvinen, M. Karikoski, E. Mattila, C. Potter, J.P. Sundberg, N. Hogg, C.G. Gahmberg, M. Salmi, and J. Ivaska. 2013. SHARPIN Regulates Uropod Detachment in Migrating Lymphocytes. Cell Rep. 5: 619–628.
54. Porter, J.C., and N. Hogg. 1997. Integrin Cross Talk: Activation of Lymphocyte Function-associated Antigen-1 on Human T Cells Alters α4β1- and α5β1-mediated Function. J. Cell Biol. 138: 1437–1447.
55. May, A.E., F.-J. Neumann, A. Schömig, and K.T. Preissner. 2000. VLA-4 (α4β1) engagement defines a novel activation pathway for β2 integrin–dependent leukocyte adhesion involving the urokinase receptor. Blood. 96: 506–513.
56. Chan, J.R., S.J. Hyduk, and M.I. Cybulsky. 2000. α4β1 Integrin/VCAM-1 Interaction Activates αLβ2 Integrin-Mediated Adhesion to ICAM-1 in Human T Cells. J. Immunol. 164: 746–753.
57. Carman, C.V., and T.A. Springer. 2004. A transmigratory cup in leukocyte diapedesis both through individual vascular endothelial cells and between them. J. Cell Biol. 167: 377–388.
30
SUPPLEMENTAL INFORMATION
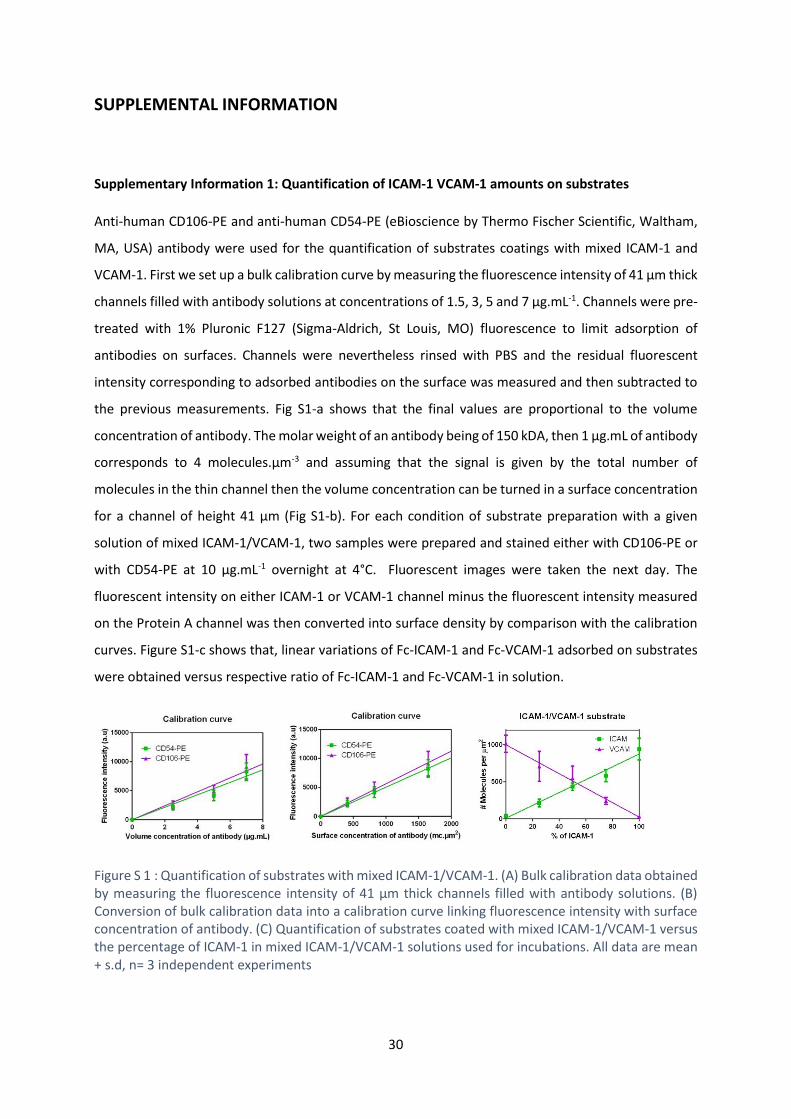
Supplementary Information 1: Quantification of ICAM-1 VCAM-1 amounts on substrates
Anti-human CD106-PE and anti-human CD54-PE (eBioscience by Thermo Fischer Scientific, Waltham,
MA, USA) antibody were used for the quantification of substrates coatings with mixed ICAM-1 and
VCAM-1. First we set up a bulk calibration curve by measuring the fluorescence intensity of 41 µm thick
channels filled with antibody solutions at concentrations of 1.5, 3, 5 and 7 µg.mL-1. Channels were pre-
treated with 1% Pluronic F127 (Sigma-Aldrich, St Louis, MO) fluorescence to limit adsorption of
antibodies on surfaces. Channels were nevertheless rinsed with PBS and the residual fluorescent
intensity corresponding to adsorbed antibodies on the surface was measured and then subtracted to
the previous measurements. Fig S1-a shows that the final values are proportional to the volume
concentration of antibody. The molar weight of an antibody being of 150 kDA, then 1 µg.mL of antibody
corresponds to 4 molecules.µm-3 and assuming that the signal is given by the total number of
molecules in the thin channel then the volume concentration can be turned in a surface concentration
for a channel of height 41 µm (Fig S1-b). For each condition of substrate preparation with a given
solution of mixed ICAM-1/VCAM-1, two samples were prepared and stained either with CD106-PE or
with CD54-PE at 10 µg.mL-1 overnight at 4°C. Fluorescent images were taken the next day. The
fluorescent intensity on either ICAM-1 or VCAM-1 channel minus the fluorescent intensity measured
on the Protein A channel was then converted into surface density by comparison with the calibration
curves. Figure S1-c shows that, linear variations of Fc-ICAM-1 and Fc-VCAM-1 adsorbed on substrates
were obtained versus respective ratio of Fc-ICAM-1 and Fc-VCAM-1 in solution.
Figure S 1 : Quantification of substrates with mixed ICAM-1/VCAM-1. (A) Bulk calibration data obtained by measuring the fluorescence intensity of 41 µm thick channels filled with antibody solutions. (B) Conversion of bulk calibration data into a calibration curve linking fluorescence intensity with surface concentration of antibody. (C) Quantification of substrates coated with mixed ICAM-1/VCAM-1 versus the percentage of ICAM-1 in mixed ICAM-1/VCAM-1 solutions used for incubations. All data are mean + s.d, n= 3 independent experiments

31
Supplementary Information 2: Quantification of LFA-1 and VLA-4 expression on effector T cells.
Quantification LFA-1 and VLA-4 number per cell was performed by quantitative cytometry (Erreur !
Source du renvoi introuvable.) and yielded an average number per cell of 25000 for LFA-1 and 13000
for VLA-4.
A B
Figure S 2 : (A) Calibration curves with the secondary antibody and calibration beads (CellQuant calibrator kit , ref 7208, Biocytex) (B) fluorescence histograms of T cells stained by indirect immunofluorescence with specific monoclonal antibodies (CD49d (HP2/1) for VLA-4, green curve and CD11a (Hi111) for LFA-1, red curve).

32
Supplementary Information 3: Calcium signaling
Figure S 3: Absence of calcium signaling triggered by flow supports absence of mechanotransduction in flow mechanotaxis. Calcium signaling versus onset of flow (left) or addition of ionomycin (right) in cells loaded with Oregon Green 488 BAPTA-1 and crawling on ICAM-1 –top) or VCAM-1 (bottom) substrates.
Supplementary movies (see Biophysical Journal 2020, Volume: 118 Issue: 3 Pages: 565-577)
Movie S1: T cell motility phenotype under flow (8 dyn.cm---2) on ICAM-1 (left) and VCAM-1 (right) substrates. Bright-field images with magnification x10.
Movie S2: T cell motility phenotype under flow (8 dyn.cm-2) on mixed ICAM-1/ VCAM-1 substrates. Transmission images with magnification x10.
Movie S3: T cell motility phenotype under flow (4 dyn.cm-2) on mixed 50 % ICAM-1 / 50 % VCAM-1 substrate. Transmission (left) and RICM (right) images with magnification x63.
Movie S4: Cell front flow focusing on downstream crawling cells in a flow of changing direction. Image sequence of lymphocytes crawling on VCAM-1 coated glass substrate at a shear stress of 8 dyn.cm-2.
33
The yellow arrow indicates the direction of flow, which is from top to bottom in the beginning of the sequence and from left to right in the end. The left panel is representative of cells displaying mostly crawling and the right panel of cells displaying a combination of crawling and rolling. Phase contrast images with magnification x20, one frame acquisition every 2 s.
Movie S5: T cell motility phenotype under flow (8 dyn.cm-2) on ICAM-1 (left) and VCAM-1 (right) substrates. Top: Transmission images with magnification x63. Bottom: RICM images with magnification x63.
Movie S6: Flow triggers no calcium signaling. Relative intracellular calcium levels in crawling lymphocytes without and with flow, on ICAM-1 then VCAM-1 surfaces. Last part of the movie is the control experiment with ionomycin which increases calcium release by increasing the cell membrane permeability.
Movie S7: The level of integrins expression dictates orientation decision. First part of the movie (left) shows that on a mixed substrate 75% ICAM-1 – 25% VCAM-1, cells are mainly crawling upstream. By adding blocking antibody against LFA-1 (TS1/22) and decreasing the ratio LFA-1/ VLA-4, cells are mainly crawling downstream (right). Second part of the movie (left) shows that on a mixed substrate 25% ICAM-1 – 75% VCAM-1, cells are mainly crawling downstream. By adding blocking antibody against VLA-4 (Natalizumab) and decreasing the ratio LFA-1/ VLA-4, cells are mainly crawling upstream (right).

34