bistable structures for energy absorption
TRANSCRIPT
Journal of
Mechanics ofMaterials and Structures
BISTABLE STRUCTURES FOR ENERGY ABSORPTIONII. COMPOSITE STRUCTURES UNDER TENSION
Zachary Whitman and Valeria La Saponara
Volume 2, Nº 2 February 2007
mathematical sciences publishers
JOURNAL OF MECHANICS OF MATERIALS AND STRUCTURESVol. 2, No. 2, 2007
BISTABLE STRUCTURES FOR ENERGY ABSORPTIONII. COMPOSITE STRUCTURES UNDER TENSION
ZACHARY WHITMAN AND VALERIA LA SAPONARA
This paper discusses proof-of-concept experiments of composite bistable structures and is preceded by acompanion paper about metallic bistable structures. A bistable structure is characterized by a stress/straincurve with stable branches separated by unstable branches. We were interested in a particular bistablestructure: one that, once activated, has a second stronger state with the ability to sustain higher loads.This allows for a better distribution of damage, and in addition the structure keeps its integrity for alonger time. Positive results on metallic configurations under tensile loading have prompted us to tryand identify an equivalent composite configuration, able to show directional control of damage throughthis material-driven mechanism. Chain-like configurations with different reinforcements (T-300 carbonfibers, Kevlar® 49, E-glass and Dyneema®), polyurethane foam core and Kevlar stitching were con-ceived, designed, fabricated and investigated. Dyneema prototypes turned out to exhibit the desiredbistable behavior as well as higher energy absorption than their baselines.
1. Introduction
Composites are typically characterized by high strength-to-weight and high stiffness-to-weight ratios,resistance to corrosion, and low magnetic signature. They can be tailored for a specific application.However, they are quite susceptible to delamination due to impact loading, for example, and a reducedload-carrying capacity may arise as a consequence of the impact event. Also, their brittleness is notattractive for applications where ductility, redundancy and high energy absorption are required, as incivil engineering.
Bistable structures for energy absorption were introduced by [Cherkaev and Slepyan 1995]. As dis-cussed in the companion paper [Whitman and La Saponara 2007], the authors were asked to produce aproof-of-concept of these structures. Chain-like configurations were designed, manufactured and testedin tension. They behaved in a bistable manner, had higher energy absorption than the correspondingbaselines, and a controlled type of failure. These results were obtained using metals such as 5052-H32aluminum, C10100 copper and A36 steel.
The concepts of main link, waiting link, percent wait were also discussed, and will be repeated herefor clarity sake. The main link is the part of the structure which is designed to break first. As it does, thestructure does not loose its integrity because of the attached waiting link, which provides a redundantload path. The waiting link becomes active when the attached main link breaks. The interaction of mainlink and waiting link can be tuned so that the structure has the desired behavior. The percent wait is
Keywords: composite, energy absorption, bistable, Dyneema.This paper is based upon work supported by the Army Research Office (grant ARO No. 41363-MA) and the National ScienceFoundation (grant CMMI-0621696, formerly CMS-0409514). Any opinions, findings, and conclusions or recommendationsexpressed in this material are those of the authors and do not necessarily reflect the views of the National Science Foundation.
359
360 ZACHARY WHITMAN AND VALERIA LA SAPONARA
the percent difference in waiting link length with respect to the attached main link length. It should beequal to the elongation to failure of the main link, however, the nonlinear behavior of the waiting linkshows that this is not the case, and further tune-up of the percent wait is required for this material-drivenmechanism to work.
Here we investigate structural configurations made with composite materials. The goal is, once again,to have a progressive failure where parts of the structure become active after a trigger damage event hasoccurred, and the damaged structure can carry a higher load with respect to its undamaged state and,more importantly, absorb more energy than its baseline. To the best of our knowledge, this study isnovel.
2. Design and manufacturing
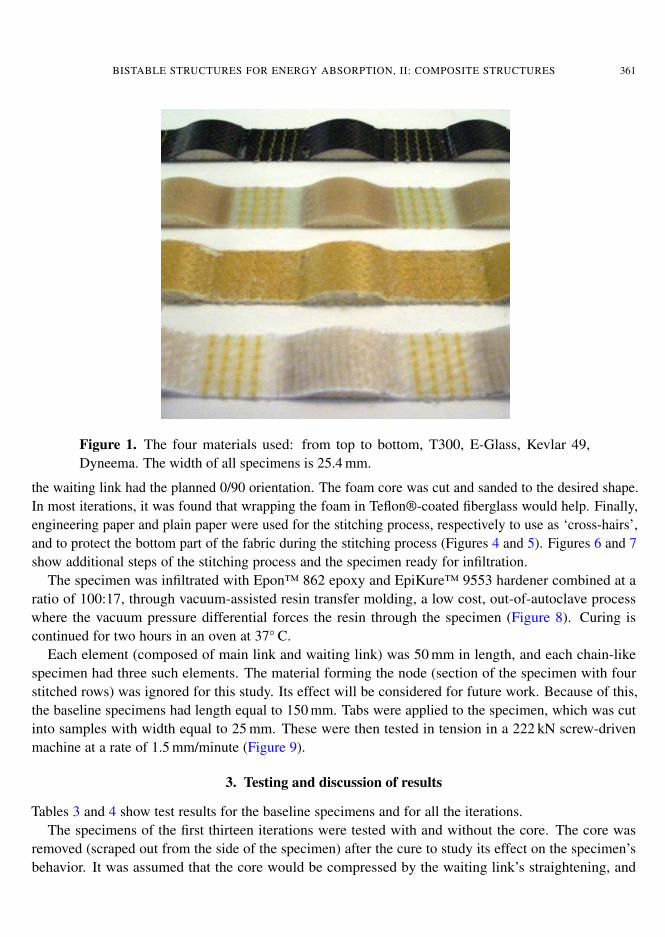
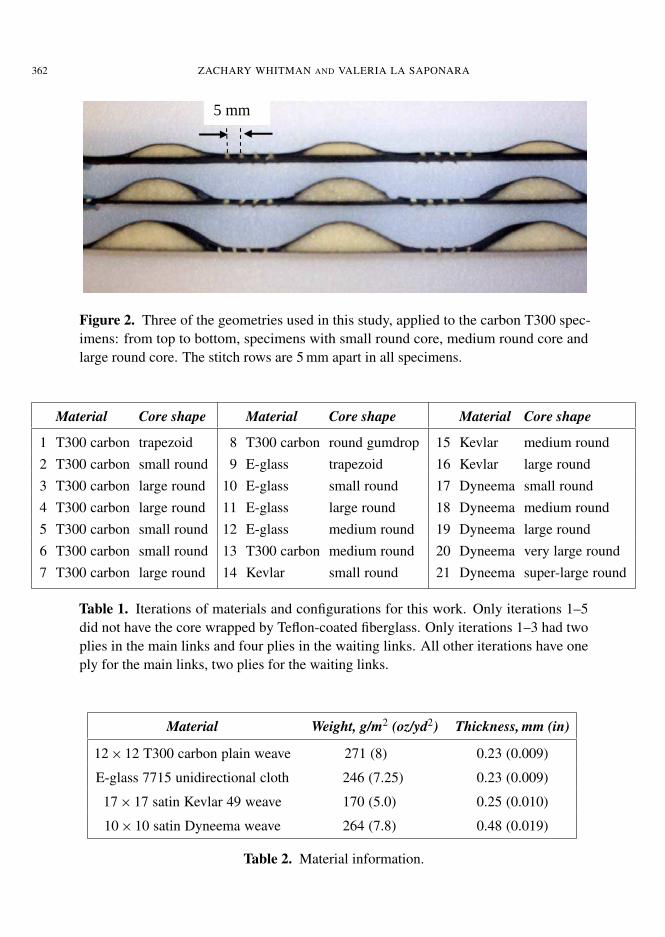
A variety of geometric configurations and percent waits was designed and manufactured with a waitinglink that tried to mimic the curved waiting link present in the metallic configurations [Whitman andLa Saponara 2007]. There were twenty-one iterations of this process (Table 1): nine had 12 × 12 plainweave1 T300 carbon from Toray Industries Inc., four used E-glass 7715 unidirectional cloth, three had a17 × 17 satin Kevlar® 49 type 285 weave, and five utilized a 10 × 10 satin weave made with Dyneema®,a polyethylene fiber donated by DSM Corporation. Figure 1 shows the four materials tested, Figure 2three of the geometries used (‘small round core’, ‘medium round core’ and ‘large round core’).
The weight and thickness of the fabrics are given in Table 2. The first three fabrics have almost thesame thickness, and Dyneema is almost twice as thick — as mentioned, this material was donated. Note,however, that Dyneema’s weight is very similar to T300 carbon’s, so one may extrapolate a comparisonof specific energy absorptions.
Each ‘chain’ has three elements. This number was chosen because the metallic 5052-H32 aluminumbistable chains with three elements had a consistent increase in energy absorption of about 30% withrespect to the baseline, and three elements were adopted as starting point of the research on compositebistable structures [Whitman and La Saponara 2007].
In addition to the reinforcement fabrics mentioned above, the following materials were used:
(a) Last-a-Foam 6704 core, with density 64 kg/m3 (4 lbs/ft3). This is a closed cell polyurethane foamwhich is quite easy to cut (with a knife — not with hot wire, which will melt the foam), shape andmachine (see Figure 3).
(b) Kevlar 29 thread. As a main link break, the entire structure is subject to a shock. To reduce thechances of delamination, stitching was deemed necessary. The Kevlar 29 has shown to have theappropriate strength for the job, while being flexible enough to go through parts of the Consewsewing machine available.
The manufacturing process is similar for all configurations, and will be discussed here, with the aid ofpictures representing one of the fabrics, Dyneema. A 152 mm wide × 406 mm long piece of fabric wascut, which is the minimum size that guarantees three elements. Most iterations required two plies forthe waiting link and one for the main link (Table 1). The size of the cuts also fit in the 355 mm diameterquilting hoop required to hold the bottom ply (for the main link) tight, and to ensure that the plies forming
112 × 12 means that there are 12 bundles in the warp direction and 12 bundles in the fill direction.
BISTABLE STRUCTURES FOR ENERGY ABSORPTION, II: COMPOSITE STRUCTURES 361
Figure 1. The four materials used: from top to bottom, T300, E-Glass, Kevlar 49,Dyneema. The width of all specimens is 25.4 mm.
the waiting link had the planned 0/90 orientation. The foam core was cut and sanded to the desired shape.In most iterations, it was found that wrapping the foam in Teflon®-coated fiberglass would help. Finally,engineering paper and plain paper were used for the stitching process, respectively to use as ‘cross-hairs’,and to protect the bottom part of the fabric during the stitching process (Figures 4 and 5). Figures 6 and 7show additional steps of the stitching process and the specimen ready for infiltration.
The specimen was infiltrated with Epon™ 862 epoxy and EpiKure™ 9553 hardener combined at aratio of 100:17, through vacuum-assisted resin transfer molding, a low cost, out-of-autoclave processwhere the vacuum pressure differential forces the resin through the specimen (Figure 8). Curing iscontinued for two hours in an oven at 37◦ C.
Each element (composed of main link and waiting link) was 50 mm in length, and each chain-likespecimen had three such elements. The material forming the node (section of the specimen with fourstitched rows) was ignored for this study. Its effect will be considered for future work. Because of this,the baseline specimens had length equal to 150 mm. Tabs were applied to the specimen, which was cutinto samples with width equal to 25 mm. These were then tested in tension in a 222 kN screw-drivenmachine at a rate of 1.5 mm/minute (Figure 9).
3. Testing and discussion of results
Tables 3 and 4 show test results for the baseline specimens and for all the iterations.The specimens of the first thirteen iterations were tested with and without the core. The core was
removed (scraped out from the side of the specimen) after the cure to study its effect on the specimen’sbehavior. It was assumed that the core would be compressed by the waiting link’s straightening, and
362 ZACHARY WHITMAN AND VALERIA LA SAPONARA
5 mm
Figure 2. Three of the geometries used in this study, applied to the carbon T300 spec-imens: from top to bottom, specimens with small round core, medium round core andlarge round core. The stitch rows are 5 mm apart in all specimens.
Material Core shape Material Core shape Material Core shape
1 T300 carbon trapezoid 8 T300 carbon round gumdrop 15 Kevlar medium round2 T300 carbon small round 9 E-glass trapezoid 16 Kevlar large round3 T300 carbon large round 10 E-glass small round 17 Dyneema small round4 T300 carbon large round 11 E-glass large round 18 Dyneema medium round5 T300 carbon small round 12 E-glass medium round 19 Dyneema large round6 T300 carbon small round 13 T300 carbon medium round 20 Dyneema very large round7 T300 carbon large round 14 Kevlar small round 21 Dyneema super-large round
Table 1. Iterations of materials and configurations for this work. Only iterations 1–5did not have the core wrapped by Teflon-coated fiberglass. Only iterations 1–3 had twoplies in the main links and four plies in the waiting links. All other iterations have oneply for the main links, two plies for the waiting links.
Material Weight, g/m2 (oz/yd2) Thickness, mm (in)
12 × 12 T300 carbon plain weave 271 (8) 0.23 (0.009)
E-glass 7715 unidirectional cloth 246 (7.25) 0.23 (0.009)
17 × 17 satin Kevlar 49 weave 170 (5.0) 0.25 (0.010)
10 × 10 satin Dyneema weave 264 (7.8) 0.48 (0.019)
Table 2. Material information.

BISTABLE STRUCTURES FOR ENERGY ABSORPTION, II: COMPOSITE STRUCTURES 363
that it would push the main link out of plane, thus causing premature failure. Removing the core gavemixed results: in some cases, the specimen was damaged, in others the energy absorption grew with coreremoval; sometimes, the load/displacement curve was bistable, but in other cases, this did not happen.This inconsistency made us decide to stop the core removal for the last eight iterations.
Among the specimens, the percent wait varied from as little as 3.9% (iteration 2) to as high as 34%(iteration 21). The number of specimens per configuration varied between two (one with core, onewithout) to three (with core), depending on the success of the configuration. While such numbers ofspecimens may not give statistically significant results, we feel that this paper addresses a wide variety ofdifferent issues, and the paper gives qualitative results that may be indicative of the general performanceof the structures.
Table 5 illustrates the energies of the round core configurations (small round, medium round and largeround for the four materials, plus additional iterations for the Dyneema). These are given in terms ofthe baselines. Dyneema was the only material that exhibited consistent higher energy absorption withrespect to its baseline, as will be discussed later in this paper. The E-glass and the Dyneema were theonly materials where the damaged state was stronger than the undamaged state, as indicated by boldnumbers in Table 5.
In the T300, Kevlar and E-glass cases, it is easy to extrapolate that the energy associated to the bistablespecimens, calculated as the area under the curve, is significantly less than for the baselines (the numbers
Time sequence
Figure 3. Steps in the process of shaping the foam core for the specimens. From rightto left: original core; intermediate stage, where the core was cut with a sharp box knife;final stage, where the core has been sanded to the shape on the left. The process wasquite reliable and repeatable.
Reinforcement material T300 carbon E-glass Kevlar DyneemaEnergy of baseline (J) 14.9 ± 1.0 39.1 ± 0.8 20.2 ± 0.5 55.5 ± 7.2
Table 3. Energy of baseline specimens for each reinforcement used. Three specimenswere tested for each material. Data shown is mean ± one standard deviation.
364 ZACHARY WHITMAN AND VALERIA LA SAPONARA
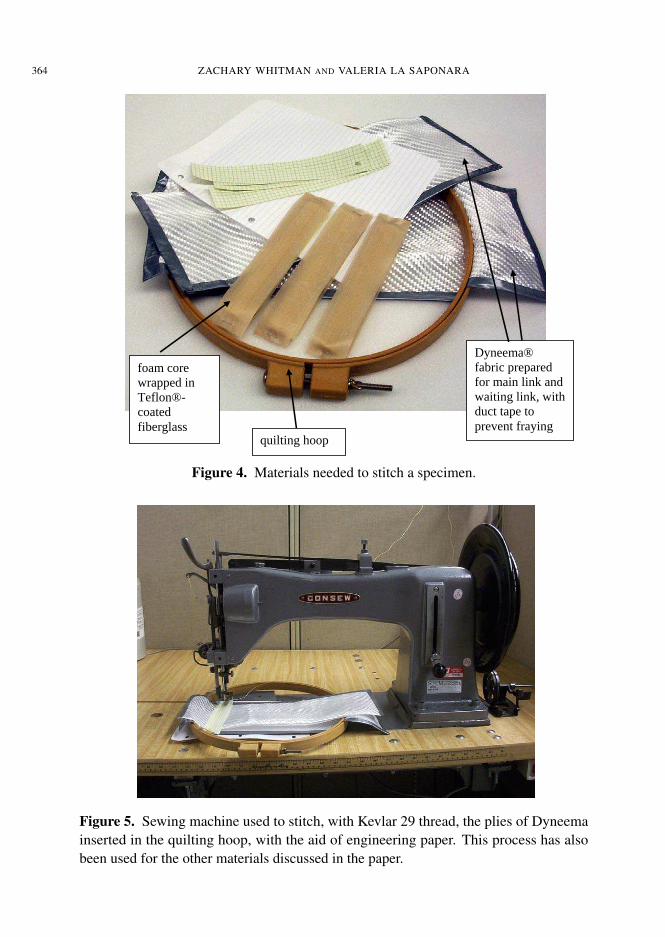
foam core wrapped in Teflon®-coated fiberglass
Dyneema® fabric prepared for main link and waiting link, with duct tape to prevent fraying
quilting hoop
Figure 4. Materials needed to stitch a specimen.
Figure 5. Sewing machine used to stitch, with Kevlar 29 thread, the plies of Dyneemainserted in the quilting hoop, with the aid of engineering paper. This process has alsobeen used for the other materials discussed in the paper.
BISTABLE STRUCTURES FOR ENERGY ABSORPTION, II: COMPOSITE STRUCTURES 365
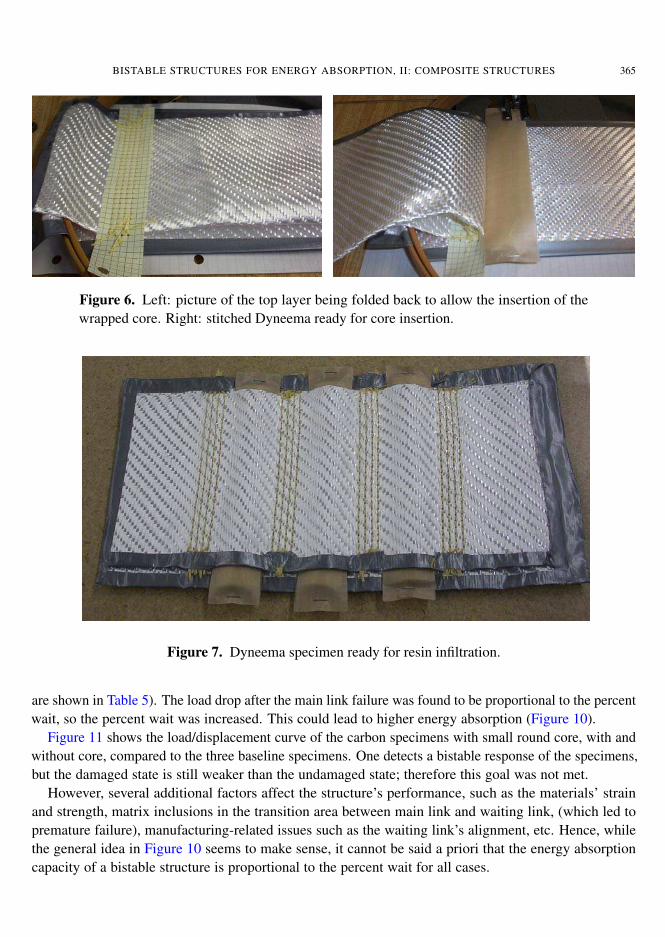
Figure 6. Left: picture of the top layer being folded back to allow the insertion of thewrapped core. Right: stitched Dyneema ready for core insertion.
Figure 7. Dyneema specimen ready for resin infiltration.
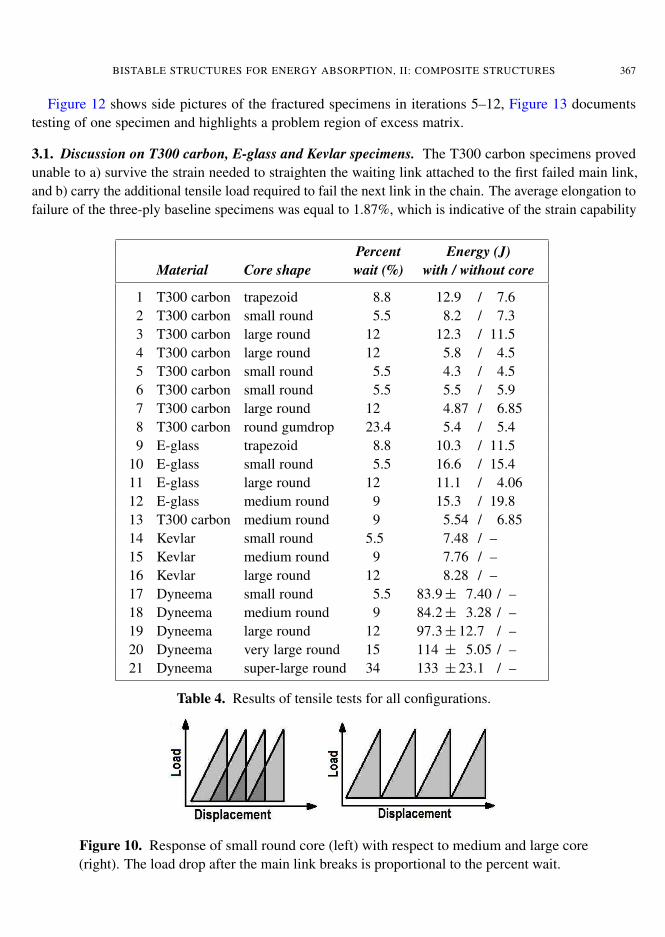
are shown in Table 5). The load drop after the main link failure was found to be proportional to the percentwait, so the percent wait was increased. This could lead to higher energy absorption (Figure 10).
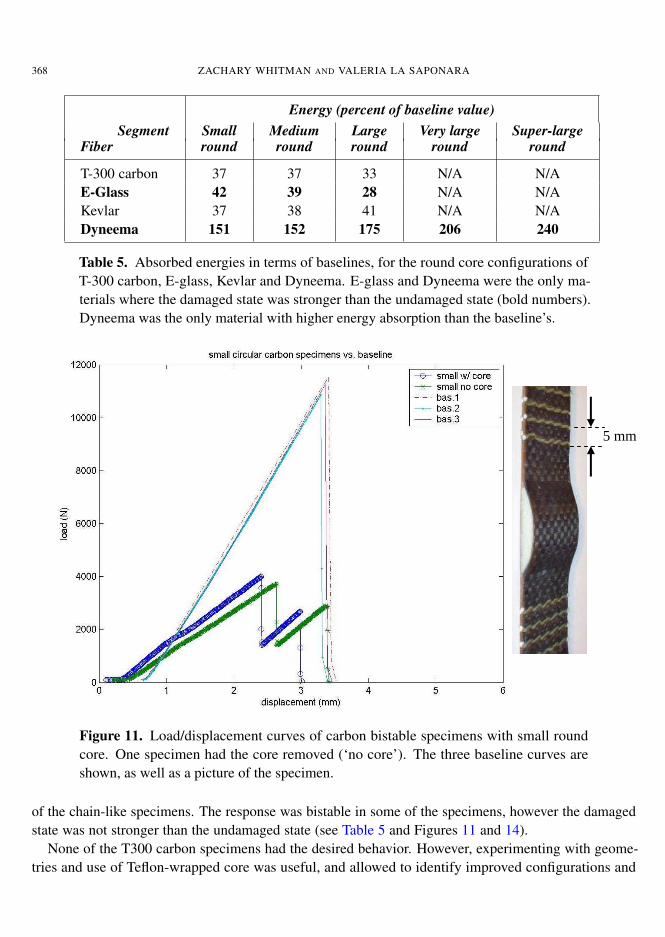
Figure 11 shows the load/displacement curve of the carbon specimens with small round core, with andwithout core, compared to the three baseline specimens. One detects a bistable response of the specimens,but the damaged state is still weaker than the undamaged state; therefore this goal was not met.
However, several additional factors affect the structure’s performance, such as the materials’ strainand strength, matrix inclusions in the transition area between main link and waiting link, (which led topremature failure), manufacturing-related issues such as the waiting link’s alignment, etc. Hence, whilethe general idea in Figure 10 seems to make sense, it cannot be said a priori that the energy absorptioncapacity of a bistable structure is proportional to the percent wait for all cases.
366 ZACHARY WHITMAN AND VALERIA LA SAPONARA
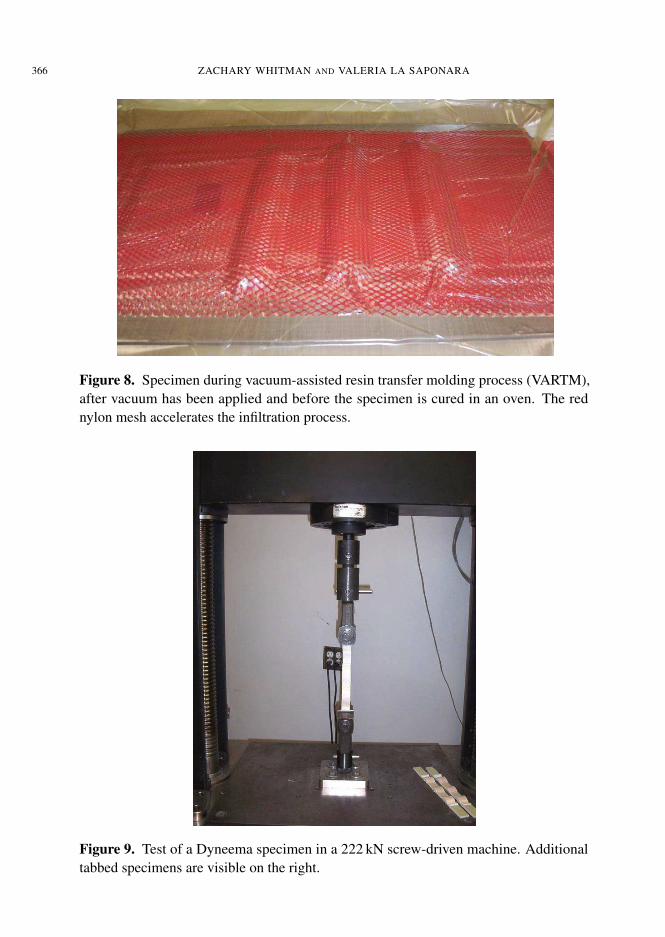
Figure 8. Specimen during vacuum-assisted resin transfer molding process (VARTM),after vacuum has been applied and before the specimen is cured in an oven. The rednylon mesh accelerates the infiltration process.
Figure 9. Test of a Dyneema specimen in a 222 kN screw-driven machine. Additionaltabbed specimens are visible on the right.
BISTABLE STRUCTURES FOR ENERGY ABSORPTION, II: COMPOSITE STRUCTURES 367
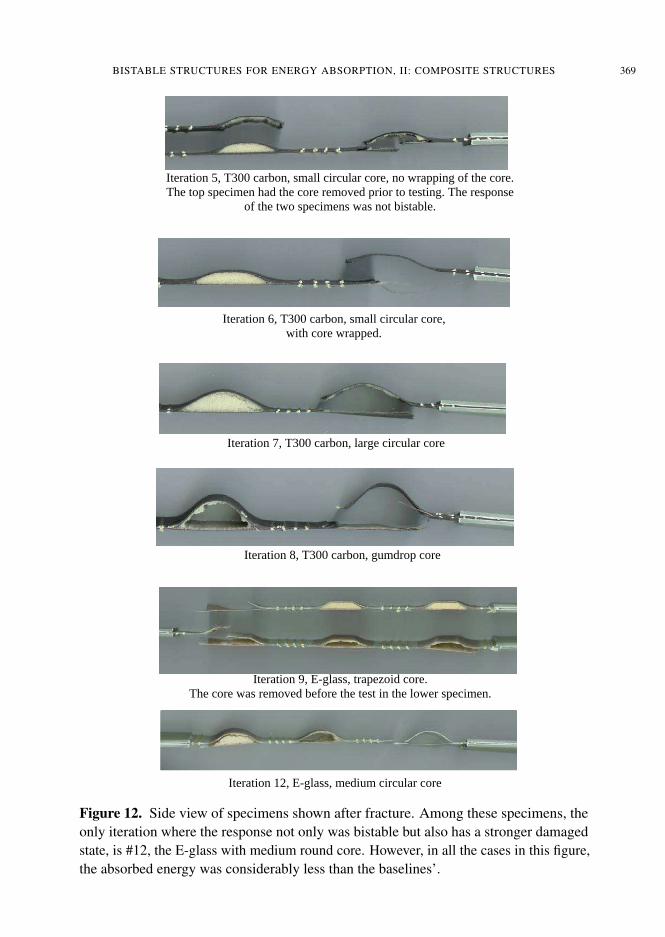
Figure 12 shows side pictures of the fractured specimens in iterations 5–12, Figure 13 documentstesting of one specimen and highlights a problem region of excess matrix.
3.1. Discussion on T300 carbon, E-glass and Kevlar specimens. The T300 carbon specimens provedunable to a) survive the strain needed to straighten the waiting link attached to the first failed main link,and b) carry the additional tensile load required to fail the next link in the chain. The average elongation tofailure of the three-ply baseline specimens was equal to 1.87%, which is indicative of the strain capability
Percent Energy (J)Material Core shape wait (%) with / without core
1 T300 carbon trapezoid 8.8 12.9 / 7.62 T300 carbon small round 5.5 8.2 / 7.33 T300 carbon large round 12 12.3 / 11.54 T300 carbon large round 12 5.8 / 4.55 T300 carbon small round 5.5 4.3 / 4.56 T300 carbon small round 5.5 5.5 / 5.97 T300 carbon large round 12 4.87 / 6.858 T300 carbon round gumdrop 23.4 5.4 / 5.49 E-glass trapezoid 8.8 10.3 / 11.5
10 E-glass small round 5.5 16.6 / 15.411 E-glass large round 12 11.1 / 4.0612 E-glass medium round 9 15.3 / 19.813 T300 carbon medium round 9 5.54 / 6.8514 Kevlar small round 5.5 7.48 / –15 Kevlar medium round 9 7.76 / –16 Kevlar large round 12 8.28 / –17 Dyneema small round 5.5 83.9 ± 7.40 / –18 Dyneema medium round 9 84.2 ± 3.28 / –19 Dyneema large round 12 97.3 ± 12.7 / –20 Dyneema very large round 15 114 ± 5.05 / –21 Dyneema super-large round 34 133 ± 23.1 / –
Table 4. Results of tensile tests for all configurations.
Figure 10. Response of small round core (left) with respect to medium and large core(right). The load drop after the main link breaks is proportional to the percent wait.
368 ZACHARY WHITMAN AND VALERIA LA SAPONARA
Energy (percent of baseline value)Segment Small Medium Large Very large Super-large
Fiber round round round round round
T-300 carbon 37 37 33 N/A N/AE-Glass 42 39 28 N/A N/AKevlar 37 38 41 N/A N/ADyneema 151 152 175 206 240
Table 5. Absorbed energies in terms of baselines, for the round core configurations ofT-300 carbon, E-glass, Kevlar and Dyneema. E-glass and Dyneema were the only ma-terials where the damaged state was stronger than the undamaged state (bold numbers).Dyneema was the only material with higher energy absorption than the baseline’s.
5 mm
Figure 11. Load/displacement curves of carbon bistable specimens with small roundcore. One specimen had the core removed (‘no core’). The three baseline curves areshown, as well as a picture of the specimen.
of the chain-like specimens. The response was bistable in some of the specimens, however the damagedstate was not stronger than the undamaged state (see Table 5 and Figures 11 and 14).
None of the T300 carbon specimens had the desired behavior. However, experimenting with geome-tries and use of Teflon-wrapped core was useful, and allowed to identify improved configurations and
BISTABLE STRUCTURES FOR ENERGY ABSORPTION, II: COMPOSITE STRUCTURES 369
Iteration 5, T300 carbon, small circular core, no wrapping of the core. The top specimen had the core removed prior to testing. The response
of the two specimens was not bistable.
Iteration 6, T300 carbon, small circular core, with core wrapped.
Iteration 7, T300 carbon, large circular core
Iteration 8, T300 carbon, gumdrop core
Iteration 9, E-glass, trapezoid core. The core was removed before the test in the lower specimen.
Iteration 12, E-glass, medium circular core
Figure 12. Side view of specimens shown after fracture. Among these specimens, theonly iteration where the response not only was bistable but also has a stronger damagedstate, is #12, the E-glass with medium round core. However, in all the cases in this figure,the absorbed energy was considerably less than the baselines’.
370 ZACHARY WHITMAN AND VALERIA LA SAPONARA
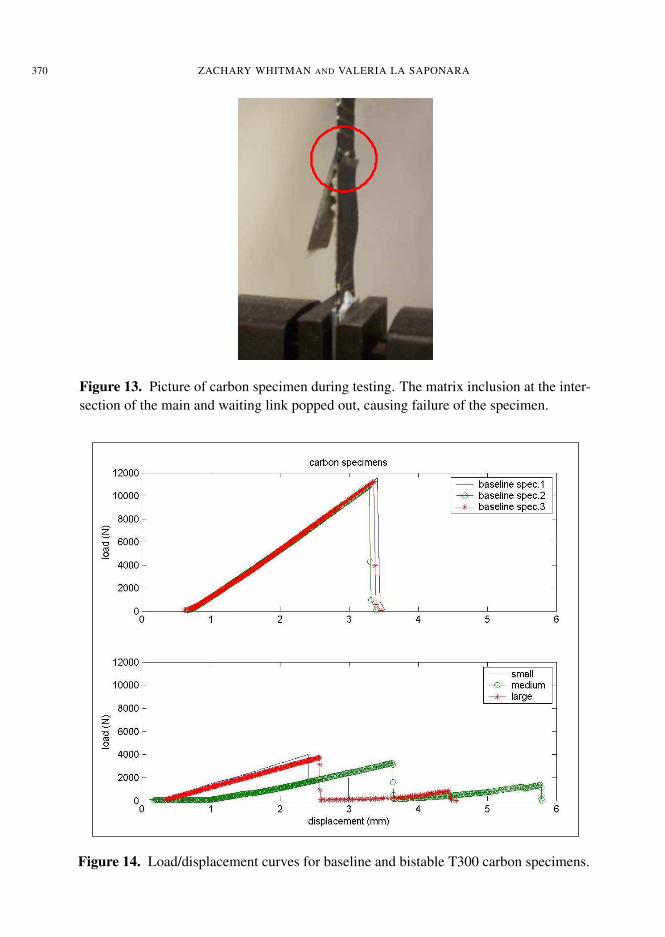
Figure 13. Picture of carbon specimen during testing. The matrix inclusion at the inter-section of the main and waiting link popped out, causing failure of the specimen.
Figure 14. Load/displacement curves for baseline and bistable T300 carbon specimens.
BISTABLE STRUCTURES FOR ENERGY ABSORPTION, II: COMPOSITE STRUCTURES 371
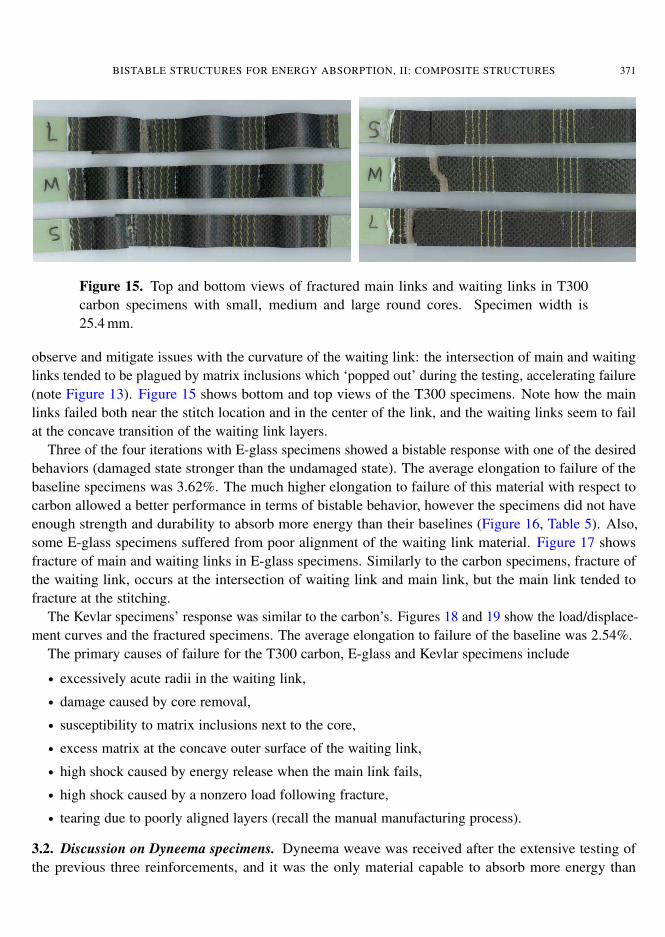
Figure 15. Top and bottom views of fractured main links and waiting links in T300carbon specimens with small, medium and large round cores. Specimen width is25.4 mm.
observe and mitigate issues with the curvature of the waiting link: the intersection of main and waitinglinks tended to be plagued by matrix inclusions which ‘popped out’ during the testing, accelerating failure(note Figure 13). Figure 15 shows bottom and top views of the T300 specimens. Note how the mainlinks failed both near the stitch location and in the center of the link, and the waiting links seem to failat the concave transition of the waiting link layers.
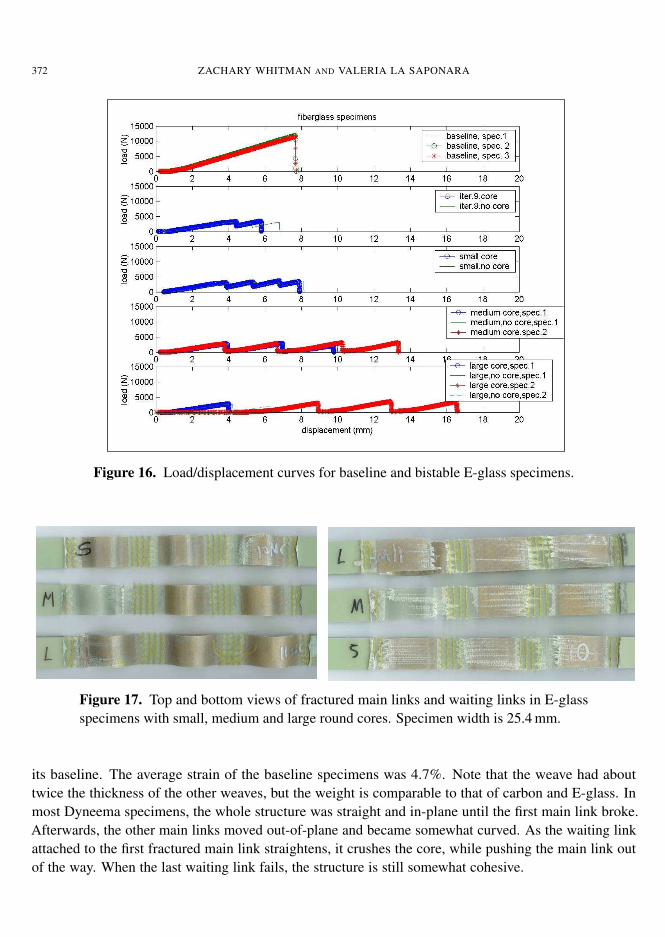
Three of the four iterations with E-glass specimens showed a bistable response with one of the desiredbehaviors (damaged state stronger than the undamaged state). The average elongation to failure of thebaseline specimens was 3.62%. The much higher elongation to failure of this material with respect tocarbon allowed a better performance in terms of bistable behavior, however the specimens did not haveenough strength and durability to absorb more energy than their baselines (Figure 16, Table 5). Also,some E-glass specimens suffered from poor alignment of the waiting link material. Figure 17 showsfracture of main and waiting links in E-glass specimens. Similarly to the carbon specimens, fracture ofthe waiting link, occurs at the intersection of waiting link and main link, but the main link tended tofracture at the stitching.
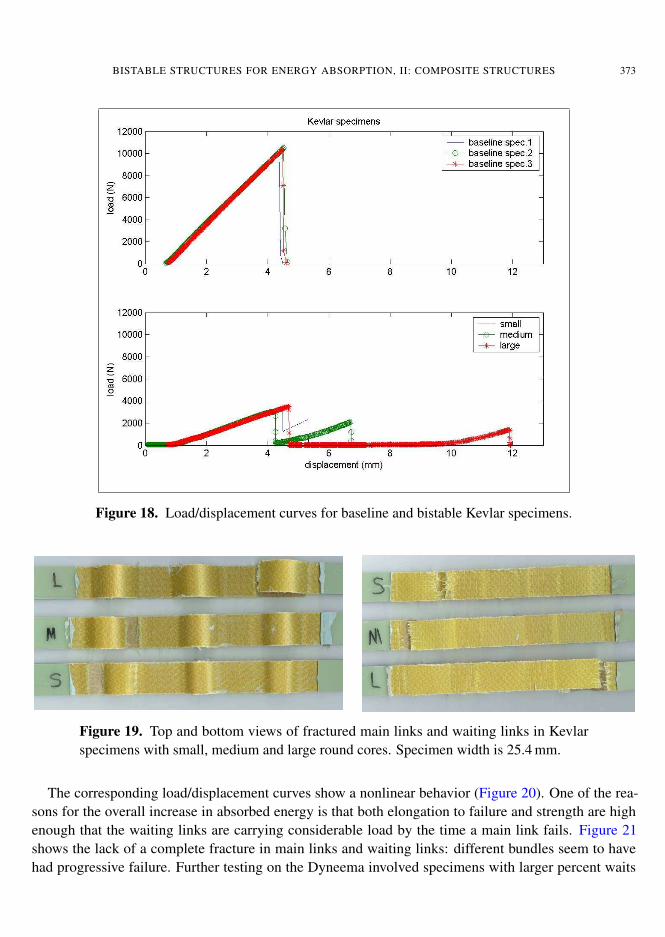
The Kevlar specimens’ response was similar to the carbon’s. Figures 18 and 19 show the load/displace-ment curves and the fractured specimens. The average elongation to failure of the baseline was 2.54%.
The primary causes of failure for the T300 carbon, E-glass and Kevlar specimens include
• excessively acute radii in the waiting link,
• damage caused by core removal,
• susceptibility to matrix inclusions next to the core,
• excess matrix at the concave outer surface of the waiting link,
• high shock caused by energy release when the main link fails,
• high shock caused by a nonzero load following fracture,
• tearing due to poorly aligned layers (recall the manual manufacturing process).
3.2. Discussion on Dyneema specimens. Dyneema weave was received after the extensive testing ofthe previous three reinforcements, and it was the only material capable to absorb more energy than
372 ZACHARY WHITMAN AND VALERIA LA SAPONARA
Figure 16. Load/displacement curves for baseline and bistable E-glass specimens.
Fracture of the waiting links of E-glass in specimens Figure 17. Top and bottom views of fractured main links and waiting links in E-glassspecimens with small, medium and large round cores. Specimen width is 25.4 mm.
its baseline. The average strain of the baseline specimens was 4.7%. Note that the weave had abouttwice the thickness of the other weaves, but the weight is comparable to that of carbon and E-glass. Inmost Dyneema specimens, the whole structure was straight and in-plane until the first main link broke.Afterwards, the other main links moved out-of-plane and became somewhat curved. As the waiting linkattached to the first fractured main link straightens, it crushes the core, while pushing the main link outof the way. When the last waiting link fails, the structure is still somewhat cohesive.
BISTABLE STRUCTURES FOR ENERGY ABSORPTION, II: COMPOSITE STRUCTURES 373
Figure 18. Load/displacement curves for baseline and bistable Kevlar specimens.
Figure 19. Top and bottom views of fractured main links and waiting links in Kevlarspecimens with small, medium and large round cores. Specimen width is 25.4 mm.
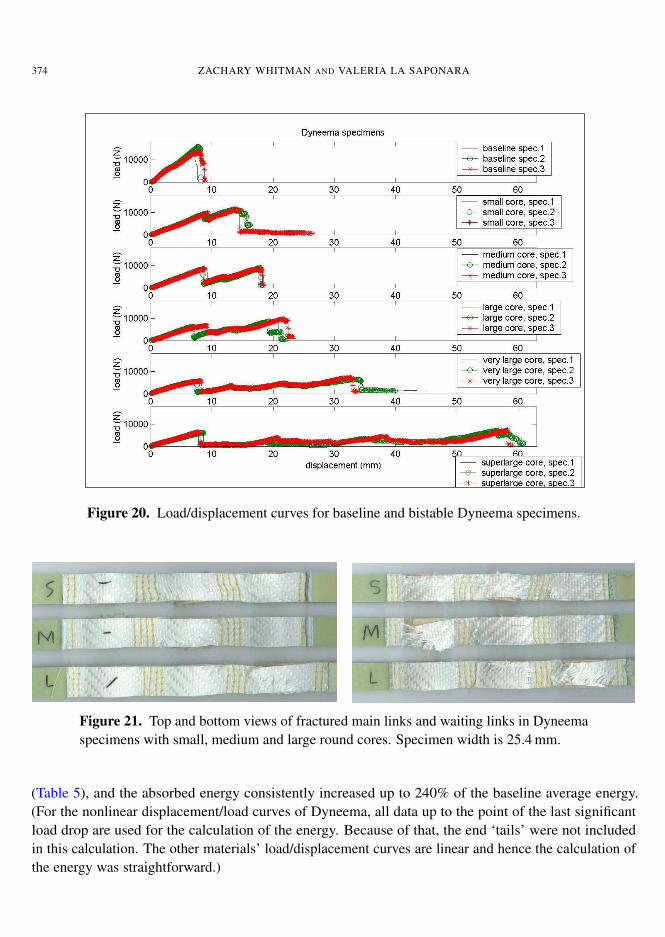
The corresponding load/displacement curves show a nonlinear behavior (Figure 20). One of the rea-sons for the overall increase in absorbed energy is that both elongation to failure and strength are highenough that the waiting links are carrying considerable load by the time a main link fails. Figure 21shows the lack of a complete fracture in main links and waiting links: different bundles seem to havehad progressive failure. Further testing on the Dyneema involved specimens with larger percent waits
374 ZACHARY WHITMAN AND VALERIA LA SAPONARA
Figure 20. Load/displacement curves for baseline and bistable Dyneema specimens.
Fracture of the main links of Dyneema® in
Figure 21. Top and bottom views of fractured main links and waiting links in Dyneemaspecimens with small, medium and large round cores. Specimen width is 25.4 mm.
(Table 5), and the absorbed energy consistently increased up to 240% of the baseline average energy.(For the nonlinear displacement/load curves of Dyneema, all data up to the point of the last significantload drop are used for the calculation of the energy. Because of that, the end ‘tails’ were not includedin this calculation. The other materials’ load/displacement curves are linear and hence the calculation ofthe energy was straightforward.)
BISTABLE STRUCTURES FOR ENERGY ABSORPTION, II: COMPOSITE STRUCTURES 375
4. Additional observations
Further experiments considered the effect of node composition (i.e. number of stitch rows), elementlength, and number of elements in a chain. These experiments were carried out on E-glass, the secondbest material, because the batch of Dyneema had been completely used. Current commercial demandsmake Dyneema very difficult to obtain for research purposes. However, we hope that it will be possibleto complete this study in the future when supplies do come available.
5. Summary and conclusions
This paper discussed the design, manufacturing and testing of composite bistable structures, with the goalof obtaining a) a bistable load/displacement curve which also exhibited a damaged state which higher loadcarrying capability than the undamaged state, b) higher energy absorption than the traditional laminate-type baselines. Twenty-one different configurations and four materials (T300 carbon, E-glass, Kevlar andDyneema) were tested in quasistatic tension. Of the four materials, E-glass and Dyneema satisfied thefirst requirement, but only Dyneema was able to demonstrate a noticeable increase of energy absorptionwith respect to its baseline. Positive results could be obtained with other configurations of T300 carbonand Kevlar outside those designed in this paper.
This material-based mechanism is very affected by quality of manufacturing, local behavior (i.e. ma-trix inclusions), elongation to failure, strength, percent wait, node composition, element length. This firststudy on composite bistable structures under tension shows that they may offer a considerable increase ofenergy absorption and fail-safe fracture, which could affect the design of composites for all applicationswhere crashworthiness and redundancy are critical aspects of the design.
Acknowledgments
We thank Dr. Andrej Cherkaev and Dr. Elena Cherkaev, Department of Mathematics, University of Utah,for their collaboration, and Dr. Martin Van Es, DSM Corporation, for the donation of Dyneema®.
The work of this paper was performed while Whitman was an M.S. student in the Department ofMechanical Engineering, University of Utah. The experimental work was conducted in the Strength ofMaterials Lab and in the Composite Manufacturing Lab of that department.
References
[Cherkaev and Slepyan 1995] A. Cherkaev and L. Slepyan, “Waiting element structures and stability under extension”, Int. J.Damage Mec. 4:1 (1995), 58–82.
[Whitman and La Saponara 2007] Z. Whitman and V. La Saponara, “Bistable structures for energy absorption, I: metallicstructures under tension”, J. Mech. Mater. Struct. 2:2 (2007), 347–358.
Received 30 May 2006. Accepted 26 Sep 2006.
ZACHARY WHITMAN: [email protected] Research Institute
VALERIA LA SAPONARA: [email protected] of Mechanical and Aeronautical Engineering, One Shields Ave, University of California, Davis, CA 95616-5294,United States

376 ZACHARY WHITMAN AND VALERIA LA SAPONARA
http://mae.ucdavis.edu/vlasaponara/