state diagrams for improving processing and … diagrams for improving processing and storage of...
TRANSCRIPT
1567
Pure Appl. Chem., Vol. 83, No. 8, pp. 1567–1617, 2011.doi:10.1351/PAC-REP-10-07-02© 2011 IUPAC, Publication date (Web): 7 March 2011
State diagrams for improving processing andstorage of foods, biological materials, andpharmaceuticals (IUPAC Technical Report)*
Maria Pilar Buera1,‡, Yrjö Roos2, Harry Levine3, Louise Slade3,Horacio R. Corti1, David S. Reid4, Tony Auffret5, andC. Austen Angell6
1Facultad de Ciencias Exactas y Naturales, Universidad de Buenos Aires, Int.Cantilo s/n. Pabellón II Ciudad Universitaria, Buenos Aires, Argentina; 2School ofFood and Nutritional Sciences, University College, Cork, Ireland; 3Food PolymerScience Consultancy (retired from Cereal Science, Kraft-Nabisco) Morris Plains,NJ 07950, USA; 4Department of Food Science and Technology, University ofCalifornia at Davis, 1 Shields Avenue, Davis, CA 95616-8571, USA; 5taPrimeConsulting, Sandwich, Kent, CT13 9JA, UK; 6Department of Chemistry, ArizonaState University, Tempe, AZ 85287, USA
Abstract: Supplemented temperature/composition phase diagrams include the non-equilib-rium glass-transition temperature (Tg) curve and equilibrium ice-melting and solubilitycurves. The inclusion of the non-equilibrium curve allows one to establish relationships withthe time coordinate and, thus, with the dynamic behavior of systems, provided that the ther-mal history of such systems is known.
The objective of this report is to contribute to the potential applications of supple-mented state diagrams for aqueous glass-formers, in order to describe the influence of watercontent, nature of vitrifying agents, and temperature on the physico-chemical properties offoods and biological and pharmaceutical products. These data are helpful to develop formu-lations, processing strategies, or storage procedures in order to optimize the stability of foodingredients and pharmaceutical formulations. Reported experimental data on phase and statetransitions for several food and pharmaceutical systems were analyzed. Some methodologi-cal aspects and the effect of phase and state transitions on the main potential chemical reac-tions that can alter those systems during processing and/or storage are discussed.
Keywords: biomolecules; glass transition; IUPAC Physical and Biophysical ChemistryDivision; phase/state diagrams; reaction rates.
CONTENTS
1. INTRODUCTION2. PHASE DIAGRAMS AND PROCESSING TECHNOLOGIES
2.1 Supplemented phase diagrams2.2 The freezing process: Ice crystallization and the cryoconcentrated matrix2.3 Glass formation: Drying and vitrification2.4 Lyophilization: Freezing and drying
*Sponsoring body: IUPAC Physical and Biophysical Chemistry Division: see more details on page 1610.‡Corresponding author: E-mail: [email protected]
3. PHASE TRANSITIONS AND THE STABILITY OF PROCESSED SYSTEMS3.1 Physical changes
3.1.1 Collapse, stickiness, and caking3.1.2 Crystallization of amorphous components
3.2. Protein stability3.2.1 Freezing-induced damage3.2.2 Changes upon storage of glassy formulations3.2.3 Consequences of the presence of salts on the protective effect of sugars
3.3 Maillard reaction3.4 Degradation of encapsulated hydrophobic components3.5 Structural effects related to chemical stability
4. PRACTICAL ASPECTS4.1 Food systems
4.1.1 Fruit and vegetable tissues4.1.2 Dairy products4.1.3 Cereal products4.1.4 Sugar confectionery4.1.5 Animal tissues
4.2 Pharmaceutical systems5. METHODOLOGY
5.1 Glass-transition curve5.2 Tg dependence on water content: The Gordon–Taylor equation5.3 The wg', Tg' point5.4 Dynamic changes in the supercooled region
5.4.1 Sugar crystallization5.4.2 Crystallization kinetics
5.5 Water and solids molecular dynamics using time-domain NMR6. NON-EQUILIBRIUM PHASE TRANSITIONS AND LIVING ORGANISMS
6.1 Anhydrobiotic organisms6.2 The problem of recalcitrant seeds6.3 Survival in frozen environments
7. FUTURE PROSPECTS8. CONCLUDING REMARKS
MEMBERSHIP OF SPONSORING BODYACKNOWLEDGMENTSREFERENCES
1. INTRODUCTION
Many components of foods, pharmaceuticals, and preserved biological materials do not exist in athermo dynamically stable condition. Thus, the conservation of their desirable properties is governed bykinetic constraints, often by their maintenance in an amorphous state. The removal of water, either bydrying or freezing, induces a supersaturation of aqueous systems, leading to an increase in the cohesiveforces between molecules and to constraint in the restriction of their mobility. The implications of glassformation and glass transitions in food technology have been extensively analyzed since the pioneeringwork by Slade and Levine in the 1980s [1–22], based on a polymer science approach. Subsequentadvances in the area of preservation mechanisms of living organisms under extreme conditions, and inthe conservation of therapeutic proteins [23] promoted the study of sugar and polyol properties in rela-tion to their protective effects on labile biomolecules [24–28]. Fundamental research was then focusedon dynamic aspects, related to the glass-forming properties of sugars and biopolymers, and on molec-
M. P. BUERA et al.
© 2011, IUPAC Pure Appl. Chem., Vol. 83, No. 8, pp. 1567–1617, 2011
1568

ular interactions that polyhydroxy compounds are able to undergo. Supplemented temperature/compo-sition phase diagrams have been demonstrated to be helpful in determining the feasibility of occurrenceof phase/state transitions [1–11]. These diagrams include the non-equilibrium glass-transition temper-ature (Tg) and equilibrium ice-melting and solubility curves. The inclusion of the non-equilibrium curveallows one to establish relationships with the time coordinate and, thus, with the dynamic behavior ofsystems, if the previous state of the sample is known.
In the first part of our report [29], the basic principles for determining the main curves that definesupplemented phase diagrams were described. The objective of this second part is to contribute to thepotential applications of supplemented state diagrams for aqueous glass-formers, in order to describethe influence of water content, nature of vitrifying agents, and temperature on the physico-chemicalproperties of foods and biological and pharmaceutical products.
2. PHASE DIAGRAMS AND PROCESSING TECHNOLOGIES
2.1 Supplemented phase diagrams
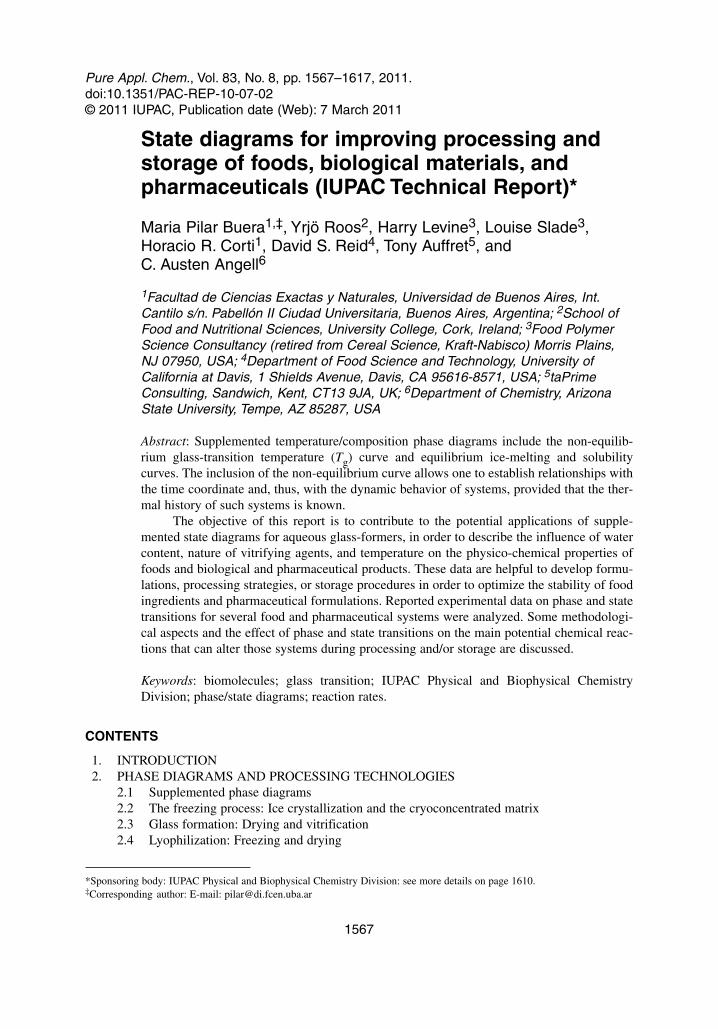
As described previously [10,14,17–22,29] in supplemented phase diagrams, the curves correspondingto equilibrium conditions (ice-melting and solubility curves) and Tg of a system are plotted as a func-tion of the solid mass fraction, w2, as shown in Fig. 1, being the mass fraction of water w1 = (1– w2) ateach point. Since the different curves in Fig. 1 delimit regions where the main dynamic changes couldhappen as a consequence of phase/state changes [10], by applying this kind of diagram, it can be pre-dicted whether a system is under thermodynamic or kinetic control, for given composition-temperatureconditions, providing the thermal history of the sample is known [8,10,14]. The events defined by the
© 2011, IUPAC Pure Appl. Chem., Vol. 83, No. 8, pp. 1567–1617, 2011
Potential applications of state diagrams 1569
Fig. 1 Supplemented phase/state diagram showing the formation of a glass of low water content bycryoconcentration (line a) [2]; dehydration (lines b → c → d) [2] and vitrification (line e) of a system of high watercontent [2]. Conditions for maximum rate of ice formation; conditions for maximum rate of solutecrystallization.
thermodynamic curves are independent of the previous thermal history of a sample. The inclusion ofthe Tg curve (corresponding to a non-equilibrium transition) in supplemented state diagrams allows oneto include the concept of time in which a certain event will take place or what changes will be kineti-cally delayed/inhibited under certain conditions. Particularly, several mathematical approaches (dis-cussed, in Section 5.4) were established in order to predict the kinetics of specific phenomena in sys-tems at conditions lying between the equilibrium curves and the non-equilibrium line. Reid [30]provided a very conceptual description of such a state diagram in relation to the thermodynamic phasediagram. Upon cooling of a solution of composition A (Fig. 1), due to supercooling (see Section 2.2)and to freezing-point depression caused by the solute, water starts to crystallize below the equilibriumtemperature for ice melting (273.15 K at sea level). In a simple binary system such as that shown in Fig.1, the point (TE, wE) represents the eutectic point, the temperature TE at which, in a mixture of compo-sition w2 = wE, both ice and solute will crystallize in a ratio that is the same as their ratio in the solu-tion phase. This behavior is easily detectable with solutes such as Na2HPO4�12H2O, Na2SO4, Na2CO3,KCl, urea1, and (NH4)2SO4 [31].
When the solute does not crystallize under the experimental conditions, cooling the solution tobelow TE will result in further ice separation, and freezing-point depression due to solute concentrationwill continue, but not at equilibrium. At some point, a temperature (Tm' in Fig. 1) and solute concen-tration (w2 = wg') are reached, at which the viscosity of the concentrated unfrozen phase becomes a lim-iting factor for additional ice formation [8,12,15,20,32–34]. Thus, line a in Fig. 1 indicates a hypo -thetical route for a system submitted to cryoconcentration, reaching the maximum mass fraction ofsolids that can be achieved by freezing. At the Tg of the maximally freeze-concentrated matrix (Tg'), aglass is formed (Fig. 1) [1–11]. The point (Tg', wg') depends on the material composition, but not on theinitial solids fraction (before freezing). At a temperature below the Tg', the amorphous unfrozen phasevitrifies and exists as a glassy solid separate from the ice crystals [22].
As defined in the first part of this report [29], Tm' identifies the point and temperature at whichice formation ceases. Since it lies on the equilibrium melting curve, it is a well-defined point. Tg', how-ever, being related to a non-equilibrium process, can have many temperature values depending on howit is measured (whether the onset or some other value over a range of temperatures is used, and depend-ing on scanning rate or frequency employed in the measurement—see Section 5.1).
Any system that is not at its highest cryoconcentration level will show a Tg value lower than thatrepresenting maximum freeze-concentration because it retains more unfrozen water.
No further unfrozen water is able to crystallize below Tg', and therefore, depending on viscosityin the vicinity of Tg', the ice melts at the same temperature as it was formed. Hence, the theoretical val-ues for Tg' and Tm' are the same. However, partial softening of the glass is required before time-depend-ent ice formation can occur. This is shown by maximally freeze-concentrated solutions of most sugars,which often exhibit onset of melting above Tg' and in some cases above the endpoint temperature of theglass-transition range. At a given extent of freeze-concentration, the melting temperature of ice and theTg theoretically reach the same temperature (Tg' for Tg or Tm' for Tm) [22].
Solute properties and solute–water interactions affect the amount of water that remains unfrozenin the matrix and thus the temperature range at which any process involving ice formation should beperformed. These variables should be taken into account in the design of processes and frozen-systemformulations. Table 1 shows the TE and Tg' values of some selected inorganic salts. It has to be notedthat the different kinetics that govern solute and water crystallization make ice crystallization and cryo -concentration possible beyond the conditions corresponding to the eutectic point (compare solute con-centration at the points wE and wg' in Fig. 1, and the values of TE and Tg' in Table 1).
M. P. BUERA et al.
© 2011, IUPAC Pure Appl. Chem., Vol. 83, No. 8, pp. 1567–1617, 2011
1570
1diaminomethanal

Table 1 Reported values for the glass-transitiontemperature of the maximally freeze-concentratedmatrix (Tg') and for the eutectic point (TE) ofsome inorganic salts.
Salt Te/K Tg'/K Reference
KCl 262 – 31(NH4)2SO4 254 – 31Na2HPO4�12H2O 272 – 249NaH2PO4 272.5 228 249
– 208 250KH2PO4 – 218 250Na2SO4 271 – 31Na2CO3 270 31NaCl 251 <213 31, 251K2HPO4�6H2O 259 192 249NaHCO3 269 –52 44CaCl2 221 –95 31MgCl2 162 – 31
2.2 The freezing process: Ice crystallization and the cryoconcentrated matrix
Freezing is a process of ice crystallization from supercooled water. A supercooled system is that inwhich no crystallization has occurred, even if it is below the ice-melting (liquidus) or solubility(solidus) curves (Fig. 1). In the case of water, it should undergo a stage of ice nucleation, followed bythe growth of ice. Nucleation can be regarded as a kinetic process for ice nuclei to overcome a kineticbarrier, the so-called nucleation barrier, under a given thermodynamic driving force, which is propor-tional to the supercooling. Although ice growth is thermodynamically favored at temperatures below273.15 K, ice nucleation is not kinetically favored in pure water, which can remain liquid down tonearly 233 K, the homogeneous nucleation temperature (Th), if free of ice-nucleating species.
The degree of supercooling (SC) is the thermodynamic impulsive force for crystallization, and itis defined as
SC = Tm – T (1)
where T is the actual (subfreezing) temperature and Tm is the equilibrium melting point of ice for agiven w2.
Supercooling is limited by heterogeneous nucleation in the presence of solid impurities. Almostall organic and inorganic solids can catalyze ice formation (i.e., serve as heterogeneous ice nucleators)at temperatures between 258 and 233 K. Certain compounds can serve as nuclei at temperatures as highas 267 K, and a wide variety of impurities make homogeneous nucleation impossible. Ice nucleation attemperatures above Th is induced by heterogeneous ice nucleating agents (INAs) [35]. Ice nucleationpreferentially occurs on these impurities (dust, mold spores, etc.), since they lower the energy requiredto form the interface between the existing phase and the new phase.
The transient ice-like embryos formed by aggregation of water molecules are subjected to con-tinuous fluctuation in size due to the incorporation of new molecules and the detachment of others. Fora given temperature, there will be a critical radius that defines the minimum size a nucleus can have tobe a stable crystal, and this critical radius decreases with decreasing temperature below Tm. Thus, therate of nucleation would increase with decreasing temperature below Tm. However, this effect is lim-ited by the decrease in molecular mobility with increasing viscosity as temperature decreases [36]. Asa result of the opposite effects that influence the increase in the extent of supercooling (either by
© 2011, IUPAC Pure Appl. Chem., Vol. 83, No. 8, pp. 1567–1617, 2011
Potential applications of state diagrams 1571

decreasing temperature or by increasing Tm), the overall crystallization rate is maximum at some inter-mediate temperature values lying between Tm and Tg [2].
Because the Gibbs energy barrier for three-dimensional nucleation of water is much higher thanthat for ice crystal growth, ice crystal growth becomes in most cases much easier than nucleation; onceice nuclei are formed, the rapid growth rate leads to instant freezing [37]. In order to avoid water crys-tallization, the cooling rate should thus be very high. Due to their more complex structure, solute crys-tallization is generally slower than that of ice, and this is the basis of cryoconcentration protocols: solutecrystallization is delayed, while water crystallization continues, beyond the eutectic point, up to thepoint where kinetic restrictions operate [2].
Freezing and melting of water are important to such food processes as freeze-concentration,freeze-drying, and freezing. The combined effects of decreasing temperature and increasing concentra-tion impose restrictions on the molecular mobility of a system. The state of the unfrozen matrixmarkedly affects the stability of a frozen product.
Crystallization and recrystallization of ice and other compounds in partially freeze-concentratedsolutions affect the quality of frozen foods. These processes are also related to the glass transition anddilution of freeze-concentrated systems [20–22,38]. Reid et al. [39] discussed the role of the glassy statein the stability of frozen products, and they described methods for identifying the temperature at whichthe glassy state is entered and the composition of the glassy phase, analyzing the differences in theresults obtained from the application of different methods. The mechanisms of freezing are also to beconsidered, since they affect the final composition of the unfrozen matrix [40].
During heating of frozen binary solutions of sugars and water, a glass transition of the freeze-con-centrated matrix, at Tg, and ice melting, at Tm, can be detected. A partially freeze-concentrated matrix
M. P. BUERA et al.
© 2011, IUPAC Pure Appl. Chem., Vol. 83, No. 8, pp. 1567–1617, 2011
1572
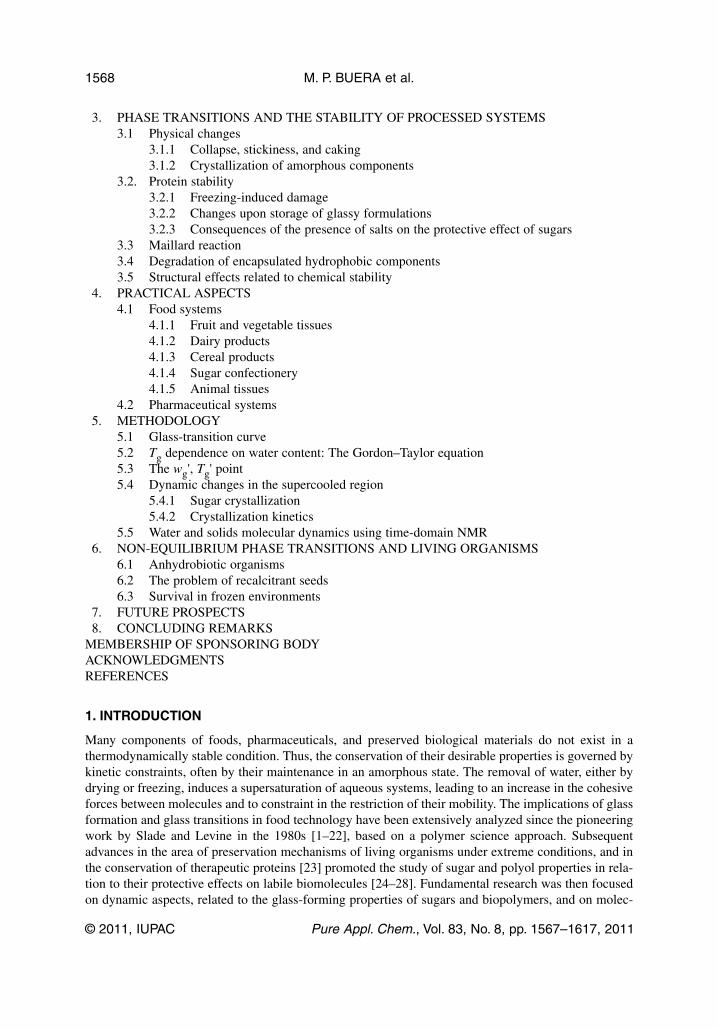
Fig. 2 Supplemented phase/state diagram showing the formation of a glass of low water content by lyophillization(through lines a → b → c → d) (modified from [2]).

(as that obtained for rapidly frozen materials) may also show ice crystallization during rewarming at agiven temperature above Tg. Such ice crystallization is an exothermal event often referred to as devitri-fication. Isothermal holding at a certain temperature below the onset temperature of ice melting at Tm'of the maximally freeze-concentrated system, but above Tg', (shown in Fig. 1 as a shaded area) allowstime-dependent ice formation. For the same reason, thermal treatments or annealing are often appliedto achieve maximum ice formation.
Below Tm' the viscosity of frozen materials increases until a glass is formed at Tg'. At tempera-tures below Tm', if the maximum amount of ice has formed, various frozen foods should exhibitimproved stability [2,4–6]. At Tm' the mobility of the matrix is sufficient to allow for dilution by liquidwater in the experimental time scale, so the enthalpy of melting starts to be observed. Hence, until Tm'is reached on warming, there is no dilution of the matrix, and the concentration at Tg' and at Tm' is thesame.
2.3 Glass formation: Drying and vitrification
Amorphous glasses are formed by a continuous process in which no interface or solidification front isinvolved. Glass structure is comparable to that of a liquid (some short-range order is observed, but nolong-range order), but its properties are similar to those of a solid. Amorphous glasses are in a non-equi-librium state, since these systems are located below the saturation curve, in the temperature-composi-tion state diagram (Fig. 1), where the thermodynamical stable form is the crystal. However, in the glassystate, most structural changes occur very slowly and only small motions of molecules, mainly rotationalmotions of side chains and vibrations, may occur [2,8]. The stabilizing effect of glasses is due to theformation of a matrix that strongly inhibits diffusion and molecular mobility (vitrification), kineticallydelaying physical changes and chemical reactions in most cases. Thus, crystallization of the amorphoussolid is kinetically delayed if the sample remains in the glassy state, below Tg. Most physical changes(including solute crystallization) result from the sharp increase in molecular mobility that occurs abovetheir Tg [2,8,14–16]. As shown in Fig. 1, the Tg of a material is a function of the relative proportion ofits glass-forming components and water. As depicted in Fig. 1, in order to form a glass from a systemstarting at room temperature, two simple routes can be followed. One route involves heating up to abovethe boiling point of water (line b), rapid dehydration (line c), and rapid cooling down (line d) [2]. Themain requirement is to pass through the regions of solute or ice crystallization (marked in Fig. 1) ade-quately fast.
Typical products containing glassy components of low water content are dehydrated foods, ingre-dients and tissues, and pharmaceuticals powders (freeze- or spray-dried).
The alternative, second route is to form a glass at high water content, avoiding ice crystallizationby rapid cooling into the glassy state, or vitrification (line e [2] in Fig. 1). At present, long-term stor-age of living cells is performed by vitrification of whole cells or tissues under liquid nitrogen (at 77 K).Vitrification of high-water-content systems, as a cryopreservation method, has many primary benefits,such as the avoidance of ice crystal formation through increased speed of temperature conduction,which provides a significant increase in cooling rates. This can eliminate structural damage of the mate-rial during freezing, but mass-transfer rates limit the sample size in which this can be achieved andthawing is never rapid enough to prevent crystallization from causing extensive damage during rewarm-ing [41]. It is to be noted that the maximum rate of ice nucleation occurs just above Tg, and the maxi-mum ice-crystal-growth rate occurs just below Tm (Fig. 1). Thus, the many nuclei formed during cool-ing can cause massive ice growth during rewarming. This leads to devitrification. The main concern oncooling is the maximum nucleation range near Tg. The most common current uses of vitrification arefor biological embryo and tissue preservation [42].
For the conservation of tissues or other biological structures, the addition of a cryoprotectant mayallow cooling down to the region of Tg without formation of ice crystals, if cooling is fast enough. If
© 2011, IUPAC Pure Appl. Chem., Vol. 83, No. 8, pp. 1567–1617, 2011
Potential applications of state diagrams 1573

nuclei are formed, the rapid cooling and high viscosity near Tg in the presence of cryoprotectant willnot allow the nuclei to grow very much and thus prevents them from being detrimental. Enough cryo -protectant to depress Tm will reduce the temperature of nucleation to Tg, thereby delaying nucleation.Dissolved sugars and polymers form glasses readily once freeze-concentrated. Certain disaccharideseffectively protect proteins and cell membranes against chilling, freezing, and dehydration, as will bediscussed later.
2.4 Lyophilization: Freezing and drying
Lyophilization, or freeze-drying, only proceeds within narrow temperature and pressure ranges, inwhich a frozen product is heated without ice melting. Franks has provided several publications in whichthe principles, processes, and variables of freeze-drying are analyzed in detail, mainly with regard tothe production of pharmaceuticals [31,43–47]. The principle of glass production by lyophilization isillustrated by the state diagram for a binary system, presented in Fig. 2. Freeze-drying involves the sub-limation of ice previously formed under vacuum (primary drying). During this stage, the solids are con-centrated in the nonfrozen phase, according to routes a–d [2] in Fig. 2.
Due to the very low pressure (<100 Pa) in the freeze-drier chamber and to the sublimation ofwater, the temperature at the ice front is very low during ice sublimation. At the very end of the primarydrying, the last crystals of ice take the heat of sublimation from the nonfrozen phase, which tempera-ture decreases, as indicated in Fig. 2. Immediately after this, the sample temperature rises asymptoti-cally toward the shelf temperature, and this marks the end of the sublimation stage. As discussed ear-lier, in every system, a given amount of water remains unavoidably unfrozen. Further drying is thusneeded after primary drying, in order to eliminate the water that could not be sublimated, because itremained unfrozen.
The secondary drying is performed by desorption under vacuum (hypothetically represented byline d in Fig. 2) [2]. Product formulation is one of the main variables that is controllable to produce anacceptable lyophilized product. Much of the formulation rationale of the past has been empirical, butthe scientific basis for using lyophilization additives emerged in the 1990s [48]. A number of worksconcerning the mechanisms by which additives can affect protein stability in solution, during dryingand in frozen, stored, and reconstituted systems improved the knowledge base [25,49–52], allowing theachievement of more scientifically based protocols.
During the primary drying stage of freeze-drying, the concept of Tg' is useful to explain whystructural collapse does not take place below its value [8], but the variable that is useful to explain whyit happens is Tm', because above this temperature, ice melting is involved in the collapse process. Tm' iscritical to the occurrence of structural collapse (a phenomenon characterized by material flow and dis-ruption of structure integrity) in various materials during freeze-drying [22]. Above Tm', increasingwater content due to ice melting leads to a rapid decrease in viscosity, because of dilution of the foodsolids (increasing plasticization by unfrozen water). The onset of ice melting at Tm' is the primary rea-son for “mobility” above that point. Once Tm' is exceeded, Tg' is no longer a necessary reference state,because of ice melting and increasing plasticization of the unfrozen phase. In this sense, the glass-tran-sition temperature referred to as Tg' and ice melting above Tm' are two different concepts, although bothrefer to the same maximum freeze-concentration phenomenon.
Tm' should always occur at the same concentration as Tg'. This reflects the fact that the kineticlimits for maximum ice formation depend on the solute and temperature. The glass transition does notneed to be completed during heating of a material, in order to allow ice melting to start at the same tem-perature at which ice formation was completed during freezing (Tm'), and a system with unfrozen phaseof solute concentration wg' was formed.
The vapor pressure of ice which provides the driving force for water removal during the primarydrying in freeze-drying, increases logarithmically with increasing temperature. Therefore, from a
M. P. BUERA et al.
© 2011, IUPAC Pure Appl. Chem., Vol. 83, No. 8, pp. 1567–1617, 2011
1574
process economic standpoint, the ice-sublimation stage profits from as high a temperature as possible[46]. Setting of the correct sublimation temperature depends on the formulation details. In practice, Tg'values above 233 K should be aimed at by judicious formulation [46]. For most products, Tg' will begoverned by the nature and proportions of excipients and salts in the product. However, it should bekept in mind that sample collapse during the primary drying period will occur, if Tm' is surpassed.
Glucose2, fructose3, sucrose4, and lactose5 are among the most important natural carbohydratesin foods. They are also important cryoprotectants in the freezing of biologically active materials. Thevarious phenomena related to freezing and melting of these aqueous carbohydrate solutions have beenstudied intensively since many decades ago [33], but some of the basic phenomena have been under-stood more recently [2,15,22,53,54], even though there is still some discussion on the true nature of thetransitions [55]. The complex thermal transitions in frozen systems are time-dependent and include bothequilibrium and non-equilibrium phenomena, such as the viscosity-controlled nature of ice formationat low temperatures. Therefore, only annealing of frozen solutions at an appropriate temperature maypromote maximum ice formation, which is extremely important to freeze-drying. It has been observedthat, for example, flavor retention during freeze-drying is significantly improved, if the material isslowly frozen [56], and therefore allowed to form a greater amount of ice.
3. PHASE TRANSITIONS AND THE STORAGE STABILITY OF PROCESSED SYSTEMS
During product storage, many physical/chemical changes may occur in the kinetically stabilized sys-tems [57]. These time-/temperature-dependent changes are critical in the maintenance of componentfunctionality, as well as nutritionally important and/or determinant to the sensory acceptance of foodsby consumers. The significance of state and phase transitions to the stability of amorphous food mate-rials, and also their impact on chemical and enzymatic reactions, has been evaluated[7,10,14–18,58–64]. State transitions can also be related to food safety.
3.1 Physical changes
3.1.1 Collapse, stickiness, and cakingThe effect of glass transition is clearly reflected in certain physical aspects of foods and pharmaceuti-cal systems. White and Cakebread [65] described various physical defects in frozen and dehydratedfoods stored above Tg. Caking of amorphous powders, stickiness, collapse, crystallization, and aromaloss have been described as temperature/time/water content-dependent phenomena occurring above acollapse temperature [66–69]. Acceleration of these phenomena is the result of the decreased viscosityand consequent increase in mobility, when a system transforms from the glassy (below Tg) to the rub-bery (above Tg) state [8]. In the case of amorphous powders, the formation of bridges between adjacentparticles, and then aggregation, was shown to take place when surface viscosity decreased because ofan increase in temperature or water content, and reached a critical value (at the sticky point tempera-ture, Tsp) that depended on particle size and the characteristic time scale of the method used to monitorthe changes. Tsp and Tg were observed to be similarly affected by increasing the mass fraction of water,with Tsp being close to the Tg end value, i.e., about 20 K above Tg onset [2,8,15]. As resistance to flowis inversely proportional to ΔT = T – Tg caking rates can be modeled as a function of ΔT usingWilliams–Landel–Ferry (WLF) behavior [2] (see Section 5.4).
© 2011, IUPAC Pure Appl. Chem., Vol. 83, No. 8, pp. 1567–1617, 2011
Potential applications of state diagrams 1575
2See the systematic IUPAC name in Table 4.3See the systematic IUPAC name in Table 4.4See the systematic IUPAC name in Table 4.5See the systematic IUPAC name in Table 4.

In Section 2.4, we mentioned that structural collapse can occur during freeze-drying, due to sur-passing Tm' of the freeze-concentrated frozen material. Such samples would show a foamy or liquid-like appearance, depending on the extent of temperature increase above Tm'. During air-drying, or dur-ing the storage of dried products, collapse is manifested by a macroscopic reduction of the systemvolume (shrinkage), and is based on the same process as stickiness [8]. Water content is a criticalparameter in caking of amorphous foods, through its “depressing” (plasticizing) effect on Tg [8], and itis typically controlled through proper formulation, adequate packaging, and/or anti-caking agents.Modification of Tg can be a means of reducing the caking rate [8,70,71].
While these phenomena can be responsible for the deterioration in quality of powdered products,agglomeration—an example of a controlled caking process—can be used to improve product appear-ance, handling, and dispersability in water. The mean apparent activation energy measured for collapseof amorphous sugar mixtures, which is in the 200 to 400 kJ mol–1 range) [72] indicates the large tem-perature dependence of the phenomenon, which is similar to that for viscosity in the temperature rangeabove Tg (WLF behavior, see Section 5.4).
3.1.2 Crystallization of solutesThe same criteria affecting the relative rates of embryo nucleation and crystal growth, discussed withregard to ice in Section 2.2, are valid when analyzing solute crystallization, and the area correspondingto the conditions for maximum rate of solute crystallization is marked in the state diagram of Fig. 1(shaded area below the solubility curve).
Sugar crystallization in foods has been shown to be a consequence of changes in molecular mobil-ity occurring above Tg [13]. Crystallization of lactose impairs the solubility of dairy powders, and accel-erates damaging chemical changes [73,74], although controlled crystallization can be used to reduce thehygroscopicity and caking tendency of whey powders and other dairy powders. In the temperatureranges where crystallization is mainly controlled by molecular diffusion, i.e., close to Tg, the effect ofwater content can be explained through its influence on Tg.
The state diagram (e.g., Figs. 1 and 2) describes two possibilities for sugar crystallization occur-rence [16,17,75]:
• Cooling down a concentrate well below the solubility line. Vuataz [75] observed that about 30 Kbelow the lactose solubility curve, spontaneous nucleation of the less-soluble lactose form (alphamonohydrate) occurs.
• Heating an amorphous sugar to above its Tg curve provokes sugar-crystal nucleation [2]. Thecrystallization rate is expected to be (T – Tg)-dependent [2,8], and the crystal structure can beaffected by cosolutes [75].
3.2 Protein stability
Most proteins can lose their native functionality, due to chemical and physical changes, when stored forextended periods in aqueous solution. Protein-drug pharmaceuticals or high added-value food-proteiningredients are often freeze-dried to achieve a stable product, typically with w1 lower than 0.1.However, depending on formulation, storage temperature, and residual water content in the proteinphase, protein stability in the solid state can be worse than that in the liquid state, and appropriate excip-ients should be present during processing, to facilitate formation of suitable matrices [26].
3.2.1 Freezing-induced damageAlthough proteins are often frozen during processing or freeze-dried after formulation, to improve theirstability, they can undergo degradation leading to losses in biological activity during such processing.The main mechanisms by which proteins are affected during freezing and dried storage are unfolding,aggregation, deamidation, and oxidation [23]. The kinetics of those mechanisms change during freez-ing, because the physical environment of the protein changes dramatically, leading to the development
M. P. BUERA et al.
© 2011, IUPAC Pure Appl. Chem., Vol. 83, No. 8, pp. 1567–1617, 2011
1576
of stresses that impact protein stability. Low temperature, freeze-concentration, and ice formation arethe three chief stresses that occur during cooling and freezing. Stambrini and Gabellieri [76] haveshown that the presence of an ice surface promoted a structural perturbation of a protein, affecting itstertiary structure. The cryoprotectants sucrose and glycerol6 inhibit the freezing-induced perturbationsof several analyzed enzymes in frozen environments. Freeze-concentration can facilitate secondaryreactions, crystallization of buffer or non-buffer components, phase separation, and redistribution ofsolutes. The partial precipitation of buffer salts can also promote dramatic pH changes during freezing.For example, the dibasic form of sodium phosphate crystallizes in frozen solutions, resulting in a sys-tem that contains the monobasic salt, which has a very low pH [77]. To minimize the changes causedby pH reduction upon freezing, the use of sodium phosphate should be avoided [51]. However, note thatif a buffer composition consists of potassium phosphate and NaCl, sodium phosphate will be formed.The presence of other components in the formulation may prevent the crystallization of dibasic sodiumphosphate. The performance of other solutes (sugars, polyols) as buffer crystallization inhibitors is dif-ficult to assess, and specific studies should be performed under each particular experimental situation[51]. An understanding of the different kinds of stresses to which a protein is subjected under frozenconditions is critical to the determination of the probability of protein degradation during freezing, andis therefore important in the design of stabilizer systems [78].
3.2.2 Changes upon storage of glassy formulationsChanges in molecular mobility, local pH, water content, and crystallinity of excipients may affect thechemical degradation rate of freeze-dried proteins or membranes in subsequent storage.
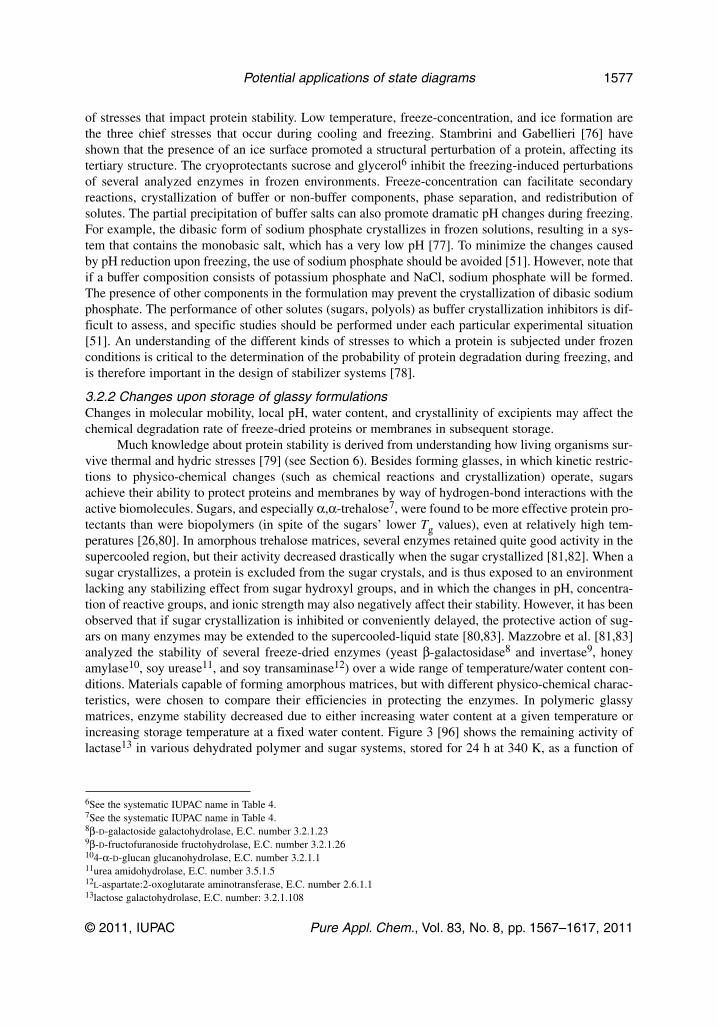
Much knowledge about protein stability is derived from understanding how living organisms sur-vive thermal and hydric stresses [79] (see Section 6). Besides forming glasses, in which kinetic restric-tions to physico-chemical changes (such as chemical reactions and crystallization) operate, sugarsachieve their ability to protect proteins and membranes by way of hydrogen-bond interactions with theactive biomolecules. Sugars, and especially α,α-trehalose7, were found to be more effective protein pro-tectants than were biopolymers (in spite of the sugars’ lower Tg values), even at relatively high tem-peratures [26,80]. In amorphous trehalose matrices, several enzymes retained quite good activity in thesupercooled region, but their activity decreased drastically when the sugar crystallized [81,82]. When asugar crystallizes, a protein is excluded from the sugar crystals, and is thus exposed to an environmentlacking any stabilizing effect from sugar hydroxyl groups, and in which the changes in pH, concentra-tion of reactive groups, and ionic strength may also negatively affect their stability. However, it has beenobserved that if sugar crystallization is inhibited or conveniently delayed, the protective action of sug-ars on many enzymes may be extended to the supercooled-liquid state [80,83]. Mazzobre et al. [81,83]analyzed the stability of several freeze-dried enzymes (yeast β-galactosidase8 and invertase9, honeyamylase10, soy urease11, and soy transaminase12) over a wide range of temperature/water content con-ditions. Materials capable of forming amorphous matrices, but with different physico-chemical charac-teristics, were chosen to compare their efficiencies in protecting the enzymes. In polymeric glassymatrices, enzyme stability decreased due to either increasing water content at a given temperature orincreasing storage temperature at a fixed water content. Figure 3 [96] shows the remaining activity oflactase13 in various dehydrated polymer and sugar systems, stored for 24 h at 340 K, as a function of
© 2011, IUPAC Pure Appl. Chem., Vol. 83, No. 8, pp. 1567–1617, 2011
Potential applications of state diagrams 1577
6See the systematic IUPAC name in Table 4.7See the systematic IUPAC name in Table 4.8β-D-galactoside galactohydrolase, E.C. number 3.2.1.239β-D-fructofuranoside fructohydrolase, E.C. number 3.2.1.26104-α-D-glucan glucanohydrolase, E.C. number 3.2.1.111urea amidohydrolase, E.C. number 3.5.1.512L-aspartate:2-oxoglutarate aminotransferase, E.C. number 2.6.1.113lactose galactohydrolase, E.C. number: 3.2.1.108

Tg. The dotted line in Fig. 3 connects the enzyme’s remaining activity values in amorphous matrices ofmaltose14, maltodextrins15 of different molecular weights, and native starch (all of which are oligomersor polymers of glucose). Although the Tg values for maltose, lactose, and melibiose16 were similar tothose for trehalose and raffinose, the enzyme was less protected in lactose or maltose matrices, becausethese reducing sugars can participate in the Maillard reaction, which can affect the active-site confor-mation and hence the catalytic activity of the enzyme. Other workers had also observed that maltodex-trins were less effective than trehalose in protecting membranes and proteins in glassy systems [26], andthis difference was attributed to a lower capacity of such polymers to form hydrogen bonds with sensi-tive components. Crowe et al. [26] concluded that a direct hydrogen-bond interaction between the pro-tective agent and the protein during drying is required for stability. Another impactful property of tre-halose is its degree of molecular packing. In addition to trehalose’s ability to form hydrogen bonds withbiomolecules [46], its low free volume enhances the packing in an amorphous matrix [84].
Lactase stability in amorphous maltose, maltodextrins, and native starch matrices was maximumin maltodextrin matrices of intermediate molar masses, as shown in Fig. 3, where the reamining enzy-matic activity is plotted as a function of molar mass and Tg. The trehalose matrix is included for com-parative purposes. Those intermediate molar mass matrices contained oligosaccharides that were nec-essary to stabilize the enzyme and had an adequate molar mass to interact with it. The large molar massof starch, its partially crystalline structure, and its superstructural arrangement reduced the capacity ofthis matrix to interact with the enzyme. The stability of the enzyme in such dried matrices (Fig. 3) wasnot only related to supramolecular aspects (such as those determined by Tg), and to the molecularmobility of a matrix, but it was also dependent on other factors such as chemical reactivity, molar mass,and conformation or molecular structure of a given matrix.
M. P. BUERA et al.
© 2011, IUPAC Pure Appl. Chem., Vol. 83, No. 8, pp. 1567–1617, 2011
1578
142-(hydroxymethyl)-6-[4,5,6-trihydroxy-2-(hydroxymethyl)oxan-3-yl]oxyox ane-3,4,5-triol15Maltodextrins derive from starch and are composed by a mixture of linear oligosaccharides consisting only of 1 → 4 linkedα-D-glucopyranosyl residues such as maltotriose, maltotetraose, etc.16(2R,3R,4S,5S,6R)-6-[[(2S,3R,4S,5R,6R)-3,4,5-trihydroxy-6-(hydroxymethyl)oxan-2-yl]oxymethyl]oxane-2,3,4,5-tetrol
Fig. 3 Percent remaining lactase activity (% R.A.) after 24 h at 343 K in dehydrated systems, as a function of matrixTg and molar mass (M): ○ 342 (maltose); � 720; � 900; � 1200; � 1800; � 3600; X starch ; � trehalose, from ref.[96].

The addition of polymers, other sugars, or salts may extend the protective effect of sugars to thesupercooled region, by delaying crystallization [85–87]. In dairy systems, the presence of proteinsdelays lactose crystallization, in comparison to pure lactose systems [88]. Gelatin17 inhibits raffinose18
crystallization, and in the presence of bovin serum albumin, sucrose or raffinose crystallization is inhib-ited, even at high water mass fractions (84 %) [89].
A second additive such as a polymer, which would raise the overall Tg of pure sugars, wouldreduce molecular mobility and inhibit crystallization. According to the aspects discussed above, poten-tial strategies to avoid sugar crystallization in low-water-content foods, ingredients, or pharmaceuticalformulations could involve vitrification or delay of sugar crystallization in supercooled media, whichcould be achieved by combinations of biopolymers, salts, or other sugars. For example, Leinen andLabuza [90] and Belcourt and Labuza [91] were able to successfully suppress sucrose recrystallizationby the addition of raffinose to a cotton candy formulation and soft cookies, respectively, which conse-quently improved the properties of those products.
3.2.3 Consequences of the presence of salts on the protective effect of sugarsThe presence of electrolytes has a profound influence on the thermodynamical and kinetic aspectsrelated to binary sugar–water systems. It is worth emphasizing that care should be taken, when extrap-olations from data for pure sugars are employed, to predict the characteristics of complex materials con-taining salts. If the aim is to produce an amorphous cryoconcentrated matrix, excipients should not crys-tallize, but should give rise to kinetically stable solutions, which can be produced by formulations withhigh Tg' values. An inspection of Table 1 shows that many mineral salts may either cause eutectic pre-cipitation or contribute to a very low system Tg'. The kinetics of ice formation (at high water contents),and of sugar crystallization from the amorphous state, are modified in the presence of salts, which overtime affect the protective action of such matrices [86,92]. The main changes in a binary sugar–watersystem, promoted by the addition of salts, are illustrated in Fig. 4. In frozen systems, salts exert a col-ligative effect and promote dilution of the maximally concentrated unfrozen phase, decreasing wg' (fromwg'1 to wg'2 in Fig. 4) due to the increase of non-frozen water content. Inhibition of ice crystallizationin sugar–salt–water systems is caused by colligative freezing-point depression (by lowering the Tm ofthe mixture), non-equilibrium freezing-point depression in the proximity of Tg', and a concomitantincrease in the amount of unfrozen water in the amorphous phase. Consequently, the Tg' of this phaseis depressed. A reduced enzyme activity was observed in such salt-containing systems [92].
In low-water-content systems, the presence of salts also resulted in retarded sugar crystallization,even when Tg remained unchanged [86]. Omar and Roos [205] reported that Tg for lactose was notgreatly affected by the presence of salt in lactose–salt mixtures, but that salt caused dramatic changesin the water-sorption and crystallization behavior of lactose, due to differences in hydrogen bondingbetween water and lactose, induced by the presence of salt.
Measurements of electrical conductivity in concentrated sugar–salt–water systems [92] revealeda high degree of local inhomogeneities, which were induced by preferential solvation of the ions, as aconsequence of stronger ion–water interactions, compared to ion–disaccharide interactions. Therefore,while ion mobility is enhanced by a low-viscosity local environment, it is expected that the mobility ofsugar molecules would be depressed by a high local viscosity. The situation could also be described interms of spatially heterogeneous dynamics [93], as was detected in supercooled liquids by differenttechniques. The dynamics in regions separated by a few nanometers could differ by several orders of
© 2011, IUPAC Pure Appl. Chem., Vol. 83, No. 8, pp. 1567–1617, 2011
Potential applications of state diagrams 1579
17Gelatin is a mixture of purified protein fraction obtained either by partial acid hydrolysis or alkaline partial hydrolysis of animalcollagen.18(2R,3R,4S,5R,6R)-2-[(2S,3S,4R,5R)-3,4-dihydroxy-2,5-bis(hydroxymethyl)oxolan-2-yl]oxy-6-[[(2S,3R,4S,5S,6R)-3,4,5-trihydroxy-6-(hydroxymethyl)oxan-2-yl]oxymethyl]oxane-3,4,5-triol
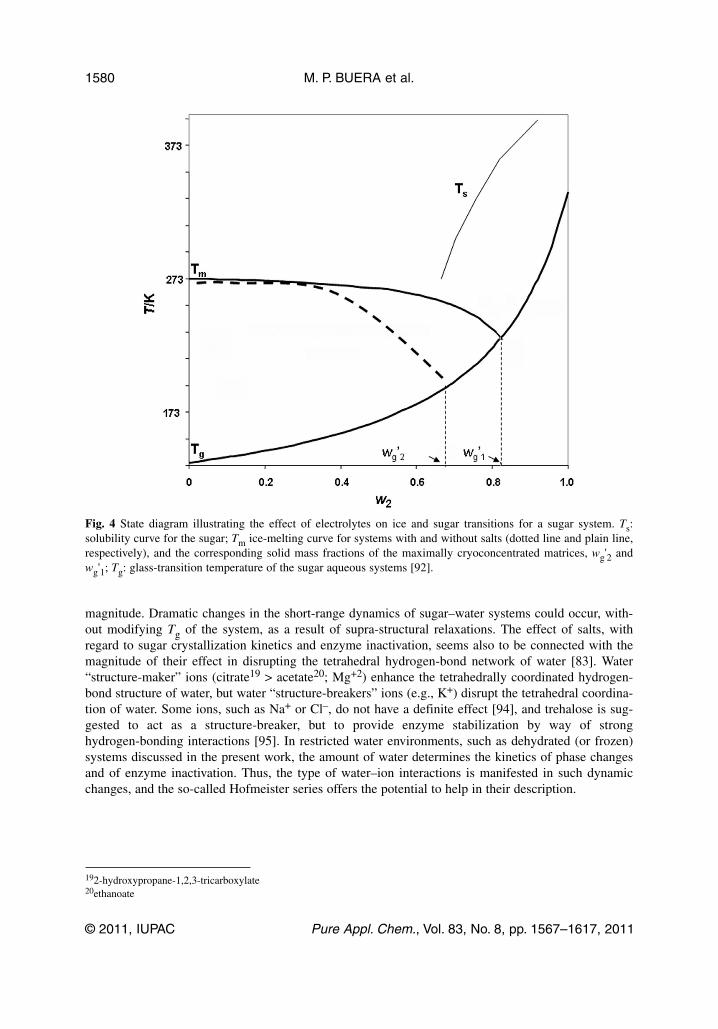
magnitude. Dramatic changes in the short-range dynamics of sugar–water systems could occur, with-out modifying Tg of the system, as a result of supra-structural relaxations. The effect of salts, withregard to sugar crystallization kinetics and enzyme inactivation, seems also to be connected with themagnitude of their effect in disrupting the tetrahedral hydrogen-bond network of water [83]. Water“structure-maker” ions (citrate19 > acetate20; Mg+2) enhance the tetrahedrally coordinated hydrogen-bond structure of water, but water “structure-breakers” ions (e.g., K+) disrupt the tetrahedral coordina-tion of water. Some ions, such as Na+ or Cl–, do not have a definite effect [94], and trehalose is sug-gested to act as a structure-breaker, but to provide enzyme stabilization by way of stronghydrogen-bonding interactions [95]. In restricted water environments, such as dehydrated (or frozen)systems discussed in the present work, the amount of water determines the kinetics of phase changesand of enzyme inactivation. Thus, the type of water–ion interactions is manifested in such dynamicchanges, and the so-called Hofmeister series offers the potential to help in their description.
M. P. BUERA et al.
© 2011, IUPAC Pure Appl. Chem., Vol. 83, No. 8, pp. 1567–1617, 2011
1580
192-hydroxypropane-1,2,3-tricarboxylate20ethanoate
Fig. 4 State diagram illustrating the effect of electrolytes on ice and sugar transitions for a sugar system. Ts:solubility curve for the sugar; Tm ice-melting curve for systems with and without salts (dotted line and plain line,respectively), and the corresponding solid mass fractions of the maximally cryoconcentrated matrices, wg'2 andwg'1; Tg: glass-transition temperature of the sugar aqueous systems [92].

The effect of salts on the phase diagrams for sugars was directly related to the charge/mass ratioof the cations present (Mg > Ca > Na > K) [81,83,85,86,92,96]. The selection of appropriate sugar–saltmixtures could be valuable in the formulation of media for particular applications in which ice crystal-lization must be avoided.
3.3 Maillard reaction
The Maillard reaction is one of the main causes of protein modification. The reaction between reduc-ing sugars and amino groups was first described by the physician Louis-Camille Maillard in 1912. Ithas been extensively studied in the food area. In a more general view, the chemistry of the Maillardreaction comprises the non-enzymatic modification of amino compounds by carbonyl-containing com-pounds. Thus, in addition to food science, this reaction has gained considerable importance in pharma-ceutical and soil science, and also in clinical areas, since many human pathologies are derived from thein vivo non-enzymatic glycosylation of proteins [97–99]. The Maillard reaction may have positive ornegative impact on the quality of food products, but it is always detrimental to pharmaceuticals or bio-logical materials during storage. The expansion of new technologies, such as the development of natu-ral flavors, pigments, emulsifiers, antimicrobials and antioxidants; the formulation of protective mediafor biological systems and ingredients; and the controlled modification of the functionality of biomol-ecules, makes necessary an in-depth analysis of Maillard reaction kinetics and the involved variables,in order to direct those new technologies toward desirable purposes.
The rate of the Maillard reaction is strongly dependent on the concentration, ratio, and chemicalnature of the reactants, and on temperature, water content, pH, and water activity (aw) [100], but it isalso influenced by the physical state of a given medium.
In aqueous liquid systems, the Maillard reaction rate decreases continuously as aw increases,mainly due to the fact that water is a product of the reaction [101–103]. However, in solid or very vis-cous systems, in which reactants are subjected to mobility restrictions, a maximum reaction rate isobserved at a given intermediate aw value. Thus, the presence of a maximum in a plot of rate vs. watermass fraction content is a consequence of the low reaction rates resulting from mobility limitations ofreactants (at low water contents) and from inhibition by product (at high water contents) [61]. For thepurpose of elucidating the applicability of phase/state diagrams, in order to predict the kinetics of theMaillard reaction, several systems with different structural characteristics were analyzed: highly col-lapsible poly(vinyl)pyrrolidone (PVP)21 matrices, crystallizing lactose and milk systems, and vegetabletissues showing intermediate degrees of collapse, due to the presence of water-insoluble polymers thatprovided structural support [82,104,105]. Figure 5 [82,92,104] illustrates the main results observed forthe Maillard reaction rates in lactose and apple systems, in relation to the respective phase/state dia-grams, as a function of the mass fraction of water (w1). The experimental areas investigated are shadedin gray, and the maximum rates are represented by the patterned bands in Fig. 5. The corresponding Tgcurves and the solubility curves for lactose and the main soluble sugars in apple (i.e., the componentsthat determine the Tg values for fruits and vegetables) were included for reference.
© 2011, IUPAC Pure Appl. Chem., Vol. 83, No. 8, pp. 1567–1617, 2011
Potential applications of state diagrams 1581
21poly[1-(2-oxo-1-pyrrolidinyl)ethylen]

The rate of browning in the analyzed fruit and food models was very low in the glassy state, butat temperatures above Tg, in addition to decreasing viscosity and increasing reaction rate, other changessuch as crystallization and collapse affected the Maillard reaction rate. The minimum water content atwhich browning was detectable was not directly related to the water hydration limit (or “monolayer”value), calculated through the Guggenheim, Anderson, and de Boer (GAB) equation [106], nor to theTg values of the systems. Table 2 shows that in various foods and model systems stored at 343 K, themaximum Maillard reaction rates were reached either close to or well above Tg, according to the struc-ture of a given system [104].
The observation of a maximum rate as a function of water mass fraction indicated that the reac-tion rate decreased at a point at which the matrix was unable to absorb additional water, either becauseof crystallization (as in the case of lactose-containing systems, Fig. 5a), by saturation of the most activesites in the water-absorbing matrix (as in the case of vegetable tissues, Fig. 5b). The inhibitory waterconcentration appeared to be associated with the saturation of the second sorption stage (as analyzed byan inverse plot of the GAB model, as proposed by Timmermann and Chirife [106]). Upon the firstappearance of frozen water and highly mobile water (determined by spin–spin transverse relaxationtime, T2, analyzed by 1H NMR, using the Hahn pulse sequence [105]), the Maillard reaction ratedecreased [105]. The water content at which the rate of the Maillard reaction is a maximum results froma compromise between plasticization by water and water’s inhibitory effect.
M. P. BUERA et al.
© 2011, IUPAC Pure Appl. Chem., Vol. 83, No. 8, pp. 1567–1617, 2011
1582
Fig. 5 State diagrams for lactose (a) and apple (b) systems, showing the experimental Tg curves and solubility dataTSL, TSG, TSS, TSF for the main sugars of each system (included for reference): lactose (a) and glucose, sucrose andfructose (b), respectively, as a function of the mass fraction of water (w1). Gray rectangles delimit the ranges ofexperimental conditions analyzed. The regions where the Maillard reaction exhibited its maximum rate are shownas patterned bands [82].
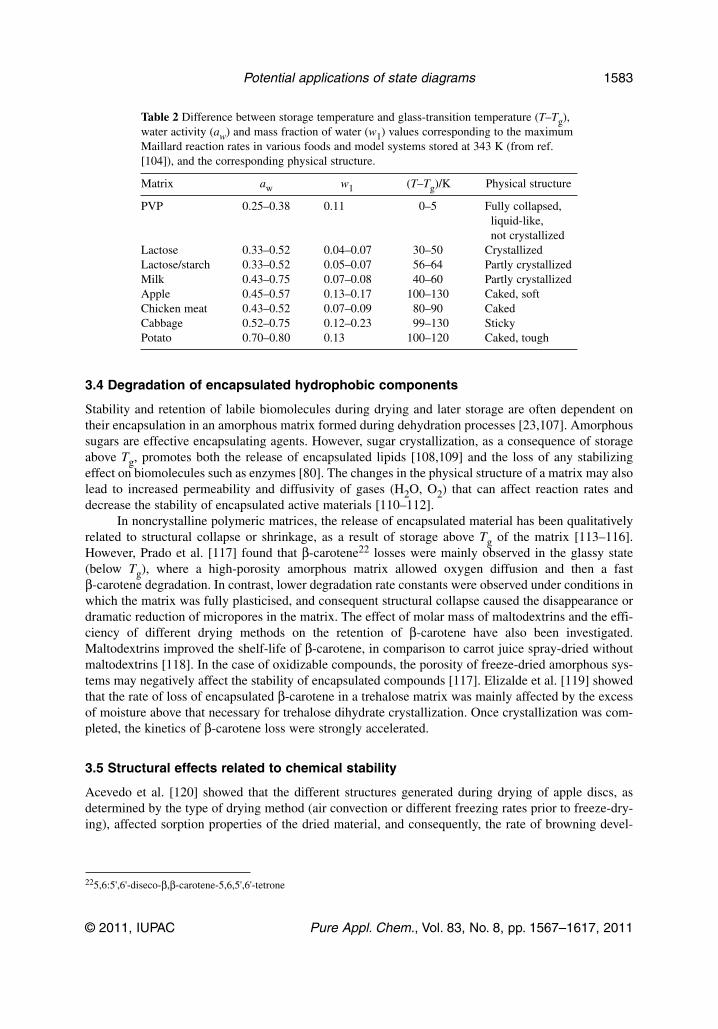
Table 2 Difference between storage temperature and glass-transition temperature (T–Tg),water activity (aw) and mass fraction of water (w1) values corresponding to the maximumMaillard reaction rates in various foods and model systems stored at 343 K (from ref.[104]), and the corresponding physical structure.
Matrix aw w1 (T–Tg)/K Physical structure
PVP 0.25–0.38 0.11 0–5 Fully collapsed,liquid-like,not crystallized
Lactose 0.33–0.52 0.04–0.07 30–50 CrystallizedLactose/starch 0.33–0.52 0.05–0.07 56–64 Partly crystallizedMilk 0.43–0.75 0.07–0.08 40–60 Partly crystallizedApple 0.45–0.57 0.13–0.17 100–130 Caked, softChicken meat 0.43–0.52 0.07–0.09 80–90 CakedCabbage 0.52–0.75 0.12–0.23 99–130 StickyPotato 0.70–0.80 0.13 100–120 Caked, tough
3.4 Degradation of encapsulated hydrophobic components
Stability and retention of labile biomolecules during drying and later storage are often dependent ontheir encapsulation in an amorphous matrix formed during dehydration processes [23,107]. Amorphoussugars are effective encapsulating agents. However, sugar crystallization, as a consequence of storageabove Tg, promotes both the release of encapsulated lipids [108,109] and the loss of any stabilizingeffect on biomolecules such as enzymes [80]. The changes in the physical structure of a matrix may alsolead to increased permeability and diffusivity of gases (H2O, O2) that can affect reaction rates anddecrease the stability of encapsulated active materials [110–112].
In noncrystalline polymeric matrices, the release of encapsulated material has been qualitativelyrelated to structural collapse or shrinkage, as a result of storage above Tg of the matrix [113–116].However, Prado et al. [117] found that β-carotene22 losses were mainly observed in the glassy state(below Tg), where a high-porosity amorphous matrix allowed oxygen diffusion and then a fastβ-carotene degradation. In contrast, lower degradation rate constants were observed under conditions inwhich the matrix was fully plasticised, and consequent structural collapse caused the disappearance ordramatic reduction of micropores in the matrix. The effect of molar mass of maltodextrins and the effi-ciency of different drying methods on the retention of β-carotene have also been investigated.Maltodextrins improved the shelf-life of β-carotene, in comparison to carrot juice spray-dried withoutmaltodextrins [118]. In the case of oxidizable compounds, the porosity of freeze-dried amorphous sys-tems may negatively affect the stability of encapsulated compounds [117]. Elizalde et al. [119] showedthat the rate of loss of encapsulated β-carotene in a trehalose matrix was mainly affected by the excessof moisture above that necessary for trehalose dihydrate crystallization. Once crystallization was com-pleted, the kinetics of β-carotene loss were strongly accelerated.
3.5 Structural effects related to chemical stability
Acevedo et al. [120] showed that the different structures generated during drying of apple discs, asdetermined by the type of drying method (air convection or different freezing rates prior to freeze-dry-ing), affected sorption properties of the dried material, and consequently, the rate of browning devel-
© 2011, IUPAC Pure Appl. Chem., Vol. 83, No. 8, pp. 1567–1617, 2011
Potential applications of state diagrams 1583
225,6:5',6'-diseco-β,β-carotene-5,6,5',6'-tetrone
opment, which in turn was also different from that for dried apple powder samples. As mentioned ear-lier, water is one of the products of the Maillard reaction. The increase in water content resulting fromthe Maillard reaction is reflected in a depression of Tg [73,121]. Water is also released as a consequenceof crystallization of certain amorphous sugars, and both accelerated enzyme inactivation and browningdevelopment can result [122,123]. The magnitude of that effect was dependent on the degree of matrixcollapse or porosity, which affected water retention in those systems [61,121].
An inverse correlation was observed between degradation rate constants for β-carotene anddegree of matrix collapse [117]. Thus, matrix collapse under controlled conditions during product pro-cessing can lead to improved stability of encapsulated biomolecules. These observations revealed thatfactors such as matrix microstructure and porosity may be important modifiers of reaction kinetics, andthese aspects are related to the location of system conditions in the state diagram.
4. PRACTICAL ASPECTS
The phase/state transition behavior of food solids and many pharmaceutical formulations has similari-ties to that of synthetic polymers [2]. Water is probably the most significant diluent and plasticizer insuch systems [2], and significantly affects the physical state and properties of other system components[20].
As discussed in previous sections, the establishment of the state diagram requires knowledge ofthree main temperature curves as functions of the mass fraction of solids:
• the freezing point depression curve • the solubility curve • the glass-transition curve
In the recently published Part I of this report, Corti et al. [29] analyzed theoretical and empiricalmodels that have been applied to predict equilibrium and non-equilibrium transition temperatures inaqueous systems. The required information to create supplemented phase/state diagrams for simplebinary or ternary aqueous systems can be obtained from literature data for single components, comple-mented by the application of theoretical or empirical relationships analyzed by Corti et al. [29]. Foodsystems represent a higher degree of complexity, but their physical state is usually governed by phasetransitions of the main components, i.e., carbohydrates, lipids, proteins, and water [21]. A first approx-imation of a state diagram can be generated on the basis of system composition (main soluble compo-nents, insoluble biopolymers, and water content), and of available literature on the critical points of theirtypical thermal or mechanical transitions. Then, the occurrence or not of some phenomena and theirkinetics in this latter case can be predicted by the relative position of the curves in the supplementedstate diagram and the experimental conditions at which the systems will be exposed.
4.1 Food systems
Sugars are the main soluble components that determine the Tg values in vegetable and dairy systems,and the latter can be restricted to a description of the state of lactose. The glass-transition and solubil-ity curves for the main component sugars may thus be employed as references in such systems; the loca-tion of the (Tg'; wg') point and the dependence of Tg on water content, described by the coefficient ofthe Gordon–Taylor equation, kGT (Section 5.2), are important tools for defining the phase/state dia-grams [6]. Table 3 shows several literature citations in which Tg', wg' values have been reported in theliterature for various food systems. In most of them, also the kGT values are provided. These data arevery valuable in order to have a first approximation of the potential state of a given system at given con-ditions.
M. P. BUERA et al.
© 2011, IUPAC Pure Appl. Chem., Vol. 83, No. 8, pp. 1567–1617, 2011
1584
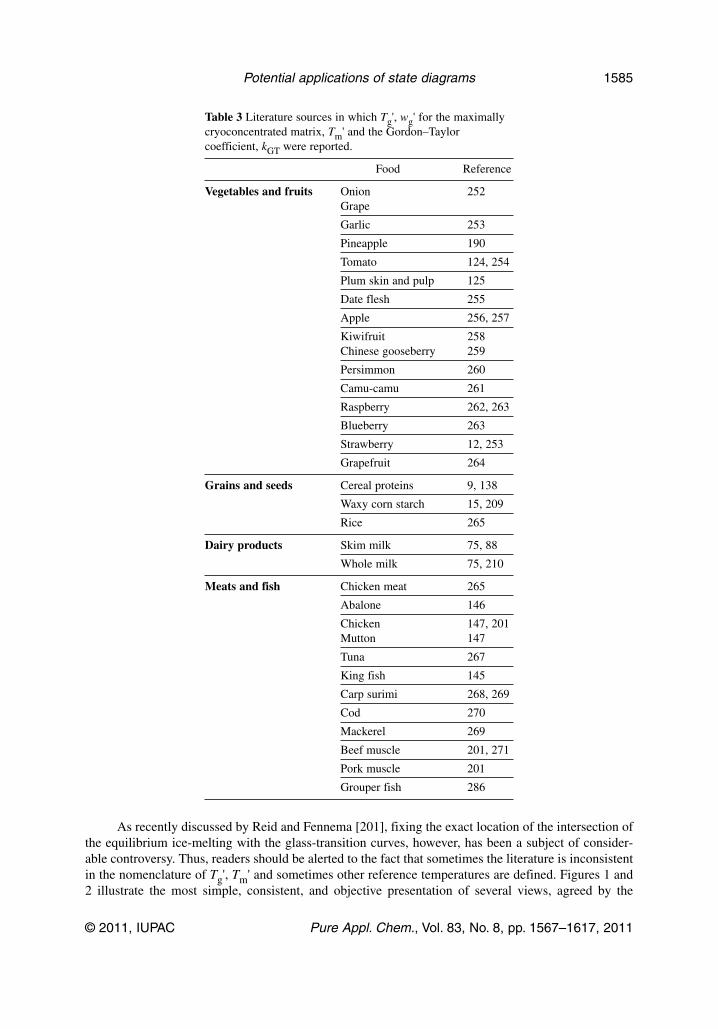
Table 3 Literature sources in which Tg', wg' for the maximallycryoconcentrated matrix, Tm' and the Gordon–Taylorcoefficient, kGT were reported.
Food Reference
Vegetables and fruits Onion 252Grape
Garlic 253
Pineapple 190
Tomato 124, 254
Plum skin and pulp 125
Date flesh 255
Apple 256, 257
Kiwifruit 258Chinese gooseberry 259
Persimmon 260
Camu-camu 261
Raspberry 262, 263
Blueberry 263
Strawberry 12, 253
Grapefruit 264
Grains and seeds Cereal proteins 9, 138
Waxy corn starch 15, 209
Rice 265
Dairy products Skim milk 75, 88
Whole milk 75, 210
Meats and fish Chicken meat 265
Abalone 146
Chicken 147, 201Mutton 147
Tuna 267
King fish 145
Carp surimi 268, 269
Cod 270
Mackerel 269
Beef muscle 201, 271
Pork muscle 201
Grouper fish 286
As recently discussed by Reid and Fennema [201], fixing the exact location of the intersection ofthe equilibrium ice-melting with the glass-transition curves, however, has been a subject of consider-able controversy. Thus, readers should be alerted to the fact that sometimes the literature is inconsistentin the nomenclature of Tg', Tm' and sometimes other reference temperatures are defined. Figures 1 and2 illustrate the most simple, consistent, and objective presentation of several views, agreed by the
© 2011, IUPAC Pure Appl. Chem., Vol. 83, No. 8, pp. 1567–1617, 2011
Potential applications of state diagrams 1585

authors of the present report, and can help to interpret or analyze the original sources of data and decidewhich variable is being referred to, on the basis of the discussions in Section 2.
4.1.1 Fruit and vegetable tissuesIce-melting temperatures, specific heat capacities, and unfrozen water contents are reported in most ofthe papers cited in Table 3. In all cases, the Gordon–Taylor equation adequately describes the depend-ence of Tg on the mass fraction of water at aw ≤ 0.90. At higher aw values, the effect of freeze-concen-tration led to an increased Tg. Annealing of samples allowed devitrification of water and thus a mini-mal amount of non-frozen water in the amorphous matrices, a gradual disappearance of theice-formation exotherm, and a consequent increase in the area of the ice-melting endotherm. Theunfrozen water content at each condition was determined from the dependence of melting enthalpy onsample mass fraction of water. Some authors [124,125] reported that at aw ≤ 0.75, two glass transitionswere observable for certain fruit tissues. The first Tg was attributed to the amorphous matrix formed bysugars and water. The second one, less pronounced and less affected by water content, was attributed tomacromolecules of the fruit pulp. The state diagrams and water-sorption properties of various fruits andvegetables were useful in determining critical points for physical stability, and also for optimizing theretention of nutrients (anthocyanins, phenolics, and antioxidants) [references in Table 3].
Spray-dried asaí (tropical fruit) showed kGT values of 4.60, 3.75, 3.56, and 6.87, depending on thetype of excipient: maltodextrin of dextrose equivalent (DE) 10, maltodextrin DE 20, gum arabic, or tapi-oca starch, respectively [71], thus suggesting the possibility of improving material stability by incorpo-rating appropriate ingredients.
4.1.2 Dairy products Vuataz [75] has presented a very complete overview of the applicability of phase/state diagrams foroptimizing the drying and storage of milk products, including practical aspects. He used the followingtools:
• The freezing-point-depression curve described in the literature [75,126], up to a certain w2. • The solubility curve, based on the solubility of lactose in water [75], and according to a hypoth-
esis on the partitioning of water, in order to dissolve milk ingredients (mainly the proteins andsalts).
• Tg values of skim, half-skim and full-cream milk powders vs. powder aw (measured at 25 °C)determined by differential scanning calorimetry (DSC) [75]. The relationship was linear in therange of aw between 0.1 and 0.3 and allowed description of the behavior of the whole range offat contents, with the same lactose to protein ratio. Moreover, this linear relationship was rathersimilar to the line established for pure amorphous lactose [127] and for spray-dried whey pow-ders with various degrees of lactose precrystallized in the α-hydrate form. Vuataz [75] identifiedthe region of the phase diagram manifesting a high risk of crystallization. From an examinationof several works on the glass-transition values for dehydrated skim milk and lactose-based modelsystems, it can be concluded that the Tg of skim milk powders, detectable by DSC, is governedby the Tg for lactose [88,123,128,129]. The addition of maltodextrin raised the Tg of dairy-basedfood powders [121,130].
4.1.3 Cereal productsStarch, proteins, and water are the main components defining the operational phase/state diagrams forcereal-based foods [7,9,11]. The structure of many cereal-based products (bread, crackers, corn flakes)can be regarded as a tri-dimensional continuous network of proteins containing a discontinuous (orinterpenetrating) phase composed of starch granules exhibiting a variable degree of organization,depending on the processing conditions for the particular type of product [7,9,11]. It is interesting tonote that the main thermomechanical changes in the final product frequently occur in the starch phase.Thus, phase/state diagrams for cereal products are often constructed in terms of starch [2]. However,product structural stability is typically controlled by the continuous protein phase. The thermal transi-
M. P. BUERA et al.
© 2011, IUPAC Pure Appl. Chem., Vol. 83, No. 8, pp. 1567–1617, 2011
1586
tions of the protein phase are meaningful in establishing the process conditions that generate theexpected properties [7], while the thermal transitions of the starch phase often define product storagestability [9].
Starch is a partially crystalline polymeric material (as observed by X-ray diffraction) that isorganized in granules. When heated in the presence of sufficient water, the granules swell, and the crys-talline organization in starch is destroyed at a characteristic temperature. This molecular disorderingprocess is called gelatinization; it can be observed as an endothermic event, by DSC, and can also bereflected in the X-ray diffraction pattern of a starch-containing material [1,131]. Gelatinization can berelated to the melting phenomenon for semi-crystalline polymers [1]. Thus, phase/state diagrams forstarch-containing systems can be constructed from the ice-melting curve, the gelatinization curve, andthe Tg curve for starch [2].
The Tg values for anhydrous high-molecular-weight food polymers such as polysaccharides[16,132] and proteins [133–135] are usually high [6], and such materials tend to decompose at temper-atures below their Tg [16]. Although the Tg values for starch, gluten protein [7,133], glutenin [134], andamylopectin-protein mixtures [128] are important in the characterization of various extruded and othercereal-based foods [2] the experimental values for many anhydrous food polymers cannot be experi-mentally determined. Based on the Tg values for maltodextrins, Roos and Karel [17] predicted a Tgvalue for anhydrous starch of 516 K, which was close to the previously reported value, 516 K [131].
Slade and Levine [1] analyzed the Tg and effective “end of non-equilibrium melting tempera-tures” (corresponding to the solubility curves in Figs. 1 and 2) for amylopectin microcrystallites in nor-mal wheat and waxy corn starches by DSC. Results of that study explained the kinetically controlledrelationship (based on the dynamics of plasticization by water) between the operative temperature, atwhich a non-equilibrium process of annealing can occur in native granular starches subjected to vari-ous heat/moisture/time treatments, and the effective Tg and Ts relevant to gelatinization [1]. They alsodemonstrated that the effective Tg associated with gelatinization of native granular starch depends onthe mass fraction of water, temperature, and time, because the glass transition represents a rate-limitingstage of a relaxation process [1]. This rate-limiting stage depends on the instantaneous magnitudes offree volume and/or local effective viscosity. These magnitudes depend in turn on the relative values ofexperimental water content compared to the water content of the operative glass, experimental temper-ature compared with the instantaneous Tg, and experimental time frame compared with the instanta-neous relaxation rate [1]. Such a relaxation process, described by WLF free volume theory for glass-forming systems, underlies various functional aspects of starch, such as gelatinization, crystallitemelting, annealing, and recrystallization [1,2].
Bread is an unstable, elastic, solid foam, the solid part of which contains a continuous phase, com-posed of an elastic network of cross-linked gluten molecules and of leached starch polymer molecules,primarily amylose (complexed or not with polar lipid molecules), and a discontinuous phase ofentrapped, partially gelatinized, swollen, deformed starch granules [136]. Starch gelatinization inducesmajor structural changes during the baking of wheat bread. The swollen granules and partially solubi-lized starch act as essential structural elements of bread [137]. The other important functional compo-nent of wheat flour is gluten protein, which is responsible for the formation of the viscoelastic glutennetwork in dough. On heating, gluten transforms from a thermoplastic, entanglement gel to a thermoset,intermolecularly crosslinked/polymerized gel network [7]. Thus, the transformation from dough tobread involves changes in both the starch and protein fractions [7,137].
The glass transitions of zein protein from corn, gliadin, and glutenin (the two components ofwheat gluten) have been studied as functions of the mass fraction of water, using mechanical spec-trometry and DSC [138]. All three of these cereal proteins are plasticizable by water, suggesting thattheir hydrophilic domains play an important role in determining their rheological properties at lowwater contents. The dependence of Tg on water content for each protein could be predicted by theGordon–Taylor equation. Temperature sweeps using small-amplitude oscillatory measurements sug-gested that all three proteins undergo crosslinking reactions in the temperature range 70–160 °C; above
© 2011, IUPAC Pure Appl. Chem., Vol. 83, No. 8, pp. 1567–1617, 2011
Potential applications of state diagrams 1587

160 °C, all proteins showed characteristic softening [138]. The development of state diagrams for suchcereal proteins can thus be used to predict their behavior during processes such as baking and extrusion[2,9].
The thermal transitions occurring during the baking and storage of bread have a profound impacton bread’s structural characteristics [139]. According to relationships established for synthetic poly-mers, which are also valid for biopolymers [2], the viscosity of such food systems depends on the dif-ference between the temperature of the system and its Tg [9]. Staling can be defined as a group ofchanges that take place during bread storage, due to certain physicochemical transformations [140],which result in an increased crumb firmness, changes in flavor and aroma, and loss of crispiness. Breadfirming is mainly caused by recrystallization of the gelatinized starch fraction [2], involving amylo -pectin chains [141], and also by starch–gluten interactions [142]. As an example of the applicability ofphase/state diagrams in the prediction of food quality aspects, Fig. 6 shows a state diagram illustratingthe evolution of two starch-containing dough systems during bread making (from dough A to final prod-uct) [143]. Ts1 and Ts2 represent the gelatinization temperatures for two formulations containing cornstarch and other biopolymers. In both cases, the final product lies in the supercooled region (betweenthe Ts and Tg curves) at room temperature, and starch recrystallization (staling) would be possible forboth formulations. The maximum recrystallization rate depends on the relative positions of the glass-transition and gelatinization curves (as discussed in Section 2). Thus, a change in formulation affectingone of the curves (gelatinization, in this case) produces that staling for formulation 1 is delayed. Sincein the absence of gluten starch retrogradation is accelerated, these concepts can be helpful in the devel-opment of formulations for gluten-free breads.
Levine and Slade [11] used state diagrams to analyze different aspects governing cookie texture.Formulation and baking time and temperature can define the location of a final product on a state dia-gram, and consequently, a product’s texture attributes and storage stability at a fixed temperature [5,11].These workers demonstrated the major opportunity offered by their “food polymer science” approachto expand not only quantitative knowledge, but also, of broader practical value in the context of indus-
M. P. BUERA et al.
© 2011, IUPAC Pure Appl. Chem., Vol. 83, No. 8, pp. 1567–1617, 2011
1588
Fig. 6 Schematic state diagram, based on a starch-containing aqueous systems, for two bread dough formulationshaving starch gelatinization temperatures of Ts1 and Ts2. The Tg values for both formulations are similar and areshown as a function of the mass fraction of solids (w2) [143]. Lines a, b, and c show the hypothetical evolution ofthe systems from the dough to final products.

trial applications, qualitative understanding of (a) the functionality of flours and flour components, and(b) the importance of glassy and rubbery states, in commercial cookie products and processes [7,9,11].
4.1.4 Sugar confectioneryThe candy industry was developed largely on an empirical basis. Nevertheless, the different steps fol-lowed during candy making can demonstrate numerous principles of physical chemistry, polymer sci-ence, and engineering [144]. Additional knowledge of the principles of binary-component phase/statediagrams may allow one to identify the location of the different steps in such diagrams. Figure 7 showsthe schematic steps that a system may follow to produce different types of sugar-based confectioneryproducts.
Sugar confectionery products are produced by dissolving sugar in a limited amount of water, viawarming up to an appropriate temperature (Ts) at which all the sugar can be solubilized (line a in Fig. 7).Upon further heating (line b), water is evaporated along the boiling-point curve. Depending on thedegree of achieved concentration (lines c or d in Fig. 7), a soft product (like toffee or fudge, line c) ora glass (hard-boiled candy, line d) is obtained upon cooling back to ambient temperature. In candy mak-ing, many different kinds of products can be produced by appropriate selection of temperatures, finalconcentrations, agitation, and cooling rates. In the supercooled region between Ts and Tg, fast coolingand agitation can promote a fast nucleation rate and the formation of small crystals, for a soft texture.The presence of milk solids and gums can also affect the extent of sugar crystallization. The formationof a small amount of large crystals (as in the case of rock candies) is favored by the avoidance of agi-tation, of the presence of impurities, and by very slow cooling. As already noted, the confectioneryindustry has developed many products largely on an empirical basis. However, with the help of infor-mation provided by phase/state diagrams [38], fewer trial-and-error experiments can lead to desiredproducts. Confectionery products represent an example of simple systems (basically composed ofsucrose, water, and possibly milk solids, for example), with transitions very easily detectable by DSC,from which a great variety of products can be obtained, if the kinetics of sugar crystallization are appro-priately controlled. The main variables that must be controlled are: heating temperature, time of heat-
© 2011, IUPAC Pure Appl. Chem., Vol. 83, No. 8, pp. 1567–1617, 2011
Potential applications of state diagrams 1589
Fig. 7 State diagram illustrating the several stages in the production of sugar confectionery: a glassy hard-boiledcandy (lines a → b → c), or a supercooled soft candy (lines a → b → d). Lines Tv, TS, and Tg represent the boilingpoint, solubility, and glass-transition temperatures, respectively, as a function of solids mass fraction (w2).
ing (concentration), cooling and agitation rates, and of course, packaging and storage conditions. Awide variety of confectionery products are obtained by careful control of these variables.
4.1.5 Animal tissuesIn DSC thermograms for fish products, Sablani et al. [145] noticed an endothermic peak, attributed tothe melting of oil, and a shift in baseline, which they attributed to a glass–rubber transition. This base-line shift was difficult to identify by DSC, for samples equilibrated at different aw values (correspond-ing to water mass fraction ranging from 0.09 to 0.28), and increasing water had little influence on thelocation of the Tg range, i.e., the plasticizing effect of water on fish protein was very small.
Sablani et al. also developed a state diagram for abalone [146]. Freezing points were determinedby the cooling method, and the Tg values were measured by dynamic oscillation in shear [146]. Thelimited glass-transition process of the abalone network needs derivation of a mechanical Tg, since thetransition could not be detected using modulated DSC (MDSC). Sunooj et al. [147] illustrated how sev-eral parameters, such as annealing temperature and time employed, sample water content, rate of heat-ing during DSC scan, etc., can affect the calorimetric determination of Tg for complex food systemssuch as chicken and mutton. As annealing temperature decreased from −11 to −23 °C, Tg values forchicken and mutton tissues shifted toward lower temperatures. Similarly, annealing times up to 1 h alsosignificantly influenced Tg values. This kind of study helps in optimizing DSC protocols for calorimet-ric determination of Tg for animal tissues.
4.2 Pharmaceutical systems
Therapeutic proteins (e.g., erythropoietins, insulin, monoclonal antibodies, blood factors, and interfer-ons) constitute the most rapidly growing class of pharmaceuticals for use in several clinical situations,including cancer, chronic inflammatory diseases, kidney transplantation, cardiovascular medicine, andinfectious diseases [148].
Injectable aqueous solutions are often the most convenient and preferable dosage form for thera-peutic proteins, whereas many purified proteins are not sufficiently stable in solution to meet shelf-liferequirements, even when they are stored at low temperatures [149]. Deteriorative changes, discussedearlier in Section 3.2, can lead to a decrease in functionality and may cause an immunological response.Effective commercialization of protein pharmaceuticals requires the development of new formulationsthat maintain the integrity of the purified protein during the manufacturing process, distribution, andstorage [149].
In the case of protein pharmaceuticals, a supplemented state diagram can help in
• selecting appropriate excipients;• selecting operating conditions for freezing and freeze-drying; and• selecting storage conditions.
Typical formulations for modern pharmaceutical freeze-dried proteins contain excipients (e.g.,sugars, polymers, amino acids) that can protect proteins from damaging physical and chemical changes[149]. Examples of excipients appropriate for use during freezing and/or freeze-drying are listed inTable 4.
M. P. BUERA et al.
© 2011, IUPAC Pure Appl. Chem., Vol. 83, No. 8, pp. 1567–1617, 2011
1590
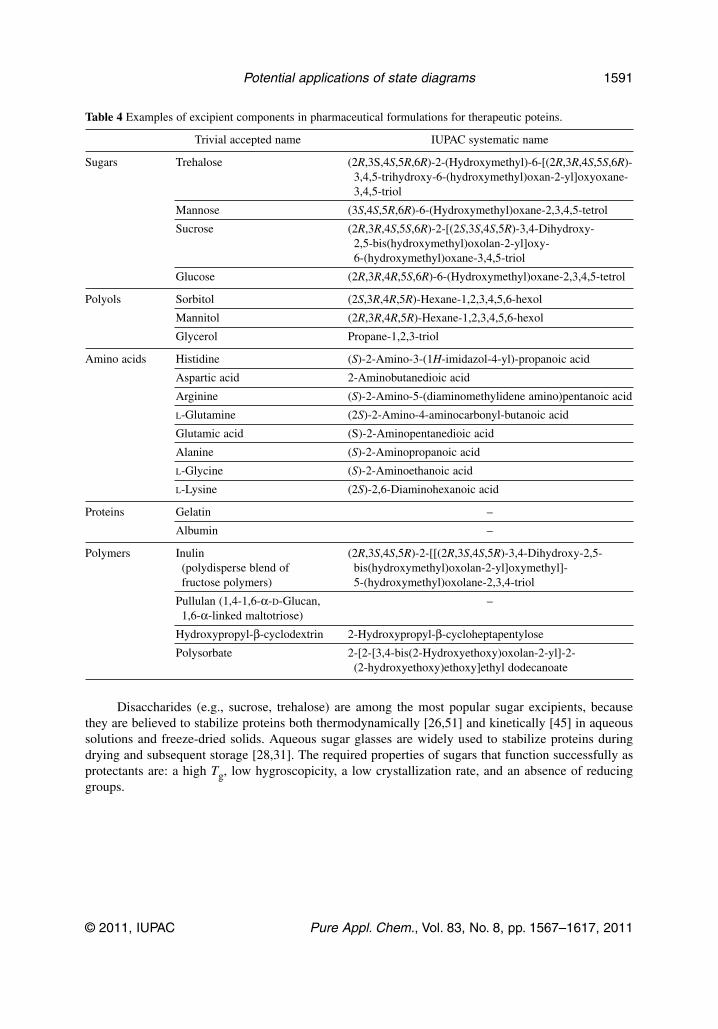
Table 4 Examples of excipient components in pharmaceutical formulations for therapeutic poteins.
Trivial accepted name IUPAC systematic name
Sugars Trehalose (2R,3S,4S,5R,6R)-2-(Hydroxymethyl)-6-[(2R,3R,4S,5S,6R)-3,4,5-trihydroxy-6-(hydroxymethyl)oxan-2-yl]oxyoxane-3,4,5-triol
Mannose (3S,4S,5R,6R)-6-(Hydroxymethyl)oxane-2,3,4,5-tetrol
Sucrose (2R,3R,4S,5S,6R)-2-[(2S,3S,4S,5R)-3,4-Dihydroxy-2,5-bis(hydroxymethyl)oxolan-2-yl]oxy-6-(hydroxymethyl)oxane-3,4,5-triol
Glucose (2R,3R,4R,5S,6R)-6-(Hydroxymethyl)oxane-2,3,4,5-tetrol
Polyols Sorbitol (2S,3R,4R,5R)-Hexane-1,2,3,4,5,6-hexol
Mannitol (2R,3R,4R,5R)-Hexane-1,2,3,4,5,6-hexol
Glycerol Propane-1,2,3-triol
Amino acids Histidine (S)-2-Amino-3-(1H-imidazol-4-yl)-propanoic acid
Aspartic acid 2-Aminobutanedioic acid
Arginine (S)-2-Amino-5-(diaminomethylidene amino)pentanoic acid
L-Glutamine (2S)-2-Amino-4-aminocarbonyl-butanoic acid
Glutamic acid (S)-2-Aminopentanedioic acid
Alanine (S)-2-Aminopropanoic acid
L-Glycine (S)-2-Aminoethanoic acid
L-Lysine (2S)-2,6-Diaminohexanoic acid
Proteins Gelatin –
Albumin –
Polymers Inulin (2R,3S,4S,5R)-2-[[(2R,3S,4S,5R)-3,4-Dihydroxy-2,5-(polydisperse blend of bis(hydroxymethyl)oxolan-2-yl]oxymethyl]-fructose polymers) 5-(hydroxymethyl)oxolane-2,3,4-triol
Pullulan (1,4-1,6-α-D-Glucan, –1,6-α-linked maltotriose)
Hydroxypropyl-β-cyclodextrin 2-Hydroxypropyl-β-cycloheptapentylose
Polysorbate 2-[2-[3,4-bis(2-Hydroxyethoxy)oxolan-2-yl]-2-(2-hydroxyethoxy)ethoxy]ethyl dodecanoate
Disaccharides (e.g., sucrose, trehalose) are among the most popular sugar excipients, becausethey are believed to stabilize proteins both thermodynamically [26,51] and kinetically [45] in aqueoussolutions and freeze-dried solids. Aqueous sugar glasses are widely used to stabilize proteins duringdrying and subsequent storage [28,31]. The required properties of sugars that function successfully asprotectants are: a high Tg, low hygroscopicity, a low crystallization rate, and an absence of reducinggroups.
© 2011, IUPAC Pure Appl. Chem., Vol. 83, No. 8, pp. 1567–1617, 2011
Potential applications of state diagrams 1591
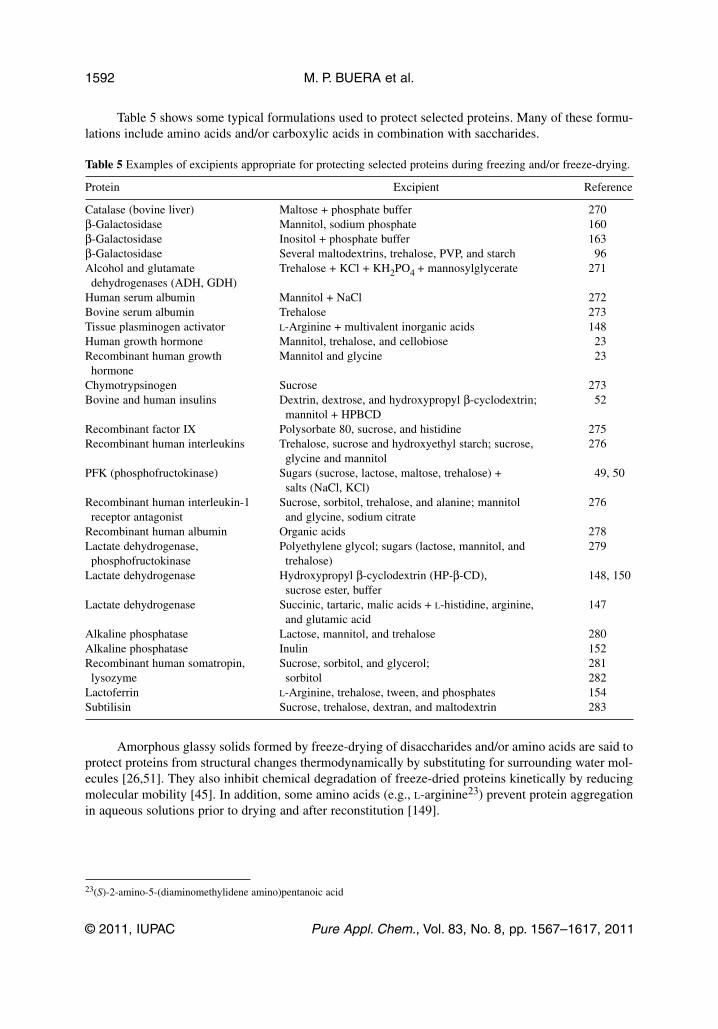
Table 5 shows some typical formulations used to protect selected proteins. Many of these formu-lations include amino acids and/or carboxylic acids in combination with saccharides.
Table 5 Examples of excipients appropriate for protecting selected proteins during freezing and/or freeze-drying.
Protein Excipient Reference
Catalase (bovine liver) Maltose + phosphate buffer 270β-Galactosidase Mannitol, sodium phosphate 160β-Galactosidase Inositol + phosphate buffer 163β-Galactosidase Several maltodextrins, trehalose, PVP, and starch 96Alcohol and glutamate Trehalose + KCl + KH2PO4 + mannosylglycerate 271dehydrogenases (ADH, GDH)
Human serum albumin Mannitol + NaCl 272Bovine serum albumin Trehalose 273Tissue plasminogen activator L-Arginine + multivalent inorganic acids 148Human growth hormone Mannitol, trehalose, and cellobiose 23Recombinant human growth Mannitol and glycine 23hormone
Chymotrypsinogen Sucrose 273Bovine and human insulins Dextrin, dextrose, and hydroxypropyl β-cyclodextrin; 52
mannitol + HPBCDRecombinant factor IX Polysorbate 80, sucrose, and histidine 275Recombinant human interleukins Trehalose, sucrose and hydroxyethyl starch; sucrose, 276
glycine and mannitolPFK (phosphofructokinase) Sugars (sucrose, lactose, maltose, trehalose) + 49, 50
salts (NaCl, KCl)Recombinant human interleukin-1 Sucrose, sorbitol, trehalose, and alanine; mannitol 276receptor antagonist and glycine, sodium citrate
Recombinant human albumin Organic acids 278Lactate dehydrogenase, Polyethylene glycol; sugars (lactose, mannitol, and 279phosphofructokinase trehalose)
Lactate dehydrogenase Hydroxypropyl β-cyclodextrin (HP-β-CD), 148, 150sucrose ester, buffer
Lactate dehydrogenase Succinic, tartaric, malic acids + L-histidine, arginine, 147and glutamic acid
Alkaline phosphatase Lactose, mannitol, and trehalose 280Alkaline phosphatase Inulin 152Recombinant human somatropin, Sucrose, sorbitol, and glycerol; 281lysozyme sorbitol 282
Lactoferrin L-Arginine, trehalose, tween, and phosphates 154Subtilisin Sucrose, trehalose, dextran, and maltodextrin 283
Amorphous glassy solids formed by freeze-drying of disaccharides and/or amino acids are said toprotect proteins from structural changes thermodynamically by substituting for surrounding water mol-ecules [26,51]. They also inhibit chemical degradation of freeze-dried proteins kinetically by reducingmolecular mobility [45]. In addition, some amino acids (e.g., L-arginine23) prevent protein aggregationin aqueous solutions prior to drying and after reconstitution [149].
M. P. BUERA et al.
© 2011, IUPAC Pure Appl. Chem., Vol. 83, No. 8, pp. 1567–1617, 2011
1592
23(S)-2-amino-5-(diaminomethylidene amino)pentanoic acid
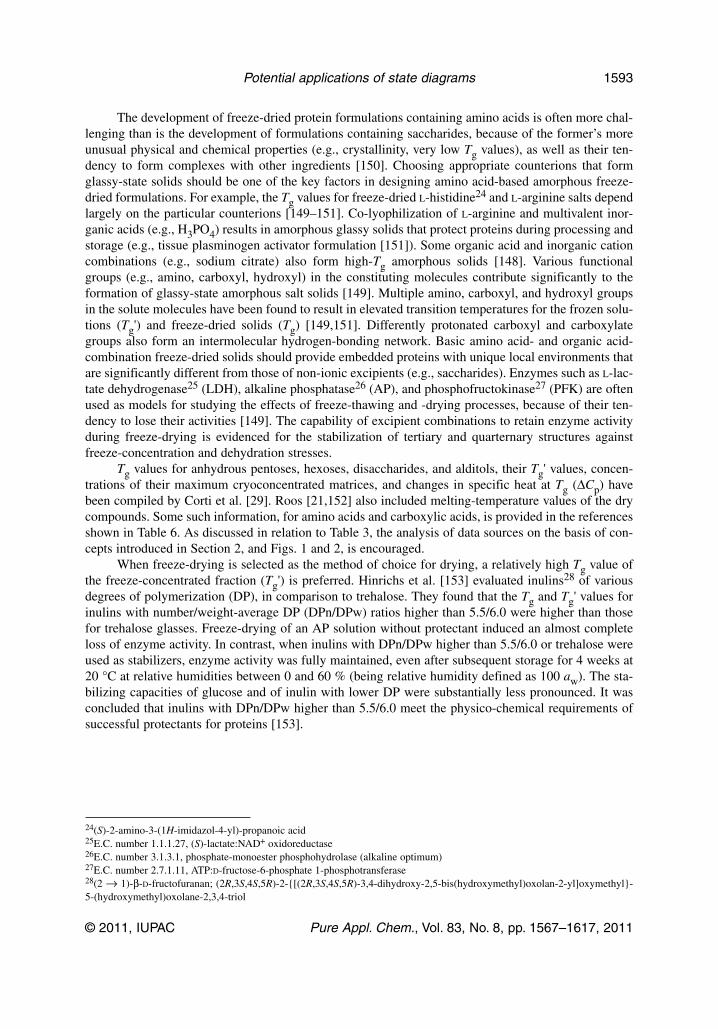
The development of freeze-dried protein formulations containing amino acids is often more chal-lenging than is the development of formulations containing saccharides, because of the former’s moreunusual physical and chemical properties (e.g., crystallinity, very low Tg values), as well as their ten-dency to form complexes with other ingredients [150]. Choosing appropriate counterions that formglassy-state solids should be one of the key factors in designing amino acid-based amorphous freeze-dried formulations. For example, the Tg values for freeze-dried L-histidine24 and L-arginine salts dependlargely on the particular counterions [149–151]. Co-lyophilization of L-arginine and multivalent inor-ganic acids (e.g., H3PO4) results in amorphous glassy solids that protect proteins during processing andstorage (e.g., tissue plasminogen activator formulation [151]). Some organic acid and inorganic cationcombinations (e.g., sodium citrate) also form high-Tg amorphous solids [148]. Various functionalgroups (e.g., amino, carboxyl, hydroxyl) in the constituting molecules contribute significantly to theformation of glassy-state amorphous salt solids [149]. Multiple amino, carboxyl, and hydroxyl groupsin the solute molecules have been found to result in elevated transition temperatures for the frozen solu-tions (Tg') and freeze-dried solids (Tg) [149,151]. Differently protonated carboxyl and carboxylategroups also form an intermolecular hydrogen-bonding network. Basic amino acid- and organic acid-combination freeze-dried solids should provide embedded proteins with unique local environments thatare significantly different from those of non-ionic excipients (e.g., saccharides). Enzymes such as L-lac-tate dehydrogenase25 (LDH), alkaline phosphatase26 (AP), and phosphofructokinase27 (PFK) are oftenused as models for studying the effects of freeze-thawing and -drying processes, because of their ten-dency to lose their activities [149]. The capability of excipient combinations to retain enzyme activityduring freeze-drying is evidenced for the stabilization of tertiary and quarternary structures againstfreeze-concentration and dehydration stresses.
Tg values for anhydrous pentoses, hexoses, disaccharides, and alditols, their Tg' values, concen-trations of their maximum cryoconcentrated matrices, and changes in specific heat at Tg (ΔCp) havebeen compiled by Corti et al. [29]. Roos [21,152] also included melting-temperature values of the drycompounds. Some such information, for amino acids and carboxylic acids, is provided in the referencesshown in Table 6. As discussed in relation to Table 3, the analysis of data sources on the basis of con-cepts introduced in Section 2, and Figs. 1 and 2, is encouraged.
When freeze-drying is selected as the method of choice for drying, a relatively high Tg value ofthe freeze-concentrated fraction (Tg') is preferred. Hinrichs et al. [153] evaluated inulins28 of variousdegrees of polymerization (DP), in comparison to trehalose. They found that the Tg and Tg' values forinulins with number/weight-average DP (DPn/DPw) ratios higher than 5.5/6.0 were higher than thosefor trehalose glasses. Freeze-drying of an AP solution without protectant induced an almost completeloss of enzyme activity. In contrast, when inulins with DPn/DPw higher than 5.5/6.0 or trehalose wereused as stabilizers, enzyme activity was fully maintained, even after subsequent storage for 4 weeks at20 °C at relative humidities between 0 and 60 % (being relative humidity defined as 100 aw). The sta-bilizing capacities of glucose and of inulin with lower DP were substantially less pronounced. It wasconcluded that inulins with DPn/DPw higher than 5.5/6.0 meet the physico-chemical requirements ofsuccessful protectants for proteins [153].
© 2011, IUPAC Pure Appl. Chem., Vol. 83, No. 8, pp. 1567–1617, 2011
Potential applications of state diagrams 1593
24(S)-2-amino-3-(1H-imidazol-4-yl)-propanoic acid25E.C. number 1.1.1.27, (S)-lactate:NAD+ oxidoreductase26E.C. number 3.1.3.1, phosphate-monoester phosphohydrolase (alkaline optimum)27E.C. number 2.7.1.11, ATP:D-fructose-6-phosphate 1-phosphotransferase28(2 → 1)-β-D-fructofuranan; (2R,3S,4S,5R)-2-{[(2R,3S,4S,5R)-3,4-dihydroxy-2,5-bis(hydroxymethyl)oxolan-2-yl]oxymethyl}-5-(hydroxymethyl)oxolane-2,3,4-triol
Table 6 Literature sources for Tg andTg' data for selected amino acids andorganic acids or their salts, used inpharmaceutical formulations fortherapeutic proteins.
Compound Reference
Argininea 150283
Histidinea 149L-Glutaminea 149L-Lysinea 148, 149Glycinea 105Alaninea 44Glutamic acida 149Citric acidb 149Tartaric acidc 149Malic acidd 149Histidine/citric acid 149Sodium acetatee 149Sodium citrate 149Potassium acetate 149Potassium citrate 149
aSee Table 4 for IUPAC systematicnames.b2-Hydroxypropane-1,2,3-tricarboxylicacid.c2,3-Dihydroxybutanedioic acid.d(S)-Hydroxybutanedioic acid.eOr sodium ethanoate.
Among polyols, mannitol29 is a popular excipient used in freeze-dried formulations to stabilizevarious biomolecules (e.g., proteins, enzymes, hormones, vitamins). Mannitol crystallization profiles,including those for its various polymorphs, have been studied extensively [154–158]. Chemical stabil-ity at extreme pH conditions may provide amorphous mannitol some advantages, among various otherpolyols and saccharides [159]. Amorphous mannitol is said to protect protein conformation duringfreeze-drying through hetero-solute molecular interaction with proteins (e.g., hydrogen bonding)[26,160–162]. However, obtaining pure amorphous mannitol by rapid cooling of a hot solution or byfreeze-drying of an aqueous mannitol solution, while possible, is not practical, because amorphousmannitol is physically unstable and will transform into a more stable crystalline form, even under ambi-ent conditions [159,163]. Another, more practical approach is the freeze-drying or rapid cooling ofmannitol in combination with other amorphous components [107,159]. Molecular-level mixing withother components may limit the spatial rearrangement of mannitol molecules required for crystalliza-tion. In fact, various solutes that can remain amorphous in frozen solutions and during freeze-drying(e.g., NaCl, K2HPO4, L-glycine30) were reported to inhibit mannitol crystallization [23,159–168].Altering molecular mobility in an amorphous phase by complex formation and/or molecular interactionis another approach to prevent mannitol crystallization. For example, addition of a small amount ofboric acid or sodium tetraborate to a hot manitol solution retards mannitol crystallization from theresulting amorphous solid [163,169]. It has also been shown that the addition of divalent cations and
M. P. BUERA et al.
© 2011, IUPAC Pure Appl. Chem., Vol. 83, No. 8, pp. 1567–1617, 2011
1594
29(2R,3R,4R,5R)-hexane-1,2,3,4,5,6-hexol 30(S)-2-aminoethanoic acid
transition metals enhances the stabilizing effect of sugars and polyols on proteins [49,50], and that theaddition of divalent cations retards trehalose crystallization [170].
5. METHODOLOGY
5.1 Glass-transition curve
According to Wunderlich [171], the most precise determination of the Tg for polymeric materials isobtained by cooling of a melt at a specified rate and then determining the transition temperature usingheat capacity, expansion coefficient, or compressibility measurements. DSC is most often the firstoption for analyzing phase and state transitions. It should be noted that different cooling and heatingrates always give different Tg values, for all amorphous systems [172], and the specific transition tem-perature within a temperature range can be identified using various criteria. Since the change in heatcapacity at Tg occurs in a temperature range, usually Tg values reported are either onset or midpointtemperatures, although the onset temperatures seem to be more important, because a number of changesin food properties occur rapidly above the onset of the transition [21,22]. The temperature range overwhich the glass transition occurs can be narrow (about 2–5 °C, e.g., for low-molecular-weight polyolsand wet sugars) or wide (larger than 15 °C, e.g., for polymers and dried materials), and the glass-tran-sition curve could be better represented by a narrow band rather than a line. There is also a variation inTg caused by sample thermal history, which is often neglected, but hysteresis in the glass transition canbe used to gain information about the thermal history of a material [21,22]. Glasses can be annealed toobtain various types of glassy solids, which may manifest different endothermal and exothermalenthalpy relaxations around the glass transition, as well as relaxations in other thermodynamic proper-ties [20,171,173]. Frequently, a first DSC scan is performed to eliminate the endo- or exothermalenthalpy relaxations that are often associated with the glass transition of a matrix, by heating to the endof the relaxation; this can dramatically affect the determination of the onset Tg in a rescan [173]. Careshould be taken, however, to avoid causing any other physical or chemical reactions during the first scan[14–16,75]. The baseline shift often observed in DSC thermograms at Tg can occur over a wide tem-perature range, and can have different degrees of steepness, depending on the type of material.Typically, humidified sugars and polyols show the steepest changes in heat capacity at Tg, while drybiopolymers show very broad and flat baseline shifts.
In most of the works cited in Tables 1, 3, and 6, phase/state transitions for freeze- or air-driedmaterials were determined over a wide range of water contents. DSC traces for such fruit and vegetabletissues, dairy products, honey, sugar-based confectionery, and whey powders showed a clearly visibleshift in baseline at Tg, and state diagrams for such food samples could be defined.
In whole-milk powders, seeds, and some cereal-based foods, Tg can be difficult to detect; depend-ing on sample water content, the glass transition may overlap with fat melting [88]. Therefore, extract-ing the lipids may be an alternative for analyzing the Tg curve in lipid-containing systems, if DSC is tobe employed.
In freeze-dried animal tissues (e.g., beef, chicken, fish products), it can often be difficult to finda clear glass transition by thermal analysis, since other changes can interfere or the complexity of thestructure can affect identification of the glass transition [145]. In a related vein, Green et al. [174] con-cluded that hydrated proteins may indeed be grouped among glass-forming systems, but due to theirspecial structural features and to the disposition of water in the protein molecules, they can show greatdepartures from thermo or rheological simplicity.
© 2011, IUPAC Pure Appl. Chem., Vol. 83, No. 8, pp. 1567–1617, 2011
Potential applications of state diagrams 1595
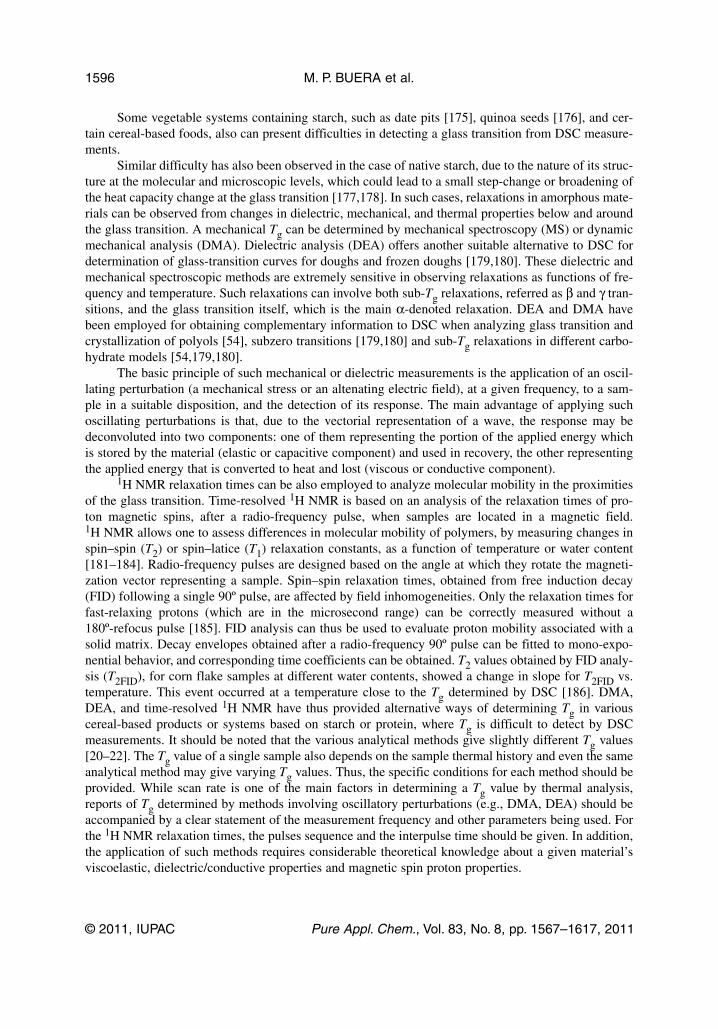
Some vegetable systems containing starch, such as date pits [175], quinoa seeds [176], and cer-tain cereal-based foods, also can present difficulties in detecting a glass transition from DSC measure-ments.
Similar difficulty has also been observed in the case of native starch, due to the nature of its struc-ture at the molecular and microscopic levels, which could lead to a small step-change or broadening ofthe heat capacity change at the glass transition [177,178]. In such cases, relaxations in amorphous mate-rials can be observed from changes in dielectric, mechanical, and thermal properties below and aroundthe glass transition. A mechanical Tg can be determined by mechanical spectroscopy (MS) or dynamicmechanical analysis (DMA). Dielectric analysis (DEA) offers another suitable alternative to DSC fordetermination of glass-transition curves for doughs and frozen doughs [179,180]. These dielectric andmechanical spectroscopic methods are extremely sensitive in observing relaxations as functions of fre-quency and temperature. Such relaxations can involve both sub-Tg relaxations, referred as β and γ tran-sitions, and the glass transition itself, which is the main α-denoted relaxation. DEA and DMA havebeen employed for obtaining complementary information to DSC when analyzing glass transition andcrystallization of polyols [54], subzero transitions [179,180] and sub-Tg relaxations in different carbo-hydrate models [54,179,180].
The basic principle of such mechanical or dielectric measurements is the application of an oscil-lating perturbation (a mechanical stress or an altenating electric field), at a given frequency, to a sam-ple in a suitable disposition, and the detection of its response. The main advantage of applying suchoscillating perturbations is that, due to the vectorial representation of a wave, the response may bedeconvoluted into two components: one of them representing the portion of the applied energy whichis stored by the material (elastic or capacitive component) and used in recovery, the other representingthe applied energy that is converted to heat and lost (viscous or conductive component).
1H NMR relaxation times can be also employed to analyze molecular mobility in the proximitiesof the glass transition. Time-resolved 1H NMR is based on an analysis of the relaxation times of pro-ton magnetic spins, after a radio-frequency pulse, when samples are located in a magnetic field.1H NMR allows one to assess differences in molecular mobility of polymers, by measuring changes inspin–spin (T2) or spin–latice (T1) relaxation constants, as a function of temperature or water content[181–184]. Radio-frequency pulses are designed based on the angle at which they rotate the magneti-zation vector representing a sample. Spin–spin relaxation times, obtained from free induction decay(FID) following a single 90º pulse, are affected by field inhomogeneities. Only the relaxation times forfast-relaxing protons (which are in the microsecond range) can be correctly measured without a180º-refocus pulse [185]. FID analysis can thus be used to evaluate proton mobility associated with asolid matrix. Decay envelopes obtained after a radio-frequency 90º pulse can be fitted to mono-expo-nential behavior, and corresponding time coefficients can be obtained. T2 values obtained by FID analy-sis (T2FID), for corn flake samples at different water contents, showed a change in slope for T2FID vs.temperature. This event occurred at a temperature close to the Tg determined by DSC [186]. DMA,DEA, and time-resolved 1H NMR have thus provided alternative ways of determining Tg in variouscereal-based products or systems based on starch or protein, where Tg is difficult to detect by DSCmeasurements. It should be noted that the various analytical methods give slightly different Tg values[20–22]. The Tg value of a single sample also depends on the sample thermal history and even the sameanalytical method may give varying Tg values. Thus, the specific conditions for each method should beprovided. While scan rate is one of the main factors in determining a Tg value by thermal analysis,reports of Tg determined by methods involving oscillatory perturbations (e.g., DMA, DEA) should beaccompanied by a clear statement of the measurement frequency and other parameters being used. Forthe 1H NMR relaxation times, the pulses sequence and the interpulse time should be given. In addition,the application of such methods requires considerable theoretical knowledge about a given material’sviscoelastic, dielectric/conductive properties and magnetic spin proton properties.
M. P. BUERA et al.
© 2011, IUPAC Pure Appl. Chem., Vol. 83, No. 8, pp. 1567–1617, 2011
1596
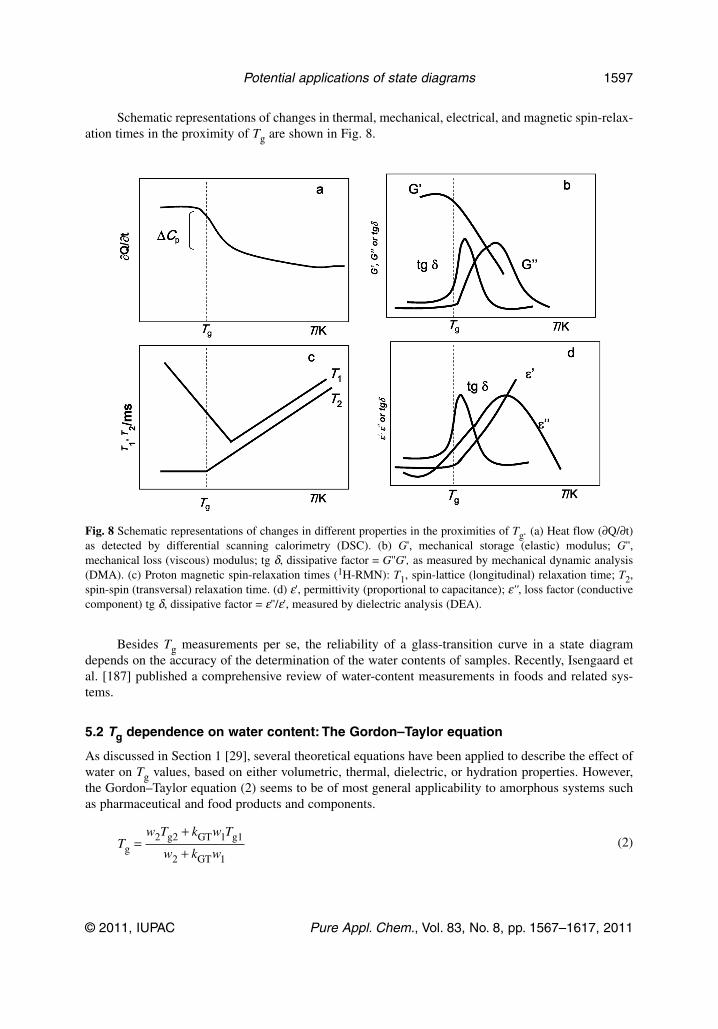
Schematic representations of changes in thermal, mechanical, electrical, and magnetic spin-relax-ation times in the proximity of Tg are shown in Fig. 8.
Besides Tg measurements per se, the reliability of a glass-transition curve in a state diagramdepends on the accuracy of the determination of the water contents of samples. Recently, Isengaard etal. [187] published a comprehensive review of water-content measurements in foods and related sys-tems.
5.2 Tg dependence on water content: The Gordon–Taylor equation
As discussed in Section 1 [29], several theoretical equations have been applied to describe the effect ofwater on Tg values, based on either volumetric, thermal, dielectric, or hydration properties. However,the Gordon–Taylor equation (2) seems to be of most general applicability to amorphous systems suchas pharmaceutical and food products and components.
(2)
© 2011, IUPAC Pure Appl. Chem., Vol. 83, No. 8, pp. 1567–1617, 2011
Potential applications of state diagrams 1597
Fig. 8 Schematic representations of changes in different properties in the proximities of Tg. (a) Heat flow (∂Q/∂t)as detected by differential scanning calorimetry (DSC). (b) G', mechanical storage (elastic) modulus; G'',mechanical loss (viscous) modulus; tg δ, dissipative factor = G''G', as measured by mechanical dynamic analysis(DMA). (c) Proton magnetic spin-relaxation times (1H-RMN): T1, spin-lattice (longitudinal) relaxation time; T2,spin-spin (transversal) relaxation time. (d) ε', permittivity (proportional to capacitance); ε'', loss factor (conductivecomponent) tg δ, dissipative factor = ε''/ε', measured by dielectric analysis (DEA).
Tw T k w T
w k wgg2 GT g1
GT=
+
+2 1
2 1

This model requires knowledge or adjustment of the following three constants:
• The glass-transition temperature of pure water, Tg1. Although some uncertainty exists about thisvalue, it has traditionally been taken as 136 K [188,189]. Corti et al. [29] have recently discussedthe Tg and ΔCp values for pure water, and possible reasons for discrepancies in the values reportedby several authors.
• The glass-transition temperature of a fully dried solute material, Tg2. Since it is not easy to com-pletely dehydrate an amorphous food powder, care should be taken to avoid chemical changes,partial recrystallization by heating to too high a temperature, and structural changes that can slowthe diffusion of water through an amorphous matrix.
• The kGT coefficient, which expresses the nonlinearity of the plasticizing effect of water.
kGT is an adjustable parameter, whose magnitude provides information about specific interactionsbetween the two components (solute and water). It is interesting to note that, for various aqueousorganic glasses, kGT is greater than 1 [19,22]. The very low Tg of water and the curvature of the depend-ence of Tg on water content indicate that, in the low water-content region, trace amounts of water willproduce a marked depression of Tg, while the effect is less marked at high water contents (see Figs. 1, 2)[2]. This plasticizing effect is more marked, the greater the kGT value. In this way, the kGT value is anindex of the plasticizing, Tg-depressing effect of water at low water contents.
kGT values, calculated from Tg curves for several fruits, are very similar to those for sucrose-con-taining systems. Telis and Sobral [124,125,190] have observed that the Tg values for various dehydratedfruits are mainly determined by the sucrose present.
Several alternatives for the Gordon–Taylor equation (such as Couchman–Karatz–Kwei) havebeen discussed by Corti et al. [29].
Roos [152] reported that the kGT values for various sugars could be related to their anhydrous Tgvalues. A linear relationship between kGT and Tg was then used to derive kGT values for various carbo-hydrates [29,152], which can be useful for predictive purposes, as an empirical parameter.
From analysis of Tg vs. aw curves, a linear relationship was found between 0.12 and 0.65 aw, butoutside this range, nonlinearity was observed. Various authors have proposed a third-degree polynomialequation for describing the dependence of Tg values on aw, including the nonlinearity in the very dryand wet regions [75]. This type of equation was considered useful for estimating the Tg for any form ofmilk (powder or concentrate with any fat content and any degree of lactose crystallization).
5.3 The wg', Tg' point
The solute concentration of the maximally freeze-concentrated unfrozen matrix (wg'), and its water con-tent can be calculated from the corresponding Tg' value, by applying the Gordon–Taylor equation, orderived from a state diagram based on Tg data at various water contents [1,2,8,15,191]. Thus, the waterand solid contents corresponding to the Tg of the maximally freeze-concentrated matrix can give themost accurate estimate for the composition of the unfrozen, maximally freeze-concentrated phase.
Experimental analysis of the maximally cryoconcentrated matrix can be performed by a sequenceof DSC runs [20]. Basically, in a first run on a diluted sample, Tg of the system, an exothermal transi-tion for ice, indicating water crystallization (devitrification), and an endothermal peak for water melt-ing can be observed. After the first exothermal peak, the matrix becomes cryoconcentrated, and even-tually, a second Tg can be observed, which depends on scanning rate, and which corresponds to Tg' ofthe concentrated matrix. If the sample is allowed to remain at a temperature close to that for maximumice formation (first exothermal peak), water has appropriate conditions for crystallizing (at an anneal-ing temperature).
An alternative is to plot the melting enthalpy of ice, in solutions with various initial water con-tents, against the mass fraction of water, which shows a linear relationship [20,192]. The mass fractionof unfrozen water associated with the maximally cryoconcentrated matrix can be estimated from such
M. P. BUERA et al.
© 2011, IUPAC Pure Appl. Chem., Vol. 83, No. 8, pp. 1567–1617, 2011
1598

a curve by extrapolation to the abscissa at the origin (ΔfusH = 0 J g–1 when the matrix is maximallycryo concentrated).
By another approach, the water contents of annealed samples can be determined by estimating thesolute concentration corresponding to the Tg at a corresponding annealing temperature [193]. Afterrapid cooling of samples to –100 °C, a first DSC scan was performed, in order to detect ice-crystal-lization and -melting transitions. Samples were then annealed for 15 min at the onset temperature of theice-crystallization peak observed in the first scan, and for 30 min at the end temperature of ice crystal-lization. After these annealing cycles, the samples were rapidly cooled down to –100 °C and then res-canned by DSC. The Tg values obtained were close to the Tg' values and in good agreement with pre-viously published data. The corresponding wg' values, determined after this annealing procedure, wereclose to those for the maximally cryoconcentrated matrices.
Many studies have reported that the solute concentrations in maximally freeze-concentrated car-bohydrate matrices correspond to w2 close to 0.8, and the dependence of Tg on experimental conditionssuch as solids concentration, annealing time, annealing temperature, and cooling rate have been stud-ied in detail [2,14,17,53,152]. Because of the kinetic constraints on ice formation, solutions with highinitial solute concentrations (w2 from 0.60 to 0.8) may require several days or even weeks of annealingat Tg' < T < Tm', before the maximally freeze-concentrated state can be achieved [2,14,20].
5.4 Dynamic changes in the supercooled region
Perhaps the analysis of molecular mobility in the supercooled region of the phase/state diagrams rep-resents one of the main challenges for the prediction and control of the rates of potential physico-chem-ical changes in several systems. As mentioned in Section 2.1, when the system is at conditions locatedbetween equilibrium and non-equilibrium curves of the supplemented phase diagrams, some mathe-matical approaches allow us to establish kinetic considerations of specific phenomena. At a given com-position, the temperature range limited by Tg (or Tm' in cryoconcentrated systems) and the equilibriumcurves (ice-melting and solids solubility), corresponds to conditions where molecular mobility repre-sents a kinetic impediment of enough significance as to affect the observed order of the reactions.Diffusion-limited relaxation processes may occur above the glass transition with a rate dependent onthe difference between storage temperature (T) and the glass-transition temperature (Tg) [1–22]. Thelocation of a given system in a phase/state diagram will greatly define its molecular mobility, and, thus,may help to predict the rates of those relaxation processes. Considering the non-equilibrium nature ofmost of the studied systems in the present report, under processing and storage conditions, those pre-dictions have paramount practical importance. As discussed in Section 3, the dynamic behavior ofsupersaturated or supercooled aqueous solutions has important implications to technological processes.Although the properties of such solutions are difficult to access experimentally in the glass-transitionregion [194], several mathematical approaches have been developed to describe them in the proximitiesof Tg. In particular, there has been increasing interest in diffusion and relaxation phenomena in thesupercooled and glassy states of food and pharmaceutical systems and components, due to their influ-ence on processing, storage, and handling [2,21,195–198]. The primary property that describes mechan-ical relaxation of mobile components is viscosity (η). The simplest equation describing the temperaturedependence of viscosity is the Arrhenius equation
(3)
where ηo is a constant, R is the gas constant, and Ea is an energy barrier to flow. Sugar–water systemsshow a departure from this model in the proximity of Tg, and therefore they have been classified as“fragile” glass-forming liquids [194]. The deviations from Arrhenius behavior may be accounted for by
© 2011, IUPAC Pure Appl. Chem., Vol. 83, No. 8, pp. 1567–1617, 2011
Potential applications of state diagrams 1599
η η=−
o
a
e
E
RT( )
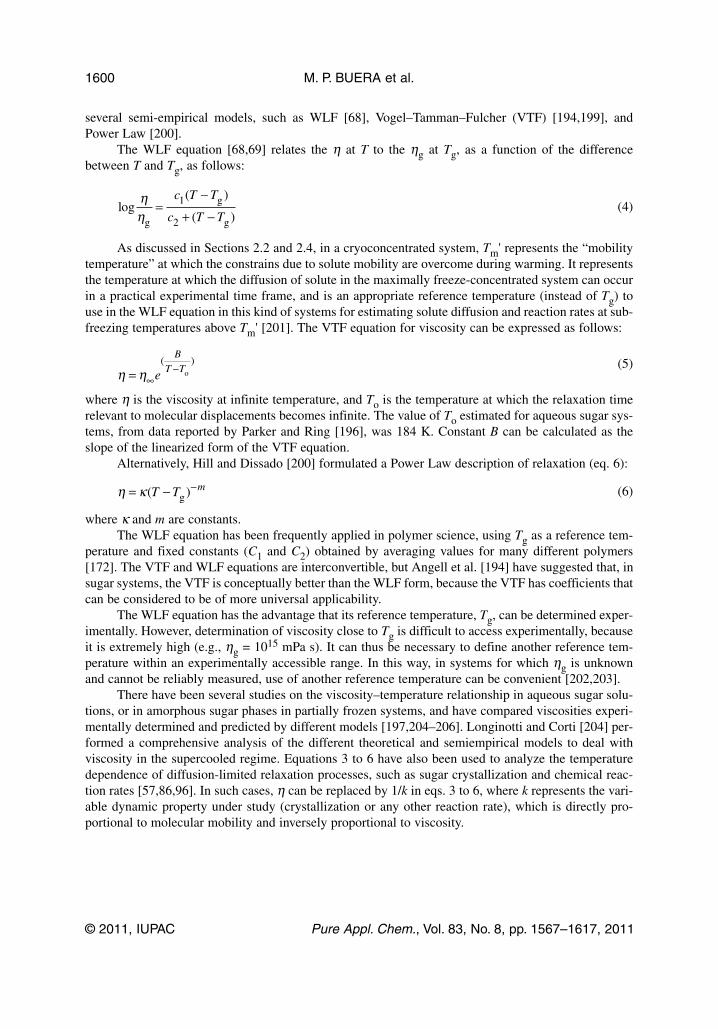
several semi-empirical models, such as WLF [68], Vogel–Tamman–Fulcher (VTF) [194,199], andPower Law [200].
The WLF equation [68,69] relates the η at T to the ηg at Tg, as a function of the differencebetween T and Tg, as follows:
(4)
As discussed in Sections 2.2 and 2.4, in a cryoconcentrated system, Tm' represents the “mobilitytemperature” at which the constrains due to solute mobility are overcome during warming. It representsthe temperature at which the diffusion of solute in the maximally freeze-concentrated system can occurin a practical experimental time frame, and is an appropriate reference temperature (instead of Tg) touse in the WLF equation in this kind of systems for estimating solute diffusion and reaction rates at sub-freezing temperatures above Tm' [201]. The VTF equation for viscosity can be expressed as follows:
(5)
where η is the viscosity at infinite temperature, and To is the temperature at which the relaxation timerelevant to molecular displacements becomes infinite. The value of To estimated for aqueous sugar sys-tems, from data reported by Parker and Ring [196], was 184 K. Constant B can be calculated as theslope of the linearized form of the VTF equation.
Alternatively, Hill and Dissado [200] formulated a Power Law description of relaxation (eq. 6):
(6)
where κ and m are constants. The WLF equation has been frequently applied in polymer science, using Tg as a reference tem-
perature and fixed constants (C1 and C2) obtained by averaging values for many different polymers[172]. The VTF and WLF equations are interconvertible, but Angell et al. [194] have suggested that, insugar systems, the VTF is conceptually better than the WLF form, because the VTF has coefficients thatcan be considered to be of more universal applicability.
The WLF equation has the advantage that its reference temperature, Tg, can be determined exper-imentally. However, determination of viscosity close to Tg is difficult to access experimentally, becauseit is extremely high (e.g., ηg = 1015 mPa s). It can thus be necessary to define another reference tem-perature within an experimentally accessible range. In this way, in systems for which ηg is unknownand cannot be reliably measured, use of another reference temperature can be convenient [202,203].
There have been several studies on the viscosity–temperature relationship in aqueous sugar solu-tions, or in amorphous sugar phases in partially frozen systems, and have compared viscosities experi-mentally determined and predicted by different models [197,204–206]. Longinotti and Corti [204] per-formed a comprehensive analysis of the different theoretical and semiempirical models to deal withviscosity in the supercooled regime. Equations 3 to 6 have also been used to analyze the temperaturedependence of diffusion-limited relaxation processes, such as sugar crystallization and chemical reac-tion rates [57,86,96]. In such cases, η can be replaced by 1/k in eqs. 3 to 6, where k represents the vari-able dynamic property under study (crystallization or any other reaction rate), which is directly pro-portional to molecular mobility and inversely proportional to viscosity.
M. P. BUERA et al.
© 2011, IUPAC Pure Appl. Chem., Vol. 83, No. 8, pp. 1567–1617, 2011
1600
log( )
( )
ηηg
g
g=
−
+ −
c T T
c T T1
2
η η= ∞−e
B
T T( )
o
η κ= − −( )T T mg
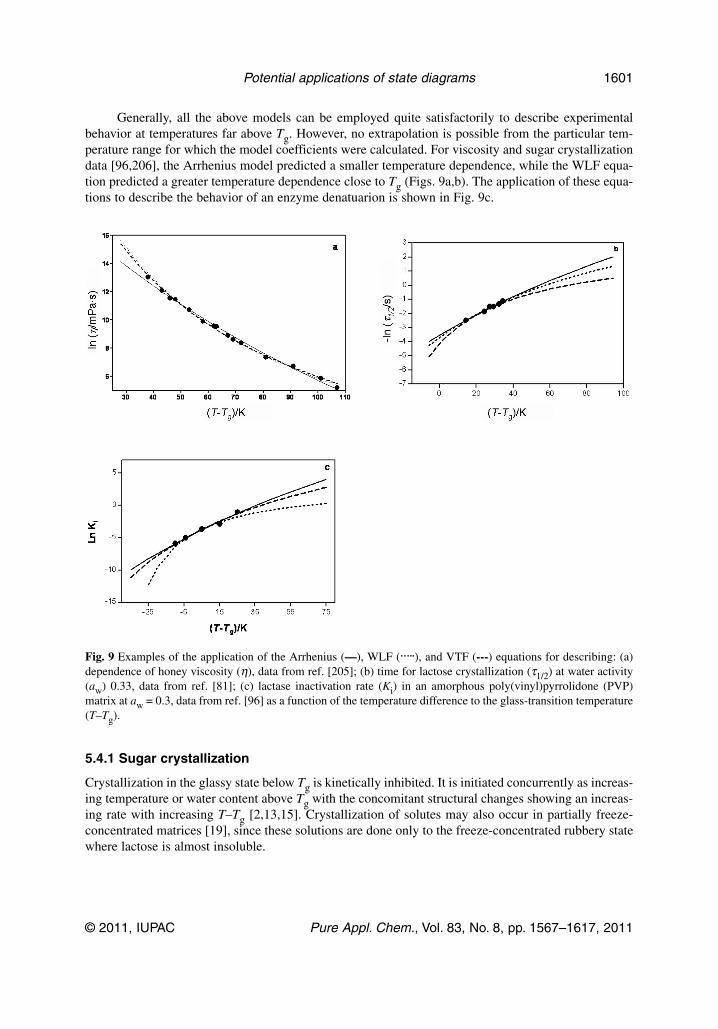
Generally, all the above models can be employed quite satisfactorily to describe experimentalbehavior at temperatures far above Tg. However, no extrapolation is possible from the particular tem-perature range for which the model coefficients were calculated. For viscosity and sugar crystallizationdata [96,206], the Arrhenius model predicted a smaller temperature dependence, while the WLF equa-tion predicted a greater temperature dependence close to Tg (Figs. 9a,b). The application of these equa-tions to describe the behavior of an enzyme denatuarion is shown in Fig. 9c.
5.4.1 Sugar crystallization
Crystallization in the glassy state below Tg is kinetically inhibited. It is initiated concurrently as increas-ing temperature or water content above Tg with the concomitant structural changes showing an increas-ing rate with increasing T–Tg [2,13,15]. Crystallization of solutes may also occur in partially freeze-concentrated matrices [19], since these solutions are done only to the freeze-concentrated rubbery statewhere lactose is almost insoluble.
© 2011, IUPAC Pure Appl. Chem., Vol. 83, No. 8, pp. 1567–1617, 2011
Potential applications of state diagrams 1601
Fig. 9 Examples of the application of the Arrhenius (—), WLF (…..), and VTF (---) equations for describing: (a)dependence of honey viscosity (η), data from ref. [205]; (b) time for lactose crystallization (τ1/2) at water activity(aw) 0.33, data from ref. [81]; (c) lactase inactivation rate (Ki) in an amorphous poly(vinyl)pyrrolidone (PVP)matrix at aw = 0.3, data from ref. [96] as a function of the temperature difference to the glass-transition temperature(T–Tg).
There are several different methods available for studying the crystallization of amorphous sug-ars [18,75,96]:
• Crystallization kinetics at constant relative humidity can be investigated by monitoring time-dependent changes in sorbed water contents during storage and observed differences resultingfrom crystallization [88,207–211].
• Measurements of the different amounts of heat released by crystallization, as determined byisothermal and non-isothermal DSC [19,87].
• Analysis of the increasing intensities and areas of peaks in X-ray diffraction (XRD) patterns isalso possible [143,212]. XRD is a practical technique for identifying crystal forms and for fol-lowing or characterizing rates of crystallization of components, especially when systems are com-plicated, such as systems with several crystallizing components.
• Microscopy and infrared and Raman spectroscopies have also been used to study the crystalliza-tion of amorphous systems [87].
5.4.2 Crystallization kineticsThe extent of crystallization, α, can be calculated from the melting enthalpy in a dynamic DSC run,from the ratio of the endothermic melting peak area for a given sample and the calorimetric enthalpy ofmelting for the corresponding pure substance (eq. 7):
(7)
where αM denotes the crystallization degree obtained from the melting enthalpy; ΔfusH is the specificenthalpy of melting of the solute in a given sample; and ΔfusH
* is the specific enthalpy of melting ofthe pure solute. This approach has been employed to calculate the degree of trehalose crystallization[92], or the degree of retrograded (or recrystallized) starch after storage [214].
Alternatively, the degree of crystallinity, or relative amount of material crystallized, can be deter-mined from isothermal DSC runs by integration of the exothermal crystallization peaks [86], to obtainthe heat of crystallization at specified time periods (eq. 8):
(8)
where αC denotes the crystallization degree obtained from the heat involved in solute crystallization;ΔQct represents the heat of crystallization exchanged at time t (which is proportional to the exothermalarea in the DSC thermogram) and ΔQc corresponds to the total heat of crystallization, obtained fromthe area under the entire crystallization curve (αc=1 corresponds to the total peak area).
It has to be pointed out that if the DSC run is performed at adequately low rates, the meltingfenomenon procceeds quite close to the equilibrium conditions, while crystallization occurs in non-equilibrium conditions.
The Johnson–Mehl–Avrami–Komogorov (JMAK) equation [215–217] can be employed to inves-tigate the kinetics of crystallization, by fitting the degree of crystallinity against time t, as follows(eq. 9):
(9)
where Kc is the rate constant for isothermal crystallization, which depends primarily on crystallizationtemperature, and n is known as the Avrami index, a parameter characteristic of nucleation and growthmechanisms for crystals, related to the number of dimensions in which crystal growth takes place. Theheight and width of exothermal peaks, and the enthalpy involved, are the representative parameters ofthe crystallization process. The parameters Kc and n can be obtained from experimental data. The
M. P. BUERA et al.
© 2011, IUPAC Pure Appl. Chem., Vol. 83, No. 8, pp. 1567–1617, 2011
1602
αMfus
fu
=Δ
Δ
H
Hs*
αCct
c=
ΔΔQ
Q
1–α = −e K tnc

numerical value of Kc is directly related to the overall rate of crystallization, and is a strong function oftemperature. Reciprocal crystallization half-time values (τ1/2) can be calculated using the followingequation (eq. 10):
(10)
Equation 10 is particularly valuable because it can provide important information about a crys-tallization mechanism [210]. For example, crystallization kinetics of synthetic polymers are often mod-elled using the Avrami equation [215], as reviewed by Sperling [172]. Crystallization in starch-con-taining foods is often referred to with the term retrogradation, which is time-dependent and has beensuggested to be kinetically controlled by the glass transition of starch [2]. The Avrami equation has beensuccessfully fitted to kinetic crystallization data for lactose [88,211]; trehalose and sucrose [92] andstarch gels [209,212,217,218]. The value of the Avrami exponent, n, was found to be higher at lowerstorage temperatures and at conditions with small T–Tg values.
Jouppila et al. [210] and Vuataz [75] described the time needed for lactose crystallization (from3 min to 1 day), through the WLF equation [68]. Using sets of data for iso thermal storage of whole milkat different temperatures between 303 and 383 K, the WLF model gave very good approximations forthe time to lactose crystallization.
Different additives may affect the molecular mobility of amorphous lactose and consequently itscrystallization rate [210,213]. The effect of a mixture of several sugars on crystallization and stabilityof embedded enzymes has been analyzed in freeze-dried model systems. In amorphous trehalose–lac-tose systems, the time to crystallization of lactose increased in the presence of trehalose [86]. The onsettemperatures for trehalose or sucrose crystallization, determined by DSC, increased in the presence ofraffinose or lactose, and crystallization was entirely avoided during the DSC run, if enough of the sec-ond sugar was present [86].
Buera et al. [74] showed that the presence of proteins retarded sugar crystallization, and in paral-lel, sugars retarded protein denaturation. Mazzobre et al. [83] have also reported the inhibition of tre-halose crystallization, due to the presence of polymers or salts. Because of this, when simple sugar orpolyol matrices are designed for protecting biomolecules, which is a common practice in pharmaceuti-cal or food-ingredient formulations, the addition of a second excipient can be beneficial (see Section4.2).
5.5 Water and solids molecular dynamics using time-domain NMR
As discussed in Section 5.1, time-resolved 1H-NMR can be used as a complementary or alternativetechnique to DSC, to determine Tg. In addition, 1H-NMR relaxation times provide a better understand-ing of water and food-solids mobility in complex and heterogeneous systems [208,220–222]. Water-molecule mobility can be analyzed by NMR spectroscopy, using proton (1H), deuterium (2H), and oxy-gen-17 (17O) nuclei. The 1H nucleus is the most abundant NMR-detectable species, and with a spinquantum number (I) of 1, its signal acquisition is relatively easy. Since relaxation times from μs up toseconds can be analyzed, a wide range of molecular mobilities can be distinguished, covering all theregions of the phase/state diagram.
Characterization of the dynamics of starch polymers and water is one of the most established andprolific areas of the application of NMR to starch-based foods [184].
As a consequence of their association with molecular mobility, the slopes of T2 obtained by freeinduction decay (T2FID) vs. temperature curves below Tg have been related to rates of product qualitychanges during storage [183]. A non-zero slope in a plot of T2FID vs temperature at T < Tg has beensuggested to indicate that some mobility exists, even before a glass transition occurs [183].
© 2011, IUPAC Pure Appl. Chem., Vol. 83, No. 8, pp. 1567–1617, 2011
Potential applications of state diagrams 1603
τ 12
0 51
− = −⎛⎝⎜
⎞⎠⎟
ln.
k
n

The spin-spin relaxation time, T2, evaluated using a Hahn spin-echo sequence, allows one tomeasure proton magnetic relaxations characterized by higher T2 values (longer relaxation times, corre-sponding to more mobile protons) than those determined by FID. In the Hahn spin-echo pulse sequence,a refocus 180º pulse is employed, and an interpulse time (τ) elapses between 90º and 180º pulses(90º-τ-180º), for which a range is selected to allow registration of the complete decay of the signal. Thedecay envelopes after a Hahn sequence are typically fitted to bi-exponential behavior. In this way, thespin-echo pulse sequence can be used to differentiate proton populations with different mobilities, as afunction of water content, and to study the relaxation of water protons, after the protons correspondingto solids have relaxed. Short relaxation times, can be attributed to solids and water molecules display-ing strong interactions with solids, and are close to T2FID values. The longer relaxation times corre-spond to proton populations with higher mobility and therefore weaker interactions with solids.
As water content increases, increasing relaxation times can be related to more mobile proton pop-ulations [104,105]. The intensity of an NMR signal corresponding to a particular proton populationoffers a relative estimation of the number of protons contributing to given T2 values. The signal inten-sity of water protons with higher mobility increases as increasing water content, indicating the increasednumber of water molecules contributing to it [104,105,223]. Partanen et al. [224] observed a decreasein molecular motion in amylose films, induced by glycerol, and evidenced by longer relaxation timesat temperatures below Tg. This effect was related to an antiplasticizing effect of glycerol, relative to thatof water [2], but with a further water- or glycerol-content increase, a plasticizing effect became evident[224].
6. NON-EQUILIBRIUM PHASE TRANSITIONS AND LIVING ORGANISMS
While most living organisms survive within a narrow range of environmental conditions, some otherscan survive under extreme stresses, by adapting to situations that would otherwise be lethal. Theydevelop various strategies for protection against extreme temperatures and dehydration, which enablethem to survive conditions such as lack of water (cryptobiosis or anhydrobiosis) and freezing tempera-tures (cryobiosis) [49–51,225].
Since such tolerant living organisms face the same problems with protecting their important bio-molecules, as pertain to food and pharmaceutical preservation, by studying the strategies used in nature,one can develop innovative procedures for use in food and pharmaceutical technologies [226].
The strategies employed by tolerant organisms for avoiding injuries caused by dehydration andfreezing, can be interpreted and analyzed with the help of simplified temperature-composition state dia-grams, such as that schematized in Fig. 10, generically designed from an approximation to the compo-sition of cell cytosol, which is similar to those compositions also found for seeds and various biologi-cal tissues [10,89,176,227].
6.1 Anhydrobiotic organisms
Glass formation is a natural mechanism for the preservation of complex anhydrobiotic organisms,which can tolerate desiccation and survive for extended periods in a dry state [26,227,228]. In responseto dehydration, the cytoplasm of desiccation-tolerant organisms forms glasses that contain largeamounts of soluble non-reducing sugars, and their state diagrams resemble those of simple sugar mix-tures (see Fig. 10). Crowe et al. [26] reported that, although vitrification of structure is necessary toimprove enzyme stability, it is not the only condition that characterizes protective molecules, since spe-cific hydrogen-bond interactions between matrix and protein are also thought to be needed. As directinteraction of sugars with protein molecules that are imbedded in a glassy matrix is believed to preventprotein denaturation and lead to optimal preservation [24], it is important that a sugar remain in a non-crystalline state, which could be either glassy or supercooled. It is to be noted that, when solute crys-tallization occurs, the composition of the non-crystalline phase changes, and often a resulting increase
M. P. BUERA et al.
© 2011, IUPAC Pure Appl. Chem., Vol. 83, No. 8, pp. 1567–1617, 2011
1604

in deteriorative reaction rates is observed [74]. Organisms that are anhydrobiotic by nature, such asSaccharomyces cerevisiae and tardigrades, have been found to accumulate up to 20 % of their dryweight of α,α-trehalose and to undergo vitrification upon drying [25]. Pollen, seeds, and resurrectionplants (such as Selaginella lepidophyl) accumulate sucrose and other non-reducing β-furanosides suchas raffinose, stachyose, or verbascose. Desiccation-tolerant plants use the disaccharide sucrose, for thispurpose [25]. In the cases of seeds, embryos, and plant tissues, the presence of several oligosaccharideshas been related to seed longevity, due to their protection of proteins and membranes, and to their pre-vention of sucrose crystallization [229,230]. Dried yeast cells have been reported to have Tg values andwater-sorption isotherms that are independent of the amount of trehalose naturally present. However,their viability is dramatically dependent on the quantity of this disaccharide present [231]. Besides sug-ars, proteins (dehydrines), salts, and amino acids are accumulated by organisms resistant to dehydra-tion, and act in different ways, stabilizing proteins and membranes, contributing to osmotic adjustment,or as free-radical scavengers.
Vitrification of protective sugars is perhaps the main strategy in nature to avoid the crystallizationof sugars in anhydrobiotic organisms.
The influence of different yeast (S. cerevisiae) cellular fractions has been studied, in an attemptto gain knowledge on the feasibility of trehalose crystallization in yeast cells. Certain constituents ofS. cerevisiae cells inhibited/delayed trehalose crystallization upon humidification at high relativehumidities [89]. This revealed that cellular structures naturally possess components that act to delay orinhibit sugar crystallization in the interior of the cells. Although crystallization of sugars in the cyto-plasm has been assumed to be a cause of viability loss, sugar crystallization is most of the times diffi-cult to detect in cells or tissues due to the interfering effect of the accompaning solutes [175,227].
© 2011, IUPAC Pure Appl. Chem., Vol. 83, No. 8, pp. 1567–1617, 2011
Potential applications of state diagrams 1605
Fig. 10 State diagram showing the conditions and mechanisms at which some living organisms develop strategieswhich allow them to survive adverse conditions.
Conditions under the glass-transition temperature (Tg) curve suitable for anhydrobiotes conservation.
Potential conditions allowing survival of the recalcitrant seeds. Tm: equilibrium temperature of ice crystallization; Tn homogeneous ice-nucleation temperature; TnINAS modifiedice-nucleation temperature by INAs; TnAFP: modified ice-nucleation temperature by AFPs. Line a indicates theconditions under protective dehydration.
6.2 The problem of recalcitrant seeds
The cytoplasmic glass in seeds is composed mainly of sugars (sucrose and oligosaccharides compriseabout 10–20 % of the dry weight), high-molecular-weight oligosaccharides, and proteins. Vitrificationof cytoplasm components in orthodox seeds has been proposed to be advantageous for germplasm sta-bility, and component transitions may affect seed viability [232]. As storage temperature or water con-tent increases, seeds can undergo a glass-to-liquid transition (at Tg), resulting in an increase in molec-ular mobility. Whether or not seed tissues are in a glassy state can depend on both seed water contentand storage temperature. In orthodox seeds, glass formation as water content is depressed is thought tolimit deteriorative reactions [230]. However, desiccation-sensitive organisms, such as recalcitrant seeds,generally lose their viability during drying, at water contents at which the glassy state has not yet beenachieved [227]. The location of potential conditions allowing survival of the recalcitrant seeds is shownin Fig. 10.
Recalcitrant seeds (e.g., Araucaria angustifolia, palm) do not tolerate a reduction in water con-tent below a relatively high level, without loss of viability, and a glass cannot be formed [229,232].Conventional storage techniques are thus not applicable to such seeds, and cryopreservation is the onlyfeasible alternative for their long-term storage [231]. Panza et al. [233] have observed that, at water con-tents (or relative humidities) at which the embryos of recalcitrant A. angustifolia seeds retain their via-bility (at and above aw 0.85), water freezes upon cooling to subzero temperatures. Since the high freez-able-water content of such seeds can promote injuries, their preservation at low temperatures representsa challenge in germplasm banks. Thus, recalcitrant seeds are good models for analyzing the impact offreezing rate, storage time, and temperature on the degree of injury. If certain plant tissues undego arapid cooling (e.g., to 77 K), only minor damage occurs [233]. Those seeds with lower contents offreezable water would be more easily cryopreserved [230]. The preservation of recalcitrant seeds couldbe improved by vitrification, either by dehydration, after imbibition of the embryos with protectingagents, or by cooling while avoiding ice formation, but this is an area that requires further research, andwould be of interest for biodiversity preservation in germplasm banks.
Sacandé et al. [234] have studied the phase and state transitions in tropical neem seed (having lowtolerance to dessication), as affected by water. Their results indicated that, through the use of phase/statediagrams, a better insight could be obtained into the peculiar behavior of dry neem seeds, allowing thedevelopment of efficient methods for storage of tropical seeds displaying intermediate storage stability.
6.3 Survival in frozen environments
Intracellular ice formation can change the chemical environment of a biomolecule. In particular, pHchanges and ionic-strength increases may damage proteins and nucleic acids [43]. In a related vein,injuries due to mechanical changes can affect such systems; large ice crystals can disrupt tissue struc-tures, so control of ice-crystal growth can be important to the survival of organisms in winter. Someplants and animals have evolved means to prevent the lethal effects of ice crystals forming in their cells.The mechanisms by which certain organisms survive extreme low temperatures are schematized inFig. 10, and they include: extracellular water crystallization (formation of ice crystals outside cell mem-brane), use of antifreeze proteins (AFPs), and glass formation [235].
In freeze-tolerant species, proteinaceous ice nucleators agents (INAs) trigger extracellular freez-ing at high subzero temperatures, either to provide protection from cold by released heat of fusion, orto establish a protective (extracellular) freezing that drives water out of cells, thus decreasing the tem-perature at which intracellular ice could form [235]. The amino acids within INAs are thought to formtemplates for ice, which can serve as embryos for ice formation [236]. Among the most efficient INAsin nature are ice-nucleating proteins found on the surface of certain bacteria, such as Pseudomonassyringae, Erwinia herbicola, and Pseudomonas fluorescens, commonly found on plant leaves and otherabove-ground plant parts [237].
M. P. BUERA et al.
© 2011, IUPAC Pure Appl. Chem., Vol. 83, No. 8, pp. 1567–1617, 2011
1606
In contrast, some organisms will die if they freeze, so they need to avoid freezing by maintainingtheir body fluids in a liquid state, even at extremely low subzero temperatures. Certain freeze-avoidingspecies increase their supercooling potential by removing ice nucleators and accumulating polyols[237]. Fish, insects, and some plants that live in Arctic and Antarctic regions have evolved to produceAFPs, which inhibit the growth of ice crystals by adsorption to ice surfaces [237]. Another class of non-freezing-tolerant organisms, such as the Arctic springtail, Onychiurus arcticus, and some insects, use astrategy of protective dehydration [235]. In protective dehydration (Fig. 10), loss of water occurs acrossa diffusion gradient between an organism’s supercooled cell fluids and ice in its surroundings, such thatthe extent of freezing-point depression always exceeds the environmental temperature, and eventually,the organism loses sufficient water and desiccates, to ensure that a freezing event cannot occur. Parallelto the induction of extensive dehydration, rapid synthesis and accumulation of the membrane/proteincryoprotectant, trehalose, and some other low-molecular-weight compounds occur. As a result, thewater in cells cannot freeze above –40 °C [235].
AFPs and antifreeze glycoproteins (AFGPs) were first identified in the 1970s in Antarctic fishesthat can survive in seawater that is colder than the freezing temperature of their blood, but such AFPsand AFGPs were later also found in various microorganisms, insects, plants, and nematodes [237].Although such proteins were first thought to act via a colligative effect, by decreasing the meting pointof water, it was later observed that they act by preventing the growth of ice crystals, having only a smalleffect on colligative properties [237]. The ability to modify the rate and shape of ice-crystal growth andprotect cellular membranes during lipid-phase transitions has resulted in identification of a number ofpotential applications of AFGPs as food additives, and in applications for the cryopreservation andhypothermal storage of cells and tissues [238,239].
The efficiency of freezing and the resulting quality of commercial products are affected by twoimportant factors: supercooling (the cooling of liquid below its freezing point, without freezing) andnucleation (the initiation of the crystallization of liquid water into solid ice). Both phenomena can bemodified by the presence of two kinds of proteins that show opposite behaviors [238], both of whichprovide enormous technological potential in industrial processes [41].
INAs, on the one hand, decrease the extent of supercooling and so increase the temperature of het-erogeneous nucleation (TnINAS in Fig. 10), thus decreasing the freezing time and promoting the forma-tion of a large number of ice crystals with dendritic structure [235]. AFPs, on the other hand, decreasethe temperature of heterogeneous (TnAFP in Fig. 10) supercooling, generate very small ice crystals,lower the freezing temperature, and retard ice recrystallization on frozen storage [237]. Major potentialapplications of INAs and AFPs have been reviewed elsewhere [41,238]. Beneficial effects of INAswould be manifested in reduced energy costs and smaller ice-crystal sizes, the latter favoring qualityand shelf-life improvements. Bacterial INAs have been employed in freezing processes for meats [240]and products difficult to concentrate or freeze-dry, such as fruit juices or pastes [241]. The managementof ice-nucleation and -crystallization times can also be employed in the development of new products[242]. AFPs are natural products that constitute part of a normal diet, through their occurrence at highconcentrations in food fishes and vegetables. AFPs from vegetables have a number of potential appli-cations. For example, they have been shown to improve the texture of frozen dough and the retentionof volatile compounds in crumb foods, through the addition of a concentrated carrot extract containingcarrot AFP [243].
Table 7 summarizes the main strategies discussed in Section 6, which allow some living organ-isms to survive adverse conditions, in relation to their location in a state diagram.
© 2011, IUPAC Pure Appl. Chem., Vol. 83, No. 8, pp. 1567–1617, 2011
Potential applications of state diagrams 1607
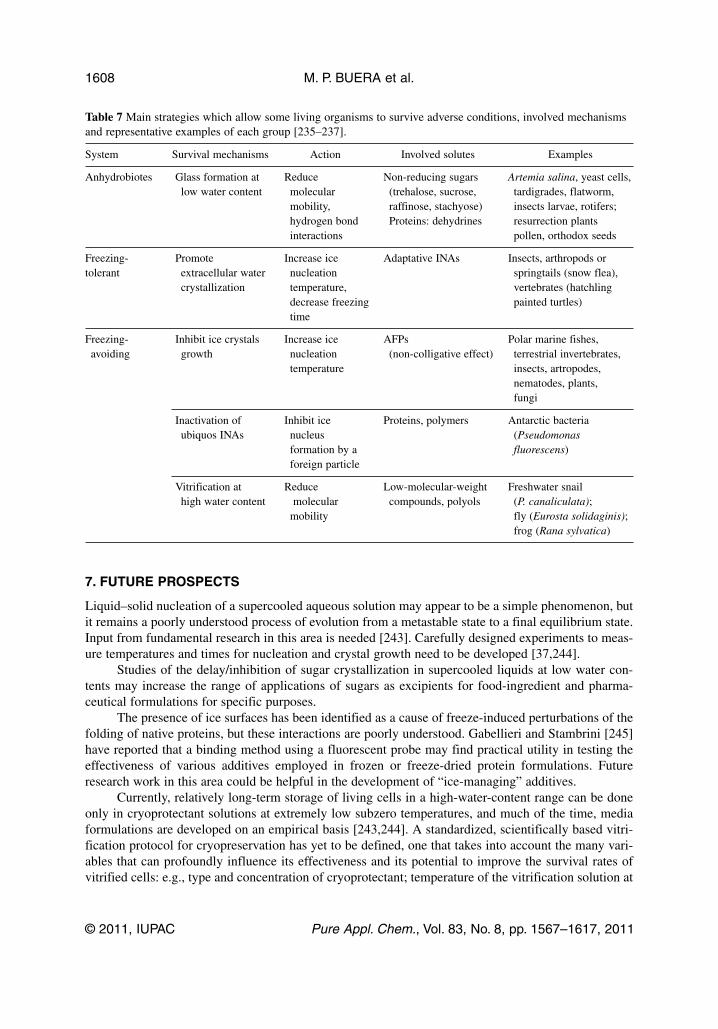
Table 7 Main strategies which allow some living organisms to survive adverse conditions, involved mechanismsand representative examples of each group [235–237].
System Survival mechanisms Action Involved solutes Examples
Anhydrobiotes Glass formation at Reduce Non-reducing sugars Artemia salina, yeast cells,low water content molecular (trehalose, sucrose, tardigrades, flatworm,
mobility, raffinose, stachyose) insects larvae, rotifers;hydrogen bond Proteins: dehydrines resurrection plantsinteractions pollen, orthodox seeds
Freezing- Promote Increase ice Adaptative INAs Insects, arthropods ortolerant extracellular water nucleation springtails (snow flea),
crystallization temperature, vertebrates (hatchlingdecrease freezing painted turtles)time
Freezing- Inhibit ice crystals Increase ice AFPs Polar marine fishes, avoiding growth nucleation (non-colligative effect) terrestrial invertebrates,
temperature insects, artropodes, nematodes, plants,fungi
Inactivation of Inhibit ice Proteins, polymers Antarctic bacteriaubiquos INAs nucleus (Pseudomonas
formation by a fluorescens)foreign particle
Vitrification at Reduce Low-molecular-weight Freshwater snailhigh water content molecular compounds, polyols (P. canaliculata);
mobility fly (Eurosta solidaginis);frog (Rana sylvatica)
7. FUTURE PROSPECTS
Liquid–solid nucleation of a supercooled aqueous solution may appear to be a simple phenomenon, butit remains a poorly understood process of evolution from a metastable state to a final equilibrium state.Input from fundamental research in this area is needed [243]. Carefully designed experiments to meas-ure temperatures and times for nucleation and crystal growth need to be developed [37,244].
Studies of the delay/inhibition of sugar crystallization in supercooled liquids at low water con-tents may increase the range of applications of sugars as excipients for food-ingredient and pharma-ceutical formulations for specific purposes.
The presence of ice surfaces has been identified as a cause of freeze-induced perturbations of thefolding of native proteins, but these interactions are poorly understood. Gabellieri and Stambrini [245]have reported that a binding method using a fluorescent probe may find practical utility in testing theeffectiveness of various additives employed in frozen or freeze-dried protein formulations. Futureresearch work in this area could be helpful in the development of “ice-managing” additives.
Currently, relatively long-term storage of living cells in a high-water-content range can be doneonly in cryoprotectant solutions at extremely low subzero temperatures, and much of the time, mediaformulations are developed on an empirical basis [243,244]. A standardized, scientifically based vitri-fication protocol for cryopreservation has yet to be defined, one that takes into account the many vari-ables that can profoundly influence its effectiveness and its potential to improve the survival rates ofvitrified cells: e.g., type and concentration of cryoprotectant; temperature of the vitrification solution at
M. P. BUERA et al.
© 2011, IUPAC Pure Appl. Chem., Vol. 83, No. 8, pp. 1567–1617, 2011
1608
exposure; duration of exposure to the final cryoprotectant, before plunging the material into liquid nitro-gen.
The relatively high cost of freezing processes currently used in the food industry, and the searchfor products with special structures, could represent a major impetus to innovations in freezing tech-niques (e.g., wider use of INAs or AFPs). Additional work to analyze costs vs. benefits, balancingenergy savings and product-quality improvements, is essential, prior to final commercialization orindustrial applications [41].
Potential areas for further research include the study of macroscopic and molecular properties ofmaterials, such as the incidence and effect of sub-Tg relaxations on the kinetics of chemical reactions,and of local heterogeneities in water distribution at microscopic length scales. Also, quantification ofstructural effects, such as collapse and compression, would be valuable for a more complete interpreta-tion of the kinetics of deteriorative reactions.
In relation to analytical tools, developments in infrared thermography, different microscopic tech-niques, and magnetic resonance spectroscopies and imaging techniques, for cryo- and dehydro-pre-served systems, have been shown to be powerful tools for the interpretation of the mechanisms ofdynamic changes in metastable systems, and are expected to contribute further, with new advances inthese areas [245,246].
8. CONCLUDING REMARKS
A major advantage from constructing supplemented phase/state diagrams is in identifying the differentstates and transitions of a material, such as freezing point and glass transition, which aids understand-ing of the complex changes that potentially will occur, when water content and temperature are varied[2]. A state diagram also assists one in identifying conditions necessary for storage stability, as well asin selecting suitable conditions of temperature and moisture content for processing [2,146,245].Analysis of a phase/state diagram is recommended, before significant modifications in formulation andhandling procedures are made in advance of large-scale food production.
We have analyzed the rates of different physico-chemical phenomena, from the perspective ofphase/state diagrams for the matrices in which they take place. In order to optimize the efficiency ofdehydro-protectant agents for biomolecules, construction of state diagrams is a good starting point foranalysis of the dynamics of quality changes, but such diagrams should be complemented by knowledgeabout any intermolecular interactions that may take place. Beyond supramolecular aspects, such as Tgand crystallinity, the density of molecular packing of matrices, reducing power, and hydrogen-bondingcapacity can also contribute to determining the effectiveness of biomolecule protectants. Electrolytescommonly present in biological media or food and pharmaceutical formulations have been shown tomodify metastable systems, affecting the kinetics of water and sugar crystallization and enzyme inacti-vation, by both molecular and supramolecular interactions [92,203].
Real, complex systems such as foods or biological materials cannot be easily represented by abinary-state diagram. However, if the all nonaqueous components are considered as a whole (total solidscontent), the glass-transition and ice-melting curves can be displayed with sufficient accuracy to be ofvalue and a pseudobinary diagram can be easily be obtained [201]. As discussed in this report, manytimes the dominant solute/s within a system can be identified (e.g., lactose in dairy products[75,88,123,128,129], sucrose in confectionery and baked foods, starch in cereal products, sugars infruit, vegetable tissues including seeds). This is acceptable provided no components of the nonaqueoussolute mix separates out, and proved to be an adequate approximation for analyzing the global behav-ior of dry and frozen foods [2,14-18,26,30,201,251], seeds, and cell preservation formulations[35,37,41,42,46-48,72,79,153,232,234]. It should be realized, however, that in complex systems differ-ent regions or different component molecules in different regions may exist, and thus may require thedescription by multiple binary state diagrams [201].
© 2011, IUPAC Pure Appl. Chem., Vol. 83, No. 8, pp. 1567–1617, 2011
Potential applications of state diagrams 1609
Glass transition alone may not be sufficient as a generic criterion for determining a system’s sta-bility, since specific solid–water interactions and other structural characteristics of systems can alsoexert control over the dependence of reaction rates on relative humidity [170]. In addition to affectingchemical reactions via aw and by plasticizing amorphous systems [6], water mobility itself has beendemonstrated to have a direct impact on chemical reactivity in low- and intermediate-moisture systems[104,105]. Nevertheless, glass transition is definitely one of the factors affecting system stability [2],and a future challenge remains to combine the glass-transition concept with other pertinent mechanismsor factors [247]. In such a way, beyond the valuable information provided by locating plausible systemconditions (compositions/temperatures) on supplemented phase/state diagrams, structural aspects ofmatrices in which a reaction takes place, water-sorption properties, and mobility have also been identi-fied as key aspects required for a more complete interpretation to describe the dynamics of major chem-ical reactions [104,105,119].
It is interesting to note that the different aspects discussed in the present paper illustrate syner-gistic interactions at the multidisciplinary interfaces of physics, chemistry, medicine, biotechnology,food science and technology, pharmacy, and biology, with regard to the preservation of living organismssuch as embryos and cells, structures such as liposomes, and also labile biomolecules such as proteins,antibodies, and hormones.
MEMBERSHIP OF SPONSORING BODY
Membership of the Physical and Biophysical Chemistry Committee for the period 2008–2009 was asfollows:
President: M. J. Rossi (Switzerland); Vice President: A. J. McQuillan (New Zealand); Secretary:R. M. Lynden-Bell (UK); Titular Members: J. H. Dymond (UK); A. Goldbeter (Belgium); J.-G. Hou(China); R. Marquardt (France); B. D. Sykes (Canada); K. Yamanouchi (Japan); Associate Members:A. R. H. Goodwin (USA); S.-J. Kim (Korea); G. R. Moore (UK); C. Prestidge (Australia); M. Rico(Spain); A. K. Wilson (USA); National Representatives: F. Akhtar (Bangladesh); M. Chalaris(Greece); A. Friedler (Israel); O. V. Mamchenko (Ukraine); S. Riazuddin (Pakistan); S. Stølen(Norway); V. Tsakova (Bulgaria); M. Witko (Poland).
Membership of the Task Group on the Thermodynamic and Non-equilibrium Criteria for Developmentand Application of Supplemented Phase Diagrams was as follows:
Chair: H. R. Corti (Argentina); Members: C. A. Angell (USA); T. Auffret (UK); M. P. Buer(Argentina); H. Levine (USA); D. S. Reid (USA); Y. Roos (Ireland); L. Slade (USA).
ACKNOWLEDGMENTS
H.R.C and M.P.B. thank CONICET, ANPCyT and the University of Buenos Aires for financial support.
REFERENCES
1. L. Slade, H. Levine. Carbohydr. Polym. 8, 183 (1988).2. L. Slade, H. Levine. Crit. Rev. Food Sci. Nutr. 30, 115 (1991). 3. L. Slade, H. Levine. J. Food Eng. 22, 143 (1994). 4. L. Slade, H. Levine. In Food Preservation by Moisture Control (ISOPOW Practicum II),
G. Barbosa-Cánovas, J. Welti-Chanes (Eds.), pp. 33–132, Technomic, Lancaster, PA (1995).5. L. Slade, H. Levine. J. Food Eng. 24, 431 (1995).6. L. Slade, H. Levine. Adv. Food Nutr. Res. 38, 103 (1995).7. L. Slade, H. Levine, J. W. Finley. In Protein Quality and the Effects of Processing, R. D. Phillips,
J. W. Findley (Eds.), pp. 9–124, Marcel Dekker, New York (1989).
M. P. BUERA et al.
© 2011, IUPAC Pure Appl. Chem., Vol. 83, No. 8, pp. 1567–1617, 2011
1610
8. H. Levine, L. Slade. Carbohydr. Polym. 6, 213 (1986). 9. H. Levine, L. Slade. In Dough Rheology and Baked Product Texture, H. Faridi, J. M. Faubion
(Eds.), pp. 157–300, Van Nostrand Reinhold, New York (1990).10. H. Levine, L. Slade. In Physical Chemistry of Foods, H. Schwartzberg, R. Hartel (Eds.), pp.
83–221, Marcel Dekker, New York (1992).11. H. Levine, L. Slade. In The Glassy State in Foods, J. M. V. Blanshard, P. J. Lillford (Eds.), pp.
333–373, Nottingham University Press, Loughborough, UK (1993).12. Y. H. Roos. J. Food Sci. 52, 433 (1987). 13. Y. Roos, M. Karel. Biotechnol. Prog. 6, 159 (1990).14. Y. Roos, M. Karel. Int. J. Food Sci. Technol. 26, 553 (1991). 15. Y. Roos, M. Karel. J. Food Sci. 56, 38 (1991). 16. Y. Roos, M. Karel. Food Technol. 45, 66 (1991). 17. Y. Roos, M. Karel. J. Food Sci. 56, 1676 (1991). 18. Y. Roos, M. Karel. Cryo-Lett. 12, 367 (1991).19. Y. Roos, M. Karel. J. Food Sci. 57, 775 (1992). 20. Y. H. Roos. In Phase Transitions in Foods, Academic Press, San Diego (1995).21. Y. Roos. J. Food Eng. 24, 339 (1995). 22. Y. H. Roos. In Handbook of Food Engineering, 2nd ed., D. Heldman, D. Lund (Eds.), pp.
288–346, CRC Press, Boca Raton (2007).23. H. R. Costantino, S. P. Schwendeman, R. Langer, A. M. Klibanov. Biochemistry (Moscow) 63,
357 (1998).24. T. Arakawa, S. N. Timasheff. Biochemistry 21, 6536 (1982).25. J. F. Carpenter, M. J. Pikal, B. S. Chang, T. W. Randolph. Pharm. Res. 14, 969 (1997).26. J. H. Crowe, J. F. Carpenter, L. M. Crowe. Annu. Rev. Physiol. 60, 73 (1998). 27. J. S. Clegg. Comp. Biochem. Physiol., B 128, 613 (2001). 28. E. Shalaev, F. Franks. In Amorphous Food and Pharmaceutical Systems, H. Levine (Ed.), pp.
200–215, RSC Publishing, Cambridge, UK (2002).29. H. R. Corti, C. A. Angell, T. Auffret, H. Levine, M. P. Buera, D. S. Reid, Y. H. Roos, L. Slade.
Pure Appl. Chem. 82, 1065 (2010).30. D. S. Reid. In Water Properties of Food, Pharmaceutical and Biological Materials, M. P. Buera,
J. Welti-Chanes, P. Lillford, H. R. Corti (Eds.), pp. 59–76, CRC Taylor and Francis, Boca Raton(2004).
31. F. Franks. In Freeze-Drying of Pharmaceuticals and Biopharmaceuticals. Principles andPractice, Chap. 5, RSC Publishing, Cambridge, UK (2007).
32. B. Luyet, D. Rasmussen. Biodynamica 10, 137 (1967). 33. D. Rasmussen, B. Luyet. Biodynamica 10, 319 (1969). 34. D. Simatos, M. Faure, E. Bonjour, M. Couach. Cryobiology 12, 202 (1975).35. B. Wowk, G. M. Fahy. Cryobiology 44, 14 (2002).36. A. P. MacKenzie. Philos. Trans. R. Soc. London, Ser. B 278, 167 (1977). 37. N. Du, X. Y. Liu, C. L. Hew. J. Biol. Chem. 278, 36000 (2003).38. R. W. Hartel. In Crystallization in Foods, p. 325, Aspen, Gaithersburg, MD (2001).39. D. S. Reid, W. Kerr, J. Hsu. J. Food Eng. 22, 483 (1994). 40. H. D. Goff. Pure Appl. Chem. 67, 1801 (1995). 41. P. J. Lillford, C. B. Holt. Philos. Trans R. Soc. London, Ser. B 357, 945 (2002). 42. S. Kattera, C. Chen. Int. Surg. 91, S55 (2006).43. F. Franks. In Water, A Compehensive Treatise, Vol. 7, F. Franks (Ed.), Plenum Press, London
(1982).44. F. Franks. Pure Appl. Chem. 65, 2527 (1993). 45. F. Franks. Bio: Technology 12, 253 (1994).
© 2011, IUPAC Pure Appl. Chem., Vol. 83, No. 8, pp. 1567–1617, 2011
Potential applications of state diagrams 1611
46. F. Franks. In Biophysics and Biochemistry at Low Temperatures, Cambridge University Press,Cambridge, UK (1995).
47. F. Franks. Eur. J. Pharm. Biopharm. 45, 221 (1998). 48. E. Shalaev, F. Franks. Cryobiology 33, 14 (1996).49. J. F. Carpenter, S. C. Hand, L. M. Crowe, J. H. Crowe. Arch. Biochem. Biophys. 50, 505 (1986).50. J. F. Carpenter, B. Martin, L. M. Crowe, J. H. Crowe. Cryobiology 24, 455 (1987).51. J. F. Carpenter, K.-I. Izutsu, T. W. Randolph. In Freeze-Drying/Lyophilization of Pharmaceuticals
and Biological Products, L. Rey, J. C. May (Eds.), pp. 123–160, Marcel Dekker, New York(1999).
52. W. Wang. Int. J. Pharm. 203, 1 (2000).53. M. J. Izzard, S. Ablett, P. J. Lillford. In Food Polymers, Gels and Colloids, E. Dickinson (Ed.),
pp. 289–300, RSC Publishing, Cambridge, UK (1991).54. R. A. Talja, Y. H. Roos. Thermochim. Acta 380, 109 (2001).55. H. D. Goff, E. Verespej, D. Jermann. Thermochim. Acta 399, 43 (2003). 56. M. Karel. In Drying ’91, A. S. Mujumdar, I. Filkova (Eds.), pp. 26–35, Elsevier, Amsterdam
(1991).57. M. Karel, S. Anglea, M. P. Buera, G. Levi, Y. Roos. Thermochim. Acta 246, 249 (1994).58. R. Karmas, M. P. Buera, M. Karel. J. Agric. Food Chem. 40, 873 (1992). 59. L. N. Bell, M. J. Hageman. J. Agric. Food Chem. 42, 2398 (1994). 60. L. N. Bell. Int. Food Res. 28, 591 (1995).61. M. P. Buera, M. Karel. Food Chem. 52, 167 (1995). 62. S. M. Lievonen, T. J. Laaksonen, Y. H. Roos. J. Agric. Food Chem. 46, 2778 (1998). 63. K. Kouasi, Y. H. Roos. J. Agric. Food Chem. 48, 2461 (2000).64. L. N. Bell, K. L. White. J. Food Sci. 65, 498 (2000). 65. G. W. White, S. H. Cakebread. J. Food Technol. 1, 73 (1966). 66. S. Tsourouflis, J. M. Flink, M. Karel. J. Sci. Food Agric. 27, 509 (1976).67. E. C. To, J. M. Flink. J. Food Technol. 13, 583 (1978).68. M. L. Williams, R. F. Landel, J. D. Ferry. J. Am. Chem. Soc. 77, 3701 (1955).69. T. Soesanto, M. C. Williams. J. Phys. Chem. 85, 3338 (1981).70. S. S. Sablani, A. K. Shresthac, B. R. Bhandari. J. Food Eng. 87, 416 (2008). 71. R. V. Tonon, A. F. Baroni, C. Brabet, O. Gibert, D. Pallet, M. D. Hubinger. J. Food Eng. 94, 215
(2009).72. G. Roudaut, D. Simatos, D. Champion, E. Contreras-Lopez, M. Le Meste. Innovative Food Sci.
Emerging Technol. 5, 127 (2004). 73. Y. H. Roos, K. Jouppila, B. Zielasko. J. Therm. Anal. 47, 1437 (1996). 74. M. P. Buera, C. Schebor, B. Elizalde. J. Food Eng. 67, 157 (2005). 75. G. Vuataz. Lait 82, 485 (2002).76. G. B. Stambrini, E. Gabellieri. Biophys. J. 70, 971 (1996).77. C. Van den Berg, D. Rose. Arch. Biochem. Biophys. 81, 319 (1959).78. S. Bakul, B. S. Bhatnagar, R. H. Bogner, M. J. Pikal. Pharm. Dev. Technol. 12, 505 (2007).79. W. Q. Sun, A. C. Leopold. Comp. Biochem. Physiol. 117A, 327 (1997).80. T. Suzuki, K. Imamura, K. Yamamoto, T. Satoh, M. Okazaki. J. Chem. Eng. Jpn. 30, 609 (1997).81. M. F. Mazzobre, J. M. Aguilera, M. P. Buera. Carbohydr. Res. 338, 541 (2003). 82. M. P. Buera. In Water Properties in Food, Health, Pharmaceutical and Biological Systems:
ISOPOW 10, D. S. Reid, T. Sajjaanantakul, P. J. Lillford, S. Charoenrein (Eds.), pp. 9–25, Wiley-Blackwell, Singapore (2010).
83. M. F. Mazzobre, P. R. Santagapita, N. Gutiérrez, M. P. Buera. In Food Engineering: IntegratedApproaches, G. Gutiérrez, G. Barbosa-Canovas, E. Parada-Arias (Eds.), pp. 73–87, Springer, NewYork (2008).
M. P. BUERA et al.
© 2011, IUPAC Pure Appl. Chem., Vol. 83, No. 8, pp. 1567–1617, 2011
1612
84. I. J. van den Dries, D. Van Dusschoten, M. A. Hemminga, E. van der Linden. J. Phys. Chem. B104, 10126 (2000).
85. M. F. Mazzobre, M. P. Buera, J. Chirife. Lebensm.-Wiss. Technol. 30, 324 (1997).86. M. F. Mazzobre, G. Soto, J. M. Aguilera, M. P. Buera. Food Res. Int. 34, 903 (2001). 87. P. Gabarra, W. Hartel. J. Food Sci. 63, 523 (1998).88. K. Jouppila, Y. H. Roos. J. Dairy Sci. 77, 2907 (1994). 89. L. Espinosa, C. Schebor, M. P. Buera, S. Moreno, J. Chirife. Cryobiology 52, 157 (2006). 90. K. M. Leinen, T. P. Labuza. J. Zhejiang Univ. Sci. 7, 85 (2006).91. L. A. Belcourt, T. P. Labuza J. Food Sci. 72, C065 (2007).92. M. P. Longinotti, M. F. Mazzobre, M. P. Buera, H. R. Corti. Phys. Chem. Chem. Phys. 4, 533
(2002).93. M. D. Ediger. Annu. Rev. Phys. Chem. 51, 99 (2000).94. S. Calligaris, M. C. Nicoli. Food Chem. 94, 130 (2006).95. A. Patist, H. Zoerb. Colloids Surf., B 40, 107 (2005). 96. M. F. Mazzobre, G. Hough, M. P. Buera. Food Sci. Technol. Int. 9, 163 (2003).97. V. M. Monnier, A. Cerami. Biochim. Biophys. Acta 760, 97 (1983). 98. J. W. Baynes, S. R. Thorpe. Diabetes 48, 1 (1999).99. A. La Rochette, I. Birlouez-Aragon, E. Silva, P. Morlière. Biochim. Biophys. Acta 1621, 235
(2003).100. T. P. Labuza, W. M. Baisier. In Physical Chemistry of Foods, H. G. Schwartzberg, R. W. Hartel
(Eds.), pp. 595–649, Marcel Dekker, New York (1992).101. J. E. Hodge. J. Agric. Food Chem. 1, 928 (1953). 102. K. Eichner, M. Karel. J. Agric. Food Chem. 20, 218 (1972).103. S. Saltmarch, T. P. Labuza. J. Food Sci. 45, 1231 (1980). 104. N. Acevedo, C. Schebor, M. P. Buera. J. Food Eng. 77, 1108 (2006). 105. N. Acevedo, C. Schebor, M. P. Buera. Food Chem. 108, 900 (2008).106. E. O. Timmermann, J. Chirife. J. Food Eng. 13, 171 (1991).107. A. Pyne, C. H. Koustov, R. Suryanarayanan. J. Pharm. Sci. 92, 2272 (2003).108. Y. Shimada, Y. Roos, M. Karel. J. Agric. Food Chem. 39, 637 (1991).109. S. Labrousse, Y. Roos, M. Karel. Sci. Aliments 12, 757 (1992).110. M. Karel, J. M. Flink. J. Agric. Food Chem. 21, 16 (1973).111. M. Karel, I. Saguy. In Water Relationships in Foods, H. Levine, L. Slade (Eds.), pp. 157–173,
Plenum Press, New York (1991).112. Y. F. Maa, H. R. Constantino, P. A. Nguyen, C. C. Hsu. Pharm. Dev. Technol. 2, 213 (1997).113. O. O. Omatete, C. Judson King. J. Food Technol. 13, 265 (1978).114. K. Selim, M. Tsimidou, C. G. Biliaderis. Food Chem. 71, 199 (2000).115. G. S. Serris, C. G. Biliaderis. J. Sci. Food Agric. 81, 691 (2001).116. G. Levi, M. Karel. J. Food Eng. 24, 1 (1995).117. S. M. Prado, M. P. Buera, B. E. Elizalde. J. Agric. Food Chem. 54, 79 (2006).118. S. A. Desobry, F. M. Netto, T. P. Labuza. J. Food Sci. 62, 1158 (1997).119. B. E. Elizalde, L. Herrera, M. P. Buera. J. Food Sci. 57, 3039 (2002).120. N. C. Acevedo, V. Briones, M. P. Buera, J. M. Aguilera. J. Food Eng. 85, 222 (2008).121. L. Burin, K. Jouppila, Y. H. Roos, J. Kansikas, M. P. Buera. Int. Dairy J. 14, 517 (2004).122. M. Kim, M. Saltmarch, T. P. Labuza. J. Food Process. Preserv. 5, 49 (1981). 123. L. Burin, K. Jouppila, Y. Roos, J. Kansikas, M. P. Buera. J. Agric. Food Chem. 48, 5263 (2000).124. V. R. N. Telis, P. J. A. Sobral. Food Res. Int. 35, 435 (2002).125. V. R. N. Telis, P. J. A. Sobral, J. Telis-Romero. Food Sci. Technol. Int. 12, 181 (2006). 126. M. S. Rahman. In Food Properties Handbook, CRC Press, Boca Raton (1995).127. R. J. Lloyd, X. Dong Chen, J. B. Hargreaves. Int. J. Food Sci. Technol. 31, 305 (1996).128. M. Kalichevsky, J. Blanshard, P. Tokarczuk. Int. J. Food Sci. Technol. 28, 139 (1993).
© 2011, IUPAC Pure Appl. Chem., Vol. 83, No. 8, pp. 1567–1617, 2011
Potential applications of state diagrams 1613

129. L. Burin, G. Hough, M. P. Buera, J. Chirife. Food Chem. 76, 423 (2002). 130. L. E. Chuy, T. P. Labuza. J. Food Sci. 59, 43 (1994). 131. G. Spigno, D. M. De Faveri. J. Food Eng. 62, 337 (2004).132. E. D. Orford, R. Parker, S. Ring, A. C. Smith. Int. J. Biol. Macromol. 11, 91 (1989).133. R. C. Hoseney, K. Zeleznak, C. S. Lai. Cereal Chem. 63, 285 (1986). 134. A. M. Cocero, J. L. Kokini. J. Rheol. 35, 257 (1991). 135. M. T. Kalichevsky, J. M. V. Blanshard. Carbohydr. Polym. 19, 271 (1992).136. J. A. Gray, J. N. BeMiller. Cereal Chem. 81, 278 (2004). 137. S. Hug-Iten, S. Handschin, B. Conde-Petit, F. Escher Lebensm.-Wiss. Technol. 32, 255 (1999).138. I. Toufeili, I. A. Lambert, J. L. Kokini. Cereal Chem. 79, 138 (2002).139. Y. H. Roos, M. Karel, J. L. Kokini. Food Technol. 50, 95 (1996).140. C. Biliaderis. In Thermal Analysis of Foods, V. Harwalkar, C. Ma (Eds.), pp. 168–220, Elsevier,
London (1990).141. P. Ribotta, A. León, M. C. Añón. Food Res. Int. 36, 357 (2003).142. P. H. Rasmussen, A. Hansen. Lebensm.-Wiss. Technol. 34, 487 (2001).143. C. Osella, H. Sánchez, M. de la Torre, C. Carrara, M. P. Buera. Starch/Stärke 57, 208 (2005).144. H. Jain, I. H. Jain. NASA/CP-2001-211029, pp. 169–182 (2001).145. S.S. Sablani, M. S. Rahman, S. Al-Busaidi, N. Guizani, N. Al-Habsi, R. Al-Belushi. Thermochim.
Acta 462, 56 (2007).146. S. S. Sablani, S. Kasapis, M. S. Rahman, A. Al-Jabria, N. Al-Habsi. Food Res. Int. 37, 915 (2004). 147. V. Sunooj, K. Radhakrishna, J. George, A. S. Bawa. J. Food Eng. 91, 347 (2009).148. N. Chennamsetty, V. Voynov, V. Kayser, B. Helk, B. L. Trout. Proc. Natl. Acad. Sci. USA 106,
11937 (2009).149. K. Izutsu, S. Kadoya, C. Yomota, T. Kawanishi, E. Yonemochi, K. Terada. Chem. Pharm. Bull.
57, 43 (2009).150. K.-I. Izutsu, Y. Fujimaki, A. Kuwabara, N. Aoyagi. Int. J. Pharm. 301, 161 (2005). 151. K.-I. Izutsu, S. Yoshioka, T. Terao. Biotechnol. Bioeng. 43, 1102 (2005).152. Y. Roos. Carbohydr. Res. 238, 39 (1993). 153. W. L. J. Hinrichs, M. G. Prinsen, H. W. Frijlink. Int. J. Pharm. 215, 163 (2001).154. A. Martini, R. E. Kune, M. Crivelente, R. Artico. J. Pharm. Sci. Technol. 51, 62 (1997).155. H. J. Kim, C. H. Shin, C. W. Kim. Biosci. Biotechnol. Biochem. 73, 61 (2009). 156. I. N. Yu, Milton, E. G. Groleau, D. S. Mishra, R. E. Vansickle. J. Pharm. Sci. 88, 196 (1999).157. A. Burger, J. O. Henck, S. Hetz, J. M. Rollinger, A. A. Weissnicht, H. Stottner. J. Pharm. Sci. 89,
457 (2000).158. V. I. Kett, S. Fitzpatrick, B. Cooper, D. Q. Craig. J. Pharm. Sci. 92, 1919 (2003).159. C. Telang, I. Yu, R. Suryanarayanan. Pharm. Res. 20, 660 (2003).160. M. J. Pikal, K. M. Dellerman, M. I. Roy, R. M. Riggin. Pharm. Res. 8, 427 (1991).161. K.-I. Izutsu, S. Yoshioka, T. Terao. Pharm. Res. 10, 1232 (1993).162. R. E. Johnson, C. E. Kirchhoff, H. T. Gaud. J. Pharm. Sci. 91, 914 (2002).163. T. Yoshinari, R. T. Forbes, P. York, Y. Karawahisma. Int. J. Pharm. 258, 109 (2003). 164. K.-I. Izutsu, S. Yoshioka, S. Kojima. Pharm. Res. 11, 995 (1994). 165. T. Randolph. J. Pharm. Sci. 86, 1198 (1997). 166. A. I. Kim, M. J. Akers, S. L. Nail. J. Pharm. Sci. 87, 931 (1998).167. R. K. Cavatur, N. M. Vemuri, A. Pyne, Z. Chrzan, D. Toledo-Velasquez. Pharm. Res. 19, 894
(2002). 168. K. Izutsu, S. Kojima. J. Pharm. Pharmacol. 54, 1033 (2002).169. K. Izutsu, S. O. Ocheda, N. Aoyagi, S. Kojima. Int. J. Pharm. 273, 85 (2004).170. M. F. Mazzobre, M. P. Buera. Biochim. Biophys. Acta 1473, 337 (1999).171. B. Wunderlich. In Thermal Characterization of Polymeric Materials, E. A. Turi (Ed.), pp.
91–234, Academic Press, New York (1981).
M. P. BUERA et al.
© 2011, IUPAC Pure Appl. Chem., Vol. 83, No. 8, pp. 1567–1617, 2011
1614

172. L. H. Sperling. In Introduction to Physical Polymer Science, 2nd ed., p. 594, John Wiley, NewYork (1992).
173. Y. H. Roos. J. Therm. Anal. Calorim. 71, 197 (2002).174. J. L. Green, J. Fan, C. A. Angell. J. Phys. Chem. 98, 13780 (1994). 175. M. S. Rahman, S. Kasapis, N. S. Z. Al-Kharusi, I. M. Al-Marhubi, A. J. Khan. J. Food Eng. 80,
1 (2007).176. S. B. Matiacevich, M. L. Castellión, S. B. Maldonado, M. P. Buera. Thermochim. Acta 448, 117
(2006).177. C. G. Biliaderis, C. M. Page, T. J. Maurice, B. O. Juliano. J. Agric. Food Chem. 34, 6 (1986).178. K. J. Zeleznak, R. C. Hoseney. Cereal Chem. 64, 121 (1987).179. T. J. Laaksonen, Y. H. Roos. J. Cereal Sci. 33, 331 (2001).180. T. J. Laaksonen, Y. H. Roos. J. Cereal Sci. 37, 319 (2003).181. S. J. Schmidt. Adv. Food Nutr. Res. 48, 1 (2004). 182. E. Vittadini, L. C. Dickinson, P. Chinachoti. Carbohydr. Polym. 46, 49 (2001).183. X. Lin, R. Ruan, P. Chen, M. Chung, X. Ye, T. Yang, C. Doona, T. Wagner. J. Food Sci. 71, R136
(2006).184. A. Farahnaky, I. A. Farhat, J. R. Mitchell, S. E. Hill. Food Hydrocol. 23, 1483 (2009). 185. P. S. Belton, I. J. Colquhoun, J. M. Field, A. Grant, P. R. Shewry, A. S. Tatham. J. Cereal Sci. 19,
115 (1994).186. A. E. Farroni, S. B. Matiacevich, S. Guerrero, S. M. Alzamora, M. P. Buera. J Agric. Food Chem.
56, 6447 (2008).187. H.-D. Isengard, T. P. Labuza, P. J. Lillford, D. S. Reid. IUFoST Bull. <http://www.iufost.org/
reports_resources/bulletins/IUF.SIB.Waterinfood.pdf.pdf> August (2008).188. M. Sugisaki, H. Suga, S. Seki. Bull. Chem. Soc. Jpn. 41, 2591 (1968).189. V. Velikov, S. Borik, C. A. Angell. Science 294, 2335 (2001).190. V. R. N. Telis, P. J. Sobral. Lebensm.-Wiss. Technol. 34, 199 (2001). 191. D. P. Miller, J. J. de Pablo, H. R. Corti. J. Phys. Chem. B 103, 10243 (1999).192. S. Suzuki, S. Kitamura. Food Hydrocol. 22, 862 (2008).193. J. Liesebach, T. Rades, M. Lim. Thermochim. Acta 401, 159 (2003). 194. C. A. Angell, D. R. Bressel, J. L Green, H. Kanno, M. Oguni, E. J. Sare. J. Food Eng. 22, 115
(1994).195. J. M. V. Blanshard, P. J. Lillford. In The Glassy State in Foods, Nottingham University Press,
Loughborough, UK (1993).196. R. Parker, S. G. Ring. Cryo-Lett. 16, 197 (1995).197. W. L. Kerr, D. S. Reid. Lebensm.-Wiss. Technol. 27, 225 (1994). 198. Y. I. Matveev, V. Y. Grinberg, V. B. Tolstoguzov. Food Hydrocol. 14, 425 (2000). 199. Z. Qiu, J. G. Stowell, K. R. Morris, S. R. Byrn, R. Pinal. Int. J. Pharm. 303, 20 (2005).200. R. M. Hill, L. A. Dissado. J. Phys. C: Solid State Physics 15, 5171 (1982). 201. O. R. Fennema, S. Damodaran, D. S. Reid. In Fennema’s Food Chemistry, S. Damodaran, K. L.
Parkin, O. R. Fennema (Eds.), pp. 17–82, CRC Press, Boca Raton (2008).202. M. Peleg. Crit. Rev. Food Sci. Nutr. 32, 59 (1992).203. K. A. Nelson, T. P. Labuza. J. Food Eng. 22, 271 (1994).204. M. P. Longinotti, H. R. Corti. J. Phys. Chem. Ref. Data 37, 11503 (2008). 205. L. Manzocco, M. C. Nicoli, M. Anese, A. Pitotti, E. Maltini. Food Res. Int. 31, 363 (1998).206. M. P. Recondo, B. E. Elizalde, M. P. Buera. J. Food Eng. 77, 126 (2006).207. H. A. Islesias, J. Chirife. J. Food Technol. 13, 137 (1978).208. S. J. Schmidt, H. Lai. In Water Relationships in Foods, H. Levine, L. Slade (Eds.), pp. 405–452,
Plenum Press, New York (1991).209. K. Jouppila, Y. H. Roos. Carbohydr. Polym. 32, 95 (1997).
© 2011, IUPAC Pure Appl. Chem., Vol. 83, No. 8, pp. 1567–1617, 2011
Potential applications of state diagrams 1615
210. K. Jouppila, J. Kansikas, Y. H. Roos. Biotechnol. Prog. 14, 347 (1998). 211. C. J. Kedward, W. Macnaughtan, J. R. Mitchell. J. Food Sci. 65, 324 (2000). 212. R. D. L. Marsh, J. M. V. Blanshard. Carbohydr. Polym. 9, 301 (1988). 213. E. A. M. Omar, Y. H. Roos. Lebensm.-Wiss. Technol. 40, 536 (2007).214. K. Jouppila, J. Kansikas, Y. H. Roos. Carbohydr. Polym. 36, 143 (1998).215. M. Avrami. J. Chem. Phys. 7, 1103 (1939). 216. A. N. Kolmogorov. Bull. Acad. Sci. USSR (Sci. Mater. Nat.) 3, 3551 (1937).217. W. A. Johnson, R. F. Mehl. Trans. AIME 135, 416 (1939). 218. P. L. Russell. Starch/Staerke 35, 277 (1983).219. M. A. Del Nobile, T. Martoriello, G. Mocci, E. La Notte. J. Food Eng. 59, 123 (2003).220. P. Chinachoti. In The Properties of Water in Foods, ISOPOW 6, D. S. Reid (Ed.), Blackie
Academic, London (1998).221. Y. Kou, L. C. Dickinson, P. Chinachoti. J. Agric. Food Chem. 48, 5489 (2000). 222. P. Chatakanonda, P. Chinachoti, K. Sriroth, K. Piyachomkwan, S. Chotineeranat, H. R. Tang,
B. Hills. Carbohydr. Polym. 53, 233 (2003). 223. S. Ablett, A. H. Darke, M. J. Izzard, P. J. Lillford. In The Glassy State in Foods, J. M. V.
Blanshard, P. J. Lillford (Eds.), pp. 189–206, Nottingham University Press, Loughborough, UK(1993).
224. R. Partanen, V. Marie, W. MacNaughtan, P. Forssell, I. Farhat. Carbohydr. Polym. 56, 147 (2004).225. M. Watanabe, T. Kikawada, N. Minagawa, F. Yukuhiro, T. Okuda. J. Exper. Biol. 205, 2799
(2002).226. J. M. Aguilera, M. Karel. Crit. Rev. Food Sci. Nutr. 37, 287 (1997).227. J. Buitink, O. Leprince. Cryobiology 48, 215 (2004).228. F. A. Hoekstra. Integr. Comp. Biol. 45, 725 (2005). 229. R. L. Obendorf. Seed Sci. Res. 7, 63 (1997). 230. U. M. N. Murthy, P. P. Kumar, W. Q. Sun. J. Exp. Bot. 54, 1057 (2003). 231. P. Cerrutti, M. Segovia, M. Galvagno, C. Schebor, M. P. Buera. Appl. Microbiol. Biotechnol. 54,
575 (2000).232. C. Walters. Biophys. J. 86, 1253 (2004).233. V. Panza, V. Láinez, S. B. Maldonado, H. Maroder, M. P. Buera. In Water Properties of Food,
Pharmaceutical and Biological Materials, M. P. Buera, J. Welti-Chanes, P. Lillford, H. R. Corti(Eds.), CRC Taylor and Francis, Boca Raton (2006).
234. M. Sacandé, J. Buitink, F. A. Hoekstra. J. Exp. Bot. 51, 635 (2000). 235. M. S. Clark, M. A. S. Thorne, J. Purać, G. Grubor-Lajšić, M. Kube, R. Reinhardt, M. R. Worland.
BMC Genomics 8, 475 (2007). 236. H. Kawahara. J. Biosci. Bioeng. 94, 492 (2002).237. K. E. Zachariassen, E. Kristiansen. Cryobiology 41, 257 (2000).238. B. Li, D.-W. Sun. J. Food Eng. 54, 175 (2002).239. M. Harding, P. Anderberg, A. D. J. Haymet. Eur. J. Biochem./FEBS 270, 1381 (2003).240. S. R. Payne, D. Stanford, A. Harris, O. A. Young. Meat Sci. 37, 429 (1994).241. J. Li, T.-C. Lee. Trends Food Sci. Technol. 6, 259 (1995).242. M. Watanabe, S. Arai. J. Food Eng. 22, 453 (1994).243. L. Zhang, W. Zhu, L. Song, Y. Wang, H. Jiang, S. Xian, Y. Ren. Int. J. Mol. Sci. 10, 2031 (2009).244. A. F. Heneghan, P. W. Wilson, A. D. J. Haymet. Proc. Natl. Acad. Sci. USA 99, 9631 (2002).245. E. Gabellieri, G. B. Strambini. Biophys. J. 90, 3239 (2006). 246. D. Mietchen, D. Manz, F. Volke, K. Storey. PLoS ONE 3, 1 (2008).247. M. S. Rahman. Trends Food Sci. Technol. 17, 129 (2006). 248. S. S. Sablani, S. Kasapis, M. S. Rahman. J. Food Eng. 78, 266 (2007).249. N. Murase, F. Franks. Biophys. Chem. 34, 293 (1989). 250. B. S. Chang, C. S. Randall. Cryobiology 29, 632 (1992).
M. P. BUERA et al.
© 2011, IUPAC Pure Appl. Chem., Vol. 83, No. 8, pp. 1567–1617, 2011
1616
251. O. R. Fennema. In Low-temperature Preservation of Foods and Living Matter, O. R. Fennema,W. D. Powrie, E. H. Marth (Eds.), pp. 101–149, Marcel Dekker, New York (1973).
252. M. M. Sá, A. M. Sereno. Thermochim. Acta 246, 285 (1994). 253. M. S. Rahman, S. Sablani, N. Al-Habsi, S. Al-Maskri, R. Al-Belusi. J. Food Sci. 70, E135 (2005).254. A. M. Goula, T. D. Karapantsios, D. S. Achilias, K. G. Adamopoulos. J. Food Eng. 85, 73 (2008).255. S. Kasapis, M. S. Rahman, N. Guizani, M. Al-Aamri. Agric. Food Chem. 48, 3779 (2000).256. Y. Bai, M. S. Rahman, C. O. Perera, B. Smith, L. D. Melton. Food Res. Int. 34, 89 (2001). 257. J. Welti-Chanes, J. A. Guerrero, M. E. Barcenas, J. M. Aguilera, F. Vergara, G. V. Barbosa-
Canovas. J. Food Process. Eng. 22, 91 (2007). 258. G. Moraga, N. Martínez-Navarrete, A. Chiralt. J. Food Eng. 72, 147 (2006). 259. H. Wang, S. Zhang, G. J. Chen. J. Food Eng. 84, 307 (2008).260. P. J. A. Sobral, V. R. N. Telis, A. M. Q. B. Habitante, A. Sereno. Thermochim. Acta 376, 83 (2001).261. M. A. Silva, P. J. A. Sobral, T. G. J. Kieckbuscha. J. Food Eng. 77, 426 (2006).262. R. M. Syamaladevi, S. S. Sablani, J. Tang, J. Powers, B. G. Swanson. J. Food Eng. 91, 460 (2009). 263. S. Khalloufi, Y. El-Maslouhi, C. Ratti. J. Food Sci. 65, 842 (2000). 264. M. J. Fabra, P. Talens, G. Moraga, N. Martínez-Navarrete. J. Food Eng. 93, 52 (2009). 265. S. S. Sablani, L. Bruno, S. Kasapis, R. M. Symaladevi. J. Food Eng. 90, 110 (2009).266. A. E. Delgado, D. Sun. J. Food Eng. 55, 1 (2002). 267. M. S. Rahman, S. Kasapis, N. Guizani, O. S. Al-Amri. J. Food Eng. 57, 321 (2003). 268. T. Suzuki. Food Hydrol. 22, 862 (2008).269. C. Ohkuma, K. Kawai, C. Viriyarattanasak, T. Mahawanich, S. Tantratian, R. Takai, T. Suzuki.
Food Hydrocol. 22, 255 (2008).270. R. C. Brake, O. R. Fennema. J. Food Sci. 64, 10 (1999). 271. K. Tanaka, T. Takeda, K. Miyajima. Chem. Pharm. Bull. 39, 1091 (1991). 272. A. Ramos, N. D. H. Raven, R. J. Sharp, S. Bartolucci, M. Rossi, R. Cannio, J. Lebbink, J. Van
Der Oost, W. M. De Vos, H. Santos. Appl. Environ. Microbiol. 83, 4020 (1997). 273. A. Hawe, W. Friess. Eur. J. Pharm. Sci. 28, 224 (2006).274. N. K. Jain, I. Roy. Eur. J. Pharm. Biopharm. 69, 824 (2008). 275. S. D. Allison, A. Donga, J. F. Carpenter. Biophys. J. 71, 2022 (1996).276. L. Bush, C. Webb, L. Bartlett, B. Burnett. Semin. Hematol. 35, 18 (1998).277. W. Garzon-Rodriguez, R. L. Koval, S. Chongprasert, S. Krishnan, T. W. Randolph, N. W. Warne,
J. F. Carpenter. J. Pharm. Sci. 93, 684 (2003). 278. B. S. Chang, G. Reeder, J. F. Carpenter. Pharm. 13, 243 (1996).279. Y. Han, B. S. Jin, S. B. Lee, Y. Sohn, J. Joung, J. H. Lee. Arch. Pharm. Res. 30, 1124 (2007).280. S. J. Prestrelski, T. Arakawa, J. F. Carpenter. Arch. Biochem. Biophys. 303, 465 (1993).281. A. W. Ford, P. J. Dawson. J. Pharm. Pharmacol. 45, 86 (1993).282. S. B. Petersen, V. Jonson, P. Fojan, R. Wimmer, S. Pedersen. J. Biotechnol. 114, 269 (2004).283. F. W. L. Hulse, R. T. Forbes, M. C. Bonnera, M. Getrost. Eur. J. Pharm. Sci. 33, 294 (2008). 284. R. A. DePaz, D. A. Dale, C. C. Barnett, J. F. Carpenter, A. L. Gaertnerb, T. W. Randolph. Enzyme
Microb. Technol. 31, 765 (2002). 285. M. S. Rahman. Int. J. Food Properties 7, 407 (2004). 286. M. S. Rahman, R. M. Al-Belushi, N. Guizani, G. S. Al-Saidi, B. Soussi. Food Chem. 114, 1257
(2009).
Republication or reproduction of this report or its storage and/or dissemination by electronic means is permitted without theneed for formal IUPAC permission on condition that an acknowledgment, with full reference to the source, along with use of thecopyright symbol ©, the name IUPAC, and the year of publication, are prominently visible. Publication of a translation intoanother language is subject to the additional condition of prior approval from the relevant IUPAC National AdheringOrganization.
© 2011, IUPAC Pure Appl. Chem., Vol. 83, No. 8, pp. 1567–1617, 2011
Potential applications of state diagrams 1617