improving vlbi processing by using ... - ivscc.bkg.bund.de
TRANSCRIPT

Johanna Juhl et al.: Improving VLBI Processing by using Homogeneous Data for Pressure and Temperature, IVS2012 General Meeting Proceedings, p.241–245http://ivscc.gsfc.nasa.gov/publications/gm2012/juhl.pdf
Improving VLBI Processing by using Homogeneous Data forPressure and Temperature
Johanna Juhl 1, Karine Le Bail 2, John Gipson 2, Dan MacMillan 2
1) Chalmers University of Technology2) NVI, Inc./NASA Goddard Space Flight Center
Contact author: Johanna Juhl, e-mail: [email protected]
Abstract
Pressure and temperature affects the processing of VLBI data via the atmospheric delay and thethermal deformation of the antenna. Errors in meteorological data cause errors in the estimationof station coordinates, predominantly local Up, of up to several mm, and degrade baseline lengthrepeatability. To improve the homogeneity of the meteorological data, we enhanced Solve to give usersthe ability to use external meteorological data. Initially we used pre-derived pressure and temperatureseries from ECMWF obtained from the Institute of Geodesy and Geophysics at the Vienna Universityof Technology. However these series contain jumps due to strategy changes, which will affect the VLBIcalculations. Therefore we derived time series for all the VLBI sites from the ECMWF model ERA-Interim, using the same model for the entire period. Using this homogeneous pressure series derivedfrom ECMWF improves the WRMS repeatability for 52% of the baselines, with 12% having unchangedWRMS repeatability, while using the temperature series derived from ECMWF improves the WRMSrepeatability for 47% of the baselines considered, with 19% having unchanged WRMS repeatability.
1. Introduction. Meteorological Data Used by Solve
17−Jun−2002 17:31:03 18−Jun−2002 17:31:03−40
−30
−20
−10
0
10
20
30
Wes
tford
tem
pera
ture
in C
elsi
us d
egre
e
Figure 1. Westford temper-
ature on 17/18 June 2002
according to the Calc/Solve
databases. The temperature
is in Celsius degrees.
Pressure and temperature are used in Very Long Baseline In-terferometry (VLBI) data processing. The hydrostatic delay usedto calibrate the measured delay is directly proportional to pres-sure. Temperature is used to calculate the linear expansion of thetelescope components as VLBI telescopes are deformed by time-dependent temperature effects. Because of these effects, biases,discontinuities, and outliers in the meteorological data will affectthe quality of the VLBI solutions.
Previously, in [4], we showed that the meteorological data inthe Mark III databases (denoted MK3DB in the following) usedby Solve in routine VLBI processing contains missing, biased, andinaccurate data. For example, at Westford we noticed discontinu-ities in the MK3DB pressures due to a change of sensors: afterthe MET3 sensor broke down, it was replaced by a GPS networkmeteorological sensor located 100m away from the antenna.Another example is shown in Figure 1. An abnormal temperaturebehavior at Westford shows a daily drop of more than 50◦C duringthe 17/18 June 2002 session.
IVS 2012 General Meeting Proceedings 241

Johanna Juhl et al.: Homogeneous Data for Pressure and Temperature
Another significant problem of the MK3DB is missing data. In 2008, 46 stations participatedin 167 sessions, twelve of which have some missing meteorological data. Two of the major stationsof the network, Zelenchukskaya and Fortaleza, were missing more than 90%. In the case of missingdata, the strategy of Solve is to use a constant default value computed from the position of thestation. In [4] we showed that the impact on the quality of the VLBI processing is significant: usingthe Solve default values, we found a degradation of the WRMS of baseline scatter of 0.12 mm overtwo weeks in the case of Zelenchukskaya, and of up to 1 mm over 9.5 years in the case of Westford.Hence using a constant default value to replace missing data is not a satisfactory solution. Thevertical component determination is also affected by erroneous meteorological data. Simulationshave shown that it varies significantly with a change in pressure (−0.12 mm/mbar for Svetloe forexample).
Our results show that it is necessary to have a homogeneous meteorological data record in theMK3DB. The optimal solution would be to have a homogeneous network of meteorological sensorsfor VLBI, as specified for VLBI2010. As this has not been the case, we investigated anothersolution: using homogeneous time series of pressure and temperature derived from a model. Forthat, we computed pressure and temperature from the ECMWF weather model (ERA-Interim)for each VLBI site. We modified Solve to accept this external data.
In Section 2 we describe two alternative sources for time series of pressure and temperature:a set developed by the Vienna University of Technology (TU Vienna) for computing VMF1 andanother set developed at GSFC derived from the ECMWF model ERA-Interim. In Section 3, wewill quantify the improvement using these two sets of time series compared with using the datafrom the MK3DB.
2. Alternative Sources for Pressure and Temperature Data
Among the various possibilities for alternative sources of meteorological data, we used twosources derived from different weather models from the European Centre for Medium-RangeWeather Forecasts (ECMWF).
2.1. Pressure and TemperatureTime Series Developed forVMF1 Computation
The GSFC VLBI group uses theVienna Mapping Function (VMF) pro-vided by the IVS group of TU Vienna.The VMF was first introduced, andthen updated with VMF1 [1], using adifferent strategy for computing themapping function coefficients. BothVMF and VMF1 are computed usingthe 40 years of reanalysis data (ERA-40)from 1979 to 2001 and then operationalmodels since 2002.
Figure 2. Moving average (window = 10 days) differ-
ences of V-ECM pressure relative to MK3DB pressure
for three stations: Westford, Tsukuba, and Wettzell.
242 IVS 2012 General Meeting Proceedings
Johanna Juhl et al.: Homogeneous Data for Pressure and Temperature
The VMF files contain the coefficients of VMF (hydrostatic coefficient and wet coefficient,hydrostatic zenith delay and wet zenith delay) as well as temperature and pressure at the site.This data is given every six hours, the same resolution as ECMWF. First, we compared thesetime series (called V-ECM in the following) with the data extracted from MK3DB. Figure 2displays the moving average differences in pressure for Westford, Tsukuba, and Wettzell. Westfordhas a large discontinuity of 3.2 mbar, while the discontinuity for Tsukuba is −1.1 mbar and forWettzell −1.6 mbar. This occurred when VMF was replaced with VMF1. Kouba [3] confirms ourconclusions. Kouba compared the hydrostatic zenith path delays of the gridded VMF1 with thesite-dependent VMF1 zenith path delays and detected biases and discontinuities up to 4 cm.
2.2. Pressure and Temperature Time Series Developed at GSFC from theECMWF Model ERA-Interim
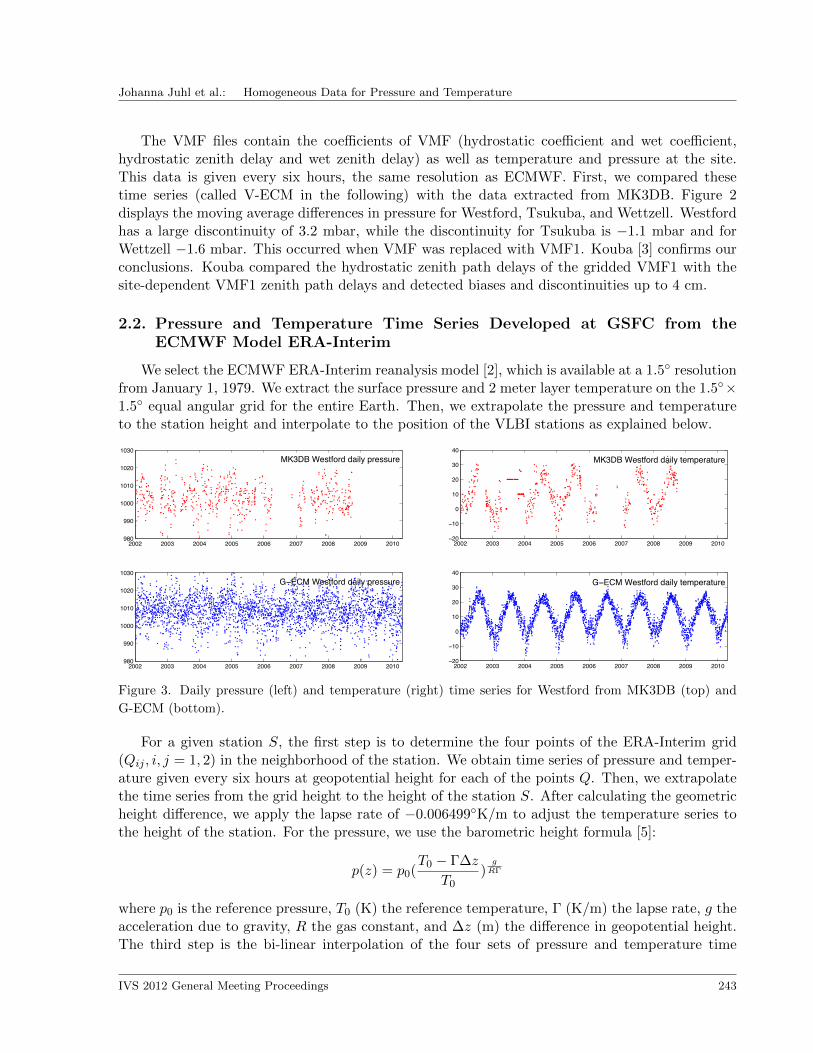
We select the ECMWF ERA-Interim reanalysis model [2], which is available at a 1.5◦ resolutionfrom January 1, 1979. We extract the surface pressure and 2 meter layer temperature on the 1.5◦×1.5◦ equal angular grid for the entire Earth. Then, we extrapolate the pressure and temperatureto the station height and interpolate to the position of the VLBI stations as explained below.
2002 2003 2004 2005 2006 2007 2008 2009 2010980
990
1000
1010
1020
1030MK3DB Westford daily pressure
2002 2003 2004 2005 2006 2007 2008 2009 2010980
990
1000
1010
1020
1030G−ECM Westford daily pressure
2002 2003 2004 2005 2006 2007 2008 2009 2010−20
−10
0
10
20
30
40MK3DB Westford daily temperature
2002 2003 2004 2005 2006 2007 2008 2009 2010−20
−10
0
10
20
30
40G−ECM Westford daily temperature
Figure 3. Daily pressure (left) and temperature (right) time series for Westford from MK3DB (top) and
G-ECM (bottom).
For a given station S, the first step is to determine the four points of the ERA-Interim grid(Qij , i, j = 1, 2) in the neighborhood of the station. We obtain time series of pressure and temper-ature given every six hours at geopotential height for each of the points Q. Then, we extrapolatethe time series from the grid height to the height of the station S. After calculating the geometricheight difference, we apply the lapse rate of −0.006499◦K/m to adjust the temperature series tothe height of the station. For the pressure, we use the barometric height formula [5]:
p(z) = p0(T0 − Γ∆z
T0)
gRΓ
where p0 is the reference pressure, T0 (K) the reference temperature, Γ (K/m) the lapse rate, g theacceleration due to gravity, R the gas constant, and ∆z (m) the difference in geopotential height.The third step is the bi-linear interpolation of the four sets of pressure and temperature time
IVS 2012 General Meeting Proceedings 243
Johanna Juhl et al.: Homogeneous Data for Pressure and Temperature
series: a linear interpolation in the x-direction first and then in the y-direction. This informationis publicly available for 171 VLBI sites at http://lacerta.gsfc.nasa.gov/met/ from 1979 until thecurrent time. These time series are called G-ECM in the following. Figure 3 gives an example ofthe time series obtained for the station Westford, compared with the data extracted from MK3DB.
3. Using Homogeneous Data for Pressure and Temperature
In this section, we show the improvement in results obtained using external data for pressureand temperature from V-ECM or G-ECM instead of MK3DB.
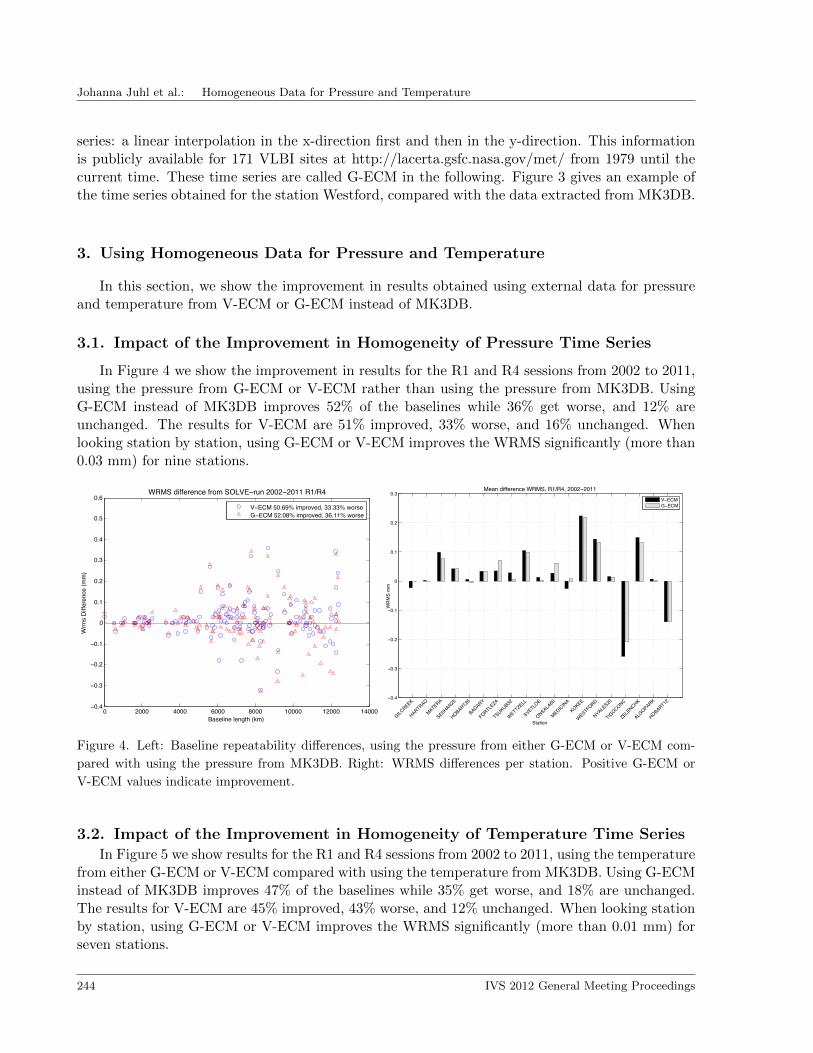
3.1. Impact of the Improvement in Homogeneity of Pressure Time Series
In Figure 4 we show the improvement in results for the R1 and R4 sessions from 2002 to 2011,using the pressure from G-ECM or V-ECM rather than using the pressure from MK3DB. UsingG-ECM instead of MK3DB improves 52% of the baselines while 36% get worse, and 12% areunchanged. The results for V-ECM are 51% improved, 33% worse, and 16% unchanged. Whenlooking station by station, using G-ECM or V-ECM improves the WRMS significantly (more than0.03 mm) for nine stations.
0 2000 4000 6000 8000 10000 12000 14000−0.4
−0.3
−0.2
−0.1
0
0.1
0.2
0.3
0.4
0.5
0.6
Baseline length (km)
Wrm
s Di
ffere
nce
(mm
)
WRMS difference from SOLVE−run 2002−2011 R1/R4
V−ECM 50.69% improved, 33.33% worseG−ECM 52.08% improved, 36.11% worse
−0.4
−0.3
−0.2
−0.1
0
0.1
0.2
0.3
WRM
S m
m
Station
Mean difference WRMS, R1/R4, 2002−2011
GILCREEK
HARTRAO
MATERA
SESHAN25
HOBART26
BADARY
FORTLEZA
TSUKUB32
WETTZELL
SVETLOE
ONSALA60
MEDICINA
KOKEE
WESTFORD
NYALES20
TIGOCONC
ZELENCHK
ALGOPARK
HOBART12
V−ECMG−ECM
Figure 4. Left: Baseline repeatability differences, using the pressure from either G-ECM or V-ECM com-
pared with using the pressure from MK3DB. Right: WRMS differences per station. Positive G-ECM or
V-ECM values indicate improvement.
3.2. Impact of the Improvement in Homogeneity of Temperature Time SeriesIn Figure 5 we show results for the R1 and R4 sessions from 2002 to 2011, using the temperature
from either G-ECM or V-ECM compared with using the temperature from MK3DB. Using G-ECMinstead of MK3DB improves 47% of the baselines while 35% get worse, and 18% are unchanged.The results for V-ECM are 45% improved, 43% worse, and 12% unchanged. When looking stationby station, using G-ECM or V-ECM improves the WRMS significantly (more than 0.01 mm) forseven stations.
244 IVS 2012 General Meeting Proceedings

Johanna Juhl et al.: Homogeneous Data for Pressure and Temperature
0 2000 4000 6000 8000 10000 12000 14000−0.5
−0.4
−0.3
−0.2
−0.1
0
0.1
0.2
0.3
Baseline length (km)
Wrm
s Di
ffere
nce
(mm
)
WRMS difference from SOLVE−run 2002−2011 R1/R4
External V−ECM 45.13% improved, 43.05% worseExternal G−ECM 46.53% improved, 34.72% worse −0.08
−0.06
−0.04
−0.02
0
0.02
0.04
0.06
0.08
0.1
WRM
S m
m
Station
Mean difference WRMS, R1/R4, 2002−2011
GILCREEK
HARTRAO
MATERA
SESHAN25
HOBART26
BADARY
FORTLEZA
TSUKUB32
WETTZELL
SVETLOE
ONSALA60
MEDICINA
KOKEE
WESTFORD
NYALES20
TIGOCONC
ZELENCHK
ALGOPARK
HOBART12
External V−ECMExternal G−ECM
Figure 5. Left: Baseline repeatability differences, using the temperature from either G-ECM or V-ECM
compared with using the temperature from MK3DB. Right: WRMS differences per station.
4. Conclusions
The Mark III databases used to process VLBI data with Solve contain missing and inaccuratedata that affects the quality of the solutions. Using external sources of data derived from ECMWFsuch as V-ECM or the G-ECM newly developed at GSFC significantly improves the WRMS of thesolutions. G-ECM is available online for 171 VLBI sites and can be extended to other stations,upon request.
Since the processing results are significantly affected by the homogeneity of the data, a globalreanalysis of the VLBI data may be necessary.
References
[1] Boehm, J.,B. Werl, H. Schuh. Troposphere mapping functions for GPS and very long baseline interfer-ometry from European Centre for Medium-Range Weather Forecasts operational analysis data. In: J.Geophys. Res., 111, B02406, doi:10.1029/2005JB003629, 2006.
[2] Dee, D.P., S.M. Uppala, A.J. Simmons, et al. The ERA-Interim reanalysis: configuration and per-formance of the data assimilation system, In: Q J R Meteorol Soc 2011, volume 137, pages 553-597,2011.
[3] Kouba, J., Implementation and testing of the gridded Vienna mapping function 1 (vmf1), In: Journalof Geodesy, volume 82(4-5), pages 193-205, 2007.
[4] Le Bail, K., J. Gipson, Strategy to improve the homogeneity of meteorological data in Mark3 databases,In: Proceedings of the 20th meeting of the european VLBI group for geodesy and astronomy, pages138-141, 2011.
[5] Zdunkowski, W., A. Bott, In: Thermodynamics of the Atmosphere: A Course in Theoretical Meteo-rology, Cambridge University Press, Cambridge, U. K., page 251, 2004.
IVS 2012 General Meeting Proceedings 245