ultra-wideband 3d image processing for improving landmine
TRANSCRIPT

Paper Ultra-wideband 3D image
processing for improving landmine
detection with GPREveline E. Ligthart, Alexander G. Yarovoy, Friedrich Roth, and Leo P. Ligthart
Abstract—This paper describes a new landmine detection al-
gorithm starting from high resolution 3D ground penetrat-
ing radar (GPR) images. The algorithm consists of two
procedures, object detection and object classification; both
strongly depend on the properties of 3D GPR images. The
algorithm has been tested on data measured with an ultra-
wideband (UWB) video impulse radar (VIR) system devel-
oped by the International Research Centre for Telecommu-
nications and Radar (IRCTR). It was found that the algo-
rithm is able to detect all landmines (including difficult to
detect M14 mines) and classifies almost all landmines cor-
rectly with a large reduction in the number of false alarms
caused by clutter. It turns out that for clutter removal it
is most effective to eliminate detected objects with a small
height.
Keywords— ground penetrating radar, image processing, object
detection, classification, clutter removal.
1. Introduction
Improving detectability and decreasing the false alarm rate
of a ground penetrating radar (GPR) sensor for landmine
detection is the main objective of numerous researches in
the past years. Some improvements can be obtained in soft-
ware processing, particularly for mine detection in GPR
images, by optimising image processing techniques. The
contribution of this paper lies in reducing the false alarm
rate and obtaining a better performance than existing meth-
ods in GPR landmine detection.
Earlier research on object detection has been performed.
In [1], landmines have been detected using an 2D energy
projection of a synthetic aperture radar (SAR) image vol-
ume. Also research of object detection and classification
of landmines in 2D images has been performed [2]. As
for 3D image analysis, only object visualization [3] has
been performed. However, to our knowledge landmine de-
tection and classification using the 3D nature of GPR im-
ages is new.
The goal of this paper is to describe the developed algo-
rithm that uses specific properties of these images to detect
landmines. The algorithm should meet a number of de-
mands:
• All recognizable landmines need to be detected.
• A low number of false alarms is required.
• Multiple 2D images are combined to form 3D images.
In the algorithm all actual 3D image information is
used for detection and classification.
• The performance of the algorithm should be validated
based on actual GPR measurements.
The novelty of this paper is the development of an algo-
rithm, which detect landmines in GPR images using their
3D nature.
In Section 2 the acquisition and preprocessing of the
data is described including a short description of its
properties. Section 3 presents the detection procedure for
3D GPR images. The classification procedure is addressed
in detail in Section 4. The results and a discussion of
the performance are given in Section 5. Finally, the pa-
per ends with conclusions and some recommendations in
Section 6.
2. Generation of the 3D GPR image
and its properties
The measurement campaign for the acquisition of the mea-
surement data [4] was performed on a dry sandy lane at
the test facilities for landmine detection systems located at
TNO Physics and Electronics Laboratory in The Hague,
The Netherlands. During the measurement campaign the
GPR system has been mounted on the relocatable scanner
of the Delft University of Technology. It scans along one
axis measuring A-scans every 1 cm and combines them to
B-scans along the other axis with an interval of 1 cm as
well. The measured area is 170 cm by 196 cm and 20 cm
in depth. Two types of landmine simulants are buried
there: PMN mines (metal content, diameter: 11.2 cm) and
M14 mines (very low metal content, diameter: 5.6 cm).
In total, 12 mines are buried (6 PMN mines and 6 M14
mines) and one unintentionally buried man-made object
which radar image has such strong resemblance to that of
a landmine that it is also labeled as a wanted target. Fur-
ther, some false alarms like stones, a bottle and a piece of
barbed wire are intentionally buried. All other objects are
referred to as clutter and are unwanted in the detection and
classification process.
The GPR system that was used to acquire the data is the
polarimetric ultra-wideband (UWB) video impulse radar
(VIR) system. This system has been developed by IRCTR
9

Eveline E. Ligthart, Alexander G. Yarovoy, Friedrich Roth, and Leo P. Ligthart
and is dedicated to buried landmine detection. The VIR
system consists of 2 transmit antennas and 4 receive anten-
nas as seen in Fig. 1. The data is measured in a co-polar
antenna combination and with the receive antenna in
“monostatic” and in “bistatic” mode. For further infor-
mation about the VIR system one is referred to [5].
Fig. 1. Top view of the antenna system.
Before image processing is performed, the acquired data
have to be preprocessed to remove system instabilities and
to reduce clutter. The latter can be obtained by applying
SAR processing using a three-dimensional imaging method.
All performed preprocessing steps including the 3D imag-
ing method are found in [6].
Properties of 3D radar images of wanted targets that dis-
criminate them from clutter are used for detection and clas-
sification of these wanted targets. These are the rotationally
symmetric amplitude distribution of wanted target images
in horizontal cross section, the high amplitudes and the ap-
pearance in many depth slices (the total depth is sampled
with a step of 0.25 cm resulting in 80 depth slices).
3. Object detection
Before object detection is applied, the envelope of each
A-scan in the 3D image is computed. This is done to elim-
inate zero crossings and negative amplitudes in the time-
domain signal. The phase of the envelope is not used,
because such phase analysis (allowing for investigating dis-
continuities in permittivity) is beyond the scope of this
work.
To detect the wanted targets in the 3D image, a threshold
procedure is used. Instead of using a fixed threshold pro-
cedure, an adaptive threshold technique is used to establish
different threshold values for each depth slice of the 3D im-
age. The reason for using different thresholds is that the
amount of clutter is much higher in depth slices contain-
ing residuals of the ground reflection than in other depth
slices and therefore needs a higher threshold value to avoid
detection of clutter.
The used adaptive threshold technique is called the decreas-
ing threshold procedure. For each depth slice all possible
threshold values are applied. For each threshold value, ob-
jects are grouped in the resulting binary depth slice; the
number of these detected objects is computed and is plot-
ted against the accompanying threshold value. The result-
ing curve is different for each depth slice, but it has roughly
the same shape (Fig. 2). From experience, it turned out that
Fig. 2. Number of detected object images versus threshold value.
The solid curve represents a depth slice with high amount of
clutter, while the dashed curve is the result from a depth slice
with low amount of clutter. The horizontal lines represent 30%
of the maximum values of the curves with T(high) and T(low) as
resulting threshold values.
Fig. 3. Binary 3D image volume after threshold procedure.
the best threshold value is situated at the beginning of the
steep slope in the curve. This threshold value can be found
by calculating a percentage of the maximum number of de-
tected objects in the curve and determine its accompanying
threshold value. The choice for this percentage is based
on the minimum size of the buried landmines in the mea-
sured area and is set to 30% of the maximum of the curve.
10

Ultra-wideband 3D image processing for improving landmine detection with GPR
In Fig. 2 it is seen that for depth slices with a low amount
of clutter the threshold value will be lower than for depth
slices with a high amount of clutter.
The 3D binary result after applying the decreasing threshold
procedure is shown in Fig. 3. Not only are the wanted
targets detected, but also surface clutter and other unwanted
objects. It is still difficult to distinguish the wanted targets
from these unwanted objects and therefore classification
is performed to eliminate the clutter and to obtain a low
number of false alarms.
4. Object classification
Classification is based on the established properties of
wanted targets. Because it is desirable to remove clut-
ter objects before classification, size based clutter removal
(Subsection 4.1) is applied. For classification of all remain-
ing objects (Subsection 4.3), features are extracted from the
established properties and selected (Subsection 4.2).
4.1. Size based clutter removal
Based on the dimensions of the wanted targets, two types of
object removal are applied: removal of objects with a large
horizontal size and removal of objects with a small height.
4.1.1. Removal of objects with a large horizontal size
Especially the residuals from the ground reflection re-
sult into detected objects with large horizontal dimensions.
These are extremely unwanted for further processing and do
not meet the dimension criteria for wanted targets. There-
fore, these object images should be removed from the
3D image volume. The removal is performed per depth
slice.
An unwanted secondary but slightly acceptable conse-
quence is the possibility that wanted target images merged
with clutter images in one or more depth slices are removed
as well. To avoid this as much as possible, the horizontal
size limit needs to be set with a sufficient margin.
4.1.2. Removal of objects with a small height
The most characteristic property of wanted targets is their
appearance in many depth slices. The height of the wanted
target images depends on the spatial length of the radar
pulse in soil (vertical resolution), the sampling, the depth
of the wanted targets (related to the intensity), the physical
height of the wanted targets and the chosen threshold value
for object detection.
The removal of object images with small height is per-
formed by taking image slices in vertical directions along
the x- and y-direction respectively and removing all objects
smaller than an established height limit. This height limit
is based on the height of the smallest and weakest wanted
target image in the data.
Fig. 4. Binary 3D image volume after size based clutter removal.
The overall result after the size based clutter removal is
shown in Fig. 4, where the amount of detected clutter ob-
jects is decreased by 70% from 351 to 112 objects.
4.2. Feature extraction
Feature extraction is a preparatory step for the classification
of the detected object images and has a big influence on
the distinction of wanted target images from clutter images.
The features are divided into four categories: statistical,
structure-, shape- and size-based features. Due to the ear-
lier performed size-based clutter removal no features have
been selected from the last category. The statistical and
structure-based features are computed from intensity im-
ages and therefore require a 3D window to be placed around
the detected objects [7]. The shape based features are com-
puted from binary images.
The quality of a feature depends on its discriminating
power, reliability and independency with other features.
Based on these criteria, nine features (F1 to F9) are
determined to be used in the feature selection:
Statistical based features
F1 maximum intensity
F2 ratio of mean over maximum intensity
F3 ratio of minimum over maximum intensity
F4 standard deviation
Structure based features
F5 similarity with a template
F6 similarity between orthogonal horizontal cross lines
F7 depth similarity
Shape based features
F8 eccentricity of the bounding ellipse
F9 ratio of minor axis over major axis lengths
11

Eveline E. Ligthart, Alexander G. Yarovoy, Friedrich Roth, and Leo P. Ligthart
4.3. Classification
To limit the computational time, the best performing fea-
tures of the total feature set are selected (with the so-called
forward feature selection method [8]) to be used in the
classification process.
The classifier is based on a simple classification rule.
For testing of the classification routine the leave-one-out
method is used to obtain training and test sets from the
feature set without having a large amount of objects in
this feature set. The classification boundary is calculated
from the training set, which is then used to decide whether
a test object is a wanted target or a clutter object. To min-
imize the risk of having a missed detection, the boundary
is computed with a certain safety margin, which is 5% of
the overall maximum value of the specific feature added to
the boundary. In Fig. 5 scatter plots for two features are
plotted including the computed boundaries, showing that
the boundaries eliminate many clutter objects.
The selected feature set contains 5 features. These are: the
maximum intensity (F1), because wanted target reflections
Fig. 5. Scatterplot of feature F2 and F5 including the classifica-
tion boundary.
Fig. 6. Binary 3D image volume after classification.
exhibit high amplitudes; the ratio of the mean over the max-
imum intensity (F2); similarity with a template (F5), where
the template is a representative horizontal cross section of
one of the wanted target images; similarity between orthog-
onal horizontal cross lines (F6), because of the rotationally
symmetric amplitude distribution of wanted target images
in horizontal cross section; and the ratio of the length of
the minor axis over that of the major axis (F9), also because
of the circular shape of the wanted target images.
After classification, 20 false alarm objects retain in the im-
age volume as can be seen in Fig. 6. This corresponds to
a clutter reduction of more than 80%.
Because of the limited down-range resolution, it is not pos-
sible to have two distinctive landmine reflection events in
a depth range of 20 cm which are situated closer than the
smallest possible distance between two landmines. There-
fore, these object images have to be merged into one object
image.
5. Performance of the algorithm
Besides the requirement that 100% of all wanted targets
have to be detected, the algorithm has to meet also another
requirement which is the low amount of false alarms. In
Fig. 7 the clutter reduction for each image processing pro-
Fig. 7. Reduction of the amount of object images per procedure
(solid line). The dashed line represents the number of the buried
landmines in the test-lane area. Procedures are: a, b – size based
clutter reduction; c, d, e, f, g – classification performance per
feature; h – merging of objects due to down-range resolution.
cedure of the algorithm is shown. It is remarkable that the
largest reduction of clutter is achieved by applying a size-
based clutter removal; that is, the removal of objects with
a small height (procedure b). The increase in amount of
clutter objects in procedure a is due to division of objects
into more objects by removing parts of objects with a large
horizontal size per depth slice.
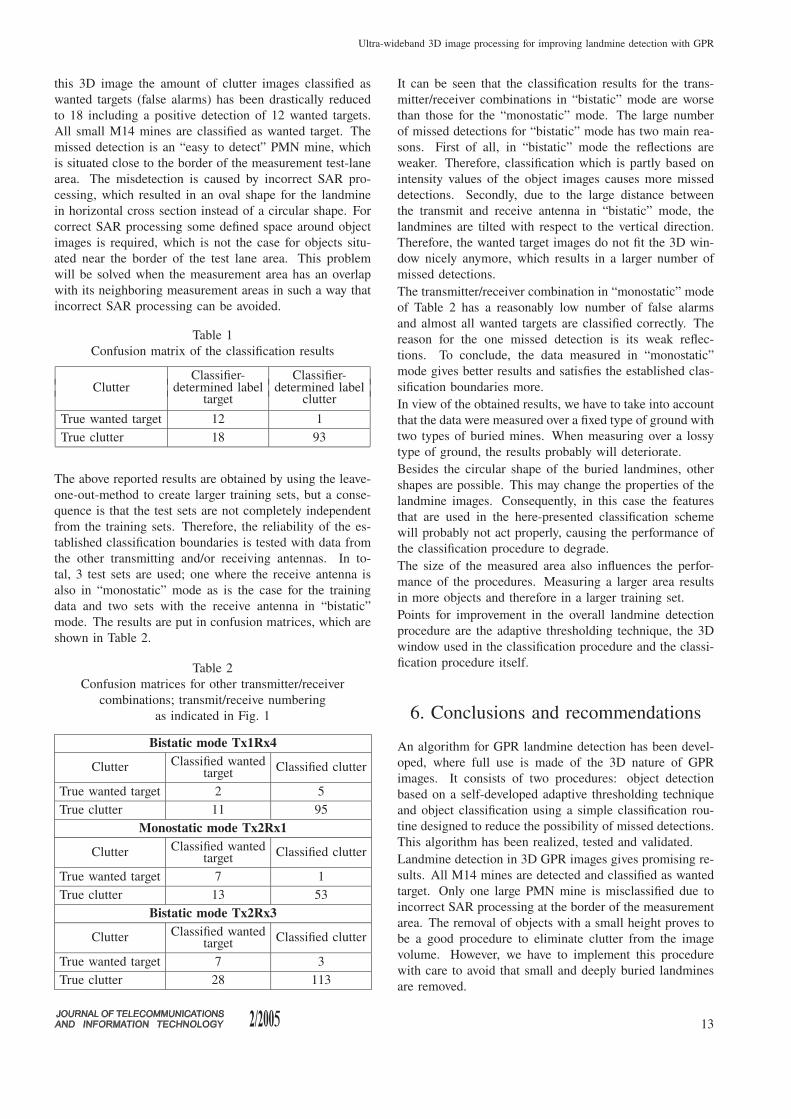
The results of the classification method are shown in
the confusion matrix of Table 1. It demonstrates that for
12
Ultra-wideband 3D image processing for improving landmine detection with GPR
this 3D image the amount of clutter images classified as
wanted targets (false alarms) has been drastically reduced
to 18 including a positive detection of 12 wanted targets.
All small M14 mines are classified as wanted target. The
missed detection is an “easy to detect” PMN mine, which
is situated close to the border of the measurement test-lane
area. The misdetection is caused by incorrect SAR pro-
cessing, which resulted in an oval shape for the landmine
in horizontal cross section instead of a circular shape. For
correct SAR processing some defined space around object
images is required, which is not the case for objects situ-
ated near the border of the test lane area. This problem
will be solved when the measurement area has an overlap
with its neighboring measurement areas in such a way that
incorrect SAR processing can be avoided.
Table 1
Confusion matrix of the classification results
Classifier- Classifier-Clutter determined label determined label
target clutter
True wanted target 12 1
True clutter 18 93
The above reported results are obtained by using the leave-
one-out-method to create larger training sets, but a conse-
quence is that the test sets are not completely independent
from the training sets. Therefore, the reliability of the es-
tablished classification boundaries is tested with data from
the other transmitting and/or receiving antennas. In to-
tal, 3 test sets are used; one where the receive antenna is
also in “monostatic” mode as is the case for the training
data and two sets with the receive antenna in “bistatic”
mode. The results are put in confusion matrices, which are
shown in Table 2.
Table 2
Confusion matrices for other transmitter/receiver
combinations; transmit/receive numbering
as indicated in Fig. 1
Bistatic mode Tx1Rx4
Clutter Classified wantedtarget
Classified clutter
True wanted target 2 5
True clutter 11 95
Monostatic mode Tx2Rx1
Clutter Classified wantedtarget
Classified clutter
True wanted target 7 1
True clutter 13 53
Bistatic mode Tx2Rx3
Clutter Classified wantedtarget
Classified clutter
True wanted target 7 3
True clutter 28 113
It can be seen that the classification results for the trans-
mitter/receiver combinations in “bistatic” mode are worse
than those for the “monostatic” mode. The large number
of missed detections for “bistatic” mode has two main rea-
sons. First of all, in “bistatic” mode the reflections are
weaker. Therefore, classification which is partly based on
intensity values of the object images causes more missed
detections. Secondly, due to the large distance between
the transmit and receive antenna in “bistatic” mode, the
landmines are tilted with respect to the vertical direction.
Therefore, the wanted target images do not fit the 3D win-
dow nicely anymore, which results in a larger number of
missed detections.
The transmitter/receiver combination in “monostatic” mode
of Table 2 has a reasonably low number of false alarms
and almost all wanted targets are classified correctly. The
reason for the one missed detection is its weak reflec-
tions. To conclude, the data measured in “monostatic”
mode gives better results and satisfies the established clas-
sification boundaries more.
In view of the obtained results, we have to take into account
that the data were measured over a fixed type of ground with
two types of buried mines. When measuring over a lossy
type of ground, the results probably will deteriorate.
Besides the circular shape of the buried landmines, other
shapes are possible. This may change the properties of the
landmine images. Consequently, in this case the features
that are used in the here-presented classification scheme
will probably not act properly, causing the performance of
the classification procedure to degrade.
The size of the measured area also influences the perfor-
mance of the procedures. Measuring a larger area results
in more objects and therefore in a larger training set.
Points for improvement in the overall landmine detection
procedure are the adaptive thresholding technique, the 3D
window used in the classification procedure and the classi-
fication procedure itself.
6. Conclusions and recommendations
An algorithm for GPR landmine detection has been devel-
oped, where full use is made of the 3D nature of GPR
images. It consists of two procedures: object detection
based on a self-developed adaptive thresholding technique
and object classification using a simple classification rou-
tine designed to reduce the possibility of missed detections.
This algorithm has been realized, tested and validated.
Landmine detection in 3D GPR images gives promising re-
sults. All M14 mines are detected and classified as wanted
target. Only one large PMN mine is misclassified due to
incorrect SAR processing at the border of the measurement
area. The removal of objects with a small height proves to
be a good procedure to eliminate clutter from the image
volume. However, we have to implement this procedure
with care to avoid that small and deeply buried landmines
are removed.
13
Eveline E. Ligthart, Alexander G. Yarovoy, Friedrich Roth, and Leo P. Ligthart
The now-available object detection procedure also needs an
expert decision; however in future this decision could be
determined by the size and possible depth of the buried
landmines.
The classifier in the object classification procedure is quite
simple, but effective. When paying more attention to the
selection of the classification method, it might be better to
use a neural network as classifier, which “learns” to separate
landmines from clutter based on their radar images.
The performance of a landmine detection system is also
improved sensor fusion. Merging different sensors like the
metal detector, the infrared detector and GPR into one land-
mine detection system [2] leads to the necessary further
development of algorithms with improved performance.
References
[1] A. G. Yarovoy, V. Kovalenko, F. Roth, L. P. Ligthart, and R. F. Bloe-
menkamp, “Multi-waveform full-polarimetric GPR sensor for land-
mine detection: first experimental results”, in Int. Conf. Requir. Tech-
nol. Detect., Remov. Neutr. Landm. UXO, Brussels, Belgium, 2003,
pp. 554–560.
[2] F. Cremer, W. de Jong, and K. Schutte, “Fusion of polarimetric in-
frared features and GPR features for landmine detection”, in 2nd Int.
Worksh. Adv. GPR, Delft, The Netherlands, 2003, pp. 222–227.
[3] L. Zanzi, M. Lualdi, H. M. Braun, W. Borisch, and G. Triltzsch, “An
ultra high frequency radar sensor for humanitarian demining tested
on different scenarios in 3D imaging mode”, in 9th Int. Conf. Ground
Penetr. Radar, Proc. SPIE, vol. 4758, pp. 240–245, 2002.
[4] A. G. Yarovoy, V. Kovalenko, F. Roth, J. van Heijenoort, P. Hakkaart,
W. de Jong, F. Cremer, J. B. Rhebergen, P. J. Fritz, M. A. Ouwens, and
R. F. Bloemenkamp, “Multi-sensor measurement campaign at TNO-
FEL test lanes in July 2002”, in Int. Conf. Requir. Technol. Detect.,
Remov. Neutr. Landm. UXO, Brussels, Belgium, 2003, pp. 208–215.
[5] A. G. Yarovoy, L. P. Ligthart, A. Schukin, and I. Kaplun, “Polari-
metric video impulse radar for landmine detection”, Subsurf. Sens.
Technol. Appl., vol. 3, no. 4, pp. 271–293, 2002.
[6] J. Groenenboom and A. G. Yarovoy, “Data processing and imaging in
GPR system dedicated for landmine detection”, Subsurf. Sens. Tech-
nol. Appl., vol. 3, no. 4, pp. 387–402, 2002.
[7] E. E. Ligthart, “Landmine detection in high resolution 3D GPR im-
ages”, M.Sc. thesis, Delft University of Technology, Faculty of Elec-
trical Engineering, Mathematics and Computer Science, Delft, The
Netherlands, 2003.
[8] A. R. Webb, Statistical Pattern Recognition. London: Hodder, Arnold,
2001.
Eveline E. Ligthart was born
in Leiden, The Netherlands, on
February 18, 1979. She re-
ceived the M.Sc. degree in elec-
trical engineering from the
Delft University of Technol-
ogy, The Netherlands, in March
2004. The present paper is part
of her graduation thesis “Land-
mine detection in high reso-
lution 3D GPR images” per-
formed at the International Research Centre for Telecom-
munications and Radar (IRCTR). At present, she is
a pattern recognition scientist at Prime Vision in Delft,
The Netherlands. Her work includes the recognition of
postal addresses and license plates.
e-mail: [email protected]
International Research Centre
for Telecommunications and Radar (IRCTR)
Faculty of Electrical Engineering,
Mathematics and Computer Science
Delft University of Technology
Mekelweg st 4
2628 CD Delft, The Netherlands
Alexander G. Yarovoy grad-
uated from the Kharkov State
University, Ukraine, in 1984
with the diploma with honor
in radio physics and electron-
ics. He received the Cand. phys.
and math. sci. and Dr. phys. and
math. sci. degrees (all in radio
physics) in 1987 and 1994, re-
spectively. In 1987 he joined
the Department of Radiophysics
at the Kharkov State University as a Researcher and became
a Professor there in 1997. From September 1994 through
1996 he was with Technical University of Ilmenau, Ger-
many, as a Visiting Researcher. Since 1999 he is with
the International Research Centre for Telecommunications
and Radar (IRCTR) at the Delft University of Technology,
The Netherlands, where he coordinates all GPR-related
projects. Currently his main research interests are in ultra-
wideband technology including radars and in applied elec-
tromagnetics.
e-mail: [email protected]
International Research Centre
for Telecommunications and Radar (IRCTR)
Faculty of Electrical Engineering,
Mathematics and Computer Science
Delft University of Technology
Mekelweg st 4
2628 CD Delft, The Netherlands
Friedrich Roth was born in
Munich, Germany, in 1972.
He received a M.Sc. degree in
geophysics from the Colorado
School of Mines (CSM), USA,
in 1999. While at CSM, he
studied the possible use of in-
ertial navigation for real-time
antenna position and orienta-
tion estimation for ground pen-
etrating radar data acquisition.
Since 2000 he has been a Ph.D. student at the Interna-
tional Research Centre for Telecommunications and Radar
(IRCTR) at the Delft University of Technology, The Nether-
lands, working on landmine detection problems. His cur-
rent research interests include electromagnetic scattering
14
Ultra-wideband 3D image processing for improving landmine detection with GPR
from buried landmines, deconvolution and target identifi-
cation, GPR polarimetry, and real-time data processing.
e-mail: [email protected]
International Research Centre
for Telecommunications and Radar (IRCTR)
Faculty of Electrical Engineering,
Mathematics and Computer Science
Delft University of Technology
Mekelweg st 4
2628 CD Delft, The Netherlands
Leo P. Ligthart was born in
Rotterdam, the Netherlands, on
September 15, 1946. He re-
ceived an engineer’s degree
(cum laude) and a Doctor of
technology degree from Delft
University of Technology in
1969 and 1985, respectively.
He is Fellow of IEE and IEEE.
He received doctorates (honoris
causa) at Moscow State Tech-
nical University of Civil Aviation in 1999 and Tomsk
State University of Control Systems and Radioelectronics
in 2001. He is academician of the Russian Academy of
Transport. Since 1988, he has held the chair of Microwave
Transmission, Radar and Remote Sensing in the Faculty of
Electrical Engineering, Mathematics and Informatics, Delft
University of Technology. In 1994, he became Director of
the International Research Centre for Telecommunications
and Radar. Prof. Ligthart’s principal areas of specializa-
tion include antennas and propagation, radar and remote
sensing, but he has also been active in satellite, mobile and
radio communications. He has published over 350 papers
and 1 book.
e-mail: [email protected]
International Research Centre
for Telecommunications and Radar (IRCTR)
Faculty of Electrical Engineering,
Mathematics and Computer Science
Delft University of Technology
Mekelweg st 4
2628 CD Delft, The Netherlands
15