sri lakshmi chemicals - welcome to...
TRANSCRIPT
Sri Lakshmi Chemicals
Environmental Clearance for the “Proposed Expansion ofBulk drugs & intermediates Products Manufacturing” at plotNo 73 D, KIADB Kolhar Industrial Area, Kolhar and Nizampur
Village, Bidar Taluk, Bidar District, Karnataka State
Prepared By
HUBERT ENVIRO CARE SYSTEMS (P) LTD,CHENNAI
EIA ReportMay- 2017
ACKNOWLEDGEMENTThe following personnel are gratefully acknowledged for their fullest support in
collection, compilation of needful data regarding the project and kind cooperation in
fulfilling the report on Environmental Impact Assessment (EIA) of M/s. Sri Lakshmi
Chemicals (SLC).
Sri Lakshmi Chemicals,
Mr. SAMINENI SURESH – Managing Partner
Mr. MADHU. – Partner
Mr. DINESH PATIL - Department Head
Hubert Enviro Care Systems Pvt. Ltd, ChennaiDr. J. R. Moses - EIA Coordinator (EC) & Functional Area Expert (FAE)
Mr. Vamsee Krishna Navooru - EIA Coordinator (EC) & Functional Area Expert (FAE)
Dr. Rajkumar Samuel - Functional Area Expert
Mr. Abishek Moses -Team Member (TM)
Mr. A. Manoharan -FAE
Mr. V. Dhivakar -FAE
Ms. Ramaa Prakash -FAE
Mr. T.P. Natesan -FAE
Mr. Brijesh Kumar -FAE
Ms. Abirami -FAE
Dr. K. Karupaiyan -TM
Mr. Chengalvarayan -TM
Mr. A.K. Natarajan -TM
Mr. Tamil Selvan. B -TM
Ms. Pavithra R -TM
Mr. Vardharajan -TM
Dr. Vivekanandan -TM
Mr. Harsha Vardhan -TM
Ms. Kavya S Kumar -TM
M/s. Sri Lakshmi chemicals -EIA/EMP report
Page 2 of 263
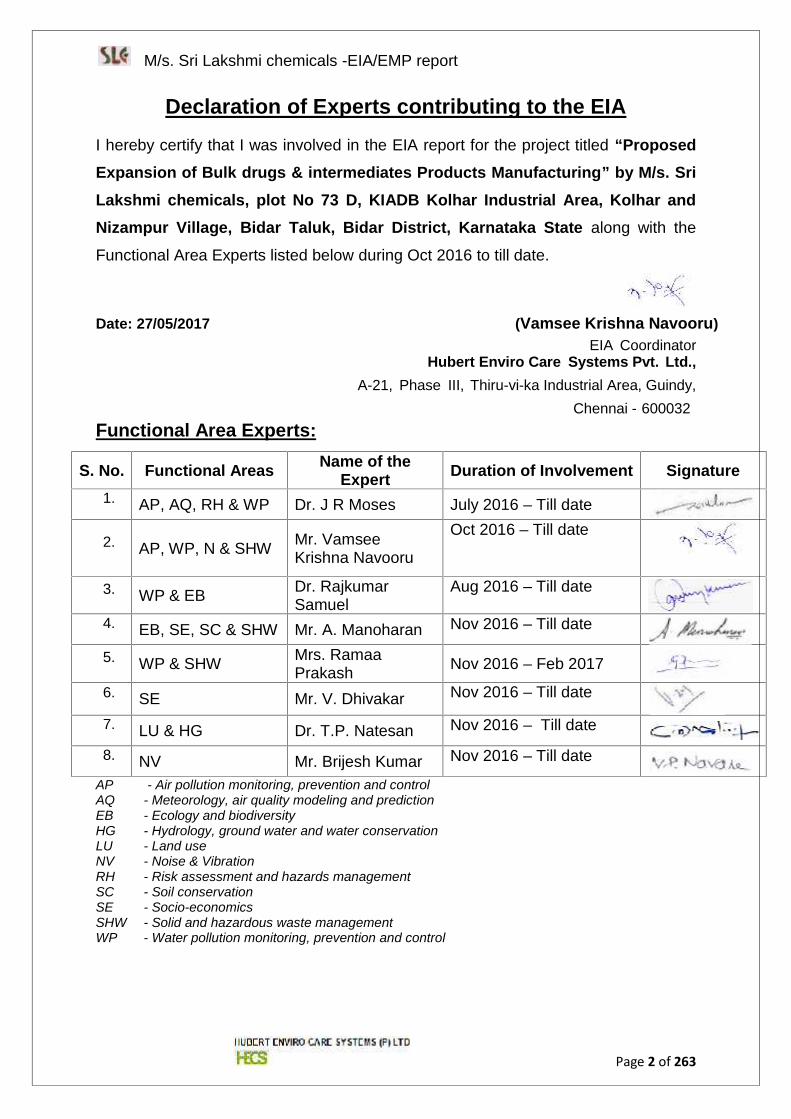
Declaration of Experts contributing to the EIAI hereby certify that I was involved in the EIA report for the project titled “ProposedExpansion of Bulk drugs & intermediates Products Manufacturing” by M/s. SriLakshmi chemicals, plot No 73 D, KIADB Kolhar Industrial Area, Kolhar andNizampur Village, Bidar Taluk, Bidar District, Karnataka State along with the
Functional Area Experts listed below during Oct 2016 to till date.
Date: 27/05/2017 (Vamsee Krishna Navooru)EIA Coordinator
Hubert Enviro Care Systems Pvt. Ltd.,A-21, Phase III, Thiru-vi-ka Industrial Area, Guindy,
Chennai - 600032Functional Area Experts:
S. No. Functional Areas Name of theExpert Duration of Involvement Signature
1. AP, AQ, RH & WP Dr. J R Moses July 2016 – Till date
2. AP, WP, N & SHW Mr. VamseeKrishna Navooru
Oct 2016 – Till date
3. WP & EB Dr. RajkumarSamuel
Aug 2016 – Till date
4. EB, SE, SC & SHW Mr. A. Manoharan Nov 2016 – Till date
5. WP & SHW Mrs. RamaaPrakash Nov 2016 – Feb 2017
6. SE Mr. V. Dhivakar Nov 2016 – Till date
7. LU & HG Dr. T.P. Natesan Nov 2016 – Till date
8. NV Mr. Brijesh Kumar Nov 2016 – Till date
AP - Air pollution monitoring, prevention and controlAQ - Meteorology, air quality modeling and predictionEB - Ecology and biodiversityHG - Hydrology, ground water and water conservationLU - Land useNV - Noise & VibrationRH - Risk assessment and hazards managementSC - Soil conservationSE - Socio-economicsSHW - Solid and hazardous waste managementWP - Water pollution monitoring, prevention and control
M/s. Sri Lakshmi chemicals -EIA/EMP report
Page 2 of 263
Declaration of Experts contributing to the EIAI hereby certify that I was involved in the EIA report for the project titled “ProposedExpansion of Bulk drugs & intermediates Products Manufacturing” by M/s. SriLakshmi chemicals, plot No 73 D, KIADB Kolhar Industrial Area, Kolhar andNizampur Village, Bidar Taluk, Bidar District, Karnataka State along with the
Functional Area Experts listed below during Oct 2016 to till date.
Date: 27/05/2017 (Vamsee Krishna Navooru)EIA Coordinator
Hubert Enviro Care Systems Pvt. Ltd.,A-21, Phase III, Thiru-vi-ka Industrial Area, Guindy,
Chennai - 600032Functional Area Experts:
S. No. Functional Areas Name of theExpert Duration of Involvement Signature
1. AP, AQ, RH & WP Dr. J R Moses July 2016 – Till date
2. AP, WP, N & SHW Mr. VamseeKrishna Navooru
Oct 2016 – Till date
3. WP & EB Dr. RajkumarSamuel
Aug 2016 – Till date
4. EB, SE, SC & SHW Mr. A. Manoharan Nov 2016 – Till date
5. WP & SHW Mrs. RamaaPrakash Nov 2016 – Feb 2017
6. SE Mr. V. Dhivakar Nov 2016 – Till date
7. LU & HG Dr. T.P. Natesan Nov 2016 – Till date
8. NV Mr. Brijesh Kumar Nov 2016 – Till date
AP - Air pollution monitoring, prevention and controlAQ - Meteorology, air quality modeling and predictionEB - Ecology and biodiversityHG - Hydrology, ground water and water conservationLU - Land useNV - Noise & VibrationRH - Risk assessment and hazards managementSC - Soil conservationSE - Socio-economicsSHW - Solid and hazardous waste managementWP - Water pollution monitoring, prevention and control
M/s. Sri Lakshmi chemicals -EIA/EMP report
Page 3 of 263
Declaration by the Head of the Accredited Consultant Organization
I, Dr. J R Moses hereby, confirm that the above mentioned experts prepared the EIA
for the - “Proposed Expansion of Bulk drugs & intermediates ProductsManufacturing” by M/s. Sri Lakshmi chemicals, plot No 73 D, KIADB KolharIndustrial Area, Kolhar and Nizampur Village, Bidar Taluk, Bidar District,Karnataka State. I also confirm that I shall be fully accountable for any misleading
information mentioned in this statement.
Signature: Date:27/05/2017
Name: Dr. J.R Moses
Designation: CEO
Name of the EIA Consultant Organization: Hubert Enviro Care Systems Pvt. Ltd.,
Chennai
M/s. Sri Lakshmi chemicals -EIA/EMP report
Page 4 of 263
Hubert Enviro Care Systems (P)Ltd.Client: Sri Lakshmi Chemicals
KIADB Kolhar Industrial Area, Kolhar and Nizampur Village, Bidar Taluk, Bidar District,Karnataka State
Project: Proposed Expansion of Bulk drugs & intermediates
Products Manufacturing
Project No.:SLC/021/2016-17,Dt 19th July 2016
Title:EIA/EMP Report
Document No.:RP002
Rev.:B
This document is the property of Hubert Enviro Care Systems (P) Ltd. and must not bepassed on to any person or body not authorised by us to receive it nor be copied orotherwise made use of either in full or in part by such person or body without our priorpermission in writing.
File path:D:\Dr. KKarupaiyan\Bidar prjs\Srilakshmi\EIA
Notes:
Revision Details:
Rev. Date DetailsInit. Sign. Init. Sign. Init. Sign.
Prepared Checked Approved
0 10th May 17 1st Revision
Dr.K.KarupaiyanKavya S Kumar,Harsha Vardhan.B,Vivekanandan.BVardharajanPavithra R
A 13th May 17 2nd Revision
Client input updatedbyDr KarupaiyanPavithra R
B 18th May 17 3rd Revision
Vamsee inputupdated byDr KarupaiyanPavithra R
Mr.VamseeKrishnaNavooru
Dr.J.R.Moses
M/s. Sri Lakshmi chemicals -EIA/EMP report
Page 5 of 263
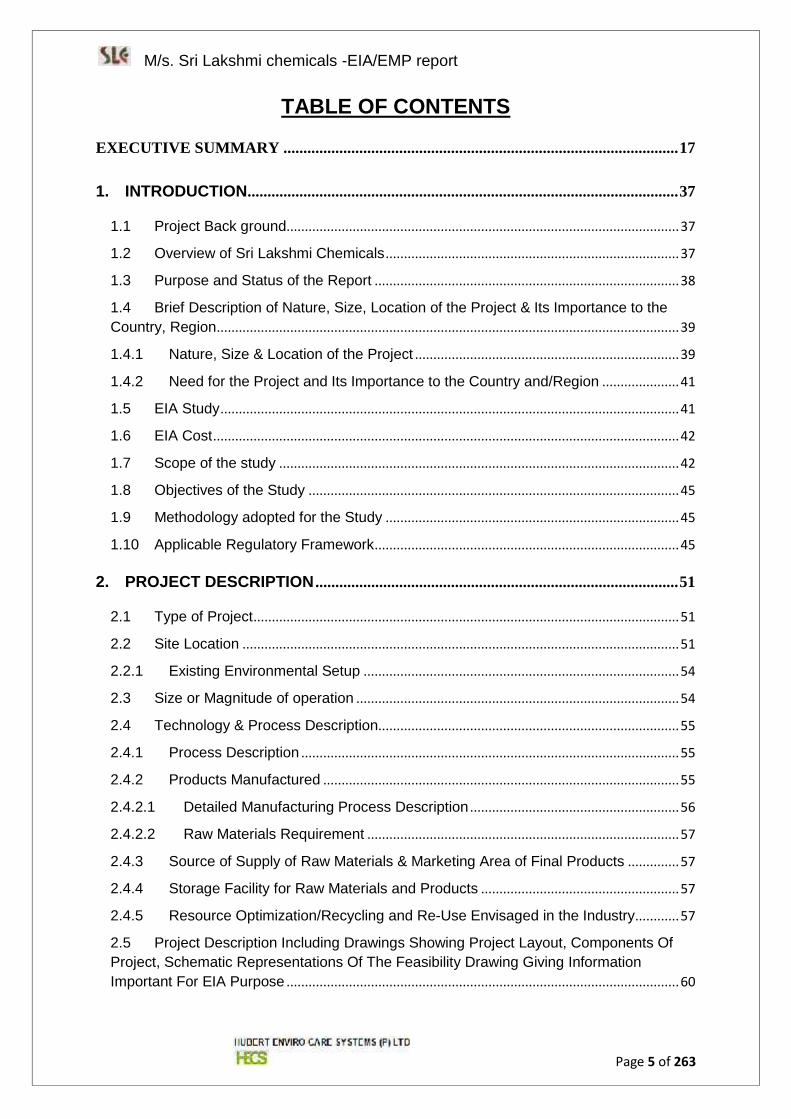
TABLE OF CONTENTS
EXECUTIVE SUMMARY ...................................................................................................17
1. INTRODUCTION............................................................................................................37
1.1 Project Back ground...........................................................................................................37
1.2 Overview of Sri Lakshmi Chemicals................................................................................37
1.3 Purpose and Status of the Report ...................................................................................38
1.4 Brief Description of Nature, Size, Location of the Project & Its Importance to theCountry, Region..............................................................................................................................39
1.4.1 Nature, Size & Location of the Project ........................................................................39
1.4.2 Need for the Project and Its Importance to the Country and/Region .....................41
1.5 EIA Study.............................................................................................................................41
1.6 EIA Cost...............................................................................................................................42
1.7 Scope of the study .............................................................................................................42
1.8 Objectives of the Study .....................................................................................................45
1.9 Methodology adopted for the Study ................................................................................45
1.10 Applicable Regulatory Framework...................................................................................45
2. PROJECT DESCRIPTION ...........................................................................................51
2.1 Type of Project....................................................................................................................51
2.2 Site Location .......................................................................................................................51
2.2.1 Existing Environmental Setup ......................................................................................54
2.3 Size or Magnitude of operation ........................................................................................54
2.4 Technology & Process Description..................................................................................55
2.4.1 Process Description .......................................................................................................55
2.4.2 Products Manufactured .................................................................................................55
2.4.2.1 Detailed Manufacturing Process Description .........................................................56
2.4.2.2 Raw Materials Requirement .....................................................................................57
2.4.3 Source of Supply of Raw Materials & Marketing Area of Final Products ..............57
2.4.4 Storage Facility for Raw Materials and Products ......................................................57
2.4.5 Resource Optimization/Recycling and Re-Use Envisaged in the Industry............57
2.5 Project Description Including Drawings Showing Project Layout, Components OfProject, Schematic Representations Of The Feasibility Drawing Giving InformationImportant For EIA Purpose ...........................................................................................................60
M/s. Sri Lakshmi chemicals -EIA/EMP report
Page 6 of 263
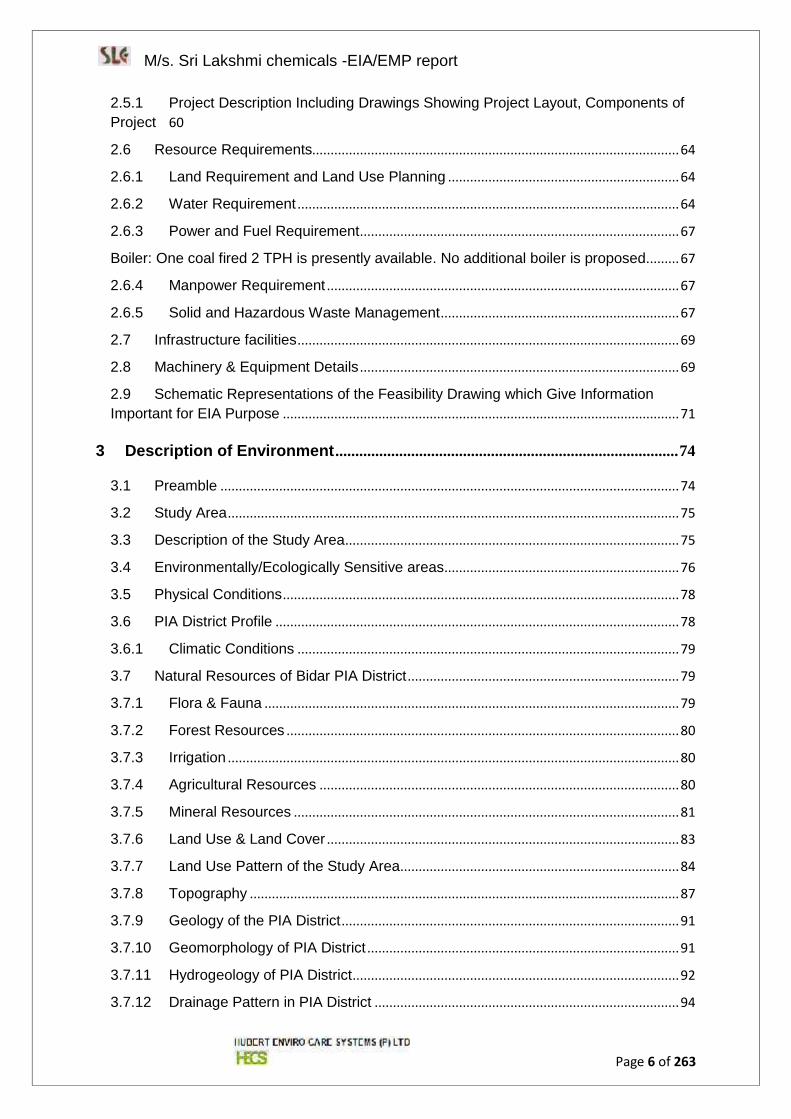
2.5.1 Project Description Including Drawings Showing Project Layout, Components ofProject 60
2.6 Resource Requirements....................................................................................................64
2.6.1 Land Requirement and Land Use Planning ...............................................................64
2.6.2 Water Requirement ........................................................................................................64
2.6.3 Power and Fuel Requirement.......................................................................................67
Boiler: One coal fired 2 TPH is presently available. No additional boiler is proposed.........67
2.6.4 Manpower Requirement ................................................................................................67
2.6.5 Solid and Hazardous Waste Management.................................................................67
2.7 Infrastructure facilities........................................................................................................69
2.8 Machinery & Equipment Details .......................................................................................69
2.9 Schematic Representations of the Feasibility Drawing which Give InformationImportant for EIA Purpose ............................................................................................................71
3 Description of Environment......................................................................................74
3.1 Preamble .............................................................................................................................74
3.2 Study Area...........................................................................................................................75
3.3 Description of the Study Area...........................................................................................75
3.4 Environmentally/Ecologically Sensitive areas................................................................76
3.5 Physical Conditions............................................................................................................78
3.6 PIA District Profile ..............................................................................................................78
3.6.1 Climatic Conditions ........................................................................................................79
3.7 Natural Resources of Bidar PIA District..........................................................................79
3.7.1 Flora & Fauna .................................................................................................................79
3.7.2 Forest Resources ...........................................................................................................80
3.7.3 Irrigation ...........................................................................................................................80
3.7.4 Agricultural Resources ..................................................................................................80
3.7.5 Mineral Resources .........................................................................................................81
3.7.6 Land Use & Land Cover ................................................................................................83
3.7.7 Land Use Pattern of the Study Area............................................................................84
3.7.8 Topography .....................................................................................................................87
3.7.9 Geology of the PIA District............................................................................................91
3.7.10 Geomorphology of PIA District .....................................................................................91
3.7.11 Hydrogeology of PIA District.........................................................................................92
3.7.12 Drainage Pattern in PIA District ...................................................................................94
M/s. Sri Lakshmi chemicals -EIA/EMP report
Page 7 of 263
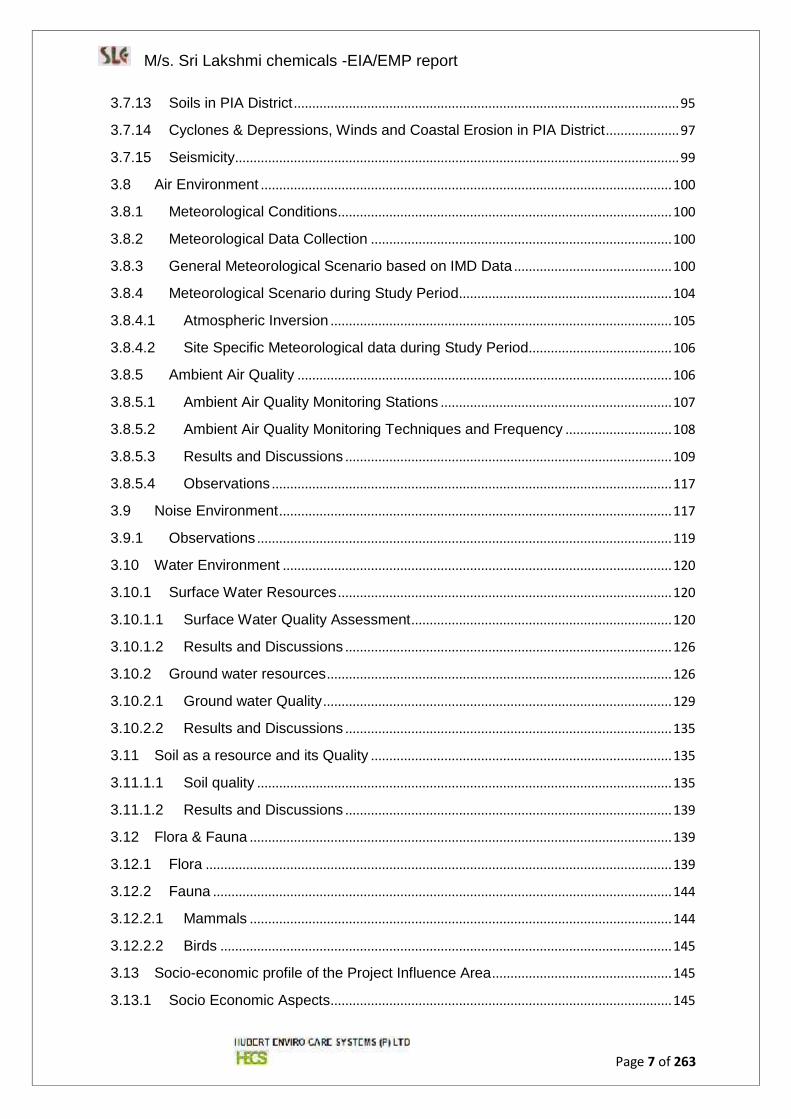
3.7.13 Soils in PIA District .........................................................................................................95
3.7.14 Cyclones & Depressions, Winds and Coastal Erosion in PIA District....................97
3.7.15 Seismicity.........................................................................................................................99
3.8 Air Environment ................................................................................................................100
3.8.1 Meteorological Conditions...........................................................................................100
3.8.2 Meteorological Data Collection ..................................................................................100
3.8.3 General Meteorological Scenario based on IMD Data ...........................................100
3.8.4 Meteorological Scenario during Study Period..........................................................104
3.8.4.1 Atmospheric Inversion .............................................................................................105
3.8.4.2 Site Specific Meteorological data during Study Period.......................................106
3.8.5 Ambient Air Quality ......................................................................................................106
3.8.5.1 Ambient Air Quality Monitoring Stations ...............................................................107
3.8.5.2 Ambient Air Quality Monitoring Techniques and Frequency .............................108
3.8.5.3 Results and Discussions .........................................................................................109
3.8.5.4 Observations .............................................................................................................117
3.9 Noise Environment...........................................................................................................117
3.9.1 Observations .................................................................................................................119
3.10 Water Environment ..........................................................................................................120
3.10.1 Surface Water Resources ...........................................................................................120
3.10.1.1 Surface Water Quality Assessment.......................................................................120
3.10.1.2 Results and Discussions .........................................................................................126
3.10.2 Ground water resources..............................................................................................126
3.10.2.1 Ground water Quality ...............................................................................................129
3.10.2.2 Results and Discussions .........................................................................................135
3.11 Soil as a resource and its Quality ..................................................................................135
3.11.1.1 Soil quality .................................................................................................................135
3.11.1.2 Results and Discussions .........................................................................................139
3.12 Flora & Fauna ...................................................................................................................139
3.12.1 Flora ...............................................................................................................................139
3.12.2 Fauna .............................................................................................................................144
3.12.2.1 Mammals ...................................................................................................................144
3.12.2.2 Birds ...........................................................................................................................145
3.13 Socio-economic profile of the Project Influence Area.................................................145
3.13.1 Socio Economic Aspects.............................................................................................145
M/s. Sri Lakshmi chemicals -EIA/EMP report
Page 8 of 263
3.13.2 Socio economic Profile of the study area .................................................................147
3.13.2.1 Employment and Livelihood....................................................................................150
3.13.2.2 Education facilities....................................................................................................153
3.13.2.3 Health Facilities within the study area...................................................................155
3.13.2.4 Sanitation Facilities & Drinking water facilities within the Study Area..............156
3.13.2.5 Infrastructure within Study Area: ............................................................................159
3.13.2.6 Tourism within the Study Area ...............................................................................159
3.13.2.7 Summary of socioeconomic indicators of the study area...................................160
4 ANTICIPATED ENVIRONMENTAL IMPACTS AND MITIGATION MEASURES171
4.1 Introduction........................................................................................................................171
4.2 OPERATION PHASE ......................................................................................................171
4.2.1 Land Environment ........................................................................................................171
4.2.1.1 Discharges on Land-Impact....................................................................................171
4.2.1.2 Mitigation Measures.................................................................................................172
4.2.2 Impacts- Soil Contamination.......................................................................................172
4.2.2.1 Soil – Mitigation Measures......................................................................................172
4.2.3 Air Environment ............................................................................................................173
4.2.3.1 Meteorological Data .................................................................................................173
4.2.3.2 AERMET Process ....................................................................................................173
4.2.3.3 AERMOD Process....................................................................................................174
4.2.4 Conclusion:....................................................................................................................178
4.2.5 Mitigation Measures.....................................................................................................178
4.2.6 Potential Impact of Noise Environment.....................................................................179
4.2.6.1 Mitigation Measures.................................................................................................179
4.2.7 Impact on Existing Water Resources ........................................................................180
4.2.7.1 Impacts to Surface Water Bodies ..........................................................................181
4.2.7.2 Mitigation Measures.................................................................................................181
4.2.8 Impact due to Wastewater Generation .....................................................................181
4.2.8.1 Mitigation Measures.................................................................................................182
4.2.8.2 Wastewater Quality and Quantity ..........................................................................182
4.2.8.3 Mitigation Measures.................................................................................................183
4.2.9 Biological Environment ................................................................................................184
M/s. Sri Lakshmi chemicals -EIA/EMP report
Page 9 of 263
4.2.9.1 Impact on Migratory Paths for Wildlife and Forest Blocks .................................184
4.2.9.2 Mitigation Measures.................................................................................................184
4.2.10 Solid Waste Management ...........................................................................................184
4.2.10.1 Impact due to Solid Waste Generation .................................................................184
4.2.10.2 Solid Waste Management during Operation Phase............................................184
5. ANALYSIS OF ALTERNATIVES (Technology & Site) .......................................187
5.1 Introduction........................................................................................................................187
5.2 Alternate Site Analysis.....................................................................................................187
5.3 Process Alternative ..........................................................................................................187
6. ENVIRONMENTAL MONITORING PROGRAM ....................................................189
6.1 Introduction........................................................................................................................189
6.2 Objectives ..........................................................................................................................189
6.3 Environmental Management Plan during Operation Phase ......................................191
6.4 Post Project Environmental Monitoring.........................................................................192
6.5 Greenbelt Development Plan .........................................................................................193
6.6 Environment Management Cell......................................................................................194
6.7 Hierarchical system/administrative order of Sri Lakshmi Chemicals limited forEnvironmental management.......................................................................................................194
6.8 Cost Estimate for Environment Management Plan (EMP).........................................195
7. ADDITIONAL STUDIES .............................................................................................198
7.1 Public Hearing...................................................................................................................198
7.2 Disaster Management Plan ............................................................................................198
7.3 R&R ACTION PLANS......................................................................................................198
7.4 Risk Assessment ..............................................................................................................198
7.5 COPY OF ToR ISSUED BY SEIAA - Karnataka .........................................................199
7.6 ToR COMPLIANCE REPORT........................................................................................206
7.7 HAZARD IDENTIFICATION AND SAFETY SYSTEM................................................225
8. PROJECT BENEFITS ................................................................................................232
8.1 PROJECT BENEFITS .....................................................................................................232
9. ENVIRONMENTAL MANAGEMENT PLAN ...........................................................234
9.1 Introduction........................................................................................................................234
M/s. Sri Lakshmi chemicals -EIA/EMP report
Page 10 of 263
9.2 Objectives of EMP............................................................................................................234
9.3 EMP Roles and Responsibilities ....................................................................................235
9.3.1 Environmental Management Cell...............................................................................235
9.4 EMP for Operational Phase ............................................................................................237
9.4.1 Air Quality ......................................................................................................................237
9.4.2 Noise Environment .......................................................................................................239
9.4.3 Water and Wastewater Management........................................................................240
9.4.4 Solid and Hazardous waste Management................................................................240
9.4.4.1 Solvent Recovery .....................................................................................................240
9.4.4.2 Land Environment ....................................................................................................240
9.4.5 Ecology ..........................................................................................................................240
9.4.6 Socio – Economic Environment .................................................................................241
9.5 AVAILABLE SAFETY SYSTEMS ..................................................................................241
9.5.1 Fire Hydrant System ....................................................................................................241
9.5.2 Fire Extinguisher...........................................................................................................242
9.5.3 Eye Wash Fountain and Safety Shower ...................................................................248
9.5.4 Work Zone Monitoring Equipments ...........................................................................248
9.5.5 Wind Sack / Wind Direction Indicator........................................................................248
9.6 OCCUPATIONAL HEALTH CENTRE (OHC) ..............................................................248
9.6.1 First Aid Boxes..............................................................................................................248
9.7 OCCUPATIONAL HEALTH AND SAFETY PROGRAM ............................................250
9.7.1 Operation Phase...........................................................................................................251
9.7.2 Occupational Health Monitoring .................................................................................251
9.7.3 Safety, Health and Environment Policy ....................................................................252
9.8 CORPORATE SOCIAL RESPONSIBILITY..................................................................254
9.9 Rainwater Harvesting & Groundwater Recharging .....................................................254
10. SUMMARY & CONCLUSION ................................................................................257
10.1 Summary ...........................................................................................................................257
10.2 Conclusion.........................................................................................................................258
11. DISCLOSURE OF CONSULTANT .......................................................................260
22.1 Brief Profile of Hubert Enviro Care Systems (P) Limited (HECS).............................260
M/s. Sri Lakshmi chemicals -EIA/EMP report
Page 11 of 263
LIST OF TABLES
Table 1-1 Project overview.......................................................................................................................37
Table 1-2 Site Coordinates.......................................................................................................................39
Table 1-3 Site Salient Features................................................................................................................40
Table 1-4 Applicable Acts and Rules .....................................................................................................46
Table 2-1 List of Industries within 10km Radius from the project site ............................................54
Table 2-2 Nearest Human Settlement.....................................................................................................54
Table 2-3 Capital Investment on the Project .........................................................................................55
Table 2-4 Existing and Proposed Products with Capacity .................................................................55
Table 2-5 Details of Storage Facilities ...................................................................................................57
Table 2-6 Solvent Recovery and Re-use................................................................................................58
Table 2-7 Spent Carbon Recovery and Disposal .................................................................................59
Table 2-8 Land Use Pattern......................................................................................................................61
Table 2-9 Detailed Land Area Break-up .................................................................................................62
Table 2-10 Water Requirement Break-up ..............................................................................................64
Table 2-11 Power and Fuel Requirement ..............................................................................................67
Table 2-12 Manpower Requirement ........................................................................................................67
Table 2-13 Municipal Solid Waste During Operation Phase ..............................................................68
Table 2-14 Hazardous Waste Management ...........................................................................................68
Table 2-15 List of Machinery & Equipments-Existing .........................................................................69
Table 3-1: Environmentally Sensitive Areas within 15 km from Project Boundary .......................76
Table 3-2: District land use/land cover statistics.................................................................................83
Table 3-3:Land Use/Land Cover statistics of 10 Km radius of the Study Area ..............................85
Table 3-4: Climatological Summary – Bidar Region (1971-2000) ....................................................101
Table 3-5 : Meteorology Data for Study Period (December 2016 - February 2017)......................106
Table 3-6: Details of Ambient Air Quality Monitoring Locations ....................................................107
Table 3-7: Analytical Methods for Analysis of Ambient Air Quality Parameters..........................108
Table 3-8: Summary of the average baseline concentrations of pollutants .................................110
Table 3-9: Summary of the average baseline concentrations of pollutants .................................111
Table 3-10: Ambient PM10 Monitoring Data .........................................................................................112
Table 3-11: Ambient PM2.5 Monitoring Data.........................................................................................113
Table 3-12 : Ambient SO2 Monitoring Data ..........................................................................................114
Table 3-13: Ambient NO2 Monitoring Data...........................................................................................115
Table 3-14: Ambient Carbon Monoxide (CO) Monitoring Data ........................................................116
Table 3-15: Ambient Volatile Organic Compounds (VOCs) Monitoring Data ...............................117
Table 3-16: Day and Night Equivalent Noise Levels..........................................................................119
Table 3-17: Test methods used for the analysis of water quality parameters..............................121
M/s. Sri Lakshmi chemicals -EIA/EMP report
Page 12 of 263
Table 3-18: Details of Surface water sampling locations .................................................................121
Table 3-19: Surface Water Monitoring Results...................................................................................123
Table 3-20: Groundwater Potential in Bidar PIA District ..................................................................127
Table 3-21: Details of Groundwater Quality Monitoring Locations ................................................129
Table 3-22: Ground Water Monitoring Results ...................................................................................130
Table 3-23: Soil Quality Monitoring Locations ...................................................................................136
Table 3-24: Soil Quality Monitoring Results .......................................................................................137
Table 3-25: List of Flora Observed in the Study Area .......................................................................140
Table 3-26: List of Fauna Reported/Observed in the Study Area ...................................................144
Table 3-27: List of Birds Observed in the Study Area.......................................................................145
Table 3-28: Bidar District Social Indicators .......................................................................................146
Table 3-29: Demographic details of all the villages in the study area ...........................................148
Table 3-30: Workers group distribution in the study area ...............................................................151
Table 3-31: District literacy rate ............................................................................................................153
Table 3-32: Literacy rate of the study area..........................................................................................153
Table 3-33: Education Infrastructures in Bidar Block .......................................................................155
Table 3-34: Health profile of Bidar Taluk .............................................................................................155
Table 3-35: Village wise sanitation & drinking water facilities within the Study Area ................157
Table 3-36: State Highways in the Study Area. ..................................................................................159
Table 3-37: Total stretch of different roads in the district................................................................159
Table 4-1 Existing Stack Emission details ..........................................................................................175
Table 4-2 Additional Stack Emission details ......................................................................................175
Table 4-3: Estimated Post Project Scenario of Resultant Sulphur Dioxide Concentration ......177
Table 4-4: Estimated Post Project Scenario of Resultant Oxides Of Nitrogen Concentration .177
Table 4-5: Estimated Post Project Scenario of Resultant Particulate Matter Concentration....177
Table 4-6: Total Maximum Glcs from the Proposed Stack Emissions for Dec 2016 ...................178
Table 4-7 Details Sewage/Wastewater Treatment and Discharge...................................................183
Table 4-8: Characteristics of Effluent Generated...............................................................................183
Table 6-1Post Project Environmental monitoring program .............................................................192
Table 6-2 Cost Estimate for Environment Management Plan ..........................................................195
Table 9-1 EMC Responsibility ...............................................................................................................236
Table 9-2 Air Pollution Control Measures ...........................................................................................238
Table 9-3 Suitability of extinguishing media for different fires .......................................................242
Table 9-4 Extinguisher based on area .................................................................................................242
M/s. Sri Lakshmi chemicals -EIA/EMP report
Page 13 of 263
List of Figures
Figure 1-1 Satellite Image showing demarcated Project Site ............................................................39
Figure 2-1 Satellite Image of Environmental Sensitive Area with Distances ..................................52
Figure 2-2 Google Satellite Imagery 10 km radius...............................................................................52
Figure 2-3 Google Satellite Imagery 5 km radius.................................................................................53
Figure 2-4 Google Satellite Imagery 1 km radius.................................................................................53
Figure 2-5 General Activity of the Project .............................................................................................56
Figure 2-6 Typical solvent recovery system.........................................................................................59
Figure 2-7 Project Site Layout .................................................................................................................61
Figure 2-8 Site Photographs....................................................................................................................63
Figure 2-9 Water Balance Chart-Existing .............................................................................................65
Figure 2-10 Water Balance Chart-Proposed ........................................................................................66
Figure 2-11 Feasibility & Environmental Assessment Process ........................................................72
Figure 3-1: Geology & Minerals Map of Karnataka ..............................................................................82
Figure 3-2: Land Use Pattern in the PIA District ..................................................................................84
Figure 3-3:Land Use Map of Bidar district ............................................................................................84
Figure 3-4: Land Use Pa ttern of the Study Area .................................................................................86
Figure 3-5:Land use/Land cover map of the Study Area ....................................................................86
Figure 3-6: Physiography map of Karnataka State..............................................................................88
Figure 3-7: Contour/Physiography map of Study Area ......................................................................89
Figure 3-8: Topo map of the study area ................................................................................................90
Figure 3-9: Geology Map of PIA District ................................................................................................91
Figure 3-10: Geomorphology Map of Study area .................................................................................92
Figure 3-11: Hydrogeology Map of PIA district ....................................................................................94
Figure 3-12: Drainage Map of the Study area .......................................................................................95
Figure 3-13: Soil Map of Karnataka State ..............................................................................................97
Figure 3-14: Wind Hazard Map of Karnataka ........................................................................................99
Figure 3-15: Seismicity Map of India ......................................................................................................99
Figure 3-16: Windrose drawn for various seasons (Jan 2016 - Dec 2016) ....................................103
Figure 3-17: Annual Windrose (Jan 2016 - Dec 2016) .......................................................................104
Figure 3-18: Specific Wind rose for the Study Period.......................................................................105
Figure 3-19: Hourly variation of the mixing heights ..........................................................................106
Figure 3-20: Trends of Measured Ambient PM10 Concentrations in the Study Area ...................112
Figure 3-21: Trends of Measured Ambient PM2.5 Concentrations in the Study Area ...................113
Figure 3-22: Trends of Measured Ambient SO2 Concentrations in the Study Area.....................114
Figure 3-23: Trends of Measured Ambient NO2 Concentrations in the Study Area ....................115
Figure 3-24: Trends of Measured Ambient CO Concentrations in the Study Area ......................116
M/s. Sri Lakshmi chemicals -EIA/EMP report
Page 14 of 263
Figure 3-25: surface water sampling Photographs ...........................................................................120
Figure 3-26: Status of Ground Water Utilisation of Bidar District ..................................................128
Figure 3-27: Literacy rate of District Vs Taluk ....................................................................................153
Figure 3-28: Informal Consultation with Locals .................................................................................164
Figure 3-29 Map Showing the Study area of the Project ..................................................................165
Figure 3-30 Map Showing the Air monitoring locations ...................................................................166
Figure 3-31 Map Showing the Noise monitoring locations ..............................................................167
Figure 3-32 Map Showing the Ground Water & Surface Water monitoring location ...................168
Figure 3-33 Map Showing the Soil monitoring locations .................................................................169
Figure 4-1 Predicted 24 hrs GLC’s of SO2 within 10 km radius of the Study area .......................176
Figure 4-2: Predicted 24-Hrs’ GLC’s of NOx within 10 km Radius of the Study Area .................176
Figure 4-3 Predicted 24-Hrs GLC’s of Particulate matter within 10 km Radius of the Study Area
............................................................................................................................................................176
Figure 4-4 Waste Management Concept..............................................................................................185
Figure 6-1 Hierarchical system/administrative order ........................................................................195
Figure 9-1 Environmental Management Cell.......................................................................................235
Figure 9-2 Emergency Organization Chart..........................................................................................250
Figure 9-3 Safety, Health and Environment Policy ............................................................................253
LIST OF ACCRONYMS
AAQ Ambient Air QualityAAQM Ambient Air Quality MonitoringCPCB Central Pollution Control BoardCSR Corporate Social ResponsibilityEIA Environmental Impact AssessmentEMC Environmental Management CellEMP Environmental Management PlanETP Effluent Treatment PlantGLC Ground Level ConcentrationISO International Standard for OrganizationKIADB Karnataka Industrial Area Development BoardKSPCB Karnataka State Pollution Control BoardkWh Kilowatt per hourLOS Level of ServiceMEE Multiple Effect EvaporatorMSDS Material Safety Data SheetNAAQ National Ambient Air QualityPCB Pollution Control BoardPCU Passenger Car UnitSEAC State Expert Appraisal CommitteeSEIAA State Environmental Impact Assessment AuthoritySTP Sewage Treatment PlantTDS Total dissolved Solids
M/s. Sri Lakshmi chemicals -EIA/EMP report
Page 15 of 263
TOR Terms of ReferenceTSDF Treatment, Storage and Disposal FacilitiesZLD Zero Liquid Discharge
LIST OF ANNEXURE
1. Existing CFO2. Land document.3. Monitoring data submitted to KSPCB4. Process & Material balance5. Product MSDS.6. List of raw materials.7. Raw materials MSDS.8. Site layout.9. Water balance charts-Existing.10.Water balance charts-Proposed.11.KSPCB authorization for HWM.12. TSDF Agreement.13. ZLD scheme.14.On-site emergency plan.15.Risk Assessment report.16.Annual Medical report.
M/s. Sri Lakshmi chemicals -EIA/EMP report
Page 16 of 263
EXECUTIVE SUMMARY
M/s. Sri Lakshmi chemicals -EIA/EMP report
Page 17 of 263
EXECUTIVE SUMMARY
M/s Sri Lakshmi Chemicals (SLC) was acquired by its management in the
year 2010 from Sree Chemicals. SLC a privately owned and professionally
managed enterprise with its corporate office in Hyderabad, Mr. Samineni
Suresh is the owner of SLC. Since Pharmaceutical products are market
desire, SLC proposes the expansion of production capacity by introducing
new products.
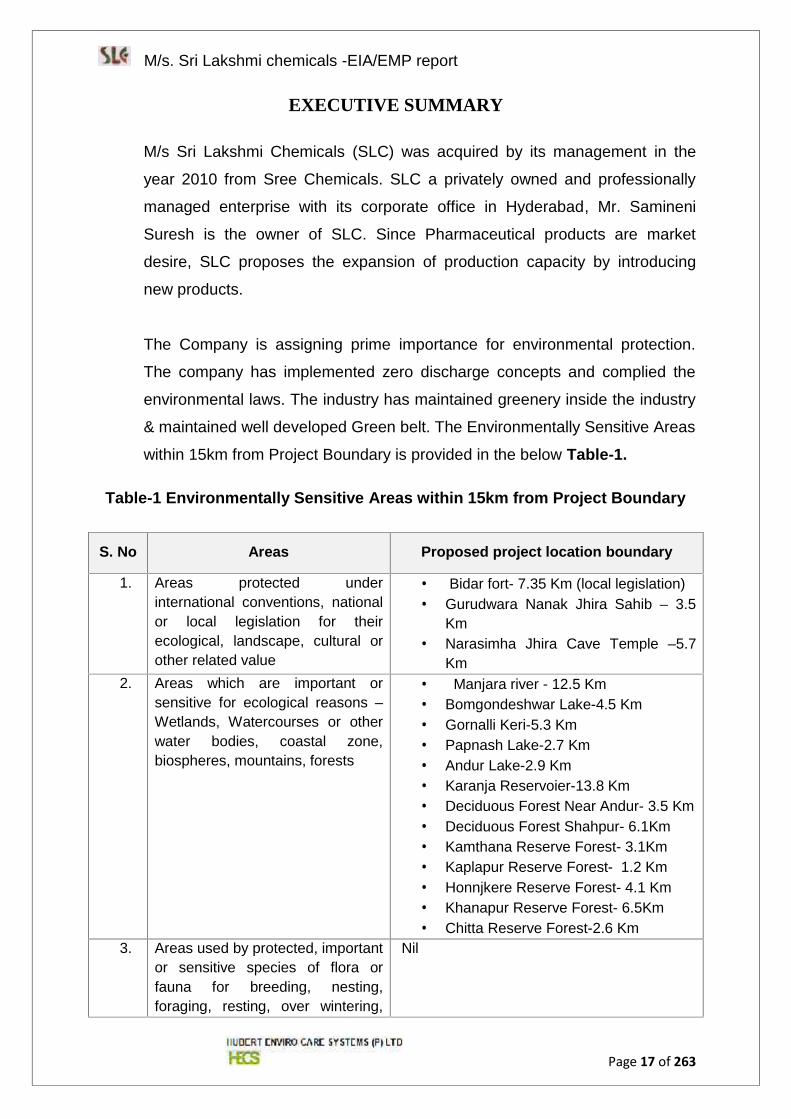
The Company is assigning prime importance for environmental protection.
The company has implemented zero discharge concepts and complied the
environmental laws. The industry has maintained greenery inside the industry
& maintained well developed Green belt. The Environmentally Sensitive Areas
within 15km from Project Boundary is provided in the below Table-1.
Table-1 Environmentally Sensitive Areas within 15km from Project Boundary
S. No Areas Proposed project location boundary
1. Areas protected underinternational conventions, nationalor local legislation for theirecological, landscape, cultural orother related value
Bidar fort- 7.35 Km (local legislation) Gurudwara Nanak Jhira Sahib – 3.5
Km Narasimha Jhira Cave Temple –5.7
Km2. Areas which are important or
sensitive for ecological reasons –Wetlands, Watercourses or otherwater bodies, coastal zone,biospheres, mountains, forests
Manjara river - 12.5 Km Bomgondeshwar Lake-4.5 Km Gornalli Keri-5.3 Km Papnash Lake-2.7 Km Andur Lake-2.9 Km Karanja Reservoier-13.8 Km Deciduous Forest Near Andur- 3.5 Km Deciduous Forest Shahpur- 6.1Km Kamthana Reserve Forest- 3.1Km Kaplapur Reserve Forest- 1.2 Km Honnjkere Reserve Forest- 4.1 Km Khanapur Reserve Forest- 6.5Km Chitta Reserve Forest-2.6 Km
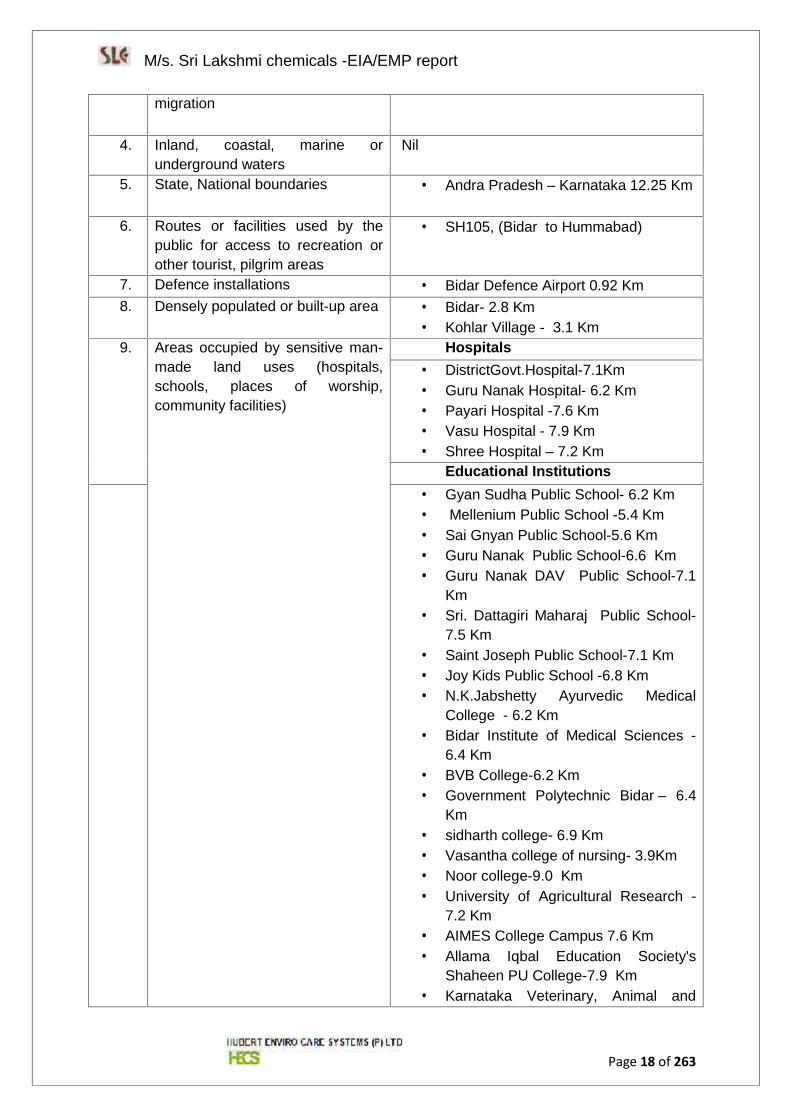
3. Areas used by protected, importantor sensitive species of flora orfauna for breeding, nesting,foraging, resting, over wintering,
Nil
M/s. Sri Lakshmi chemicals -EIA/EMP report
Page 18 of 263
migration
4. Inland, coastal, marine orunderground waters
Nil
5. State, National boundaries Andra Pradesh – Karnataka 12.25 Km
6. Routes or facilities used by thepublic for access to recreation orother tourist, pilgrim areas
SH105, (Bidar to Hummabad)
7. Defence installations Bidar Defence Airport 0.92 Km8. Densely populated or built-up area Bidar- 2.8 Km
Kohlar Village - 3.1 Km9. Areas occupied by sensitive man-
made land uses (hospitals,schools, places of worship,community facilities)
Hospitals DistrictGovt.Hospital-7.1Km Guru Nanak Hospital- 6.2 Km Payari Hospital -7.6 Km Vasu Hospital - 7.9 Km Shree Hospital – 7.2 Km
Educational Institutions Gyan Sudha Public School- 6.2 Km Mellenium Public School -5.4 Km Sai Gnyan Public School-5.6 Km Guru Nanak Public School-6.6 Km Guru Nanak DAV Public School-7.1
Km Sri. Dattagiri Maharaj Public School-
7.5 Km Saint Joseph Public School-7.1 Km Joy Kids Public School -6.8 Km N.K.Jabshetty Ayurvedic Medical
College - 6.2 Km Bidar Institute of Medical Sciences -
6.4 Km BVB College-6.2 Km Government Polytechnic Bidar – 6.4
Km sidharth college- 6.9 Km Vasantha college of nursing- 3.9Km Noor college-9.0 Km University of Agricultural Research -
7.2 Km AIMES College Campus 7.6 Km Allama Iqbal Education Society's
Shaheen PU College-7.9 Km Karnataka Veterinary, Animal and
M/s. Sri Lakshmi chemicals -EIA/EMP report
Page 19 of 263
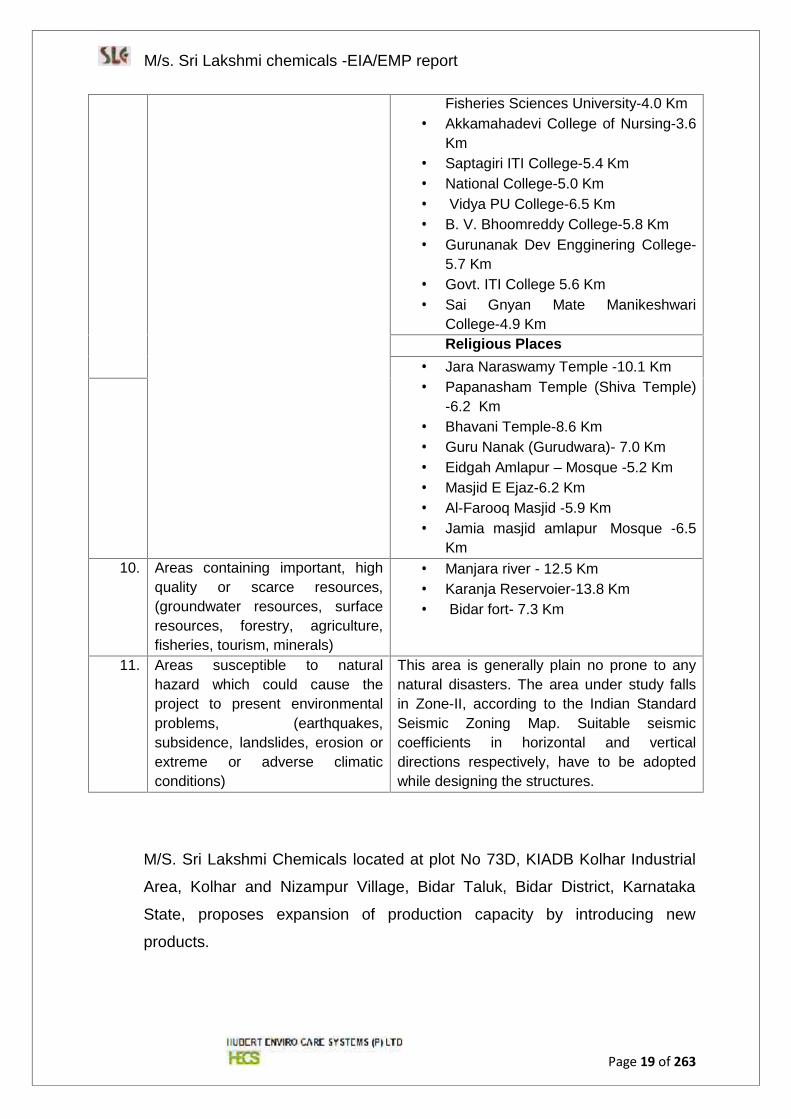
Fisheries Sciences University-4.0 Km Akkamahadevi College of Nursing-3.6
Km Saptagiri ITI College-5.4 Km National College-5.0 Km Vidya PU College-6.5 Km B. V. Bhoomreddy College-5.8 Km Gurunanak Dev Engginering College-
5.7 Km Govt. ITI College 5.6 Km Sai Gnyan Mate Manikeshwari
College-4.9 KmReligious Places
Jara Naraswamy Temple -10.1 Km Papanasham Temple (Shiva Temple)
-6.2 Km Bhavani Temple-8.6 Km Guru Nanak (Gurudwara)- 7.0 Km Eidgah Amlapur – Mosque -5.2 Km Masjid E Ejaz-6.2 Km Al-Farooq Masjid -5.9 Km Jamia masjid amlapur Mosque -6.5
Km10. Areas containing important, high
quality or scarce resources,(groundwater resources, surfaceresources, forestry, agriculture,fisheries, tourism, minerals)
Manjara river - 12.5 Km Karanja Reservoier-13.8 Km Bidar fort- 7.3 Km
11. Areas susceptible to naturalhazard which could cause theproject to present environmentalproblems, (earthquakes,subsidence, landslides, erosion orextreme or adverse climaticconditions)
This area is generally plain no prone to anynatural disasters. The area under study fallsin Zone-II, according to the Indian StandardSeismic Zoning Map. Suitable seismiccoefficients in horizontal and verticaldirections respectively, have to be adoptedwhile designing the structures.
M/S. Sri Lakshmi Chemicals located at plot No 73D, KIADB Kolhar Industrial
Area, Kolhar and Nizampur Village, Bidar Taluk, Bidar District, Karnataka
State, proposes expansion of production capacity by introducing new
products.
M/s. Sri Lakshmi chemicals -EIA/EMP report
Page 20 of 263
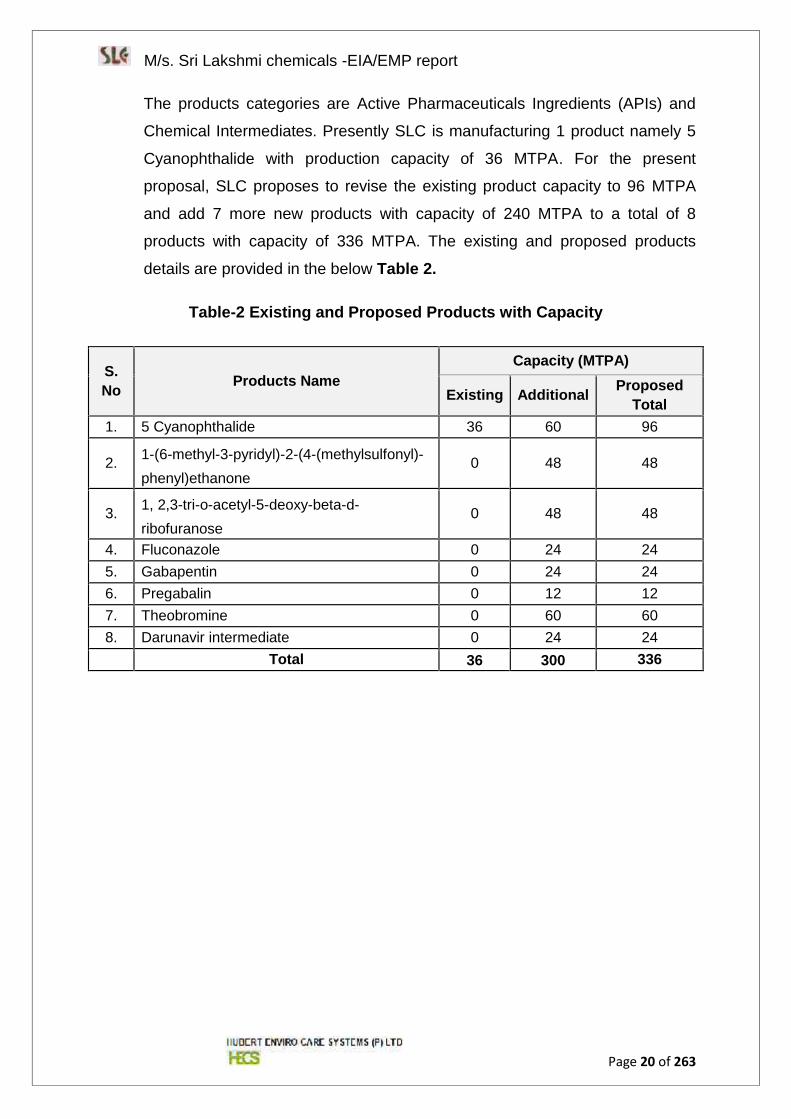
The products categories are Active Pharmaceuticals Ingredients (APIs) and
Chemical Intermediates. Presently SLC is manufacturing 1 product namely 5
Cyanophthalide with production capacity of 36 MTPA. For the present
proposal, SLC proposes to revise the existing product capacity to 96 MTPA
and add 7 more new products with capacity of 240 MTPA to a total of 8
products with capacity of 336 MTPA. The existing and proposed products
details are provided in the below Table 2.
Table-2 Existing and Proposed Products with Capacity
S.No Products Name
Capacity (MTPA)
Existing Additional ProposedTotal
1. 5 Cyanophthalide 36 60 96
2. 1-(6-methyl-3-pyridyl)-2-(4-(methylsulfonyl)-phenyl)ethanone
0 48 48
3. 1, 2,3-tri-o-acetyl-5-deoxy-beta-d-ribofuranose
0 48 48
4. Fluconazole 0 24 245. Gabapentin 0 24 246. Pregabalin 0 12 127. Theobromine 0 60 608. Darunavir intermediate 0 24 24
Total 36 300 336
M/s. Sri Lakshmi chemicals -EIA/EMP report
Page 21 of 263
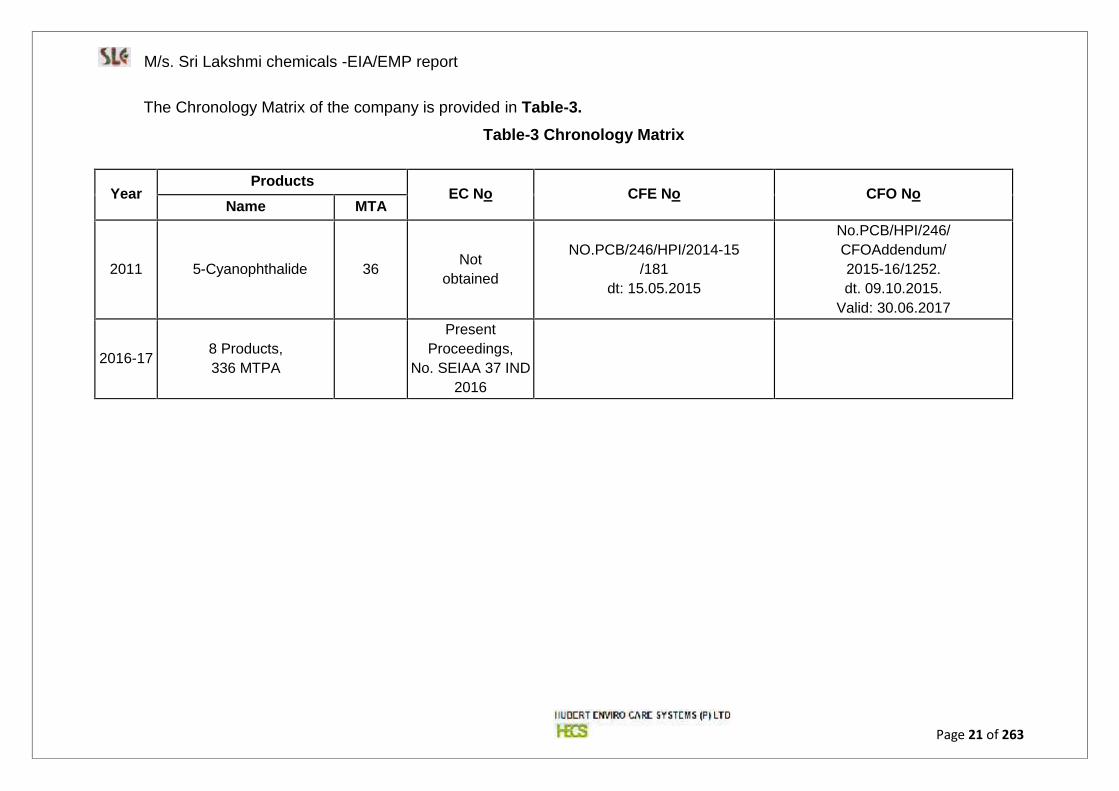
The Chronology Matrix of the company is provided in Table-3.Table-3 Chronology Matrix
YearProducts
EC No CFE No CFO NoName MTA
2011 5-Cyanophthalide 36 Notobtained
NO.PCB/246/HPI/2014-15/181
dt: 15.05.2015
No.PCB/HPI/246/CFOAddendum/2015-16/1252.dt. 09.10.2015.
Valid: 30.06.2017
2016-17 8 Products,336 MTPA
PresentProceedings,
No. SEIAA 37 IND2016
M/s. Sri Lakshmi chemicals -EIA/EMP report
Page 22 of 263
The proposed site is within KIADB Industrial Area. As per Amendment in EIA
Notification 2006, dated 22nd August 2013; said notification for change in
product mix/expansion industries requires prior Environmental clearance from
Central Government or SEIAA under sub-section (3) of section 3. The
Proposed Project termed under Schedule 5 (f), Category B, Synthetic Organic
Chemicals as per the EIA Notification 2006 and its Amendments requiring EIA
studies of the project. The facility requires prior Environmental Clearance from
State Environmental Impact Assessment Authority (SEIAA), Karnataka before
commencing onsite activities. The application along with relevant project
documents was submitted to SEIAA, Karnataka on 06.08.2016. Based on the
information furnished and the presentation made before the State Expert
Appraisal Committee Members, the proposal was appraised in the 171st
SEAC meeting held on 22.09.2016 and was issued the Terms of Reference
(TOR) for preparing Environmental Impact Assessment (EIA) Report vide
Letter No. SEIAA/F.No- SEIAA 37 IND 2016 dated 18.11.2016.
Since existing product do not have environmental clearance, as per the
MoEF&CC Notification No. S.O. 804(E) dated 14th March, 2017, Karnataka
SEIAA has recommended the proposal to EAC, MoEF & CC under Category
A, 5(f).
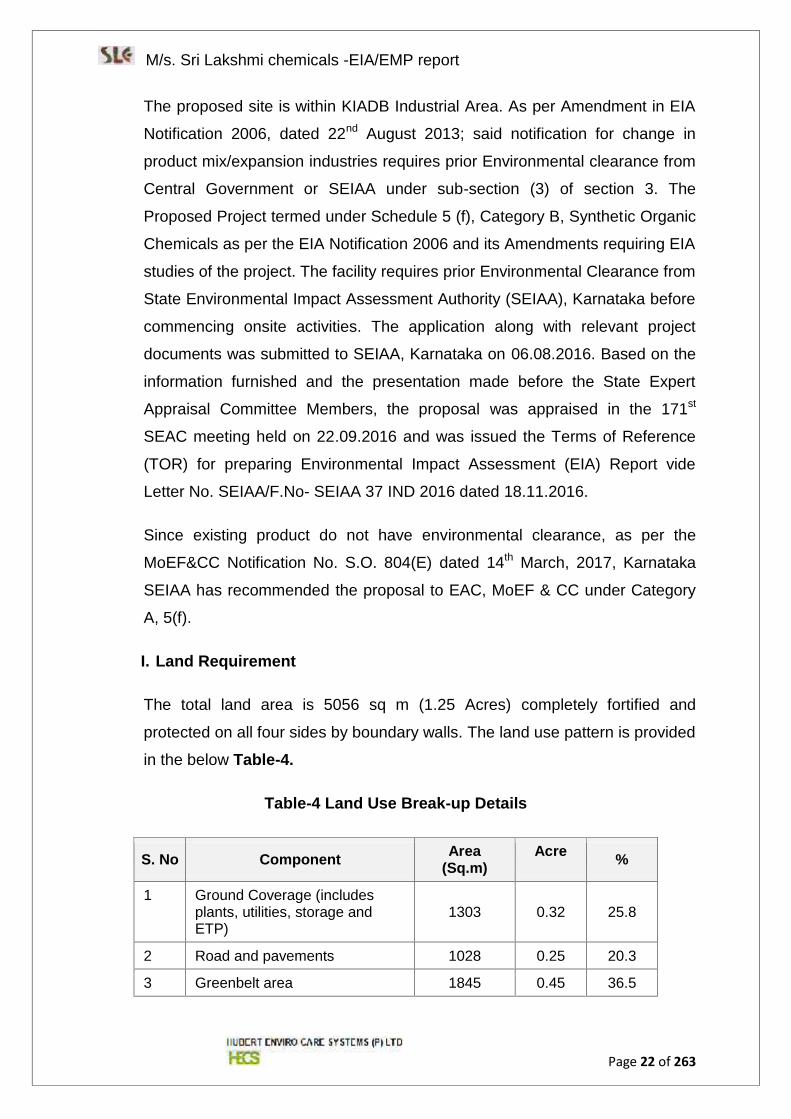
I. Land Requirement
The total land area is 5056 sq m (1.25 Acres) completely fortified and
protected on all four sides by boundary walls. The land use pattern is provided
in the below Table-4.
Table-4 Land Use Break-up Details
S. No Component Area(Sq.m)
Acre %
1 Ground Coverage (includesplants, utilities, storage andETP)
1303 0.32 25.8
2 Road and pavements 1028 0.25 20.3
3 Greenbelt area 1845 0.45 36.5
M/s. Sri Lakshmi chemicals -EIA/EMP report
Page 23 of 263
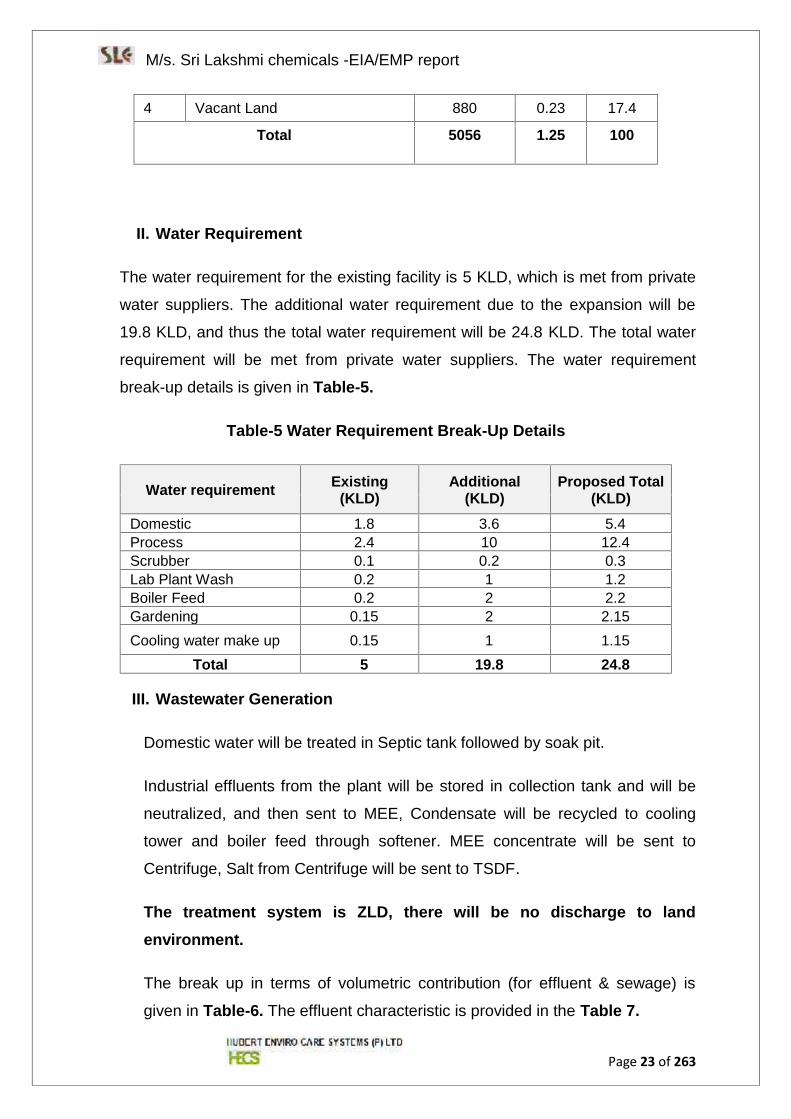
4 Vacant Land 880 0.23 17.4
Total 5056 1.25 100
II. Water Requirement
The water requirement for the existing facility is 5 KLD, which is met from private
water suppliers. The additional water requirement due to the expansion will be
19.8 KLD, and thus the total water requirement will be 24.8 KLD. The total water
requirement will be met from private water suppliers. The water requirement
break-up details is given in Table-5.
Table-5 Water Requirement Break-Up Details
Water requirement Existing(KLD)
Additional(KLD)
Proposed Total(KLD)
Domestic 1.8 3.6 5.4Process 2.4 10 12.4Scrubber 0.1 0.2 0.3Lab Plant Wash 0.2 1 1.2Boiler Feed 0.2 2 2.2Gardening 0.15 2 2.15Cooling water make up 0.15 1 1.15
Total 5 19.8 24.8
III. Wastewater Generation
Domestic water will be treated in Septic tank followed by soak pit.
Industrial effluents from the plant will be stored in collection tank and will be
neutralized, and then sent to MEE, Condensate will be recycled to cooling
tower and boiler feed through softener. MEE concentrate will be sent to
Centrifuge, Salt from Centrifuge will be sent to TSDF.
The treatment system is ZLD, there will be no discharge to landenvironment.
The break up in terms of volumetric contribution (for effluent & sewage) is
given in Table-6. The effluent characteristic is provided in the Table 7.
M/s. Sri Lakshmi chemicals -EIA/EMP report
Page 24 of 263
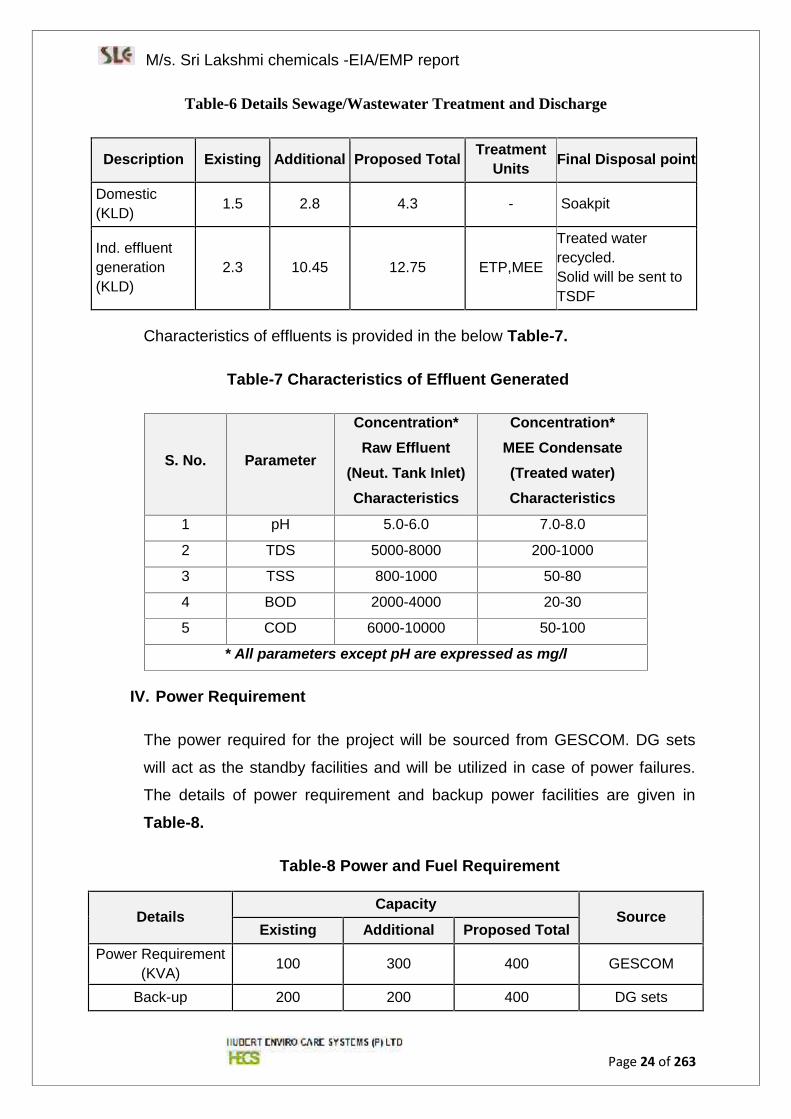
Table-6 Details Sewage/Wastewater Treatment and Discharge
Description Existing Additional Proposed Total TreatmentUnits Final Disposal point
Domestic(KLD) 1.5 2.8 4.3 - Soakpit
Ind. effluentgeneration(KLD)
2.3 10.45 12.75 ETP,MEE
Treated waterrecycled.Solid will be sent toTSDF
Characteristics of effluents is provided in the below Table-7.
Table-7 Characteristics of Effluent Generated
S. No. Parameter
Concentration*Raw Effluent
(Neut. Tank Inlet)Characteristics
Concentration*MEE Condensate(Treated water)Characteristics
1 pH 5.0-6.0 7.0-8.0
2 TDS 5000-8000 200-1000
3 TSS 800-1000 50-80
4 BOD 2000-4000 20-30
5 COD 6000-10000 50-100
* All parameters except pH are expressed as mg/l
IV. Power Requirement
The power required for the project will be sourced from GESCOM. DG sets
will act as the standby facilities and will be utilized in case of power failures.
The details of power requirement and backup power facilities are given in
Table-8.
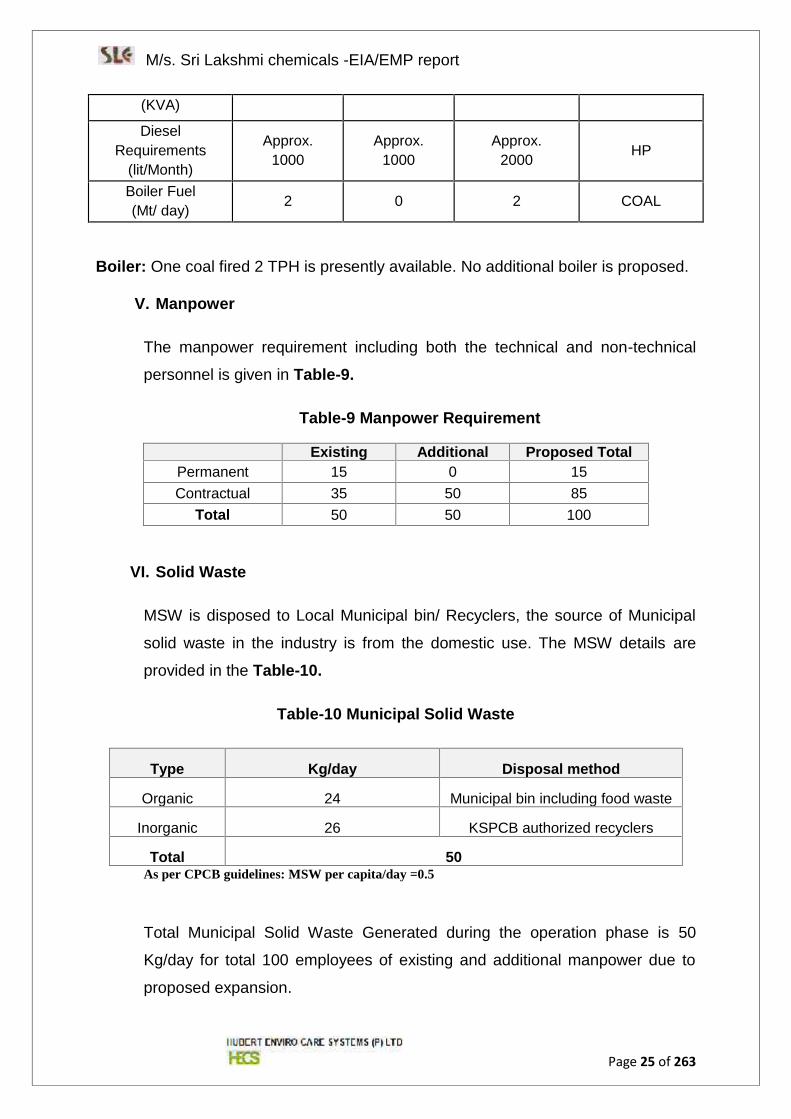
Table-8 Power and Fuel Requirement
DetailsCapacity
SourceExisting Additional Proposed Total
Power Requirement(KVA) 100 300 400 GESCOM
Back-up 200 200 400 DG sets
M/s. Sri Lakshmi chemicals -EIA/EMP report
Page 25 of 263
(KVA)
DieselRequirements
(lit/Month)
Approx.1000
Approx.1000
Approx.2000 HP
Boiler Fuel(Mt/ day) 2 0 2 COAL
Boiler: One coal fired 2 TPH is presently available. No additional boiler is proposed.
V. Manpower
The manpower requirement including both the technical and non-technical
personnel is given in Table-9.
Table-9 Manpower Requirement
Existing Additional Proposed TotalPermanent 15 0 15Contractual 35 50 85
Total 50 50 100
VI. Solid Waste
MSW is disposed to Local Municipal bin/ Recyclers, the source of Municipal
solid waste in the industry is from the domestic use. The MSW details are
provided in the Table-10.
Table-10 Municipal Solid Waste
Type Kg/day Disposal method
Organic 24 Municipal bin including food waste
Inorganic 26 KSPCB authorized recyclers
Total 50As per CPCB guidelines: MSW per capita/day =0.5
Total Municipal Solid Waste Generated during the operation phase is 50
Kg/day for total 100 employees of existing and additional manpower due to
proposed expansion.
M/s. Sri Lakshmi chemicals -EIA/EMP report
Page 26 of 263
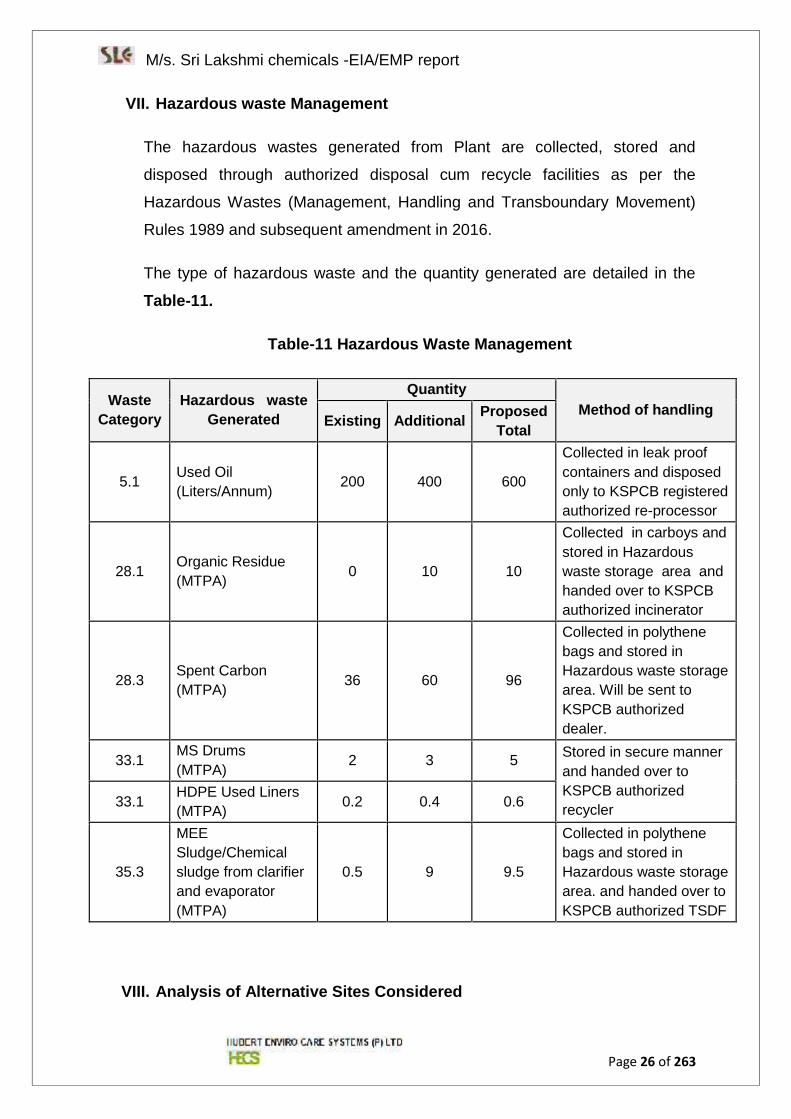
VII. Hazardous waste Management
The hazardous wastes generated from Plant are collected, stored and
disposed through authorized disposal cum recycle facilities as per the
Hazardous Wastes (Management, Handling and Transboundary Movement)
Rules 1989 and subsequent amendment in 2016.
The type of hazardous waste and the quantity generated are detailed in the
Table-11.
Table-11 Hazardous Waste Management
WasteCategory
Hazardous wasteGenerated
QuantityMethod of handling
Existing Additional ProposedTotal
5.1 Used Oil(Liters/Annum) 200 400 600
Collected in leak proofcontainers and disposedonly to KSPCB registeredauthorized re-processor
28.1 Organic Residue(MTPA) 0 10 10
Collected in carboys andstored in Hazardouswaste storage area andhanded over to KSPCBauthorized incinerator
28.3 Spent Carbon(MTPA) 36 60 96
Collected in polythenebags and stored inHazardous waste storagearea. Will be sent toKSPCB authorizeddealer.
33.1 MS Drums(MTPA) 2 3 5 Stored in secure manner
and handed over toKSPCB authorizedrecycler33.1 HDPE Used Liners
(MTPA) 0.2 0.4 0.6
35.3
MEESludge/Chemicalsludge from clarifierand evaporator(MTPA)
0.5 9 9.5
Collected in polythenebags and stored inHazardous waste storagearea. and handed over toKSPCB authorized TSDF
VIII. Analysis of Alternative Sites Considered
M/s. Sri Lakshmi chemicals -EIA/EMP report
Page 27 of 263
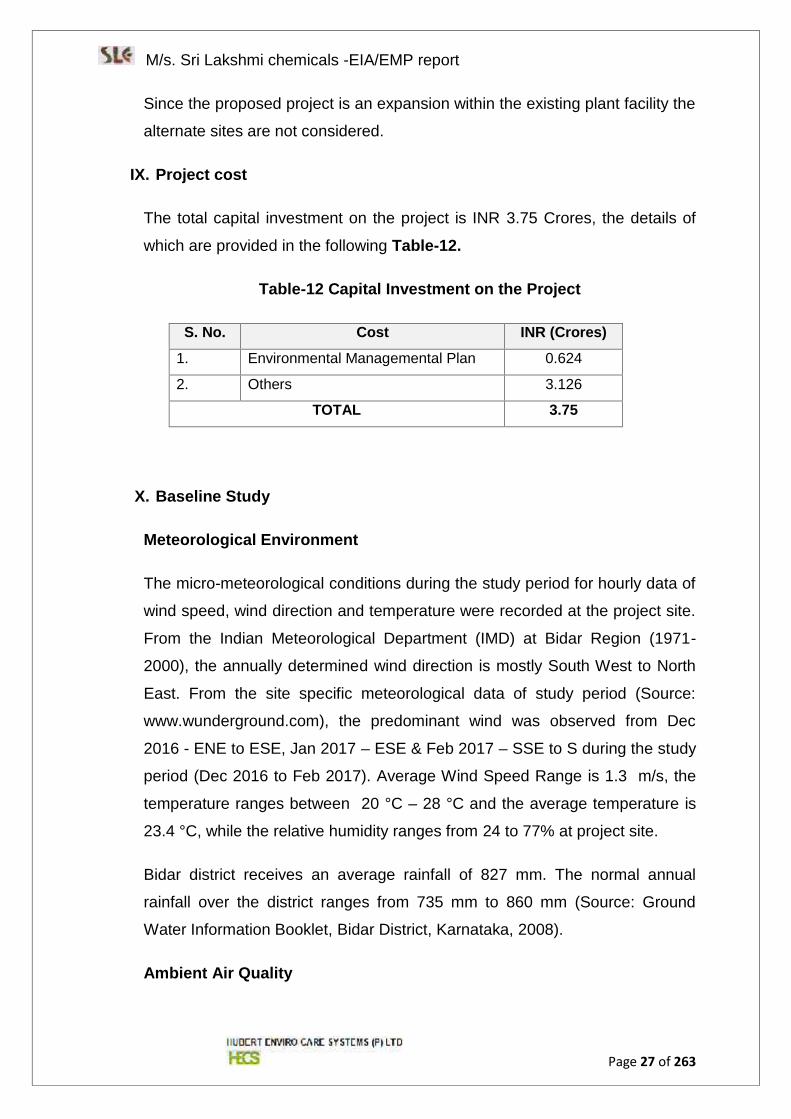
Since the proposed project is an expansion within the existing plant facility the
alternate sites are not considered.
IX. Project cost
The total capital investment on the project is INR 3.75 Crores, the details of
which are provided in the following Table-12.
Table-12 Capital Investment on the Project
S. No. Cost INR (Crores)
1. Environmental Managemental Plan 0.624
2. Others 3.126
TOTAL 3.75
X. Baseline Study
Meteorological Environment
The micro-meteorological conditions during the study period for hourly data of
wind speed, wind direction and temperature were recorded at the project site.
From the Indian Meteorological Department (IMD) at Bidar Region (1971-
2000), the annually determined wind direction is mostly South West to North
East. From the site specific meteorological data of study period (Source:
www.wunderground.com), the predominant wind was observed from Dec
2016 - ENE to ESE, Jan 2017 – ESE & Feb 2017 – SSE to S during the study
period (Dec 2016 to Feb 2017). Average Wind Speed Range is 1.3 m/s, the
temperature ranges between 20 °C – 28 °C and the average temperature is
23.4 °C, while the relative humidity ranges from 24 to 77% at project site.
Bidar district receives an average rainfall of 827 mm. The normal annual
rainfall over the district ranges from 735 mm to 860 mm (Source: Ground
Water Information Booklet, Bidar District, Karnataka, 2008).
Ambient Air Quality
M/s. Sri Lakshmi chemicals -EIA/EMP report
Page 28 of 263
The ambient air quality has been monitored at 8 locations for 18 parameters
including 16 parameters as per NAAQS, 2009 within the study area. The
baseline levels of PM10, PM2.5, SO2, NO2, CO, Pb, O3, NH3, C6H6, C20 H12, As,
Ni, VOC, Cl, HCl, HBr, H2S & HF are well within the National Ambient Air
Quality Standards for Industrial, Commercial and Residential areas at all
monitoring locations during the study period from December 2016 to February
2017.
Noise Environment
The existing ambient noise levels were monitored using precision noise level
meter in and around the project site at 10 km radius at 8 locations during
December 2016 to February 2017. During the study period, day time noise
levels varied between 53.8 dB(A) to 78.2 dB (A) and night time noise levels
varied from 46.4 dB (A) to 73.1 dB (A) across the sampling stations. The field
observations during the study period indicate that the ambient noise levels in
both Industrial area and in Residential area noise are slightly exceeded the
limit prescribed by MoEF&CC.
Water Environment
The prevailing status of water quality at eight sampling locations each for
ground and surface water have been assessed during December 2016.
The standard methods prescribed in IS were followed for sample collection,
preservation and analysis in the laboratory for various physiochemical
parameters.
Surface water quality
The values range from 6.9-7.76 for pH, 243– 374 mg/l for TDS, 107 - 165 mg/l
for Total Hardness, 18.5– 38.8 mg/l for chloride content, 10.4– 15.8 mg/l l for
sulphate content.
Ground Water Quality
M/s. Sri Lakshmi chemicals -EIA/EMP report
Page 29 of 263
The values range from 7.01 -7.84 for pH, 237 -521 mg/l for TDS, 66 -285 mg/l
for Total Hardness, 32.7– 121.3 mg/l for chloride content, 22.7– 74 mg/l for
sulphate content.
Land Environment
Assessment of soil characteristics is of paramount importance since the
vegetation growth, agricultural practices and production is directly related to
the soil fertility and quality. It is observed that,
The pH of the soil samples ranged from 7.98-8.33.
Conductivity of the soil samples ranged from 177-331 μS/cm. As the
EC value is less than 2000 μS/cm, the soil is found to be non-saline in
nature
The water holding capacity of the soil samples varied from 31-43.4 (%).
Nitrogen content ranged from 44 kg/ha to 216kg/ha
Phosphorous ranged from 22 to 126 kg/ha
Potassium content ranges from 45 to 264 kg/ha
Biological Environment
There sensitive places in the study area is provided in the Table-1 of
executive summary. The species observed in the study area are mostly
commercial crops and plantation crops and breaks were also observed
throughout the semi-evergreen and moist deciduous forest types. There is no
extinct flora and fauna species found in the study area.
Socio Economic Environment
Bidar district is located in the northern most tip of the State of Karnataka. The
total geographical area of the district is 5,448 sq.km. Bidar district is
surrounded by Gulbarga district to the south, Maharashtra State in the West
and North. It is bounded on the East by Andhra Pradesh. The population of
the district is 1703300 as per 2011 Census. The male population is 870665
and female population is 832635.The unique feature of the district is that there
are many spoken languages and dialects. As it is close to Maharashtra and
M/s. Sri Lakshmi chemicals -EIA/EMP report
Page 30 of 263
Andhrapradesh, they speak Kannada, Hindi, Marathi, Urdu and Telugu
languages.
A socio-economic study was undertaken in assessing aspects which are
dealing with social and cultural conditions, and economic status in the study
area. The study provides information such as demographic structure,
population dynamics, infrastructure resources, and the status of human health
and economic attributes like employment, per-capita income, agriculture,
trade, and industrial development in the study area. The study of these
characteristic helps in identification, prediction and evaluation of impacts on
socio-economic and parameters of human interest due to proposed project
developments. The parameters are:
Demographic structure
Infrastructure Facility
Economic Status
Health status
Cultural attributes
The district is rural in character as 75 percent of the population lives in rural
areas. Agriculture is the main contributor to the economy of the district. The
district has low industrial base. A major proportion of the area in the district is
not under irrigation. The proportion of net area irrigated to net area sown is
only 14.18%. The socio-economic status of the district and study area are
provided in the Chapter 3, Section 3.13.
The project area is in the Kolhar Village, Bidar taluk and at located
17°54'39.71"N and 77°27'23.66"E (Centre Coordinates) comes under Bidar
district of Karnataka state. It is located at an distance of 4.2 Km (NE) from
Bidar town.
Anticipated Environmental Impacts
Air Environment
M/s. Sri Lakshmi chemicals -EIA/EMP report
Page 31 of 263
Base line data reveals that ambient air quality in the study area for all the
parameters are well within the permissible limits as prescribed by National
Ambient Air Quality Standards. The main sources of emissions will be from
the D.G sets, Reactors and Boiler which are facilitated with stacks of
adequate height as an air pollution control measure.
Noise Environment
Baseline line study showed that the noise levels in both Industrial area and in
Residential area noise are slightly exceeded the limit prescribed by
MoEF&CC. The designed equipment with noise levels not exceeding beyond
the requirements of Occupational Health and Safety Administration Standard
will be employed.
Land Use
As the manufacturing facility is located in the designated KIADB industrial
area, the proposed activity does not change the land use classification of the
site.
XI. Environmental Monitoring Program
A monitoring schedule with respect to Ambient Air Quality, Water &
Wastewater Quality, Noise Quality as per Karnataka State Pollution Control
Board (KSPCB), shall be maintained.
XII. Pollution Control Measures
The emission from boilers and D.G sets will be mitigated by providing
adequate stack height. The D.G set will be provided with adequate stack
height of 11 m AGL. Boiler is provided with cyclone separator to control the
pollutants and stack of 21 m AGL to disperse the pollutants. Acoustic
enclosures are provided to the DG sets to control noise emissions. The
reactors are connected to individual scrubber and stacks (4 Nos), stack height
9 m AGL.
M/s. Sri Lakshmi chemicals -EIA/EMP report
Page 32 of 263
Municipal Solid Wastes including food waste are disposed to municipal bin.
The hazardous waste will be stored separately in hazardous waste storage
and disposed to KSPCB authorized TSDF sites within the stipulated period of
time. Hazardous waste materials will be properly disposed as per the
Hazardous and Other wastes (Management and Transboundary Movement)
Rules 1989 and subsequent amendment in 2016.
The wastewater generated will be mainly sewage and process effluent.
Domestic water will be treated in Septic tank followed by soak pit.
Industrial effluents from the plant will be stored collection tank and
neutralized, and then sent to MEE, Condensate will be sent recycled to
cooling tower and boiler feed though softener. MEE concentrate will be sent to
Centrifuge, Salt from Centrifuge will be sent to TSDF.
The wastewater treatment system will be ZLD. There will be no discharge to
land environment.
XIII. Greenbelt Development
The total land area is 5056 sq m (1.25 Acres) which is completely fortified and
protected on all the four sides by boundary walls. The Greenbelt area is 1845
Sq. mt (0.45 Acres, 36.5 %).
XIV. Risk Analysis
Hazard Identification and Risk Analysis including identification, screening of
scenarios, and consequence analysis of the various risk scenarios. Risk
Assessment has been done with respect to the Solvent Storage Tanks and
Pipe lines.
The Risk Assessment has been carried out by using the ALOHA software
5.4.5 (Aerial Locations of Hazardous Atmospheres) which was developed by
office of Emergency management, EPA and Emergency Response Division,
NOAA & PHAST Lite 7.11 (Licence number 1603-120331(S-28502))
developed by DNV GL AS 2014.
M/s. Sri Lakshmi chemicals -EIA/EMP report
Page 33 of 263
The scope of the study mainly involves:
Identifications of Hazards
Consequence modeling
Flash fire
Jet Fire analysis
dispersion of vapour cloud
pool fire
Impact limits identifications and contour mapping of the risk on the
layouts.
Mitigating measures for handling and storage to reduce impacts &
prevent incidents.
As per the NFPA rating, the fire hazard is observed in chemicals such as
Ethylene Dichloride (EDC), Toluene, Acetone, Isopropanol, Methanol,
Morpholine, N-Hexane, Tetrahydrofuran (THF) and Ethyl acetate. The
health hazard is observed in Morpholine. For the chemicals such as
Chloroform, DMSO, MDC and DMF fire and health hazards are not
observed.
The consequence analysis is performed for pipelines which are
connected from Storage tanks to Process tank.
All the hazards are observed in NorthEast direction due to the wind
blowing from SouthWest.
In case of emergency, onsite emergency plan will be implemented
Risk Control Measures
Pressure safety valves for storage tanks
Pressure alarm high and pressure alarm low for storage tanks
Level indicators with monitoring from control for storage tanks
Level transmitter, Level gauge and Temperature indicators for the
storage tanks
Fire protection arrangements in the form of Fire Hydrants and Monitors
for the storage tanks.
Emergency Handling checklist and procedure
M/s. Sri Lakshmi chemicals -EIA/EMP report
Page 34 of 263
All reactors would be equipped with condenser with appropriate heat
transfer area, which acts as primary condenser. Over and above that, the
non-condensable solvent vapors from the primary condenser are further
cooled in the vent condenser (Sub cooler) which have the circulation of
chilled water/ Brine circulation. This additional measure is taken to
enhance solvent recovery. The distillate/ Condensate from the primary &
secondary condensers would be collected in jacketed vessels which
have chilled utility circulation.
XV. Disaster Management Plan
The salient features of Disaster Management Plan includes
Emergency shutdown procedure
Electrical Power Failure & Key Utility failures
Fire protection system
Emergency safety equipment & Reporting and response to emergency
Emergency Help from nearby industries and tie up with nearby industries
Emergency Control Room - is the focal point in case of an emergency
from where the operations to handle the emergency are directed and
coordinated. It will be equipped with Internal and P & T telephones,
Paging system and Emergency siren.
On-Site Emergency Plan
To provide effective planning, communication and to ensure discipline
while mitigating identified emergencies at the earliest utilizing available
resources, safety gadgets and systems.
Synchronized action from all the internal and external agencies at the
earliest to initiate corrective and preventive action.
To minimize the human injury and illness during emergency mitigation,
priority is given to rescue of incident victim/s, rendering them first aid
onsite and if required providing further medical services at the earliest,
which is available nearest to our plant.
To minimize damage to property, general environment or work
environment.
M/s. Sri Lakshmi chemicals -EIA/EMP report
Page 35 of 263
To effectively refer and utilize this revised onsite emergency plan while
conducting on site emergency and preparedness response drills and
also during real emergencies.
To identify any deviations during above drills and real situations to
ensure any identified and recorded observations for continual corrective
actions and preventive actions.
XVI. Benefits of the Proposed Project
The proposed expansion of production capacity will fulfill the market
requirement and play a vital role in the Active Pharmaceutical Ingredients and
Chemical Intermediates sectors and thereby address the market demand and
Social benefits.
The products manufactured at these facilities will be exported that will aid in
adding revenue to the nation. The corporate social responsibilities that will be
taken up by the proposed project will improve the well-being of the society
and the corporate responsibilities towards the protection of the environment
will help in conserving the ecosystem. It will also provide employment
opportunities to local population.
M/s. Sri Lakshmi chemicals -EIA/EMP report
Page 36 of 263
CHAPTER – 1Introduction
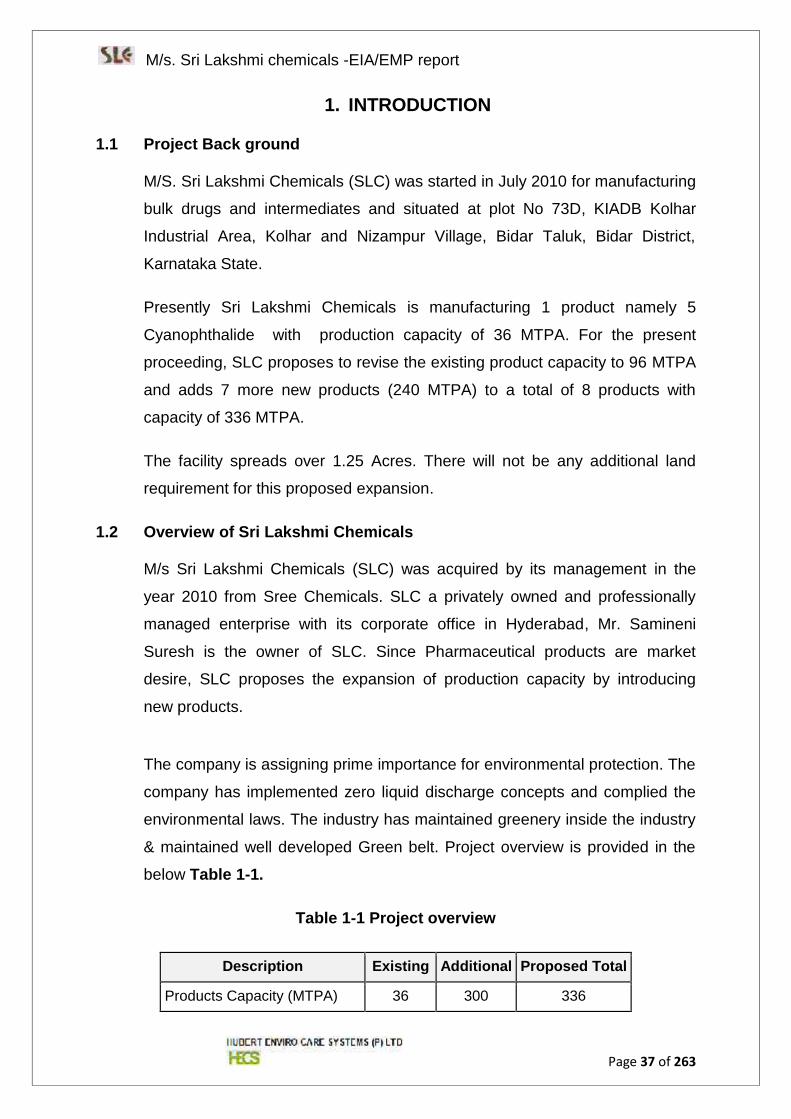
M/s. Sri Lakshmi chemicals -EIA/EMP report
Page 37 of 263
1. INTRODUCTION
1.1 Project Back ground
M/S. Sri Lakshmi Chemicals (SLC) was started in July 2010 for manufacturing
bulk drugs and intermediates and situated at plot No 73D, KIADB Kolhar
Industrial Area, Kolhar and Nizampur Village, Bidar Taluk, Bidar District,
Karnataka State.
Presently Sri Lakshmi Chemicals is manufacturing 1 product namely 5
Cyanophthalide with production capacity of 36 MTPA. For the present
proceeding, SLC proposes to revise the existing product capacity to 96 MTPA
and adds 7 more new products (240 MTPA) to a total of 8 products with
capacity of 336 MTPA.
The facility spreads over 1.25 Acres. There will not be any additional land
requirement for this proposed expansion.
1.2 Overview of Sri Lakshmi Chemicals
M/s Sri Lakshmi Chemicals (SLC) was acquired by its management in the
year 2010 from Sree Chemicals. SLC a privately owned and professionally
managed enterprise with its corporate office in Hyderabad, Mr. Samineni
Suresh is the owner of SLC. Since Pharmaceutical products are market
desire, SLC proposes the expansion of production capacity by introducing
new products.
The company is assigning prime importance for environmental protection. The
company has implemented zero liquid discharge concepts and complied the
environmental laws. The industry has maintained greenery inside the industry
& maintained well developed Green belt. Project overview is provided in the
below Table 1-1.
Table 1-1 Project overview
Description Existing Additional Proposed Total
Products Capacity (MTPA) 36 300 336
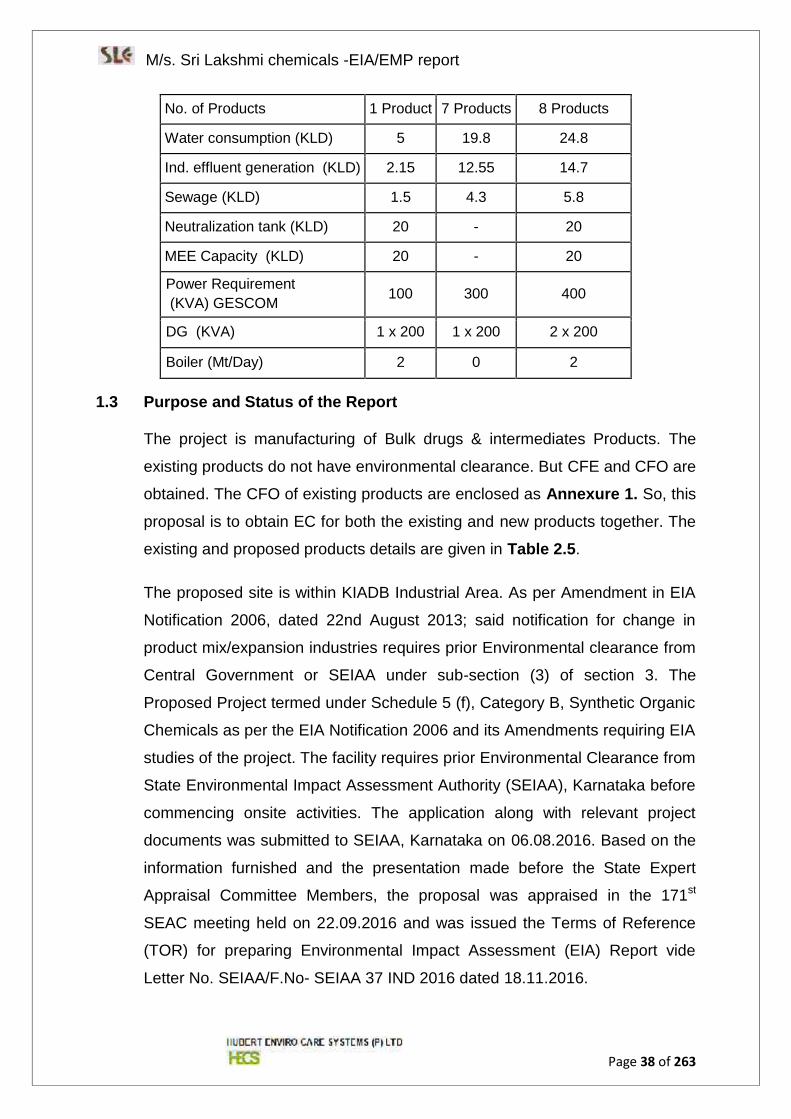
M/s. Sri Lakshmi chemicals -EIA/EMP report
Page 38 of 263
No. of Products 1 Product 7 Products 8 Products
Water consumption (KLD) 5 19.8 24.8
Ind. effluent generation (KLD) 2.15 12.55 14.7
Sewage (KLD) 1.5 4.3 5.8
Neutralization tank (KLD) 20 - 20
MEE Capacity (KLD) 20 - 20
Power Requirement(KVA) GESCOM 100 300 400
DG (KVA) 1 x 200 1 x 200 2 x 200
Boiler (Mt/Day) 2 0 2
1.3 Purpose and Status of the Report
The project is manufacturing of Bulk drugs & intermediates Products. The
existing products do not have environmental clearance. But CFE and CFO are
obtained. The CFO of existing products are enclosed as Annexure 1. So, this
proposal is to obtain EC for both the existing and new products together. The
existing and proposed products details are given in Table 2.5.
The proposed site is within KIADB Industrial Area. As per Amendment in EIA
Notification 2006, dated 22nd August 2013; said notification for change in
product mix/expansion industries requires prior Environmental clearance from
Central Government or SEIAA under sub-section (3) of section 3. The
Proposed Project termed under Schedule 5 (f), Category B, Synthetic Organic
Chemicals as per the EIA Notification 2006 and its Amendments requiring EIA
studies of the project. The facility requires prior Environmental Clearance from
State Environmental Impact Assessment Authority (SEIAA), Karnataka before
commencing onsite activities. The application along with relevant project
documents was submitted to SEIAA, Karnataka on 06.08.2016. Based on the
information furnished and the presentation made before the State Expert
Appraisal Committee Members, the proposal was appraised in the 171st
SEAC meeting held on 22.09.2016 and was issued the Terms of Reference
(TOR) for preparing Environmental Impact Assessment (EIA) Report vide
Letter No. SEIAA/F.No- SEIAA 37 IND 2016 dated 18.11.2016.
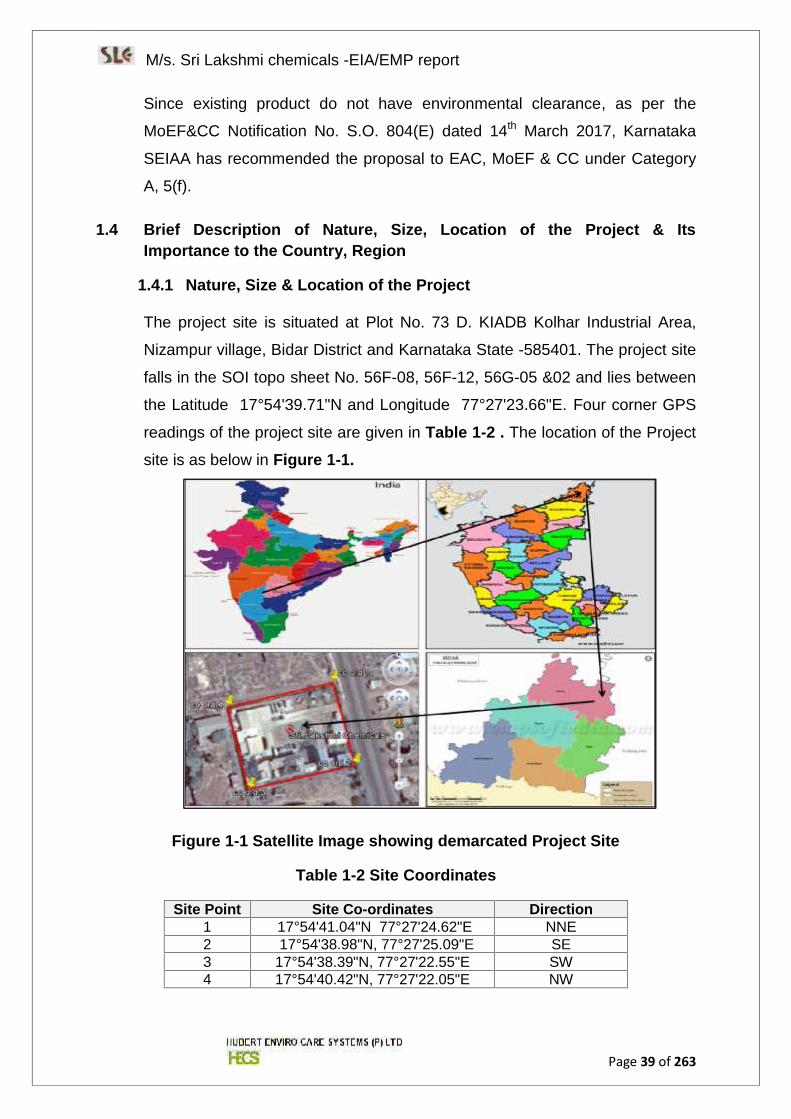
M/s. Sri Lakshmi chemicals -EIA/EMP report
Page 39 of 263
Since existing product do not have environmental clearance, as per the
MoEF&CC Notification No. S.O. 804(E) dated 14th March 2017, Karnataka
SEIAA has recommended the proposal to EAC, MoEF & CC under Category
A, 5(f).
1.4 Brief Description of Nature, Size, Location of the Project & ItsImportance to the Country, Region
1.4.1 Nature, Size & Location of the Project
The project site is situated at Plot No. 73 D. KIADB Kolhar Industrial Area,
Nizampur village, Bidar District and Karnataka State -585401. The project site
falls in the SOI topo sheet No. 56F-08, 56F-12, 56G-05 &02 and lies between
the Latitude 17°54'39.71"N and Longitude 77°27'23.66"E. Four corner GPS
readings of the project site are given in Table 1-2 . The location of the Project
site is as below in Figure 1-1.
Figure 1-1 Satellite Image showing demarcated Project Site
Table 1-2 Site Coordinates
Site Point Site Co-ordinates Direction1 17°54'41.04"N 77°27'24.62"E NNE2 17°54'38.98"N, 77°27'25.09"E SE3 17°54'38.39"N, 77°27'22.55"E SW4 17°54'40.42"N, 77°27'22.05"E NW
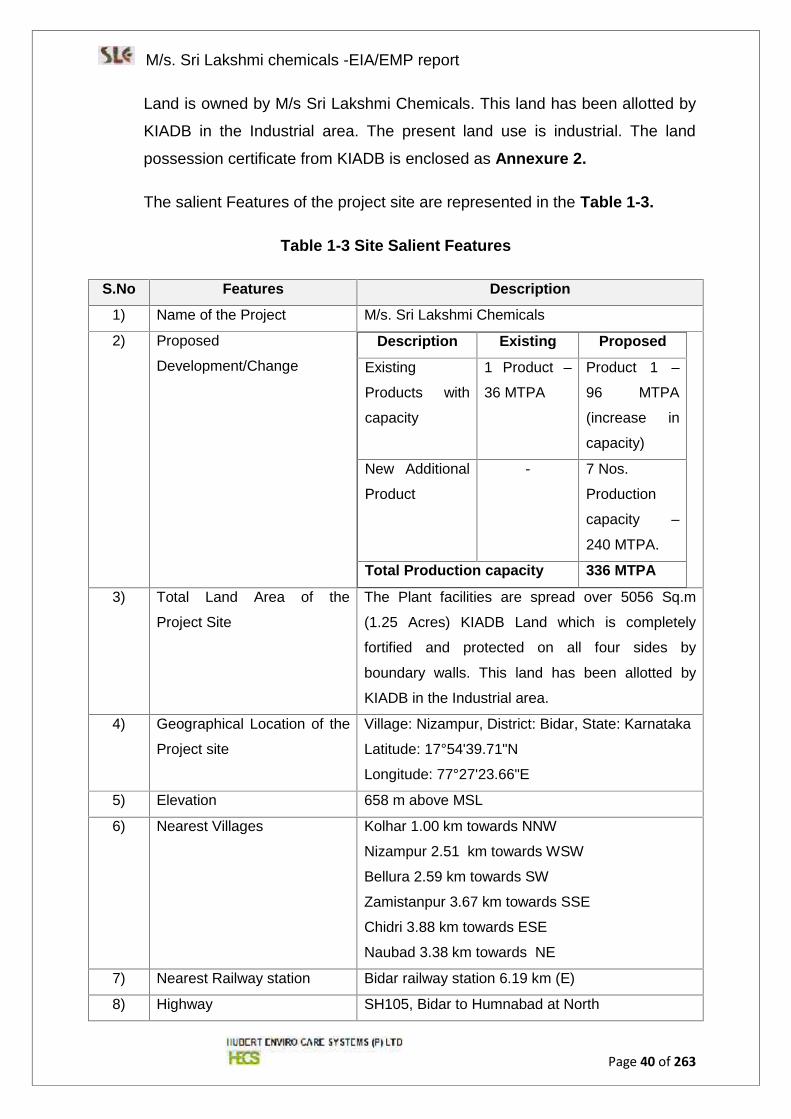
M/s. Sri Lakshmi chemicals -EIA/EMP report
Page 40 of 263
Land is owned by M/s Sri Lakshmi Chemicals. This land has been allotted by
KIADB in the Industrial area. The present land use is industrial. The land
possession certificate from KIADB is enclosed as Annexure 2.
The salient Features of the project site are represented in the Table 1-3.
Table 1-3 Site Salient Features
S.No Features Description
1) Name of the Project M/s. Sri Lakshmi Chemicals
2) Proposed
Development/Change
Description Existing Proposed
Existing
Products with
capacity
1 Product –
36 MTPA
Product 1 –
96 MTPA
(increase in
capacity)
New Additional
Product
- 7 Nos.
Production
capacity –
240 MTPA.
Total Production capacity 336 MTPA
3) Total Land Area of the
Project Site
The Plant facilities are spread over 5056 Sq.m
(1.25 Acres) KIADB Land which is completely
fortified and protected on all four sides by
boundary walls. This land has been allotted by
KIADB in the Industrial area.
4) Geographical Location of the
Project site
Village: Nizampur, District: Bidar, State: Karnataka
Latitude: 17°54'39.71"N
Longitude: 77°27'23.66"E
5) Elevation 658 m above MSL
6) Nearest Villages Kolhar 1.00 km towards NNW
Nizampur 2.51 km towards WSW
Bellura 2.59 km towards SW
Zamistanpur 3.67 km towards SSE
Chidri 3.88 km towards ESE
Naubad 3.38 km towards NE
7) Nearest Railway station Bidar railway station 6.19 km (E)
8) Highway SH105, Bidar to Humnabad at North
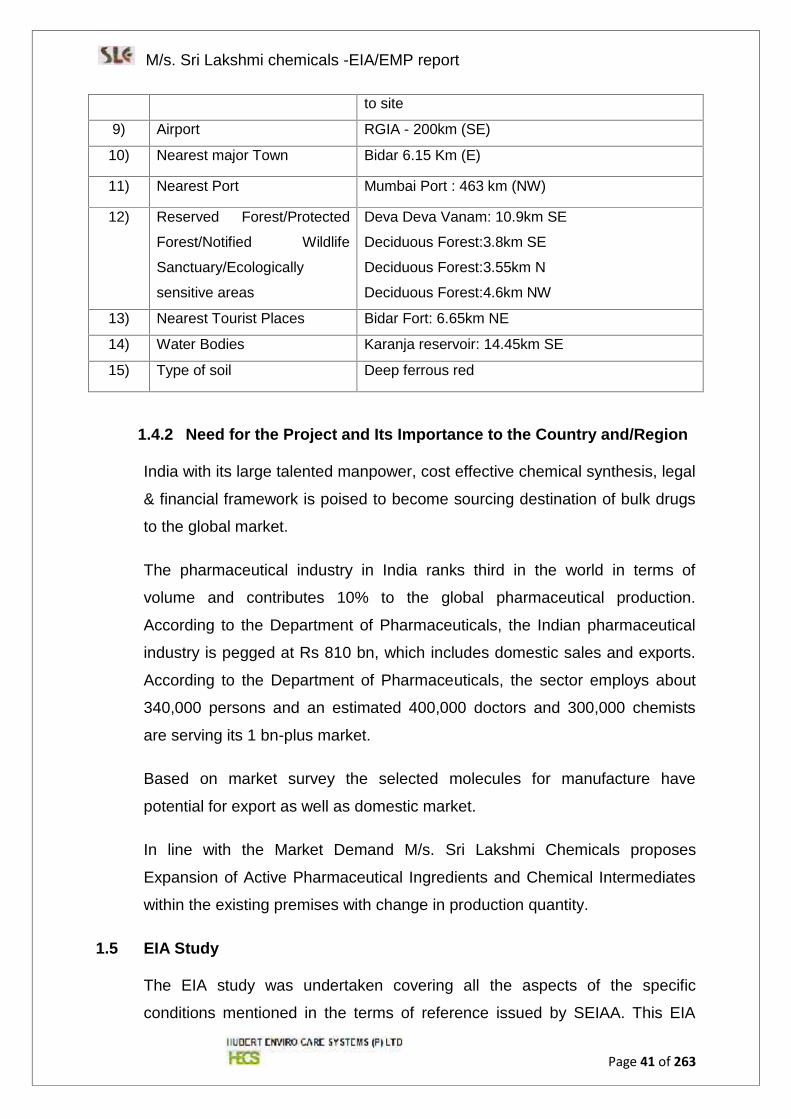
M/s. Sri Lakshmi chemicals -EIA/EMP report
Page 41 of 263
to site
9) Airport RGIA - 200km (SE)
10) Nearest major Town Bidar 6.15 Km (E)
11) Nearest Port Mumbai Port : 463 km (NW)
12) Reserved Forest/Protected
Forest/Notified Wildlife
Sanctuary/Ecologically
sensitive areas
Deva Deva Vanam: 10.9km SE
Deciduous Forest:3.8km SE
Deciduous Forest:3.55km N
Deciduous Forest:4.6km NW
13) Nearest Tourist Places Bidar Fort: 6.65km NE
14) Water Bodies Karanja reservoir: 14.45km SE
15) Type of soil Deep ferrous red
1.4.2 Need for the Project and Its Importance to the Country and/Region
India with its large talented manpower, cost effective chemical synthesis, legal
& financial framework is poised to become sourcing destination of bulk drugs
to the global market.
The pharmaceutical industry in India ranks third in the world in terms of
volume and contributes 10% to the global pharmaceutical production.
According to the Department of Pharmaceuticals, the Indian pharmaceutical
industry is pegged at Rs 810 bn, which includes domestic sales and exports.
According to the Department of Pharmaceuticals, the sector employs about
340,000 persons and an estimated 400,000 doctors and 300,000 chemists
are serving its 1 bn-plus market.
Based on market survey the selected molecules for manufacture have
potential for export as well as domestic market.
In line with the Market Demand M/s. Sri Lakshmi Chemicals proposes
Expansion of Active Pharmaceutical Ingredients and Chemical Intermediates
within the existing premises with change in production quantity.
1.5 EIA Study
The EIA study was undertaken covering all the aspects of the specific
conditions mentioned in the terms of reference issued by SEIAA. This EIA
M/s. Sri Lakshmi chemicals -EIA/EMP report
Page 42 of 263
study was undertaken by M/s Hubert Enviro Care Systems (P) Ltd (HECS), a
NABET accredited EIA consulting organisation, with specific project related
inputs required for undertaking the EIA studies from M/s. Sri Lakshmi
Chemicals, Bidar.
M/s. Hubert Enviro Care Systems (P) Ltd is authorized to undertake EIA
studies for Synthetic Organic Chemicals industry (dyes & dye intermediates,
bulk drugs and intermediates excluding drug formulations, synthetic rubbers
basic organic chemicals, other synthetic organic chemicals and chemical
intermediates) as per the NABET accreditation scheme.
As per EIA notification, public consultation for the proposed project shall be
exempted as the project is coming up in notified Karnataka Industrial Area
Development Board
1.6 EIA Cost
EIA study was undertaken by HECS for an amount of Rs. 7/- Lakhs (seven
Lakh only)
1.7 Scope of the study
The scope of the work mentioned includes an assessment study of proposed
pharmaceutical manufacturing unit and their impact on the region. This study
puts forward the most effective ways to protect the environment form
increasing pollution caused by the burgeoning industrial development and
recommendations for environmental-friendly development initiatives in the
region.
An Environmental Impact Assessment (EIA) is an assessment of the possible
impact, whether positive or negative, that a proposed project may have on the
environment, together consisting of the natural, social and economic aspects,
i.e., aiming at “Sustainable Development” due to the project activities.
This EIA report presents the existing baseline scenario and the assessment
and evaluation of the environmental impacts that may rise during the
construction and operational phases of the project. This report also highlights
M/s. Sri Lakshmi chemicals -EIA/EMP report
Page 43 of 263
the Environmental Monitoring Program during the construction and operation
phases of the project and the post project monitoring program. In terms of the
EIA Notification of the MoEF&CC dated 14th September 2006 and
subsequent amendments the generic structure of the EIA document will be as
under:
Chapter 1: Introduction
Introductory information is presented in this Chapter. The introduction chapter
provides background to the project, project proponent and describes the
objective of this document. The purpose and organization of the report is also
presented in this chapter.
Chapter 2: Project Description
This Chapter includes Project Description and Infrastructure Facilities
delineating all the industrial and environmental aspect of the industry of M/s.
Sri Lakshmi Chemicals., operation phase activities as well as process details
of proposed products. This Chapter gives information about storage and
handling, water and resources requirement.
Chapter 3: Description of the Environment
This Chapter provides baseline environmental status of Environmental
Components (Primary data) delineating meteorological details of the project
site and surrounding area.
Chapter 4: Anticipated Environmental Impacts & Mitigation Measures
This Chapter presents the analysis of impacts on the environmental and
social aspects of the project as a result of establishment of plan and thereby
suggesting the mitigation measures.
Chapter 5: Analysis of Alternatives (Technology and Sites)
This chapter includes the justification for the selection of the project site from
Environmental point of view as well as from economic point of view so that the
technology will be affordable to the member units of the industrial area.
M/s. Sri Lakshmi chemicals -EIA/EMP report
Page 44 of 263
Chapter 6: Environmental Monitoring Program
This chapter will include the technical aspects of monitoring, the effectiveness
of mitigation measures which will include the measurement methodologies,
frequency, location, data analysis, reporting schedules etc.,
Chapter 7: Additional Studies
This chapter will detail about the Public Consultation sought regarding the
project. It will also identify the risks of the Project in relation to the general
public and the surrounding environment during construction and operation
phases of the plant and thereby presents Disaster Management Plan. Social
impact assessment and R&R action plans.
Chapter 8: Project Benefits
This chapter deals with improvement in physical and social infrastructures,
employment potential and other tangible benefits.
Chapter 9: Environmental Management Plan
This is the key Chapter of the report and presents the mitigation plan, covers
the institutional and monitoring requirements to implement environmental
mitigation measures and to assess their adequacy during project
implementation.
Chapter 10: Summary and Conclusion
This chapter summarizes the information given in Chapters in this EIA/EMP
report and the conclusion based on the environmental study, impact
identification, mitigation measures and the environmental management plan.
Chapter 11: Disclosure of the Consultant
Names of consultants engaged in the preparation of the EIA/EMP report along
with their brief resume and nature of Consultancy rendered are included in
this Chapter.
M/s. Sri Lakshmi chemicals -EIA/EMP report
Page 45 of 263
1.8 Objectives of the Study
To ensure environmental considerations are explicitly addressed and
incorporated into the development decision-making process.
To anticipate and avoid, minimize or offset the adverse significant
biophysical, social and other relevant effects of the above project proposal.
To protect the productivity and capacity of natural systems and the
ecological processes which maintain their respective functions
To promote development that is sustainable and optimizes resource use
as well as management opportunities.
To fully recognize the scope and requirements of the TOR and comply
with the same.
The major objective of this study is to prepare a detailed Environmental
Impact Assessment Study within the study area i.e 10 km radius from the
project.
1.9 Methodology adopted for the Study
An Environmental Impact Assessment (EIA) is an assessment of the possible
impact, whether positive or negative, that a proposed project may have on the
environment, together consisting of the natural, social and economic aspects,
i.e., aiming at “Sustainable Development” due to the project activities.
1.10 Applicable Regulatory Framework
The EIA process followed for this EIA report is composed of the following
stages:
Study of project information.
Screening & Scoping.
Environmental pre-feasibility study & application for approval of TOR.
Collection of detailed project management plan/report.
M/s. Sri Lakshmi chemicals -EIA/EMP report
Page 46 of 263
Baseline data collection.
Impact identification, Prediction & Evaluation.
Mitigation measures & delineation of EMP.
Risk assessment and safety & disaster management plan.
Review & finalization of EIA Report based on the TOR requirements.
Submission of EIA report for implementation of mitigation measures &
EMP as well as necessary clearances from relevant Authority.
The following Acts and Rules are applicable to the proposed project:
The details of Acts and Rules with applicability to the proposed project are
given in Table 1-4.
Table 1-4 Applicable Acts and Rules
S.No
Act and Rulesapplicable Purpose Objective Applicability
1. EIA Notification2006 and itsamendments.
New projects,Expansionmodernization,change in productmix of the existingproject
Protection andImprovement ofthe Environment
As the proposal isfor new projectscheduled undercategory 5(f),Environmentalclearance fromMinistry ofEnvironment,Forest & ClimateChange isapplicable
M/s. Sri Lakshmi chemicals -EIA/EMP report
Page 47 of 263
S.No
Act and Rulesapplicable Purpose Objective Applicability
2. The Manufacture,Storage and Importof HazardousChemicals Rules,1989 and itsamendments
Handling ofHazardousChemicals
Regulate themanufacture,storage andimport ofHazardousChemicals
Preparation/update of On-siteEmergencyPreparednessPlan andsubmission toFactoryinspectorate.
Preparation/update of SafetyReport and submitto Factoryinspectorate.
Preparation ofMaterial SafetyData Sheet.
3. The Water(Prevention andControl of Pollution)Act, 1974 and itsamendments.
New projects,Expansionmodernization,change of productmix of the existingproject,
Existing plants
Prevention,control andabatement ofwater pollution
Consent toEstablish andConsent toOperate fromState PollutionControl Board tobe obtained forexpansion andnew product
4. The Air (Preventionand Control ofPollution) Act, 1981and itsamendments.
New projects,Expansion/modernization,change of productmix of the existingproject, Existingindustries
Prevention,control andabatement of airpollution
Consent toEstablish andConsent toOperate fromState PollutionControl Board tobe obtained forexpansion andnew product
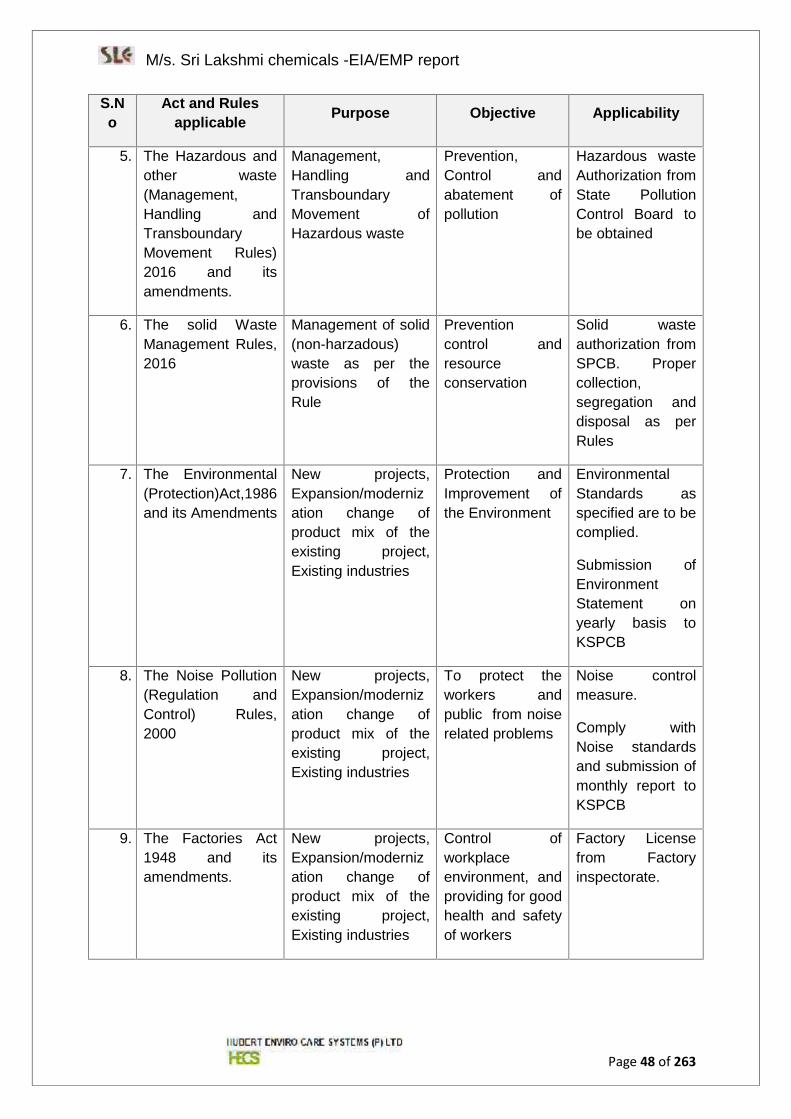
M/s. Sri Lakshmi chemicals -EIA/EMP report
Page 48 of 263
S.No
Act and Rulesapplicable Purpose Objective Applicability
5. The Hazardous andother waste(Management,Handling andTransboundaryMovement Rules)2016 and itsamendments.
Management,Handling andTransboundaryMovement ofHazardous waste
Prevention,Control andabatement ofpollution
Hazardous wasteAuthorization fromState PollutionControl Board tobe obtained
6. The solid WasteManagement Rules,2016
Management of solid(non-harzadous)waste as per theprovisions of theRule
Preventioncontrol andresourceconservation
Solid wasteauthorization fromSPCB. Propercollection,segregation anddisposal as perRules
7. The Environmental(Protection)Act,1986and its Amendments
New projects,Expansion/modernization change ofproduct mix of theexisting project,Existing industries
Protection andImprovement ofthe Environment
EnvironmentalStandards asspecified are to becomplied.
Submission ofEnvironmentStatement onyearly basis toKSPCB
8. The Noise Pollution(Regulation andControl) Rules,2000
New projects,Expansion/modernization change ofproduct mix of theexisting project,Existing industries
To protect theworkers andpublic from noiserelated problems
Noise controlmeasure.
Comply withNoise standardsand submission ofmonthly report toKSPCB
9. The Factories Act1948 and itsamendments.
New projects,Expansion/modernization change ofproduct mix of theexisting project,Existing industries
Control ofworkplaceenvironment, andproviding for goodhealth and safetyof workers
Factory Licensefrom Factoryinspectorate.
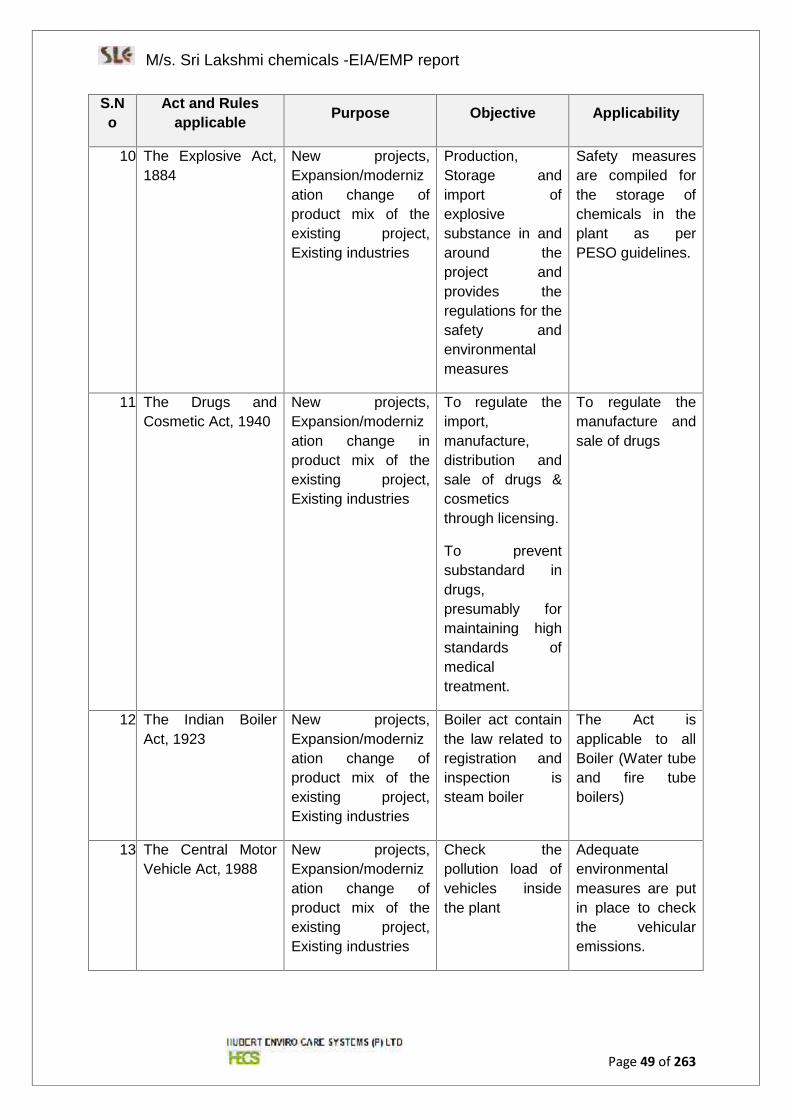
M/s. Sri Lakshmi chemicals -EIA/EMP report
Page 49 of 263
S.No
Act and Rulesapplicable Purpose Objective Applicability
10. The Explosive Act,1884
New projects,Expansion/modernization change ofproduct mix of theexisting project,Existing industries
Production,Storage andimport ofexplosivesubstance in andaround theproject andprovides theregulations for thesafety andenvironmentalmeasures
Safety measuresare compiled forthe storage ofchemicals in theplant as perPESO guidelines.
11. The Drugs andCosmetic Act, 1940
New projects,Expansion/modernization change inproduct mix of theexisting project,Existing industries
To regulate theimport,manufacture,distribution andsale of drugs &cosmeticsthrough licensing.
To preventsubstandard indrugs,presumably formaintaining highstandards ofmedicaltreatment.
To regulate themanufacture andsale of drugs
12. The Indian BoilerAct, 1923
New projects,Expansion/modernization change ofproduct mix of theexisting project,Existing industries
Boiler act containthe law related toregistration andinspection issteam boiler
The Act isapplicable to allBoiler (Water tubeand fire tubeboilers)
13. The Central MotorVehicle Act, 1988
New projects,Expansion/modernization change ofproduct mix of theexisting project,Existing industries
Check thepollution load ofvehicles insidethe plant
Adequateenvironmentalmeasures are putin place to checkthe vehicularemissions.
M/s. Sri Lakshmi chemicals -EIA/EMP report
Page 50 of 263
CHAPTER – 2Project Description
M/s. Sri Lakshmi chemicals -EIA/EMP report
Page 51 of 263
2. PROJECT DESCRIPTION
2.1 Type of Project
M/s. Sri Lakshmi Chemicals. is an existing unit for manufacturing of bulk
drugs and intermediates and situated at plot No 73 D, KIADB Industrial Area,
Nizampur village, Bidar Taluk, Bidar Dt, Karnataka.
The proposed project falls under the schedule 5 (f) Synthetic Organic
Chemicals as per the EIA Notification dated September 14, 2006 and its
amendments. There is no interlinked project. The project is categorized into
category ‘B’ as the site is located inside KIADB Industrial Area.
Since existing product do not have environmental clearance, as per the
MoEF&CC Notification No. S.O. 804(E) dated 14th March, 2017, Karnataka
SEIAA has recommended to EAC, MoEF & CC under Category A, 5(f).
2.2 Site Location
The project site location is discussed under Chapter 1, Section 1.4.1 andFigure 1-1 The Satellite Image of Environmental Sensitive Area with
Distances within 15KM Radius is appended in the Figure 2-1. The Google
satellite imageries covering 10 Km, 5 km &1 km radius around the project
area are appended the Figure 2-2 to Figure 2-4 respectively.
The project site falls in the Latitude 17°54'39.71"N and Longitude
77°27'23.66"E (Centre coordinates).
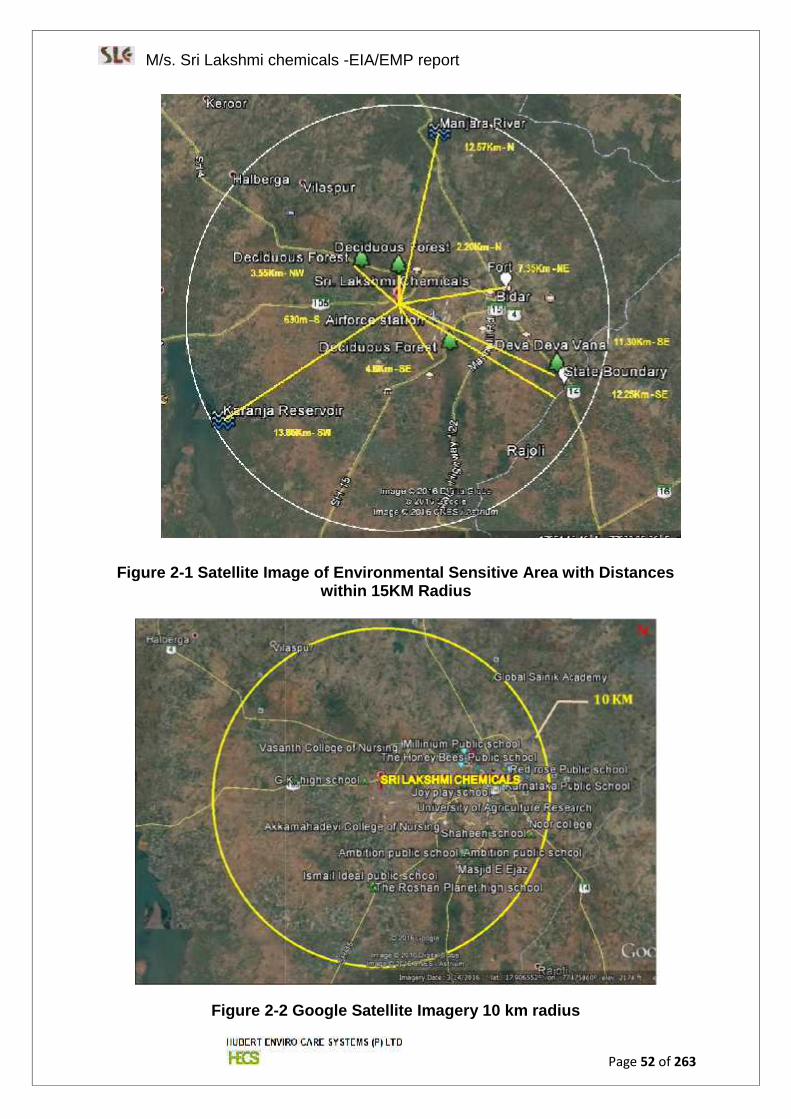
M/s. Sri Lakshmi chemicals -EIA/EMP report
Page 52 of 263
Figure 2-1 Satellite Image of Environmental Sensitive Area with Distanceswithin 15KM Radius
Figure 2-2 Google Satellite Imagery 10 km radius
M/s. Sri Lakshmi chemicals -EIA/EMP report
Page 52 of 263
Figure 2-1 Satellite Image of Environmental Sensitive Area with Distanceswithin 15KM Radius
Figure 2-2 Google Satellite Imagery 10 km radius
M/s. Sri Lakshmi chemicals -EIA/EMP report
Page 52 of 263
Figure 2-1 Satellite Image of Environmental Sensitive Area with Distanceswithin 15KM Radius
Figure 2-2 Google Satellite Imagery 10 km radius
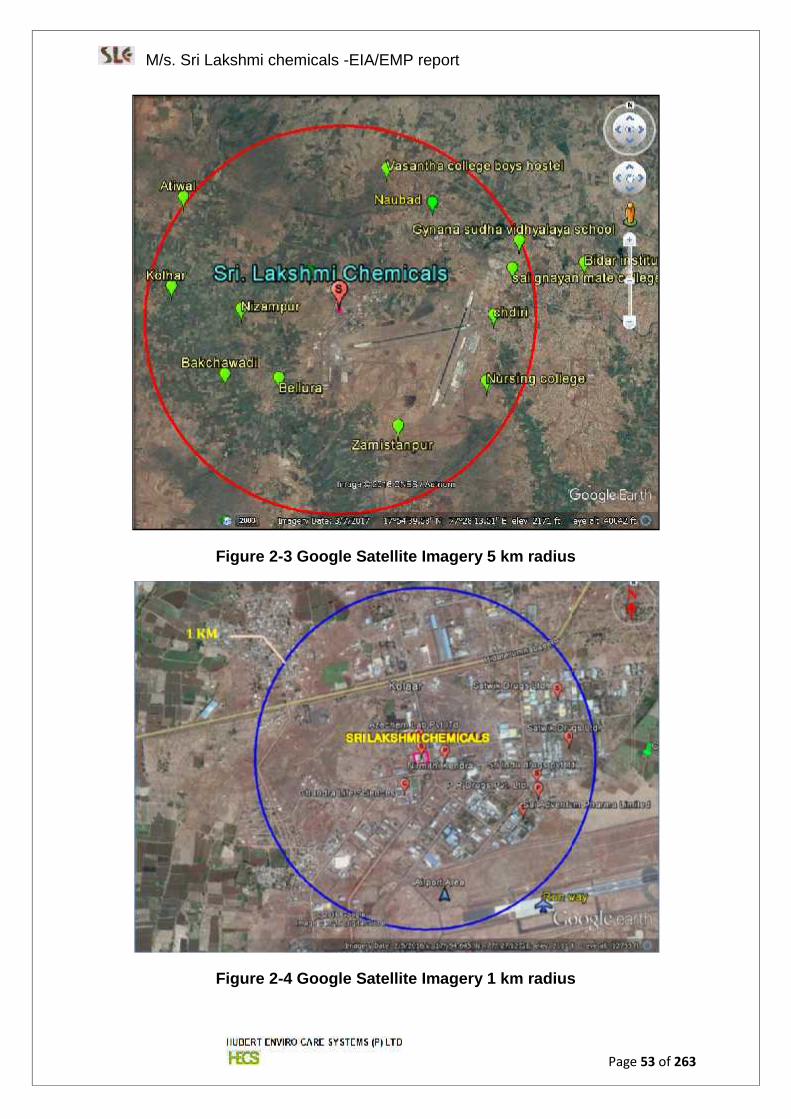
M/s. Sri Lakshmi chemicals -EIA/EMP report
Page 53 of 263
Figure 2-3 Google Satellite Imagery 5 km radius
Figure 2-4 Google Satellite Imagery 1 km radius
M/s. Sri Lakshmi chemicals -EIA/EMP report
Page 53 of 263
Figure 2-3 Google Satellite Imagery 5 km radius
Figure 2-4 Google Satellite Imagery 1 km radius
M/s. Sri Lakshmi chemicals -EIA/EMP report
Page 53 of 263
Figure 2-3 Google Satellite Imagery 5 km radius
Figure 2-4 Google Satellite Imagery 1 km radius
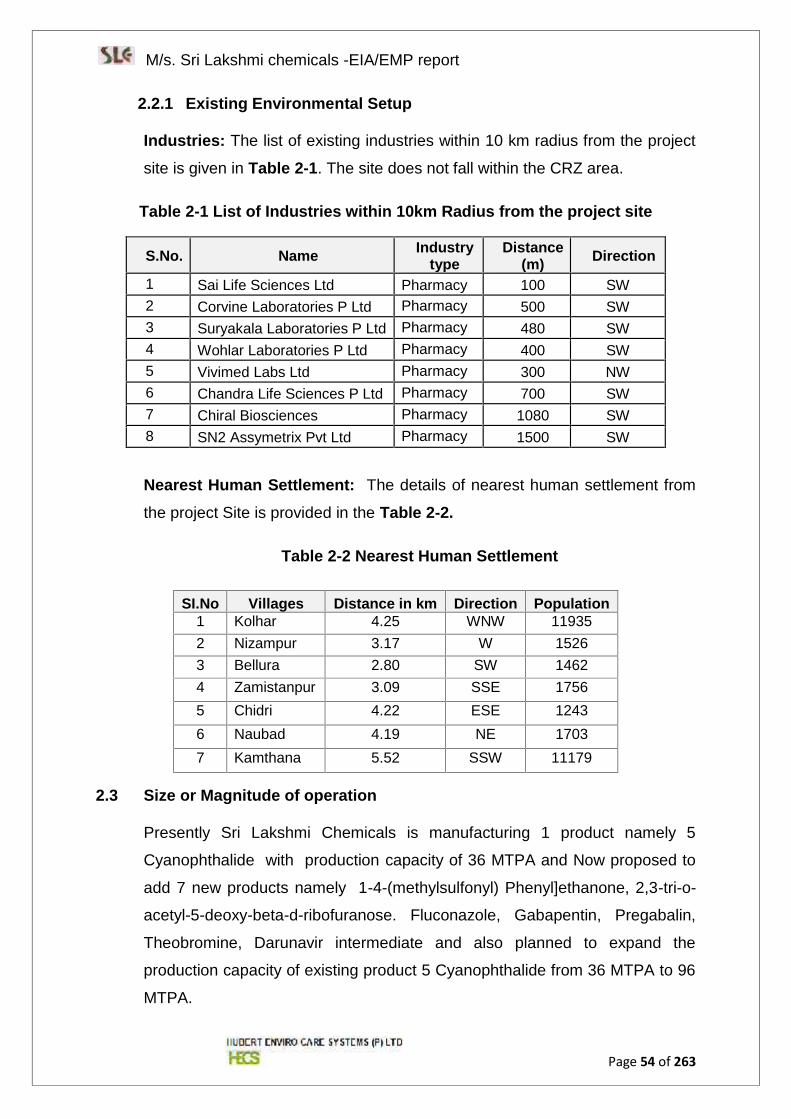
M/s. Sri Lakshmi chemicals -EIA/EMP report
Page 54 of 263
2.2.1 Existing Environmental Setup
Industries: The list of existing industries within 10 km radius from the project
site is given in Table 2-1. The site does not fall within the CRZ area.
Table 2-1 List of Industries within 10km Radius from the project site
S.No. Name Industrytype
Distance(m) Direction
1 Sai Life Sciences Ltd Pharmacy 100 SW2 Corvine Laboratories P Ltd Pharmacy 500 SW3 Suryakala Laboratories P Ltd Pharmacy 480 SW4 Wohlar Laboratories P Ltd Pharmacy 400 SW5 Vivimed Labs Ltd Pharmacy 300 NW6 Chandra Life Sciences P Ltd Pharmacy 700 SW7 Chiral Biosciences Pharmacy 1080 SW8 SN2 Assymetrix Pvt Ltd Pharmacy 1500 SW
Nearest Human Settlement: The details of nearest human settlement from
the project Site is provided in the Table 2-2.
Table 2-2 Nearest Human Settlement
SI.No Villages Distance in km Direction Population1 Kolhar 4.25 WNW 119352 Nizampur 3.17 W 15263 Bellura 2.80 SW 14624 Zamistanpur 3.09 SSE 17565 Chidri 4.22 ESE 12436 Naubad 4.19 NE 17037 Kamthana 5.52 SSW 11179
2.3 Size or Magnitude of operation
Presently Sri Lakshmi Chemicals is manufacturing 1 product namely 5
Cyanophthalide with production capacity of 36 MTPA and Now proposed to
add 7 new products namely 1-4-(methylsulfonyl) Phenyl]ethanone, 2,3-tri-o-
acetyl-5-deoxy-beta-d-ribofuranose. Fluconazole, Gabapentin, Pregabalin,
Theobromine, Darunavir intermediate and also planned to expand the
production capacity of existing product 5 Cyanophthalide from 36 MTPA to 96
MTPA.
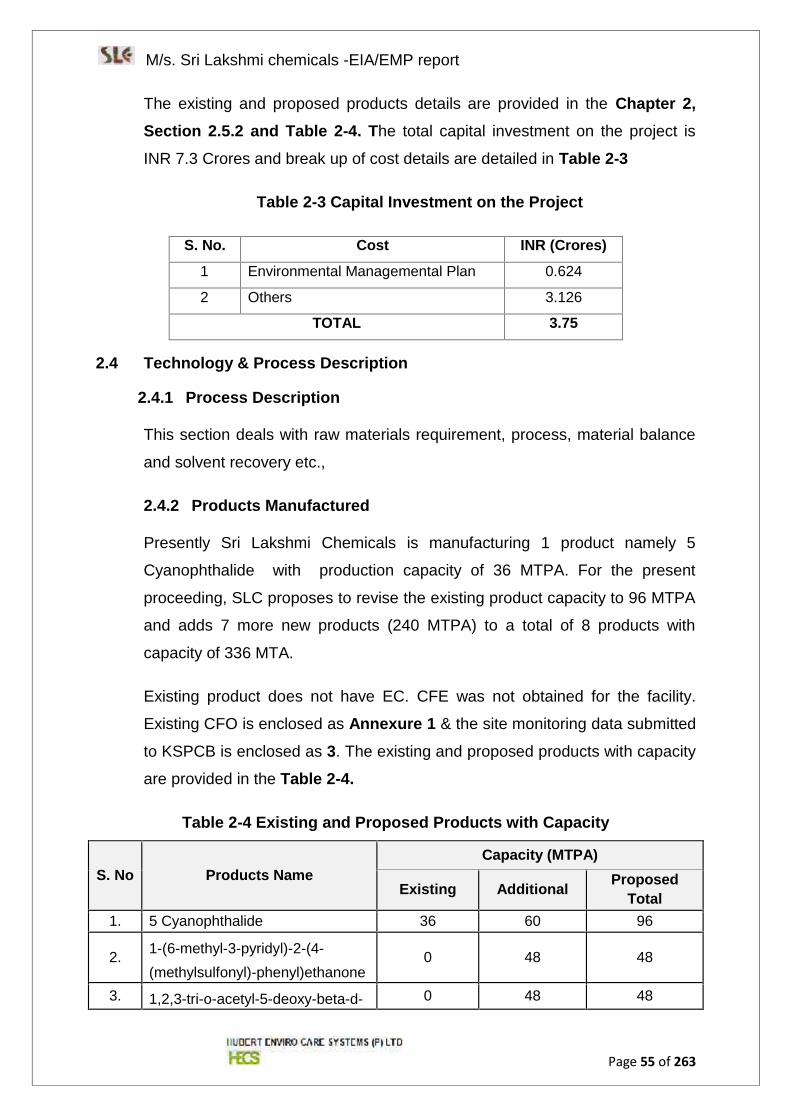
M/s. Sri Lakshmi chemicals -EIA/EMP report
Page 55 of 263
The existing and proposed products details are provided in the Chapter 2,Section 2.5.2 and Table 2-4. The total capital investment on the project is
INR 7.3 Crores and break up of cost details are detailed in Table 2-3
Table 2-3 Capital Investment on the Project
S. No. Cost INR (Crores)
1 Environmental Managemental Plan 0.624
2 Others 3.126
TOTAL 3.75
2.4 Technology & Process Description
2.4.1 Process Description
This section deals with raw materials requirement, process, material balance
and solvent recovery etc.,
2.4.2 Products Manufactured
Presently Sri Lakshmi Chemicals is manufacturing 1 product namely 5
Cyanophthalide with production capacity of 36 MTPA. For the present
proceeding, SLC proposes to revise the existing product capacity to 96 MTPA
and adds 7 more new products (240 MTPA) to a total of 8 products with
capacity of 336 MTA.
Existing product does not have EC. CFE was not obtained for the facility.
Existing CFO is enclosed as Annexure 1 & the site monitoring data submitted
to KSPCB is enclosed as 3. The existing and proposed products with capacity
are provided in the Table 2-4.
Table 2-4 Existing and Proposed Products with Capacity
S. No Products NameCapacity (MTPA)
Existing Additional ProposedTotal
1. 5 Cyanophthalide 36 60 96
2. 1-(6-methyl-3-pyridyl)-2-(4-(methylsulfonyl)-phenyl)ethanone
0 48 48
3. 1,2,3-tri-o-acetyl-5-deoxy-beta-d- 0 48 48
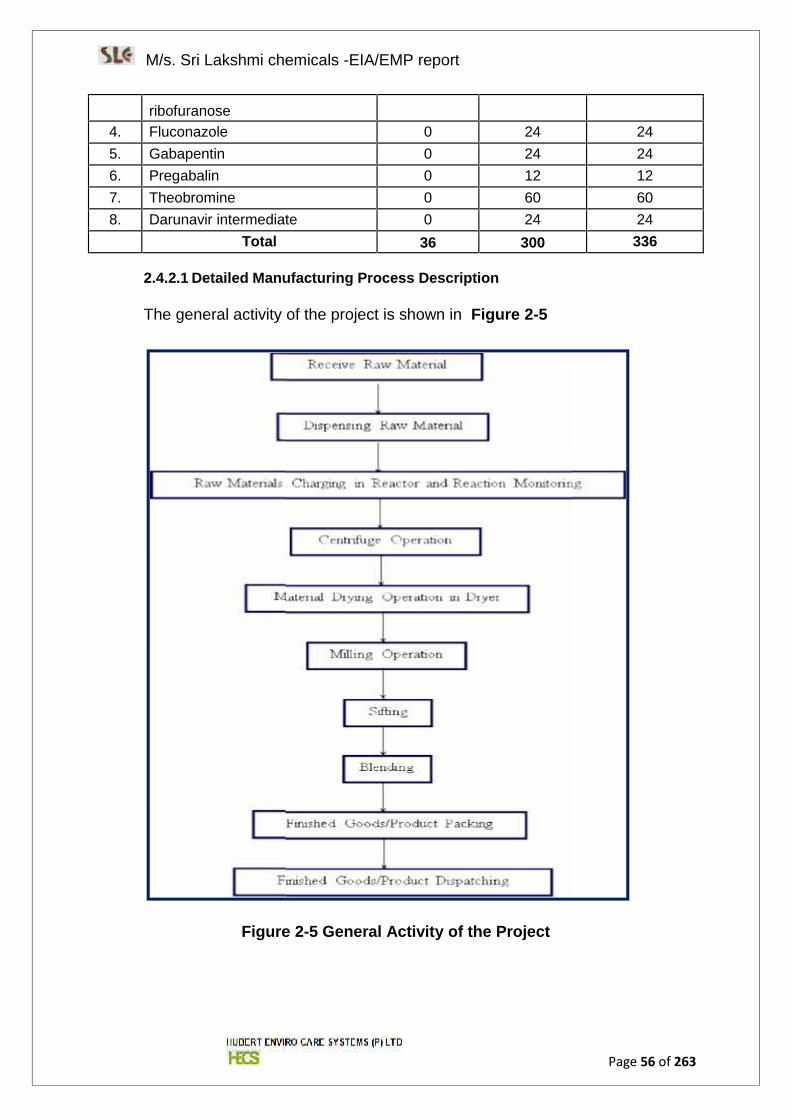
M/s. Sri Lakshmi chemicals -EIA/EMP report
Page 56 of 263
ribofuranose4. Fluconazole 0 24 245. Gabapentin 0 24 246. Pregabalin 0 12 127. Theobromine 0 60 608. Darunavir intermediate 0 24 24
Total 36 300 336
2.4.2.1 Detailed Manufacturing Process Description
The general activity of the project is shown in Figure 2-5
Figure 2-5 General Activity of the Project
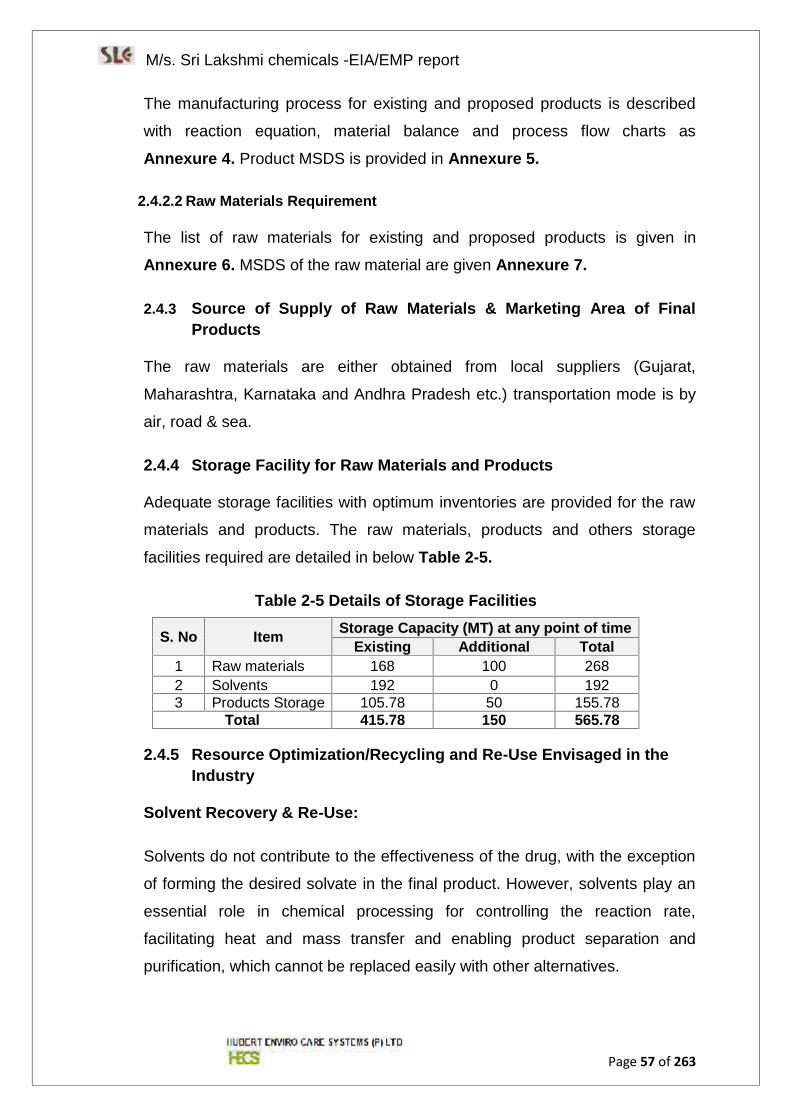
M/s. Sri Lakshmi chemicals -EIA/EMP report
Page 57 of 263
The manufacturing process for existing and proposed products is described
with reaction equation, material balance and process flow charts as
Annexure 4. Product MSDS is provided in Annexure 5.
2.4.2.2 Raw Materials Requirement
The list of raw materials for existing and proposed products is given in
Annexure 6. MSDS of the raw material are given Annexure 7.
2.4.3 Source of Supply of Raw Materials & Marketing Area of FinalProducts
The raw materials are either obtained from local suppliers (Gujarat,
Maharashtra, Karnataka and Andhra Pradesh etc.) transportation mode is by
air, road & sea.
2.4.4 Storage Facility for Raw Materials and Products
Adequate storage facilities with optimum inventories are provided for the raw
materials and products. The raw materials, products and others storage
facilities required are detailed in below Table 2-5.
Table 2-5 Details of Storage Facilities
S. No Item Storage Capacity (MT) at any point of timeExisting Additional Total
1 Raw materials 168 100 2682 Solvents 192 0 1923 Products Storage 105.78 50 155.78
Total 415.78 150 565.78
2.4.5 Resource Optimization/Recycling and Re-Use Envisaged in theIndustry
Solvent Recovery & Re-Use:
Solvents do not contribute to the effectiveness of the drug, with the exception
of forming the desired solvate in the final product. However, solvents play an
essential role in chemical processing for controlling the reaction rate,
facilitating heat and mass transfer and enabling product separation and
purification, which cannot be replaced easily with other alternatives.
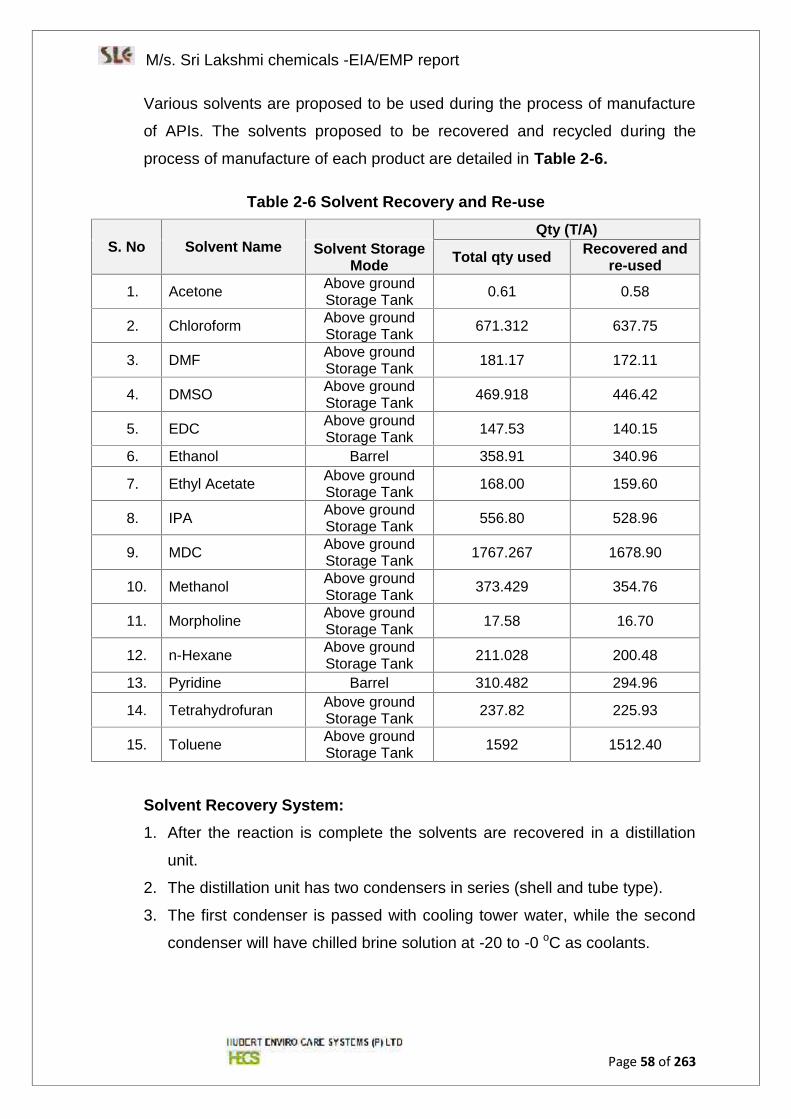
M/s. Sri Lakshmi chemicals -EIA/EMP report
Page 58 of 263
Various solvents are proposed to be used during the process of manufacture
of APIs. The solvents proposed to be recovered and recycled during the
process of manufacture of each product are detailed in Table 2-6.
Table 2-6 Solvent Recovery and Re-use
S. No Solvent NameQty (T/A)
Solvent StorageMode Total qty used Recovered and
re-used
1. Acetone Above groundStorage Tank 0.61 0.58
2. Chloroform Above groundStorage Tank 671.312 637.75
3. DMF Above groundStorage Tank 181.17 172.11
4. DMSO Above groundStorage Tank 469.918 446.42
5. EDC Above groundStorage Tank 147.53 140.15
6. Ethanol Barrel 358.91 340.96
7. Ethyl Acetate Above groundStorage Tank 168.00 159.60
8. IPA Above groundStorage Tank 556.80 528.96
9. MDC Above groundStorage Tank 1767.267 1678.90
10. Methanol Above groundStorage Tank 373.429 354.76
11. Morpholine Above groundStorage Tank 17.58 16.70
12. n-Hexane Above groundStorage Tank 211.028 200.48
13. Pyridine Barrel 310.482 294.96
14. Tetrahydrofuran Above groundStorage Tank 237.82 225.93
15. Toluene Above groundStorage Tank 1592 1512.40
Solvent Recovery System:1. After the reaction is complete the solvents are recovered in a distillation
unit.
2. The distillation unit has two condensers in series (shell and tube type).
3. The first condenser is passed with cooling tower water, while the second
condenser will have chilled brine solution at -20 to -0 oC as coolants.
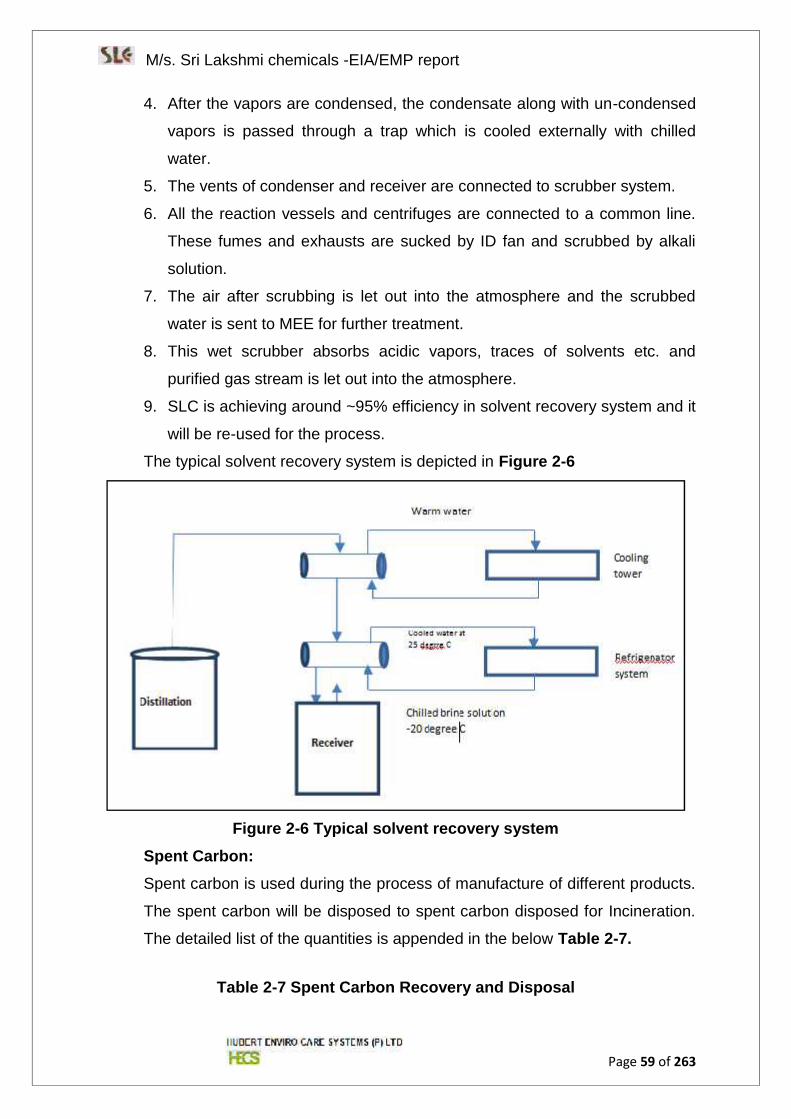
M/s. Sri Lakshmi chemicals -EIA/EMP report
Page 59 of 263
4. After the vapors are condensed, the condensate along with un-condensed
vapors is passed through a trap which is cooled externally with chilled
water.
5. The vents of condenser and receiver are connected to scrubber system.
6. All the reaction vessels and centrifuges are connected to a common line.
These fumes and exhausts are sucked by ID fan and scrubbed by alkali
solution.
7. The air after scrubbing is let out into the atmosphere and the scrubbed
water is sent to MEE for further treatment.
8. This wet scrubber absorbs acidic vapors, traces of solvents etc. and
purified gas stream is let out into the atmosphere.
9. SLC is achieving around ~95% efficiency in solvent recovery system and it
will be re-used for the process.
The typical solvent recovery system is depicted in Figure 2-6
Figure 2-6 Typical solvent recovery systemSpent Carbon:Spent carbon is used during the process of manufacture of different products.
The spent carbon will be disposed to spent carbon disposed for Incineration.
The detailed list of the quantities is appended in the below Table 2-7.
Table 2-7 Spent Carbon Recovery and Disposal
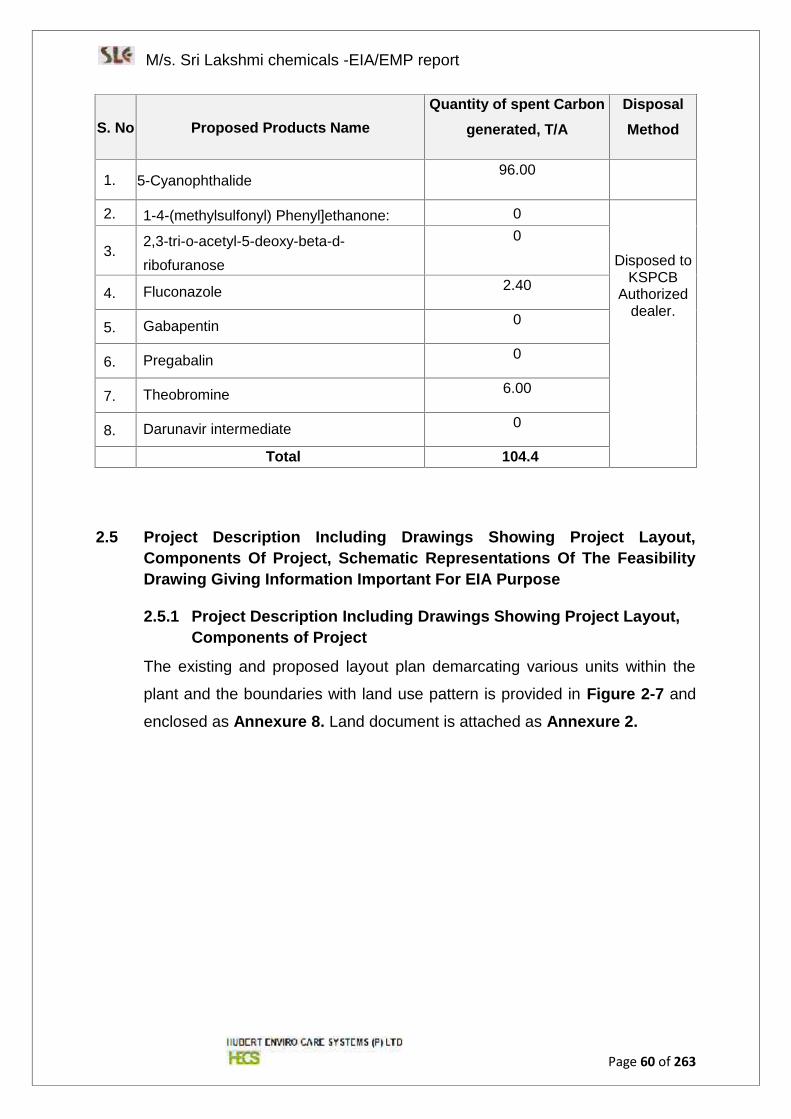
M/s. Sri Lakshmi chemicals -EIA/EMP report
Page 60 of 263
S. No Proposed Products NameQuantity of spent Carbon
generated, T/ADisposalMethod
1. 5-Cyanophthalide96.00
2. 1-4-(methylsulfonyl) Phenyl]ethanone: 0
Disposed toKSPCB
Authorizeddealer.
3.2,3-tri-o-acetyl-5-deoxy-beta-d-ribofuranose
0
4. Fluconazole 2.40
5. Gabapentin 0
6. Pregabalin 0
7. Theobromine 6.00
8. Darunavir intermediate 0
Total 104.4
2.5 Project Description Including Drawings Showing Project Layout,Components Of Project, Schematic Representations Of The FeasibilityDrawing Giving Information Important For EIA Purpose
2.5.1 Project Description Including Drawings Showing Project Layout,Components of Project
The existing and proposed layout plan demarcating various units within the
plant and the boundaries with land use pattern is provided in Figure 2-7 and
enclosed as Annexure 8. Land document is attached as Annexure 2.
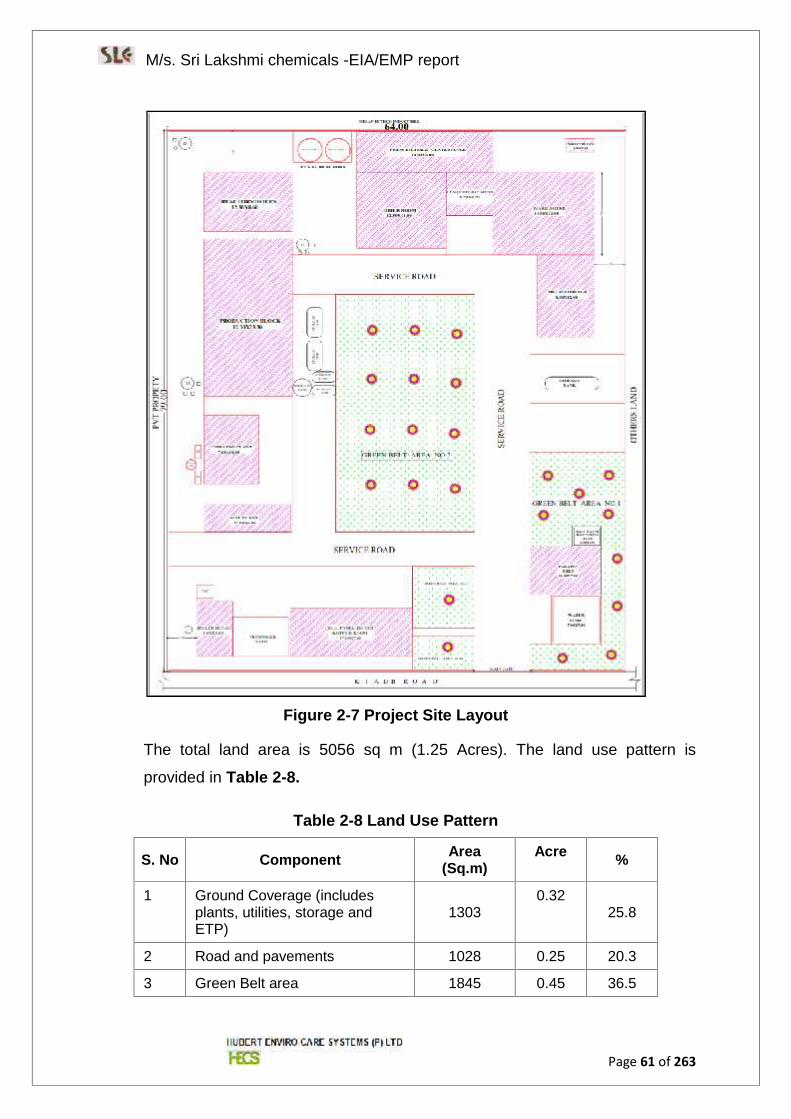
M/s. Sri Lakshmi chemicals -EIA/EMP report
Page 61 of 263
Figure 2-7 Project Site Layout
The total land area is 5056 sq m (1.25 Acres). The land use pattern is
provided in Table 2-8.
Table 2-8 Land Use Pattern
S. No Component Area(Sq.m)
Acre %
1 Ground Coverage (includesplants, utilities, storage andETP)
13030.32
25.8
2 Road and pavements 1028 0.25 20.3
3 Green Belt area 1845 0.45 36.5
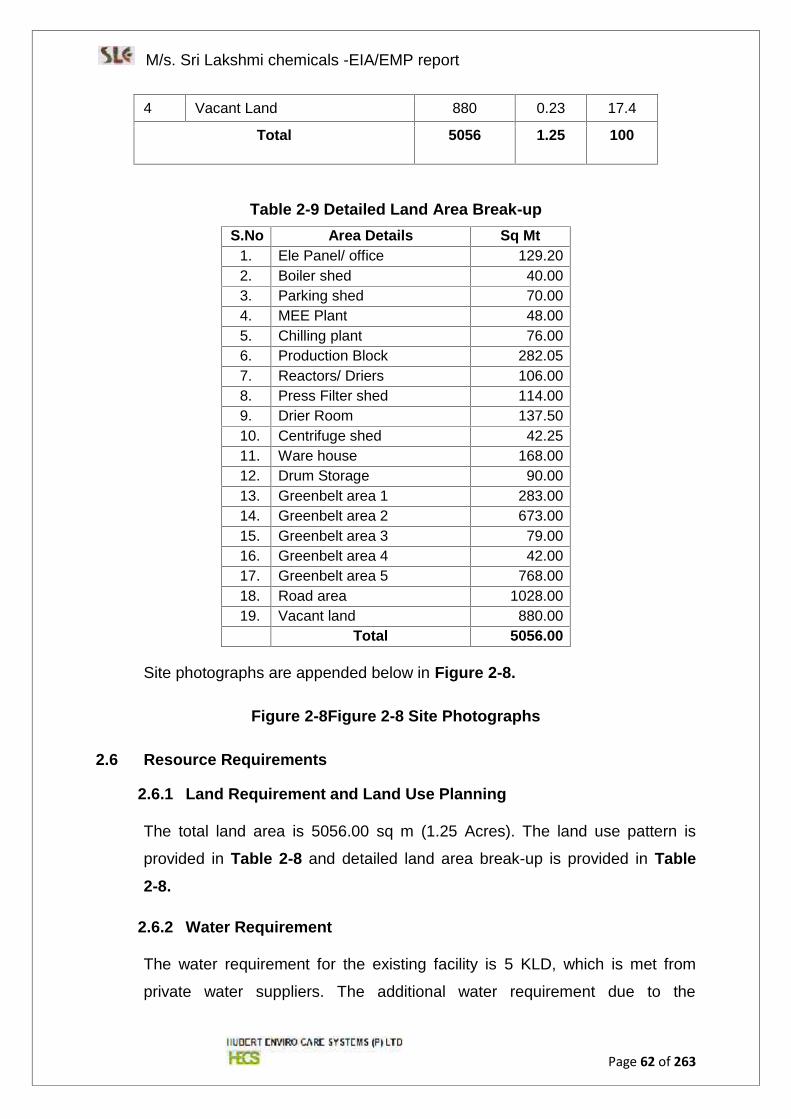
M/s. Sri Lakshmi chemicals -EIA/EMP report
Page 62 of 263
4 Vacant Land 880 0.23 17.4
Total 5056 1.25 100
Table 2-9 Detailed Land Area Break-upS.No Area Details Sq Mt
1. Ele Panel/ office 129.202. Boiler shed 40.003. Parking shed 70.004. MEE Plant 48.005. Chilling plant 76.006. Production Block 282.057. Reactors/ Driers 106.008. Press Filter shed 114.009. Drier Room 137.5010. Centrifuge shed 42.2511. Ware house 168.0012. Drum Storage 90.0013. Greenbelt area 1 283.0014. Greenbelt area 2 673.0015. Greenbelt area 3 79.0016. Greenbelt area 4 42.0017. Greenbelt area 5 768.0018. Road area 1028.0019. Vacant land 880.00
Total 5056.00
Site photographs are appended below in Figure 2-8.
Figure 2-8Figure 2-8 Site Photographs
2.6 Resource Requirements
2.6.1 Land Requirement and Land Use Planning
The total land area is 5056.00 sq m (1.25 Acres). The land use pattern is
provided in Table 2-8 and detailed land area break-up is provided in Table2-8.
2.6.2 Water Requirement
The water requirement for the existing facility is 5 KLD, which is met from
private water suppliers. The additional water requirement due to the
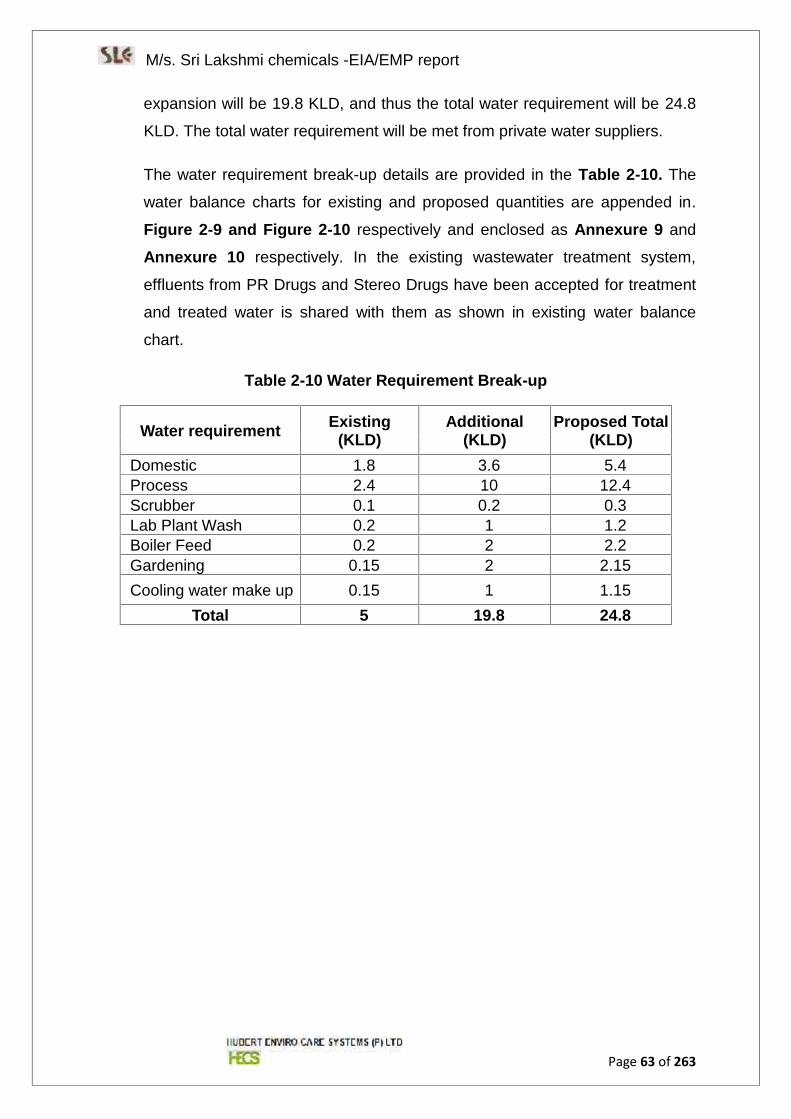
M/s. Sri Lakshmi chemicals -EIA/EMP report
Page 63 of 263
expansion will be 19.8 KLD, and thus the total water requirement will be 24.8
KLD. The total water requirement will be met from private water suppliers.
The water requirement break-up details are provided in the Table 2-10. The
water balance charts for existing and proposed quantities are appended in.
Figure 2-9 and Figure 2-10 respectively and enclosed as Annexure 9 and
Annexure 10 respectively. In the existing wastewater treatment system,
effluents from PR Drugs and Stereo Drugs have been accepted for treatment
and treated water is shared with them as shown in existing water balance
chart.
Table 2-10 Water Requirement Break-up
Water requirement Existing(KLD)
Additional(KLD)
Proposed Total(KLD)
Domestic 1.8 3.6 5.4Process 2.4 10 12.4Scrubber 0.1 0.2 0.3Lab Plant Wash 0.2 1 1.2Boiler Feed 0.2 2 2.2Gardening 0.15 2 2.15Cooling water make up 0.15 1 1.15
Total 5 19.8 24.8
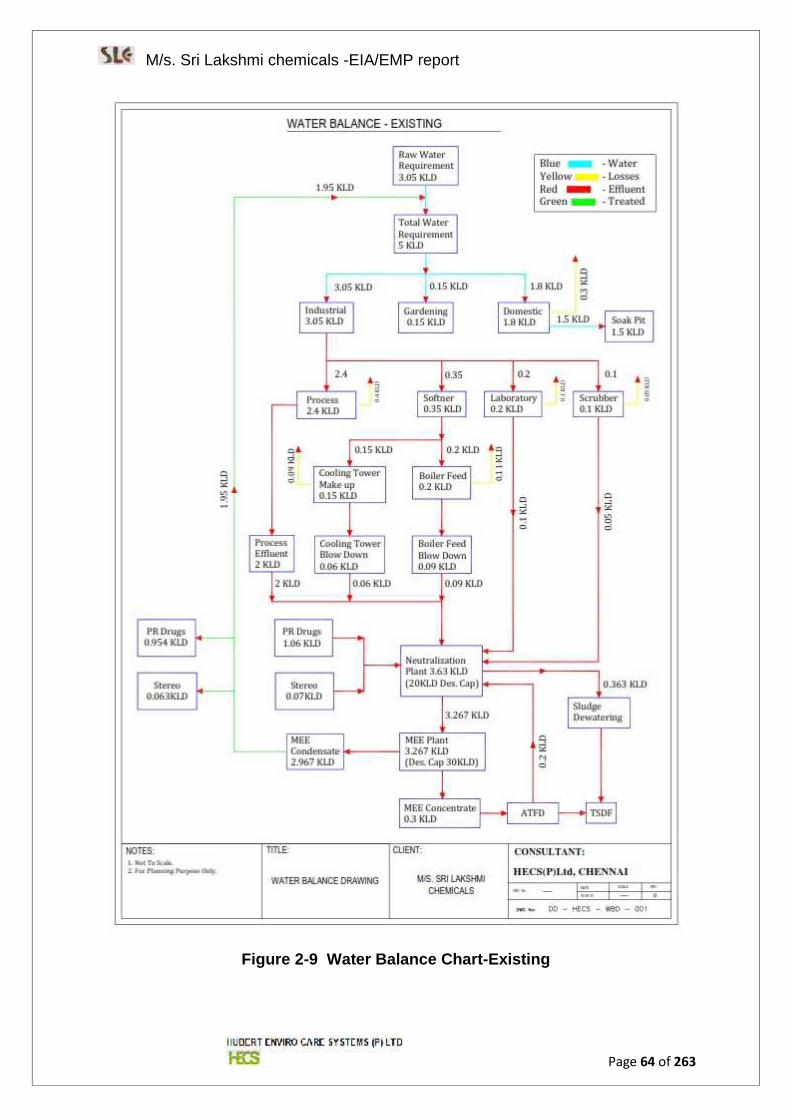
M/s. Sri Lakshmi chemicals -EIA/EMP report
Page 64 of 263
Figure 2-9 Water Balance Chart-Existing
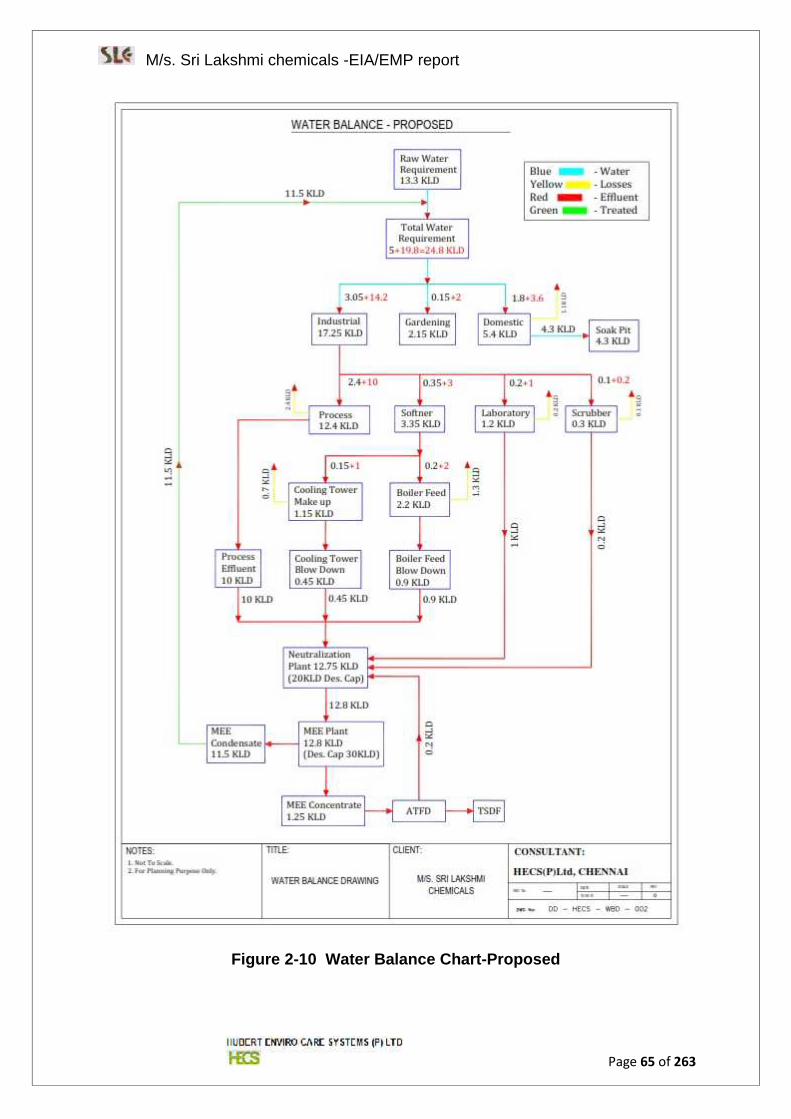
M/s. Sri Lakshmi chemicals -EIA/EMP report
Page 65 of 263
Figure 2-10 Water Balance Chart-Proposed
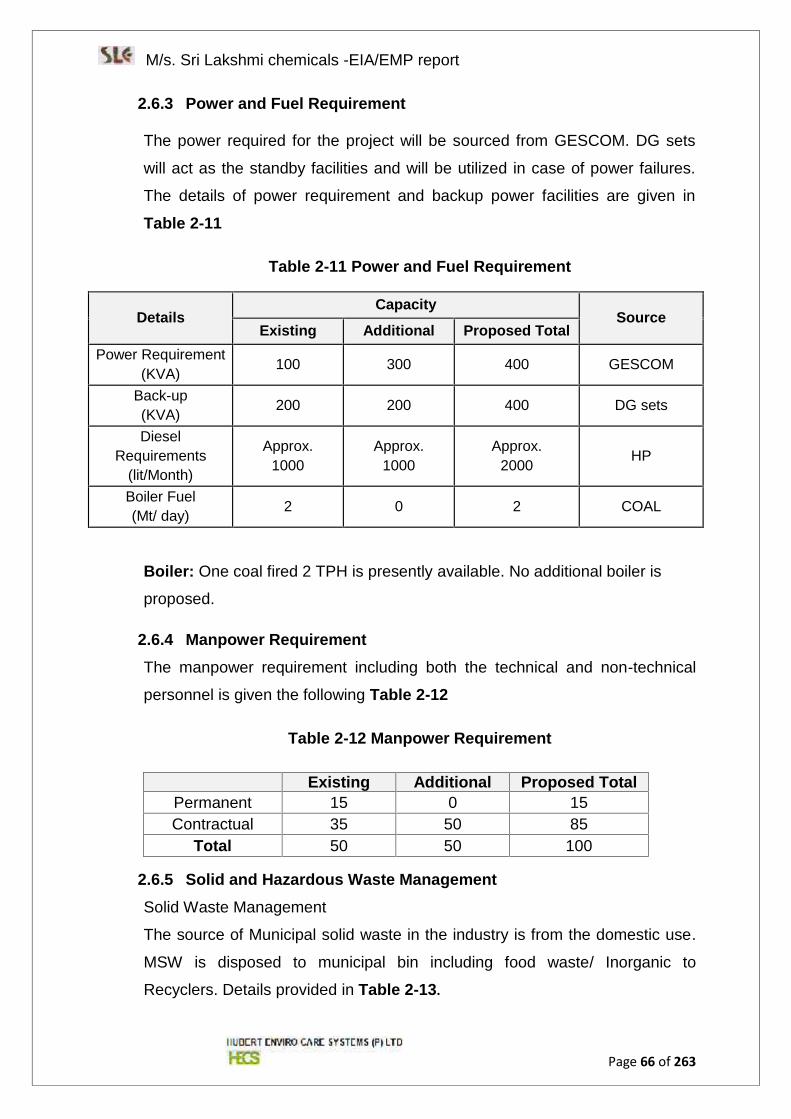
M/s. Sri Lakshmi chemicals -EIA/EMP report
Page 66 of 263
2.6.3 Power and Fuel Requirement
The power required for the project will be sourced from GESCOM. DG sets
will act as the standby facilities and will be utilized in case of power failures.
The details of power requirement and backup power facilities are given in
Table 2-11
Table 2-11 Power and Fuel Requirement
DetailsCapacity
SourceExisting Additional Proposed Total
Power Requirement(KVA) 100 300 400 GESCOM
Back-up(KVA) 200 200 400 DG sets
DieselRequirements
(lit/Month)
Approx.1000
Approx.1000
Approx.2000 HP
Boiler Fuel(Mt/ day) 2 0 2 COAL
Boiler: One coal fired 2 TPH is presently available. No additional boiler is
proposed.
2.6.4 Manpower RequirementThe manpower requirement including both the technical and non-technical
personnel is given the following Table 2-12
Table 2-12 Manpower Requirement
Existing Additional Proposed TotalPermanent 15 0 15Contractual 35 50 85
Total 50 50 100
2.6.5 Solid and Hazardous Waste ManagementSolid Waste Management
The source of Municipal solid waste in the industry is from the domestic use.
MSW is disposed to municipal bin including food waste/ Inorganic to
Recyclers. Details provided in Table 2-13.

M/s. Sri Lakshmi chemicals -EIA/EMP report
Page 67 of 263
Table 2-13 Municipal Solid Waste During Operation Phase
Type Kg/day Disposal method
Organic 24Municipal bin including food
waste
Inorganic 26 KSPCB authorized recyclers
Total 50As per CPCB guidelines: MSW per capita/day =0.5 kg
Total Municipal Solid Waste Generated during the operation phase is 50
Kg/day for total 100 employees of existing and additional manpower due to
proposed expansion.
Hazardous waste ManagementThe various hazardous waste are generated from the process are spent
catalyst, spent solvent, process residues, chemical sludge from the effluent
treatment plant and discarded bags from the raw materials section. These are
stored in a separate hazardous waste storage area and are disposed off by
sending it to the authorized dealers within a stipulated period of time.
Hazardous waste materials are properly disposed as per the Hazardous
Wastes (Management, Handling and Transboundary Movement) Rules 1989
and subsequent amendment in 2016. KSPCB authorization for HWM is
enclosed as Annexure 11. Agreement has been made with KSPCB
approved TSDF is enclosed as Annexure 12. The type of hazardous waste
and the quantity generated are detailed in the Table 2-14.
Table 2-14 Hazardous Waste Management
WasteCategory
Hazardous wasteGenerated
QuantityMethod ofhandlingExisting Additional Proposed
Total
5.1 Used Oil(Liters/Annum) 200 400 600
Collected in leakproof containers anddisposed only toKSPCB registeredauthorized re-processor
28.1 Organic Residue(MTPA) 0 10 10 Collected in
carboys and stored
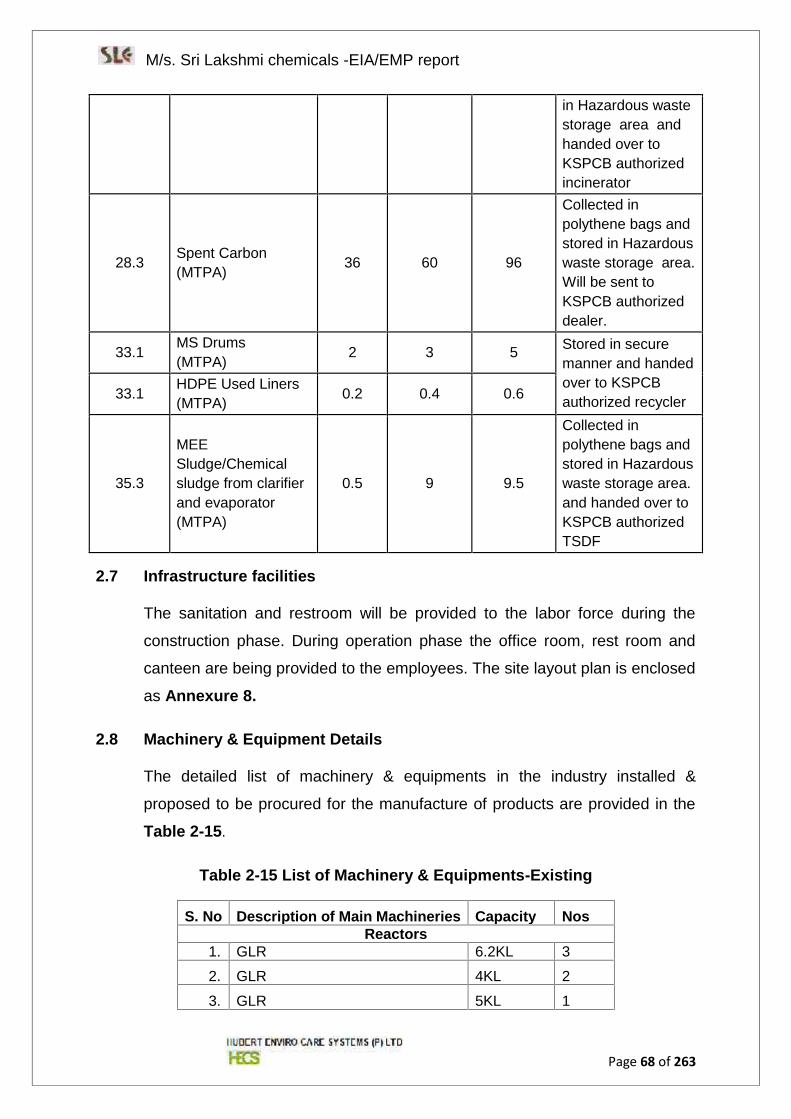
M/s. Sri Lakshmi chemicals -EIA/EMP report
Page 68 of 263
in Hazardous wastestorage area andhanded over toKSPCB authorizedincinerator
28.3 Spent Carbon(MTPA) 36 60 96
Collected inpolythene bags andstored in Hazardouswaste storage area.Will be sent toKSPCB authorizeddealer.
33.1 MS Drums(MTPA) 2 3 5 Stored in secure
manner and handedover to KSPCBauthorized recycler33.1 HDPE Used Liners
(MTPA) 0.2 0.4 0.6
35.3
MEESludge/Chemicalsludge from clarifierand evaporator(MTPA)
0.5 9 9.5
Collected inpolythene bags andstored in Hazardouswaste storage area.and handed over toKSPCB authorizedTSDF
2.7 Infrastructure facilities
The sanitation and restroom will be provided to the labor force during the
construction phase. During operation phase the office room, rest room and
canteen are being provided to the employees. The site layout plan is enclosed
as Annexure 8.
2.8 Machinery & Equipment Details
The detailed list of machinery & equipments in the industry installed &
proposed to be procured for the manufacture of products are provided in the
Table 2-15.
Table 2-15 List of Machinery & Equipments-Existing
S. No Description of Main Machineries Capacity NosReactors
1. GLR 6.2KL 3
2. GLR 4KL 2
3. GLR 5KL 1
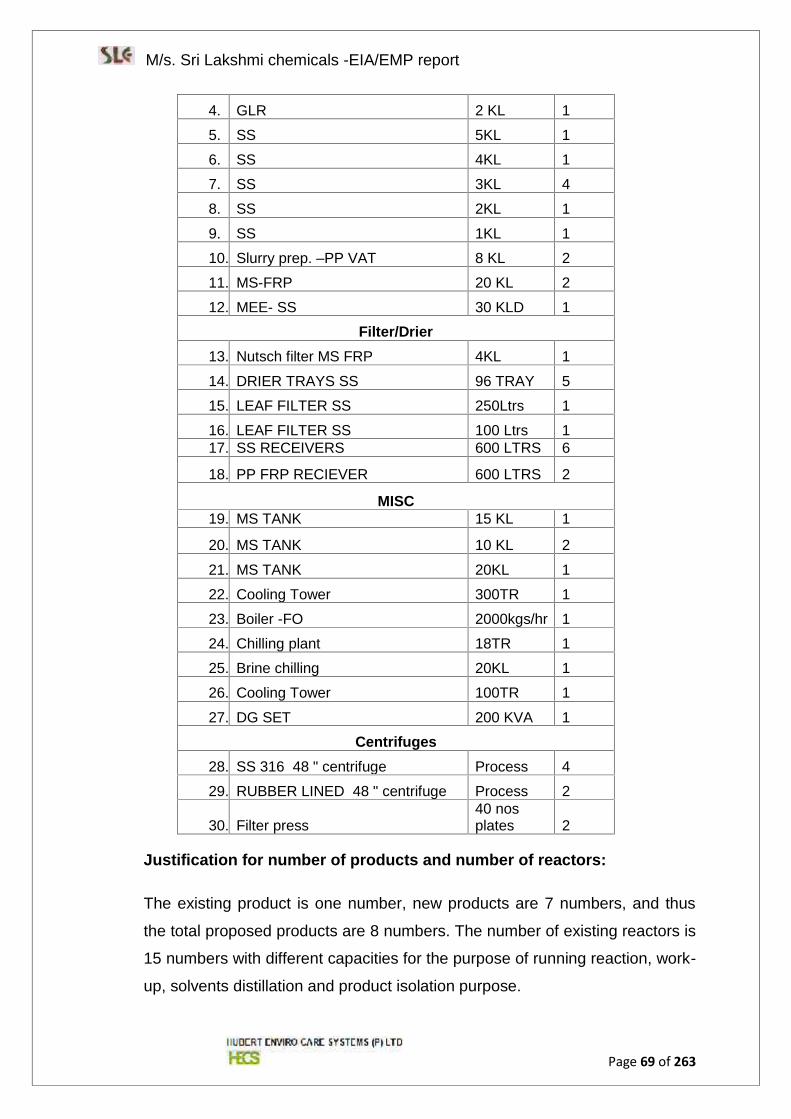
M/s. Sri Lakshmi chemicals -EIA/EMP report
Page 69 of 263
4. GLR 2 KL 1
5. SS 5KL 1
6. SS 4KL 1
7. SS 3KL 4
8. SS 2KL 1
9. SS 1KL 1
10. Slurry prep. –PP VAT 8 KL 2
11. MS-FRP 20 KL 2
12. MEE- SS 30 KLD 1
Filter/Drier13. Nutsch filter MS FRP 4KL 1
14. DRIER TRAYS SS 96 TRAY 5
15. LEAF FILTER SS 250Ltrs 1
16. LEAF FILTER SS 100 Ltrs 117. SS RECEIVERS 600 LTRS 6
18. PP FRP RECIEVER 600 LTRS 2
MISC19. MS TANK 15 KL 1
20. MS TANK 10 KL 2
21. MS TANK 20KL 1
22. Cooling Tower 300TR 1
23. Boiler -FO 2000kgs/hr 1
24. Chilling plant 18TR 1
25. Brine chilling 20KL 1
26. Cooling Tower 100TR 1
27. DG SET 200 KVA 1
Centrifuges28. SS 316 48 " centrifuge Process 4
29. RUBBER LINED 48 " centrifuge Process 2
30. Filter press40 nosplates 2
Justification for number of products and number of reactors:
The existing product is one number, new products are 7 numbers, and thus
the total proposed products are 8 numbers. The number of existing reactors is
15 numbers with different capacities for the purpose of running reaction, work-
up, solvents distillation and product isolation purpose.
M/s. Sri Lakshmi chemicals -EIA/EMP report
Page 70 of 263
The existing product is only one numbers, existing number of reactors are 15,
the number of reactors may seem more with respect to number of existing
products, not all the reactors were in use. All these reactors were present
when factory was acquired by SLC management from Sree Chemicals in
2010.
No additional Machineries & Equipments are required for the proposed
expansion.
2.9 Schematic Representations of the Feasibility Drawing which GiveInformation Important for EIA Purpose
A schematic representation of the overall feasibility and environmental
assessment process is shown in Figure 2-11. The EIA process is composed of
the following stages:
Study of project information
Screening & Scoping
Environmental Pre-Feasibility study & application for approval of TOR
Collection of detailed project management plan/report
Baseline Data collection
Impact identification, Prediction & Evaluation
Mitigation measures & delineation of EMP
Risk Assessment and Safety & Disaster Management plan
Review & finalization of EIA Report based on the TOR requirements.
Submission of EIA report for implementation of mitigation measures &
EMP as well as necessary clearances from relevant Authority.
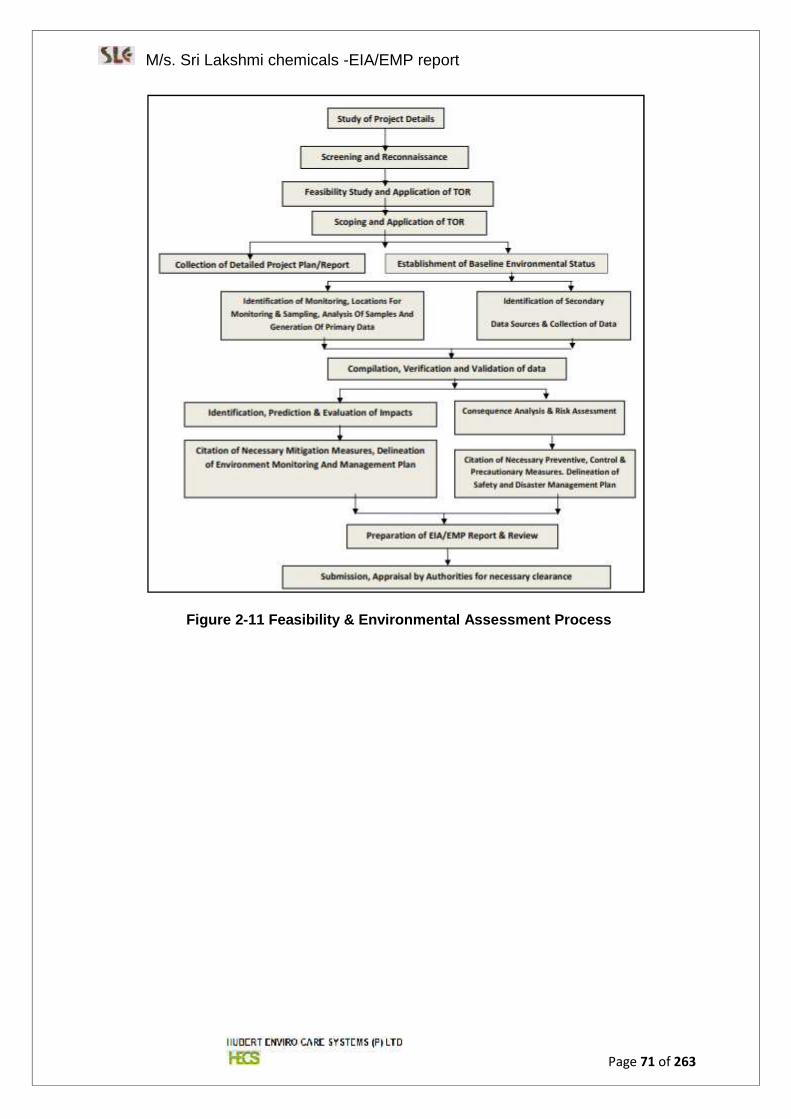
M/s. Sri Lakshmi chemicals -EIA/EMP report
Page 71 of 263
Figure 2-11 Feasibility & Environmental Assessment Process
M/s. Sri Lakshmi chemicals -EIA/EMP report
Page 72 of 263
Chapter 3Description of Environment
M/s. Sri Lakshmi chemicals -EIA/EMP report
Page 73 of 263
3 Description of Environment
3.1 Preamble
This chapter depicts the existing environmental conditions in and around the
10Km radius from the proposed project with an area of 1.24 Acres (0.505 Ha)
located at Plot No.73 D Kolhar Industrial Area, KIADB, Nizampur Village Bidar
Taluk Bidar District & Karnataka State.The primary baseline data monitored
covered three (3) months i.e., from December 2016 - February 2017, and
secondary data was collected from Government and Semi-Government
organisations. The primary baseline data has been generated by M/s. Hubert
Enviro Care Systems (P) Ltd, Chennai, and a MoEF&CC approved & NABL
certified Environmental Testing Laboratory for the following Terrestrial
environmental components.
Terrestrial Environmental Components
Meteorology
Temperature
Relative Humidity
Rainfall
Wind Speed & Direction
Solar Radiation
Ambient Air Quality
Particulate matter <10 micron size (PM10)
Particulate matter <2.5 micron size (PM2.5)
Sulphur Dioxide (SO2)
Nitrogen Dioxide (NO2)
Carbon Monoxide (CO)
Lead (Pb)
Ozone (O3)
Benzene (C6H6)
Benzo (a) pyrene (C20H12)
Arsenic (As)
Nickel (Ni)
Ammonia (NH3)
M/s. Sri Lakshmi chemicals -EIA/EMP report
Page 74 of 263
Hydrogen Fluoride (HF)
Hydrogen Bromide (HBr)
Hydrogen Sulfide (H2S)
Hydrogen Chloride (HCl)
Ambient Noise Levels
Day equivalent noise levels
Night equivalent noise levels
Inland Water Quality
Groundwater Quality
Surface Water Quality
Soil QualityFlora & Fauna (Ecology)
3.2 Study Area
A 10Km radial distance with the proposed project site as the epicentre has
been identified as the General study area / Project Influence Area (PIA) for
assessing the baseline environmental status. The core study area is the
project area and its immediate surroundings to the tune of 1.0 Km radius from
the boundary. The project area is the land where the project is being
developed. Further the Project Impact/Influence Area (PIA) is 10Km from the
boundary of the core area covering Bidar Taluk Bidar District of Karnataka
State. The map showing the study area/PIA for the EIA study is given as
Figure 3-29.
3.3 Description of the Study Area
As described in Chapter 1 Introduction M/s. Sri Lakshmi Chemicals Ltd, it is
situated in KIADB. Kolhar, Bidar district, Karnataka. An overall idea of the
study area with reference to the physical conditions are presented for better
understanding in the following sections before proceeding into the section on
the prevailing environmental conditions of the study area.
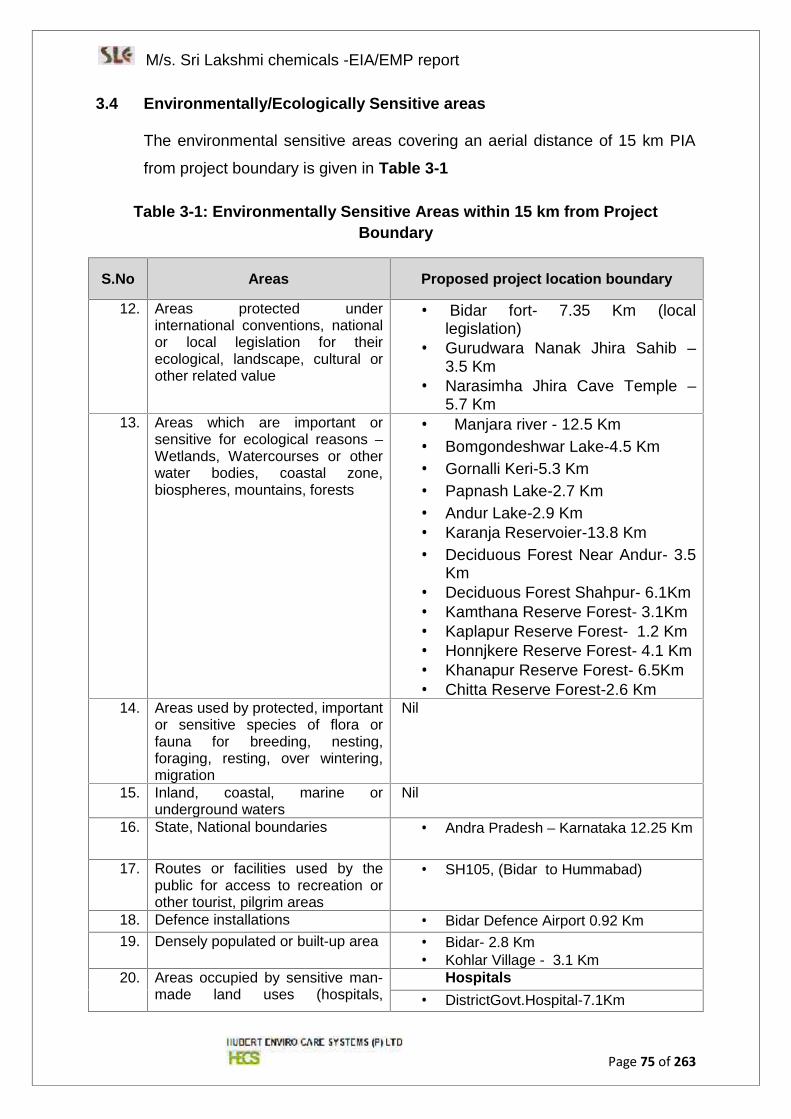
M/s. Sri Lakshmi chemicals -EIA/EMP report
Page 75 of 263
3.4 Environmentally/Ecologically Sensitive areas
The environmental sensitive areas covering an aerial distance of 15 km PIA
from project boundary is given in Table 3-1
Table 3-1: Environmentally Sensitive Areas within 15 km from ProjectBoundary
S.No Areas Proposed project location boundary
12. Areas protected underinternational conventions, nationalor local legislation for theirecological, landscape, cultural orother related value
Bidar fort- 7.35 Km (locallegislation)
Gurudwara Nanak Jhira Sahib –3.5 Km
Narasimha Jhira Cave Temple –5.7 Km
13. Areas which are important orsensitive for ecological reasons –Wetlands, Watercourses or otherwater bodies, coastal zone,biospheres, mountains, forests
Manjara river - 12.5 Km Bomgondeshwar Lake-4.5 Km Gornalli Keri-5.3 Km Papnash Lake-2.7 Km Andur Lake-2.9 Km Karanja Reservoier-13.8 Km Deciduous Forest Near Andur- 3.5
Km Deciduous Forest Shahpur- 6.1Km Kamthana Reserve Forest- 3.1Km Kaplapur Reserve Forest- 1.2 Km Honnjkere Reserve Forest- 4.1 Km Khanapur Reserve Forest- 6.5Km Chitta Reserve Forest-2.6 Km
14. Areas used by protected, importantor sensitive species of flora orfauna for breeding, nesting,foraging, resting, over wintering,migration
Nil
15. Inland, coastal, marine orunderground waters
Nil
16. State, National boundaries Andra Pradesh – Karnataka 12.25 Km
17. Routes or facilities used by thepublic for access to recreation orother tourist, pilgrim areas
SH105, (Bidar to Hummabad)
18. Defence installations Bidar Defence Airport 0.92 Km19. Densely populated or built-up area Bidar- 2.8 Km
Kohlar Village - 3.1 Km20. Areas occupied by sensitive man-
made land uses (hospitals,Hospitals
DistrictGovt.Hospital-7.1Km
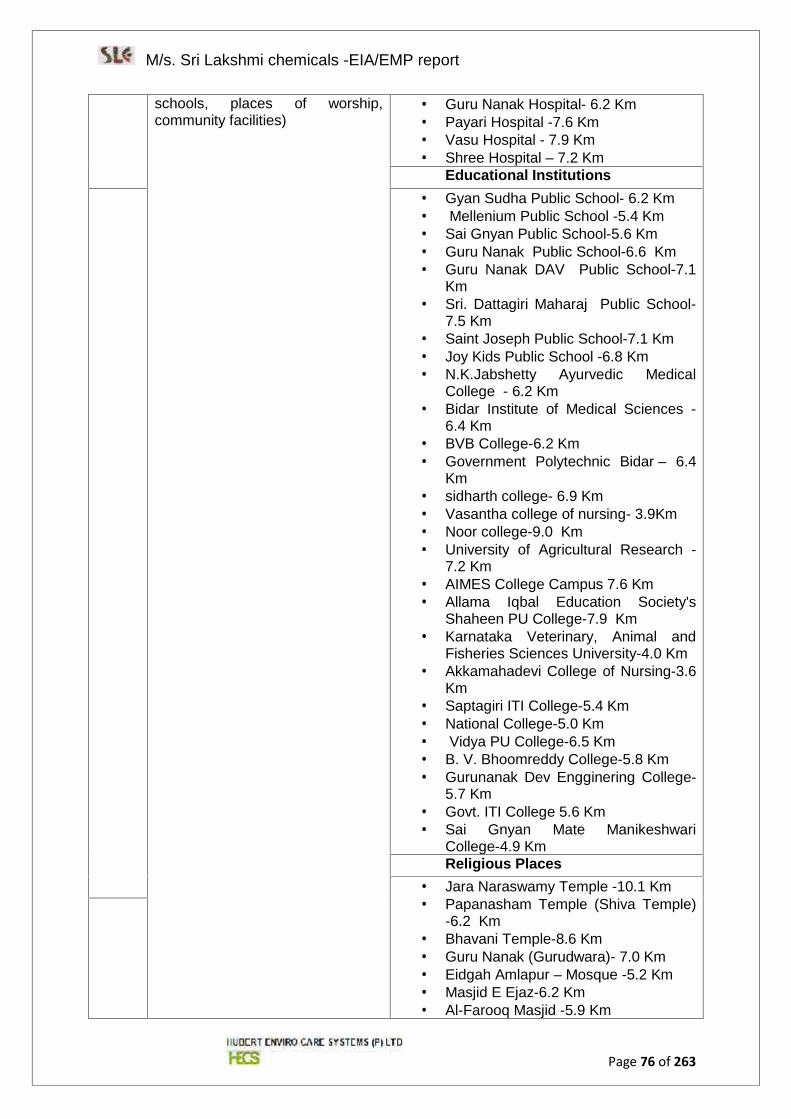
M/s. Sri Lakshmi chemicals -EIA/EMP report
Page 76 of 263
schools, places of worship,community facilities)
Guru Nanak Hospital- 6.2 Km Payari Hospital -7.6 Km Vasu Hospital - 7.9 Km Shree Hospital – 7.2 Km
Educational Institutions Gyan Sudha Public School- 6.2 Km Mellenium Public School -5.4 Km Sai Gnyan Public School-5.6 Km Guru Nanak Public School-6.6 Km Guru Nanak DAV Public School-7.1
Km Sri. Dattagiri Maharaj Public School-
7.5 Km Saint Joseph Public School-7.1 Km Joy Kids Public School -6.8 Km N.K.Jabshetty Ayurvedic Medical
College - 6.2 Km Bidar Institute of Medical Sciences -
6.4 Km BVB College-6.2 Km Government Polytechnic Bidar – 6.4
Km sidharth college- 6.9 Km Vasantha college of nursing- 3.9Km Noor college-9.0 Km University of Agricultural Research -
7.2 Km AIMES College Campus 7.6 Km Allama Iqbal Education Society's
Shaheen PU College-7.9 Km Karnataka Veterinary, Animal and
Fisheries Sciences University-4.0 Km Akkamahadevi College of Nursing-3.6
Km Saptagiri ITI College-5.4 Km National College-5.0 Km Vidya PU College-6.5 Km B. V. Bhoomreddy College-5.8 Km Gurunanak Dev Engginering College-
5.7 Km Govt. ITI College 5.6 Km Sai Gnyan Mate Manikeshwari
College-4.9 KmReligious Places
Jara Naraswamy Temple -10.1 Km Papanasham Temple (Shiva Temple)
-6.2 Km Bhavani Temple-8.6 Km Guru Nanak (Gurudwara)- 7.0 Km Eidgah Amlapur – Mosque -5.2 Km Masjid E Ejaz-6.2 Km Al-Farooq Masjid -5.9 Km
M/s. Sri Lakshmi chemicals -EIA/EMP report
Page 77 of 263
Jamia masjid amlapur Mosque -6.5Km
21. Areas containing important, highquality or scarce resources,(groundwater resources, surfaceresources, forestry, agriculture,fisheries, tourism, minerals)
Manjara river - 12.5 Km Karanja Reservoier-13.8 Km Bidar fort- 7.3 Km
22. Areas susceptible to naturalhazard which could cause theproject to present environmentalproblems, (earthquakes,subsidence, landslides, erosion orextreme or adverse climaticconditions)
This area is generally plain no prone to anynatural disasters. The area under study fallsin Zone-II, according to the Indian StandardSeismic Zoning Map. Suitable seismiccoefficients in horizontal and verticaldirections respectively, have to be adoptedwhile designing the structures.
3.5 Physical Conditions
wherever possible references to the conditions prevailing in the study area in
particular are also provided. The physical conditions are discussed as under:
District profile
Drainage, land use, geology, Physiography
Natural resources
Climatic conditions, seismic zone characteristics and natural hazards
3.6 PIA District Profile
The Bidar district is the northern most part of the Karnataka state with
geographical area of 5460 sq.km. It lies between 17°35’ and 18°29’ North
latitude and 76°41’ to 77°39’ East longitude. It is bounded by Nizamabad and
Medak districts of Andhra Pradesh state on the eastern side, Latur and
Osmanabad districts of Maharastra state on the western side, Nanded district
of Maharastra state on the northern side and Gulbarga district on southern
side.
The entire district forms a part of the Deccan Plateau and is made up mostly
of solidified lava. The northern part of the district is characterized by expanses
of level and treeless surface punctuated here and there by flat and undulating
hillocks, black soils and basaltic rocks. The southern half of the district is a
high plateau about 715 m above mean sea level and are well drained. The
average elevation of the district is between 580 to 610 m above mean sea
M/s. Sri Lakshmi chemicals -EIA/EMP report
Page 78 of 263
level. Alluvial deposit is normally found along the banks of the Manjra river
and its main tributaries.
3.6.1 Climatic Conditions
The district experiences semi-arid climate with extreme summer. The dust
storms and severe heat waves are common in the district between April and
May. The temperature begins to rise towards the end of February till May,
which is the hottest month of the year. Coldest months are December and
January. The temperature varies in the district between 20 ºC and 42 ºC.
The year in the district may be divided into summer season from March to
May, southwest monsoon season from June to September, post-monsoon
season from October to November and winter season from December to
February.
Generally, the monsoon sets in the month of June and reaches its climax in
the month of September. The rainfall generally is spread over 39 to 53 days.
Nearly 75% to 80% of the annual rainfall is during the period of Southwest
monsoon. A few showers are also received during the North- East Monsoon,
generally in the month of December.
Bidar district receives an average rainfall of 827 mm. The normal annual
rainfall over thedistrict ranges from 735 mm to 860 mm.
Source:Ground Water Information Booklet,Bidar District, Karnataka,2008
3.7 Natural Resources of Bidar PIA District
3.7.1 Flora & Fauna
Flora: The weeds and climber found in the forest of the district are not of
much economic value. Some different type of grass which grows in the area
are not of nutrient type for the cattle and therefore useful for thatching roof of
huts and houses. The minor forest produce consist tupra (beedi) leaves,
rousa grass, seetaphal, honey, wax, tamarind and mango fruits. The most
common shrubs are Bikke (Gardenia gummifera, Linn) and Gotti or Challe
(Ziziphus xylopyrus willd). They are mostly used for fencing the fields. The
M/s. Sri Lakshmi chemicals -EIA/EMP report
Page 79 of 263
following are the tree species found in the district: Acacia arabica (Jali or
babul), Tamarindus indica, linn (Hunase), Butea frondosa, Palash,
Anogeissus latifolia, wall (Dindiga), and Hardwickia binata.
Fauna: The scantiness of forest accounts for almost a total absence of
denizens of the forest that can be said to belong to the big game variety.
There is no tiger. Occasionally, leopard may be seen. Wolves are found in the
craggy portion of the undulating forest. As many as 30 varieties of bats are
found in the district. Heads of the small deer appears during winter. The more
important among the domesticated animals are the buffalo, the cow, the
sheep, the goat and the camel.Flora and fauna of PIA are discussed in
section 3.11.
3.7.2 Forest Resources
Forest areas of Bidar division are classified as Reserve forests, Protected
forests and Unclassified forests.Bidar Forest division is having 43,592 ha. of
Forest area including
Reserve Forests, Protected forests and Unclassified forests. This area is
about 8.5% of total geographical extent of the district.
3.7.3 Irrigation
In the district the irrigation takes place from surface water and ground water.
The surface water irrigation is through canals, tanks and from medium and
minor irrigation projects. Major irrigation dam has been constructed across the
Karanja river and medium irrigation dam constructed across Chukkenala and
Mullamari rivers. From ground water the irrigation is through dug wells, dug
cum bore wells and bore wells..
3.7.4 Agricultural Resources
The main occupation of the people in the district is agriculture and related
operations.
There are two main seasons in which agricultural practices are carried out.
The two seasons are Kharif and Rabi. Khariff season commences from June
and the crops are harvested in September. Rabi season commences from
M/s. Sri Lakshmi chemicals -EIA/EMP report
Page 80 of 263
September and crops harvested in Febuaray. Themain food crops are Jowar,
Paddy, Wheat, Bajra, Maize and pulses. Groundnut, sugarcane and cotton
are the cash crops.
Cereals- Paddy,Jowar,Bajra,Maize
Pulse- Wheat Black gram, Bengalgram,Green Gram and RedGram\Horticulture-Banana,Mango,Papaya,Grapes,Potato TomatoBrijal,
Cash Crop-Sugarcane,Cotton
Oil Seeds-Groundnut,Sunflower,Soyabean, Saflower,Sesame
Livestock- Livestock rearing plays an important role in the rural economy of
the district. It supplements family income from agriculture and also provides
employment. It is more vital wherever agricultural is predominant in the
society. Farmers are dependent on animal husbandry activities to utilize
agricultural by-products and crop residues to convert them into animal
products with good returns. Bullocks are more prized among the cattle since
they provide the necessary draught power required for agriculture.
3.7.5 Mineral Resources
The minerals found in the area are Bauxite, Kaolin and Red ochre. A deposit
of highly siliceous bauxite clay has been located about three kilometers south
of Basavakalyan. Similar deposits are noticed near Alwal and Kamthana
Villages of Bidar taluk. A large deposit of Kaolin islocated near Kamthana
village. Red ochre deposits are found near Sirsi and Aurad Village. Geology &
Minerals map of Karnataka is given in

M/s. Sri Lakshmi chemicals -EIA/EMP report
Page 81 of 263
Figure 3-1.
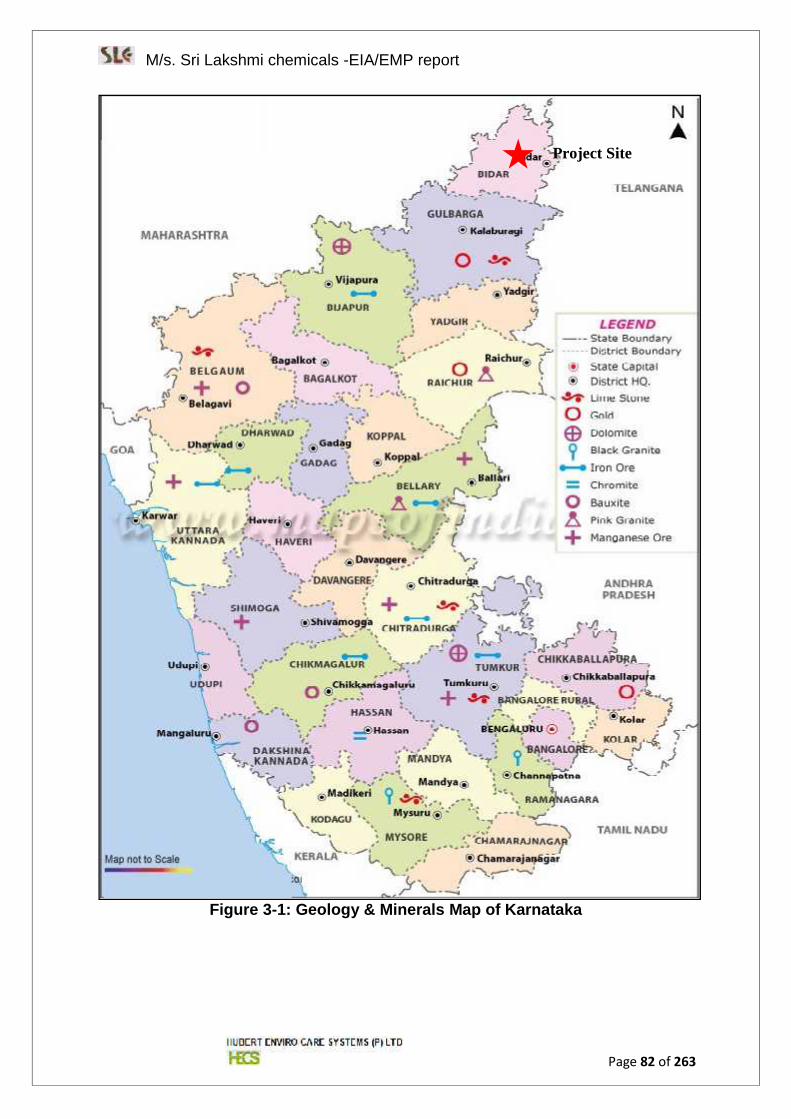
M/s. Sri Lakshmi chemicals -EIA/EMP report
Page 82 of 263
Figure 3-1: Geology & Minerals Map of Karnataka
Project Site
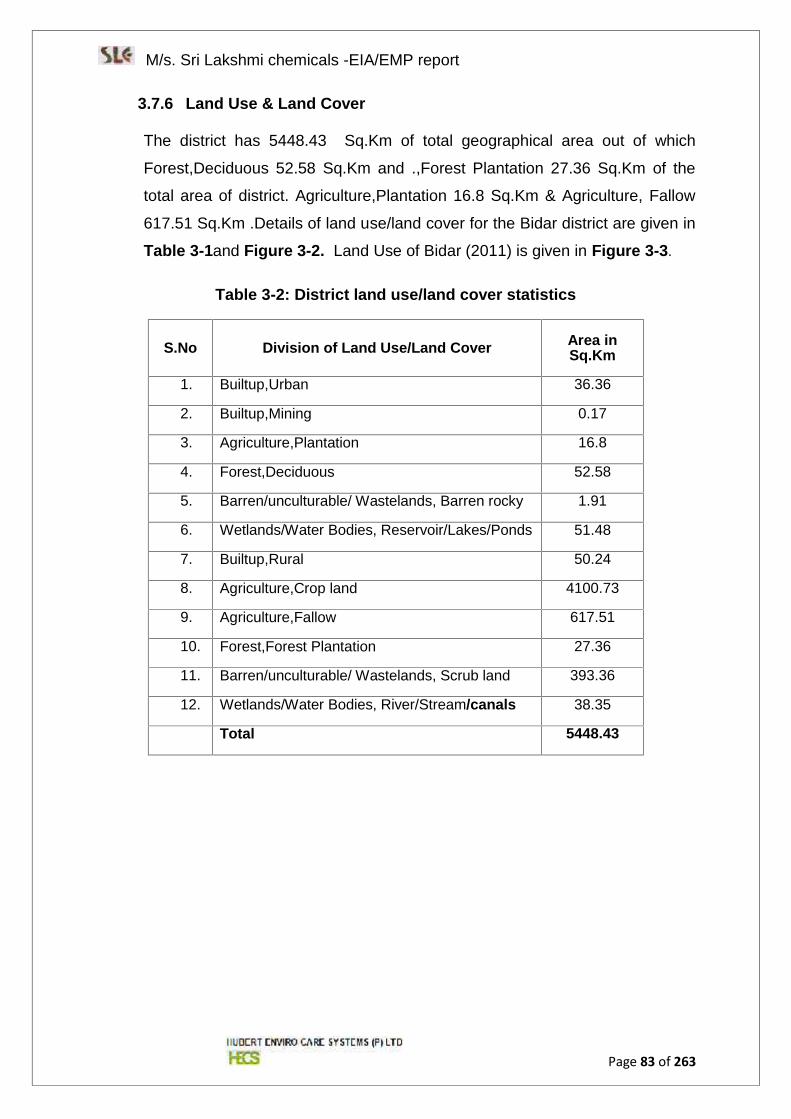
M/s. Sri Lakshmi chemicals -EIA/EMP report
Page 83 of 263
3.7.6 Land Use & Land Cover
The district has 5448.43 Sq.Km of total geographical area out of which
Forest,Deciduous 52.58 Sq.Km and .,Forest Plantation 27.36 Sq.Km of the
total area of district. Agriculture,Plantation 16.8 Sq.Km & Agriculture, Fallow
617.51 Sq.Km .Details of land use/land cover for the Bidar district are given in
Table 3-1and Figure 3-2. Land Use of Bidar (2011) is given in Figure 3-3.
Table 3-2: District land use/land cover statistics
S.No Division of Land Use/Land Cover Area inSq.Km
1. Builtup,Urban 36.36
2. Builtup,Mining 0.17
3. Agriculture,Plantation 16.8
4. Forest,Deciduous 52.58
5. Barren/unculturable/ Wastelands, Barren rocky 1.91
6. Wetlands/Water Bodies, Reservoir/Lakes/Ponds 51.48
7. Builtup,Rural 50.24
8. Agriculture,Crop land 4100.73
9. Agriculture,Fallow 617.51
10. Forest,Forest Plantation 27.36
11. Barren/unculturable/ Wastelands, Scrub land 393.36
12. Wetlands/Water Bodies, River/Stream/canals 38.35
Total 5448.43
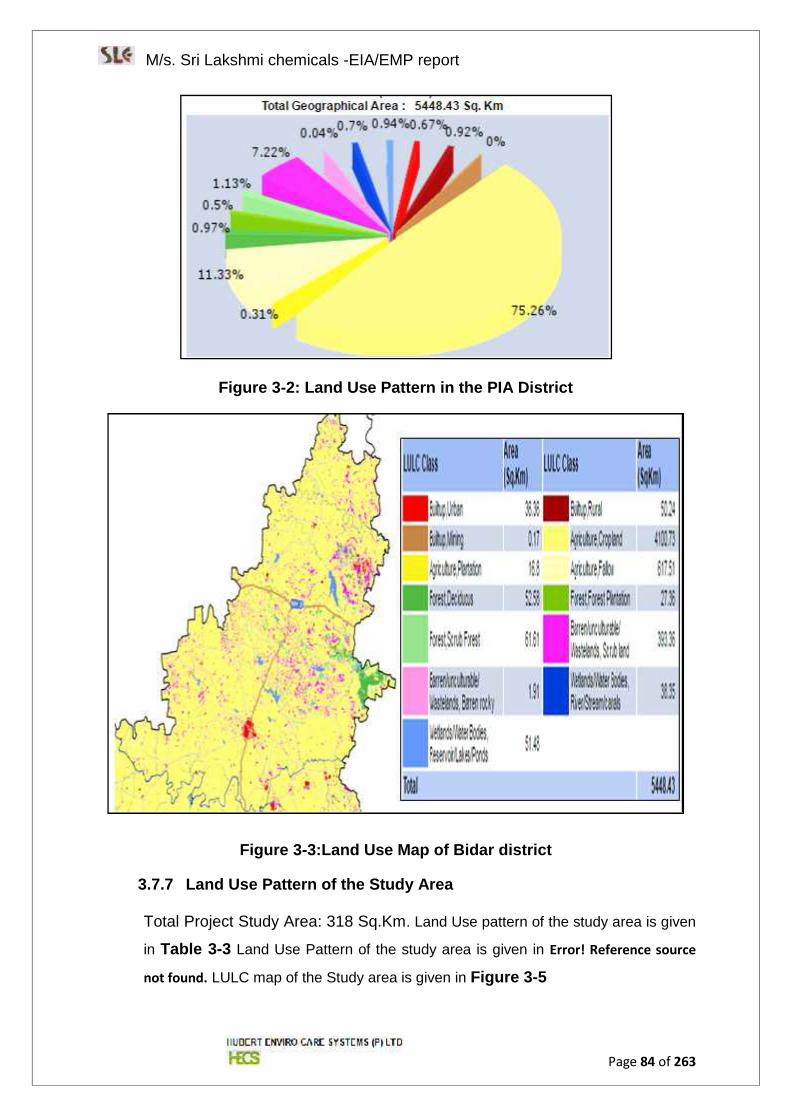
M/s. Sri Lakshmi chemicals -EIA/EMP report
Page 84 of 263
Figure 3-2: Land Use Pattern in the PIA District
Figure 3-3:Land Use Map of Bidar district
3.7.7 Land Use Pattern of the Study Area
Total Project Study Area: 318 Sq.Km. Land Use pattern of the study area is given
in Table 3-3 Land Use Pattern of the study area is given in Error! Reference source
not found. LULC map of the Study area is given in Figure 3-5
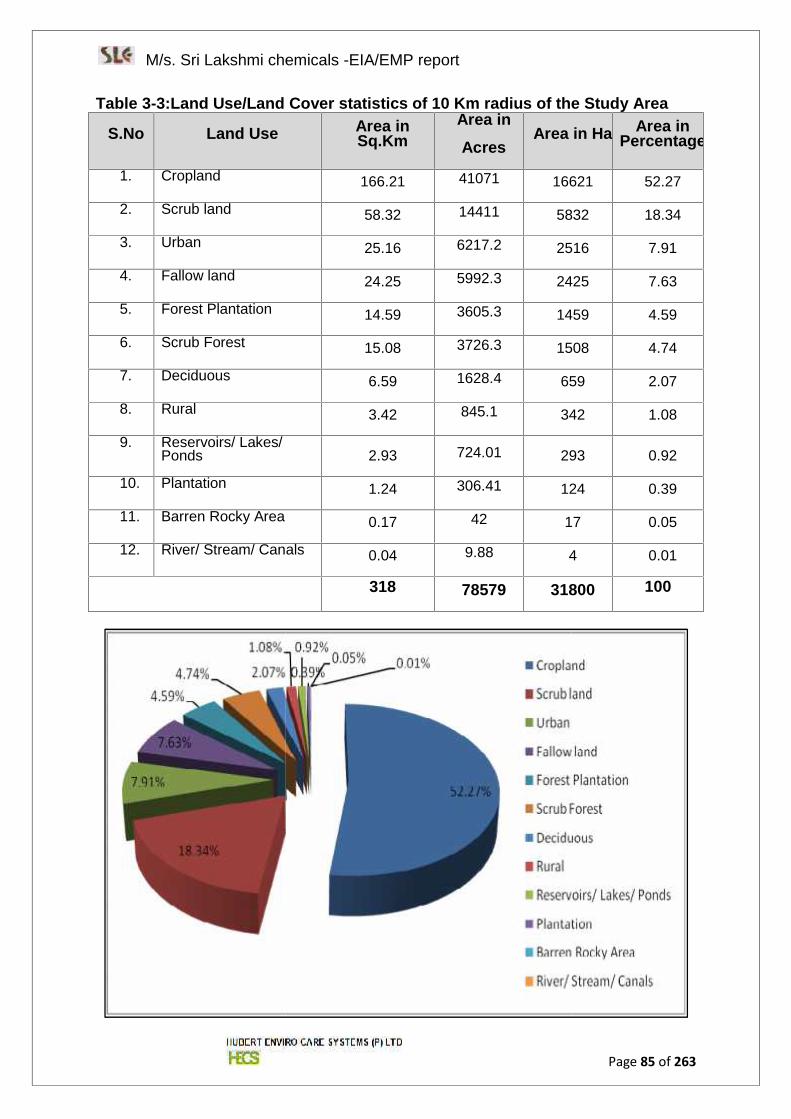
M/s. Sri Lakshmi chemicals -EIA/EMP report
Page 85 of 263
Table 3-3:Land Use/Land Cover statistics of 10 Km radius of the Study Area
S.No Land Use Area inSq.Km
Area in
AcresArea in Ha Area in
Percentage
1. Cropland 166.21 41071 16621 52.27
2. Scrub land 58.32 14411 5832 18.34
3. Urban 25.16 6217.2 2516 7.91
4. Fallow land 24.25 5992.3 2425 7.63
5. Forest Plantation 14.59 3605.3 1459 4.59
6. Scrub Forest 15.08 3726.3 1508 4.74
7. Deciduous 6.59 1628.4 659 2.07
8. Rural 3.42 845.1 342 1.08
9. Reservoirs/ Lakes/Ponds 2.93 724.01 293 0.92
10. Plantation 1.24 306.41 124 0.39
11. Barren Rocky Area 0.17 42 17 0.05
12. River/ Stream/ Canals 0.04 9.88 4 0.01
318 78579 31800 100
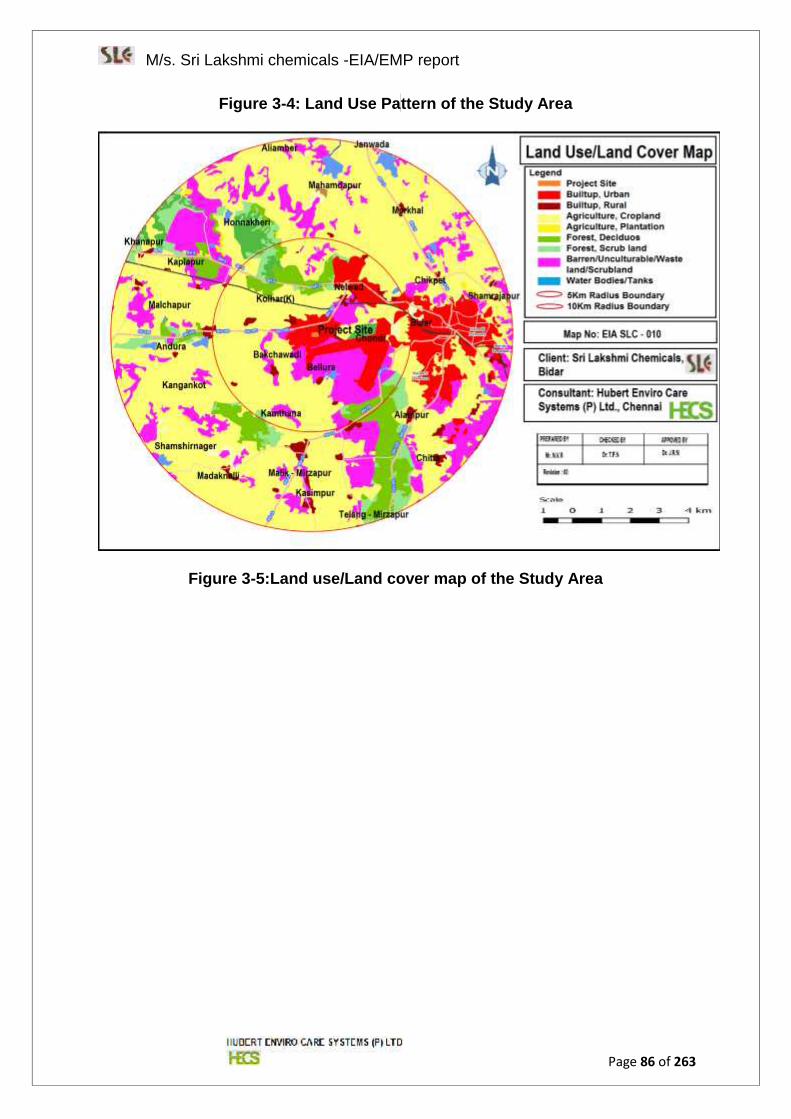
M/s. Sri Lakshmi chemicals -EIA/EMP report
Page 86 of 263
Figure 3-4: Land Use Pattern of the Study Area
Figure 3-5:Land use/Land cover map of the Study Area
M/s. Sri Lakshmi chemicals -EIA/EMP report
Page 87 of 263
3.7.8 Topography
The entire district forms a part of the Deccan Plateau and is made up nmostly
of solidified lava. The northern part of the district is characterized by expanses
of level and treeless surface punctuated here and there by flat and undulating
hillocks, black soils and basaltic rocks. The southern half of the district is a
high plateau about 715 m above mean sea level and are well drained. The
average elevation of the district is between 580 to 610 m above mean sea
level. Alluvial deposit is normally found along the banks of the Manjra river
and its main tributaries. The project site fall under an elevation of 600 m
above the mean sea level. and the study area contours vary from 560 m to
680m above MSL. From the project site the high elevations were observed
towards South South East direction and the lowest contours wereobserved in
North and NE direction. While the remaining areas showed variations
withrespect to contours.Physiography map of Karnataka state is given in
Figure 3-7 Contour map/Physiography map of project site is given in Figure3-7. Topo map of the study area is given in Figure 3-8
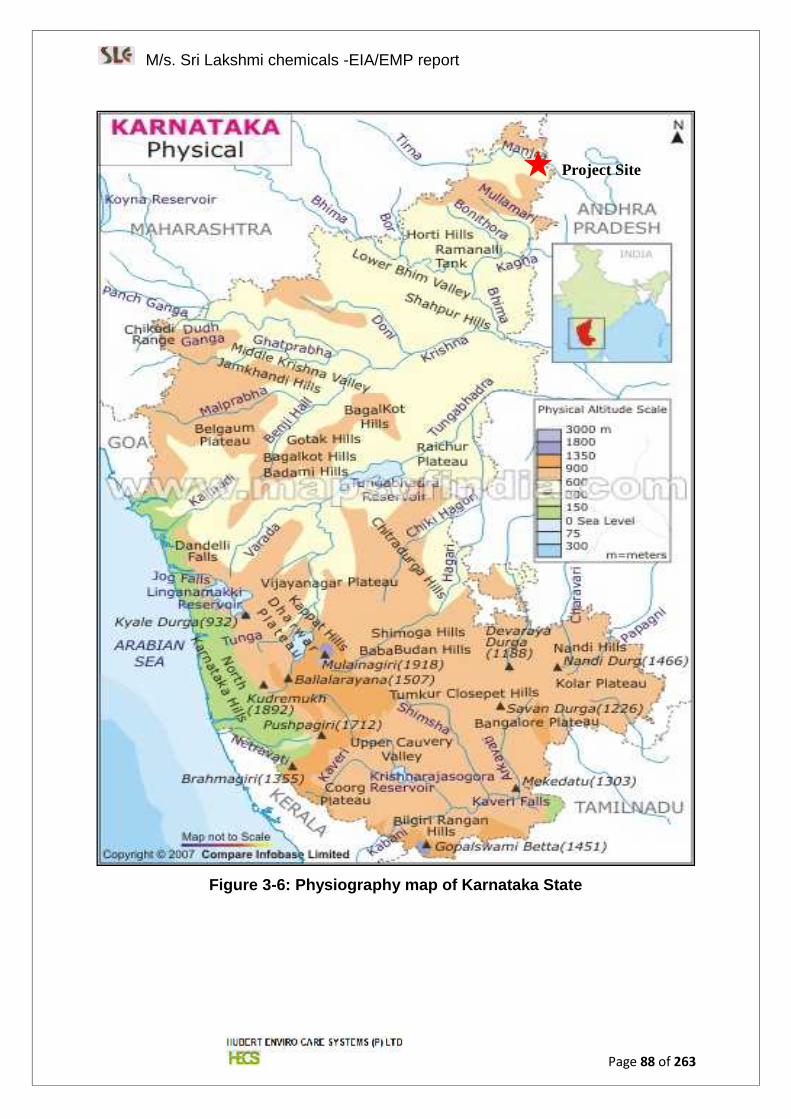
M/s. Sri Lakshmi chemicals -EIA/EMP report
Page 88 of 263
Figure 3-6: Physiography map of Karnataka State
Project Site
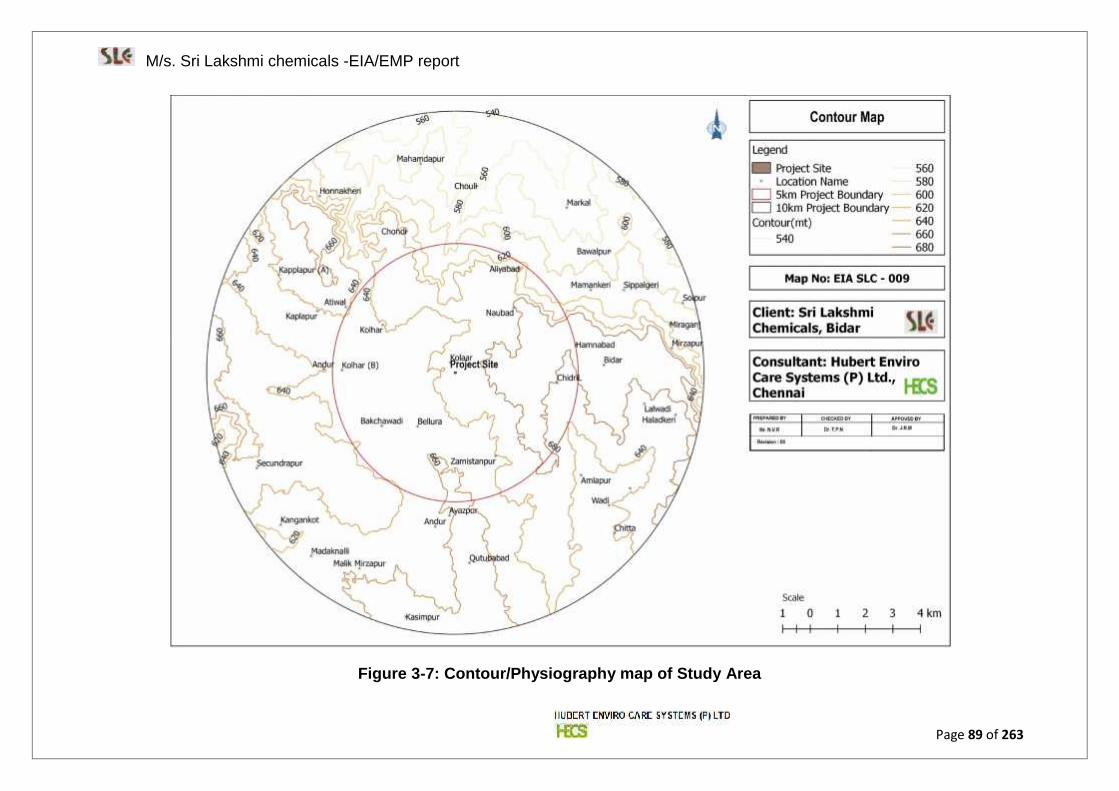
M/s. Sri Lakshmi chemicals -EIA/EMP report
Page 89 of 263
Figure 3-7: Contour/Physiography map of Study Area
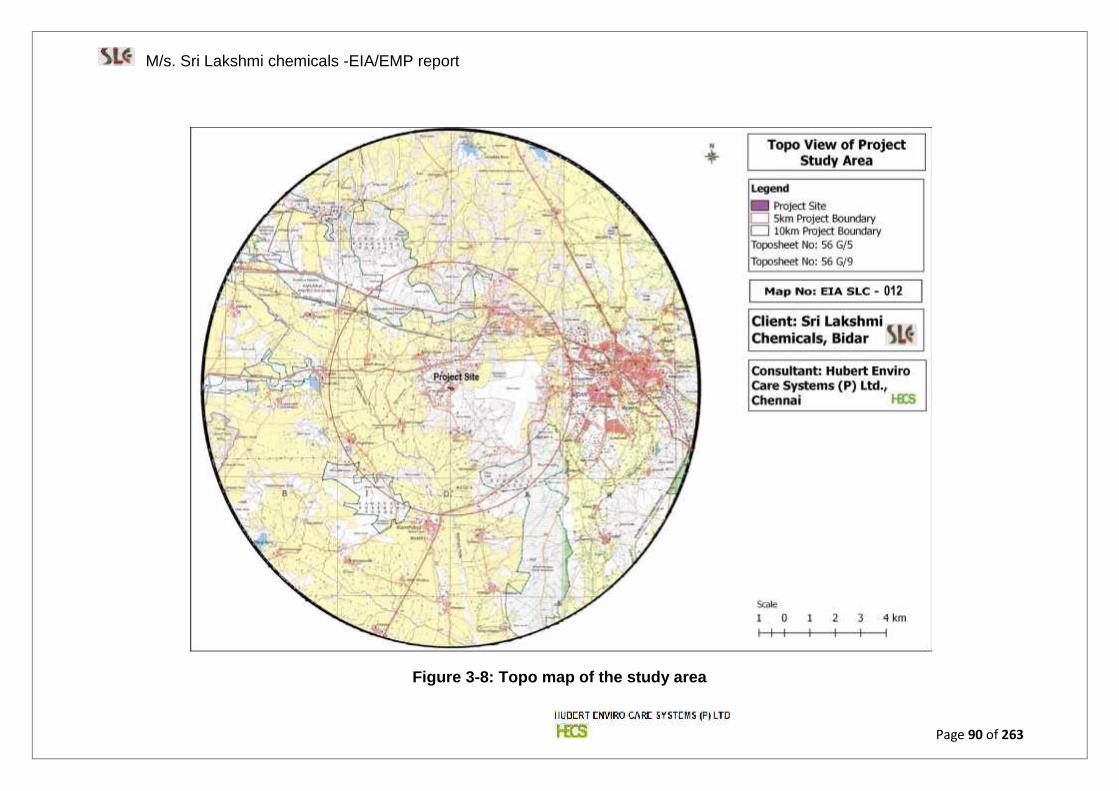
M/s. Sri Lakshmi chemicals -EIA/EMP report
Page 90 of 263
Figure 3-8: Topo map of the study area
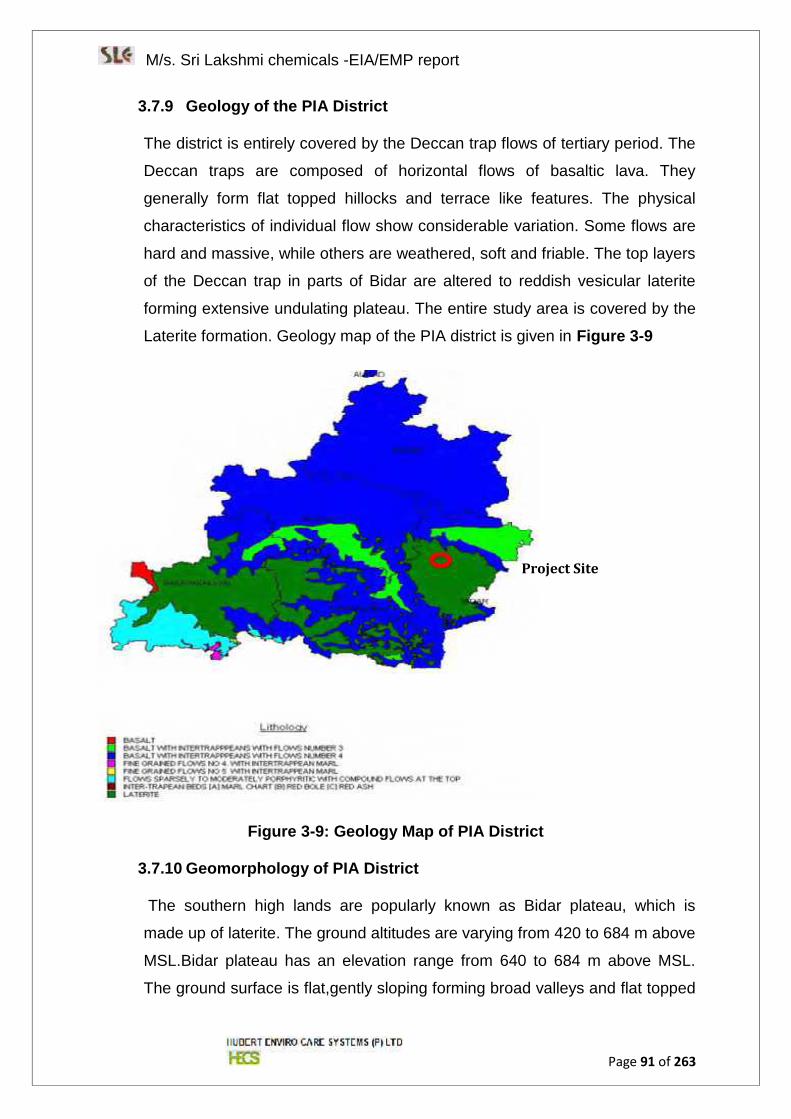
M/s. Sri Lakshmi chemicals -EIA/EMP report
Page 91 of 263
3.7.9 Geology of the PIA District
The district is entirely covered by the Deccan trap flows of tertiary period. The
Deccan traps are composed of horizontal flows of basaltic lava. They
generally form flat topped hillocks and terrace like features. The physical
characteristics of individual flow show considerable variation. Some flows are
hard and massive, while others are weathered, soft and friable. The top layers
of the Deccan trap in parts of Bidar are altered to reddish vesicular laterite
forming extensive undulating plateau. The entire study area is covered by the
Laterite formation. Geology map of the PIA district is given in Figure 3-9
Figure 3-9: Geology Map of PIA District
3.7.10 Geomorphology of PIA District
The southern high lands are popularly known as Bidar plateau, which is
made up of laterite. The ground altitudes are varying from 420 to 684 m above
MSL.Bidar plateau has an elevation range from 640 to 684 m above MSL.
The ground surface is flat,gently sloping forming broad valleys and flat topped
Project Site
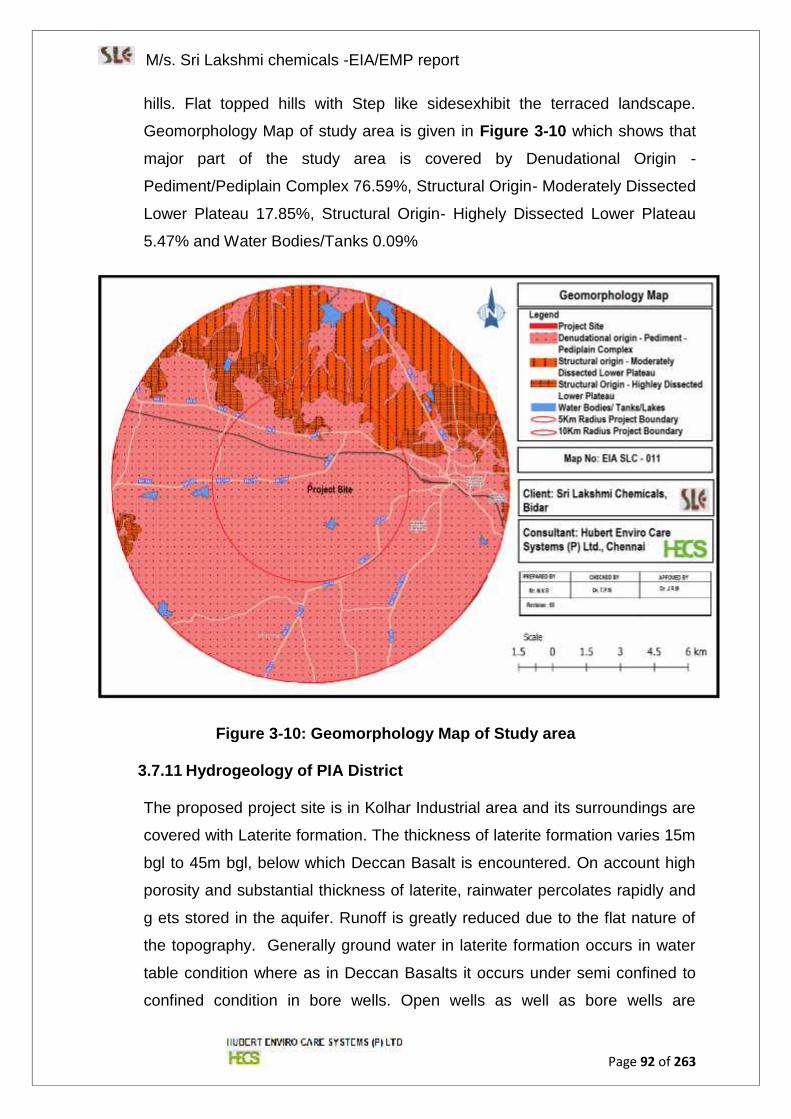
M/s. Sri Lakshmi chemicals -EIA/EMP report
Page 92 of 263
hills. Flat topped hills with Step like sidesexhibit the terraced landscape.
Geomorphology Map of study area is given in Figure 3-10 which shows that
major part of the study area is covered by Denudational Origin -
Pediment/Pediplain Complex 76.59%, Structural Origin- Moderately Dissected
Lower Plateau 17.85%, Structural Origin- Highely Dissected Lower Plateau
5.47% and Water Bodies/Tanks 0.09%
Figure 3-10: Geomorphology Map of Study area
3.7.11 Hydrogeology of PIA District
The proposed project site is in Kolhar Industrial area and its surroundings are
covered with Laterite formation. The thickness of laterite formation varies 15m
bgl to 45m bgl, below which Deccan Basalt is encountered. On account high
porosity and substantial thickness of laterite, rainwater percolates rapidly and
g ets stored in the aquifer. Runoff is greatly reduced due to the flat nature of
the topography. Generally ground water in laterite formation occurs in water
table condition where as in Deccan Basalts it occurs under semi confined to
confined condition in bore wells. Open wells as well as bore wells are

M/s. Sri Lakshmi chemicals -EIA/EMP report
Page 93 of 263
common in the area. The depth of the dug wells range from 7.0 to 12.0 m bgl
depending upon the topographic location. Depth to water level ranges from 8
to 10 m bgl during pre-monsoon period and i t ranges 3 to 7 m bgl during the
post monsoon period. It is reported that in lateritic formation during the rainy
season ground water levels rise up to 1 to 2m bgl and in some cases the wells
overflow. However during summer season shallow open w ells in laterite
formation go dry. Deep open wells sustain pumping for 4 to 6 hour s in a
day during rainy season & winter season, one to three hours during summer
season. The laterite aquifer around Bidar town is having more thickness(60m
bgl) and al so potential in ground water point of view relatively.
Specific Capacity of open wells varies widely from 3 to 260 liters per minute
per meter of draw down. Generally drinking water supply and agriculture bore
wells having depth range of 100 to 150 m bgl are common in the area. Casing
of the bore well is lowered up t o the depth of 30 to 40 m bgl covering entire
thickness of laterite to avoid collapse of bore well. Success of the bore wells
depends upon the number of basalt flows encountered in the bore well and
the thickness of the vesicular basalt in each flow. Yield of bore wells range
from meager to 5.0 liters/second. Hydrogeology of Bidar District is given in
Figure 3-11. The geology of Project Site covers of alluvium and having an
yield upto 5 litres per second.
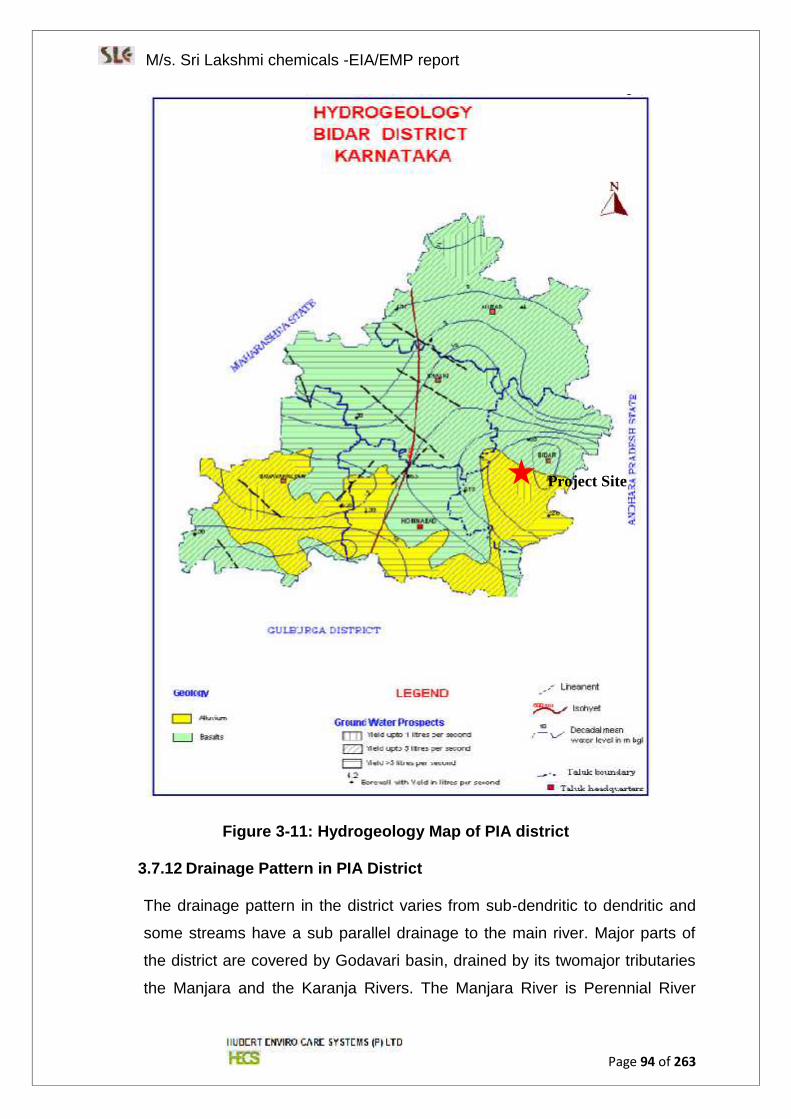
M/s. Sri Lakshmi chemicals -EIA/EMP report
Page 94 of 263
Figure 3-11: Hydrogeology Map of PIA district
3.7.12 Drainage Pattern in PIA District
The drainage pattern in the district varies from sub-dendritic to dendritic and
some streams have a sub parallel drainage to the main river. Major parts of
the district are covered by Godavari basin, drained by its twomajor tributaries
the Manjara and the Karanja Rivers. The Manjara River is Perennial River
Project Site
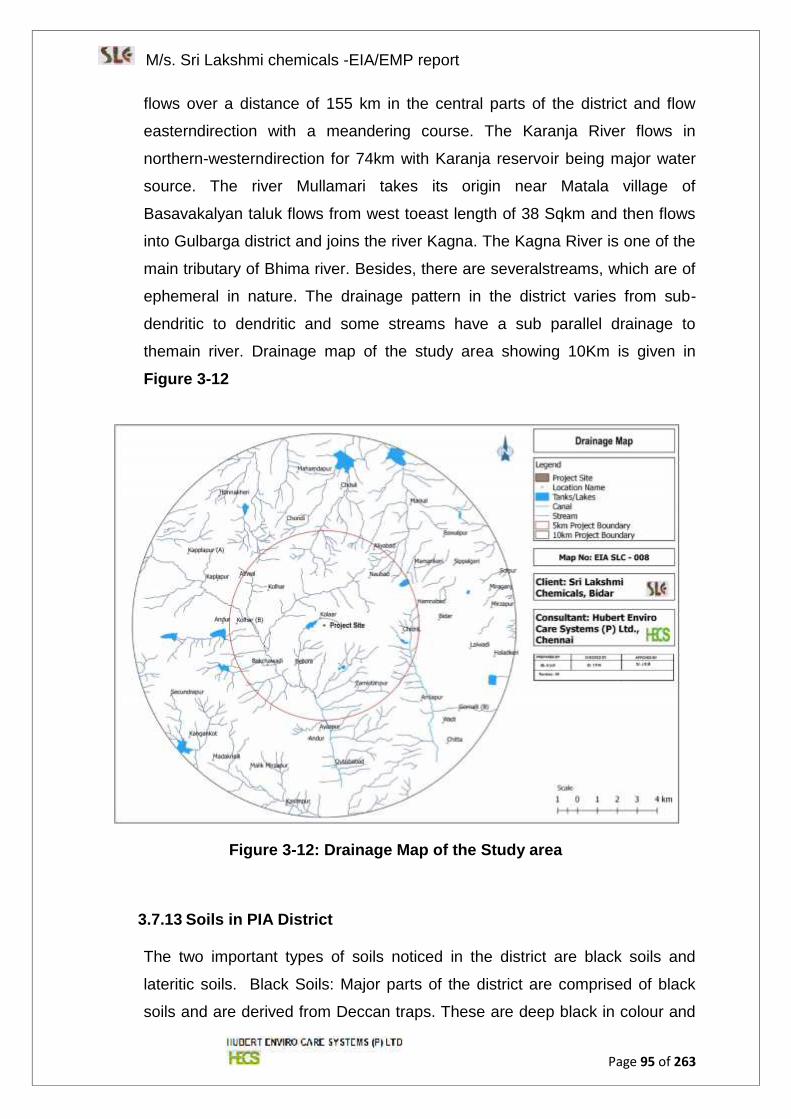
M/s. Sri Lakshmi chemicals -EIA/EMP report
Page 95 of 263
flows over a distance of 155 km in the central parts of the district and flow
easterndirection with a meandering course. The Karanja River flows in
northern-westerndirection for 74km with Karanja reservoir being major water
source. The river Mullamari takes its origin near Matala village of
Basavakalyan taluk flows from west toeast length of 38 Sqkm and then flows
into Gulbarga district and joins the river Kagna. The Kagna River is one of the
main tributary of Bhima river. Besides, there are severalstreams, which are of
ephemeral in nature. The drainage pattern in the district varies from sub-
dendritic to dendritic and some streams have a sub parallel drainage to
themain river. Drainage map of the study area showing 10Km is given in
Figure 3-12
Figure 3-12: Drainage Map of the Study area
3.7.13 Soils in PIA District
The two important types of soils noticed in the district are black soils and
lateritic soils. Black Soils: Major parts of the district are comprised of black
soils and are derived from Deccan traps. These are deep black in colour and
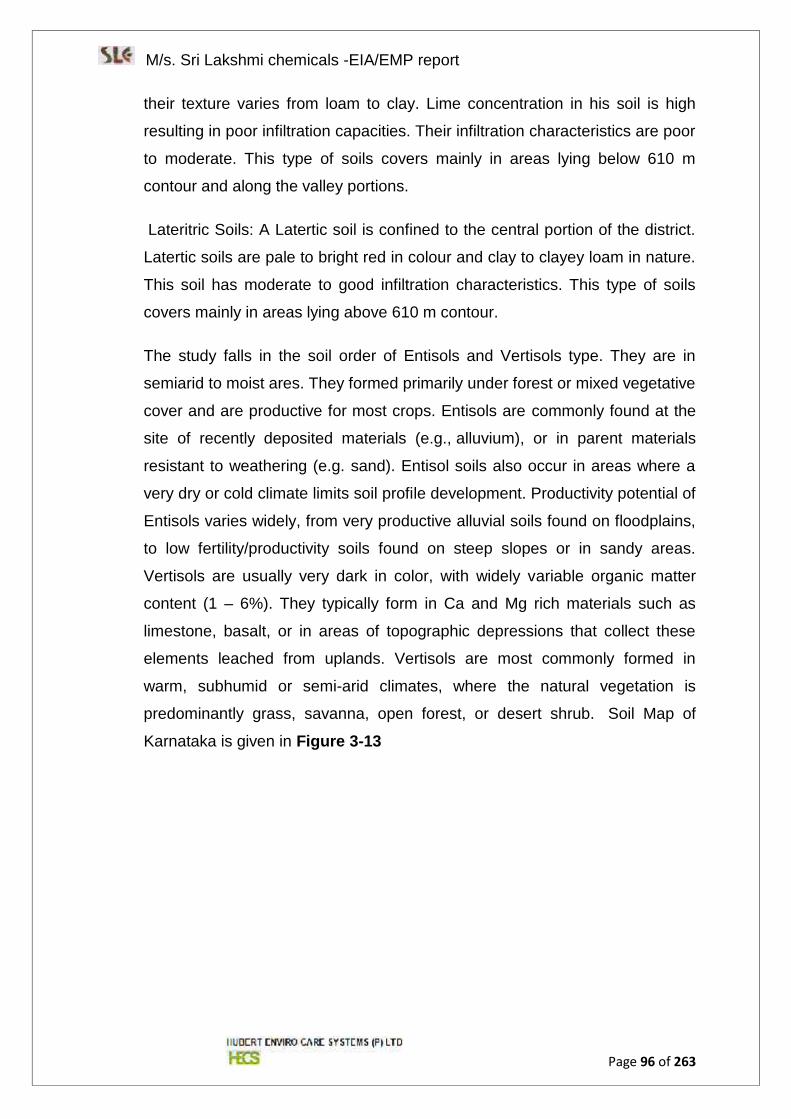
M/s. Sri Lakshmi chemicals -EIA/EMP report
Page 96 of 263
their texture varies from loam to clay. Lime concentration in his soil is high
resulting in poor infiltration capacities. Their infiltration characteristics are poor
to moderate. This type of soils covers mainly in areas lying below 610 m
contour and along the valley portions.
Lateritric Soils: A Latertic soil is confined to the central portion of the district.
Latertic soils are pale to bright red in colour and clay to clayey loam in nature.
This soil has moderate to good infiltration characteristics. This type of soils
covers mainly in areas lying above 610 m contour.
The study falls in the soil order of Entisols and Vertisols type. They are in
semiarid to moist ares. They formed primarily under forest or mixed vegetative
cover and are productive for most crops. Entisols are commonly found at the
site of recently deposited materials (e.g., alluvium), or in parent materials
resistant to weathering (e.g. sand). Entisol soils also occur in areas where a
very dry or cold climate limits soil profile development. Productivity potential of
Entisols varies widely, from very productive alluvial soils found on floodplains,
to low fertility/productivity soils found on steep slopes or in sandy areas.
Vertisols are usually very dark in color, with widely variable organic matter
content (1 – 6%). They typically form in Ca and Mg rich materials such as
limestone, basalt, or in areas of topographic depressions that collect these
elements leached from uplands. Vertisols are most commonly formed in
warm, subhumid or semi-arid climates, where the natural vegetation is
predominantly grass, savanna, open forest, or desert shrub. Soil Map of
Karnataka is given in Figure 3-13
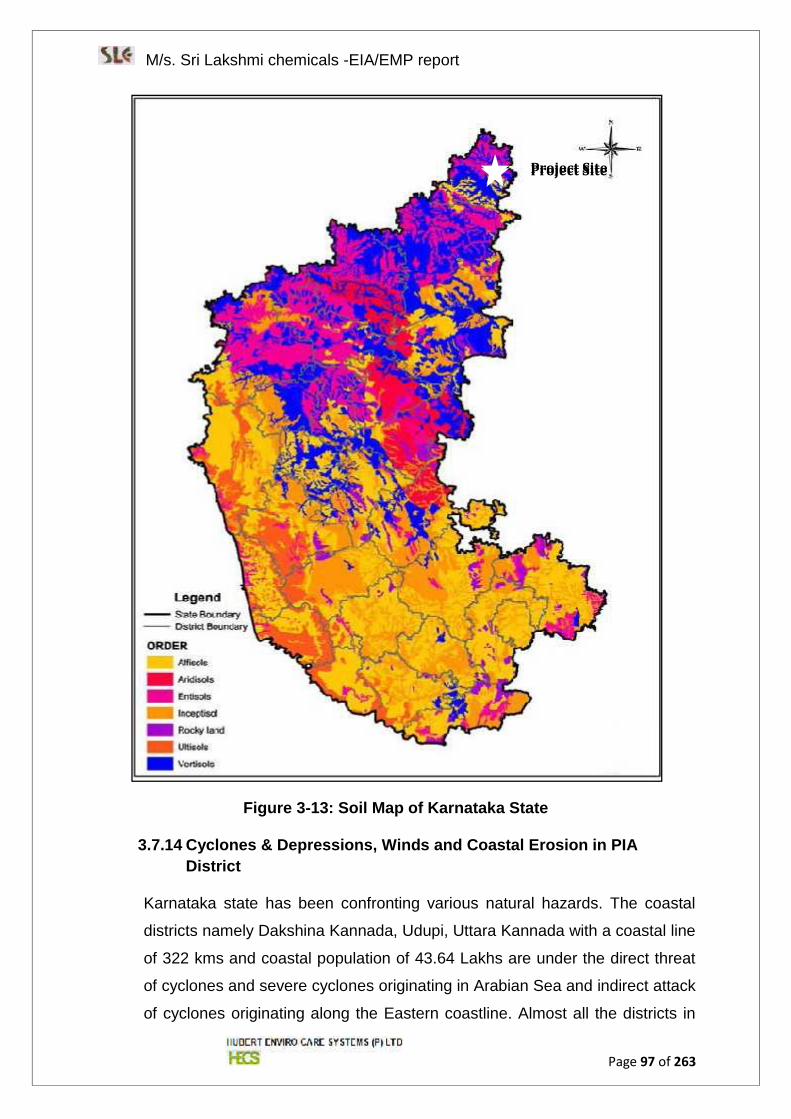
M/s. Sri Lakshmi chemicals -EIA/EMP report
Page 97 of 263
Figure 3-13: Soil Map of Karnataka State
3.7.14 Cyclones & Depressions, Winds and Coastal Erosion in PIADistrict
Karnataka state has been confronting various natural hazards. The coastal
districts namely Dakshina Kannada, Udupi, Uttara Kannada with a coastal line
of 322 kms and coastal population of 43.64 Lakhs are under the direct threat
of cyclones and severe cyclones originating in Arabian Sea and indirect attack
of cyclones originating along the Eastern coastline. Almost all the districts in
Project SiteProject Site
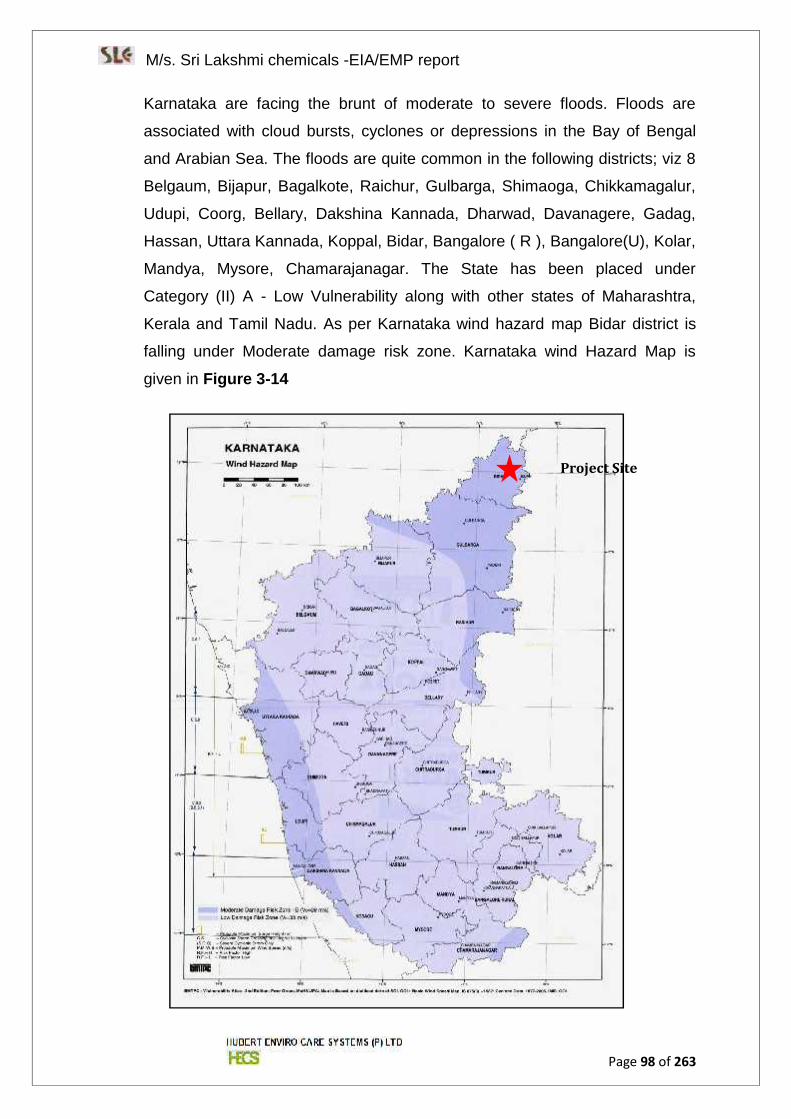
M/s. Sri Lakshmi chemicals -EIA/EMP report
Page 98 of 263
Karnataka are facing the brunt of moderate to severe floods. Floods are
associated with cloud bursts, cyclones or depressions in the Bay of Bengal
and Arabian Sea. The floods are quite common in the following districts; viz 8
Belgaum, Bijapur, Bagalkote, Raichur, Gulbarga, Shimaoga, Chikkamagalur,
Udupi, Coorg, Bellary, Dakshina Kannada, Dharwad, Davanagere, Gadag,
Hassan, Uttara Kannada, Koppal, Bidar, Bangalore ( R ), Bangalore(U), Kolar,
Mandya, Mysore, Chamarajanagar. The State has been placed under
Category (II) A - Low Vulnerability along with other states of Maharashtra,
Kerala and Tamil Nadu. As per Karnataka wind hazard map Bidar district is
falling under Moderate damage risk zone. Karnataka wind Hazard Map is
given in Figure 3-14
Project Site
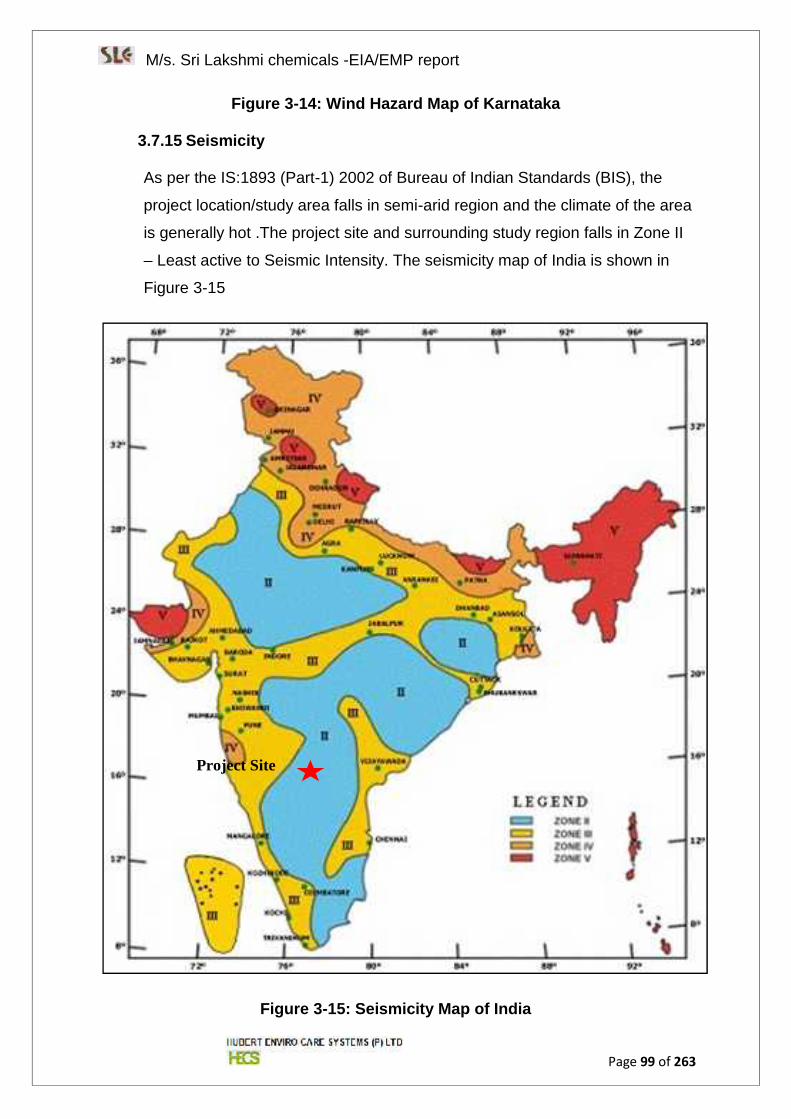
M/s. Sri Lakshmi chemicals -EIA/EMP report
Page 99 of 263
Figure 3-14: Wind Hazard Map of Karnataka
3.7.15 Seismicity
As per the IS:1893 (Part-1) 2002 of Bureau of Indian Standards (BIS), the
project location/study area falls in semi-arid region and the climate of the area
is generally hot .The project site and surrounding study region falls in Zone II
– Least active to Seismic Intensity. The seismicity map of India is shown in
Figure 3-15
Figure 3-15: Seismicity Map of India
Project Site
M/s. Sri Lakshmi chemicals -EIA/EMP report
Page 100 of 263
3.8 Air Environment
Baseline ambient air quality assessment gives the status in the vicinity of site
and is an indispensable part of environmental impact assessment studies.
Significant changes, in predominant winds and weather conditions are
observed in winter, summer and post-monsoon seasons apart from the local
topographic influences. The baseline status of air environment in the study
area is assessed through a systematic air quality surveillance programme
3.8.1 Meteorological Conditions
The regional air quality is influenced by the meteorology of that region. The
principal weather parameters that influence the concentration of the air
pollutants in the surroundings are wind speed, wind direction and
temperature. The meteorological data is useful for proper interpretation of the
baseline data. It is used as input for air quality dispersion models for
predicting the post project environmental scenario i.e. ground level
concentrations due to proposed utilities like boiler & DG sets, etc.
3.8.2 Meteorological Data Collection
Available secondary data pertaining to the meteorological parameters was
obtained from the IMD Climatalogical tables. In addition, baseline
meteorological data (primary data) was generated during the Post-monsoon
Season (December 2016 - February 2017). The methodology adopted for
monitoring surface observations is as per the standard norms laid down by
Bureau of Indian Standards (BIS) i.e. IS:8829 and Indian Meteorological
Department (IMD).
3.8.3 General Meteorological Scenario based on IMD Data
The nearest Indian Meteorological Department (IMD) station located to project
site is Bangalore. The Climatological data for Bidar(17 32’ N and 77o 32’ E),
published by the IMD, based on daily observations at 08:30 and 17:30 hour
IST for a 30 year period, is presented in the following sections on the
meteorological conditions of the region. The monthly variations of the relevant
meteorological parameters are reproduced in Table 3-4. Windrose drawn for
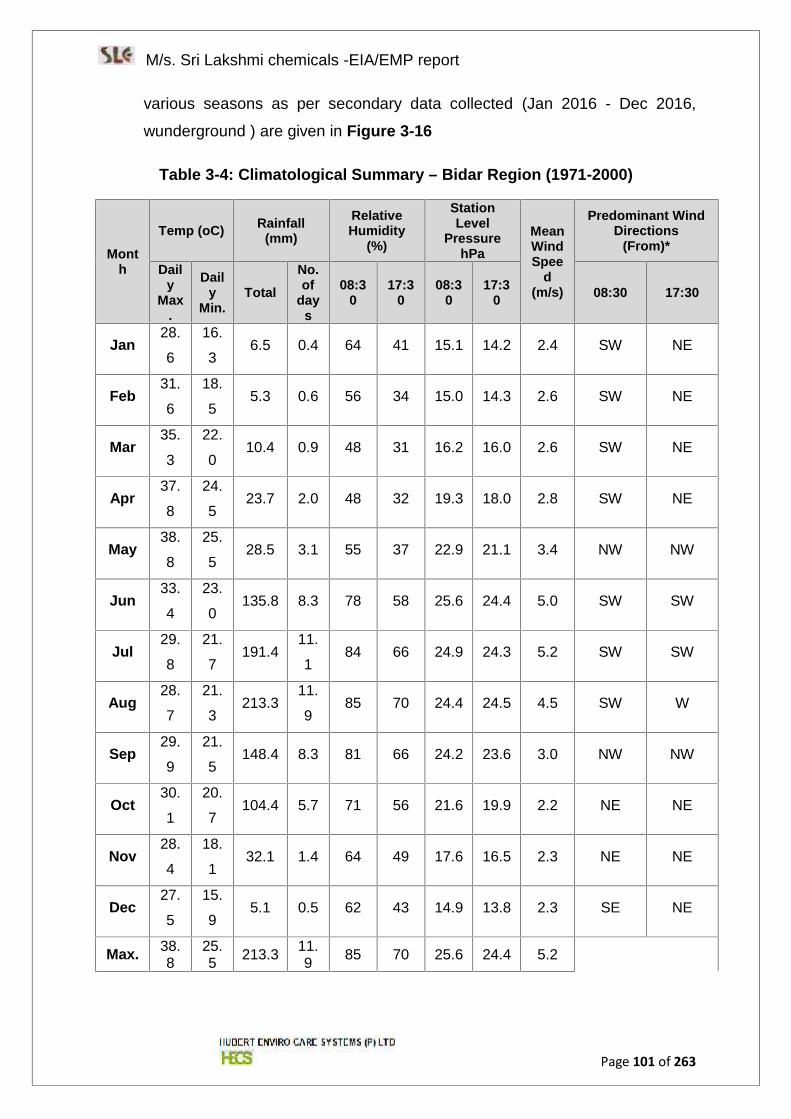
M/s. Sri Lakshmi chemicals -EIA/EMP report
Page 101 of 263
various seasons as per secondary data collected (Jan 2016 - Dec 2016,
wunderground ) are given in Figure 3-16
Table 3-4: Climatological Summary – Bidar Region (1971-2000)
Month
Temp (oC) Rainfall(mm)
RelativeHumidity
(%)
StationLevel
PressurehPa
MeanWindSpee
d(m/s)
Predominant WindDirections
(From)*
Daily
Max.
Daily
Min.Total
No.of
days
08:30
17:30
08:30
17:30 08:30 17:30
Jan28.
6
16.
36.5 0.4 64 41 15.1 14.2 2.4 SW NE
Feb31.
6
18.
55.3 0.6 56 34 15.0 14.3 2.6 SW NE
Mar35.
3
22.
010.4 0.9 48 31 16.2 16.0 2.6 SW NE
Apr37.
8
24.
523.7 2.0 48 32 19.3 18.0 2.8 SW NE
May38.
8
25.
528.5 3.1 55 37 22.9 21.1 3.4 NW NW
Jun33.
4
23.
0135.8 8.3 78 58 25.6 24.4 5.0 SW SW
Jul29.
8
21.
7191.4
11.
184 66 24.9 24.3 5.2 SW SW
Aug28.
7
21.
3213.3
11.
985 70 24.4 24.5 4.5 SW W
Sep29.
9
21.
5148.4 8.3 81 66 24.2 23.6 3.0 NW NW
Oct30.
1
20.
7104.4 5.7 71 56 21.6 19.9 2.2 NE NE
Nov28.
4
18.
132.1 1.4 64 49 17.6 16.5 2.3 NE NE
Dec27.
5
15.
95.1 0.5 62 43 14.9 13.8 2.3 SE NE
Max. 38.8
25.5 213.3 11.
9 85 70 25.6 24.4 5.2
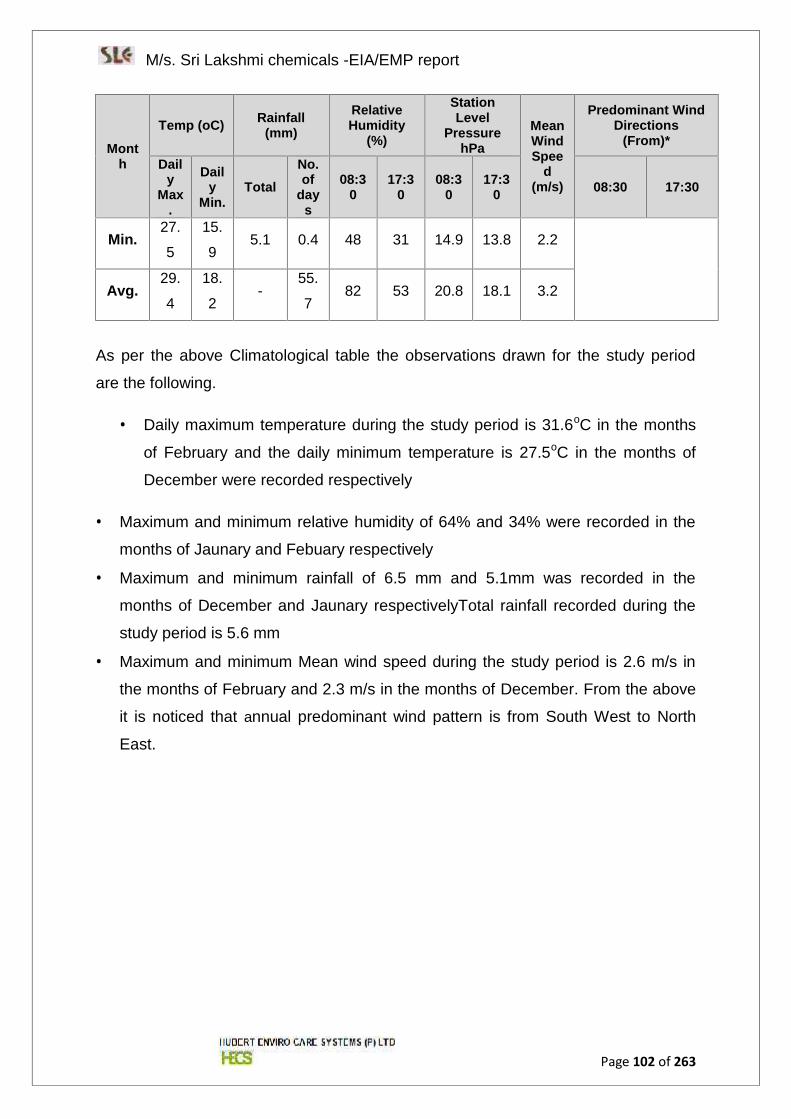
M/s. Sri Lakshmi chemicals -EIA/EMP report
Page 102 of 263
Month
Temp (oC) Rainfall(mm)
RelativeHumidity
(%)
StationLevel
PressurehPa
MeanWindSpee
d(m/s)
Predominant WindDirections
(From)*
Daily
Max.
Daily
Min.Total
No.of
days
08:30
17:30
08:30
17:30 08:30 17:30
Min.27.
5
15.
95.1 0.4 48 31 14.9 13.8 2.2
Avg.29.
4
18.
2-
55.
782 53 20.8 18.1 3.2
As per the above Climatological table the observations drawn for the study period
are the following.
Daily maximum temperature during the study period is 31.6oC in the months
of February and the daily minimum temperature is 27.5oC in the months of
December were recorded respectively
Maximum and minimum relative humidity of 64% and 34% were recorded in the
months of Jaunary and Febuary respectively
Maximum and minimum rainfall of 6.5 mm and 5.1mm was recorded in the
months of December and Jaunary respectivelyTotal rainfall recorded during the
study period is 5.6 mm
Maximum and minimum Mean wind speed during the study period is 2.6 m/s in
the months of February and 2.3 m/s in the months of December. From the above
it is noticed that annual predominant wind pattern is from South West to North
East.
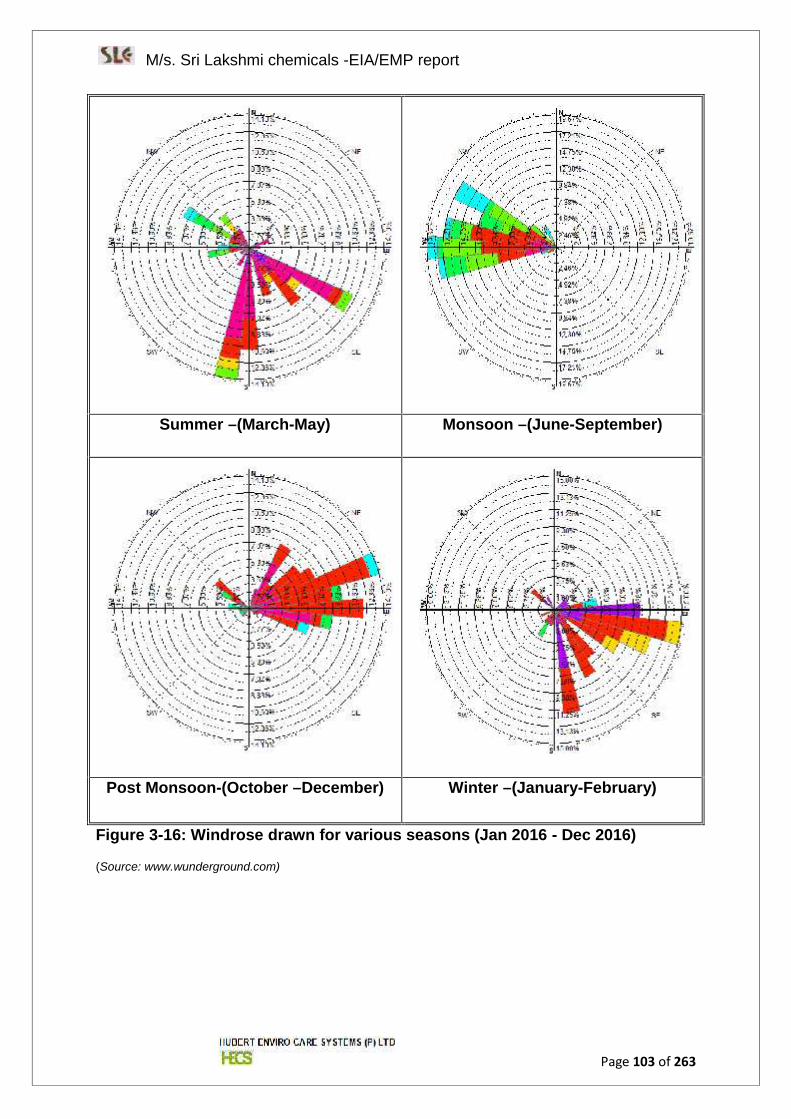
M/s. Sri Lakshmi chemicals -EIA/EMP report
Page 103 of 263
Summer –(March-May) Monsoon –(June-September)
Post Monsoon-(October –December) Winter –(January-February)
Figure 3-16: Windrose drawn for various seasons (Jan 2016 - Dec 2016)
(Source: www.wunderground.com)
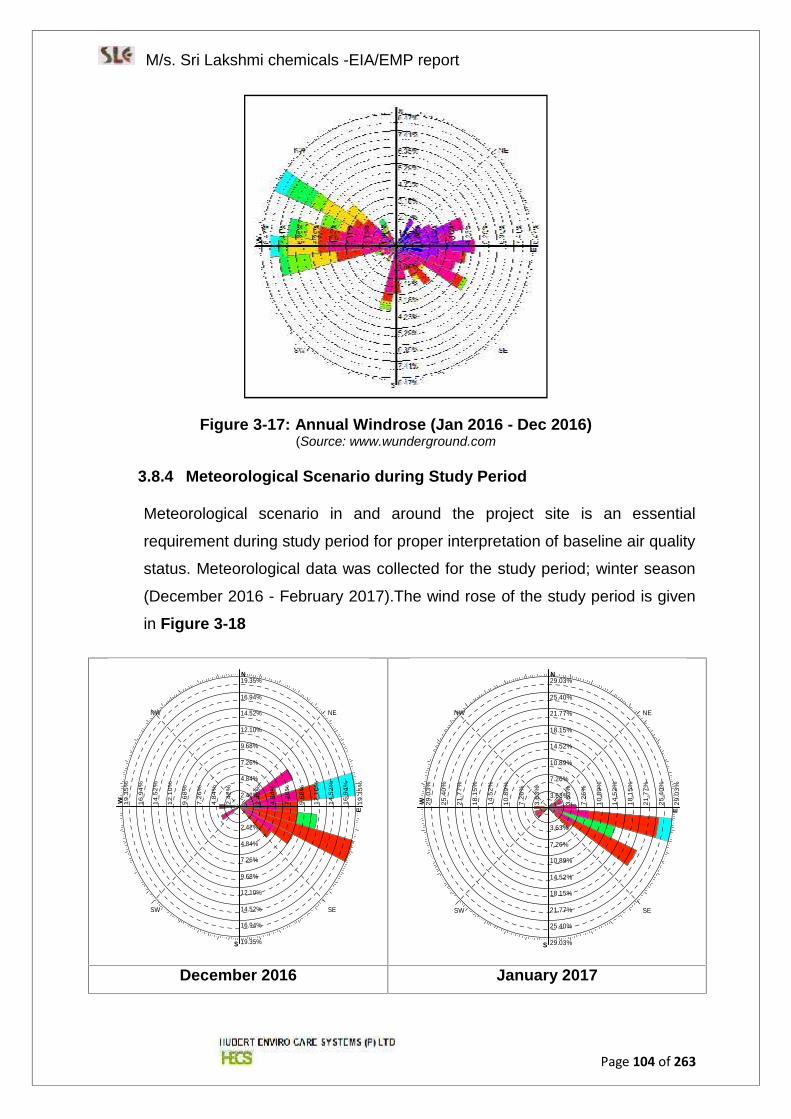
M/s. Sri Lakshmi chemicals -EIA/EMP report
Page 104 of 263
Figure 3-17: Annual Windrose (Jan 2016 - Dec 2016)(Source: www.wunderground.com
3.8.4 Meteorological Scenario during Study Period
Meteorological scenario in and around the project site is an essential
requirement during study period for proper interpretation of baseline air quality
status. Meteorological data was collected for the study period; winter season
(December 2016 - February 2017).The wind rose of the study period is given
in Figure 3-18
December 2016 January 2017
W
E
S
N
SW SE
NW NE
2.42%
2.42%
2.42
%
2.42
%
4.84%
4.84%
4.84
%
4.84
%
7.26%
7.26%
7.26
%
7.26
%
9.68%
9.68%
9.68
%
9.68
%
12.10%
12.10%
12.1
0%
12.1
0%
14.52%
14.52%
14.5
2%
14.5
2%
16.94%
16.94%
16.9
4%
16.9
4%
19.35%
19.35%
19.3
5%
19.3
5%
W
E
S
N
SW SE
NW NE
3.63%
3.63%
3.63
%
3.63
%
7.26%
7.26%
7.26
%
7.26
%
10.89%
10.89%
10.8
9%
10.8
9%
14.52%
14.52%
14.5
2%
14.5
2%
18.15%
18.15%
18.1
5%
18.1
5%
21.77%
21.77%
21.7
7%
21.7
7%
25.40%
25.40%
25.4
0%
25.4
0%
29.03%
29.03%
29.0
3%
29.0
3%
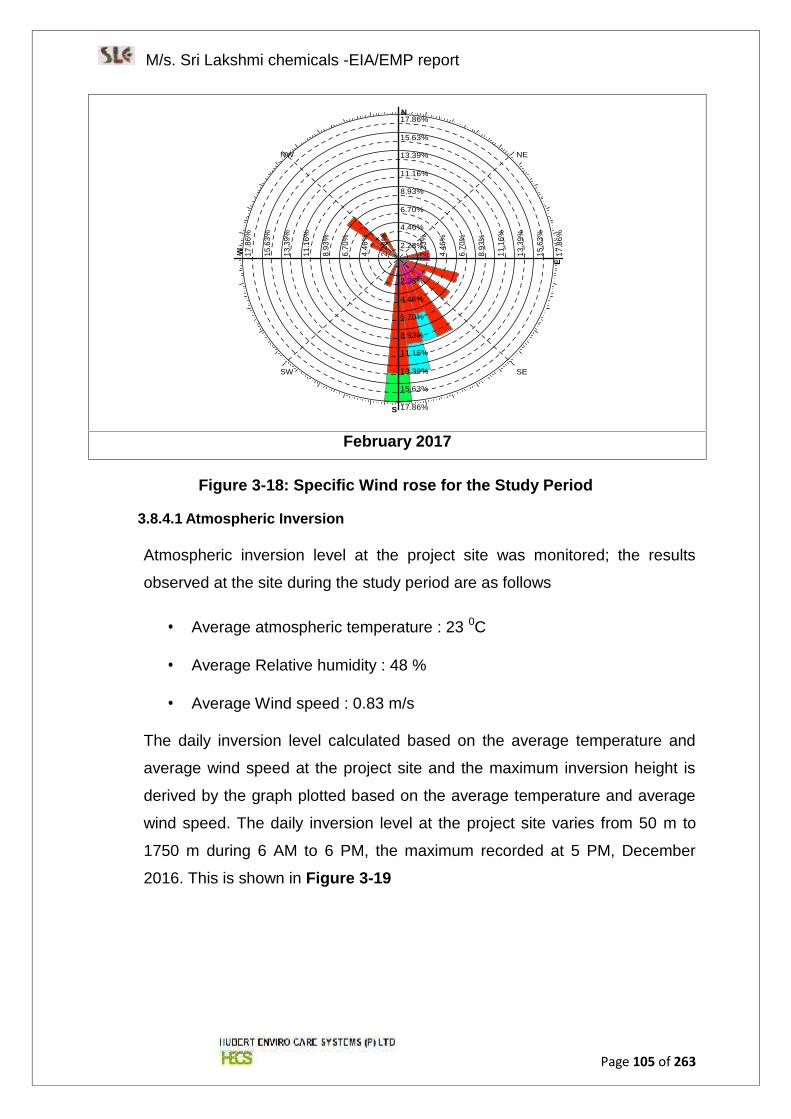
M/s. Sri Lakshmi chemicals -EIA/EMP report
Page 105 of 263
February 2017
Figure 3-18: Specific Wind rose for the Study Period
3.8.4.1 Atmospheric Inversion
Atmospheric inversion level at the project site was monitored; the results
observed at the site during the study period are as follows
Average atmospheric temperature : 23 0C
Average Relative humidity : 48 %
Average Wind speed : 0.83 m/s
The daily inversion level calculated based on the average temperature and
average wind speed at the project site and the maximum inversion height is
derived by the graph plotted based on the average temperature and average
wind speed. The daily inversion level at the project site varies from 50 m to
1750 m during 6 AM to 6 PM, the maximum recorded at 5 PM, December
2016. This is shown in Figure 3-19
W
E
S
N
SW SE
NW NE
2.23%
2.23%
2.23
%
2.23
%
4.46%
4.46%
4.46
%
4.46
%
6.70%
6.70%
6.70
%
6.70
%
8.93%
8.93%8.
93%
8.93
%
11.16%
11.16%
11.1
6%
11.1
6%
13.39%
13.39%
13.3
9%
13.3
9%
15.63%
15.63%
15.6
3%
15.6
3%
17.86%
17.86%
17.8
6%
17.8
6%
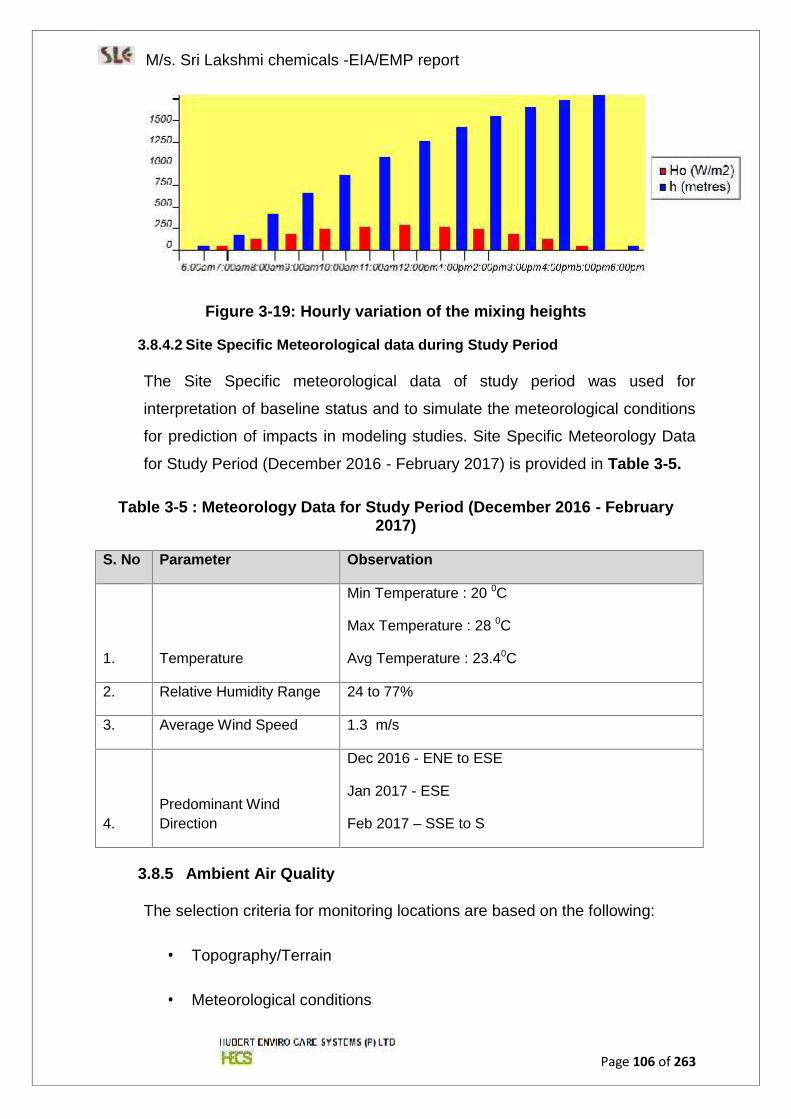
M/s. Sri Lakshmi chemicals -EIA/EMP report
Page 106 of 263
Figure 3-19: Hourly variation of the mixing heights
3.8.4.2 Site Specific Meteorological data during Study Period
The Site Specific meteorological data of study period was used for
interpretation of baseline status and to simulate the meteorological conditions
for prediction of impacts in modeling studies. Site Specific Meteorology Data
for Study Period (December 2016 - February 2017) is provided in Table 3-5.
Table 3-5 : Meteorology Data for Study Period (December 2016 - February2017)
S. No Parameter Observation
1. Temperature
Min Temperature : 20 0C
Max Temperature : 28 0C
Avg Temperature : 23.40C
2. Relative Humidity Range 24 to 77%
3. Average Wind Speed 1.3 m/s
4.Predominant WindDirection
Dec 2016 - ENE to ESE
Jan 2017 - ESE
Feb 2017 – SSE to S
3.8.5 Ambient Air Quality
The selection criteria for monitoring locations are based on the following:
Topography/Terrain
Meteorological conditions
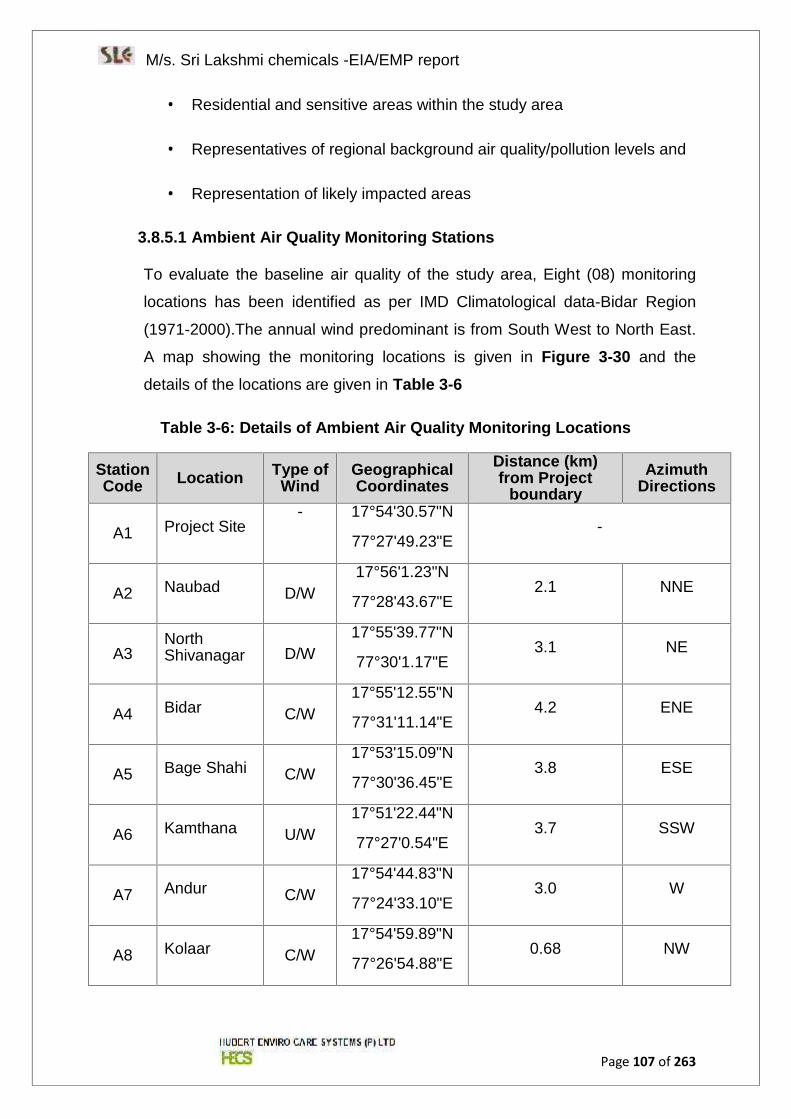
M/s. Sri Lakshmi chemicals -EIA/EMP report
Page 107 of 263
Residential and sensitive areas within the study area
Representatives of regional background air quality/pollution levels and
Representation of likely impacted areas
3.8.5.1 Ambient Air Quality Monitoring Stations
To evaluate the baseline air quality of the study area, Eight (08) monitoring
locations has been identified as per IMD Climatological data-Bidar Region
(1971-2000).The annual wind predominant is from South West to North East.
A map showing the monitoring locations is given in Figure 3-30 and the
details of the locations are given in Table 3-6
Table 3-6: Details of Ambient Air Quality Monitoring Locations
StationCode Location Type of
WindGeographicalCoordinates
Distance (km)from Project
boundaryAzimuth
Directions
A1 Project Site- 17°54'30.57"N
77°27'49.23"E-
A2 Naubad D/W17°56'1.23"N
77°28'43.67"E2.1 NNE
A3NorthShivanagar D/W
17°55'39.77"N
77°30'1.17"E3.1 NE
A4 Bidar C/W17°55'12.55"N
77°31'11.14"E4.2 ENE
A5 Bage Shahi C/W17°53'15.09"N
77°30'36.45"E3.8 ESE
A6 Kamthana U/W17°51'22.44"N
77°27'0.54"E3.7 SSW
A7 Andur C/W17°54'44.83"N
77°24'33.10"E3.0 W
A8 Kolaar C/W17°54'59.89"N
77°26'54.88"E0.68 NW
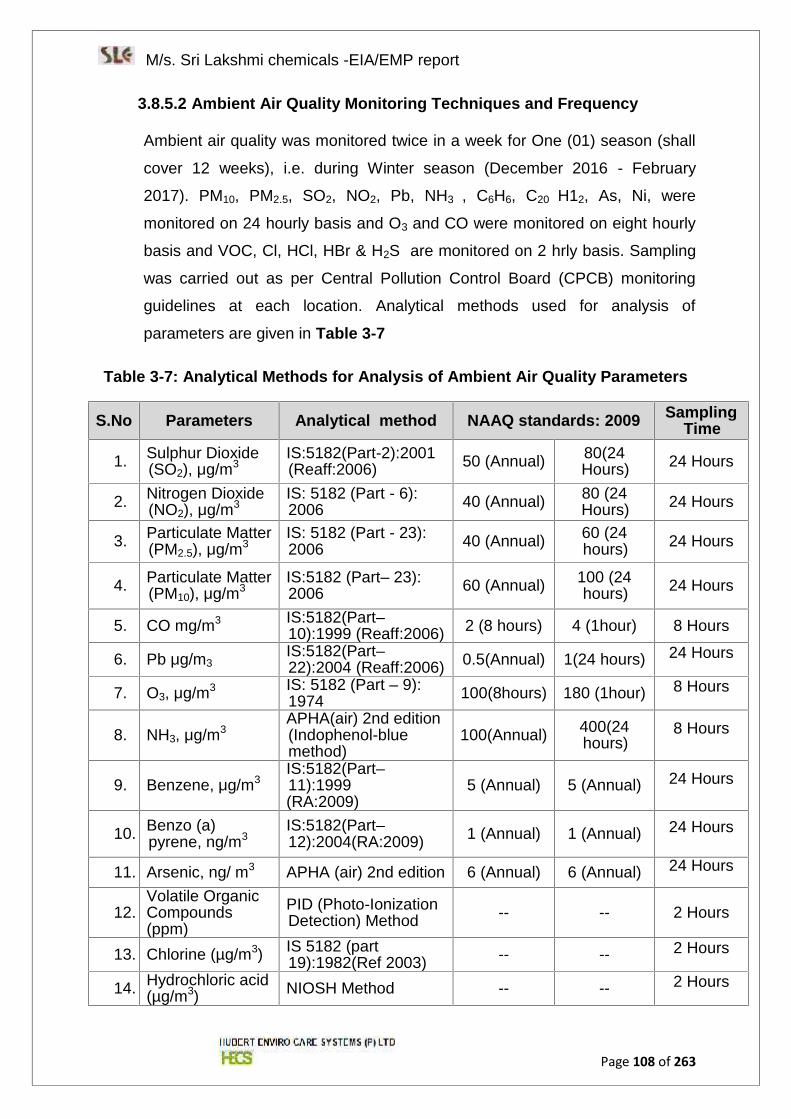
M/s. Sri Lakshmi chemicals -EIA/EMP report
Page 108 of 263
3.8.5.2 Ambient Air Quality Monitoring Techniques and Frequency
Ambient air quality was monitored twice in a week for One (01) season (shall
cover 12 weeks), i.e. during Winter season (December 2016 - February
2017). PM10, PM2.5, SO2, NO2, Pb, NH3 , C6H6, C20 H12, As, Ni, were
monitored on 24 hourly basis and O3 and CO were monitored on eight hourly
basis and VOC, Cl, HCl, HBr & H2S are monitored on 2 hrly basis. Sampling
was carried out as per Central Pollution Control Board (CPCB) monitoring
guidelines at each location. Analytical methods used for analysis of
parameters are given in Table 3-7
Table 3-7: Analytical Methods for Analysis of Ambient Air Quality Parameters
S.No Parameters Analytical method NAAQ standards: 2009 SamplingTime
1. Sulphur Dioxide(SO2), μg/m3
IS:5182(Part-2):2001(Reaff:2006) 50 (Annual) 80(24
Hours) 24 Hours
2. Nitrogen Dioxide(NO2), μg/m3
IS: 5182 (Part - 6):2006 40 (Annual) 80 (24
Hours) 24 Hours
3. Particulate Matter(PM2.5), μg/m3
IS: 5182 (Part - 23):2006 40 (Annual) 60 (24
hours) 24 Hours
4. Particulate Matter(PM10), μg/m3
IS:5182 (Part– 23):2006 60 (Annual) 100 (24
hours) 24 Hours
5. CO mg/m3 IS:5182(Part–10):1999 (Reaff:2006) 2 (8 hours) 4 (1hour) 8 Hours
6. Pb μg/m3IS:5182(Part–22):2004 (Reaff:2006) 0.5(Annual) 1(24 hours) 24 Hours
7. O3, μg/m3 IS: 5182 (Part – 9):1974 100(8hours) 180 (1hour) 8 Hours
8. NH3, μg/m3APHA(air) 2nd edition(Indophenol-bluemethod)
100(Annual) 400(24hours)
8 Hours
9. Benzene, μg/m3IS:5182(Part–11):1999(RA:2009)
5 (Annual) 5 (Annual) 24 Hours
10. Benzo (a)pyrene, ng/m3
IS:5182(Part–12):2004(RA:2009) 1 (Annual) 1 (Annual) 24 Hours
11. Arsenic, ng/ m3 APHA (air) 2nd edition 6 (Annual) 6 (Annual) 24 Hours
12.Volatile OrganicCompounds(ppm)
PID (Photo-IonizationDetection) Method -- -- 2 Hours
13. Chlorine (µg/m3) IS 5182 (part19):1982(Ref 2003) -- -- 2 Hours
14. Hydrochloric acid(µg/m3) NIOSH Method -- -- 2 Hours
M/s. Sri Lakshmi chemicals -EIA/EMP report
Page 109 of 263
15. Hydrobromic acid(µg/m3) NIOSH Method -- -- 2 Hours
16. Hydrogensulphide (µg/m3)
IS 5182 (part 7) :1973(Ref 2003) -- -- 2 Hours
17. Hydrogenfluoride (µg/m3) NIOSH Method -- -- 2 Hours
3.8.5.3 Results and DiscussionsThe variations of the pollutants PM10, PM2.5, SO2, NO2, CO, Pb, O3 , NH3 ,
C6H6, C20 H12, As, Ni, VOC, Cl, HCl, HBr & H2S are compared with National
Ambient Air Quality Standards (NAAQS), MoEF&CC Notification, November,
2009. Ambient Air Quality Monitoring Data (December 2016 - February 2017)
for the study area is given in Table 3-8 to Table 3-15 and trends of measured
ambient concentrations in the study area were graphically represented in
Figure 3-20 to Figure 3-24
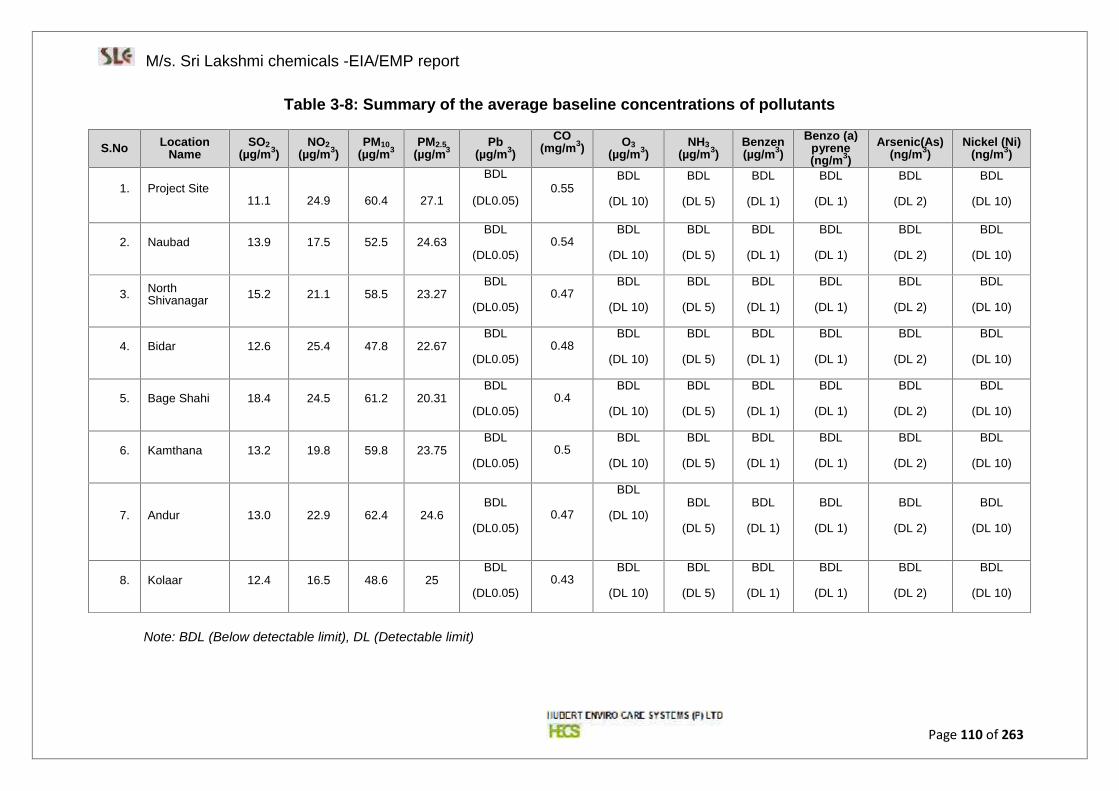
M/s. Sri Lakshmi chemicals -EIA/EMP report
Page 110 of 263
Table 3-8: Summary of the average baseline concentrations of pollutants
S.No LocationName
SO2(µg/m3)
NO2(µg/m3)
PM10(µg/m3
PM2.5(µg/m3
Pb(µg/m3)
CO(mg/m3) O3
(µg/m3)NH3
(µg/m3)Benzen(µg/m3)
Benzo (a)pyrene(ng/m3)
Arsenic(As)(ng/m3)
Nickel (Ni)(ng/m3)
1. Project Site11.1 24.9 60.4 27.1
BDL
(DL0.05)0.55
BDL
(DL 10)
BDL
(DL 5)
BDL
(DL 1)
BDL
(DL 1)
BDL
(DL 2)
BDL
(DL 10)
2. Naubad 13.9 17.5 52.5 24.63BDL
(DL0.05)0.54
BDL
(DL 10)
BDL
(DL 5)
BDL
(DL 1)
BDL
(DL 1)
BDL
(DL 2)
BDL
(DL 10)
3. NorthShivanagar 15.2 21.1 58.5 23.27
BDL
(DL0.05)0.47
BDL
(DL 10)
BDL
(DL 5)
BDL
(DL 1)
BDL
(DL 1)
BDL
(DL 2)
BDL
(DL 10)
4. Bidar 12.6 25.4 47.8 22.67BDL
(DL0.05)0.48
BDL
(DL 10)
BDL
(DL 5)
BDL
(DL 1)
BDL
(DL 1)
BDL
(DL 2)
BDL
(DL 10)
5. Bage Shahi 18.4 24.5 61.2 20.31BDL
(DL0.05)0.4
BDL
(DL 10)
BDL
(DL 5)
BDL
(DL 1)
BDL
(DL 1)
BDL
(DL 2)
BDL
(DL 10)
6. Kamthana 13.2 19.8 59.8 23.75BDL
(DL0.05)0.5
BDL
(DL 10)
BDL
(DL 5)
BDL
(DL 1)
BDL
(DL 1)
BDL
(DL 2)
BDL
(DL 10)
7. Andur 13.0 22.9 62.4 24.6BDL
(DL0.05)0.47
BDL
(DL 10)BDL
(DL 5)
BDL
(DL 1)
BDL
(DL 1)
BDL
(DL 2)
BDL
(DL 10)
8. Kolaar 12.4 16.5 48.6 25BDL
(DL0.05)0.43
BDL
(DL 10)
BDL
(DL 5)
BDL
(DL 1)
BDL
(DL 1)
BDL
(DL 2)
BDL
(DL 10)
Note: BDL (Below detectable limit), DL (Detectable limit)
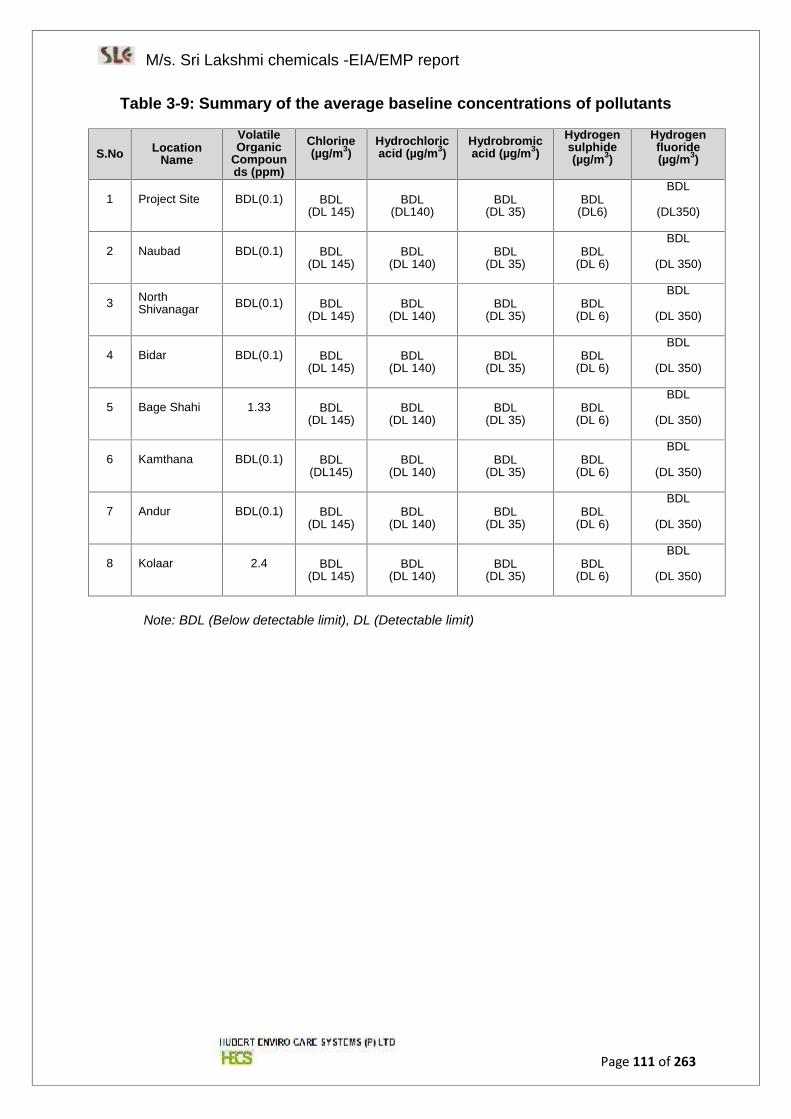
M/s. Sri Lakshmi chemicals -EIA/EMP report
Page 111 of 263
Table 3-9: Summary of the average baseline concentrations of pollutants
S.No LocationName
VolatileOrganic
Compounds (ppm)
Chlorine(µg/m3)
Hydrochloricacid (µg/m3)
Hydrobromicacid (µg/m3)
Hydrogensulphide(µg/m3)
Hydrogenfluoride(µg/m3)
1 Project Site BDL(0.1) BDL(DL 145)
BDL(DL140)
BDL(DL 35)
BDL(DL6)
BDL
(DL350)
2 Naubad BDL(0.1) BDL(DL 145)
BDL(DL 140)
BDL(DL 35)
BDL(DL 6)
BDL
(DL 350)
3 NorthShivanagar BDL(0.1) BDL
(DL 145)BDL
(DL 140)BDL
(DL 35)BDL
(DL 6)
BDL
(DL 350)
4 Bidar BDL(0.1) BDL(DL 145)
BDL(DL 140)
BDL(DL 35)
BDL(DL 6)
BDL
(DL 350)
5 Bage Shahi 1.33 BDL(DL 145)
BDL(DL 140)
BDL(DL 35)
BDL(DL 6)
BDL
(DL 350)
6 Kamthana BDL(0.1) BDL(DL145)
BDL(DL 140)
BDL(DL 35)
BDL(DL 6)
BDL
(DL 350)
7 Andur BDL(0.1) BDL(DL 145)
BDL(DL 140)
BDL(DL 35)
BDL(DL 6)
BDL
(DL 350)
8 Kolaar 2.4 BDL(DL 145)
BDL(DL 140)
BDL(DL 35)
BDL(DL 6)
BDL
(DL 350)
Note: BDL (Below detectable limit), DL (Detectable limit)
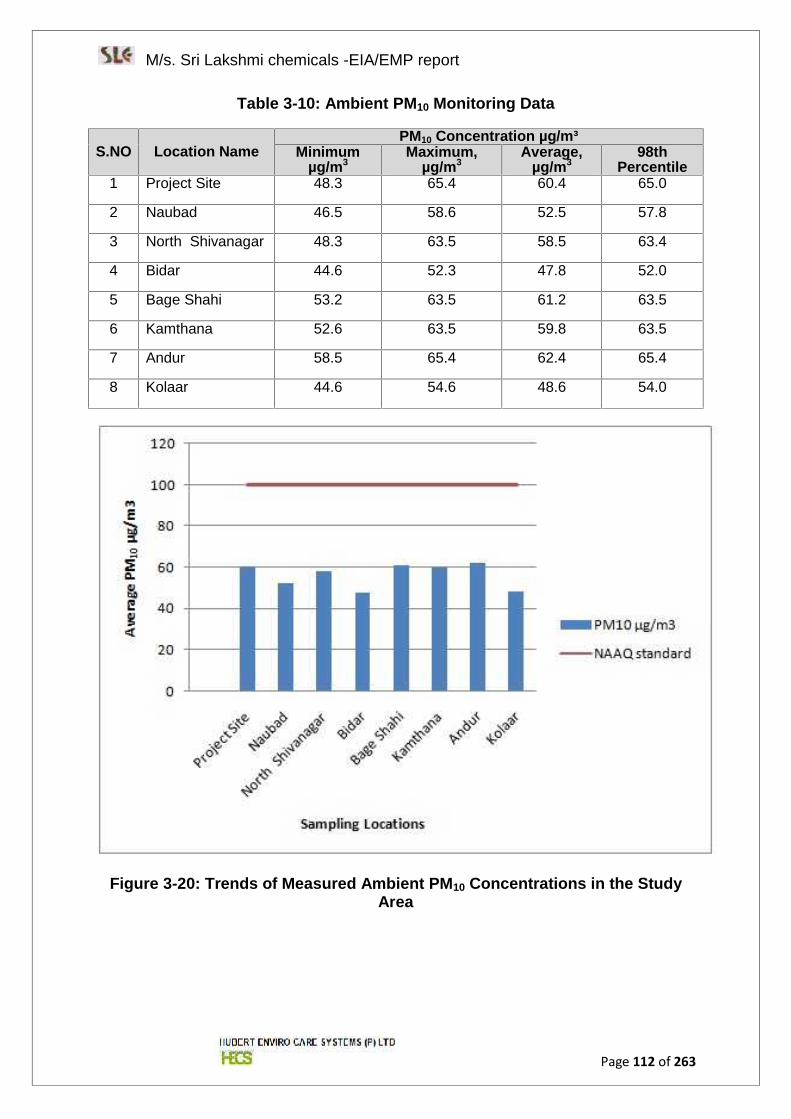
M/s. Sri Lakshmi chemicals -EIA/EMP report
Page 112 of 263
Table 3-10: Ambient PM10 Monitoring Data
S.NO Location NamePM10 Concentration µg/m³
Minimumµg/m3
Maximum,µg/m3
Average,µg/m3
98thPercentile
1 Project Site 48.3 65.4 60.4 65.0
2 Naubad 46.5 58.6 52.5 57.8
3 North Shivanagar 48.3 63.5 58.5 63.4
4 Bidar 44.6 52.3 47.8 52.0
5 Bage Shahi 53.2 63.5 61.2 63.5
6 Kamthana 52.6 63.5 59.8 63.5
7 Andur 58.5 65.4 62.4 65.4
8 Kolaar 44.6 54.6 48.6 54.0
Figure 3-20: Trends of Measured Ambient PM10 Concentrations in the StudyArea
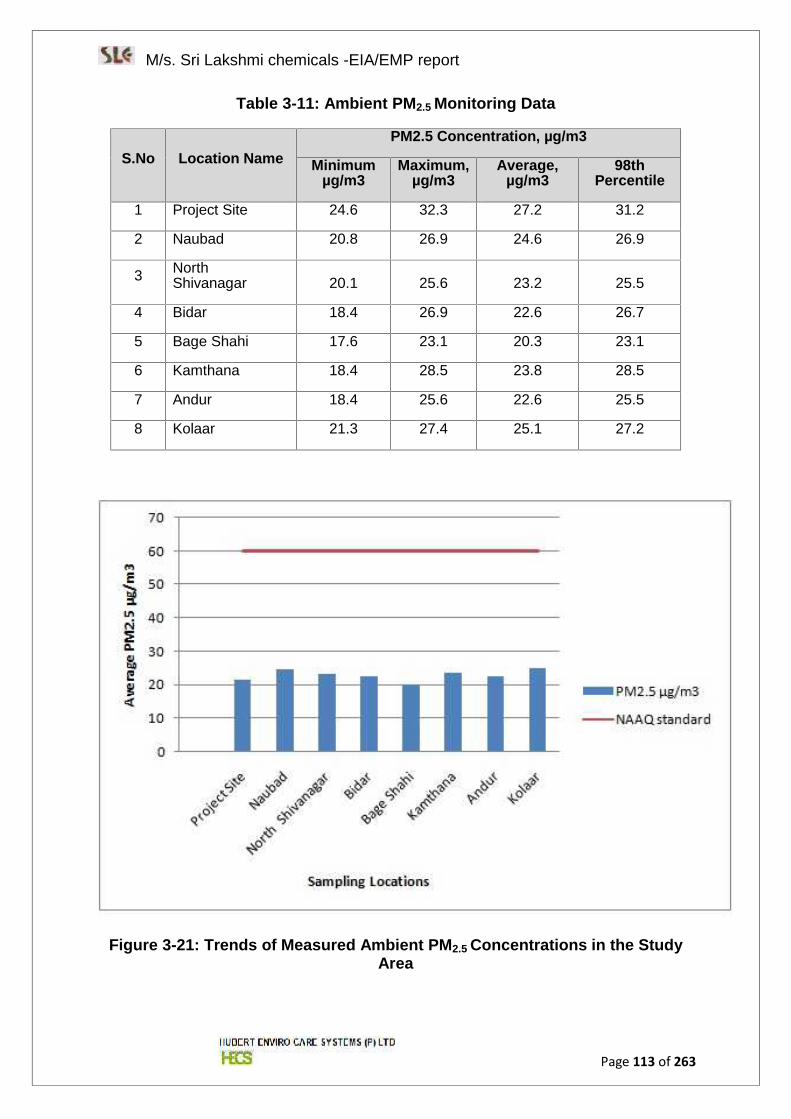
M/s. Sri Lakshmi chemicals -EIA/EMP report
Page 113 of 263
Table 3-11: Ambient PM2.5 Monitoring Data
S.No Location NamePM2.5 Concentration, µg/m3
Minimumµg/m3
Maximum,µg/m3
Average,µg/m3
98thPercentile
1 Project Site 24.6 32.3 27.2 31.2
2 Naubad 20.8 26.9 24.6 26.9
3 NorthShivanagar 20.1 25.6 23.2 25.5
4 Bidar 18.4 26.9 22.6 26.7
5 Bage Shahi 17.6 23.1 20.3 23.1
6 Kamthana 18.4 28.5 23.8 28.5
7 Andur 18.4 25.6 22.6 25.5
8 Kolaar 21.3 27.4 25.1 27.2
Figure 3-21: Trends of Measured Ambient PM2.5 Concentrations in the StudyArea
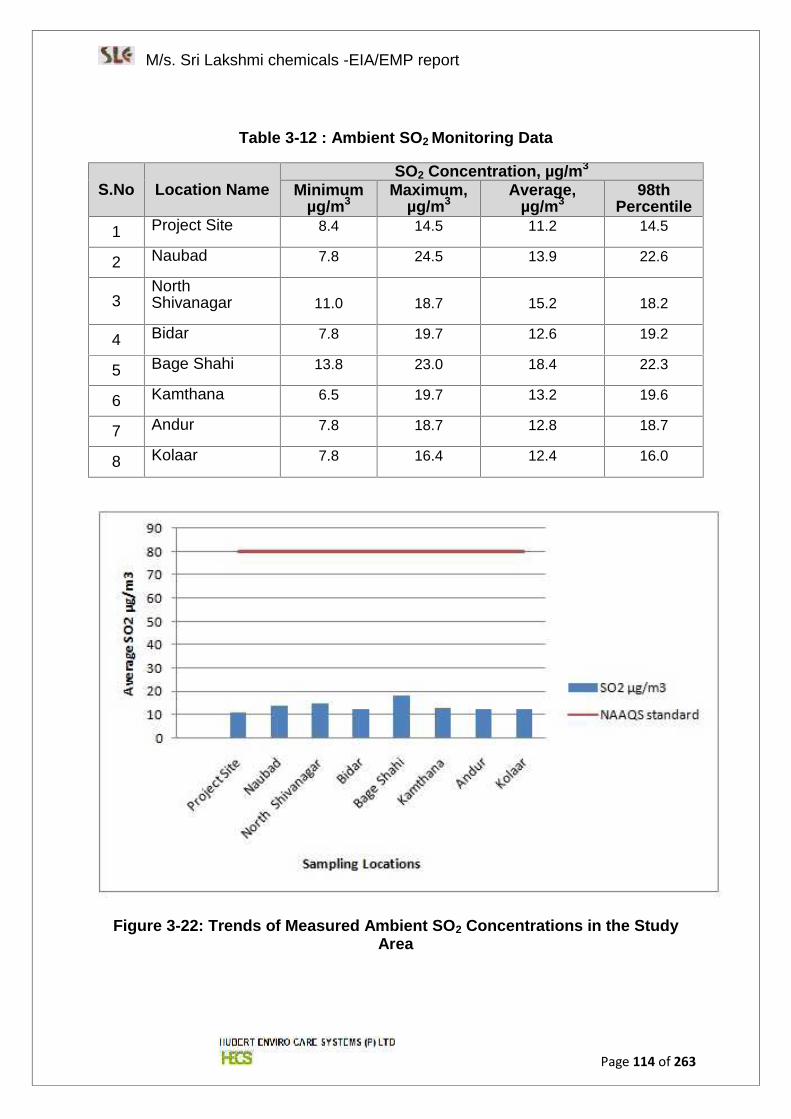
M/s. Sri Lakshmi chemicals -EIA/EMP report
Page 114 of 263
Table 3-12 : Ambient SO2 Monitoring Data
S.No Location NameSO2 Concentration, µg/m3
Minimumµg/m3
Maximum,µg/m3
Average,µg/m3
98thPercentile
1 Project Site 8.4 14.5 11.2 14.5
2 Naubad 7.8 24.5 13.9 22.6
3NorthShivanagar 11.0 18.7 15.2 18.2
4 Bidar 7.8 19.7 12.6 19.2
5 Bage Shahi 13.8 23.0 18.4 22.3
6 Kamthana 6.5 19.7 13.2 19.6
7 Andur 7.8 18.7 12.8 18.7
8 Kolaar 7.8 16.4 12.4 16.0
Figure 3-22: Trends of Measured Ambient SO2 Concentrations in the StudyArea
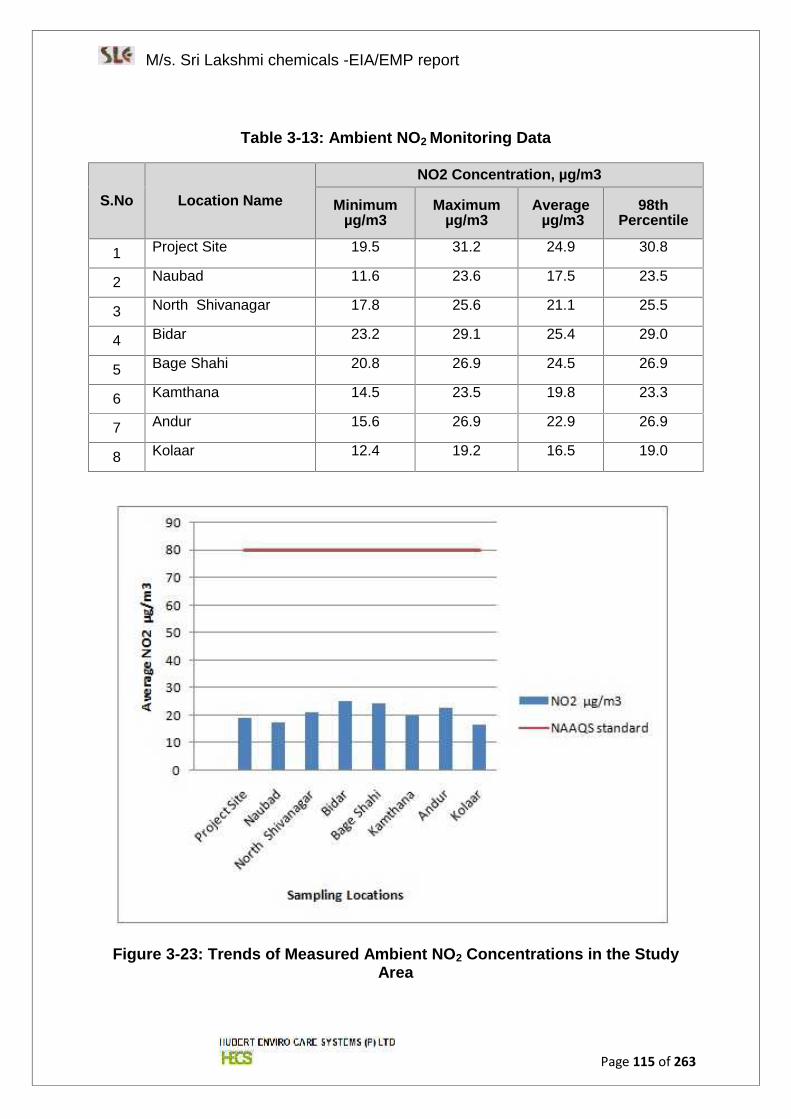
M/s. Sri Lakshmi chemicals -EIA/EMP report
Page 115 of 263
Table 3-13: Ambient NO2 Monitoring Data
S.No Location Name
NO2 Concentration, µg/m3
Minimumµg/m3
Maximumµg/m3
Averageµg/m3
98thPercentile
1 Project Site 19.5 31.2 24.9 30.8
2 Naubad 11.6 23.6 17.5 23.5
3 North Shivanagar 17.8 25.6 21.1 25.5
4 Bidar 23.2 29.1 25.4 29.0
5 Bage Shahi 20.8 26.9 24.5 26.9
6 Kamthana 14.5 23.5 19.8 23.3
7 Andur 15.6 26.9 22.9 26.9
8 Kolaar 12.4 19.2 16.5 19.0
Figure 3-23: Trends of Measured Ambient NO2 Concentrations in the StudyArea

M/s. Sri Lakshmi chemicals -EIA/EMP report
Page 116 of 263
Table 3-14: Ambient Carbon Monoxide (CO) Monitoring Data
S.No Location NameCO Concentration, mg/m3
Minimummg/m3
Maximummg/m3
Averagemg/m3
98thPercentile
1 Project Site 0.10 0.90 0.55 0.90
2 Naubad 0.20 1.30 0.54 1.25
3 North Shivanagar 0.20 0.80 0.47 0.80
4 Bidar 0.20 0.80 0.48 0.80
5 Bage Shahi 0.10 0.80 0.44 0.80
6 Kamthana 0.10 1.30 0.51 1.21
7 Andur 0.10 1.10 0.47 1.01
8 Kolaar 0.10 0.90 0.43 0.90
Note: - BDL = Below Detectable Limit
Figure 3-24: Trends of Measured Ambient CO Concentrations in the StudyArea
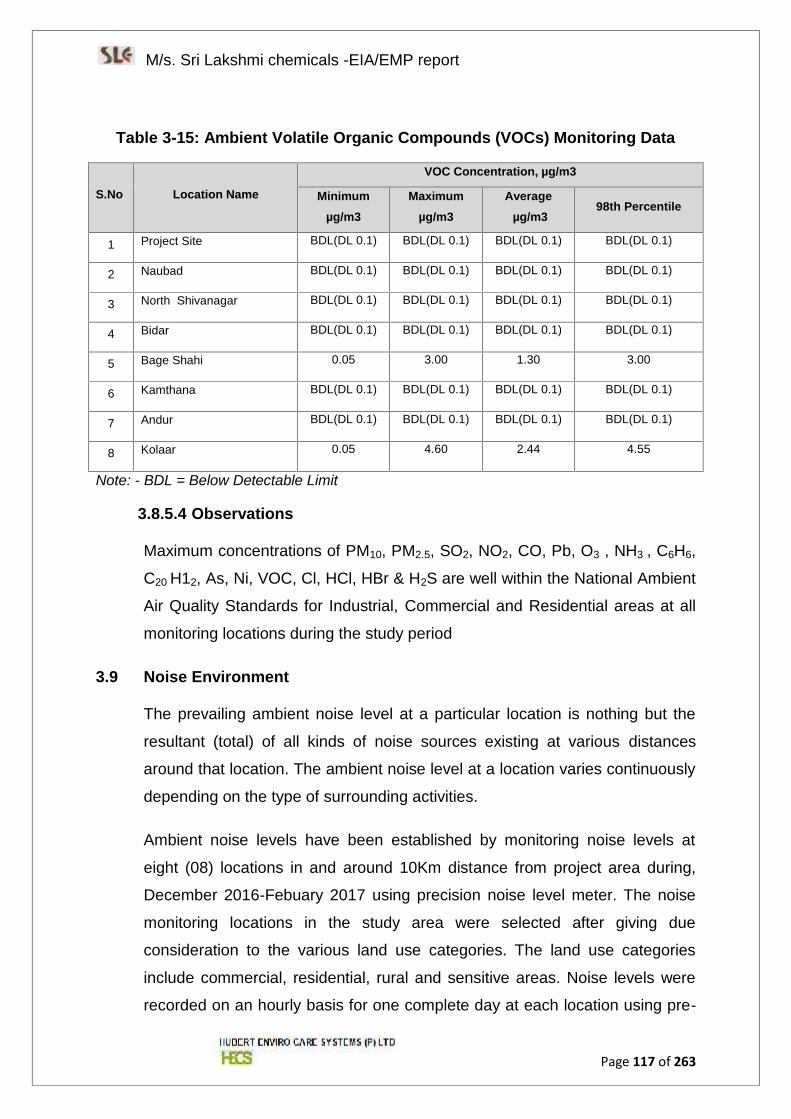
M/s. Sri Lakshmi chemicals -EIA/EMP report
Page 117 of 263
Table 3-15: Ambient Volatile Organic Compounds (VOCs) Monitoring Data
S.No Location Name
VOC Concentration, µg/m3
Minimumµg/m3
Maximumµg/m3
Averageµg/m3
98th Percentile
1 Project Site BDL(DL 0.1) BDL(DL 0.1) BDL(DL 0.1) BDL(DL 0.1)
2 Naubad BDL(DL 0.1) BDL(DL 0.1) BDL(DL 0.1) BDL(DL 0.1)
3 North Shivanagar BDL(DL 0.1) BDL(DL 0.1) BDL(DL 0.1) BDL(DL 0.1)
4 Bidar BDL(DL 0.1) BDL(DL 0.1) BDL(DL 0.1) BDL(DL 0.1)
5 Bage Shahi 0.05 3.00 1.30 3.00
6 Kamthana BDL(DL 0.1) BDL(DL 0.1) BDL(DL 0.1) BDL(DL 0.1)
7 Andur BDL(DL 0.1) BDL(DL 0.1) BDL(DL 0.1) BDL(DL 0.1)
8 Kolaar 0.05 4.60 2.44 4.55
Note: - BDL = Below Detectable Limit
3.8.5.4 Observations
Maximum concentrations of PM10, PM2.5, SO2, NO2, CO, Pb, O3 , NH3 , C6H6,
C20 H12, As, Ni, VOC, Cl, HCl, HBr & H2S are well within the National Ambient
Air Quality Standards for Industrial, Commercial and Residential areas at all
monitoring locations during the study period
3.9 Noise Environment
The prevailing ambient noise level at a particular location is nothing but the
resultant (total) of all kinds of noise sources existing at various distances
around that location. The ambient noise level at a location varies continuously
depending on the type of surrounding activities.
Ambient noise levels have been established by monitoring noise levels at
eight (08) locations in and around 10Km distance from project area during,
December 2016-Febuary 2017 using precision noise level meter. The noise
monitoring locations in the study area were selected after giving due
consideration to the various land use categories. The land use categories
include commercial, residential, rural and sensitive areas. Noise levels were
recorded on an hourly basis for one complete day at each location using pre-

M/s. Sri Lakshmi chemicals -EIA/EMP report
Page 118 of 263
calibrated noise levels. A map showing the monitoring locations is given as
Figure 3-30 Results and Discussions
Based on the recorded hourly noise levels at each monitoring location, the
day equivalent (Ld) and night equivalent (Ln) were calculated;
Ld: Average noise levels between 6:00 hours to 22.00 hours.
Ln: Average noise levels between 22:00 hours to 6.00 hours.
The Day-Night (Ldn) equivalent noise levels were calculated using the US
Environmental Protection Agency formula:
Ldn = 10 Log [0.0416 {16 (10Ld/10) + 8 (10Ln+10/10)}]
The comparison of day equivalent noise levels (Ld) and night equivalent noise
levels (Ln) with the respective CPCB stipulated noise standards for various
land use categories are shown in the Table 3-16.
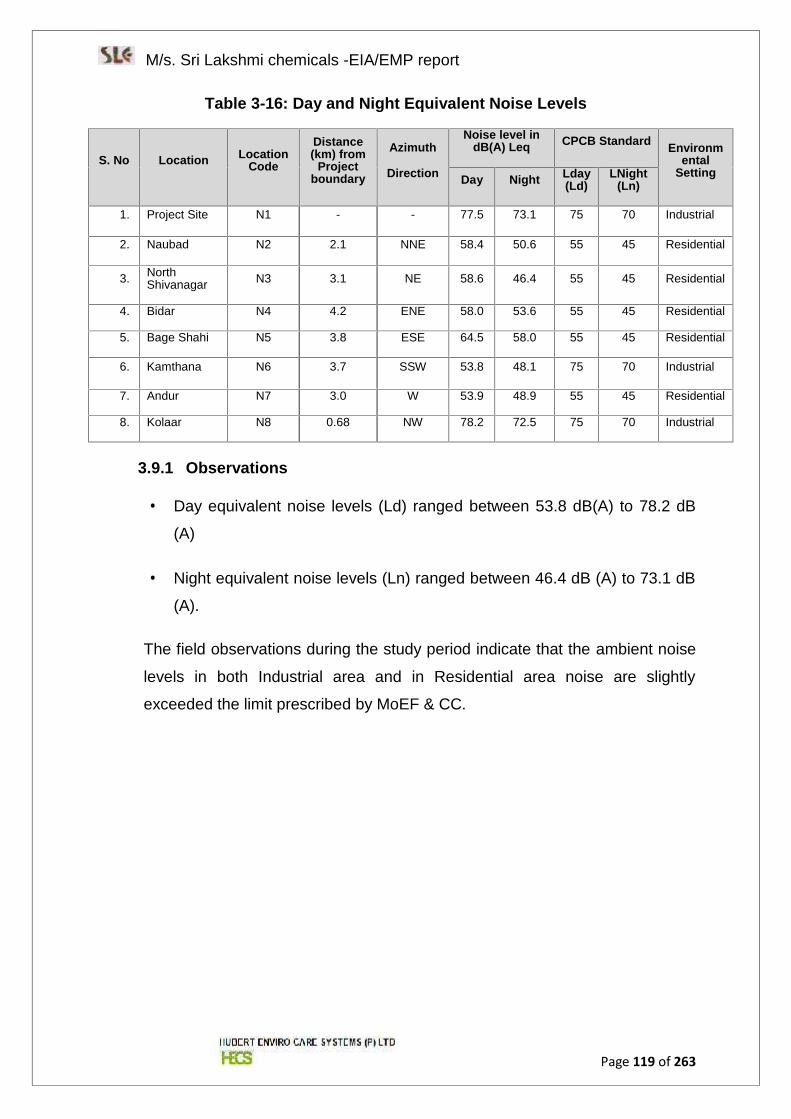
M/s. Sri Lakshmi chemicals -EIA/EMP report
Page 119 of 263
Table 3-16: Day and Night Equivalent Noise Levels
S. No Location LocationCode
Distance(km) from
Projectboundary
Azimuth
Direction
Noise level indB(A) Leq CPCB Standard Environm
entalSettingDay Night Lday
(Ld)LNight
(Ln)
1. .Project Site N1 - - 77.5 73.1 75 70 Industrial
2. Naubad N2 2.1 NNE 58.4 50.6 55 45 Residential
3. NorthShivanagar N3 3.1 NE 58.6 46.4 55 45 Residential
4. Bidar N4 4.2 ENE 58.0 53.6 55 45 Residential
5. Bage Shahi N5 3.8 ESE 64.5 58.0 55 45 Residential
6. Kamthana N6 3.7 SSW 53.8 48.1 75 70 Industrial
7. Andur N7 3.0 W 53.9 48.9 55 45 Residential
8. Kolaar N8 0.68 NW 78.2 72.5 75 70 Industrial
3.9.1 Observations
Day equivalent noise levels (Ld) ranged between 53.8 dB(A) to 78.2 dB
(A)
Night equivalent noise levels (Ln) ranged between 46.4 dB (A) to 73.1 dB
(A).
The field observations during the study period indicate that the ambient noise
levels in both Industrial area and in Residential area noise are slightly
exceeded the limit prescribed by MoEF & CC.
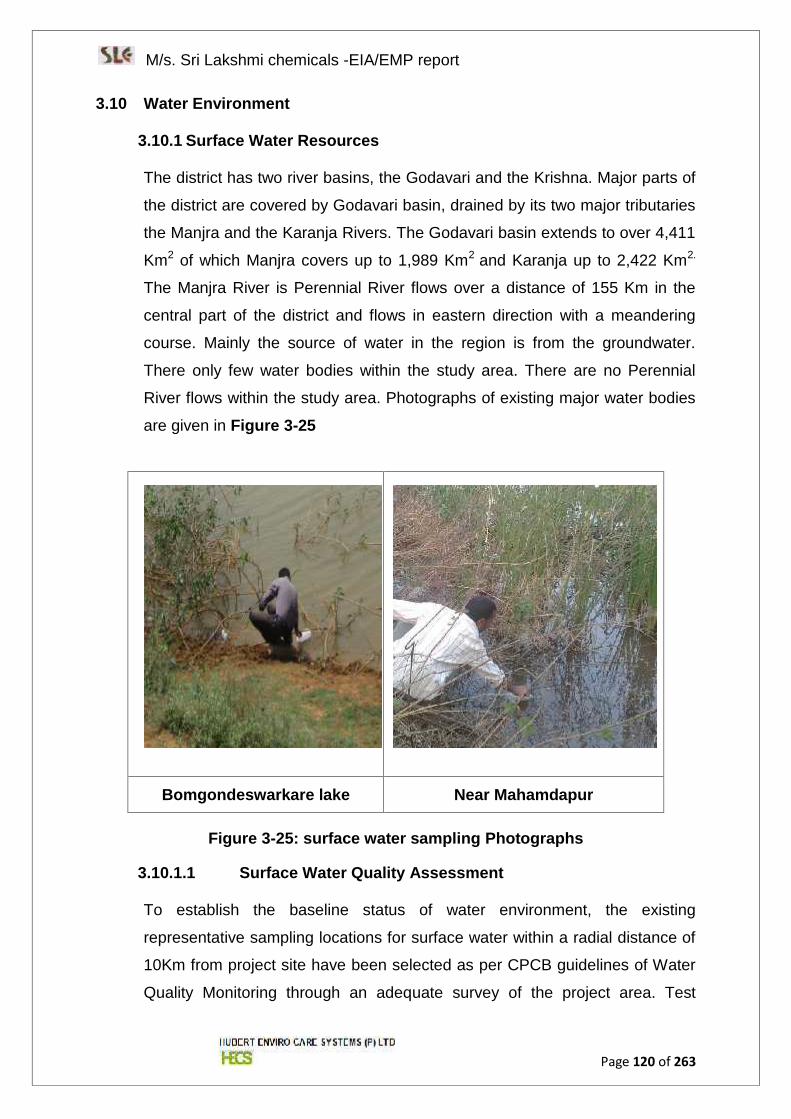
M/s. Sri Lakshmi chemicals -EIA/EMP report
Page 120 of 263
3.10 Water Environment
3.10.1 Surface Water Resources
The district has two river basins, the Godavari and the Krishna. Major parts of
the district are covered by Godavari basin, drained by its two major tributaries
the Manjra and the Karanja Rivers. The Godavari basin extends to over 4,411
Km2 of which Manjra covers up to 1,989 Km2 and Karanja up to 2,422 Km2.
The Manjra River is Perennial River flows over a distance of 155 Km in the
central part of the district and flows in eastern direction with a meandering
course. Mainly the source of water in the region is from the groundwater.
There only few water bodies within the study area. There are no Perennial
River flows within the study area. Photographs of existing major water bodies
are given in Figure 3-25
Figure 3-25: surface water sampling Photographs
3.10.1.1 Surface Water Quality Assessment
To establish the baseline status of water environment, the existing
representative sampling locations for surface water within a radial distance of
10Km from project site have been selected as per CPCB guidelines of Water
Quality Monitoring through an adequate survey of the project area. Test
Bomgondeswarkare lake Near Mahamdapur
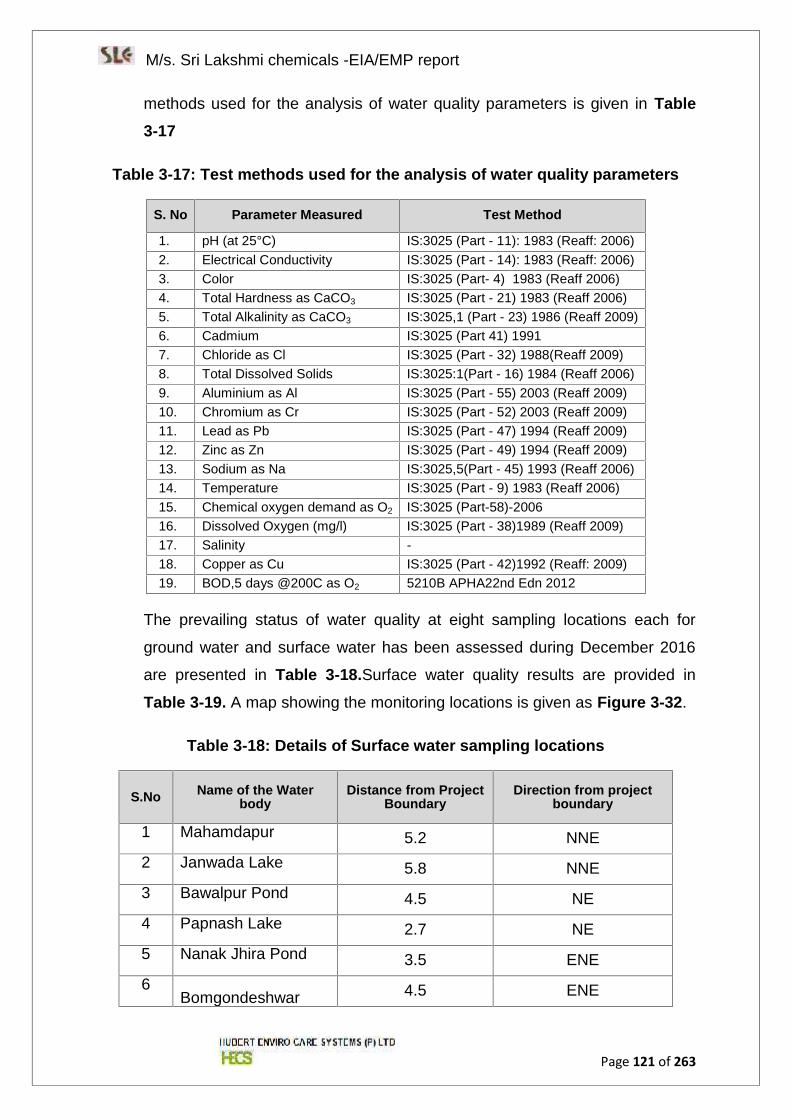
M/s. Sri Lakshmi chemicals -EIA/EMP report
Page 121 of 263
methods used for the analysis of water quality parameters is given in Table3-17
Table 3-17: Test methods used for the analysis of water quality parameters
S. No Parameter Measured Test Method
1. pH (at 25°C) IS:3025 (Part - 11): 1983 (Reaff: 2006)2. Electrical Conductivity IS:3025 (Part - 14): 1983 (Reaff: 2006)3. Color IS:3025 (Part- 4) 1983 (Reaff 2006)4. Total Hardness as CaCO3 IS:3025 (Part - 21) 1983 (Reaff 2006)5. Total Alkalinity as CaCO3 IS:3025,1 (Part - 23) 1986 (Reaff 2009)6. Cadmium IS:3025 (Part 41) 19917. Chloride as Cl IS:3025 (Part - 32) 1988(Reaff 2009)8. Total Dissolved Solids IS:3025:1(Part - 16) 1984 (Reaff 2006)9. Aluminium as Al IS:3025 (Part - 55) 2003 (Reaff 2009)10. Chromium as Cr IS:3025 (Part - 52) 2003 (Reaff 2009)11. Lead as Pb IS:3025 (Part - 47) 1994 (Reaff 2009)12. Zinc as Zn IS:3025 (Part - 49) 1994 (Reaff 2009)13. Sodium as Na IS:3025,5(Part - 45) 1993 (Reaff 2006)14. Temperature IS:3025 (Part - 9) 1983 (Reaff 2006)15. Chemical oxygen demand as O2 IS:3025 (Part-58)-200616. Dissolved Oxygen (mg/l) IS:3025 (Part - 38)1989 (Reaff 2009)17. Salinity -18. Copper as Cu IS:3025 (Part - 42)1992 (Reaff: 2009)19. BOD,5 days @200C as O2 5210B APHA22nd Edn 2012
The prevailing status of water quality at eight sampling locations each for
ground water and surface water has been assessed during December 2016
are presented in Table 3-18.Surface water quality results are provided in
Table 3-19. A map showing the monitoring locations is given as Figure 3-32.
Table 3-18: Details of Surface water sampling locations
S.No Name of the Waterbody
Distance from ProjectBoundary
Direction from projectboundary
1 Mahamdapur 5.2 NNE2 Janwada Lake 5.8 NNE3 Bawalpur Pond 4.5 NE4 Papnash Lake 2.7 NE5 Nanak Jhira Pond 3.5 ENE6
Bomgondeshwar 4.5 ENE
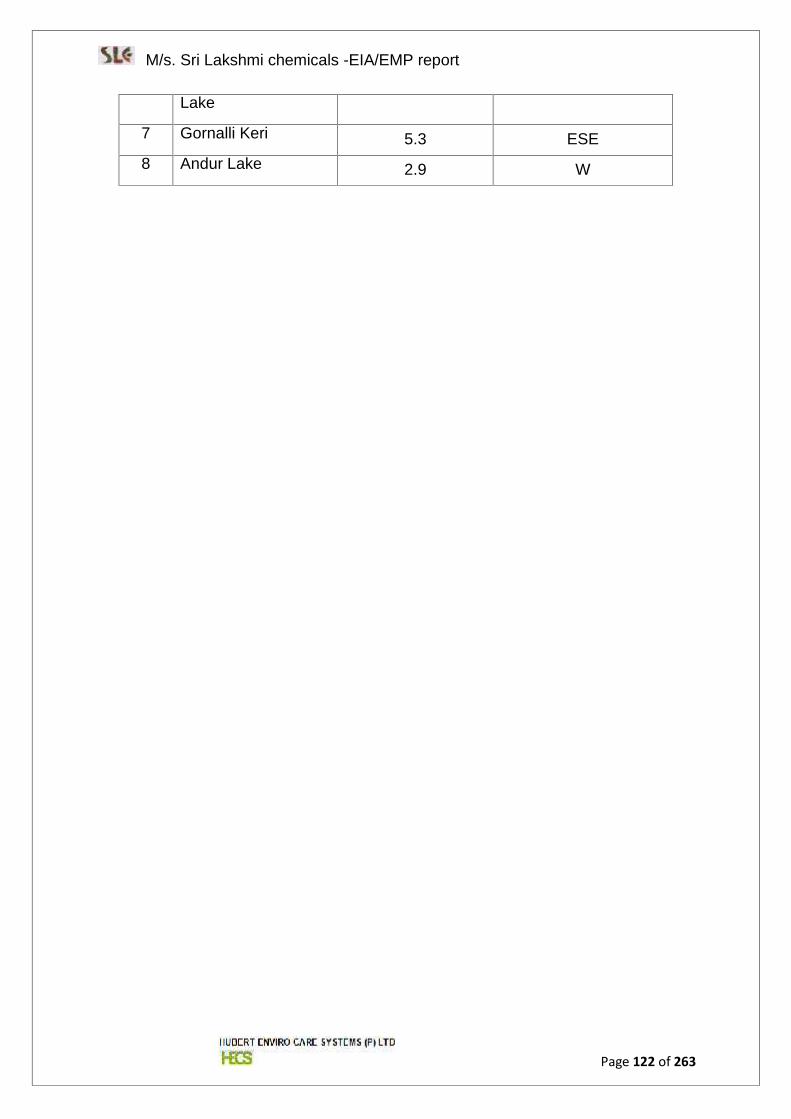
M/s. Sri Lakshmi chemicals -EIA/EMP report
Page 122 of 263
Lake
7 Gornalli Keri 5.3 ESE8 Andur Lake 2.9 W
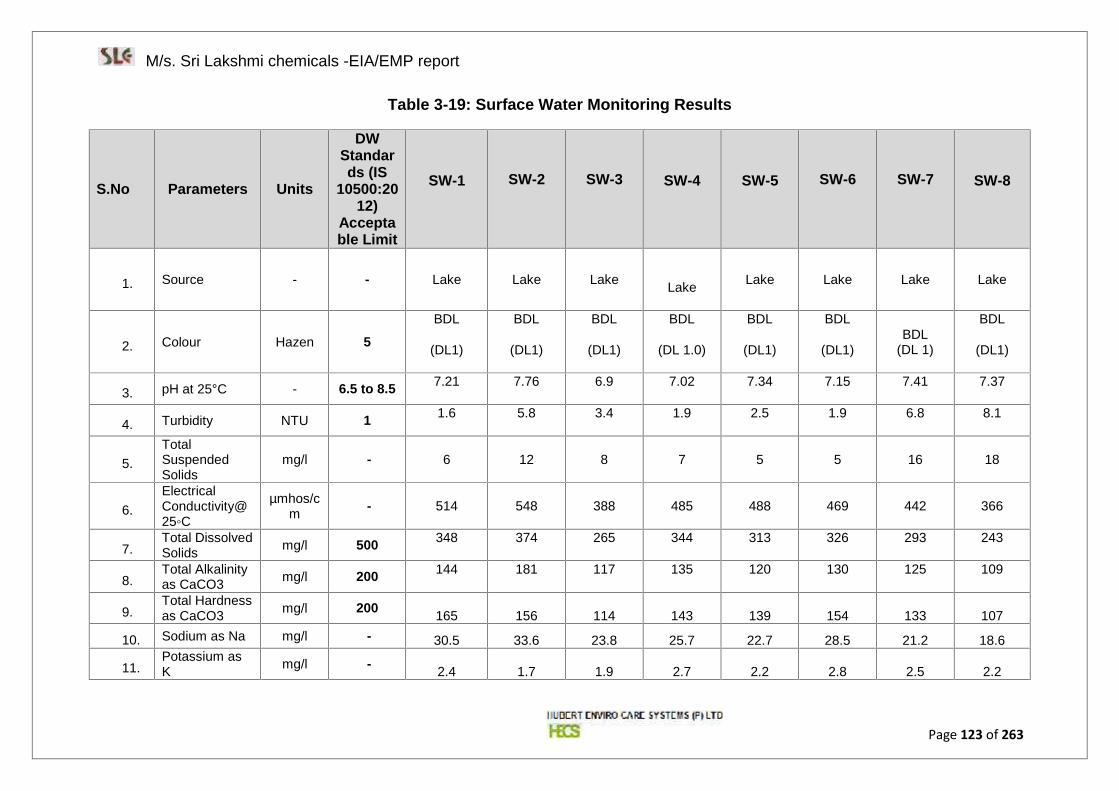
M/s. Sri Lakshmi chemicals -EIA/EMP report
Page 123 of 263
Table 3-19: Surface Water Monitoring Results
S.No Parameters Units
DWStandards (IS
10500:2012)
Acceptable Limit
SW-1 SW-2 SW-3 SW-4 SW-5 SW-6 SW-7 SW-8
1. Source - - Lake Lake Lake Lake Lake Lake Lake Lake
2. Colour Hazen 5BDL
(DL1)
BDL
(DL1)
BDL
(DL1)
BDL
(DL 1.0)
BDL
(DL1)
BDL
(DL1)BDL
(DL 1)
BDL
(DL1)
3. pH at 25°C - 6.5 to 8.5 7.21 7.76 6.9 7.02 7.34 7.15 7.41 7.37
4. Turbidity NTU 1 1.6 5.8 3.4 1.9 2.5 1.9 6.8 8.1
5.TotalSuspendedSolids
mg/l - 6 12 8 7 5 5 16 18
6.ElectricalConductivity@25◦C
µmhos/cm - 514 548 388 485 488 469 442 366
7.Total DissolvedSolids mg/l 500 348 374 265 344 313 326 293 243
8.Total Alkalinityas CaCO3 mg/l 200 144 181 117 135 120 130 125 109
9.Total Hardnessas CaCO3 mg/l 200 165 156 114 143 139 154 133 107
10. Sodium as Na mg/l - 30.5 33.6 23.8 25.7 22.7 28.5 21.2 18.6
11.Potassium asK mg/l - 2.4 1.7 1.9 2.7 2.2 2.8 2.5 2.2
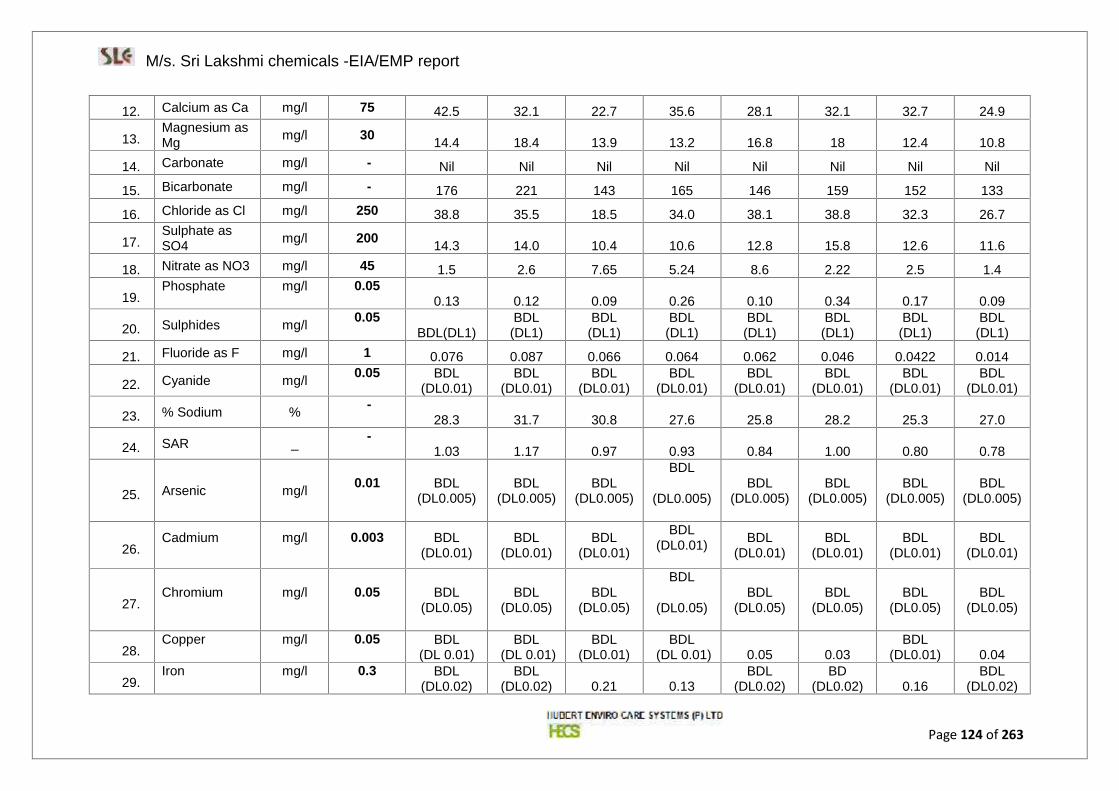
M/s. Sri Lakshmi chemicals -EIA/EMP report
Page 124 of 263
12. Calcium as Ca mg/l 75 42.5 32.1 22.7 35.6 28.1 32.1 32.7 24.9
13.Magnesium asMg mg/l 30 14.4 18.4 13.9 13.2 16.8 18 12.4 10.8
14. Carbonate mg/l - Nil Nil Nil Nil Nil Nil Nil Nil
15. Bicarbonate mg/l - 176 221 143 165 146 159 152 133
16. Chloride as Cl mg/l 250 38.8 35.5 18.5 34.0 38.1 38.8 32.3 26.7
17.Sulphate asSO4 mg/l 200 14.3 14.0 10.4 10.6 12.8 15.8 12.6 11.6
18. Nitrate as NO3 mg/l 45 1.5 2.6 7.65 5.24 8.6 2.22 2.5 1.4
19.Phosphate mg/l 0.05
0.13 0.12 0.09 0.26 0.10 0.34 0.17 0.09
20. Sulphides mg/l 0.05BDL(DL1)
BDL(DL1)
BDL(DL1)
BDL(DL1)
BDL(DL1)
BDL(DL1)
BDL(DL1)
BDL(DL1)
21. Fluoride as F mg/l 1 0.076 0.087 0.066 0.064 0.062 0.046 0.0422 0.014
22. Cyanide mg/l 0.05 BDL(DL0.01)
BDL(DL0.01)
BDL(DL0.01)
BDL(DL0.01)
BDL(DL0.01)
BDL(DL0.01)
BDL(DL0.01)
BDL(DL0.01)
23. % Sodium % -28.3 31.7 30.8 27.6 25.8 28.2 25.3 27.0
24. SAR _ -1.03 1.17 0.97 0.93 0.84 1.00 0.80 0.78
25. Arsenic mg/l 0.01 BDL(DL0.005)
BDL(DL0.005)
BDL(DL0.005)
BDL
(DL0.005)BDL
(DL0.005)BDL
(DL0.005)BDL
(DL0.005)BDL
(DL0.005)
26.Cadmium mg/l 0.003 BDL
(DL0.01)BDL
(DL0.01)BDL
(DL0.01)
BDL(DL0.01) BDL
(DL0.01)BDL
(DL0.01)BDL
(DL0.01)BDL
(DL0.01)
27.Chromium mg/l 0.05 BDL
(DL0.05)BDL
(DL0.05)BDL
(DL0.05)
BDL
(DL0.05)BDL
(DL0.05)BDL
(DL0.05)BDL
(DL0.05)BDL
(DL0.05)
28.Copper mg/l 0.05 BDL
(DL 0.01)BDL
(DL 0.01)BDL
(DL0.01)BDL
(DL 0.01) 0.05 0.03BDL
(DL0.01) 0.04
29.Iron mg/l 0.3 BDL
(DL0.02)BDL
(DL0.02) 0.21 0.13BDL
(DL0.02)BD
(DL0.02) 0.16BDL
(DL0.02)
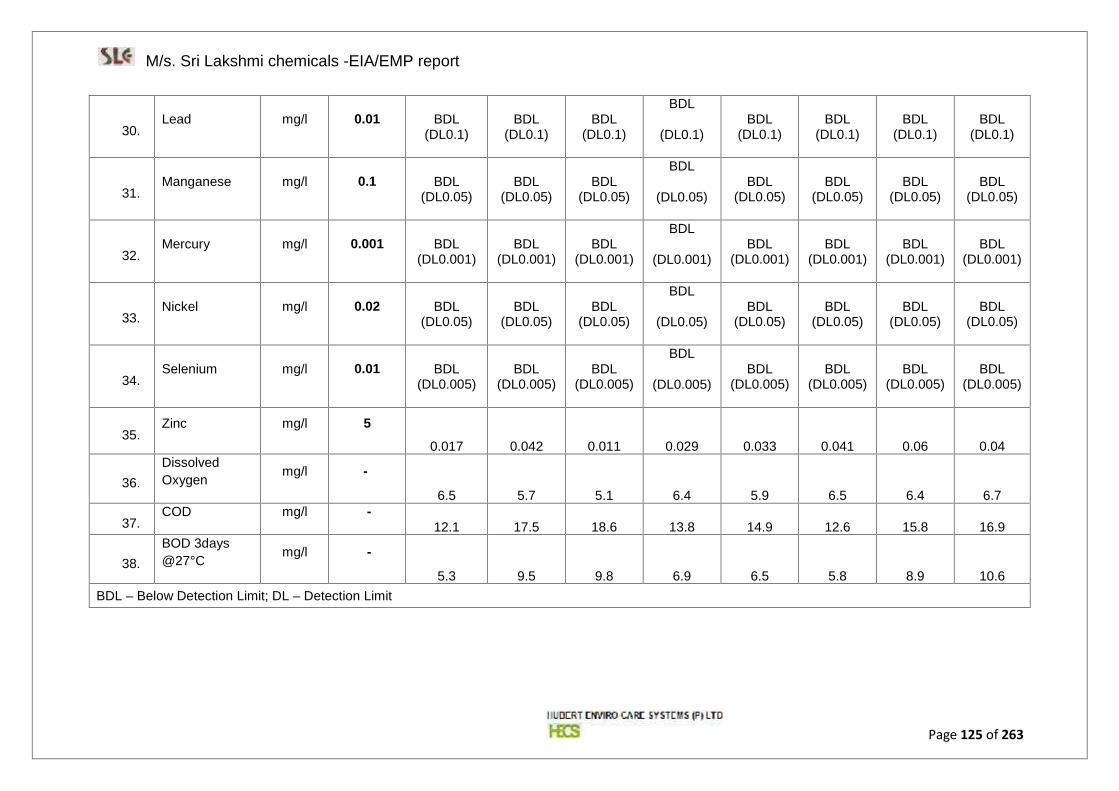
M/s. Sri Lakshmi chemicals -EIA/EMP report
Page 125 of 263
30.Lead mg/l 0.01 BDL
(DL0.1)BDL
(DL0.1)BDL
(DL0.1)
BDL
(DL0.1)BDL
(DL0.1)BDL
(DL0.1)BDL
(DL0.1)BDL
(DL0.1)
31.Manganese mg/l 0.1 BDL
(DL0.05)BDL
(DL0.05)BDL
(DL0.05)
BDL
(DL0.05)BDL
(DL0.05)BDL
(DL0.05)BDL
(DL0.05)BDL
(DL0.05)
32.Mercury mg/l 0.001 BDL
(DL0.001)BDL
(DL0.001)BDL
(DL0.001)
BDL
(DL0.001)BDL
(DL0.001)BDL
(DL0.001)BDL
(DL0.001)BDL
(DL0.001)
33.Nickel mg/l 0.02 BDL
(DL0.05)BDL
(DL0.05)BDL
(DL0.05)
BDL
(DL0.05)BDL
(DL0.05)BDL
(DL0.05)BDL
(DL0.05)BDL
(DL0.05)
34.Selenium mg/l 0.01 BDL
(DL0.005)BDL
(DL0.005)BDL
(DL0.005)
BDL
(DL0.005)BDL
(DL0.005)BDL
(DL0.005)BDL
(DL0.005)BDL
(DL0.005)
35.Zinc mg/l 5
0.017 0.042 0.011 0.029 0.033 0.041 0.06 0.04
36.DissolvedOxygen mg/l -
6.5 5.7 5.1 6.4 5.9 6.5 6.4 6.7
37.COD mg/l -
12.1 17.5 18.6 13.8 14.9 12.6 15.8 16.9
38.BOD 3days@27°C mg/l -
5.3 9.5 9.8 6.9 6.5 5.8 8.9 10.6BDL – Below Detection Limit; DL – Detection Limit

M/s. Sri Lakshmi chemicals -EIA/EMP report
Page 126 of 263
3.10.1.2 Results and Discussions
Summary of analytical results
i. In the surface water the pH varies between 6.9-7.76, which are
meeting the IS 10500:2012 for Drinking Water.
ii. The Total Dissolved Solids range varies between 243 mg/l – 374 mg/l
for the surface water. The TDS values are within the acceptable limit of
IS 10500:2012.
iii. The desirable limit of the chloride content is 250mg/l and permissible
limit is 1000 mg/l. The chloride content in the surface water for study
area is ranges between 18.5 mg/l – 38.8 mg/l.
iv. The desirable limit of the sulphate content is 200mg/l and permissible
limit is 400mg/l. The sulphate content of the surface water of the study
area varies between 10.4 mg/l – 15.8 mg/l meeting the desirable limit
of the IS 10500: 2012.
v. The Total hardness ranges is between 107 mg/l - 165 mg/l, within the
acceptable limit of IS 10500: 2012.
3.10.2 Ground water resources
The resource estimation and categorization is carried out as per the
recommendations of ‘Ground Water Resources Estimation Methodology - 97
(GEM -97) considering water shed as a unit. Water shed and hydrological
boundaries do not match with the administrative boundaries. As a result
different parts of taluk fall in different watersheds having different stages of
ground water development and categorization. Pro-rata approach to
consolidate the watershed data into Talukwise data gives only details on
ground water resource, draft, and additional irrigation potential. Pro rata
approach cannot be applied for taluk, as a unit, as far as stage of
development and categorization is concerned. It is observed that Aurad and
Humanabad taluks are completely under safe category. 88% of Bhalki and
91% of Basavakalyan taluks are safe and 79% of Bidar taluk is safe while rest
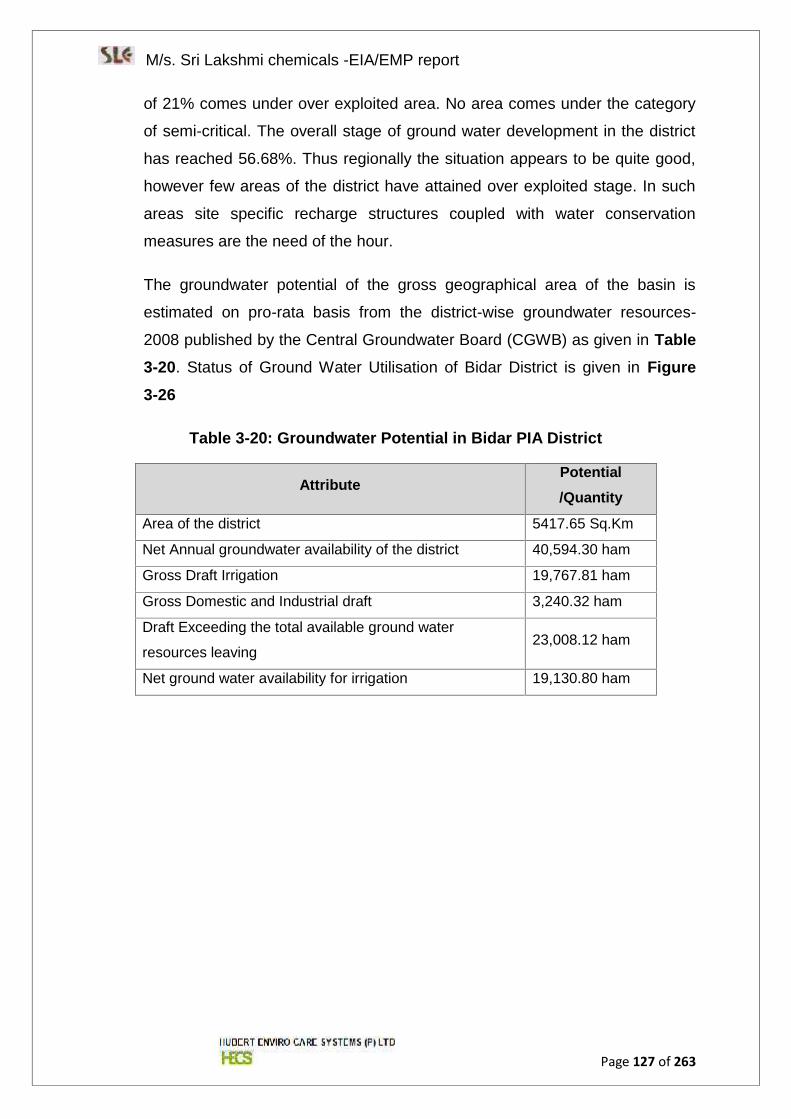
M/s. Sri Lakshmi chemicals -EIA/EMP report
Page 127 of 263
of 21% comes under over exploited area. No area comes under the category
of semi-critical. The overall stage of ground water development in the district
has reached 56.68%. Thus regionally the situation appears to be quite good,
however few areas of the district have attained over exploited stage. In such
areas site specific recharge structures coupled with water conservation
measures are the need of the hour.
The groundwater potential of the gross geographical area of the basin is
estimated on pro-rata basis from the district-wise groundwater resources-
2008 published by the Central Groundwater Board (CGWB) as given in Table3-20. Status of Ground Water Utilisation of Bidar District is given in Figure3-26
Table 3-20: Groundwater Potential in Bidar PIA District
AttributePotential/Quantity
Area of the district 5417.65 Sq.Km
Net Annual groundwater availability of the district 40,594.30 ham
Gross Draft Irrigation 19,767.81 ham
Gross Domestic and Industrial draft 3,240.32 ham
Draft Exceeding the total available ground water
resources leaving23,008.12 ham
Net ground water availability for irrigation 19,130.80 ham
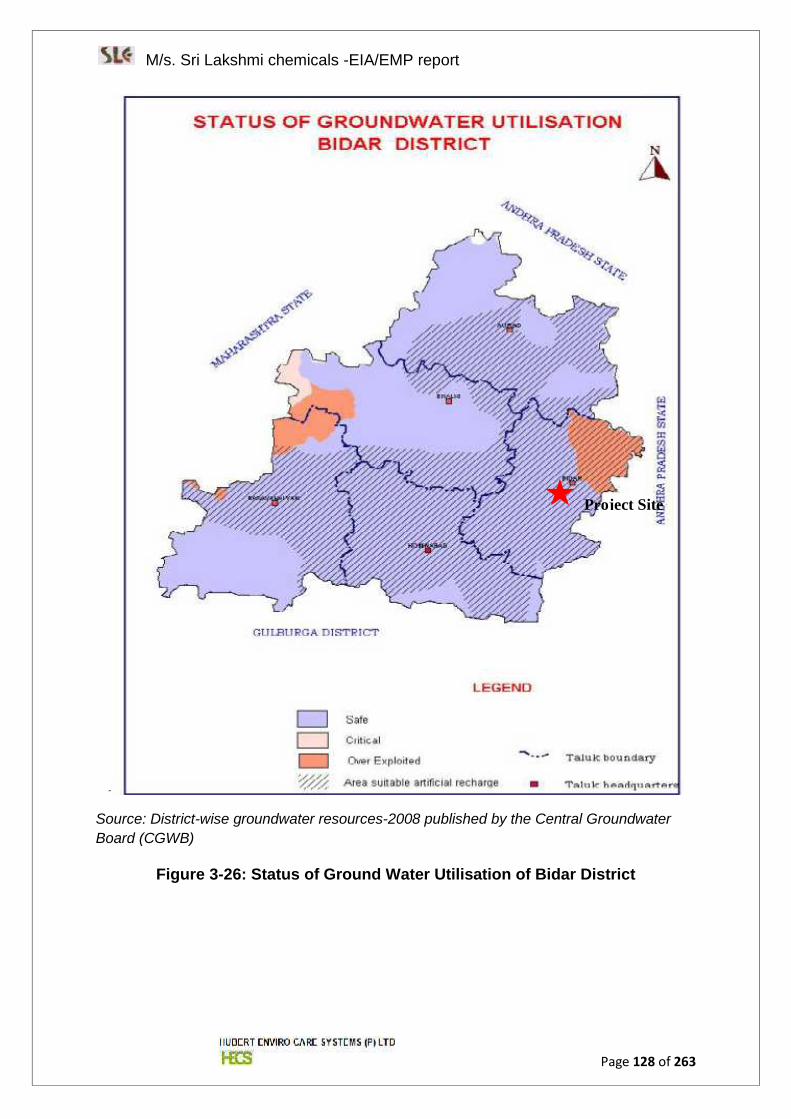
M/s. Sri Lakshmi chemicals -EIA/EMP report
Page 128 of 263
Source: District-wise groundwater resources-2008 published by the Central GroundwaterBoard (CGWB)
Figure 3-26: Status of Ground Water Utilisation of Bidar District
Project Site
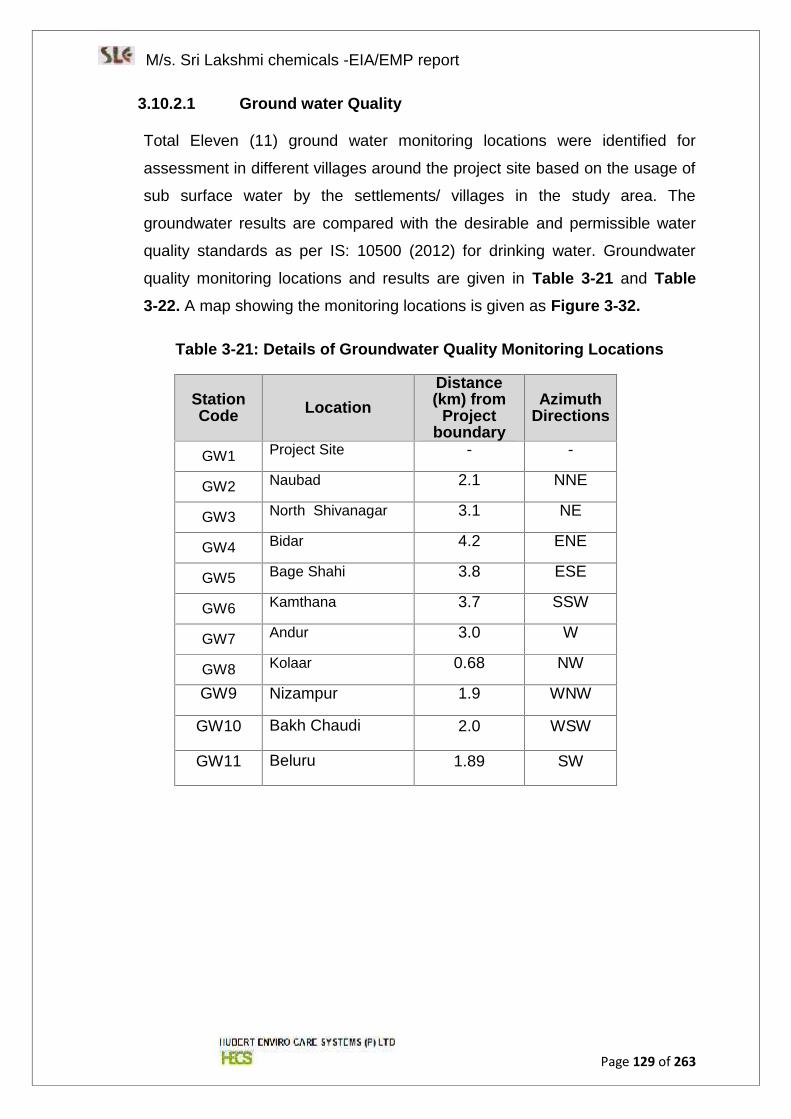
M/s. Sri Lakshmi chemicals -EIA/EMP report
Page 129 of 263
3.10.2.1 Ground water Quality
Total Eleven (11) ground water monitoring locations were identified for
assessment in different villages around the project site based on the usage of
sub surface water by the settlements/ villages in the study area. The
groundwater results are compared with the desirable and permissible water
quality standards as per IS: 10500 (2012) for drinking water. Groundwater
quality monitoring locations and results are given in Table 3-21 and Table3-22. A map showing the monitoring locations is given as Figure 3-32.
Table 3-21: Details of Groundwater Quality Monitoring Locations
StationCode Location
Distance(km) from
Projectboundary
AzimuthDirections
GW1 Project Site - -
GW2 Naubad 2.1 NNE
GW3 North Shivanagar 3.1 NE
GW4 Bidar 4.2 ENE
GW5 Bage Shahi 3.8 ESE
GW6 Kamthana 3.7 SSW
GW7 Andur 3.0 W
GW8 Kolaar 0.68 NW
GW9 Nizampur 1.9 WNW
GW10 Bakh Chaudi 2.0 WSW
GW11 Beluru 1.89 SW
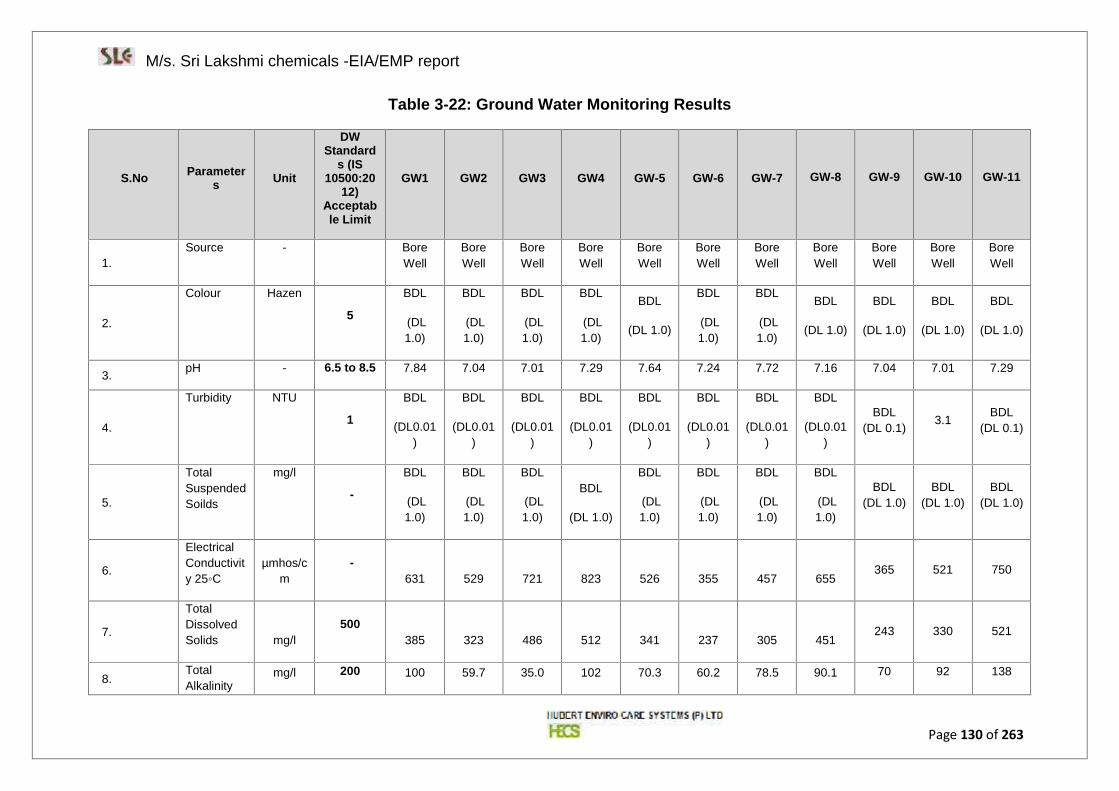
M/s. Sri Lakshmi chemicals -EIA/EMP report
Page 130 of 263
Table 3-22: Ground Water Monitoring Results
S.No Parameters Unit
DWStandard
s (IS10500:20
12)Acceptable Limit
GW1 GW2 GW3 GW4 GW-5 GW-6 GW-7 GW-8 GW-9 GW-10 GW-11
1.Source - Bore
WellBoreWell
BoreWell
BoreWell
BoreWell
BoreWell
BoreWell
BoreWell
BoreWell
BoreWell
BoreWell
2.
Colour Hazen
5
BDL
(DL1.0)
BDL
(DL1.0)
BDL
(DL1.0)
BDL
(DL1.0)
BDL
(DL 1.0)
BDL
(DL1.0)
BDL
(DL1.0)
BDL
(DL 1.0)
BDL
(DL 1.0)
BDL
(DL 1.0)
BDL
(DL 1.0)
3. pH - 6.5 to 8.5 7.84 7.04 7.01 7.29 7.64 7.24 7.72 7.16 7.04 7.01 7.29
4.
Turbidity NTU
1
BDL
(DL0.01)
BDL
(DL0.01)
BDL
(DL0.01)
BDL
(DL0.01)
BDL
(DL0.01)
BDL
(DL0.01)
BDL
(DL0.01)
BDL
(DL0.01)
BDL(DL 0.1)
3.1 BDL(DL 0.1)
5.
TotalSuspendedSoilds
mg/l
-
BDL
(DL1.0)
BDL
(DL1.0)
BDL
(DL1.0)
BDL
(DL 1.0)
BDL
(DL1.0)
BDL
(DL1.0)
BDL
(DL1.0)
BDL
(DL1.0)
BDL(DL 1.0)
BDL(DL 1.0)
BDL(DL 1.0)
6.
ElectricalConductivity 25◦C
µmhos/cm
-631 529 721 823 526 355 457 655
365 521 750
7.
TotalDissolvedSolids mg/l
500385 323 486 512 341 237 305 451
243 330 521
8.TotalAlkalinity
mg/l 200 100 59.7 35.0 102 70.3 60.2 78.5 90.1 70 92 138
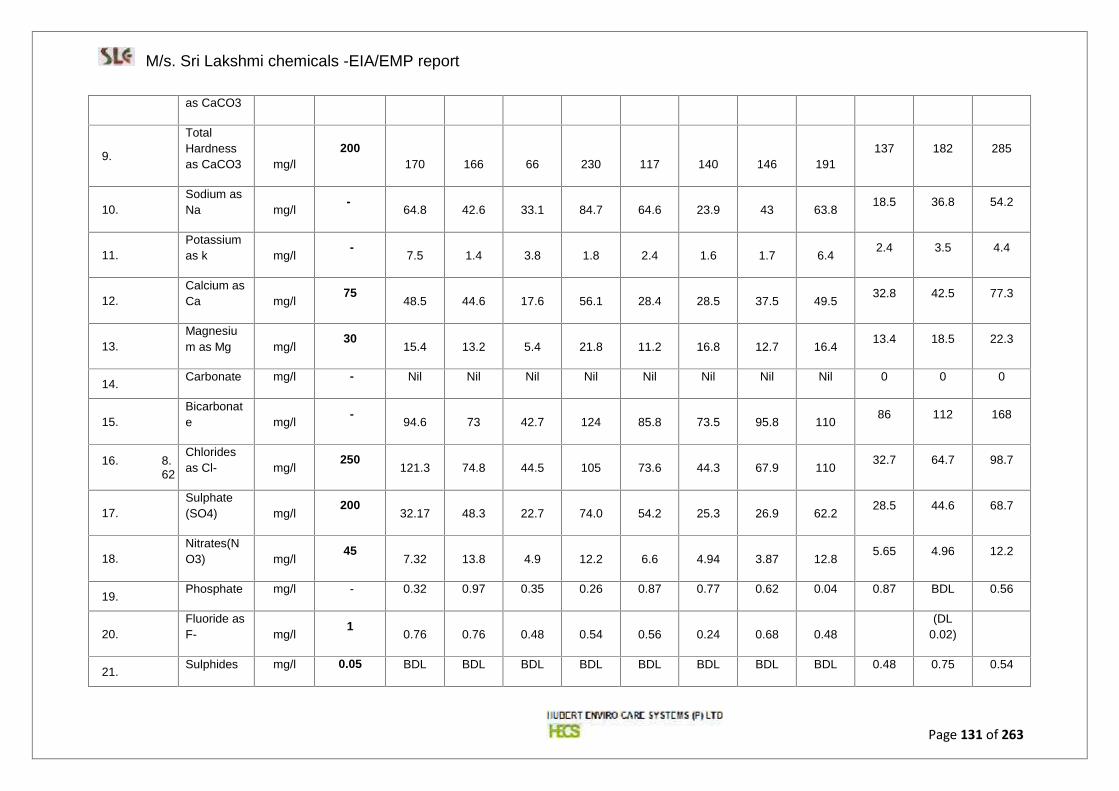
M/s. Sri Lakshmi chemicals -EIA/EMP report
Page 131 of 263
as CaCO3
9.
TotalHardnessas CaCO3 mg/l
200170 166 66 230 117 140 146 191
137 182 285
10.Sodium asNa mg/l
-64.8 42.6 33.1 84.7 64.6 23.9 43 63.8
18.5 36.8 54.2
11.Potassiumas k mg/l
-7.5 1.4 3.8 1.8 2.4 1.6 1.7 6.4
2.4 3.5 4.4
12.Calcium asCa mg/l
7548.5 44.6 17.6 56.1 28.4 28.5 37.5 49.5
32.8 42.5 77.3
13.Magnesium as Mg mg/l
3015.4 13.2 5.4 21.8 11.2 16.8 12.7 16.4
13.4 18.5 22.3
14. Carbonate mg/l - Nil Nil Nil Nil Nil Nil Nil Nil 0 0 0
15.Bicarbonate mg/l
-94.6 73 42.7 124 85.8 73.5 95.8 110 86 112 168
16. 8.62
Chloridesas Cl- mg/l
250121.3 74.8 44.5 105 73.6 44.3 67.9 110
32.7 64.7 98.7
17.Sulphate(SO4) mg/l
20032.17 48.3 22.7 74.0 54.2 25.3 26.9 62.2
28.5 44.6 68.7
18.Nitrates(NO3) mg/l
457.32 13.8 4.9 12.2 6.6 4.94 3.87 12.8
5.65 4.96 12.2
19. Phosphate mg/l - 0.32 0.97 0.35 0.26 0.87 0.77 0.62 0.04 0.87 BDL 0.56
20.Fluoride asF- mg/l
10.76 0.76 0.48 0.54 0.56 0.24 0.68 0.48
(DL0.02)
21. Sulphides mg/l 0.05 BDL BDL BDL BDL BDL BDL BDL BDL 0.48 0.75 0.54
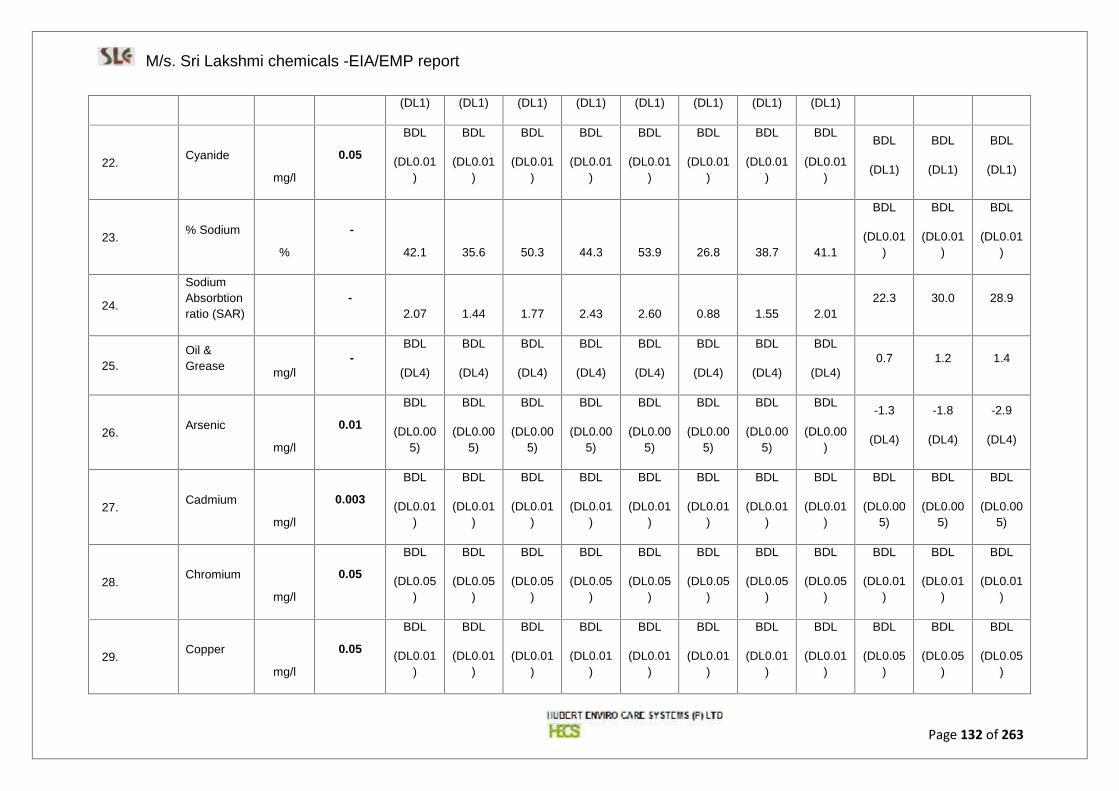
M/s. Sri Lakshmi chemicals -EIA/EMP report
Page 132 of 263
(DL1) (DL1) (DL1) (DL1) (DL1) (DL1) (DL1) (DL1)
22. Cyanide
mg/l
0.05
BDL
(DL0.01)
BDL
(DL0.01)
BDL
(DL0.01)
BDL
(DL0.01)
BDL
(DL0.01)
BDL
(DL0.01)
BDL
(DL0.01)
BDL
(DL0.01)
BDL
(DL1)
BDL
(DL1)
BDL
(DL1)
23. % Sodium
%
-
42.1 35.6 50.3 44.3 53.9 26.8 38.7 41.1
BDL
(DL0.01)
BDL
(DL0.01)
BDL
(DL0.01)
24.
SodiumAbsorbtionratio (SAR)
-2.07 1.44 1.77 2.43 2.60 0.88 1.55 2.01
22.3 30.0 28.9
25.Oil &Grease mg/l
-BDL
(DL4)
BDL
(DL4)
BDL
(DL4)
BDL
(DL4)
BDL
(DL4)
BDL
(DL4)
BDL
(DL4)
BDL
(DL4)0.7 1.2 1.4
26. Arsenic
mg/l
0.01
BDL
(DL0.005)
BDL
(DL0.005)
BDL
(DL0.005)
BDL
(DL0.005)
BDL
(DL0.005)
BDL
(DL0.005)
BDL
(DL0.005)
BDL
(DL0.00)
-1.3
(DL4)
-1.8
(DL4)
-2.9
(DL4)
27. Cadmium
mg/l
0.003
BDL
(DL0.01)
BDL
(DL0.01)
BDL
(DL0.01)
BDL
(DL0.01)
BDL
(DL0.01)
BDL
(DL0.01)
BDL
(DL0.01)
BDL
(DL0.01)
BDL
(DL0.005)
BDL
(DL0.005)
BDL
(DL0.005)
28. Chromium
mg/l
0.05
BDL
(DL0.05)
BDL
(DL0.05)
BDL
(DL0.05)
BDL
(DL0.05)
BDL
(DL0.05)
BDL
(DL0.05)
BDL
(DL0.05)
BDL
(DL0.05)
BDL
(DL0.01)
BDL
(DL0.01)
BDL
(DL0.01)
29. Copper
mg/l
0.05
BDL
(DL0.01)
BDL
(DL0.01)
BDL
(DL0.01)
BDL
(DL0.01)
BDL
(DL0.01)
BDL
(DL0.01)
BDL
(DL0.01)
BDL
(DL0.01)
BDL
(DL0.05)
BDL
(DL0.05)
BDL
(DL0.05)
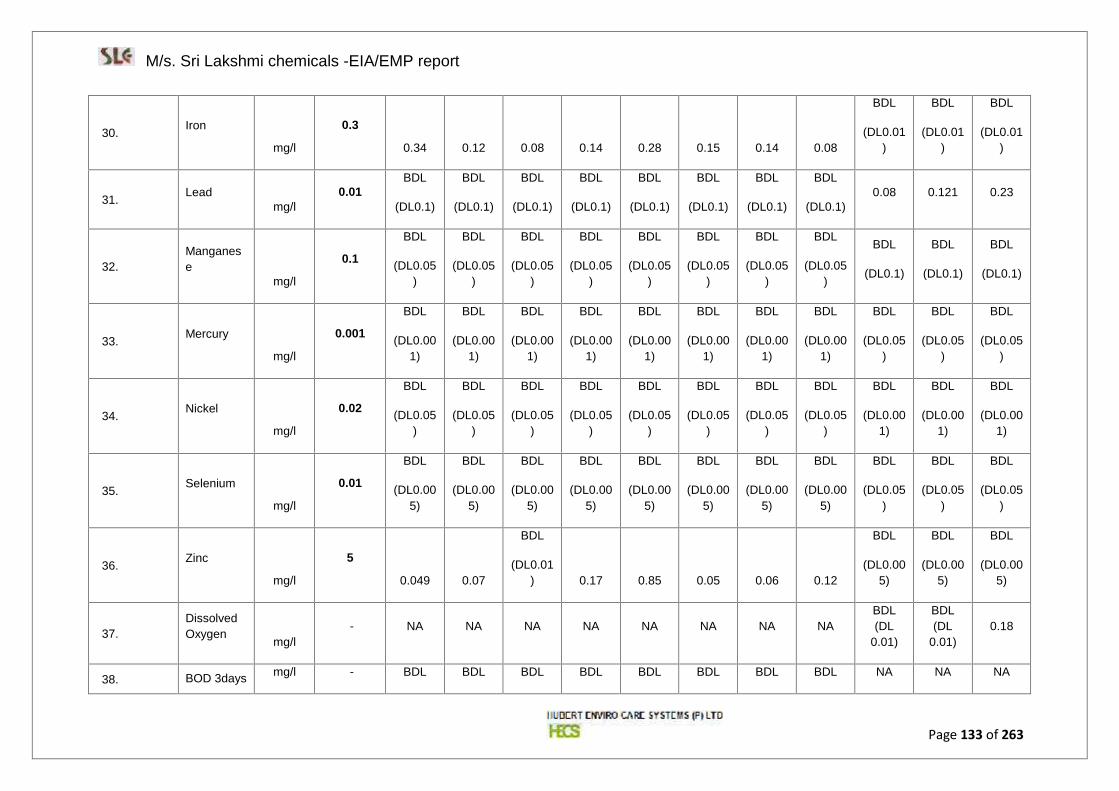
M/s. Sri Lakshmi chemicals -EIA/EMP report
Page 133 of 263
30. Iron
mg/l
0.3
0.34 0.12 0.08 0.14 0.28 0.15 0.14 0.08
BDL
(DL0.01)
BDL
(DL0.01)
BDL
(DL0.01)
31. Leadmg/l
0.01BDL
(DL0.1)
BDL
(DL0.1)
BDL
(DL0.1)
BDL
(DL0.1)
BDL
(DL0.1)
BDL
(DL0.1)
BDL
(DL0.1)
BDL
(DL0.1)0.08 0.121 0.23
32.Manganese
mg/l
0.1
BDL
(DL0.05)
BDL
(DL0.05)
BDL
(DL0.05)
BDL
(DL0.05)
BDL
(DL0.05)
BDL
(DL0.05)
BDL
(DL0.05)
BDL
(DL0.05)
BDL
(DL0.1)
BDL
(DL0.1)
BDL
(DL0.1)
33. Mercury
mg/l
0.001
BDL
(DL0.001)
BDL
(DL0.001)
BDL
(DL0.001)
BDL
(DL0.001)
BDL
(DL0.001)
BDL
(DL0.001)
BDL
(DL0.001)
BDL
(DL0.001)
BDL
(DL0.05)
BDL
(DL0.05)
BDL
(DL0.05)
34. Nickel
mg/l
0.02
BDL
(DL0.05)
BDL
(DL0.05)
BDL
(DL0.05)
BDL
(DL0.05)
BDL
(DL0.05)
BDL
(DL0.05)
BDL
(DL0.05)
BDL
(DL0.05)
BDL
(DL0.001)
BDL
(DL0.001)
BDL
(DL0.001)
35. Selenium
mg/l
0.01
BDL
(DL0.005)
BDL
(DL0.005)
BDL
(DL0.005)
BDL
(DL0.005)
BDL
(DL0.005)
BDL
(DL0.005)
BDL
(DL0.005)
BDL
(DL0.005)
BDL
(DL0.05)
BDL
(DL0.05)
BDL
(DL0.05)
36. Zinc
mg/l
5
0.049 0.07
BDL
(DL0.01) 0.17 0.85 0.05 0.06 0.12
BDL
(DL0.005)
BDL
(DL0.005)
BDL
(DL0.005)
37.DissolvedOxygen
mg/l- NA NA NA NA NA NA NA NA
BDL(DL
0.01)
BDL(DL
0.01)0.18
38. BOD 3days mg/l - BDL BDL BDL BDL BDL BDL BDL BDL NA NA NA
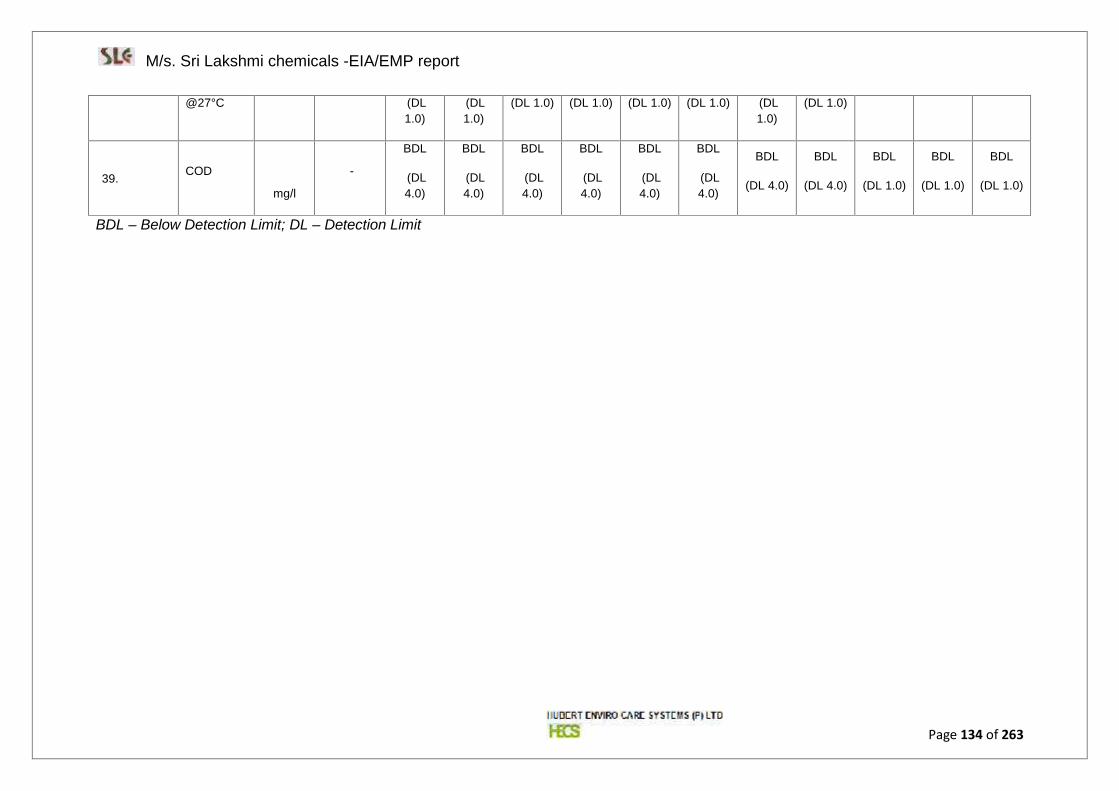
M/s. Sri Lakshmi chemicals -EIA/EMP report
Page 134 of 263
@27°C (DL1.0)
(DL1.0)
(DL 1.0) (DL 1.0) (DL 1.0) (DL 1.0) (DL1.0)
(DL 1.0)
39. COD
mg/l
-
BDL
(DL4.0)
BDL
(DL4.0)
BDL
(DL4.0)
BDL
(DL4.0)
BDL
(DL4.0)
BDL
(DL4.0)
BDL
(DL 4.0)
BDL
(DL 4.0)
BDL
(DL 1.0)
BDL
(DL 1.0)
BDL
(DL 1.0)
BDL – Below Detection Limit; DL – Detection Limit
M/s. Sri Lakshmi chemicals -EIA/EMP report
Page 135 of 263
3.10.2.2 Results and Discussions
A summary of analytical results are presented below:
vi. In the ground water the pH varies between 7.01-7.84 which are
meeting the IS 10500:2012 for Drinking Water.
vii. The Total Dissolved Solids range varies between 237 mg/l -521mg/l for
the ground water and few samples exceed the acceptable limit of IS
10500:2012
viii. The desirable limit of the chloride content is 250mg/l and permissible
limit is 1000 mg/l. The chloride content in the ground water for study
area ranges between 32.7 mg/l – 121.3 mg/l.
ix. The desirable limit of the sulphate content is 200mg/l and permissible
limit is 400mg/l. The sulphate content of the ground water of the study
area varies between 22.7 mg/l – 74 mg/l meeting the desirable limit of
the IS 10500: 2012.
x. The Total hardness ranges is between 66 mg/l -285 mg/l for few
samples acceptable limit of IS 10500: 2012 exceeds.
3.11 Soil as a resource and its Quality
Two types of soils founds in the district are Lateritic red soil and black cotton
soil. Aurad and Bhalki taluks have mainly black cotton soil. Bidar and
Humnabad taluks have mainly lateritic red soil. Basavakalyan taluk has both
types of soils.The predominant soils in the study area were Lateritic soils are
pale to bright red in colour and clay to clayey loam in nature.
3.11.1.1 Soil quality
In order to assess the quality of soil at different locations in the study area,
various land use categories were taken into account. Soil sampling was
carried out at Ten (10) locations in the study area. Soil analysis was carried
as per IS: 2720 methods. Soil quality monitoring locations & results are given
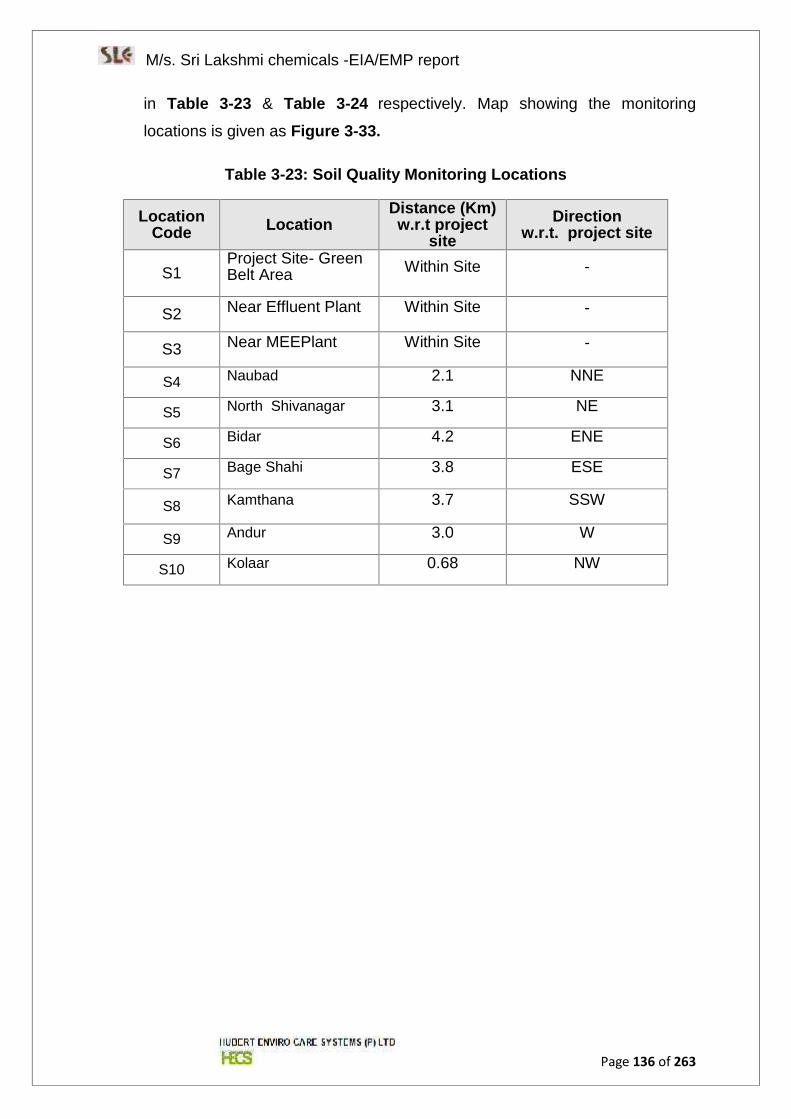
M/s. Sri Lakshmi chemicals -EIA/EMP report
Page 136 of 263
in Table 3-23 & Table 3-24 respectively. Map showing the monitoring
locations is given as Figure 3-33.
Table 3-23: Soil Quality Monitoring Locations
LocationCode Location
Distance (Km)w.r.t project
siteDirection
w.r.t. project site
S1Project Site- GreenBelt Area Within Site -
S2 Near Effluent Plant Within Site -
S3 Near MEEPlant Within Site -
S4 Naubad 2.1 NNE
S5 North Shivanagar 3.1 NE
S6 Bidar 4.2 ENE
S7 Bage Shahi 3.8 ESE
S8 Kamthana 3.7 SSW
S9 Andur 3.0 W
S10 Kolaar 0.68 NW
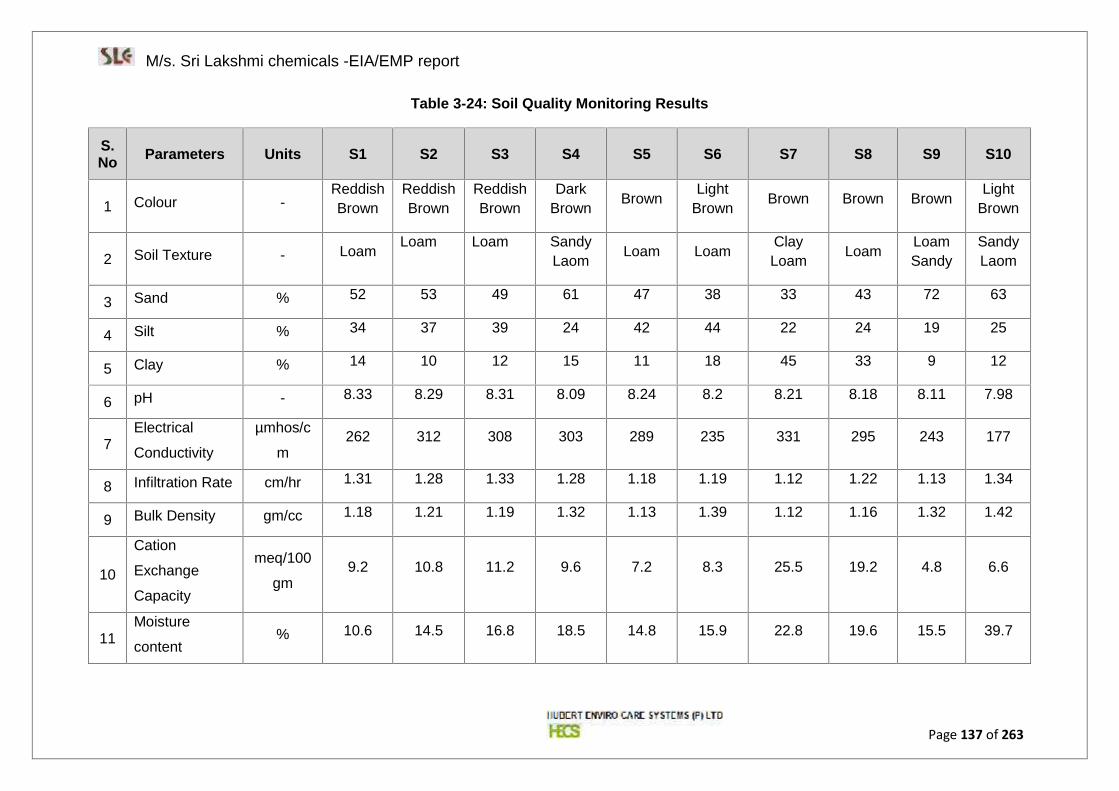
M/s. Sri Lakshmi chemicals -EIA/EMP report
Page 137 of 263
Table 3-24: Soil Quality Monitoring Results
S.No Parameters Units S1 S2 S3 S4 S5 S6 S7 S8 S9 S10
1 Colour -ReddishBrown
ReddishBrown
ReddishBrown
DarkBrown Brown Light
Brown Brown Brown Brown LightBrown
2 Soil Texture - Loam Loam Loam SandyLaom Loam Loam Clay
Loam Loam LoamSandy
SandyLaom
3 Sand % 52 53 49 61 47 38 33 43 72 63
4 Silt % 34 37 39 24 42 44 22 24 19 25
5 Clay % 14 10 12 15 11 18 45 33 9 12
6 pH - 8.33 8.29 8.31 8.09 8.24 8.2 8.21 8.18 8.11 7.98
7Electrical
Conductivity
µmhos/c
m262 312 308 303 289 235 331 295 243 177
8 Infiltration Rate cm/hr 1.31 1.28 1.33 1.28 1.18 1.19 1.12 1.22 1.13 1.34
9 Bulk Density gm/cc 1.18 1.21 1.19 1.32 1.13 1.39 1.12 1.16 1.32 1.42
10
Cation
Exchange
Capacity
meq/100
gm9.2 10.8 11.2 9.6 7.2 8.3 25.5 19.2 4.8 6.6
11Moisture
content% 10.6 14.5 16.8 18.5 14.8 15.9 22.8 19.6 15.5 39.7
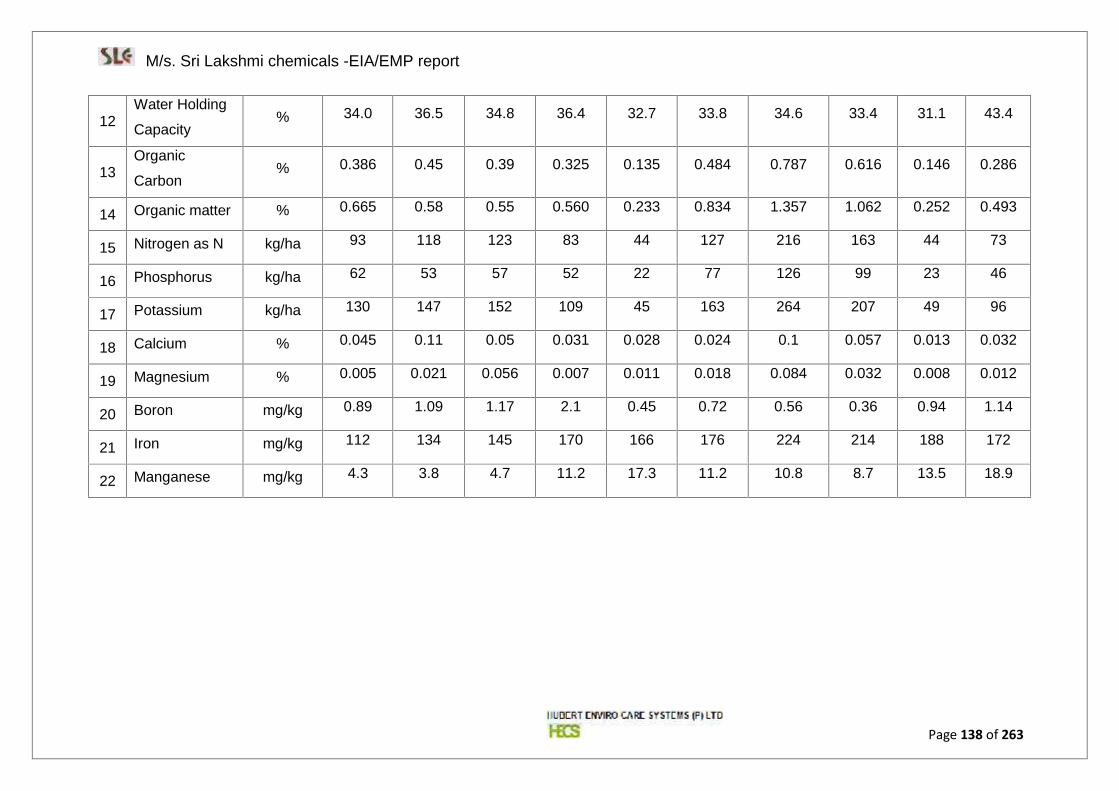
M/s. Sri Lakshmi chemicals -EIA/EMP report
Page 138 of 263
12Water Holding
Capacity% 34.0 36.5 34.8 36.4 32.7 33.8 34.6 33.4 31.1 43.4
13Organic
Carbon% 0.386 0.45 0.39 0.325 0.135 0.484 0.787 0.616 0.146 0.286
14 Organic matter % 0.665 0.58 0.55 0.560 0.233 0.834 1.357 1.062 0.252 0.493
15 Nitrogen as N kg/ha 93 118 123 83 44 127 216 163 44 73
16 Phosphorus kg/ha 62 53 57 52 22 77 126 99 23 46
17 Potassium kg/ha 130 147 152 109 45 163 264 207 49 96
18 Calcium % 0.045 0.11 0.05 0.031 0.028 0.024 0.1 0.057 0.013 0.032
19 Magnesium % 0.005 0.021 0.056 0.007 0.011 0.018 0.084 0.032 0.008 0.012
20 Boron mg/kg 0.89 1.09 1.17 2.1 0.45 0.72 0.56 0.36 0.94 1.14
21 Iron mg/kg 112 134 145 170 166 176 224 214 188 172
22 Manganese mg/kg 4.3 3.8 4.7 11.2 17.3 11.2 10.8 8.7 13.5 18.9
M/s. Sri Lakshmi chemicals -EIA/EMP report
Page 139 of 263
3.11.1.2 Results and Discussions
A summary of analytical results are presented below:
The pH of the soil samples ranged from 7.98-8.33.
Conductivity of the soil samples ranged from 177-331 μS/cm. As the
EC value is less than 2000 μS/cm, the soil is found to be non-saline in
nature
The water holding capacity of the soil samples varied from 31-43.4 (%).
Nitrogen content ranged from 44 kg/ha to 216kg/ha
Phosphorous ranged from 22 to 126 kg/ha
Potassium content ranges from 45 to 264 kg/ha
3.12 Flora & Fauna
Study of biological environment is one of the most important aspects for
Environmental Impact Assessment, in view of the need for conservation of
environmental quality and biodiversity.
Generally, biological communities are the good indicator of climatic and
edaphic factors. Studies on biological aspects of ecosystems are important in
environmental impact assessment for safety of natural flora and fauna
information on the impact of environmental stress on community structure
serves as an inexpensive and efficient early warning system to check the
damage to a particular ecosystem. The biological environment includes
mainly terrestrial ecosystem and aquatic ecosystem.
The study of terrestrial ecology within the study area of 10 Km radius has
been carried out through field investigation as well as Secondary data
collected.
3.12.1 Flora
This section describes terrestrial ecology of the area based on
reconnaissance survey and information gathered from secondary data
available for the area. List of of flora reported/observed in the study area is
given in Table 3-25
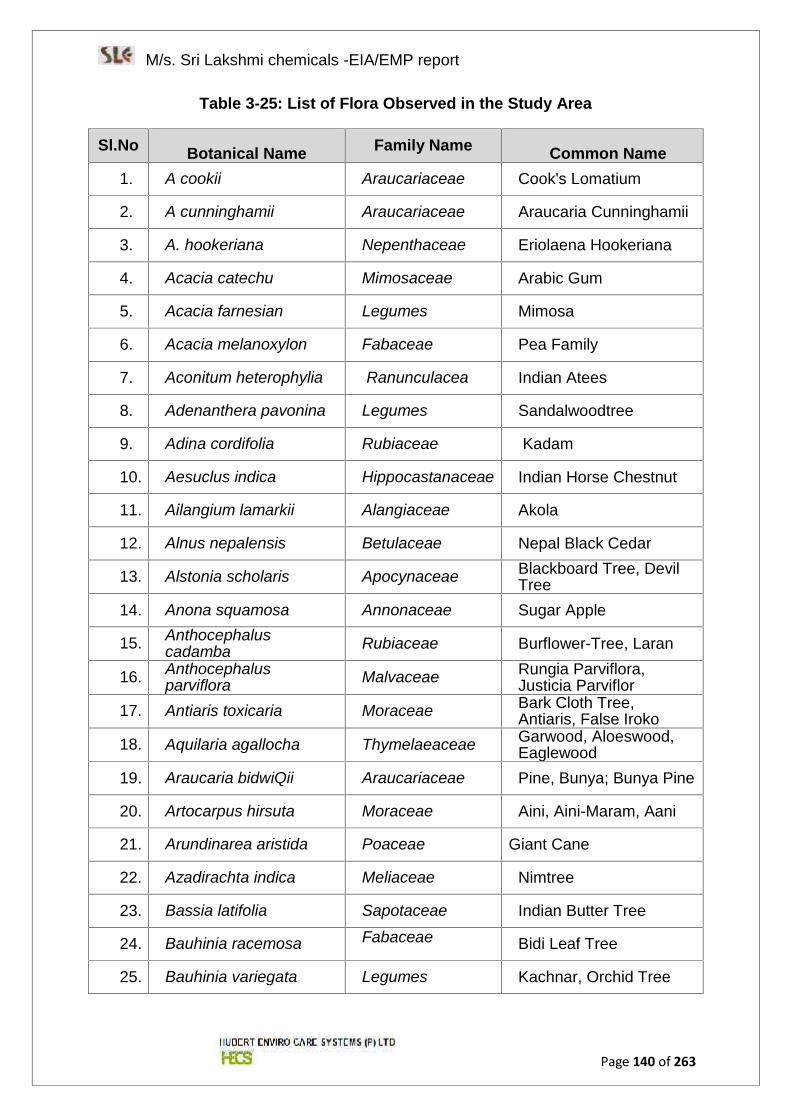
M/s. Sri Lakshmi chemicals -EIA/EMP report
Page 140 of 263
Table 3-25: List of Flora Observed in the Study Area
Sl.No Botanical Name Family Name Common Name1. A cookii Araucariaceae Cook's Lomatium
2. A cunninghamii Araucariaceae Araucaria Cunninghamii
3. A. hookeriana Nepenthaceae Eriolaena Hookeriana
4. Acacia catechu Mimosaceae Arabic Gum
5. Acacia farnesian Legumes Mimosa
6. Acacia melanoxylon Fabaceae Pea Family
7. Aconitum heterophylia Ranunculacea Indian Atees
8. Adenanthera pavonina Legumes Sandalwoodtree
9. Adina cordifolia Rubiaceae Kadam
10. Aesuclus indica Hippocastanaceae Indian Horse Chestnut
11. Ailangium lamarkii Alangiaceae Akola
12. Alnus nepalensis Betulaceae Nepal Black Cedar
13. Alstonia scholaris Apocynaceae Blackboard Tree, DevilTree
14. Anona squamosa Annonaceae Sugar Apple
15. Anthocephaluscadamba Rubiaceae Burflower-Tree, Laran
16. Anthocephalusparviflora Malvaceae Rungia Parviflora,
Justicia Parviflor17. Antiaris toxicaria Moraceae Bark Cloth Tree,
Antiaris, False Iroko18. Aquilaria agallocha Thymelaeaceae Garwood, Aloeswood,
Eaglewood19. Araucaria bidwiQii Araucariaceae Pine, Bunya; Bunya Pine
20. Artocarpus hirsuta Moraceae Aini, Aini-Maram, Aani
21. Arundinarea aristida Poaceae Giant Cane
22. Azadirachta indica Meliaceae Nimtree
23. Bassia latifolia Sapotaceae Indian Butter Tree
24. Bauhinia racemosa Fabaceae Bidi Leaf Tree
25. Bauhinia variegata Legumes Kachnar, Orchid Tree
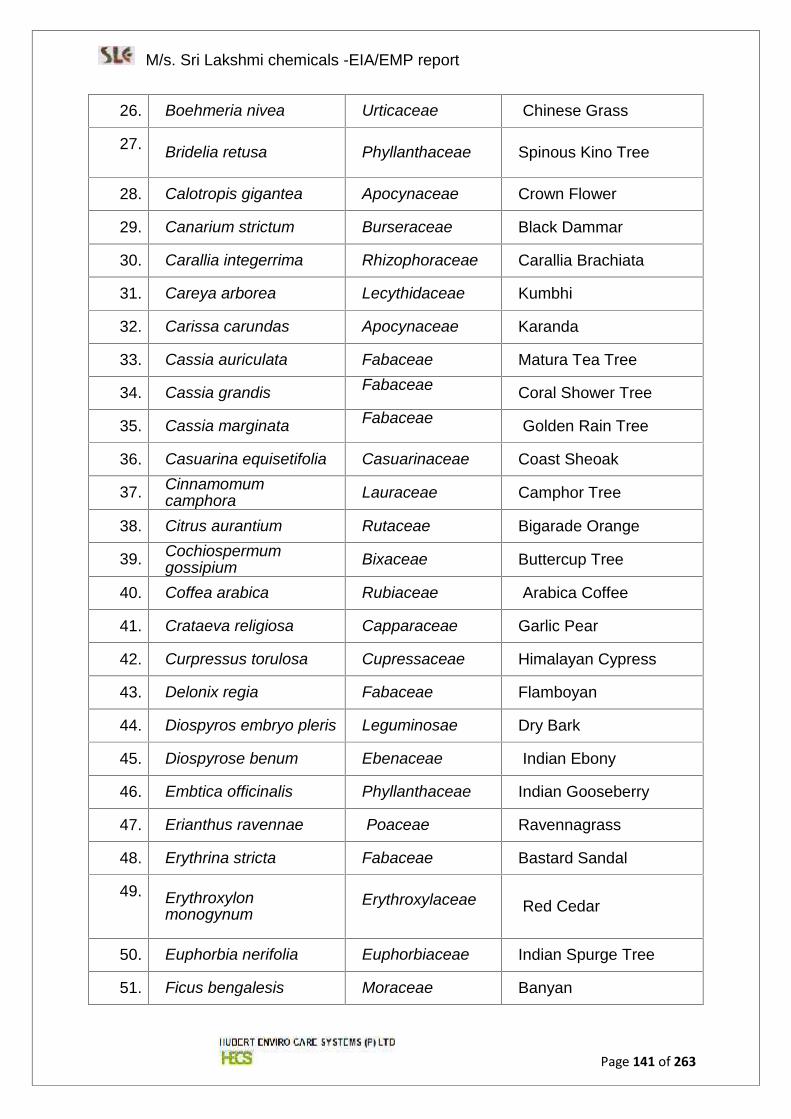
M/s. Sri Lakshmi chemicals -EIA/EMP report
Page 141 of 263
26. Boehmeria nivea Urticaceae Chinese Grass
27. Bridelia retusa Phyllanthaceae Spinous Kino Tree
28. Calotropis gigantea Apocynaceae Crown Flower
29. Canarium strictum Burseraceae Black Dammar
30. Carallia integerrima Rhizophoraceae Carallia Brachiata
31. Careya arborea Lecythidaceae Kumbhi
32. Carissa carundas Apocynaceae Karanda
33. Cassia auriculata Fabaceae Matura Tea Tree
34. Cassia grandis Fabaceae Coral Shower Tree
35. Cassia marginata Fabaceae Golden Rain Tree
36. Casuarina equisetifolia Casuarinaceae Coast Sheoak
37. Cinnamomumcamphora Lauraceae Camphor Tree
38. Citrus aurantium Rutaceae Bigarade Orange
39. Cochiospermumgossipium Bixaceae Buttercup Tree
40. Coffea arabica Rubiaceae Arabica Coffee
41. Crataeva religiosa Capparaceae Garlic Pear
42. Curpressus torulosa Cupressaceae Himalayan Cypress
43. Delonix regia Fabaceae Flamboyan
44. Diospyros embryo pleris Leguminosae Dry Bark
45. Diospyrose benum Ebenaceae Indian Ebony
46. Embtica officinalis Phyllanthaceae Indian Gooseberry
47. Erianthus ravennae Poaceae Ravennagrass
48. Erythrina stricta Fabaceae Bastard Sandal
49. Erythroxylonmonogynum
Erythroxylaceae Red Cedar
50. Euphorbia nerifolia Euphorbiaceae Indian Spurge Tree
51. Ficus bengalesis Moraceae Banyan
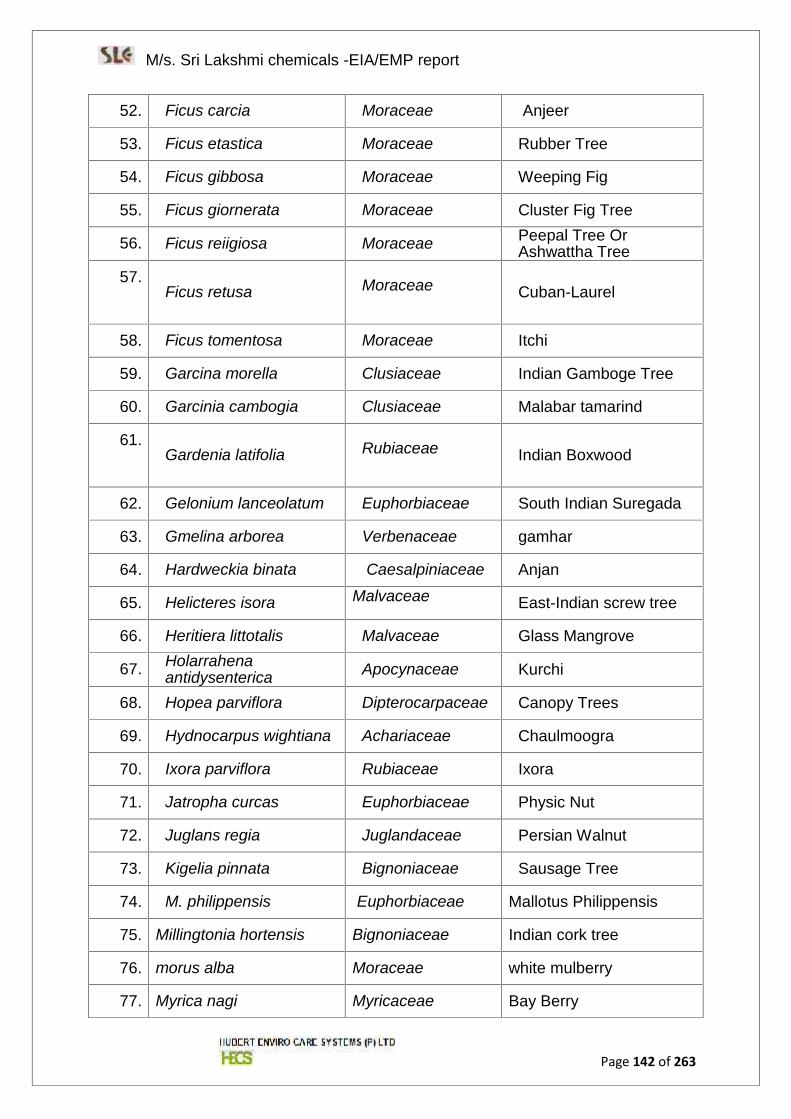
M/s. Sri Lakshmi chemicals -EIA/EMP report
Page 142 of 263
52. Ficus carcia Moraceae Anjeer
53. Ficus etastica Moraceae Rubber Tree
54. Ficus gibbosa Moraceae Weeping Fig
55. Ficus giornerata Moraceae Cluster Fig Tree
56. Ficus reiigiosa Moraceae Peepal Tree OrAshwattha Tree
57.Ficus retusa Moraceae Cuban-Laurel
58. Ficus tomentosa Moraceae Itchi
59. Garcina morella Clusiaceae Indian Gamboge Tree
60. Garcinia cambogia Clusiaceae Malabar tamarind
61.Gardenia latifolia Rubiaceae Indian Boxwood
62. Gelonium lanceolatum Euphorbiaceae South Indian Suregada
63. Gmelina arborea Verbenaceae gamhar
64. Hardweckia binata Caesalpiniaceae Anjan
65. Helicteres isora Malvaceae East-Indian screw tree
66. Heritiera littotalis Malvaceae Glass Mangrove
67. Holarrahenaantidysenterica Apocynaceae Kurchi
68. Hopea parviflora Dipterocarpaceae Canopy Trees
69. Hydnocarpus wightiana Achariaceae Chaulmoogra
70. Ixora parviflora Rubiaceae Ixora
71. Jatropha curcas Euphorbiaceae Physic Nut
72. Juglans regia Juglandaceae Persian Walnut
73. Kigelia pinnata Bignoniaceae Sausage Tree
74. M. philippensis Euphorbiaceae Mallotus Philippensis
75. Millingtonia hortensis Bignoniaceae Indian cork tree
76. morus alba Moraceae white mulberry
77. Myrica nagi Myricaceae Bay Berry
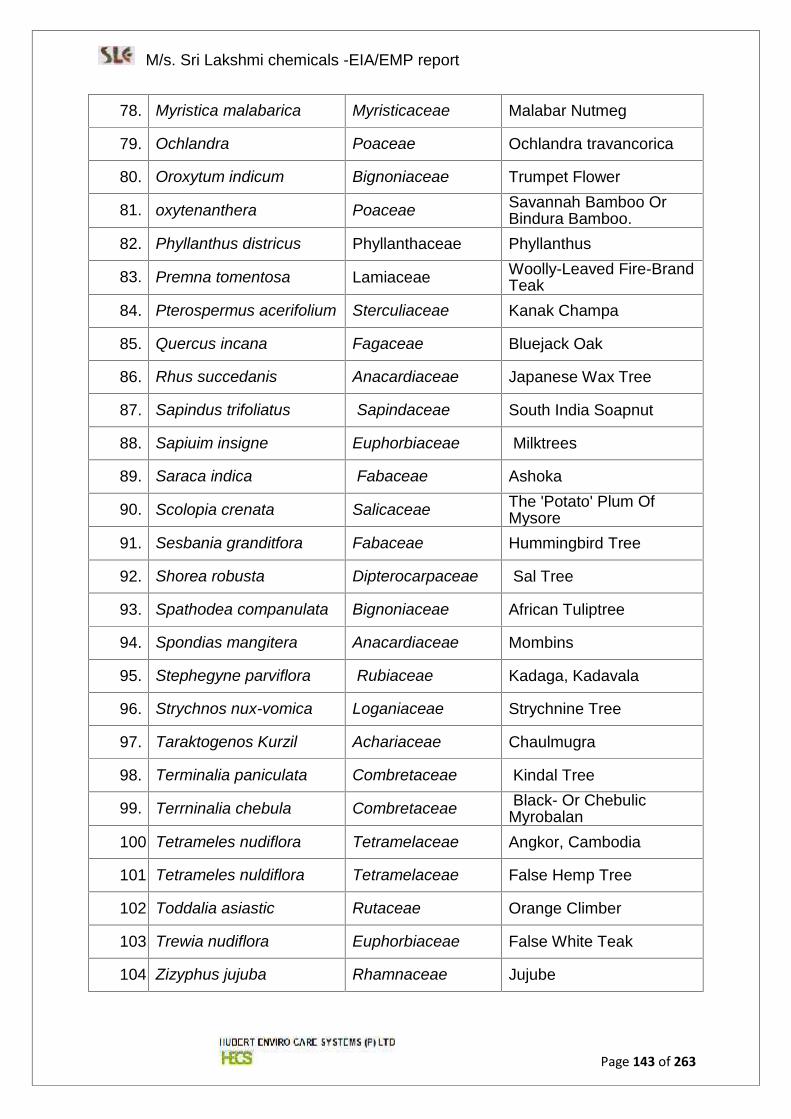
M/s. Sri Lakshmi chemicals -EIA/EMP report
Page 143 of 263
78. Myristica malabarica Myristicaceae Malabar Nutmeg
79. Ochlandra Poaceae Ochlandra travancorica
80. Oroxytum indicum Bignoniaceae Trumpet Flower
81. oxytenanthera Poaceae Savannah Bamboo OrBindura Bamboo.
82. Phyllanthus districus Phyllanthaceae Phyllanthus
83. Premna tomentosa Lamiaceae Woolly-Leaved Fire-BrandTeak
84. Pterospermus acerifolium Sterculiaceae Kanak Champa
85. Quercus incana Fagaceae Bluejack Oak
86. Rhus succedanis Anacardiaceae Japanese Wax Tree
87. Sapindus trifoliatus Sapindaceae South India Soapnut
88. Sapiuim insigne Euphorbiaceae Milktrees
89. Saraca indica Fabaceae Ashoka
90. Scolopia crenata Salicaceae The 'Potato' Plum OfMysore
91. Sesbania granditfora Fabaceae Hummingbird Tree
92. Shorea robusta Dipterocarpaceae Sal Tree
93. Spathodea companulata Bignoniaceae African Tuliptree
94. Spondias mangitera Anacardiaceae Mombins
95. Stephegyne parviflora Rubiaceae Kadaga, Kadavala
96. Strychnos nux-vomica Loganiaceae Strychnine Tree
97. Taraktogenos Kurzil Achariaceae Chaulmugra
98. Terminalia paniculata Combretaceae Kindal Tree
99. Terrninalia chebula Combretaceae Black- Or ChebulicMyrobalan
100. Tetrameles nudiflora Tetramelaceae Angkor, Cambodia
101. Tetrameles nuldiflora Tetramelaceae False Hemp Tree
102. Toddalia asiastic Rutaceae Orange Climber
103. Trewia nudiflora Euphorbiaceae False White Teak
104. Zizyphus jujuba Rhamnaceae Jujube
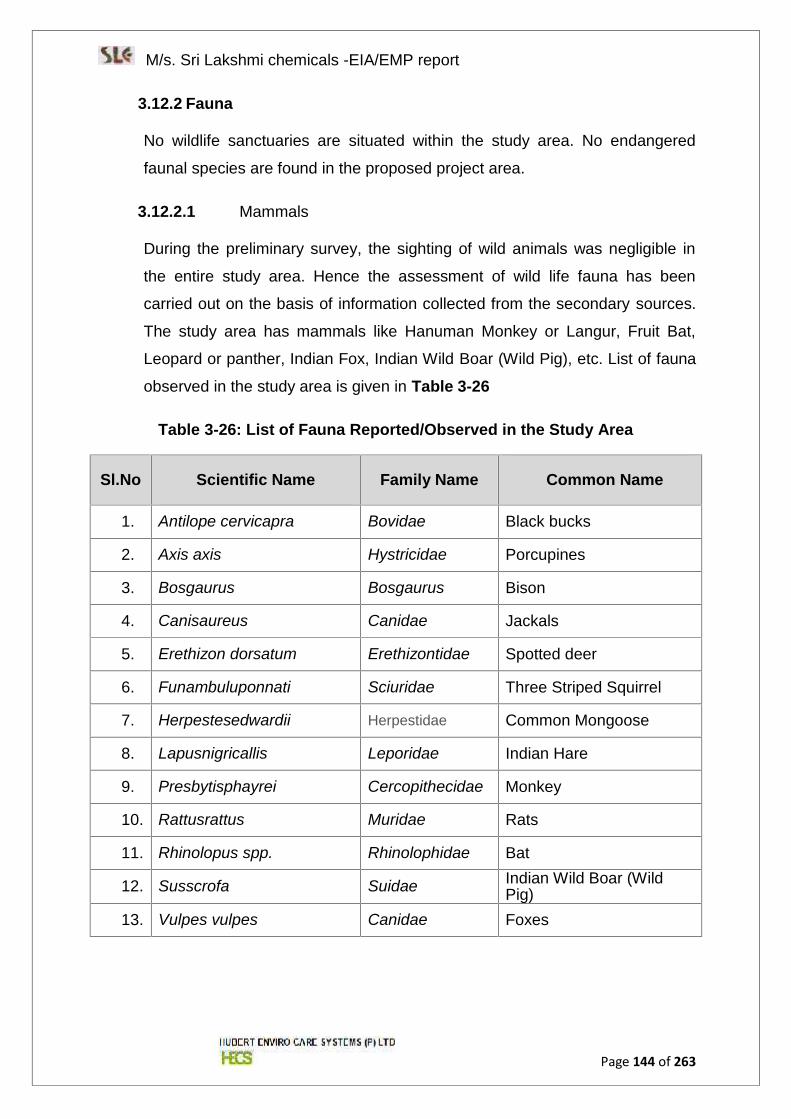
M/s. Sri Lakshmi chemicals -EIA/EMP report
Page 144 of 263
3.12.2 Fauna
No wildlife sanctuaries are situated within the study area. No endangered
faunal species are found in the proposed project area.
3.12.2.1 Mammals
During the preliminary survey, the sighting of wild animals was negligible in
the entire study area. Hence the assessment of wild life fauna has been
carried out on the basis of information collected from the secondary sources.
The study area has mammals like Hanuman Monkey or Langur, Fruit Bat,
Leopard or panther, Indian Fox, Indian Wild Boar (Wild Pig), etc. List of fauna
observed in the study area is given in Table 3-26
Table 3-26: List of Fauna Reported/Observed in the Study Area
Sl.No Scientific Name Family Name Common Name
1. Antilope cervicapra Bovidae Black bucks
2. Axis axis Hystricidae Porcupines
3. Bosgaurus Bosgaurus Bison
4. Canisaureus Canidae Jackals
5. Erethizon dorsatum Erethizontidae Spotted deer
6. Funambuluponnati Sciuridae Three Striped Squirrel
7. Herpestesedwardii Herpestidae Common Mongoose
8. Lapusnigricallis Leporidae Indian Hare
9. Presbytisphayrei Cercopithecidae Monkey
10. Rattusrattus Muridae Rats
11. Rhinolopus spp. Rhinolophidae Bat
12. Susscrofa Suidae Indian Wild Boar (WildPig)
13. Vulpes vulpes Canidae Foxes
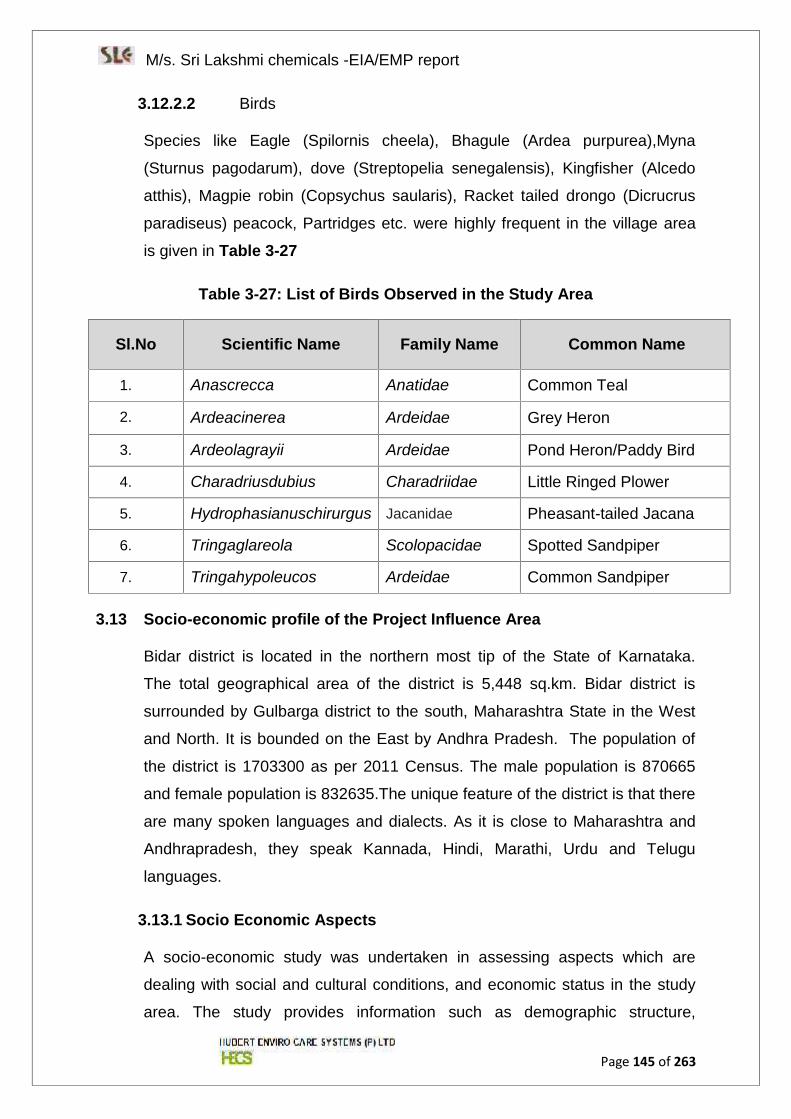
M/s. Sri Lakshmi chemicals -EIA/EMP report
Page 145 of 263
3.12.2.2 Birds
Species like Eagle (Spilornis cheela), Bhagule (Ardea purpurea),Myna
(Sturnus pagodarum), dove (Streptopelia senegalensis), Kingfisher (Alcedo
atthis), Magpie robin (Copsychus saularis), Racket tailed drongo (Dicrucrus
paradiseus) peacock, Partridges etc. were highly frequent in the village area
is given in Table 3-27
Table 3-27: List of Birds Observed in the Study Area
3.13 Socio-economic profile of the Project Influence Area
Bidar district is located in the northern most tip of the State of Karnataka.
The total geographical area of the district is 5,448 sq.km. Bidar district is
surrounded by Gulbarga district to the south, Maharashtra State in the West
and North. It is bounded on the East by Andhra Pradesh. The population of
the district is 1703300 as per 2011 Census. The male population is 870665
and female population is 832635.The unique feature of the district is that there
are many spoken languages and dialects. As it is close to Maharashtra and
Andhrapradesh, they speak Kannada, Hindi, Marathi, Urdu and Telugu
languages.
3.13.1 Socio Economic Aspects
A socio-economic study was undertaken in assessing aspects which are
dealing with social and cultural conditions, and economic status in the study
area. The study provides information such as demographic structure,
Sl.No Scientific Name Family Name Common Name
1. Anascrecca Anatidae Common Teal
2. Ardeacinerea Ardeidae Grey Heron
3. Ardeolagrayii Ardeidae Pond Heron/Paddy Bird
4. Charadriusdubius Charadriidae Little Ringed Plower
5. Hydrophasianuschirurgus Jacanidae Pheasant-tailed Jacana
6. Tringaglareola Scolopacidae Spotted Sandpiper
7. Tringahypoleucos Ardeidae Common Sandpiper
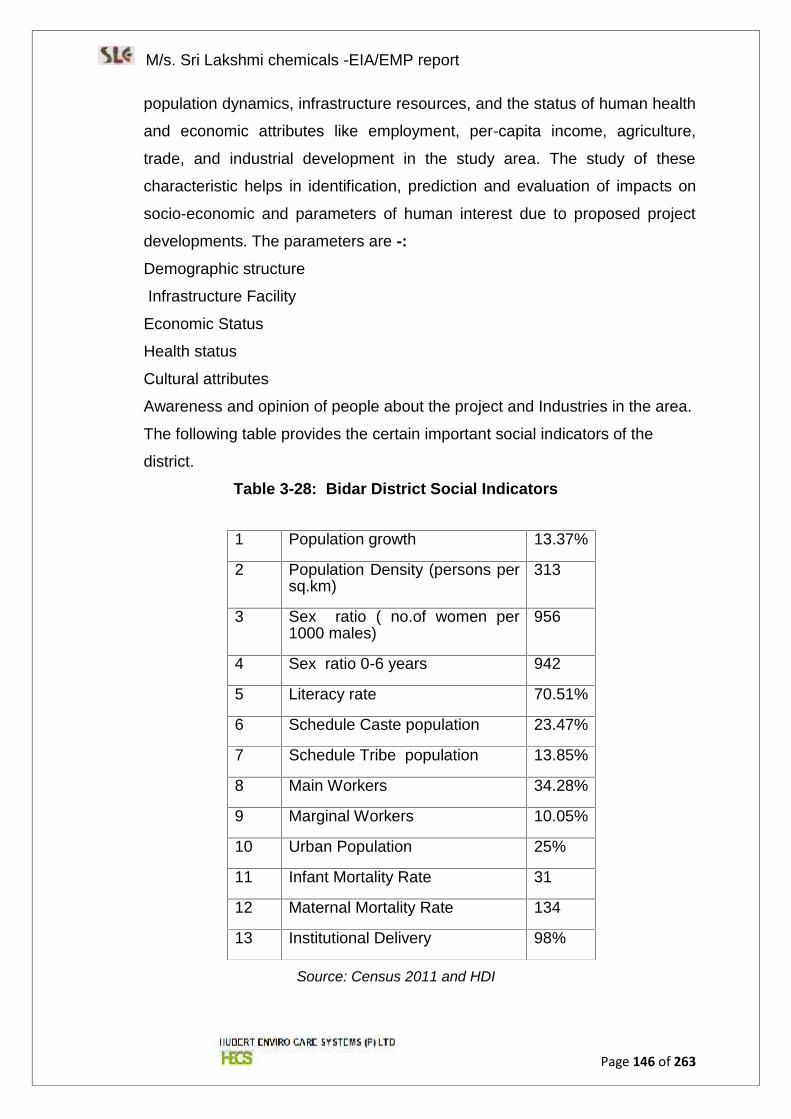
M/s. Sri Lakshmi chemicals -EIA/EMP report
Page 146 of 263
population dynamics, infrastructure resources, and the status of human health
and economic attributes like employment, per-capita income, agriculture,
trade, and industrial development in the study area. The study of these
characteristic helps in identification, prediction and evaluation of impacts on
socio-economic and parameters of human interest due to proposed project
developments. The parameters are -:Demographic structure
Infrastructure Facility
Economic Status
Health status
Cultural attributes
Awareness and opinion of people about the project and Industries in the area.
The following table provides the certain important social indicators of the
district.
Table 3-28: Bidar District Social Indicators
Source: Census 2011 and HDI
1 Population growth 13.37%
2 Population Density (persons persq.km)
313
3 Sex ratio ( no.of women per1000 males)
956
4 Sex ratio 0-6 years 942
5 Literacy rate 70.51%
6 Schedule Caste population 23.47%
7 Schedule Tribe population 13.85%
8 Main Workers 34.28%
9 Marginal Workers 10.05%
10 Urban Population 25%
11 Infant Mortality Rate 31
12 Maternal Mortality Rate 134
13 Institutional Delivery 98%
M/s. Sri Lakshmi chemicals -EIA/EMP report
Page 147 of 263
The district is rural in character as 75 percent of the population lives in rural
areas. Agriculture is the main contributor to the economy of the district. The
district has low industrial base. A major proportion of the area in the district is
not under irrigation. The proportion of net area irrigated to net area sown is
only 14.18%.
3.13.2 Socio economic Profile of the study area
Demographic Profile:
The study area has equal male (51.96%) and female (48.03%) population.
The child (0 to 6 years) population also has an equal share of male (51.45%)
and female (48.54%) population.
The area has 17.47% of Schedule Caste and 7.99% of the Scheduled Tribe
population.
The average size of the family is 5.
The following table shows the detailed demographic details of all the villages
in the study area is given in Table 3-29
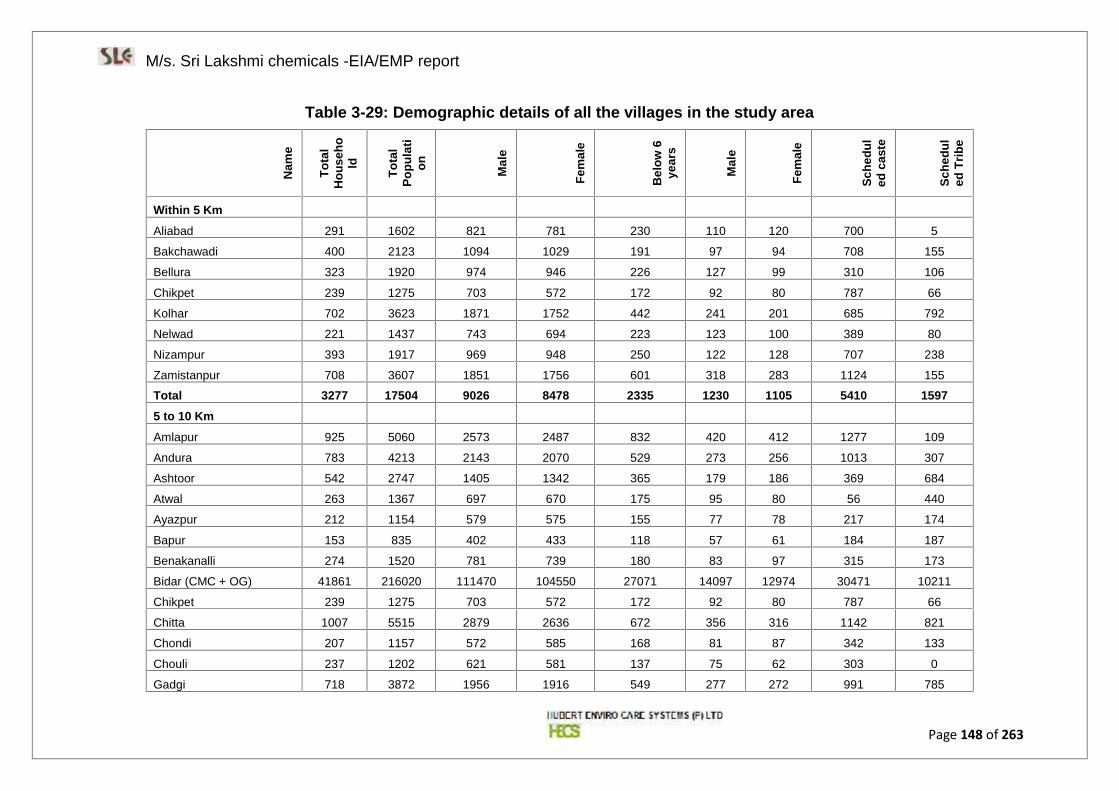
M/s. Sri Lakshmi chemicals -EIA/EMP report
Page 148 of 263
Table 3-29: Demographic details of all the villages in the study area
Nam
e
Tota
lH
ouse
hold
Tota
lPo
pula
tion Mal
e
Fem
ale
Bel
ow 6
year
s
Mal
e
Fem
ale
Sche
dul
ed c
aste
Sche
dul
ed T
ribe
Within 5 Km
Aliabad 291 1602 821 781 230 110 120 700 5
Bakchawadi 400 2123 1094 1029 191 97 94 708 155
Bellura 323 1920 974 946 226 127 99 310 106
Chikpet 239 1275 703 572 172 92 80 787 66
Kolhar 702 3623 1871 1752 442 241 201 685 792
Nelwad 221 1437 743 694 223 123 100 389 80
Nizampur 393 1917 969 948 250 122 128 707 238
Zamistanpur 708 3607 1851 1756 601 318 283 1124 155
Total 3277 17504 9026 8478 2335 1230 1105 5410 15975 to 10 Km
Amlapur 925 5060 2573 2487 832 420 412 1277 109
Andura 783 4213 2143 2070 529 273 256 1013 307
Ashtoor 542 2747 1405 1342 365 179 186 369 684
Atwal 263 1367 697 670 175 95 80 56 440
Ayazpur 212 1154 579 575 155 77 78 217 174
Bapur 153 835 402 433 118 57 61 184 187
Benakanalli 274 1520 781 739 180 83 97 315 173
Bidar (CMC + OG) 41861 216020 111470 104550 27071 14097 12974 30471 10211
Chikpet 239 1275 703 572 172 92 80 787 66
Chitta 1007 5515 2879 2636 672 356 316 1142 821
Chondi 207 1157 572 585 168 81 87 342 133
Chouli 237 1202 621 581 137 75 62 303 0
Gadgi 718 3872 1956 1916 549 277 272 991 785
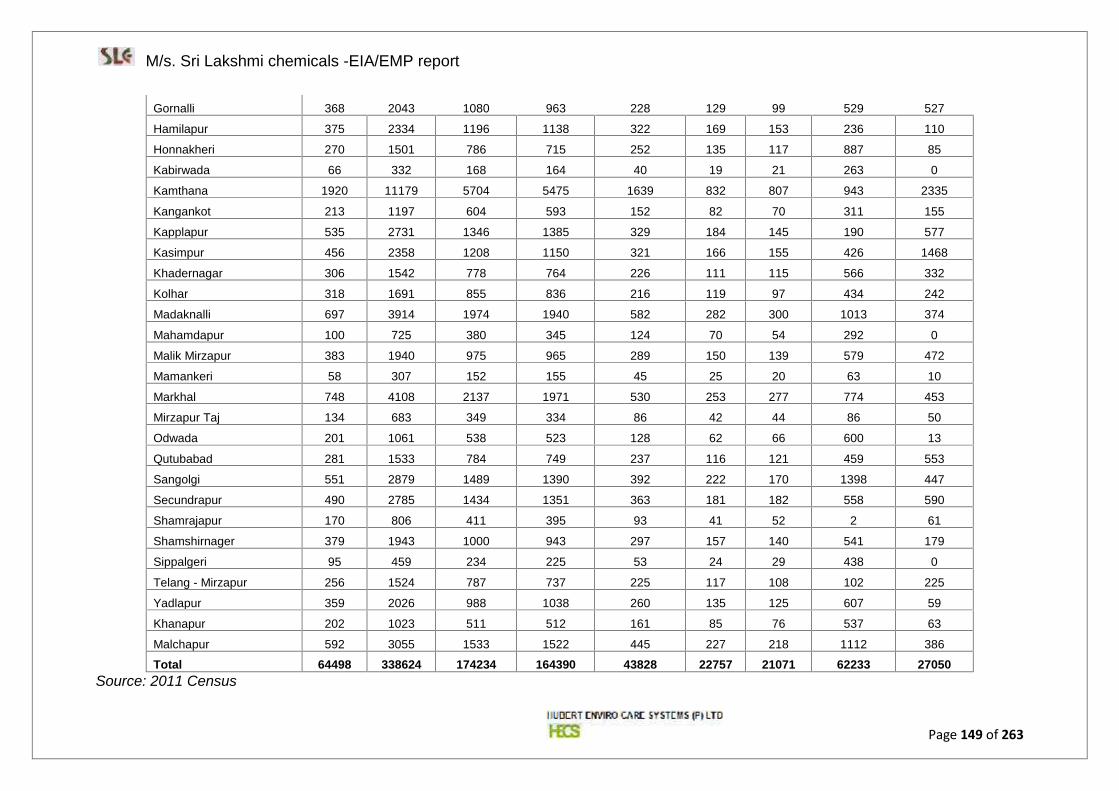
M/s. Sri Lakshmi chemicals -EIA/EMP report
Page 149 of 263
Gornalli 368 2043 1080 963 228 129 99 529 527
Hamilapur 375 2334 1196 1138 322 169 153 236 110
Honnakheri 270 1501 786 715 252 135 117 887 85
Kabirwada 66 332 168 164 40 19 21 263 0
Kamthana 1920 11179 5704 5475 1639 832 807 943 2335
Kangankot 213 1197 604 593 152 82 70 311 155
Kapplapur 535 2731 1346 1385 329 184 145 190 577
Kasimpur 456 2358 1208 1150 321 166 155 426 1468
Khadernagar 306 1542 778 764 226 111 115 566 332
Kolhar 318 1691 855 836 216 119 97 434 242
Madaknalli 697 3914 1974 1940 582 282 300 1013 374
Mahamdapur 100 725 380 345 124 70 54 292 0
Malik Mirzapur 383 1940 975 965 289 150 139 579 472
Mamankeri 58 307 152 155 45 25 20 63 10
Markhal 748 4108 2137 1971 530 253 277 774 453
Mirzapur Taj 134 683 349 334 86 42 44 86 50
Odwada 201 1061 538 523 128 62 66 600 13
Qutubabad 281 1533 784 749 237 116 121 459 553
Sangolgi 551 2879 1489 1390 392 222 170 1398 447
Secundrapur 490 2785 1434 1351 363 181 182 558 590
Shamrajapur 170 806 411 395 93 41 52 2 61
Shamshirnager 379 1943 1000 943 297 157 140 541 179
Sippalgeri 95 459 234 225 53 24 29 438 0
Telang - Mirzapur 256 1524 787 737 225 117 108 102 225
Yadlapur 359 2026 988 1038 260 135 125 607 59
Khanapur 202 1023 511 512 161 85 76 537 63
Malchapur 592 3055 1533 1522 445 227 218 1112 386
Total 64498 338624 174234 164390 43828 22757 21071 62233 27050Source: 2011 Census
M/s. Sri Lakshmi chemicals -EIA/EMP report
Page 150 of 263
3.13.2.1 Employment and Livelihood
The area is predominately agricultural based. Agriculture and its allied
activities like cattle rearing; agriculture products selling are their main income
sources. Of the total working population, 81.81% are the main workers as
they have regular job more than six months in a year. Only 24.22% of working
population involved in agricultural and agricultural related occupation.Since
the major portion of the Bidar town comes within the 10 Km radius, the
majority of the workers are non-agricultural activities. The following Table3-30 gives the picture of different workers categories.
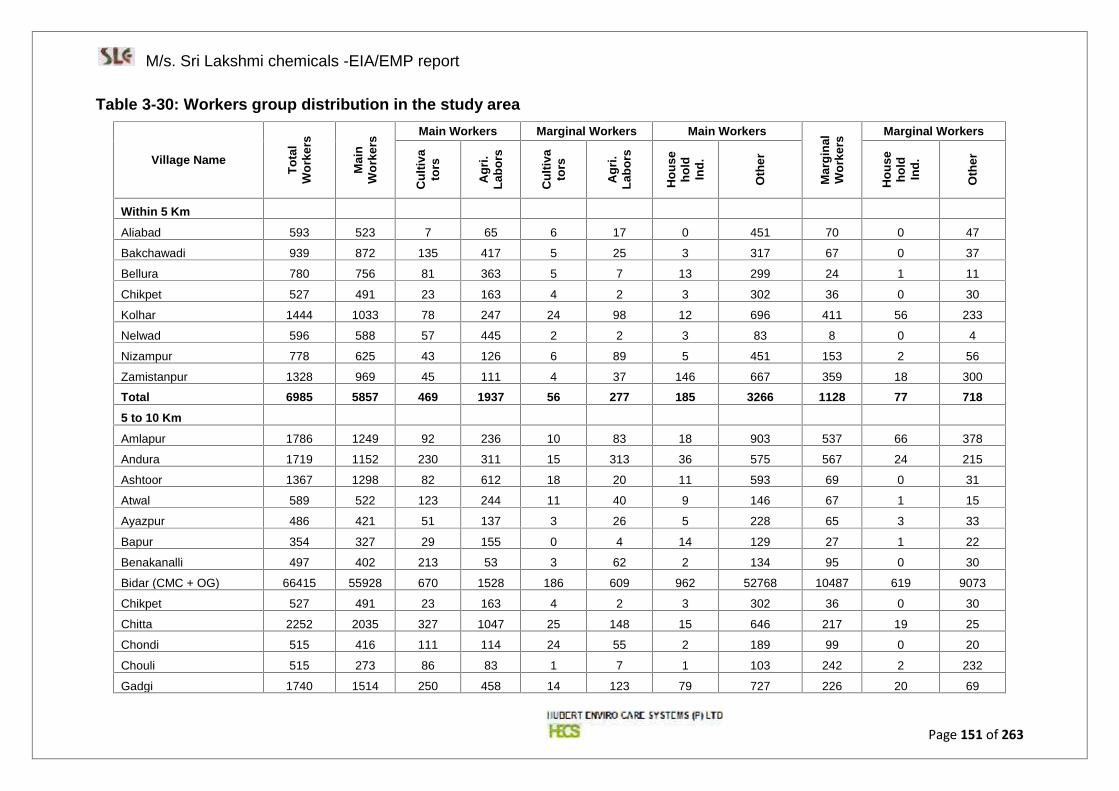
M/s. Sri Lakshmi chemicals -EIA/EMP report
Page 151 of 263
Table 3-30: Workers group distribution in the study area
Village Name
Tota
lW
orke
rs
Mai
nW
orke
rs
Main Workers Marginal Workers Main Workers
Mar
gina
lW
orke
rs
Marginal Workers
Cul
tiva
tors
Agr
i.La
bors
Cul
tiva
tors
Agr
i.La
bors
Hou
seho
ldIn
d.
Oth
er
Hou
seho
ldIn
d.
Oth
er
Within 5 Km
Aliabad 593 523 7 65 6 17 0 451 70 0 47
Bakchawadi 939 872 135 417 5 25 3 317 67 0 37
Bellura 780 756 81 363 5 7 13 299 24 1 11
Chikpet 527 491 23 163 4 2 3 302 36 0 30
Kolhar 1444 1033 78 247 24 98 12 696 411 56 233
Nelwad 596 588 57 445 2 2 3 83 8 0 4
Nizampur 778 625 43 126 6 89 5 451 153 2 56
Zamistanpur 1328 969 45 111 4 37 146 667 359 18 300
Total 6985 5857 469 1937 56 277 185 3266 1128 77 7185 to 10 Km
Amlapur 1786 1249 92 236 10 83 18 903 537 66 378
Andura 1719 1152 230 311 15 313 36 575 567 24 215
Ashtoor 1367 1298 82 612 18 20 11 593 69 0 31
Atwal 589 522 123 244 11 40 9 146 67 1 15
Ayazpur 486 421 51 137 3 26 5 228 65 3 33
Bapur 354 327 29 155 0 4 14 129 27 1 22
Benakanalli 497 402 213 53 3 62 2 134 95 0 30
Bidar (CMC + OG) 66415 55928 670 1528 186 609 962 52768 10487 619 9073
Chikpet 527 491 23 163 4 2 3 302 36 0 30
Chitta 2252 2035 327 1047 25 148 15 646 217 19 25
Chondi 515 416 111 114 24 55 2 189 99 0 20
Chouli 515 273 86 83 1 7 1 103 242 2 232
Gadgi 1740 1514 250 458 14 123 79 727 226 20 69
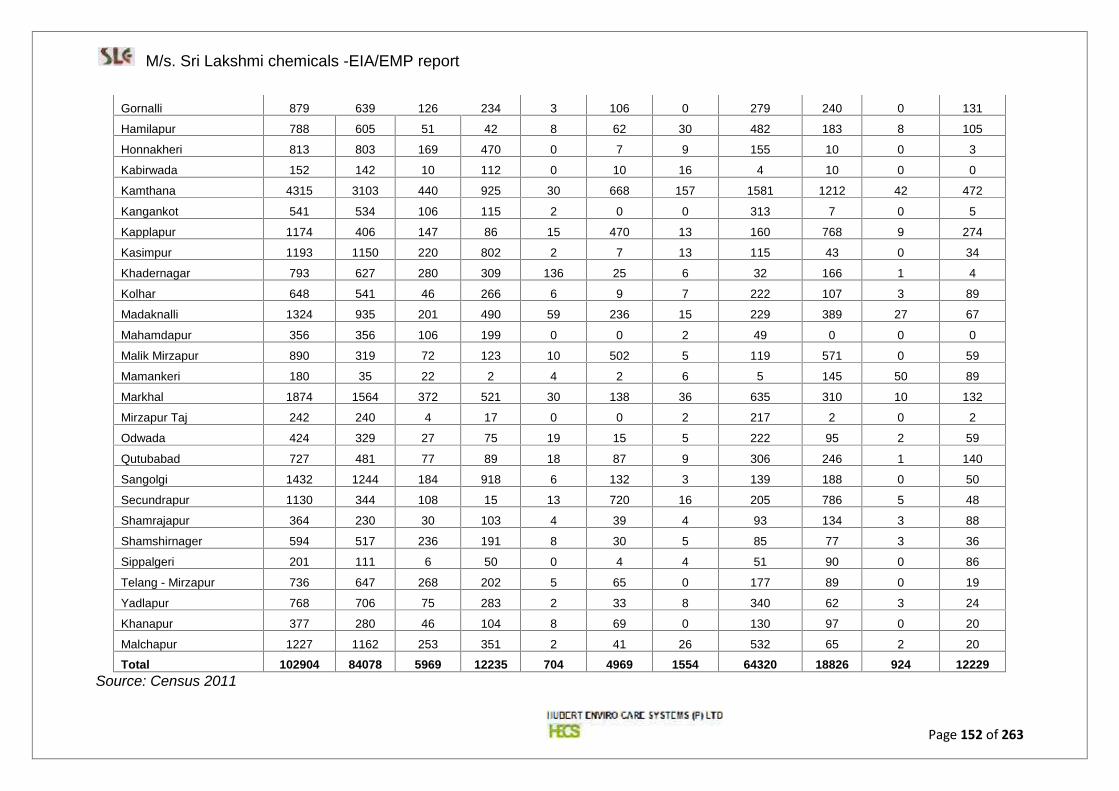
M/s. Sri Lakshmi chemicals -EIA/EMP report
Page 152 of 263
Gornalli 879 639 126 234 3 106 0 279 240 0 131
Hamilapur 788 605 51 42 8 62 30 482 183 8 105
Honnakheri 813 803 169 470 0 7 9 155 10 0 3
Kabirwada 152 142 10 112 0 10 16 4 10 0 0
Kamthana 4315 3103 440 925 30 668 157 1581 1212 42 472
Kangankot 541 534 106 115 2 0 0 313 7 0 5
Kapplapur 1174 406 147 86 15 470 13 160 768 9 274
Kasimpur 1193 1150 220 802 2 7 13 115 43 0 34
Khadernagar 793 627 280 309 136 25 6 32 166 1 4
Kolhar 648 541 46 266 6 9 7 222 107 3 89
Madaknalli 1324 935 201 490 59 236 15 229 389 27 67
Mahamdapur 356 356 106 199 0 0 2 49 0 0 0
Malik Mirzapur 890 319 72 123 10 502 5 119 571 0 59
Mamankeri 180 35 22 2 4 2 6 5 145 50 89
Markhal 1874 1564 372 521 30 138 36 635 310 10 132
Mirzapur Taj 242 240 4 17 0 0 2 217 2 0 2
Odwada 424 329 27 75 19 15 5 222 95 2 59
Qutubabad 727 481 77 89 18 87 9 306 246 1 140
Sangolgi 1432 1244 184 918 6 132 3 139 188 0 50
Secundrapur 1130 344 108 15 13 720 16 205 786 5 48
Shamrajapur 364 230 30 103 4 39 4 93 134 3 88
Shamshirnager 594 517 236 191 8 30 5 85 77 3 36
Sippalgeri 201 111 6 50 0 4 4 51 90 0 86
Telang - Mirzapur 736 647 268 202 5 65 0 177 89 0 19
Yadlapur 768 706 75 283 2 33 8 340 62 3 24
Khanapur 377 280 46 104 8 69 0 130 97 0 20
Malchapur 1227 1162 253 351 2 41 26 532 65 2 20
Total 102904 84078 5969 12235 704 4969 1554 64320 18826 924 12229Source: Census 2011
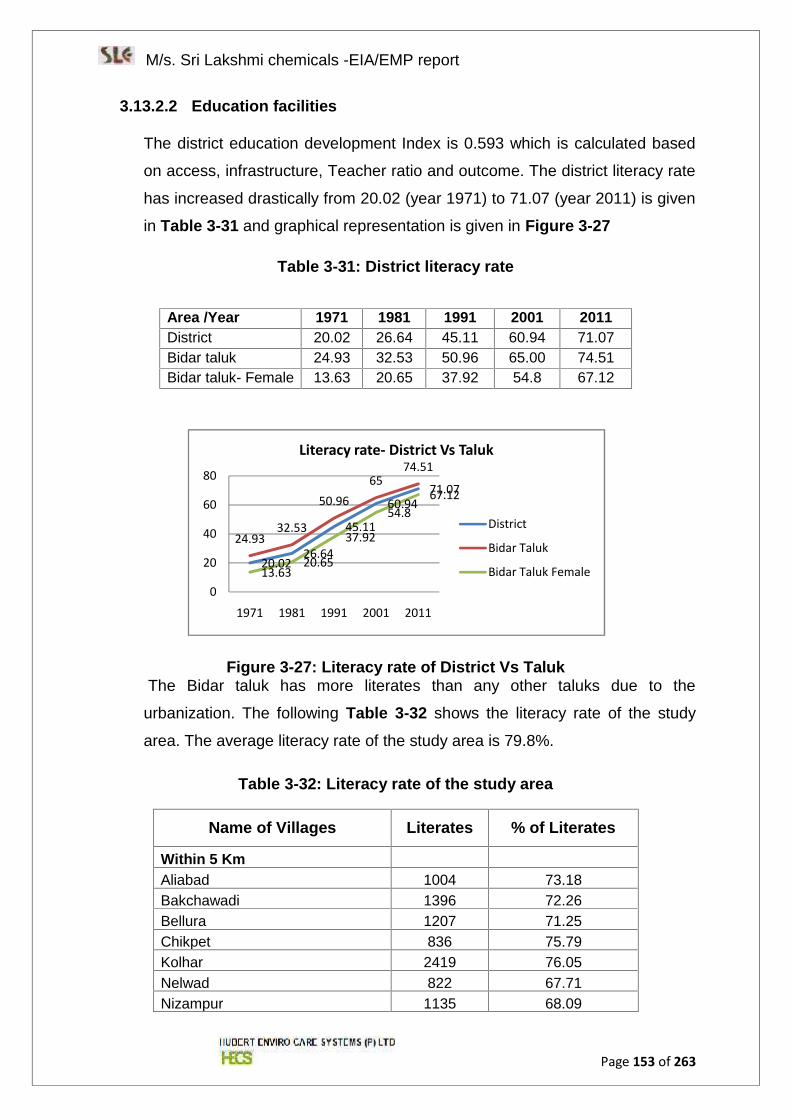
M/s. Sri Lakshmi chemicals -EIA/EMP report
Page 153 of 263
3.13.2.2 Education facilities
The district education development Index is 0.593 which is calculated based
on access, infrastructure, Teacher ratio and outcome. The district literacy rate
has increased drastically from 20.02 (year 1971) to 71.07 (year 2011) is given
in Table 3-31 and graphical representation is given in Figure 3-27
Table 3-31: District literacy rate
Area /Year 1971 1981 1991 2001 2011District 20.02 26.64 45.11 60.94 71.07Bidar taluk 24.93 32.53 50.96 65.00 74.51Bidar taluk- Female 13.63 20.65 37.92 54.8 67.12
Figure 3-27: Literacy rate of District Vs TalukThe Bidar taluk has more literates than any other taluks due to the
urbanization. The following Table 3-32 shows the literacy rate of the study
area. The average literacy rate of the study area is 79.8%.
Table 3-32: Literacy rate of the study area
Name of Villages Literates % of Literates
Within 5 KmAliabad 1004 73.18Bakchawadi 1396 72.26Bellura 1207 71.25Chikpet 836 75.79Kolhar 2419 76.05Nelwad 822 67.71Nizampur 1135 68.09
20.0226.64
45.11
60.9471.07
24.9332.53
50.9665
74.51
13.6320.65
37.92
54.867.12
0
20
40
60
80
1971 1981 1991 2001 2011
Literacy rate- District Vs Taluk
District
Bidar Taluk
Bidar Taluk Female
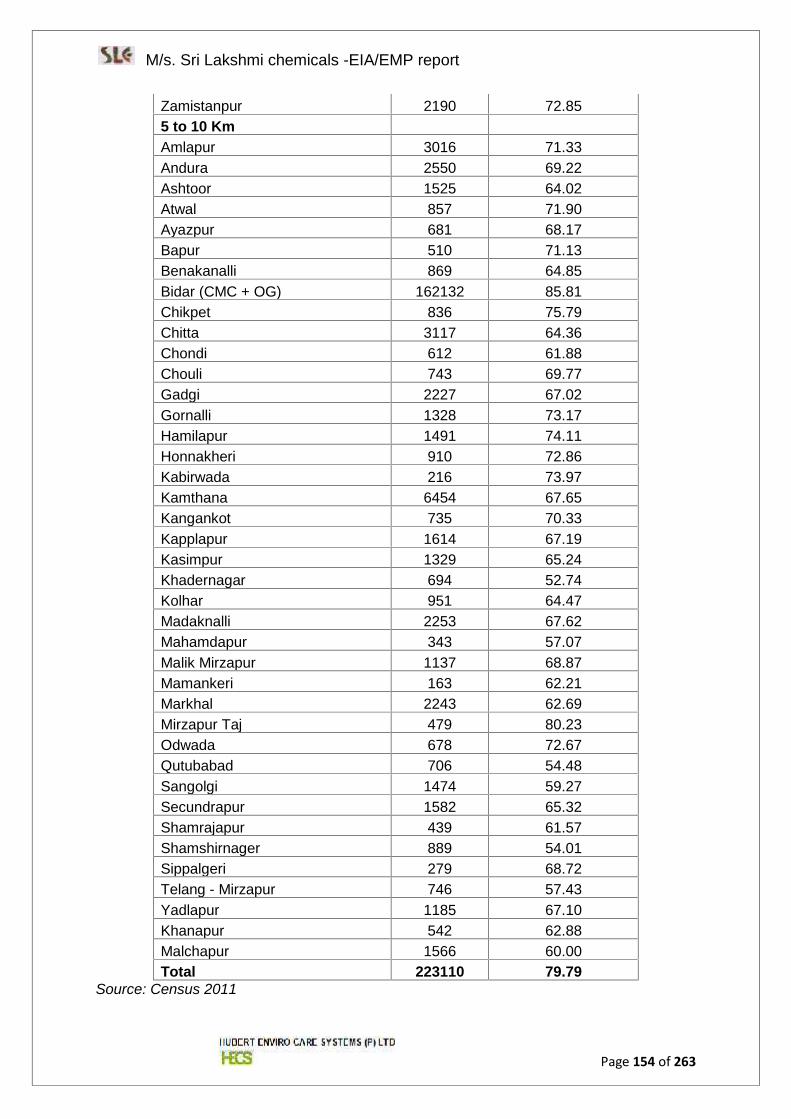
M/s. Sri Lakshmi chemicals -EIA/EMP report
Page 154 of 263
Zamistanpur 2190 72.855 to 10 KmAmlapur 3016 71.33Andura 2550 69.22Ashtoor 1525 64.02Atwal 857 71.90Ayazpur 681 68.17Bapur 510 71.13Benakanalli 869 64.85Bidar (CMC + OG) 162132 85.81Chikpet 836 75.79Chitta 3117 64.36Chondi 612 61.88Chouli 743 69.77Gadgi 2227 67.02Gornalli 1328 73.17Hamilapur 1491 74.11Honnakheri 910 72.86Kabirwada 216 73.97Kamthana 6454 67.65Kangankot 735 70.33Kapplapur 1614 67.19Kasimpur 1329 65.24Khadernagar 694 52.74Kolhar 951 64.47Madaknalli 2253 67.62Mahamdapur 343 57.07Malik Mirzapur 1137 68.87Mamankeri 163 62.21Markhal 2243 62.69Mirzapur Taj 479 80.23Odwada 678 72.67Qutubabad 706 54.48Sangolgi 1474 59.27Secundrapur 1582 65.32Shamrajapur 439 61.57Shamshirnager 889 54.01Sippalgeri 279 68.72Telang - Mirzapur 746 57.43Yadlapur 1185 67.10Khanapur 542 62.88Malchapur 1566 60.00Total 223110 79.79
Source: Census 2011
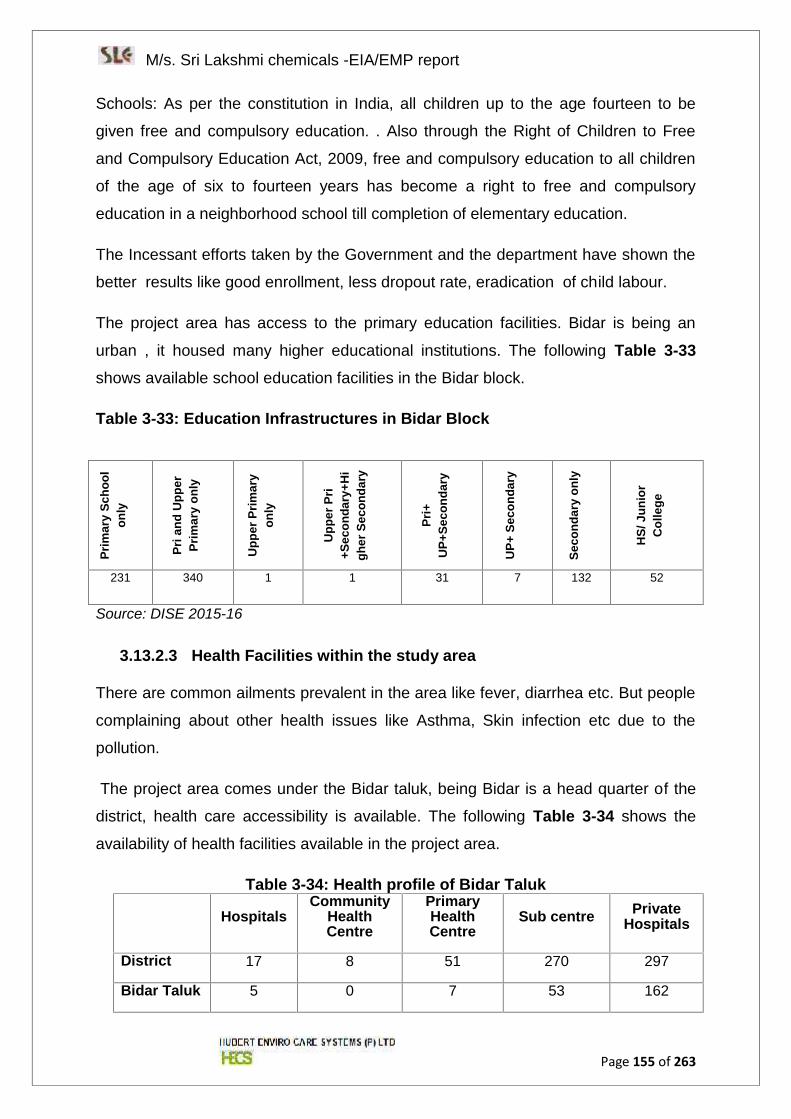
M/s. Sri Lakshmi chemicals -EIA/EMP report
Page 155 of 263
Schools: As per the constitution in India, all children up to the age fourteen to be
given free and compulsory education. . Also through the Right of Children to Free
and Compulsory Education Act, 2009, free and compulsory education to all children
of the age of six to fourteen years has become a right to free and compulsory
education in a neighborhood school till completion of elementary education.
The Incessant efforts taken by the Government and the department have shown the
better results like good enrollment, less dropout rate, eradication of child labour.
The project area has access to the primary education facilities. Bidar is being an
urban , it housed many higher educational institutions. The following Table 3-33shows available school education facilities in the Bidar block.
Table 3-33: Education Infrastructures in Bidar Block
Prim
ary
Scho
olon
ly
Pri a
nd U
pper
Prim
ary
only
Upp
er P
rimar
yon
ly
Upp
er P
ri+S
econ
dary
+Hi
gher
Sec
onda
ry
Pri+
UP+
Seco
ndar
y
UP+
Sec
onda
ry
Seco
ndar
y on
ly
HS/
Jun
ior
Col
lege
231 340 1 1 31 7 132 52
Source: DISE 2015-16
3.13.2.3 Health Facilities within the study area
There are common ailments prevalent in the area like fever, diarrhea etc. But people
complaining about other health issues like Asthma, Skin infection etc due to the
pollution.
The project area comes under the Bidar taluk, being Bidar is a head quarter of the
district, health care accessibility is available. The following Table 3-34 shows the
availability of health facilities available in the project area.
Table 3-34: Health profile of Bidar Taluk
HospitalsCommunity
HealthCentre
PrimaryHealthCentre
Sub centre PrivateHospitals
District 17 8 51 270 297
Bidar Taluk 5 0 7 53 162
M/s. Sri Lakshmi chemicals -EIA/EMP report
Page 156 of 263
Source: BHO, Bidar
There are some health indicators like the Infant Mortality Rate, Child Mortality rate
and Maternal Mortality Rate etc. shows the health of the area.
Infant Mortality Rate: It is defined as the deaths of infants of age less than
one year per thousand live births. The IMR of Bidar taluk is 23 and of the
district are 31 (WHO European Region -10 per 1000 live births).
Child Mortality Rate: also known as under-5 mortality or child death refers to
the death of infants and children under the age of five or between the age of
one month to four years. The CMR of the taluk is 31 and that of the district is
35.(WHO European Region -11 per 1000 live births)
Maternal Mortality Rate: Maternal death is the death of a woman while
pregnant or within 42 days of termination of pregnancy, irrespective of the
duration from any cause related to or aggravated by the pregnancy or its
management but not from accidental or incidental causes. The MMR of the
Bidar taluk is 119 and the district is 134.
3.13.2.4 Sanitation Facilities & Drinking water facilities within the StudyArea
Tap water and tube wells are the main sources of drinking water. The following
Table 3-35 shows the drinking water from different sources and availability of toilets.
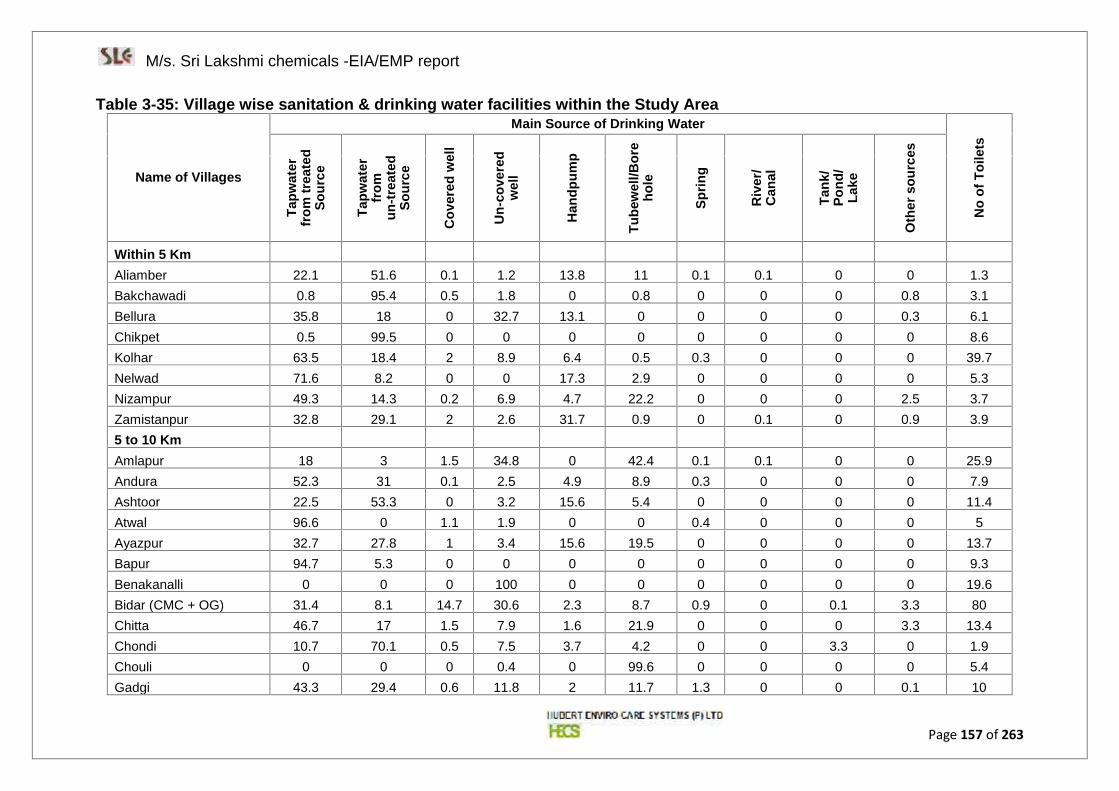
M/s. Sri Lakshmi chemicals -EIA/EMP report
Page 157 of 263
Table 3-35: Village wise sanitation & drinking water facilities within the Study Area
Name of Villages
Main Source of Drinking Water
No
of T
oile
ts
Tapw
ater
from
trea
ted
Sour
ce
Tapw
ater
from
un-tr
eate
dSo
urce
Cov
ered
wel
l
Un-
cove
red
wel
l
Han
dpum
p
Tube
wel
l/Bor
eho
le
Sprin
g
Riv
er/
Can
al
Tank
/Po
nd/
Lake
Oth
er s
ourc
es
Within 5 KmAliamber 22.1 51.6 0.1 1.2 13.8 11 0.1 0.1 0 0 1.3Bakchawadi 0.8 95.4 0.5 1.8 0 0.8 0 0 0 0.8 3.1Bellura 35.8 18 0 32.7 13.1 0 0 0 0 0.3 6.1Chikpet 0.5 99.5 0 0 0 0 0 0 0 0 8.6Kolhar 63.5 18.4 2 8.9 6.4 0.5 0.3 0 0 0 39.7Nelwad 71.6 8.2 0 0 17.3 2.9 0 0 0 0 5.3Nizampur 49.3 14.3 0.2 6.9 4.7 22.2 0 0 0 2.5 3.7Zamistanpur 32.8 29.1 2 2.6 31.7 0.9 0 0.1 0 0.9 3.95 to 10 KmAmlapur 18 3 1.5 34.8 0 42.4 0.1 0.1 0 0 25.9Andura 52.3 31 0.1 2.5 4.9 8.9 0.3 0 0 0 7.9Ashtoor 22.5 53.3 0 3.2 15.6 5.4 0 0 0 0 11.4Atwal 96.6 0 1.1 1.9 0 0 0.4 0 0 0 5Ayazpur 32.7 27.8 1 3.4 15.6 19.5 0 0 0 0 13.7Bapur 94.7 5.3 0 0 0 0 0 0 0 0 9.3Benakanalli 0 0 0 100 0 0 0 0 0 0 19.6Bidar (CMC + OG) 31.4 8.1 14.7 30.6 2.3 8.7 0.9 0 0.1 3.3 80Chitta 46.7 17 1.5 7.9 1.6 21.9 0 0 0 3.3 13.4Chondi 10.7 70.1 0.5 7.5 3.7 4.2 0 0 3.3 0 1.9Chouli 0 0 0 0.4 0 99.6 0 0 0 0 5.4Gadgi 43.3 29.4 0.6 11.8 2 11.7 1.3 0 0 0.1 10
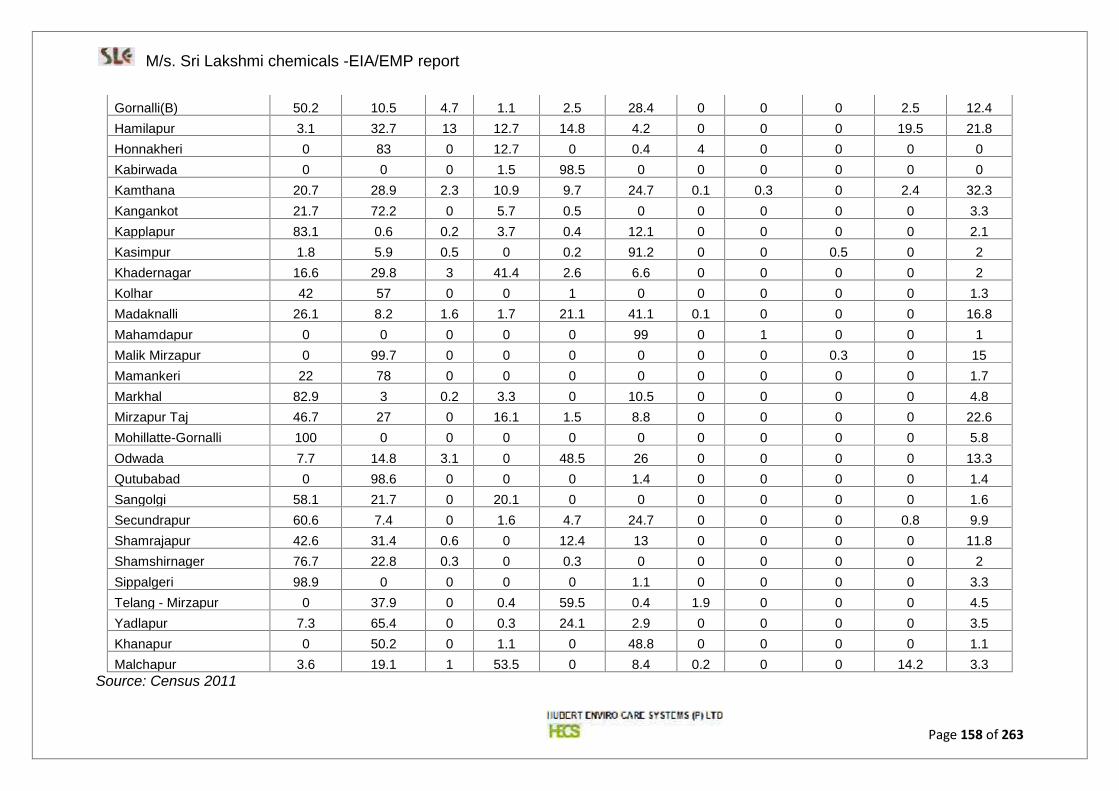
M/s. Sri Lakshmi chemicals -EIA/EMP report
Page 158 of 263
Gornalli(B) 50.2 10.5 4.7 1.1 2.5 28.4 0 0 0 2.5 12.4Hamilapur 3.1 32.7 13 12.7 14.8 4.2 0 0 0 19.5 21.8Honnakheri 0 83 0 12.7 0 0.4 4 0 0 0 0Kabirwada 0 0 0 1.5 98.5 0 0 0 0 0 0Kamthana 20.7 28.9 2.3 10.9 9.7 24.7 0.1 0.3 0 2.4 32.3Kangankot 21.7 72.2 0 5.7 0.5 0 0 0 0 0 3.3Kapplapur 83.1 0.6 0.2 3.7 0.4 12.1 0 0 0 0 2.1Kasimpur 1.8 5.9 0.5 0 0.2 91.2 0 0 0.5 0 2Khadernagar 16.6 29.8 3 41.4 2.6 6.6 0 0 0 0 2Kolhar 42 57 0 0 1 0 0 0 0 0 1.3Madaknalli 26.1 8.2 1.6 1.7 21.1 41.1 0.1 0 0 0 16.8Mahamdapur 0 0 0 0 0 99 0 1 0 0 1Malik Mirzapur 0 99.7 0 0 0 0 0 0 0.3 0 15Mamankeri 22 78 0 0 0 0 0 0 0 0 1.7Markhal 82.9 3 0.2 3.3 0 10.5 0 0 0 0 4.8Mirzapur Taj 46.7 27 0 16.1 1.5 8.8 0 0 0 0 22.6Mohillatte-Gornalli 100 0 0 0 0 0 0 0 0 0 5.8Odwada 7.7 14.8 3.1 0 48.5 26 0 0 0 0 13.3Qutubabad 0 98.6 0 0 0 1.4 0 0 0 0 1.4Sangolgi 58.1 21.7 0 20.1 0 0 0 0 0 0 1.6Secundrapur 60.6 7.4 0 1.6 4.7 24.7 0 0 0 0.8 9.9Shamrajapur 42.6 31.4 0.6 0 12.4 13 0 0 0 0 11.8Shamshirnager 76.7 22.8 0.3 0 0.3 0 0 0 0 0 2Sippalgeri 98.9 0 0 0 0 1.1 0 0 0 0 3.3Telang - Mirzapur 0 37.9 0 0.4 59.5 0.4 1.9 0 0 0 4.5Yadlapur 7.3 65.4 0 0.3 24.1 2.9 0 0 0 0 3.5Khanapur 0 50.2 0 1.1 0 48.8 0 0 0 0 1.1Malchapur 3.6 19.1 1 53.5 0 8.4 0.2 0 0 14.2 3.3
Source: Census 2011
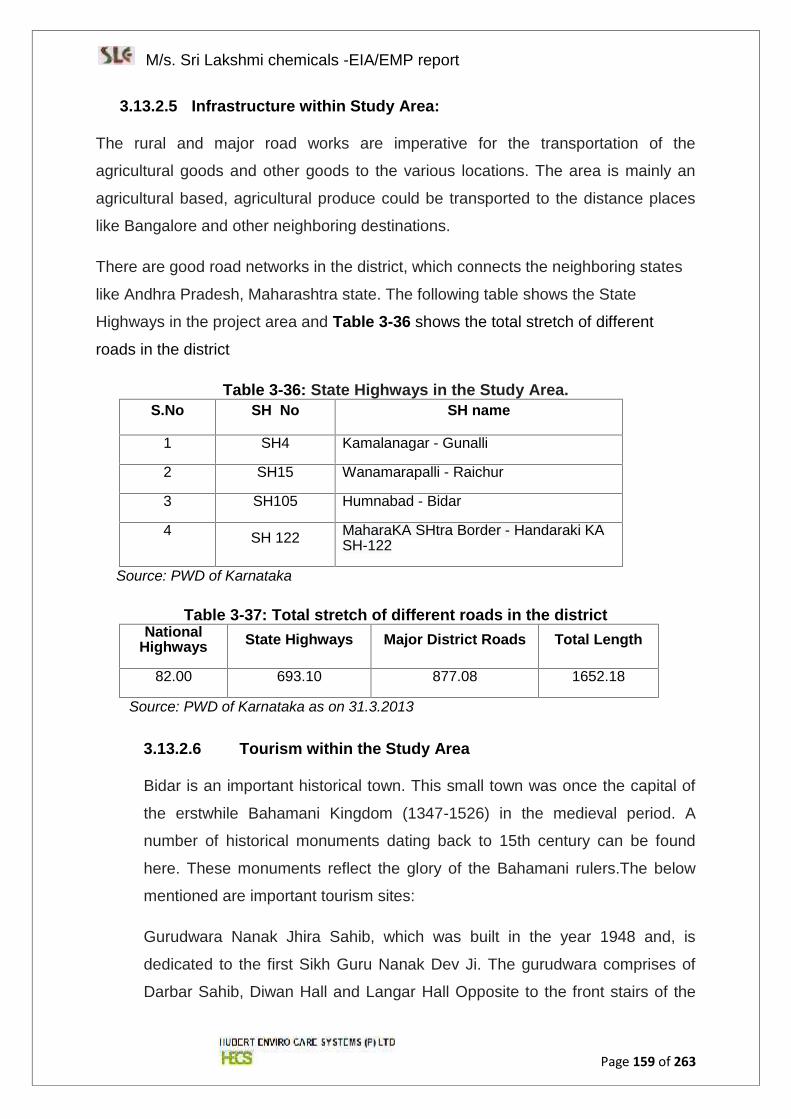
M/s. Sri Lakshmi chemicals -EIA/EMP report
Page 159 of 263
3.13.2.5 Infrastructure within Study Area:
The rural and major road works are imperative for the transportation of the
agricultural goods and other goods to the various locations. The area is mainly an
agricultural based, agricultural produce could be transported to the distance places
like Bangalore and other neighboring destinations.
There are good road networks in the district, which connects the neighboring states
like Andhra Pradesh, Maharashtra state. The following table shows the State
Highways in the project area and Table 3-36 shows the total stretch of different
roads in the district
Table 3-36: State Highways in the Study Area.S.No SH No SH name
1 SH4 Kamalanagar - Gunalli
2 SH15 Wanamarapalli - Raichur
3 SH105 Humnabad - Bidar
4 SH 122 MaharaKA SHtra Border - Handaraki KASH-122
Source: PWD of Karnataka
Table 3-37: Total stretch of different roads in the districtNational
Highways State Highways Major District Roads Total Length
82.00 693.10 877.08 1652.18
Source: PWD of Karnataka as on 31.3.2013
3.13.2.6 Tourism within the Study Area
Bidar is an important historical town. This small town was once the capital of
the erstwhile Bahamani Kingdom (1347-1526) in the medieval period. A
number of historical monuments dating back to 15th century can be found
here. These monuments reflect the glory of the Bahamani rulers.The below
mentioned are important tourism sites:
Gurudwara Nanak Jhira Sahib, which was built in the year 1948 and, is
dedicated to the first Sikh Guru Nanak Dev Ji. The gurudwara comprises of
Darbar Sahib, Diwan Hall and Langar Hall Opposite to the front stairs of the
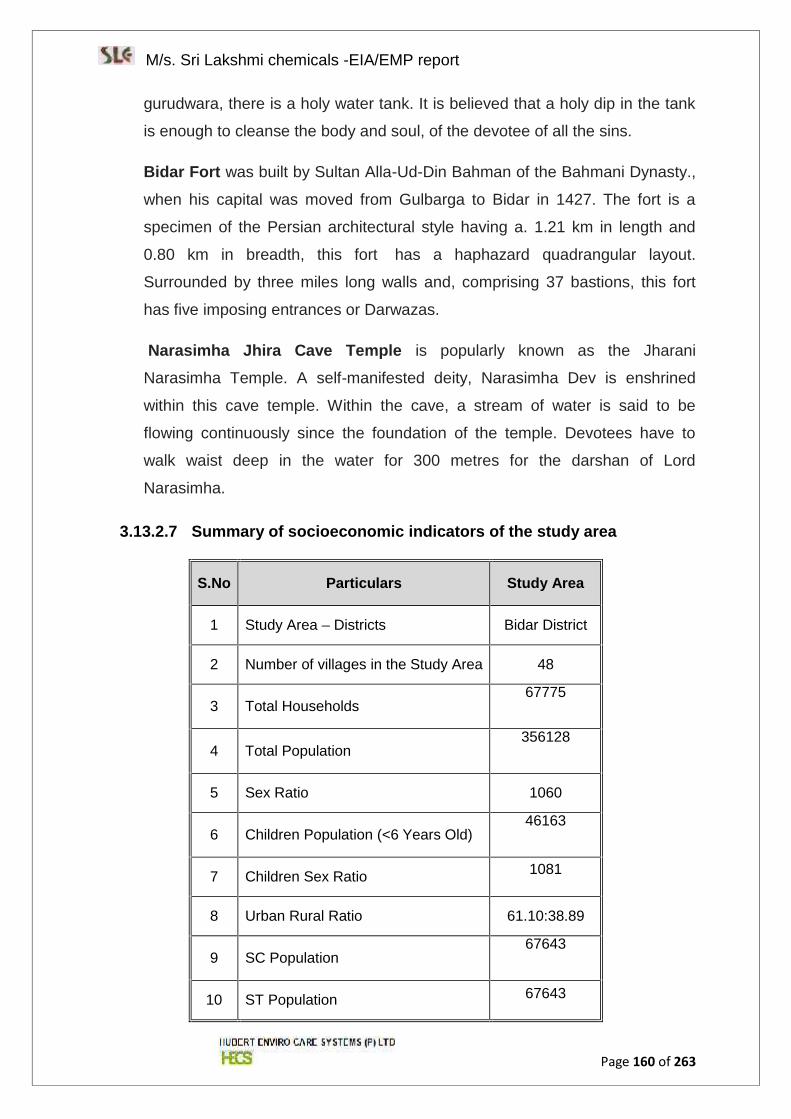
M/s. Sri Lakshmi chemicals -EIA/EMP report
Page 160 of 263
gurudwara, there is a holy water tank. It is believed that a holy dip in the tank
is enough to cleanse the body and soul, of the devotee of all the sins.
Bidar Fort was built by Sultan Alla-Ud-Din Bahman of the Bahmani Dynasty.,
when his capital was moved from Gulbarga to Bidar in 1427. The fort is a
specimen of the Persian architectural style having a. 1.21 km in length and
0.80 km in breadth, this fort has a haphazard quadrangular layout.
Surrounded by three miles long walls and, comprising 37 bastions, this fort
has five imposing entrances or Darwazas.
Narasimha Jhira Cave Temple is popularly known as the Jharani
Narasimha Temple. A self-manifested deity, Narasimha Dev is enshrined
within this cave temple. Within the cave, a stream of water is said to be
flowing continuously since the foundation of the temple. Devotees have to
walk waist deep in the water for 300 metres for the darshan of Lord
Narasimha.
3.13.2.7 Summary of socioeconomic indicators of the study area
S.No Particulars Study Area
1 Study Area – Districts Bidar District
2 Number of villages in the Study Area 48
3 Total Households67775
4 Total Population356128
5 Sex Ratio 1060
6 Children Population (<6 Years Old)46163
7 Children Sex Ratio 1081
8 Urban Rural Ratio 61.10:38.89
9 SC Population67643
10 ST Population 67643
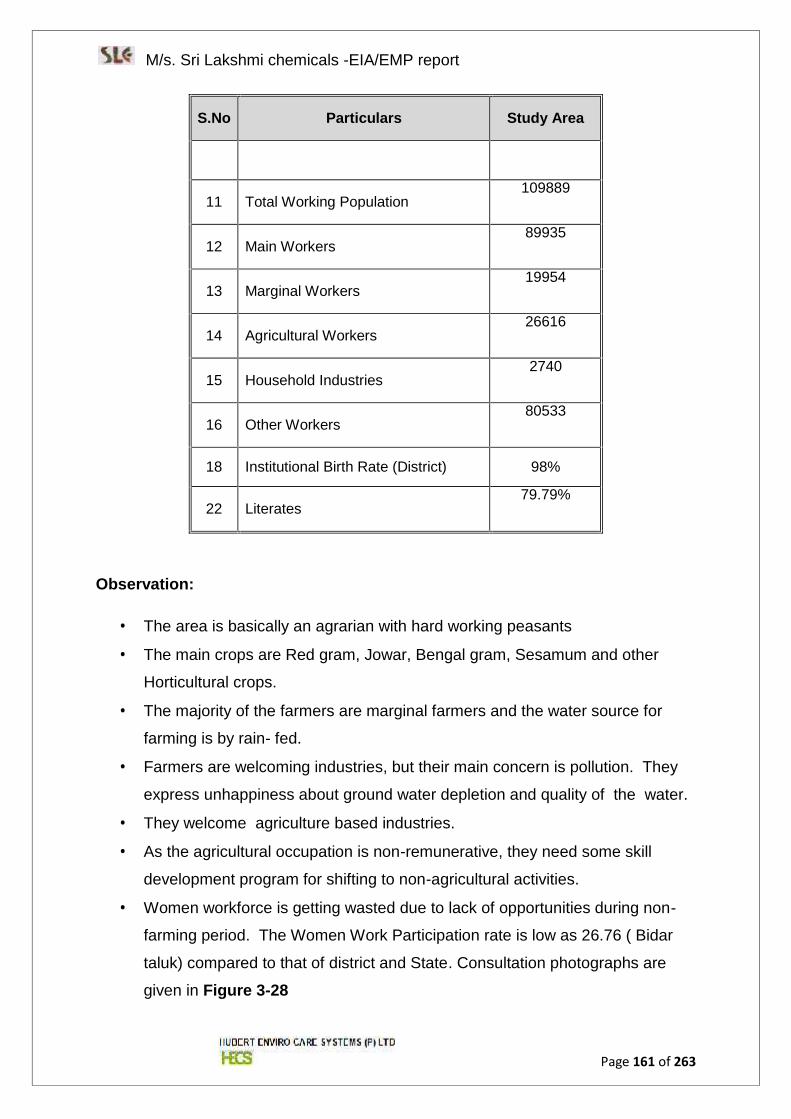
M/s. Sri Lakshmi chemicals -EIA/EMP report
Page 161 of 263
S.No Particulars Study Area
11 Total Working Population109889
12 Main Workers89935
13 Marginal Workers19954
14 Agricultural Workers26616
15 Household Industries2740
16 Other Workers80533
18 Institutional Birth Rate (District) 98%
22 Literates79.79%
Observation:
The area is basically an agrarian with hard working peasants
The main crops are Red gram, Jowar, Bengal gram, Sesamum and other
Horticultural crops.
The majority of the farmers are marginal farmers and the water source for
farming is by rain- fed.
Farmers are welcoming industries, but their main concern is pollution. They
express unhappiness about ground water depletion and quality of the water.
They welcome agriculture based industries.
As the agricultural occupation is non-remunerative, they need some skill
development program for shifting to non-agricultural activities.
Women workforce is getting wasted due to lack of opportunities during non-
farming period. The Women Work Participation rate is low as 26.76 ( Bidar
taluk) compared to that of district and State. Consultation photographs are
given in Figure 3-28
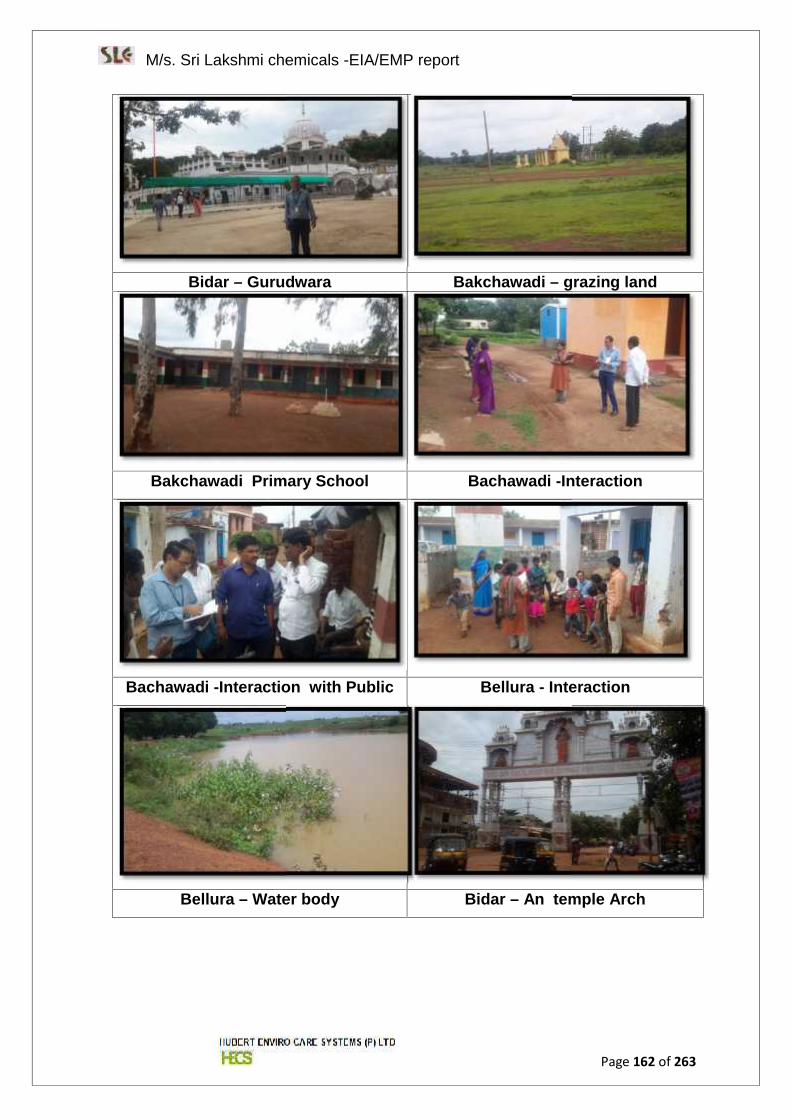
M/s. Sri Lakshmi chemicals -EIA/EMP report
Page 162 of 263
Bidar – Gurudwara Bakchawadi – grazing land
Bakchawadi Primary School Bachawadi -Interaction
Bachawadi -Interaction with Public Bellura - Interaction
Bellura – Water body Bidar – An temple Arch
M/s. Sri Lakshmi chemicals -EIA/EMP report
Page 162 of 263
Bidar – Gurudwara Bakchawadi – grazing land
Bakchawadi Primary School Bachawadi -Interaction
Bachawadi -Interaction with Public Bellura - Interaction
Bellura – Water body Bidar – An temple Arch
M/s. Sri Lakshmi chemicals -EIA/EMP report
Page 162 of 263
Bidar – Gurudwara Bakchawadi – grazing land
Bakchawadi Primary School Bachawadi -Interaction
Bachawadi -Interaction with Public Bellura - Interaction
Bellura – Water body Bidar – An temple Arch
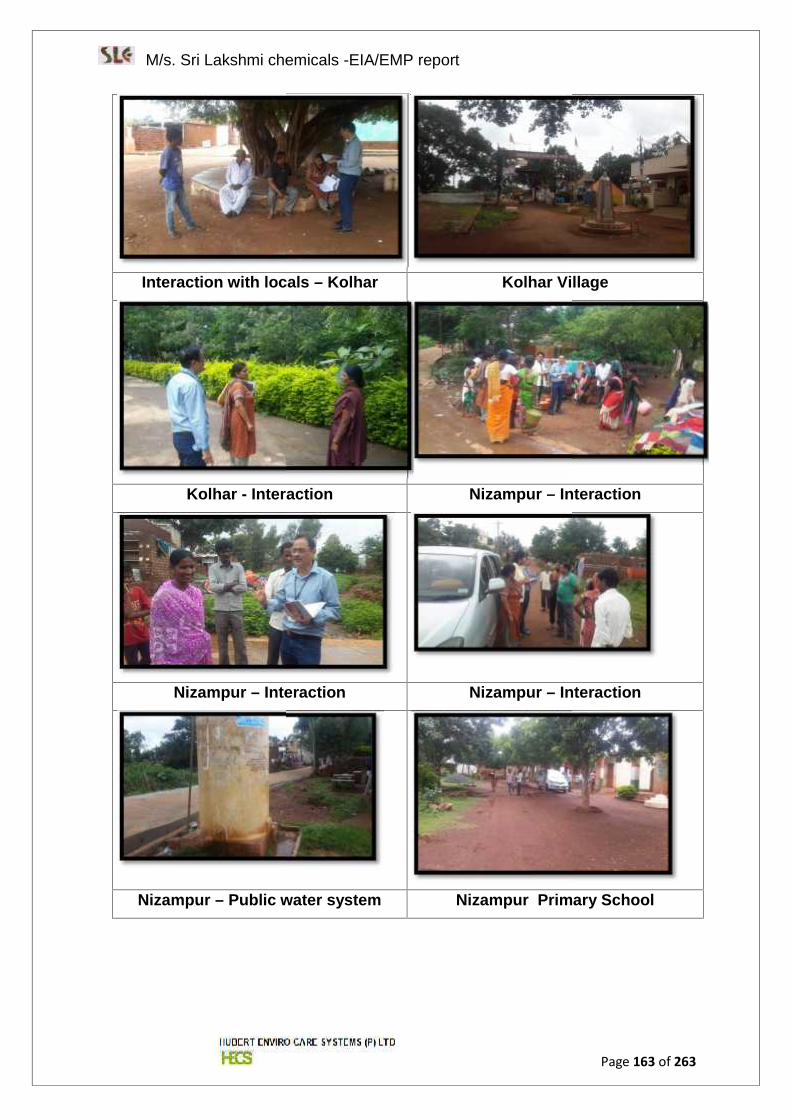
M/s. Sri Lakshmi chemicals -EIA/EMP report
Page 163 of 263
Interaction with locals – Kolhar Kolhar Village
Kolhar - Interaction Nizampur – Interaction
Nizampur – Interaction Nizampur – Interaction
Nizampur – Public water system Nizampur Primary School
M/s. Sri Lakshmi chemicals -EIA/EMP report
Page 163 of 263
Interaction with locals – Kolhar Kolhar Village
Kolhar - Interaction Nizampur – Interaction
Nizampur – Interaction Nizampur – Interaction
Nizampur – Public water system Nizampur Primary School
M/s. Sri Lakshmi chemicals -EIA/EMP report
Page 163 of 263
Interaction with locals – Kolhar Kolhar Village
Kolhar - Interaction Nizampur – Interaction
Nizampur – Interaction Nizampur – Interaction
Nizampur – Public water system Nizampur Primary School
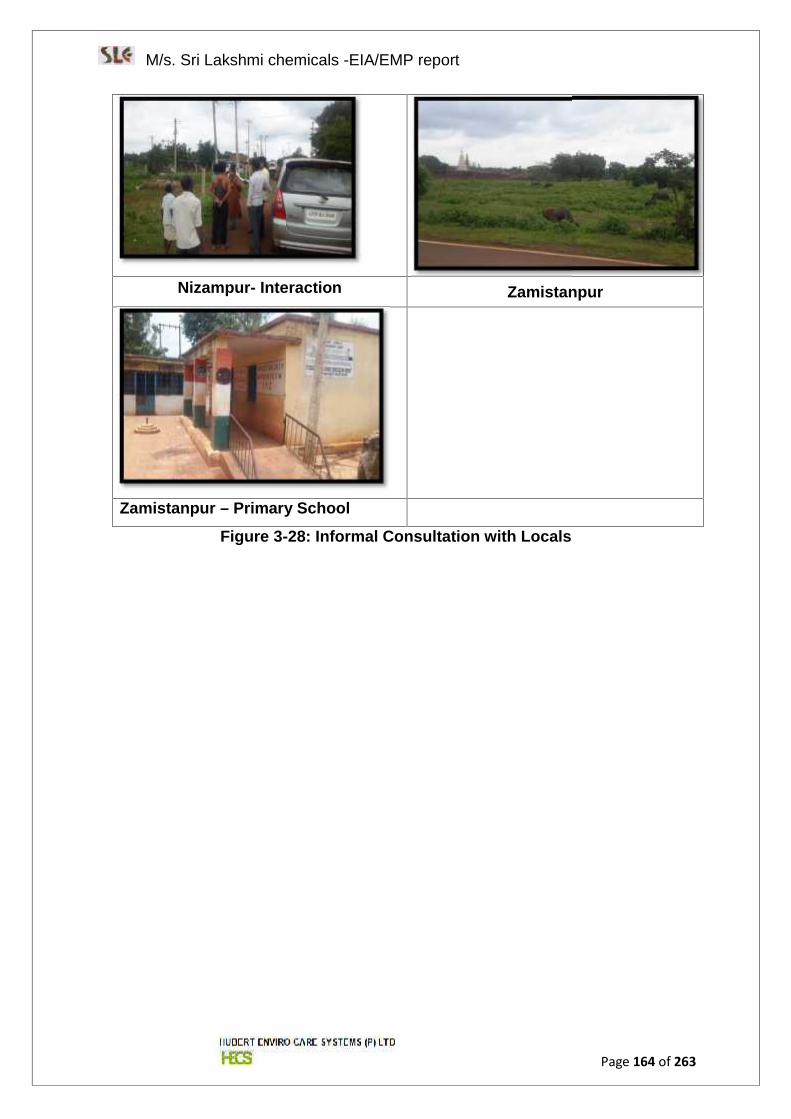
M/s. Sri Lakshmi chemicals -EIA/EMP report
Page 164 of 263
Nizampur- Interaction Zamistanpur
Zamistanpur – Primary School
Figure 3-28: Informal Consultation with Locals
M/s. Sri Lakshmi chemicals -EIA/EMP report
Page 164 of 263
Nizampur- Interaction Zamistanpur
Zamistanpur – Primary School
Figure 3-28: Informal Consultation with Locals
M/s. Sri Lakshmi chemicals -EIA/EMP report
Page 164 of 263
Nizampur- Interaction Zamistanpur
Zamistanpur – Primary School
Figure 3-28: Informal Consultation with Locals
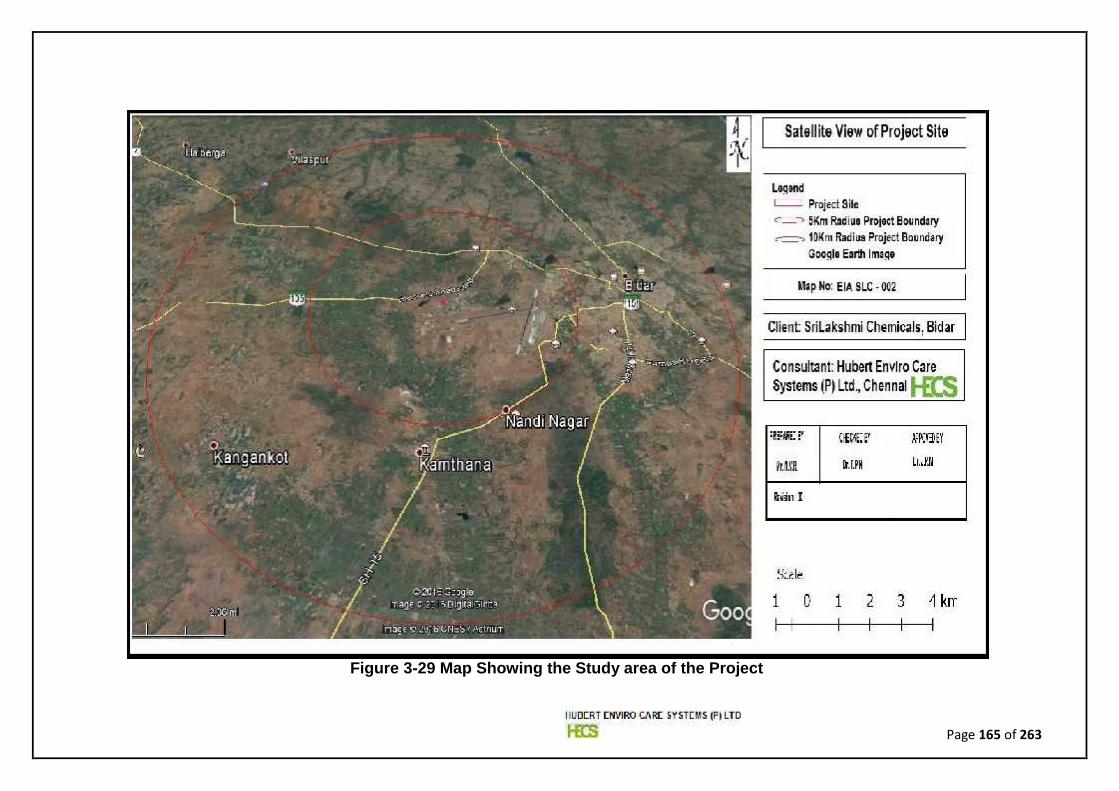
Page 165 of 263
Figure 3-29 Map Showing the Study area of the Project
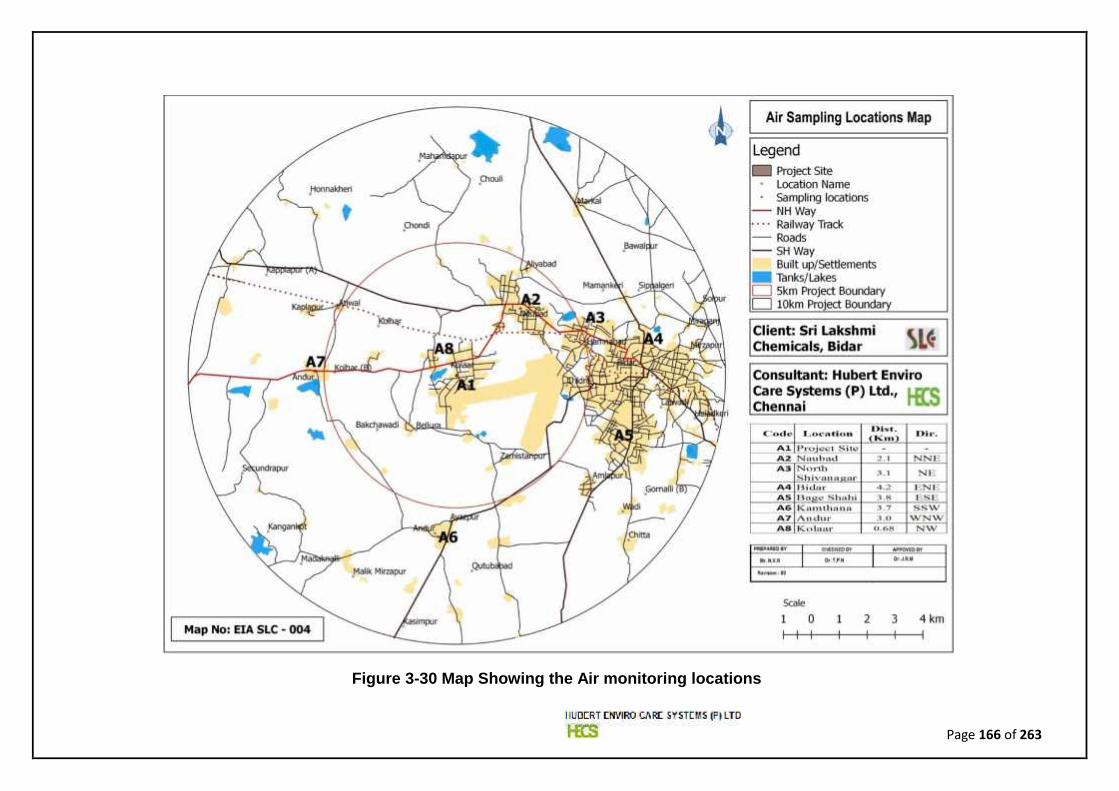
Page 166 of 263
Figure 3-30 Map Showing the Air monitoring locations
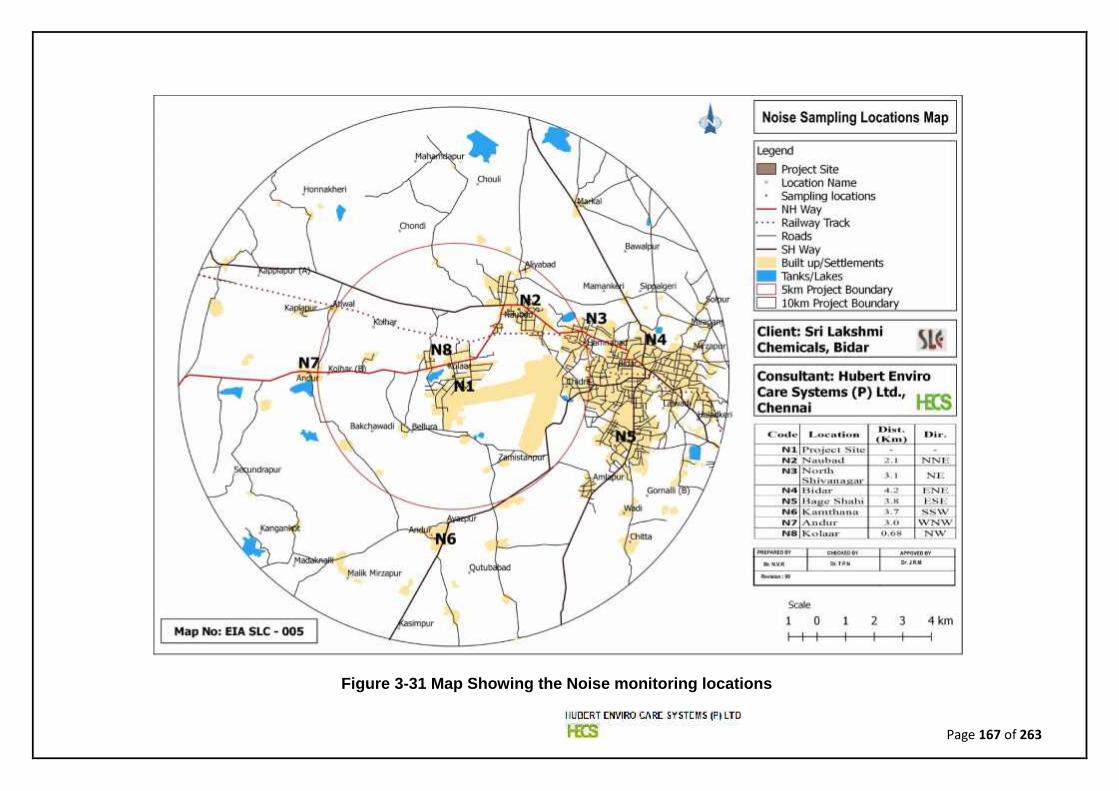
Page 167 of 263
Figure 3-31 Map Showing the Noise monitoring locations
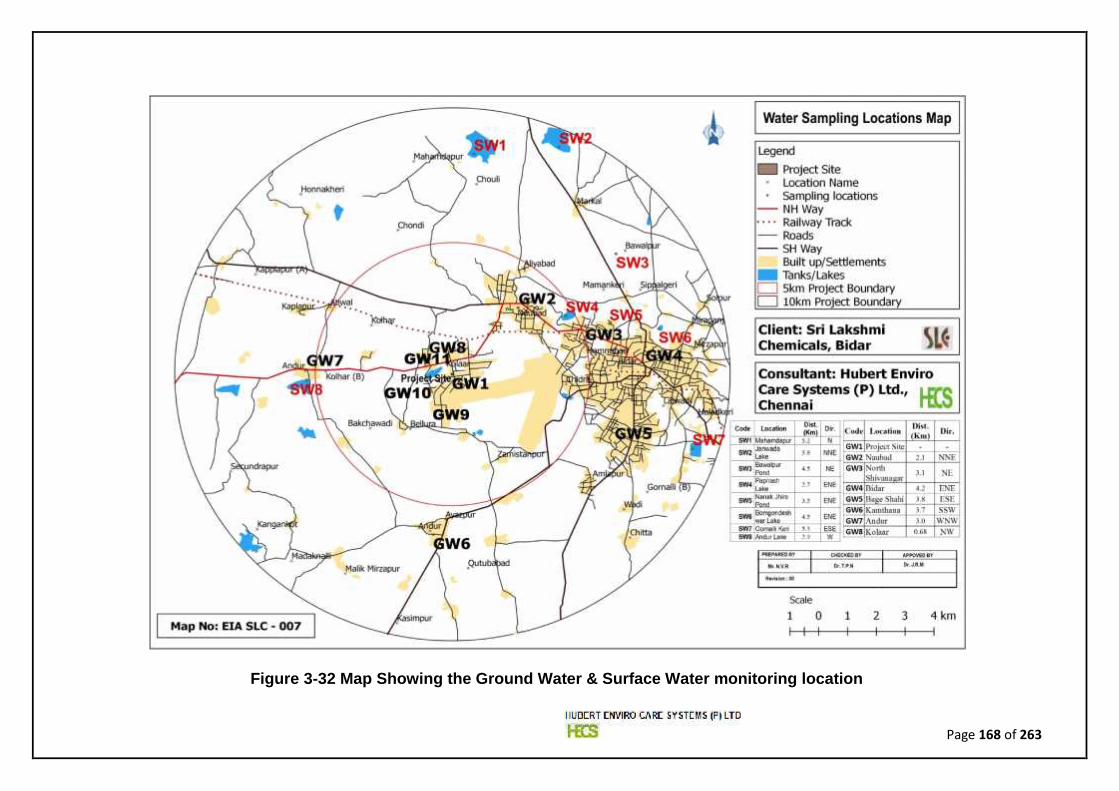
Page 168 of 263
Figure 3-32 Map Showing the Ground Water & Surface Water monitoring location
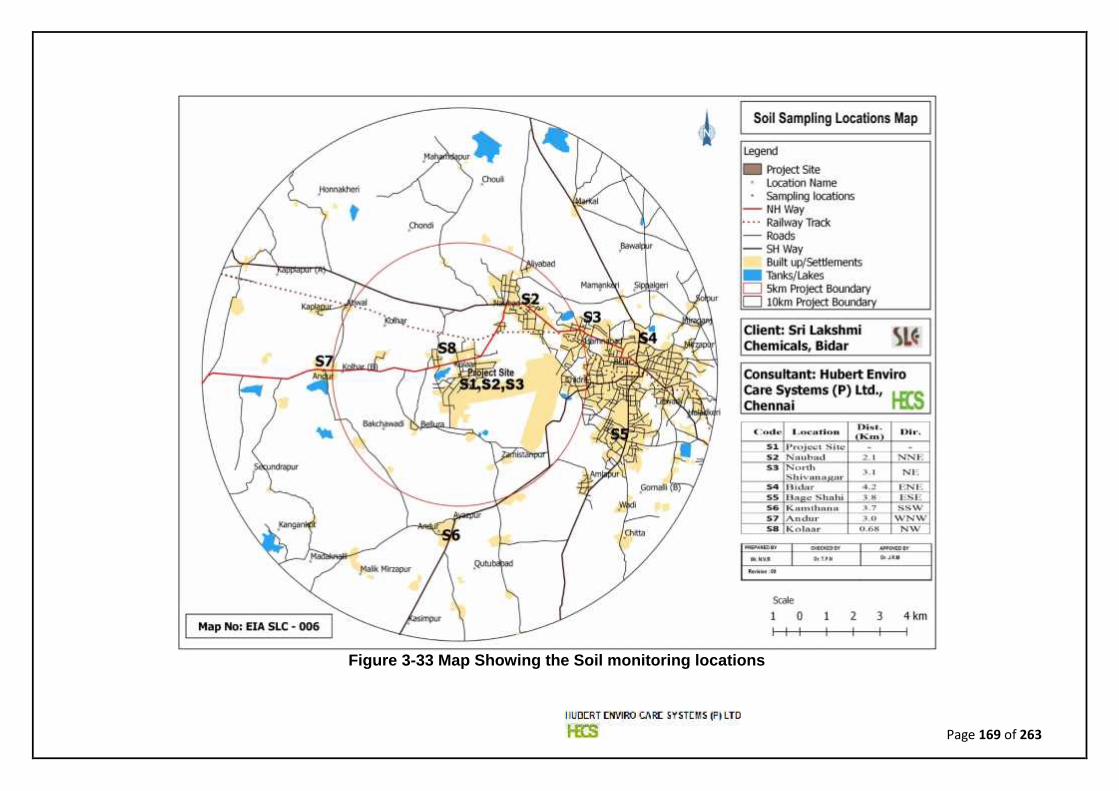
Page 169 of 263
Figure 3-33 Map Showing the Soil monitoring locations
Page 170 of 263
CHAPTER – 4ANTICIPATED ENVIRONMENTAL
IMPACTS AND MITIGATIONMEASURES
Page 171 of 263
4 ANTICIPATED ENVIRONMENTAL IMPACTS AND MITIGATIONMEASURES
4.1 Introduction
Environmental Impact is any change in the environmental attributes, adverse or
beneficial, caused or induced by the proposed action or set of actions. The
predicted adverse impacts during each stage of project development are
superimposed over the baseline status of the existing environmental quality to infer
the scenario of environmental conditions in the post-project stage. The main
purpose of identifying the impacts is that it helps in adopting appropriate mitigation
measures for the adverse consequences if any.
Predicting and evaluating the various significant impacts that are likely to occur. The
impacts on the environmental indices viz. air, water, soil, noise, biological and
socioeconomic conditions are scrutinized methodically and assessed.
The most likely impacts on the environment due to the proposed project need to be
appraised during the two different phases of the project namely pre-
operation/construction phase and operation phase. The particulars on impacts that
could be triggered on the environmental attributes by the activities of the proposed
project are discussed below.
4.2 OPERATION PHASE
From an environmental perspective, this phase is of paramount significance due to
its potential to invoke long-term impacts. The adverse effects that are likely to occur
during this operational phase of the project are: Air Pollution (gaseous emissions),
Effluent generation, noise generation, solid waste generation.
4.2.1 Land Environment
The land use of the existing area is already for industrial use. The proposed
expansion is within the existing facility hence there will be no change in land use
pattern.
4.2.1.1 Discharges on Land-Impact
Domestic water will be treated in Septic tank followed by soak pit.
Page 172 of 263
Industrial effluents from the plant will be stored in a collection tank and neutralized
and then sent to MEE, Condensate will be recycled to cooling tower and boiler feed
though softener. MEE concentrate will be sent to Centrifuge, Salt from Centrifuge
will be sent to TSDF (KSPCB authorization for HWM Annexure 11 and Agreement
copy made with TSDF is enclosed as Annexure 12).
The existing system is ZLD and the proposed system will also be Zero Liquid
Discharge (ZLD). There will be no discharge to land environment.
4.2.1.2 Mitigation Measures
Periodic maintenance and check of wastewater conveyance pipelines
Attempt to restore by replacing a part or putting together the torn or broken
parts of the conveyance pipeline in case of any leakage is detected.
Necessary preventive measures for spillages from pipelines, such as
surface RCC channels along the pipelines are adopted.
Lining of effluent collection tank/ETP common guard pond.
Treated wastewater quality shall be ensured as per standards before using it
for various requirements.
With regards to ETP-There will be institutional arrangement to check the
efficiency of Zero Liquid Discharge.
4.2.2 Impacts- Soil Contamination
Potential impacts on land environment are envisaged due to hazardous and non-
hazardous wastes generated due to various operations in the project site. Sludge
generated during production process, chemical waste including toxic waste, burnt
fuel waste, oil slurry, MEE salts from centrifuge etc are the source of hazardous
waste. Sludge from ETP will be generated. Poor management of such
materials/wastes from the operations is a potential risk of soil contamination.
4.2.2.1 Soil – Mitigation Measures
Good housekeeping and best practices of waste handling shall be adopted to
eliminate/minimise the risks of soil contamination. The wastes generated will be
stored in temporary storage facility and transferred to nearby Treatment, Storage
and Disposal Facility (TSDF) and also to the approved vendors of Karnataka State
Page 173 of 263
Pollution Control Board (KSPCB) landfill and Co-processing. However, waste
minimization techniques will be adopted in order to minimize the generation of
wastes.
4.2.3 Air Environment
Base line data reveals that ambient air quality in the study area for the Parameters
PM10, PM2.5, SO2, NO2, CO, Pb, O3 , NH3 , C6H6, C20 H12, As, Ni, VOC, Cl, HCl, HBr,
H2S & HF are well within the permissible Limits as prescribed by the National
Ambient Air Quality Standards (NAAQS) for Industrial Area, Residential, Rural &
Other areas.
The major air pollution sources from the industry are DG sets, boilers and reactors.
The DG set and boiler sources are provided with stacks of adequate height so as to
disperse the emanating flue gases containing suspended particulate matters, oxides
of sulfur and nitrogen without affecting the ground level concentrations. The
emissions generated from the reactors are scrubbed out by wet scrubbers.
4.2.3.1 Meteorological Data
The site specific meteorological data for three months from Dec 2016 to Feb 2017
was obtained from secondary sources. Other data included for AERMET were daily
wind speed, wind direction, temperature, relative humidity, air pressure,
precipitation, and solar radiation recorded during the period. AERMET reformats
meteorological data so that it can be used as input for AERMOD model.
4.2.3.2 AERMET Process
For the 3 phase AERMET processing of the meteorological data, specifications of
the land use in the area are required to determine the terrain roughness for
modeling. The land use was characterized for in and around the site. The surface
characteristics for the site and surroundings were selected and used to calculate the
albedo, Bowen ratio and surface roughness parameter.
The meteorological data were processed in the AERMET software to generate wind
flow pattern & to generate surface meteorological data and profile meteorological
data in a prescribed format that can be fed to AERMOD for modeling.
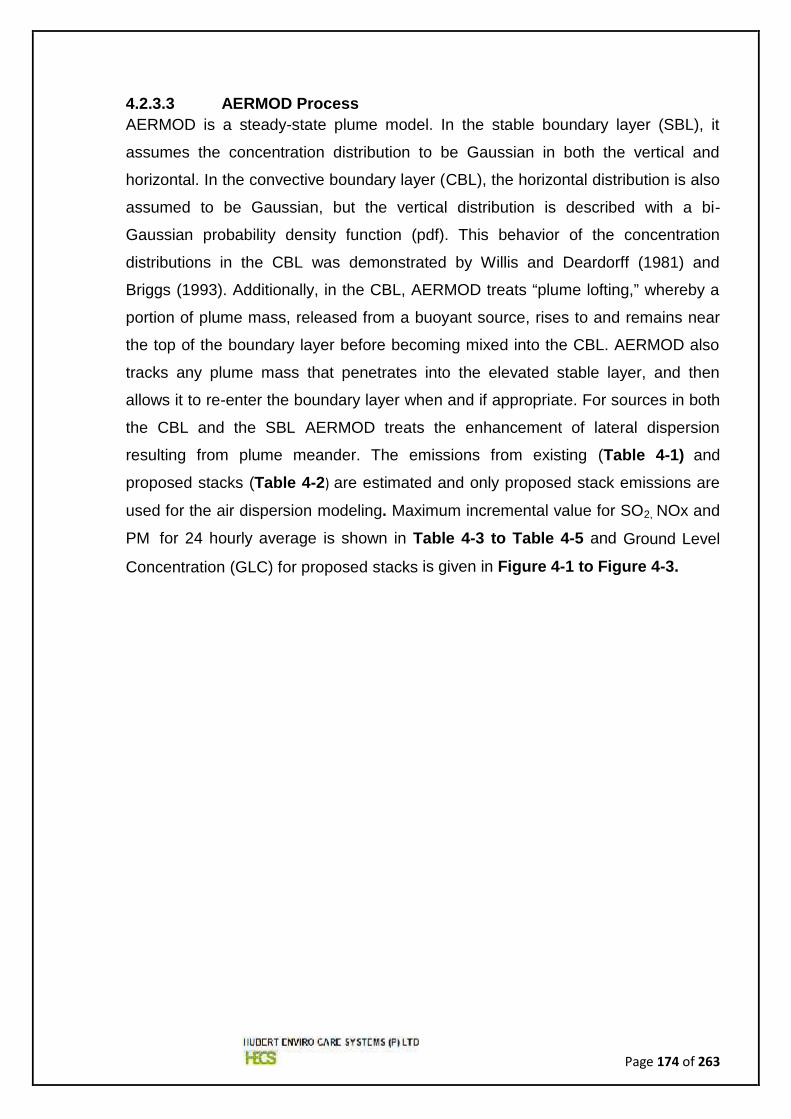
Page 174 of 263
4.2.3.3 AERMOD ProcessAERMOD is a steady-state plume model. In the stable boundary layer (SBL), it
assumes the concentration distribution to be Gaussian in both the vertical and
horizontal. In the convective boundary layer (CBL), the horizontal distribution is also
assumed to be Gaussian, but the vertical distribution is described with a bi-
Gaussian probability density function (pdf). This behavior of the concentration
distributions in the CBL was demonstrated by Willis and Deardorff (1981) and
Briggs (1993). Additionally, in the CBL, AERMOD treats “plume lofting,” whereby a
portion of plume mass, released from a buoyant source, rises to and remains near
the top of the boundary layer before becoming mixed into the CBL. AERMOD also
tracks any plume mass that penetrates into the elevated stable layer, and then
allows it to re-enter the boundary layer when and if appropriate. For sources in both
the CBL and the SBL AERMOD treats the enhancement of lateral dispersion
resulting from plume meander. The emissions from existing (Table 4-1) and
proposed stacks (Table 4-2) are estimated and only proposed stack emissions are
used for the air dispersion modeling. Maximum incremental value for SO2, NOx and
PM for 24 hourly average is shown in Table 4-3 to Table 4-5 and Ground Level
Concentration (GLC) for proposed stacks is given in Figure 4-1 to Figure 4-3.
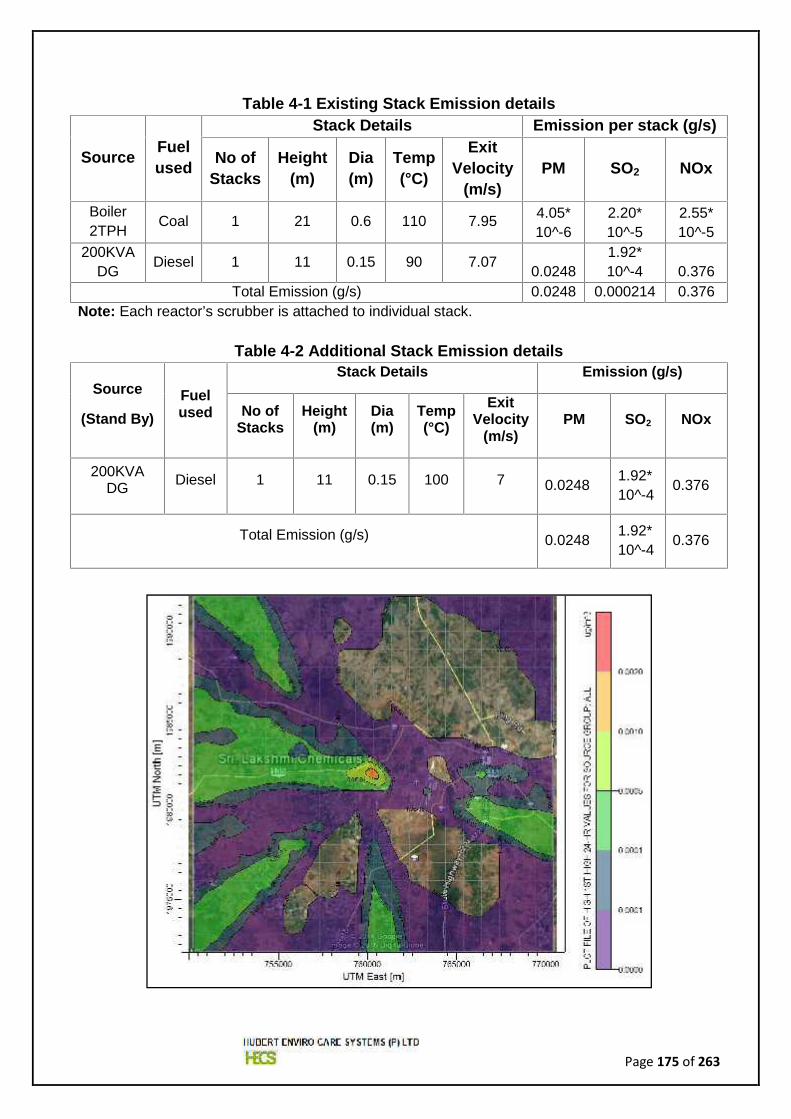
Page 175 of 263
Table 4-1 Existing Stack Emission details
Source Fuelused
Stack Details Emission per stack (g/s)
No ofStacks
Height(m)
Dia(m)
Temp(°C)
ExitVelocity
(m/s)PM SO2 NOx
Boiler2TPH Coal 1 21 0.6 110 7.95 4.05*
10^-62.20*10^-5
2.55*10^-5
200KVADG Diesel 1 11 0.15 90 7.07 0.0248
1.92*10^-4 0.376
Total Emission (g/s) 0.0248 0.000214 0.376Note: Each reactor’s scrubber is attached to individual stack.
Table 4-2 Additional Stack Emission details
Source
(Stand By)Fuelused
Stack Details Emission (g/s)
No ofStacks
Height(m)
Dia(m)
Temp(°C)
ExitVelocity
(m/s)PM SO2 NOx
200KVADG Diesel 1 11 0.15 100 7 0.0248 1.92*
10^-4 0.376
Total Emission (g/s) 0.0248 1.92*10^-4 0.376
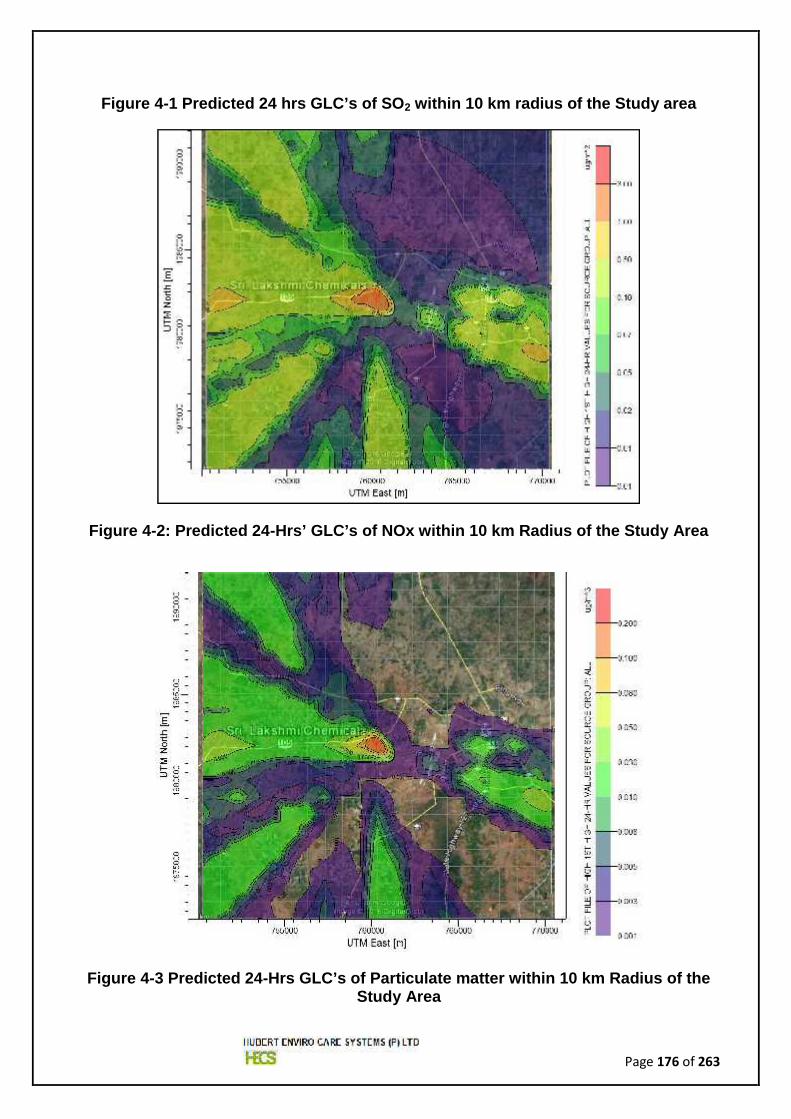
Page 176 of 263
Figure 4-1 Predicted 24 hrs GLC’s of SO2 within 10 km radius of the Study area
Figure 4-2: Predicted 24-Hrs’ GLC’s of NOx within 10 km Radius of the Study Area
Figure 4-3 Predicted 24-Hrs GLC’s of Particulate matter within 10 km Radius of theStudy Area
Page 177 of 263
Sulphur Dioxide (SO2)
Table 4-3: Estimated Post Project Scenario of ResultantSulphur Dioxide Concentration
S.NOUTM coordinates (m) Conc.
(µg/m3)Distance from
Center ofSources (Km)
Direction fromSource CenterE N
1 760343.4 1982057 0.0014 0 02 759338 1982057 0.00068 1 W3 758332.7 1982057 0.0004 2 W4 751295.6 1982057 0.00038 9 W5 769391.1 1979068 0.00037 9.5 ESE6 770396.5 1979068 0.00031 10.5 ESE7 752300.9 1982057 0.00028 8 W8 766375.2 1980064 0.00026 6.3 ESE9 750290.3 1982057 0.00026 10 W
10 757327.4 1982057 0.00024 3 W
Oxides of Nitrogen (NOx)
Table 4-4: Estimated Post Project Scenario of ResultantOxides Of Nitrogen Concentration
S.NOUTM coordinates (m) Conc.
(µg/m3)Distance from
Center ofSources (Km)
Direction fromSource CenterE N
1 760343.4 1982057 2.74173 0 02 759338 1982057 1.32891 1 W3 758332.7 1982057 0.77877 2 W4 751295.6 1982057 0.74193 9 W5 769391.1 1979068 0.73009 9.5 ESE6 770396.5 1979068 0.6005 10.5 ESE7 752300.9 1982057 0.55724 8 W8 750290.3 1982057 0.51643 10 W9 766375.2 1980064 0.51085 6.3 ESE
10 757327.4 1982057 0.47631 3 W
Particulate Matter
Table 4-5: Estimated Post Project Scenario of ResultantParticulate Matter Concentration
S.NOUTM coordinates (m) Conc.
(µg/m3)Distance from
Center ofSources (Km)
Direction fromSource CenterE N
1 760343.4 1982057 0.18084 0 02 759338 1982057 0.08765 1 W3 758332.7 1982057 0.05137 2 W4 751295.6 1982057 0.04894 9 W5 769391.1 1979068 0.04815 9.5 ESE
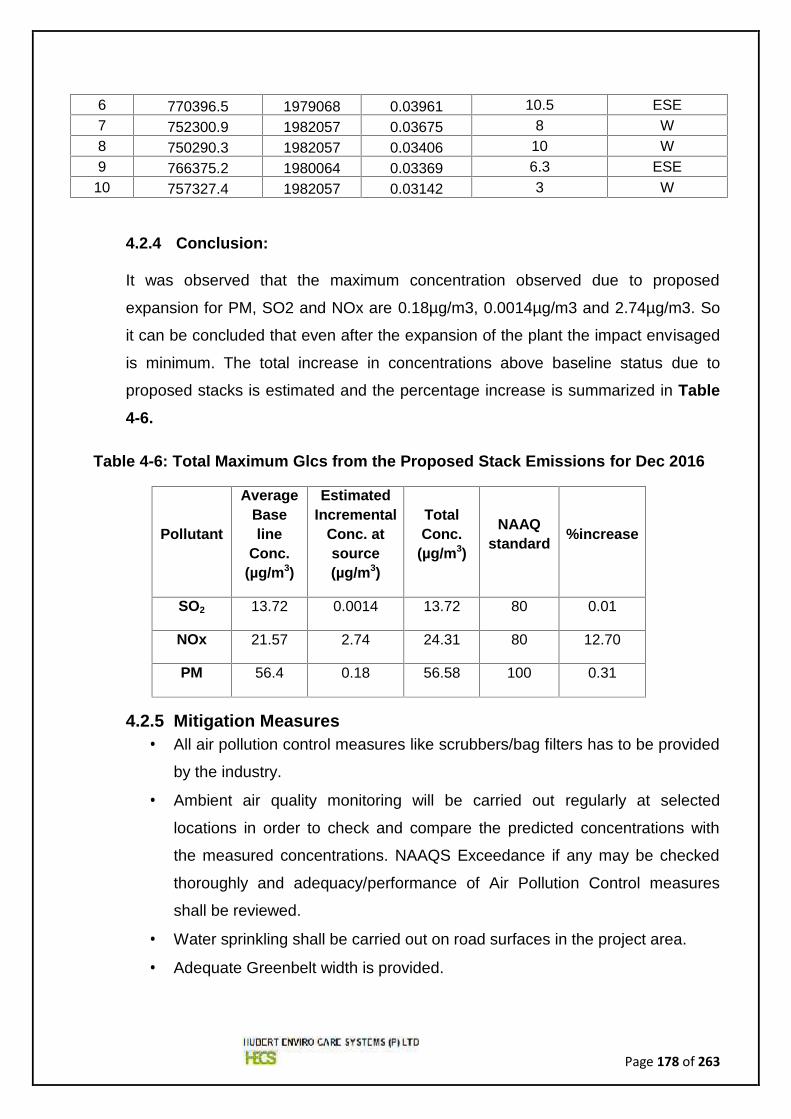
Page 178 of 263
6 770396.5 1979068 0.03961 10.5 ESE7 752300.9 1982057 0.03675 8 W8 750290.3 1982057 0.03406 10 W9 766375.2 1980064 0.03369 6.3 ESE
10 757327.4 1982057 0.03142 3 W
4.2.4 Conclusion:
It was observed that the maximum concentration observed due to proposed
expansion for PM, SO2 and NOx are 0.18µg/m3, 0.0014µg/m3 and 2.74µg/m3. So
it can be concluded that even after the expansion of the plant the impact envisaged
is minimum. The total increase in concentrations above baseline status due to
proposed stacks is estimated and the percentage increase is summarized in Table4-6.
Table 4-6: Total Maximum Glcs from the Proposed Stack Emissions for Dec 2016
Pollutant
AverageBaseline
Conc.(µg/m3)
EstimatedIncremental
Conc. atsource(µg/m3)
TotalConc.
(µg/m3)
NAAQstandard %increase
SO2 13.72 0.0014 13.72 80 0.01
NOx 21.57 2.74 24.31 80 12.70
PM 56.4 0.18 56.58 100 0.31
4.2.5 Mitigation Measures All air pollution control measures like scrubbers/bag filters has to be provided
by the industry.
Ambient air quality monitoring will be carried out regularly at selected
locations in order to check and compare the predicted concentrations with
the measured concentrations. NAAQS Exceedance if any may be checked
thoroughly and adequacy/performance of Air Pollution Control measures
shall be reviewed.
Water sprinkling shall be carried out on road surfaces in the project area.
Adequate Greenbelt width is provided.
Page 179 of 263
Trucks with cargo susceptible for fugitive suspension will be covered with
tarpaulin. All the vehicles will be periodically checked to ensure compliance
to the emission standards.
In addition, EMC will ensure that unit will be with essential pollution control
measures as to be stated by KSPCB in their CFO.
4.2.6 Potential Impact of Noise Environment
Noise generation sources during operation phase is classified into two categories:
Stationary sources due to operation of heavy duty machineies at the project
site like Boilers, Compressors, DG sets, Pumps etc.
Mobile sources corresponding to mainly vehicular traffic for staff mobilization,
materials, material transportation, liquid fuel transportation to project site, etc.
Vibrations are expected to be generated by various activities associated with
the proposed project during operational phase. The impact of vibrations
beyond the site would be negligible during normal operation phase. However,
the impacts on workers engaged in the plant area would be considerable due
to occupational exposure. The proposed fixed major equipment/units such as
boiler house, compressors, pumps, DG sets etc., also generate vibrations
during operational phase and may cause exposures to the workers/operators
engaged at these units.
4.2.6.1 Mitigation Measures The major noise generating equipment like Compressors, DG sets, Boiler
Feed water pumps etc. will be enclosed in an acoustic enclosure designed for
an insertion loss of 25 dB (A) and silencers to other equipment etc.
Major noise generating equipment will be designed with 85 dB (A) ensuring
cumulative noise at 1.0 m remains at 85 dB (A).
The occupational noise exposure to the workers in the form of eight hourly
time weighted average will be maintained well within the prescribed
Occupational Safety and Health Administration (OSHA) standard limits.
Adequate PPE will be provided to the staff exposing to noise risks.
Acoustic silencers will be provided in equipment wherever necessary.
Page 180 of 263
Acoustic design with sound proof glass panelling will be provided for critical
operator cabins / control rooms of individual modules as well as central
control facilities.
Use of personal protective equipments/devices such as ear-muffs, ear plugs
etc. will be strictly enforced for the workers engaged in high noise areas.
Periodic maintenance of the equipment to be used in the developmental
works will be carried out. Worn out parts will be replaced and rotating parts
will be lubricated to minimise noise emissions.
Implementation of greenbelt for noise attenuation will be undertaken: shrub
plantation; landscaping with horticulture; and Tree plantation at vehicle
parking areas and along approach roads.
Ambient noise levels will be monitored at regular intervals during operational
phase of the project.
Low vibration generating machines/equipment will be selected to meet
international standards and foundations will be so designed to minimise
vibrations and secured properly.
Vibration generating sources and their platforms should be maintained
properly to minimize vibrations and related impacts.
Various standards pertaining to vibrations are formulated by statutory bodies
like Bureau of Indian Standards (BIS) and Director General of Mines Safety
(DGMS), which is being practiced would be continued to mitigate the workers’
health effects due to vibrations.
Vibration dampers will be provided around the source of generation.
Transportation Management Plan will be prepared and the transportation of
construction materials will be planned in line with the same.
4.2.7 Impact on Existing Water Resources
During operation phase, water requirement of proposed units will be mainly for
process, condenser cooling water, DM water for steam generation, service water,
domestic use, fire water, green belt etc.
The water requirement for the existing facility is 5 KLD, which is met from private
water suppliers. The additional water requirement due to the expansion will be 19.8
Page 181 of 263
KLD, and thus the total water requirement will be 24.8 KLD. The total water
requirement will be met from private water suppliers and KIADB.
Wastewater generated from the project will be treated in ETP and Zero Liquid
Discharge will be maintained, hence the impact due to the proposed project is very
minimal.
4.2.7.1 Impacts to Surface Water Bodies
The surface water and groundwater are the life line of the villages. All the ponds in
the area are working as recharge sites for the under lying groundwater and hence
the surface water and ground water systems are acting like a single unit and
therefore cannot be seen in Isolation.
Any contamination in surface drainage due to operation of project could collapse the
system and will have serious impacts to the water resources especially the
availability of potable water in the PIA area. The impacts will be high in the core
area especially the 5.0 km radius area. Therefore the efficiency of the Zero waste
discharge will be ensured with proper regulatory and institutional arrangements.
4.2.7.2 Mitigation Measures
Though the proposed development will not draw Groundwater, the following
measures proposed as a part of development to improve the ground water scenario
and also to ensure that ground water is not contaminated.
Strategic plans such as implementing the following structures for rainfall harvesting
and groundwater recharging purposes in project site will be adhered.
Recharge pits
Only roof-top rain water harvesting
Rainwater storage ponds/tanks
Storage cum recharge ponds
Monitoring of water quality and groundwater level variations in the project site.
4.2.8 Impact due to Wastewater Generation
The source of wastewater generation from the project is as follows:
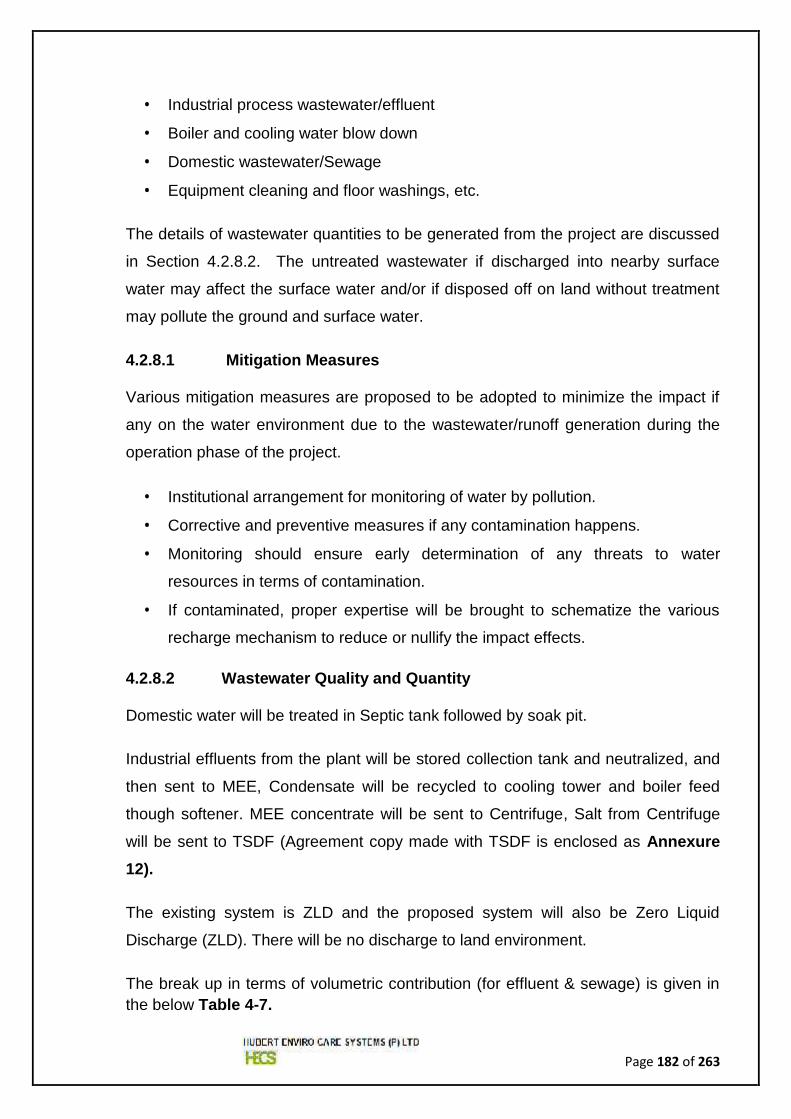
Page 182 of 263
Industrial process wastewater/effluent
Boiler and cooling water blow down
Domestic wastewater/Sewage
Equipment cleaning and floor washings, etc.
The details of wastewater quantities to be generated from the project are discussed
in Section 4.2.8.2. The untreated wastewater if discharged into nearby surface
water may affect the surface water and/or if disposed off on land without treatment
may pollute the ground and surface water.
4.2.8.1 Mitigation Measures
Various mitigation measures are proposed to be adopted to minimize the impact if
any on the water environment due to the wastewater/runoff generation during the
operation phase of the project.
Institutional arrangement for monitoring of water by pollution.
Corrective and preventive measures if any contamination happens.
Monitoring should ensure early determination of any threats to water
resources in terms of contamination.
If contaminated, proper expertise will be brought to schematize the various
recharge mechanism to reduce or nullify the impact effects.
4.2.8.2 Wastewater Quality and Quantity
Domestic water will be treated in Septic tank followed by soak pit.
Industrial effluents from the plant will be stored collection tank and neutralized, and
then sent to MEE, Condensate will be recycled to cooling tower and boiler feed
though softener. MEE concentrate will be sent to Centrifuge, Salt from Centrifuge
will be sent to TSDF (Agreement copy made with TSDF is enclosed as Annexure12).
The existing system is ZLD and the proposed system will also be Zero Liquid
Discharge (ZLD). There will be no discharge to land environment.
The break up in terms of volumetric contribution (for effluent & sewage) is given inthe below Table 4-7.
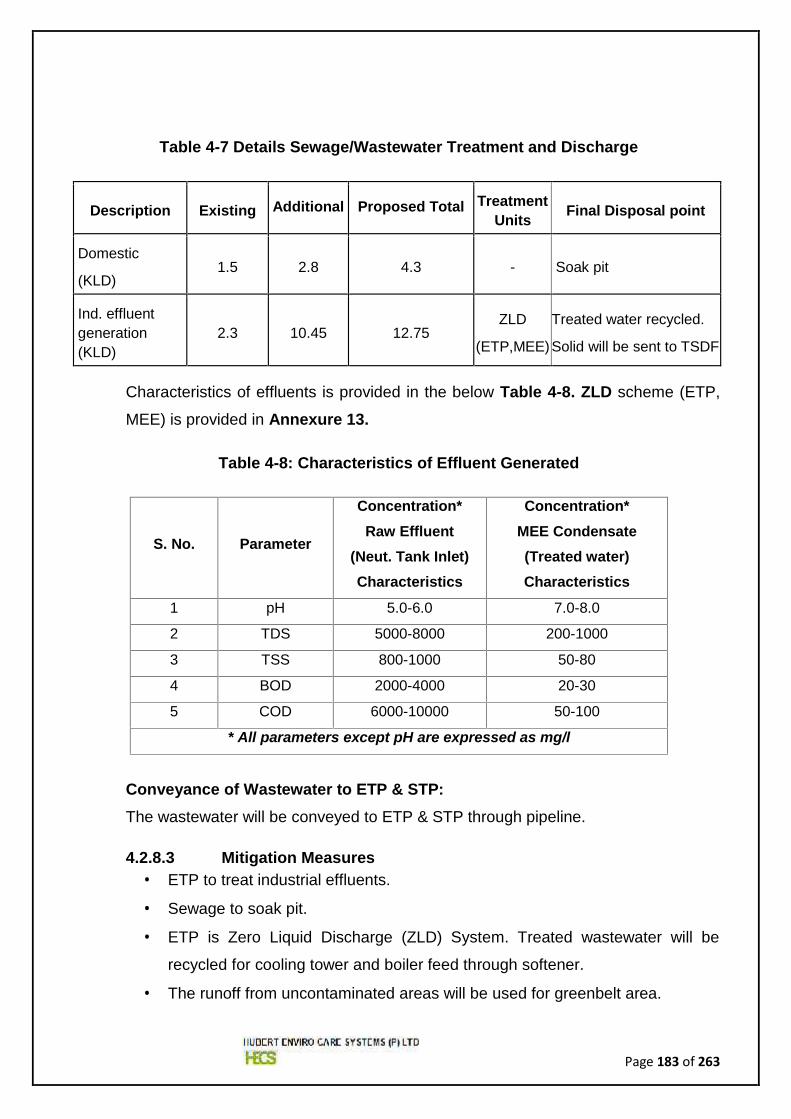
Page 183 of 263
Table 4-7 Details Sewage/Wastewater Treatment and Discharge
Description Existing Additional Proposed Total TreatmentUnits Final Disposal point
Domestic
(KLD)1.5 2.8 4.3 - Soak pit
Ind. effluentgeneration(KLD)
2.3 10.45 12.75ZLD
(ETP,MEE)
Treated water recycled.
Solid will be sent to TSDF
Characteristics of effluents is provided in the below Table 4-8. ZLD scheme (ETP,
MEE) is provided in Annexure 13.
Table 4-8: Characteristics of Effluent Generated
S. No. Parameter
Concentration*Raw Effluent
(Neut. Tank Inlet)Characteristics
Concentration*MEE Condensate(Treated water)Characteristics
1 pH 5.0-6.0 7.0-8.0
2 TDS 5000-8000 200-1000
3 TSS 800-1000 50-80
4 BOD 2000-4000 20-30
5 COD 6000-10000 50-100
* All parameters except pH are expressed as mg/l
Conveyance of Wastewater to ETP & STP:The wastewater will be conveyed to ETP & STP through pipeline.
4.2.8.3 Mitigation Measures ETP to treat industrial effluents.
Sewage to soak pit.
ETP is Zero Liquid Discharge (ZLD) System. Treated wastewater will be
recycled for cooling tower and boiler feed through softener.
The runoff from uncontaminated areas will be used for greenbelt area.
Page 184 of 263
The oil contaminated water, if any will be sent to oil water separator;
separated oil will be sent to KSPCB approved vendors and water will be sent
to ETP for further treatment. The treated water will be re used for various
applications.
4.2.9 Biological Environment
4.2.9.1 Impact on Migratory Paths for Wildlife and Forest BlocksThere are no identified migratory paths for major and minor wildlife in the project
site and the study area. The identified fauna which are observed at the project site
and in the study area are local migrants only. Therefore the proposed project
operations are not likely to have any adverse impact on the paths for avid-fauna.
4.2.9.2 Mitigation Measures Discharge of wastes/wastewater without treatment into the water bodies during
the operation phase would not be allowed.
Awareness will be given to workers about the importance and conservation of
terrestrial ecology and biodiversity.
4.2.10 Solid Waste Management
4.2.10.1 Impact due to Solid Waste Generation
During operation phase, various types of solid waste are likely to be generated
which can be broadly categorized as Hazardous Waste and Non-hazardous Waste.
Further, the generated solid waste generation may include Biodegradable,
Recyclable and Inert compounds. The details of solid waste generation and its
management proposed are discussed in Chapter 2, Section 2.6.5. If the solid
waste generated is not properly managed and disposed in unauthorized manner, it
will impact on soil quality, groundwater and air quality.
4.2.10.2 Solid Waste Management during Operation Phase
Strict guidelines will be put in place in order to manage the solid waste generation
during the operational phase of the development. The main goals of the guidelines
will be to ensure adopting recycling techniques and encouraging sorting of solid
waste at source into organic and inorganic wastes. Waste management is given in
Figure 4-4.
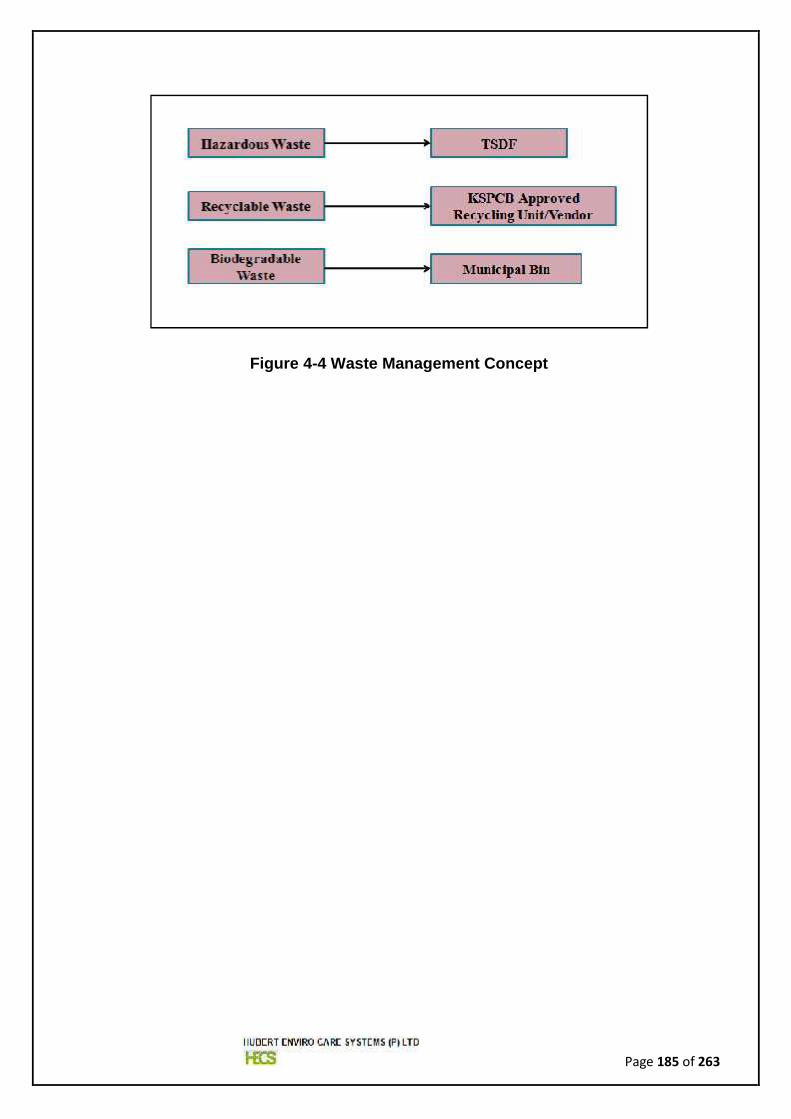
Page 185 of 263
Figure 4-4 Waste Management Concept
Page 186 of 263
CHAPTER – 5Analysis of Alternatives
Page 187 of 263
5. ANALYSIS OF ALTERNATIVES (Technology & Site)
5.1 Introduction
This project doesn’t have alternative for site and technology and the justifications
are described below
5.2 Alternate Site Analysis
Alternate sites were not considered due to location and facilities at KIADB, Industrial
Area & Existing infrastructure and facilities is adequate for the proposed expansion
of production capacity.
5.3 Process Alternative
The process used for production is made by M/s. Sri Lakshmi Chemicals. There
would not be any changes in the process. The process made by M/s Sri Lakshmi
Chemicals is cost effective with high quality in output.
Page 188 of 263
CHAPTER – 6Environmental Monitoring Program
Page 189 of 263
6. ENVIRONMENTAL MONITORING PROGRAM
6.1 Introduction
The primary aim of environmental monitoring program is to formulate a systematic,
site-specific plan for monitoring the environmental parameters within the impact
area, during and after commissioning of the project, which would aid in assessing
the effectiveness of mitigation and environmental protection measures implemented
for the proposed project based on the existing environmental scenario and the
probable environmental impacts appraisal.
The plan framed for the intended facility will describe:
The details of the proposed mitigation measures taken for safeguarding the
environment at the project site as well as in the vicinity of the industrial site
Details of management plans (Greenbelt development plan, Solid waste
management plan etc)
Post project environmental monitoring programme to be undertaken after
commissioning of the project.
The associated cost components of the pollution control systems that will be
installed at the site.
For each of the environmental attributes, the monitoring plan specifies the
parameters to be monitored, location of monitoring sites, frequency and duration
of monitoring and it also denotes the applicable standards, implementation and
supervising responsibilities.
6.2 Objectives
Ensure day to day operational activities are conducted in a manner in
compliance with the applicable regulatory approvals including legislation and
industry standards
Evaluate the adequacy of mitigation and pollution control measures
implemented for reducing the adverse impacts caused during the construction
Page 190 of 263
and operation stage and suggest additional mitigation measures, if appropriate,
in the light of the results
Define a detailed framework to monitor and document for achieving full
compliance with statutory requirements
Encourage good environmental management practices through planning,
commitment and continuous improvement
Develop clearly defined environmental monitoring program designed to assess
the nature and extent of environmental impacts of the proposed operations and
progressively refine such programs against the targets
Define roles and responsibilities of site personnel and ensure that all people
onsite are fully informed of their responsibilities and accountabilities with regard
to the environment
To comply with all regulations stipulated by the Central Pollution Control Board
(CPCB)/ State Pollution Control Board (SPCB) related to air emission and liquid
effluent discharge as per air and water pollution control act/ laws
To handle hazardous wastes as per the Hazardous Waste (Management &
Handling) Rules 1989 and Other Wastes (Management and Transboundary
Movement) Rules, 2016 and subsequent amendments
Review, improve and update environmental management procedures and
standards
Establish response procedures for actual/potential environmental impacts
including community complaints and ensure corrective action is taken
Perspective budgeting and allocation of funds for environmental management
expenditure, Continuous development and search for innovative technologies
for a cleaner and better environment
Page 191 of 263
6.3 Environmental Management Plan during Operation Phase
The control measures which will be imposed to mitigate the impacts caused during
the operation phase of the project are as follows:
1. Periodic monitoring of the environmental attributes to check the adequacy and
effectiveness of the pollution control measures employed.
2. The major sources of emission are DG sets, boiler stack, production block
(reactors) scrubber stacks which will be of adequate height to disperse the
pollutants. Adequate greenbelt has been developed in the existing facility to
mitigate the pollution arising due to movement of vehicles. Regular monitoring
of DG-Stack and Ambient air quality are carried out.
3. Appropriate treatment and disposal method is followed for the liquid effluents
generated in the existing plant and proper treatment and disposal procedure is
proposed for the liquid effluents of proposed new facility. The detailed waste
treatment and disposal methods are discussed in the Chapter 4, Section4.2.8.2.
4. Noise pollution is curbed by providing acoustic enclosures for D.G sets, boiler
and reactors; thereby the ambient noise levels is maintained below the CPCB
limits of 75 dB (A) for industrial areas. Personal protective equipments are
provided to those workers who work in the areas of high noise.
5. Rainwater harvesting system will be implemented for the sustainability of
underground water system.
6. Proper maintenance of greenbelt will be ensured.
7. Adequate safety measures conforming to the occupational health and safety
policy will be taken to prevent accidents/hazards to the workers.
8. Necessary energy saving measures like fixing of LED lamps, operational
schedule, awareness program etc., will be made.
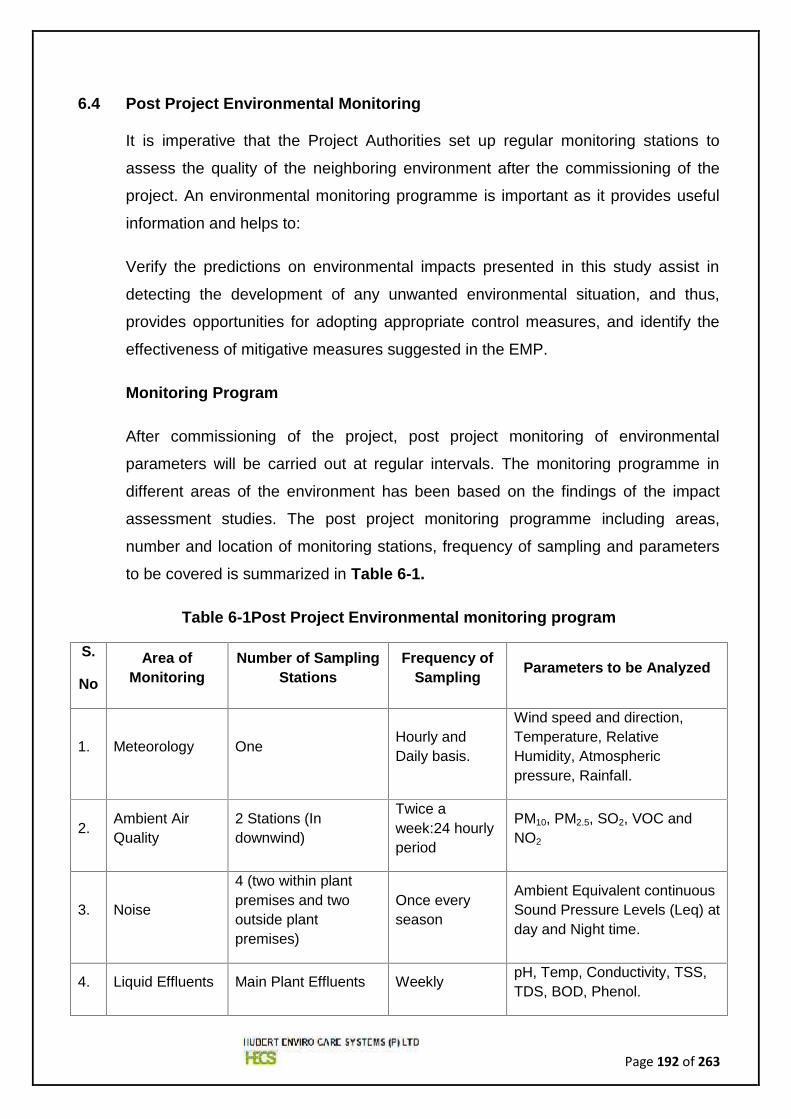
Page 192 of 263
6.4 Post Project Environmental Monitoring
It is imperative that the Project Authorities set up regular monitoring stations to
assess the quality of the neighboring environment after the commissioning of the
project. An environmental monitoring programme is important as it provides useful
information and helps to:
Verify the predictions on environmental impacts presented in this study assist in
detecting the development of any unwanted environmental situation, and thus,
provides opportunities for adopting appropriate control measures, and identify the
effectiveness of mitigative measures suggested in the EMP.
Monitoring Program
After commissioning of the project, post project monitoring of environmental
parameters will be carried out at regular intervals. The monitoring programme in
different areas of the environment has been based on the findings of the impact
assessment studies. The post project monitoring programme including areas,
number and location of monitoring stations, frequency of sampling and parameters
to be covered is summarized in Table 6-1.
Table 6-1Post Project Environmental monitoring program
S.
No
Area ofMonitoring
Number of SamplingStations
Frequency ofSampling Parameters to be Analyzed
1. Meteorology One Hourly andDaily basis.
Wind speed and direction,Temperature, RelativeHumidity, Atmosphericpressure, Rainfall.
2. Ambient AirQuality
2 Stations (Indownwind)
Twice aweek:24 hourlyperiod
PM10, PM2.5, SO2, VOC andNO2
3. Noise
4 (two within plantpremises and twooutside plantpremises)
Once everyseason
Ambient Equivalent continuousSound Pressure Levels (Leq) atday and Night time.
4. Liquid Effluents Main Plant Effluents Weekly pH, Temp, Conductivity, TSS,TDS, BOD, Phenol.
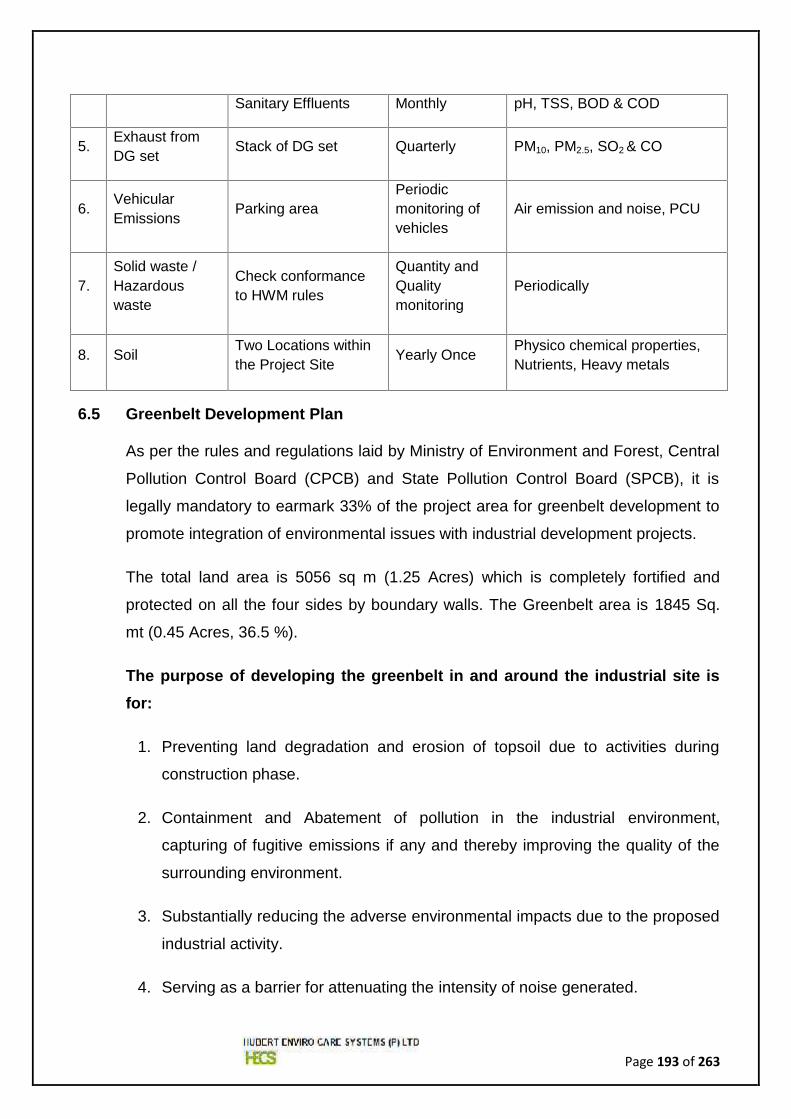
Page 193 of 263
Sanitary Effluents Monthly pH, TSS, BOD & COD
5. Exhaust fromDG set Stack of DG set Quarterly PM10, PM2.5, SO2 & CO
6. VehicularEmissions Parking area
Periodicmonitoring ofvehicles
Air emission and noise, PCU
7.Solid waste /Hazardouswaste
Check conformanceto HWM rules
Quantity andQualitymonitoring
Periodically
8. Soil Two Locations withinthe Project Site Yearly Once Physico chemical properties,
Nutrients, Heavy metals
6.5 Greenbelt Development Plan
As per the rules and regulations laid by Ministry of Environment and Forest, Central
Pollution Control Board (CPCB) and State Pollution Control Board (SPCB), it is
legally mandatory to earmark 33% of the project area for greenbelt development to
promote integration of environmental issues with industrial development projects.
The total land area is 5056 sq m (1.25 Acres) which is completely fortified and
protected on all the four sides by boundary walls. The Greenbelt area is 1845 Sq.
mt (0.45 Acres, 36.5 %).
The purpose of developing the greenbelt in and around the industrial site isfor:
1. Preventing land degradation and erosion of topsoil due to activities during
construction phase.
2. Containment and Abatement of pollution in the industrial environment,
capturing of fugitive emissions if any and thereby improving the quality of the
surrounding environment.
3. Substantially reducing the adverse environmental impacts due to the proposed
industrial activity.
4. Serving as a barrier for attenuating the intensity of noise generated.
Page 194 of 263
5. Enhancing the biodiversity index of the region.
6. Adding aesthetic value to the project area.
7. Maintaining the ecological equilibrium of the area.
Development of greenbelt includes:
Plantation along the boundary / periphery and all over the project site for protection
against particulate dispersion and noise dispersion. The peripheral greenbelt will
vary in width to suit the plant design requirement.
Plantation along approach road and pathways for protection against noise and
vehicular emissions.
Existing Species:1. Neem (Azadirchta indica) – 30 Nos2. Ficus bengalesis -10 Nos3. Gulmohar (Delonix regia) -10 Nos4. Saraca indica – 20 Nos
6.6 Environment Management Cell
For the effective implementation of the mitigation measures and consistent
functioning of the proposed project, an Environmental Management System has
been proposed (EMS). The EMS will include the following:
Environmental Management Cell
Environmental Monitoring Program
Personnel Training
Regular Environmental Audits and Corrective Action Plan
Documentation-Standard Operating procedures of Environmental Management
6.7 Hierarchical system/administrative order of Sri Lakshmi Chemicals limited forEnvironmental management
The following organizational set up is formulated to ensure the effective
implementation measures and to conduct environmental monitoring.
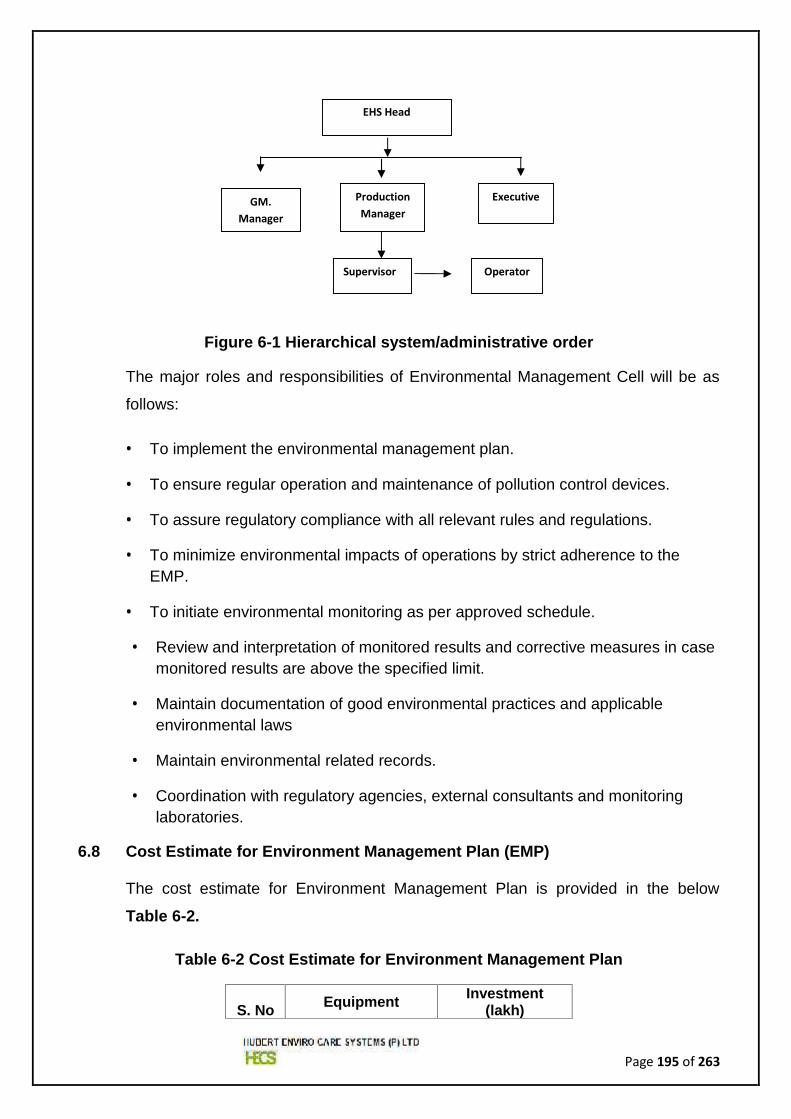
Page 195 of 263
Figure 6-1 Hierarchical system/administrative order
The major roles and responsibilities of Environmental Management Cell will be as
follows:
To implement the environmental management plan.
To ensure regular operation and maintenance of pollution control devices.
To assure regulatory compliance with all relevant rules and regulations.
To minimize environmental impacts of operations by strict adherence to theEMP.
To initiate environmental monitoring as per approved schedule.
Review and interpretation of monitored results and corrective measures in casemonitored results are above the specified limit.
Maintain documentation of good environmental practices and applicableenvironmental laws
Maintain environmental related records.
Coordination with regulatory agencies, external consultants and monitoringlaboratories.
6.8 Cost Estimate for Environment Management Plan (EMP)
The cost estimate for Environment Management Plan is provided in the below
Table 6-2.
Table 6-2 Cost Estimate for Environment Management Plan
S. No Equipment Investment(lakh)
EHS Head
GM.Manager
ProductionManager
Executive
Supervisor Operator
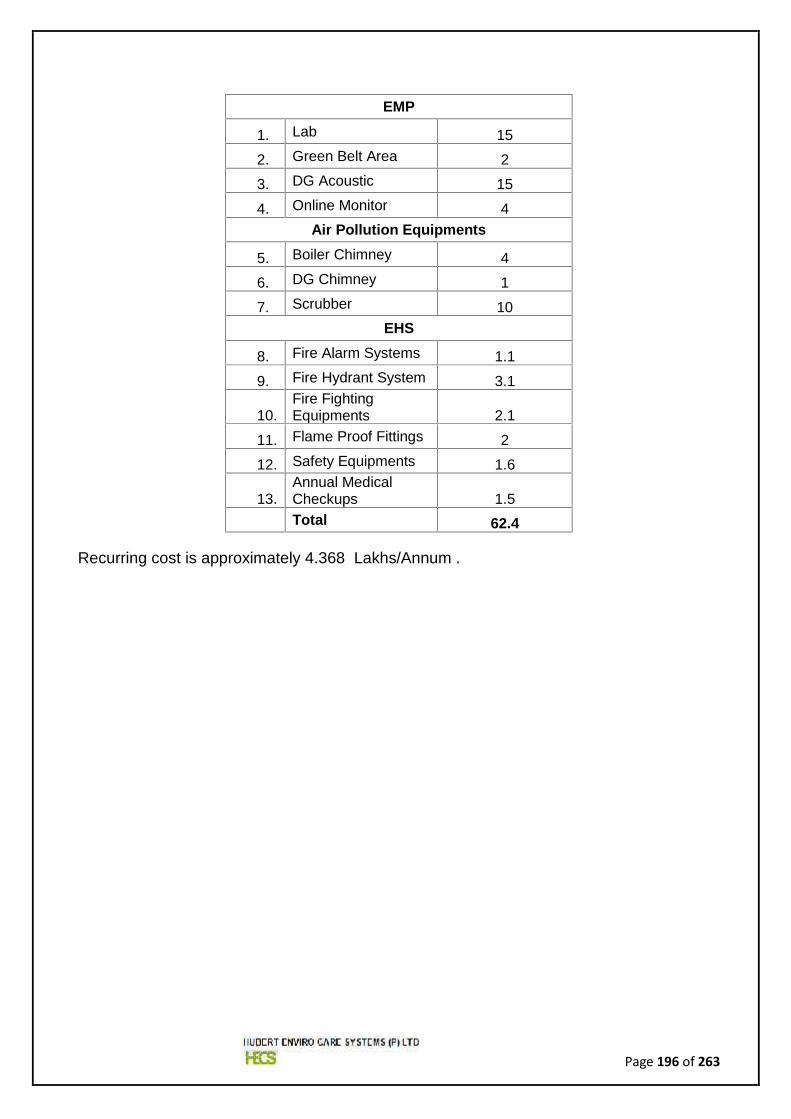
Page 196 of 263
EMP
1. Lab 15
2. Green Belt Area 2
3. DG Acoustic 15
4. Online Monitor 4Air Pollution Equipments
5. Boiler Chimney 4
6. DG Chimney 1
7. Scrubber 10EHS
8. Fire Alarm Systems 1.1
9. Fire Hydrant System 3.1
10.Fire FightingEquipments 2.1
11. Flame Proof Fittings 2
12. Safety Equipments 1.6
13.Annual MedicalCheckups 1.5Total 62.4
Recurring cost is approximately 4.368 Lakhs/Annum .

Page 197 of 263
CHAPTER – 7Additional Studies
Page 198 of 263
7. ADDITIONAL STUDIES
7.1 Public Hearing
The proposed project is located in Notified KIADB Industrial Area, the projects
attracts the Category B as per EIA Notification 2006; As per MoEF & CC Office
Memorandum, dated 3rd June 2009; EIA Notification, 2006 in para 7 (i), sub section
III exempted from undertaking public hearing for expansion or modernization or
change of product mix in existing projects.
7.2 Disaster Management Plan
An onsite emergency plan is attributed to the response plan that contains and
minimizes the effects due to emergencies within the installations which have a
potential to cause damage to people and facilities within the installation premises.
The On-site and offsite emergency Plan is attached as Annexure 14.
7.3 R&R ACTION PLANS
Rehabilitation and resettlement is not applicable since the project is in KIADB
Industrial Area, Kolhar, Bidar.
7.4 Risk Assessment
The Detailed risk assessment report for the proposed project is enclosed as
Annexure 15.
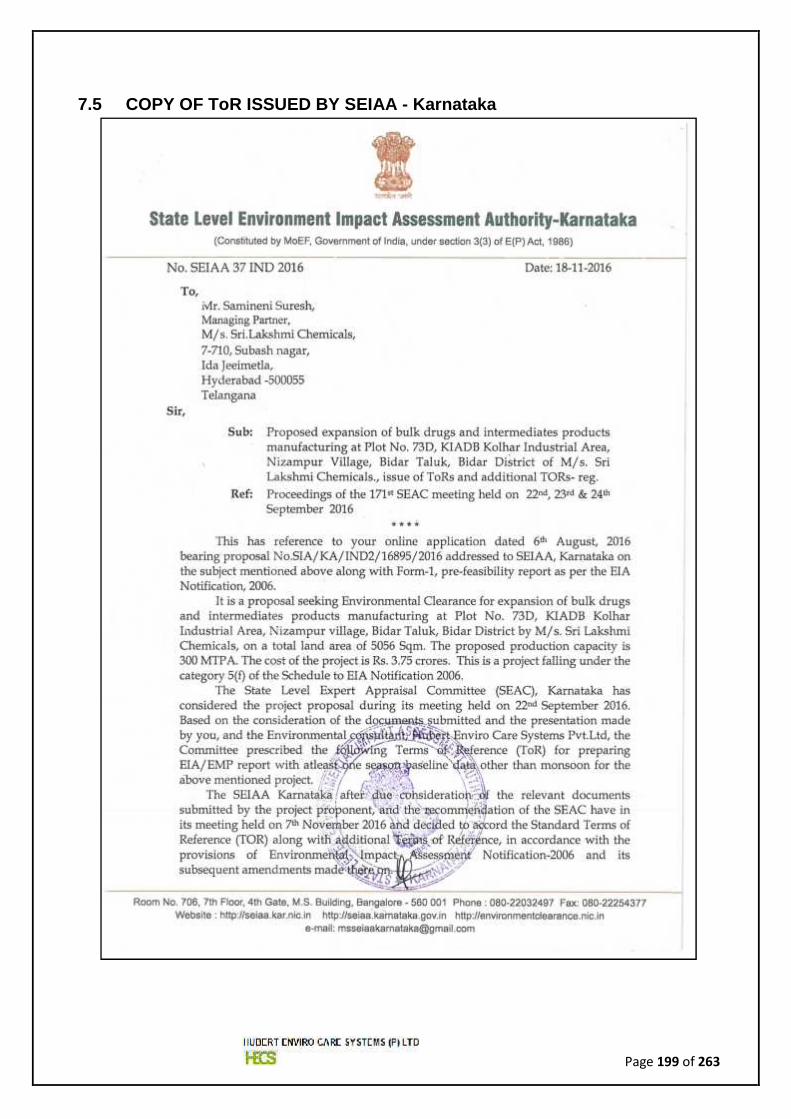
Page 199 of 263
7.5 COPY OF ToR ISSUED BY SEIAA - Karnataka
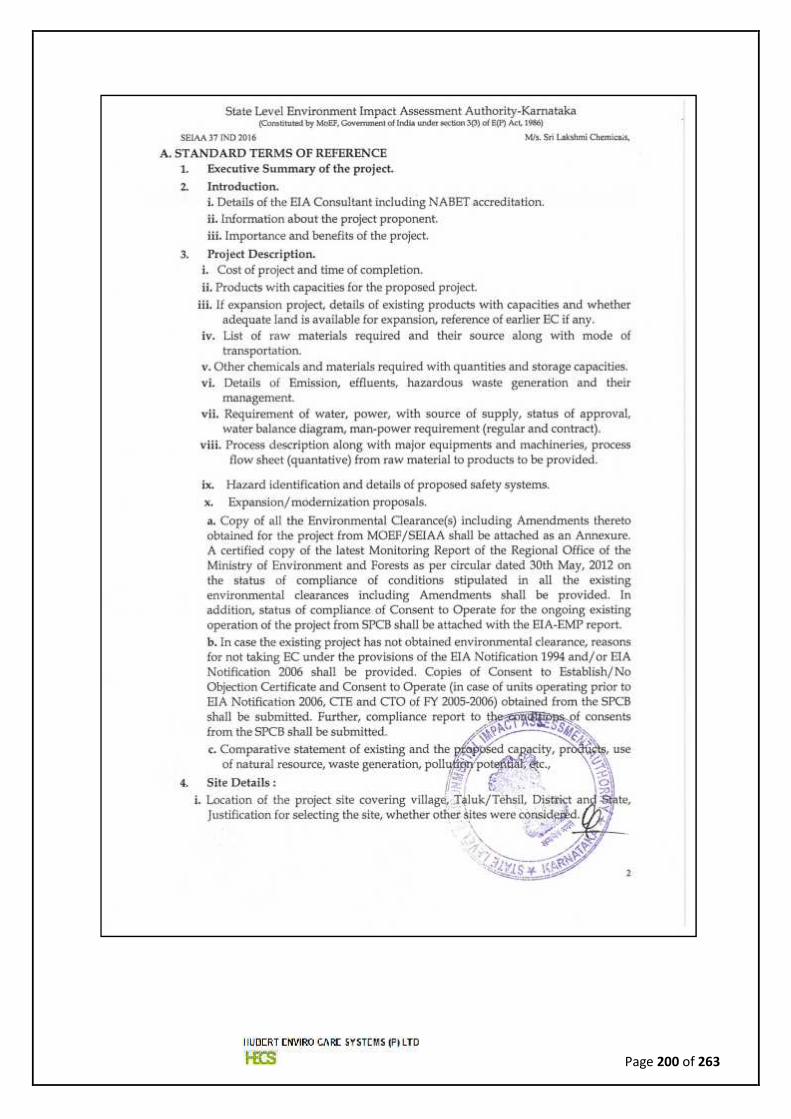
Page 200 of 263

Page 201 of 263
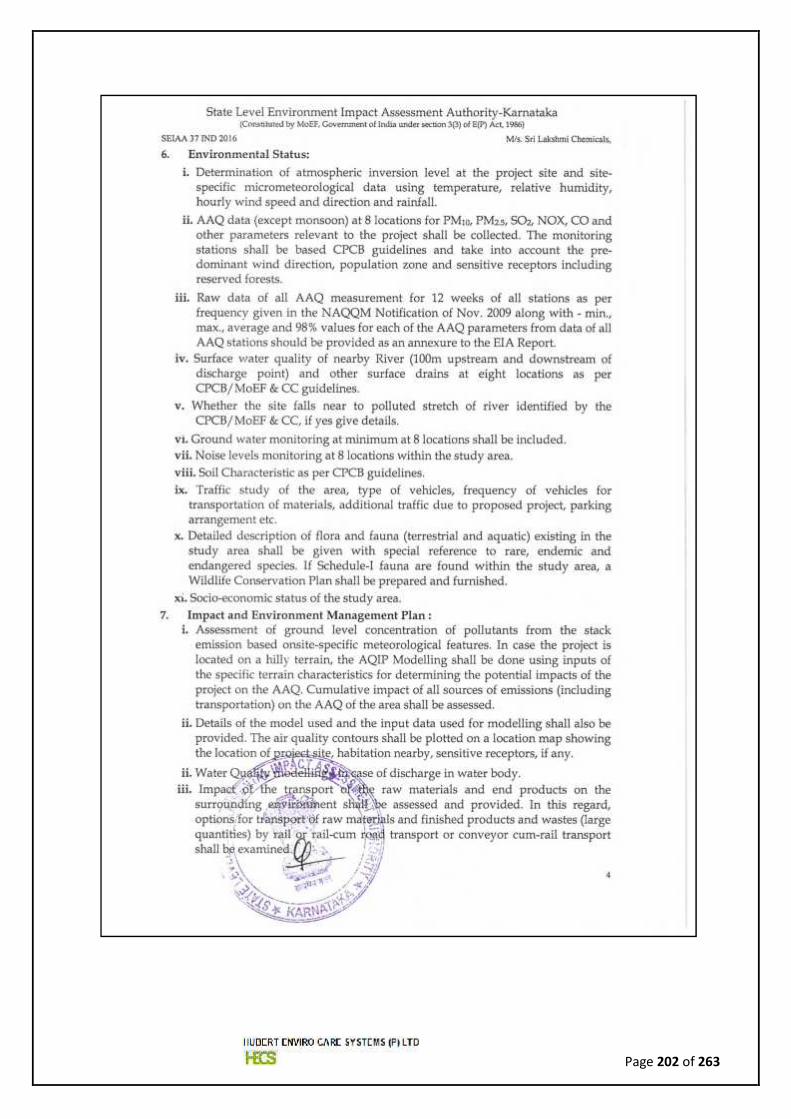
Page 202 of 263
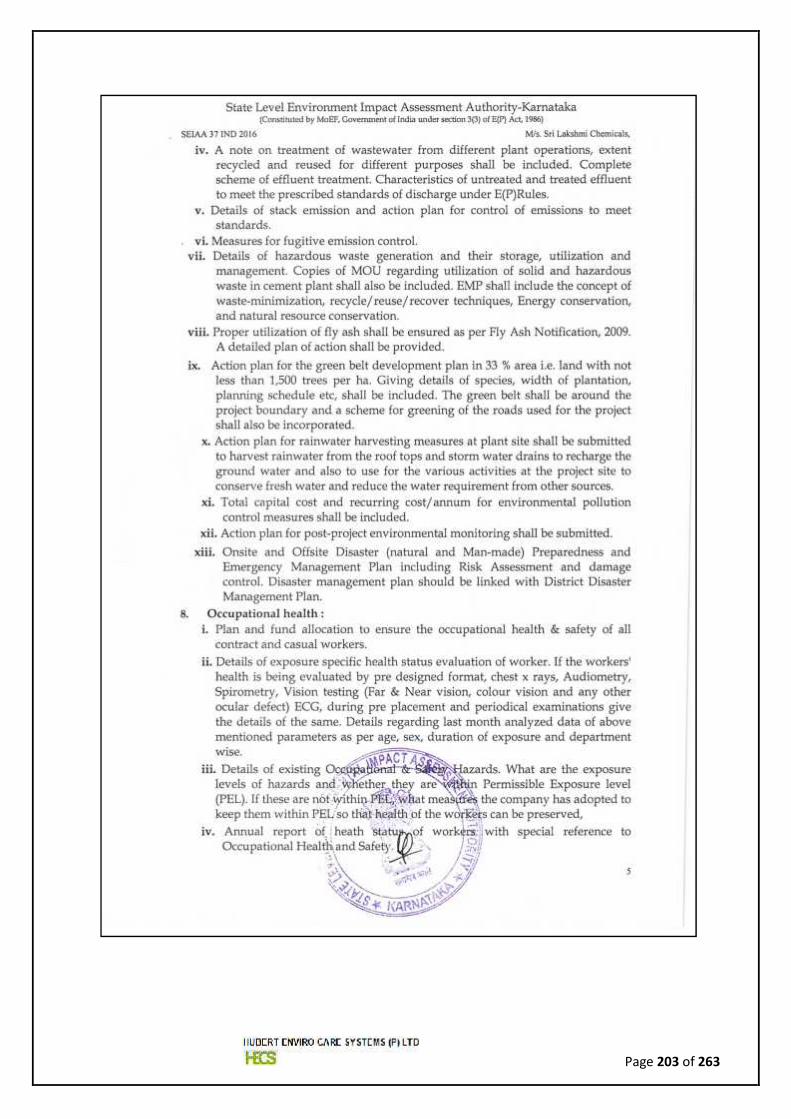
Page 203 of 263
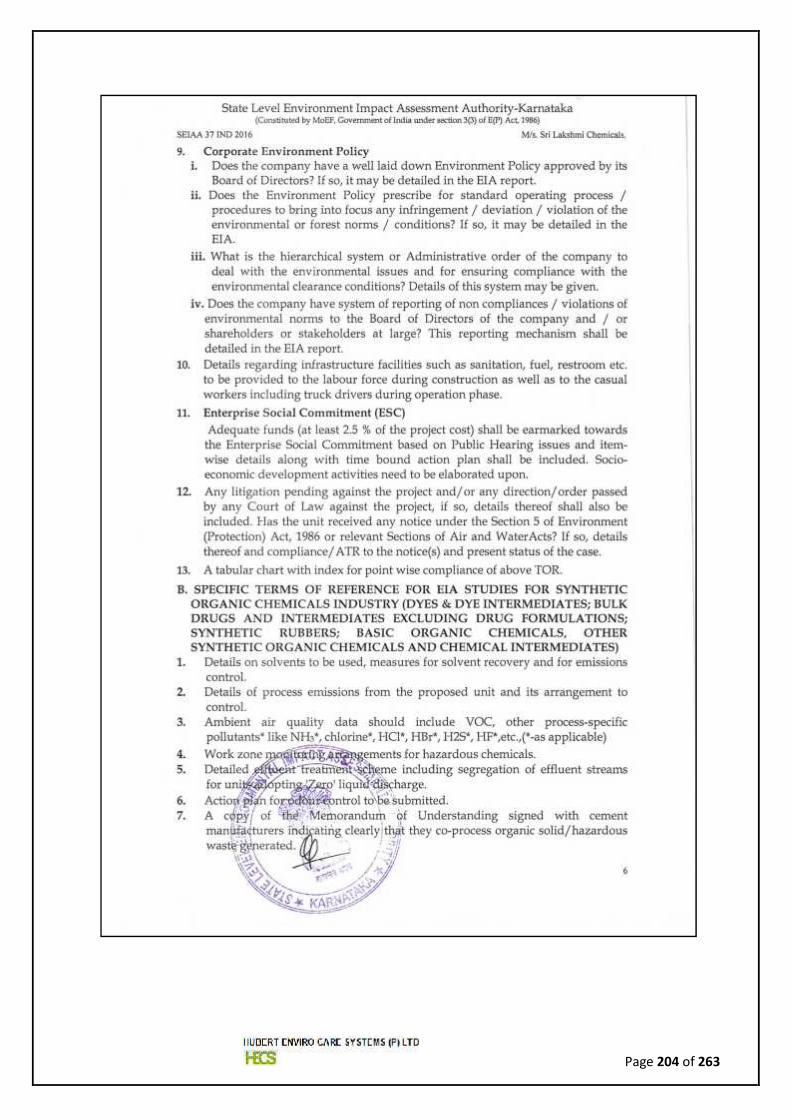
Page 204 of 263

Page 205 of 263
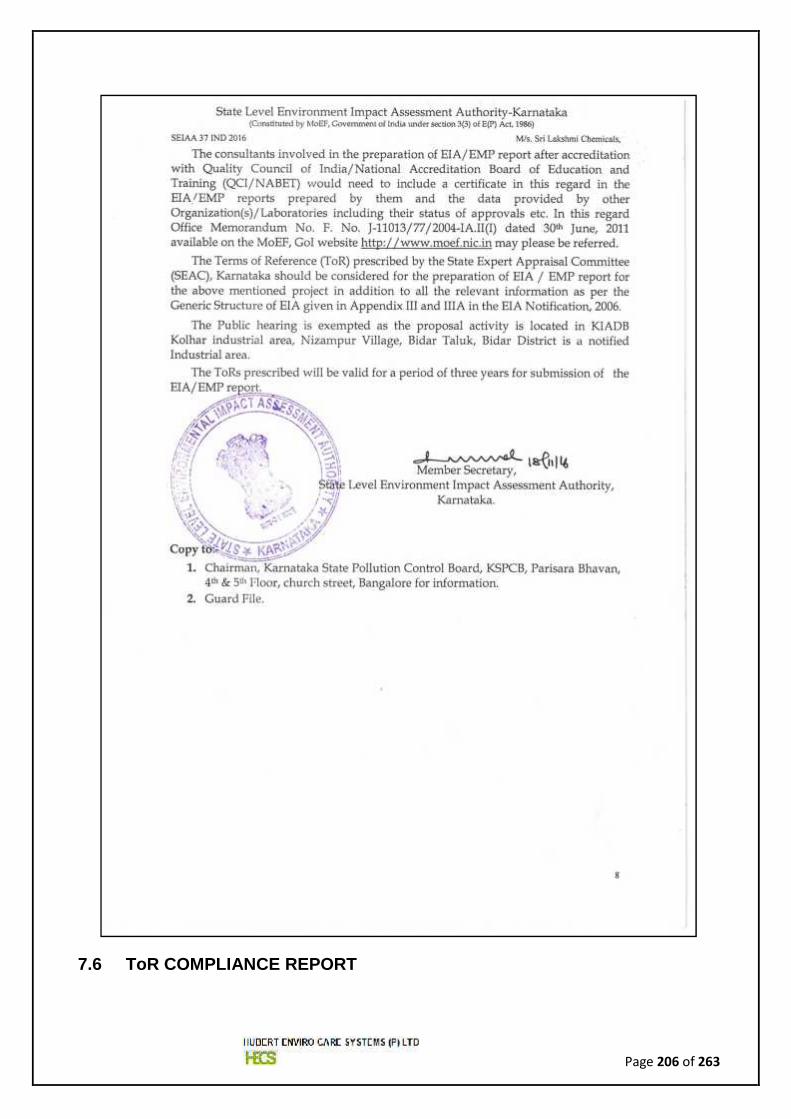
Page 206 of 263
7.6 ToR COMPLIANCE REPORT
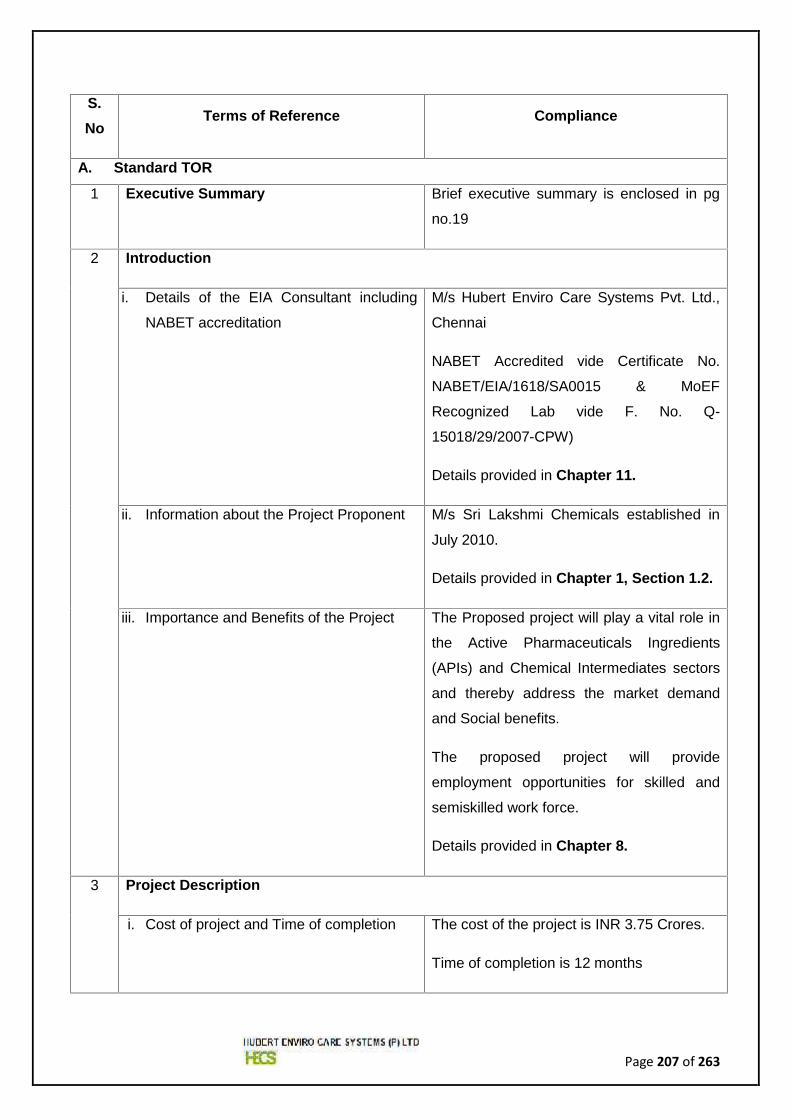
Page 207 of 263
S.No
Terms of Reference Compliance
A. Standard TOR
1 Executive Summary Brief executive summary is enclosed in pg
no.19
2 Introduction
i. Details of the EIA Consultant including
NABET accreditation
M/s Hubert Enviro Care Systems Pvt. Ltd.,
Chennai
NABET Accredited vide Certificate No.
NABET/EIA/1618/SA0015 & MoEF
Recognized Lab vide F. No. Q-
15018/29/2007-CPW)
Details provided in Chapter 11.
ii. Information about the Project Proponent M/s Sri Lakshmi Chemicals established in
July 2010.
Details provided in Chapter 1, Section 1.2.
iii. Importance and Benefits of the Project The Proposed project will play a vital role in
the Active Pharmaceuticals Ingredients
(APIs) and Chemical Intermediates sectors
and thereby address the market demand
and Social benefits.
The proposed project will provide
employment opportunities for skilled and
semiskilled work force.
Details provided in Chapter 8.
3 Project Description
i. Cost of project and Time of completion The cost of the project is INR 3.75 Crores.
Time of completion is 12 months
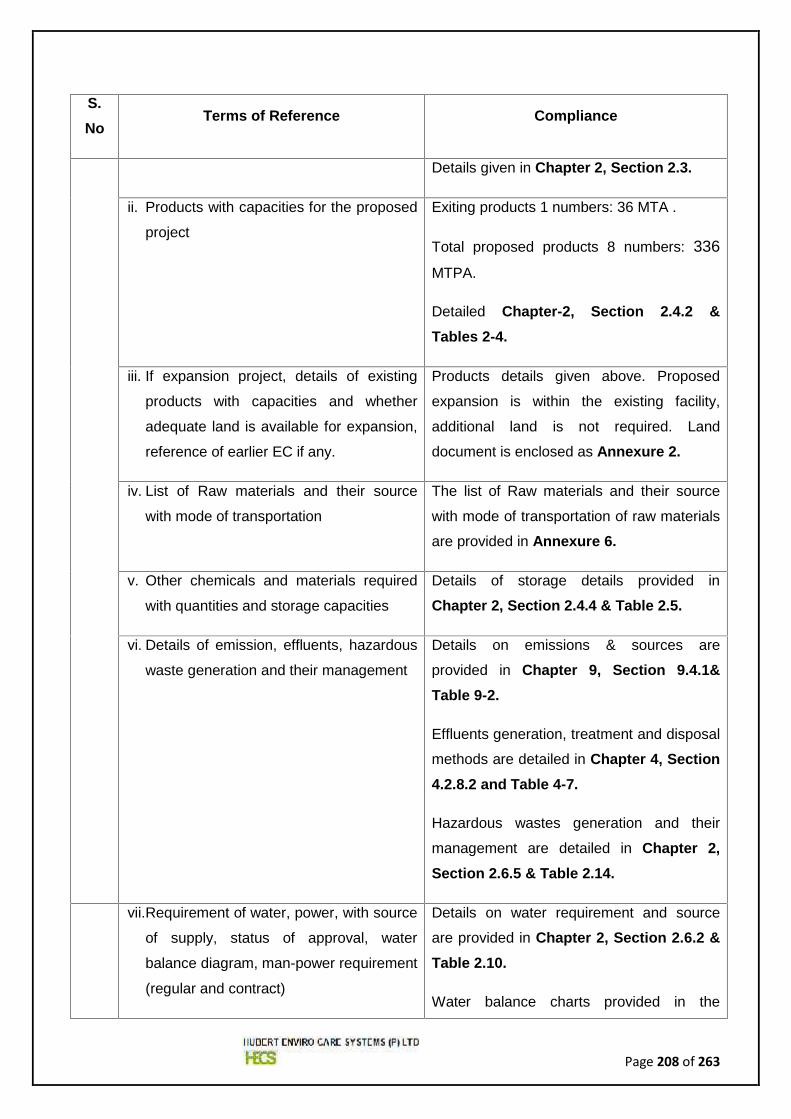
Page 208 of 263
S.No
Terms of Reference Compliance
Details given in Chapter 2, Section 2.3.
ii. Products with capacities for the proposed
project
Exiting products 1 numbers: 36 MTA .
Total proposed products 8 numbers: 336MTPA.
Detailed Chapter-2, Section 2.4.2 &Tables 2-4.
iii. If expansion project, details of existing
products with capacities and whether
adequate land is available for expansion,
reference of earlier EC if any.
Products details given above. Proposed
expansion is within the existing facility,
additional land is not required. Land
document is enclosed as Annexure 2.
iv. List of Raw materials and their source
with mode of transportation
The list of Raw materials and their source
with mode of transportation of raw materials
are provided in Annexure 6.
v. Other chemicals and materials required
with quantities and storage capacities
Details of storage details provided in
Chapter 2, Section 2.4.4 & Table 2.5.
vi. Details of emission, effluents, hazardous
waste generation and their management
Details on emissions & sources are
provided in Chapter 9, Section 9.4.1&Table 9-2.
Effluents generation, treatment and disposal
methods are detailed in Chapter 4, Section4.2.8.2 and Table 4-7.
Hazardous wastes generation and their
management are detailed in Chapter 2,Section 2.6.5 & Table 2.14.
vii.Requirement of water, power, with source
of supply, status of approval, water
balance diagram, man-power requirement
(regular and contract)
Details on water requirement and source
are provided in Chapter 2, Section 2.6.2 &Table 2.10.
Water balance charts provided in the
Page 209 of 263
S.No
Terms of Reference Compliance
Chapter 2, Section 2.6.2 & Figures 2-9 to2-10, and the same enclosed as Annexure9 & 10.
Details on power requirement and source
are provided in Chapter 2, Section 2.6.3 &Table 2.11.
Details on manpower requirement and
source are provided in Chapter 2, Section2.6.4 & Table 2.12.
viii. Process description along with major
equipments and machineries, process
flow sheet (quantitative) from raw material
to products to be provided
Process description is Attached as
Annexure 4.
The detailed list of machinery & equipments
in the industry installed & proposed to be
procured are provided in the Chapter 2,Section 2.8 and Tables 2-15.
ix. Hazard identification and details of
proposed safety systems
Hazard identification and details are
provided in Chapter 7, Section 7.7.
x. Expansion/ modernization proposals
(a) Copy of all Environmental
Clearance(s) including amendments
thereto obtaining for the project from
MoEF&CC/SEIAA shall be attached
as an Annexure. A certified copy of
the latest monitoring report of the
Regional office of the Ministry of
Environment and Forests as per
circular dated 30th May, 2012 on the
status of compliance of conditions
stipulated in all existing
environmental clearances including
EC and CFE are not obtained for the
existing facility.
Existing CFO and Site monitoring data
submitted to KSPCB are enclosed as
Annexure 1 & 3 respectively.
Page 210 of 263
S.No
Terms of Reference Compliance
Amendments shall be provided. In
addition status of compliance of
Consent to Operate for the ongoing
existing operation of the project from
SPCB shall be attached with the EIA-
EMP report
(b) In case the existing project has not
obtained environmental clearance,
reasons for not obtaining the
provisions of the EIA notification
1994 and/or EIA notification 2006
shall be provided. Copies of Consent
to Establish / No objection certificate
and Consent to Operate (in case of
units operating in prior to EIA
notification 2006, CTE and CTO of
FY 2005-2006) obtained from the
SPCB shall be submitted. Further
compliance report to the conditions of
Consents from the SPCB shall be
submitted.
4 Site Details
i. Location of the project site covering
village, Taluka/Tehsil, District and State,
justification for selecting the site. Whether
other sites were considered
Location of the project site is detailed in
Chapter 1, Section 1.4.1.
Alternate sites were not considered,
justification provided in the Chapter 5 &Section 5.2.
ii. A Topo sheet of the study area of
radius of 10Km and site location on
1:50,000/ 1:25,000 scale on an A3/A2
sheet (including al eco-sensitive areas and
environmentally sensitive places)
Topo map of study area is provided in
Chapter 3, Section 3.7.8 and Figure 3-8.
Page 211 of 263
S.No
Terms of Reference Compliance
iii. Details w.r.t option analysis for
selection of site
Alternate sites were not considered,
justification provided in the Chapter 5,Section 5.2.
iv. Co-ordinates (lat-long) of all four
corners of the site
Site coordinates of all the corners Provided
in Chapter 1, Section 1.4.1 & Table 1-2.
v. Google map Earth downloaded of the
project site
Satellite imageries of the Environment
Sensitive Area with Distances within 15 km
radius is provided in the Figure 2-1 and 10,
5 & 1km radius are appended in Figures 2-2 to 2-4 respectively. Chapter 2, Section2.2.
vi. Layout maps including existing unit
as well as proposed unit indicating storage
area, plant area, greenbelt area, utilities
etc. If located within an industrial
area/Estate/Complex, layout of Industrial
indicating location of unit within the
Industrial area/Estate.
Plant layout indicating storage area, plant
area, greenbelt area, utilities etc attached as
Annexure-8.
vii. Photographs of the proposed and
existing (if applicable) plant site, existing,
show photographs of
plantations/greenbelt, in particular
The sites photographs are appended in
Chapter 2, Section 2.5 & Figure 2-8.
viii. Land use break-up of total land of the
project site (indicate and acquired),
government/ private- agriculture, forest,
wasteland, water bodies, settlements, etc
shall be included (not required for
industrial area)
The Land use break-up of total land is
provided in the Chapter 2, Section 2.5 &Tables 2-8 & 9.
ix. A list of major industries with name
and type within the study area (10 km
radius) shall be incorporated. Land use
details of the study area)
List of major industries with name and type
within the study area (10 km radius) is
provided in the Chapter 2, Section 2.2.1 &
Page 212 of 263
S.No
Terms of Reference Compliance
Table 2.1.
x. Geological features and Geo-
hydrological status of the study area shall
be included.
Geo-hydrological status of Bidar District is
provided in Chapter 3, Section 3.7.11 andFigure 3-11.
xi. Details of drainage of the project upto
5km radius of the study area. If the site is
within 1Km radius of any major river, peak
and lean season river discharge as well as
flood occurrence frequency based on peak
rainfall data of the past 30 years. Details of
Flood Level of the project site and
maximum of Flood of the river shall also be
provided (mega green field projects)
Drainage map of the study area showing
10Km is appended in Chapter 3, Section3.7.12 and Figure 3-12.
xii. Status of acquisition of land. If
acquisition is not complete, stage of the
acquisition process and expected time of
complete procession of the land.
Land document enclosed as Annexure-2.
xiii. R&R details in respect of land in line
with state Government policy
Not applicable. The project site is in the
designated KIADB industrial area.
5 Forest and wildlife related issues (if applicable)
i. Permission and approvals for the use
of forest land (forestry clearance), if any,
and recommendations of the State Forest
Department (if applicable)
Not Applicable.
ii. Land use map based on High
resolution satellite imagery (GPS) of the
proposed site delineating the forest land (in
case of projects involving forest land more
than 40 Ha)
Not Applicable.
iii. Status of application submitted for
obtaining the stage of Forest Clearance
Not Applicable.
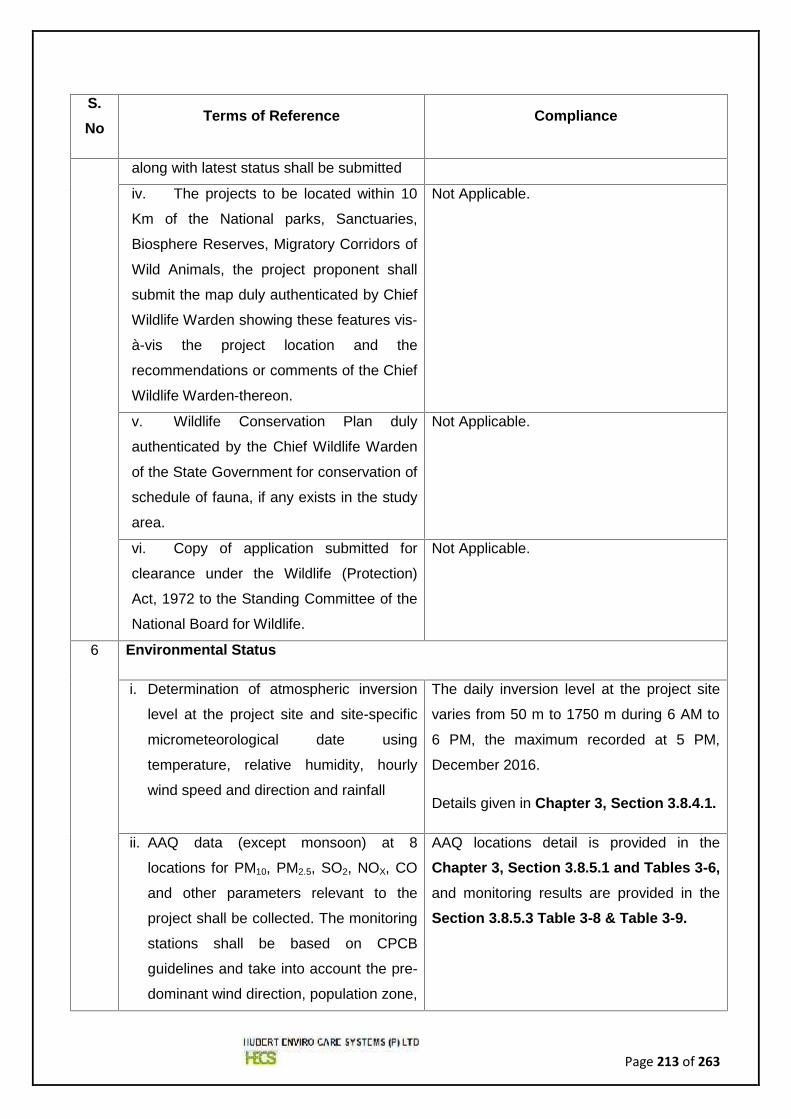
Page 213 of 263
S.No
Terms of Reference Compliance
along with latest status shall be submitted
iv. The projects to be located within 10
Km of the National parks, Sanctuaries,
Biosphere Reserves, Migratory Corridors of
Wild Animals, the project proponent shall
submit the map duly authenticated by Chief
Wildlife Warden showing these features vis-
à-vis the project location and the
recommendations or comments of the Chief
Wildlife Warden-thereon.
Not Applicable.
v. Wildlife Conservation Plan duly
authenticated by the Chief Wildlife Warden
of the State Government for conservation of
schedule of fauna, if any exists in the study
area.
Not Applicable.
vi. Copy of application submitted for
clearance under the Wildlife (Protection)
Act, 1972 to the Standing Committee of the
National Board for Wildlife.
Not Applicable.
6 Environmental Status
i. Determination of atmospheric inversion
level at the project site and site-specific
micrometeorological date using
temperature, relative humidity, hourly
wind speed and direction and rainfall
The daily inversion level at the project site
varies from 50 m to 1750 m during 6 AM to
6 PM, the maximum recorded at 5 PM,
December 2016.
Details given in Chapter 3, Section 3.8.4.1.
ii. AAQ data (except monsoon) at 8
locations for PM10, PM2.5, SO2, NOX, CO
and other parameters relevant to the
project shall be collected. The monitoring
stations shall be based on CPCB
guidelines and take into account the pre-
dominant wind direction, population zone,
AAQ locations detail is provided in the
Chapter 3, Section 3.8.5.1 and Tables 3-6,and monitoring results are provided in the
Section 3.8.5.3 Table 3-8 & Table 3-9.
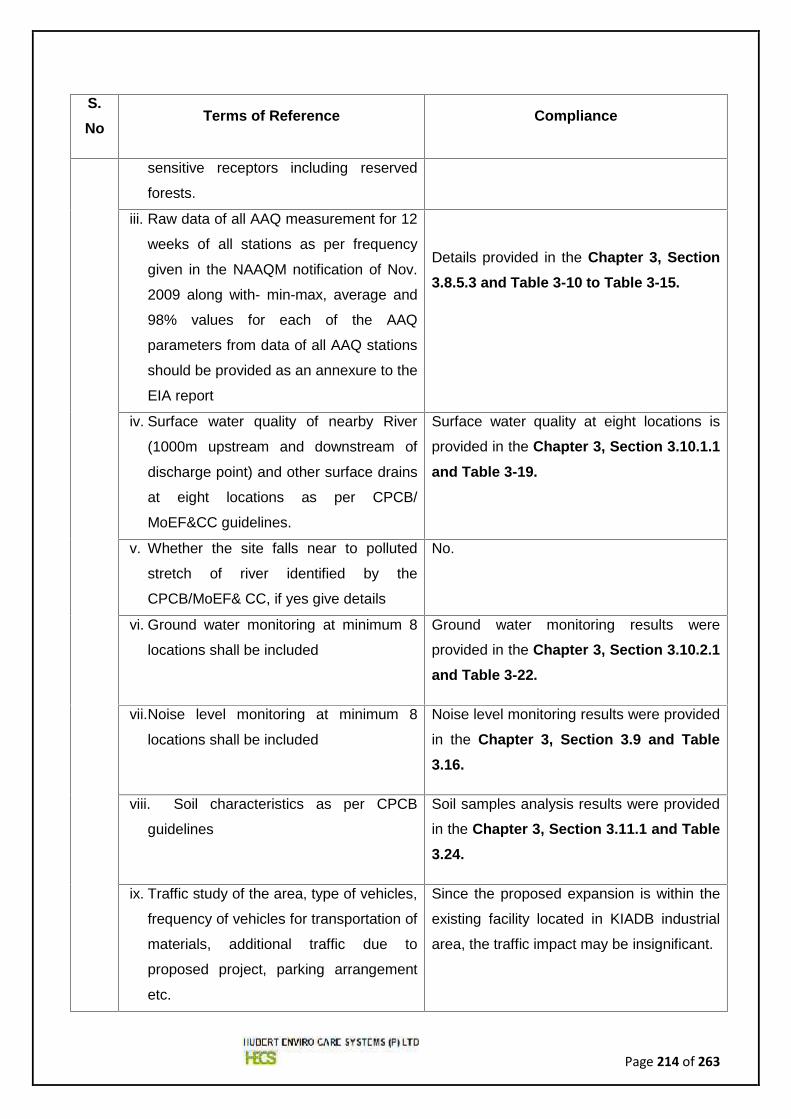
Page 214 of 263
S.No
Terms of Reference Compliance
sensitive receptors including reserved
forests.
iii. Raw data of all AAQ measurement for 12
weeks of all stations as per frequency
given in the NAAQM notification of Nov.
2009 along with- min-max, average and
98% values for each of the AAQ
parameters from data of all AAQ stations
should be provided as an annexure to the
EIA report
Details provided in the Chapter 3, Section3.8.5.3 and Table 3-10 to Table 3-15.
iv. Surface water quality of nearby River
(1000m upstream and downstream of
discharge point) and other surface drains
at eight locations as per CPCB/
MoEF&CC guidelines.
Surface water quality at eight locations is
provided in the Chapter 3, Section 3.10.1.1and Table 3-19.
v. Whether the site falls near to polluted
stretch of river identified by the
CPCB/MoEF& CC, if yes give details
No.
vi. Ground water monitoring at minimum 8
locations shall be included
Ground water monitoring results were
provided in the Chapter 3, Section 3.10.2.1and Table 3-22.
vii.Noise level monitoring at minimum 8
locations shall be included
Noise level monitoring results were provided
in the Chapter 3, Section 3.9 and Table3.16.
viii. Soil characteristics as per CPCB
guidelines
Soil samples analysis results were provided
in the Chapter 3, Section 3.11.1 and Table3.24.
ix. Traffic study of the area, type of vehicles,
frequency of vehicles for transportation of
materials, additional traffic due to
proposed project, parking arrangement
etc.
Since the proposed expansion is within the
existing facility located in KIADB industrial
area, the traffic impact may be insignificant.
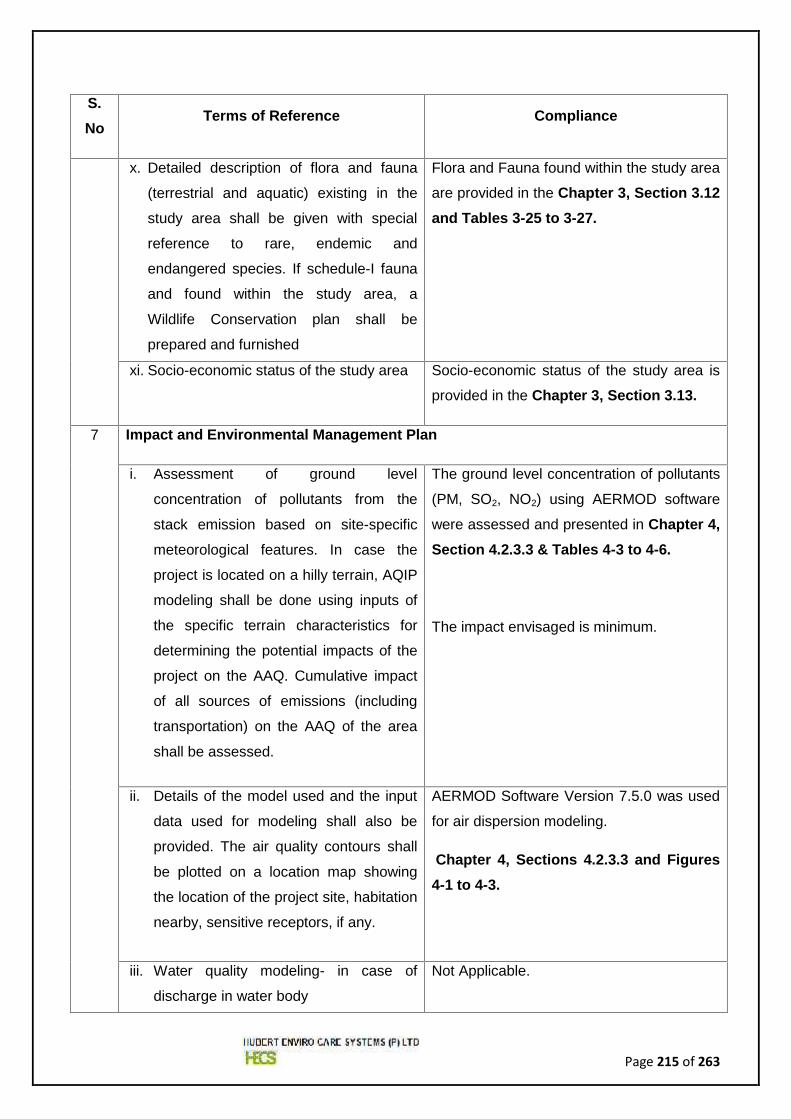
Page 215 of 263
S.No
Terms of Reference Compliance
x. Detailed description of flora and fauna
(terrestrial and aquatic) existing in the
study area shall be given with special
reference to rare, endemic and
endangered species. If schedule-I fauna
and found within the study area, a
Wildlife Conservation plan shall be
prepared and furnished
Flora and Fauna found within the study area
are provided in the Chapter 3, Section 3.12and Tables 3-25 to 3-27.
xi. Socio-economic status of the study area Socio-economic status of the study area is
provided in the Chapter 3, Section 3.13.
7 Impact and Environmental Management Plan
i. Assessment of ground level
concentration of pollutants from the
stack emission based on site-specific
meteorological features. In case the
project is located on a hilly terrain, AQIP
modeling shall be done using inputs of
the specific terrain characteristics for
determining the potential impacts of the
project on the AAQ. Cumulative impact
of all sources of emissions (including
transportation) on the AAQ of the area
shall be assessed.
The ground level concentration of pollutants
(PM, SO2, NO2) using AERMOD software
were assessed and presented in Chapter 4,Section 4.2.3.3 & Tables 4-3 to 4-6.
The impact envisaged is minimum.
ii. Details of the model used and the input
data used for modeling shall also be
provided. The air quality contours shall
be plotted on a location map showing
the location of the project site, habitation
nearby, sensitive receptors, if any.
AERMOD Software Version 7.5.0 was used
for air dispersion modeling.
Chapter 4, Sections 4.2.3.3 and Figures4-1 to 4-3.
iii. Water quality modeling- in case of
discharge in water body
Not Applicable.
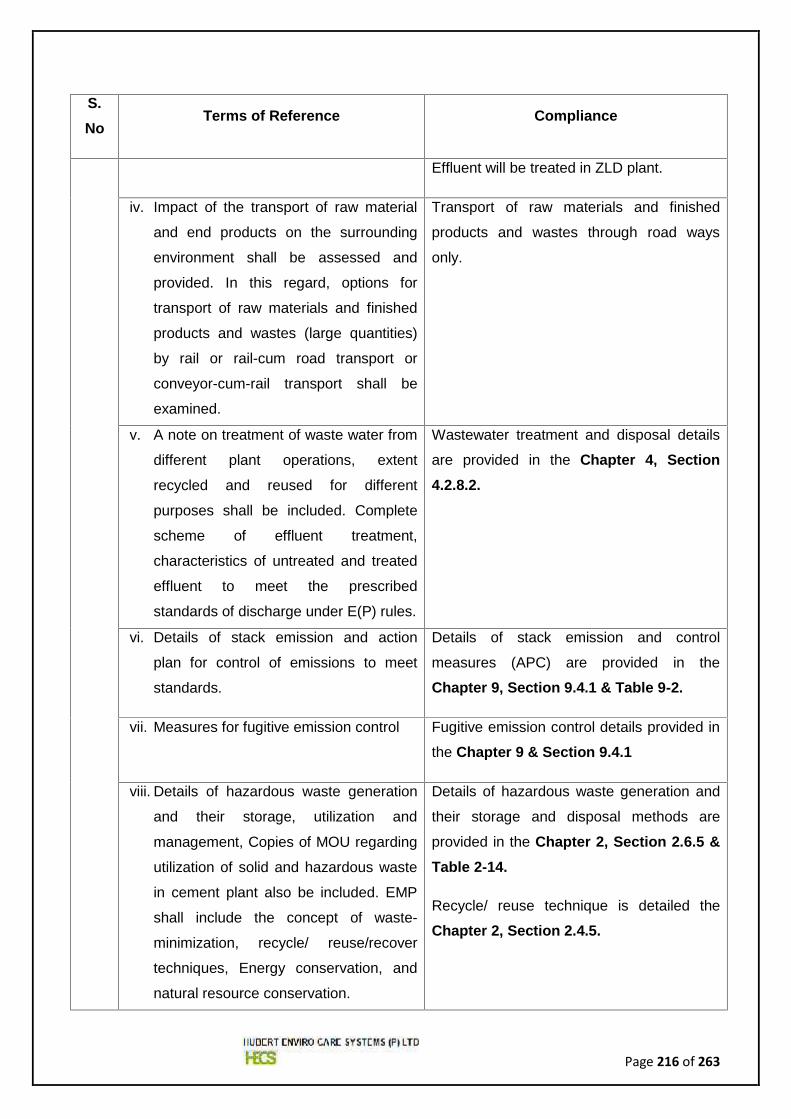
Page 216 of 263
S.No
Terms of Reference Compliance
Effluent will be treated in ZLD plant.
iv. Impact of the transport of raw material
and end products on the surrounding
environment shall be assessed and
provided. In this regard, options for
transport of raw materials and finished
products and wastes (large quantities)
by rail or rail-cum road transport or
conveyor-cum-rail transport shall be
examined.
Transport of raw materials and finished
products and wastes through road ways
only.
v. A note on treatment of waste water from
different plant operations, extent
recycled and reused for different
purposes shall be included. Complete
scheme of effluent treatment,
characteristics of untreated and treated
effluent to meet the prescribed
standards of discharge under E(P) rules.
Wastewater treatment and disposal details
are provided in the Chapter 4, Section4.2.8.2.
vi. Details of stack emission and action
plan for control of emissions to meet
standards.
Details of stack emission and control
measures (APC) are provided in the
Chapter 9, Section 9.4.1 & Table 9-2.
vii. Measures for fugitive emission control Fugitive emission control details provided in
the Chapter 9 & Section 9.4.1
viii. Details of hazardous waste generation
and their storage, utilization and
management, Copies of MOU regarding
utilization of solid and hazardous waste
in cement plant also be included. EMP
shall include the concept of waste-
minimization, recycle/ reuse/recover
techniques, Energy conservation, and
natural resource conservation.
Details of hazardous waste generation and
their storage and disposal methods are
provided in the Chapter 2, Section 2.6.5 &Table 2-14.
Recycle/ reuse technique is detailed the
Chapter 2, Section 2.4.5.
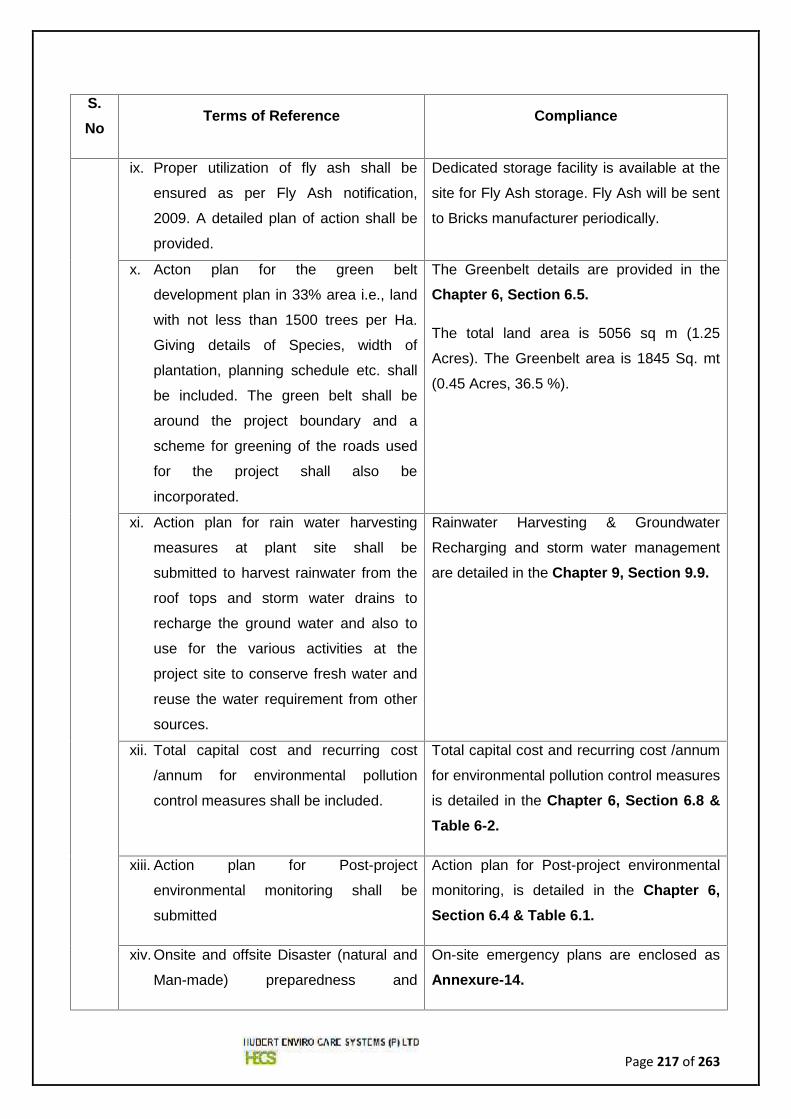
Page 217 of 263
S.No
Terms of Reference Compliance
ix. Proper utilization of fly ash shall be
ensured as per Fly Ash notification,
2009. A detailed plan of action shall be
provided.
Dedicated storage facility is available at the
site for Fly Ash storage. Fly Ash will be sent
to Bricks manufacturer periodically.
x. Acton plan for the green belt
development plan in 33% area i.e., land
with not less than 1500 trees per Ha.
Giving details of Species, width of
plantation, planning schedule etc. shall
be included. The green belt shall be
around the project boundary and a
scheme for greening of the roads used
for the project shall also be
incorporated.
The Greenbelt details are provided in the
Chapter 6, Section 6.5.
The total land area is 5056 sq m (1.25
Acres). The Greenbelt area is 1845 Sq. mt
(0.45 Acres, 36.5 %).
xi. Action plan for rain water harvesting
measures at plant site shall be
submitted to harvest rainwater from the
roof tops and storm water drains to
recharge the ground water and also to
use for the various activities at the
project site to conserve fresh water and
reuse the water requirement from other
sources.
Rainwater Harvesting & Groundwater
Recharging and storm water management
are detailed in the Chapter 9, Section 9.9.
xii. Total capital cost and recurring cost
/annum for environmental pollution
control measures shall be included.
Total capital cost and recurring cost /annum
for environmental pollution control measures
is detailed in the Chapter 6, Section 6.8 &Table 6-2.
xiii. Action plan for Post-project
environmental monitoring shall be
submitted
Action plan for Post-project environmental
monitoring, is detailed in the Chapter 6,Section 6.4 & Table 6.1.
xiv. Onsite and offsite Disaster (natural and
Man-made) preparedness and
On-site emergency plans are enclosed as
Annexure-14.
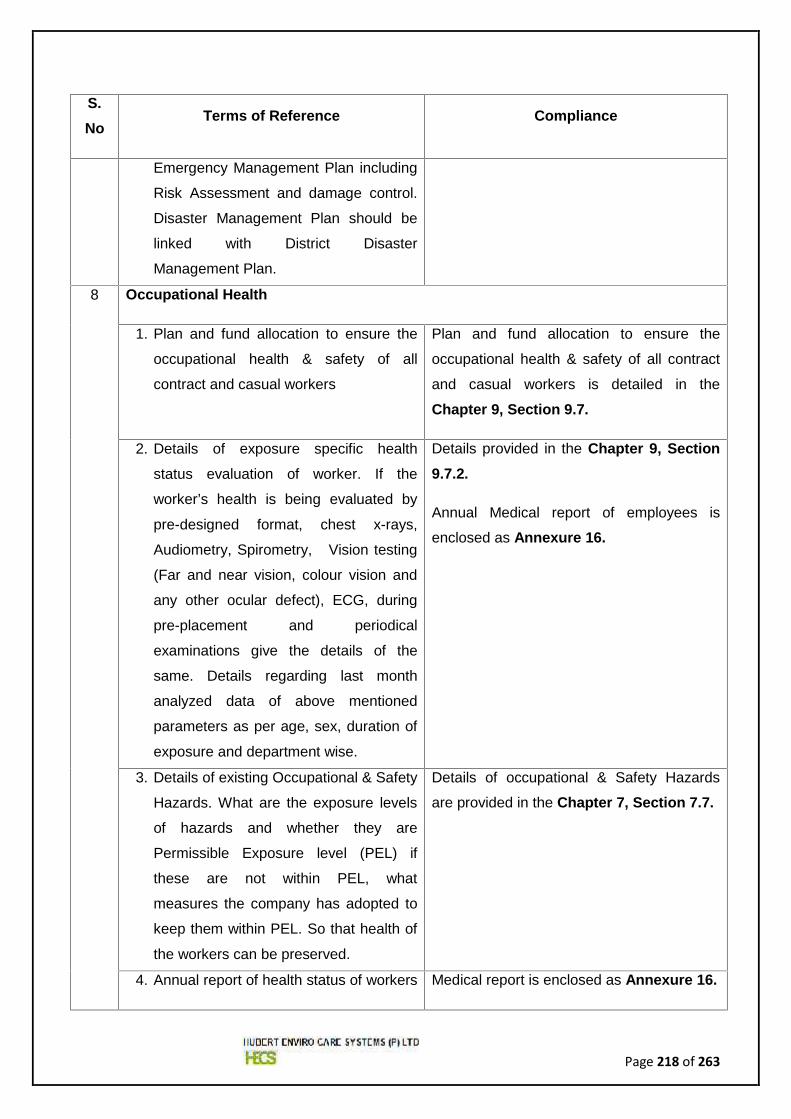
Page 218 of 263
S.No
Terms of Reference Compliance
Emergency Management Plan including
Risk Assessment and damage control.
Disaster Management Plan should be
linked with District Disaster
Management Plan.
8 Occupational Health
1. Plan and fund allocation to ensure the
occupational health & safety of all
contract and casual workers
Plan and fund allocation to ensure the
occupational health & safety of all contract
and casual workers is detailed in the
Chapter 9, Section 9.7.
2. Details of exposure specific health
status evaluation of worker. If the
worker’s health is being evaluated by
pre-designed format, chest x-rays,
Audiometry, Spirometry, Vision testing
(Far and near vision, colour vision and
any other ocular defect), ECG, during
pre-placement and periodical
examinations give the details of the
same. Details regarding last month
analyzed data of above mentioned
parameters as per age, sex, duration of
exposure and department wise.
Details provided in the Chapter 9, Section9.7.2.
Annual Medical report of employees is
enclosed as Annexure 16.
3. Details of existing Occupational & Safety
Hazards. What are the exposure levels
of hazards and whether they are
Permissible Exposure level (PEL) if
these are not within PEL, what
measures the company has adopted to
keep them within PEL. So that health of
the workers can be preserved.
Details of occupational & Safety Hazards
are provided in the Chapter 7, Section 7.7.
4. Annual report of health status of workers Medical report is enclosed as Annexure 16.
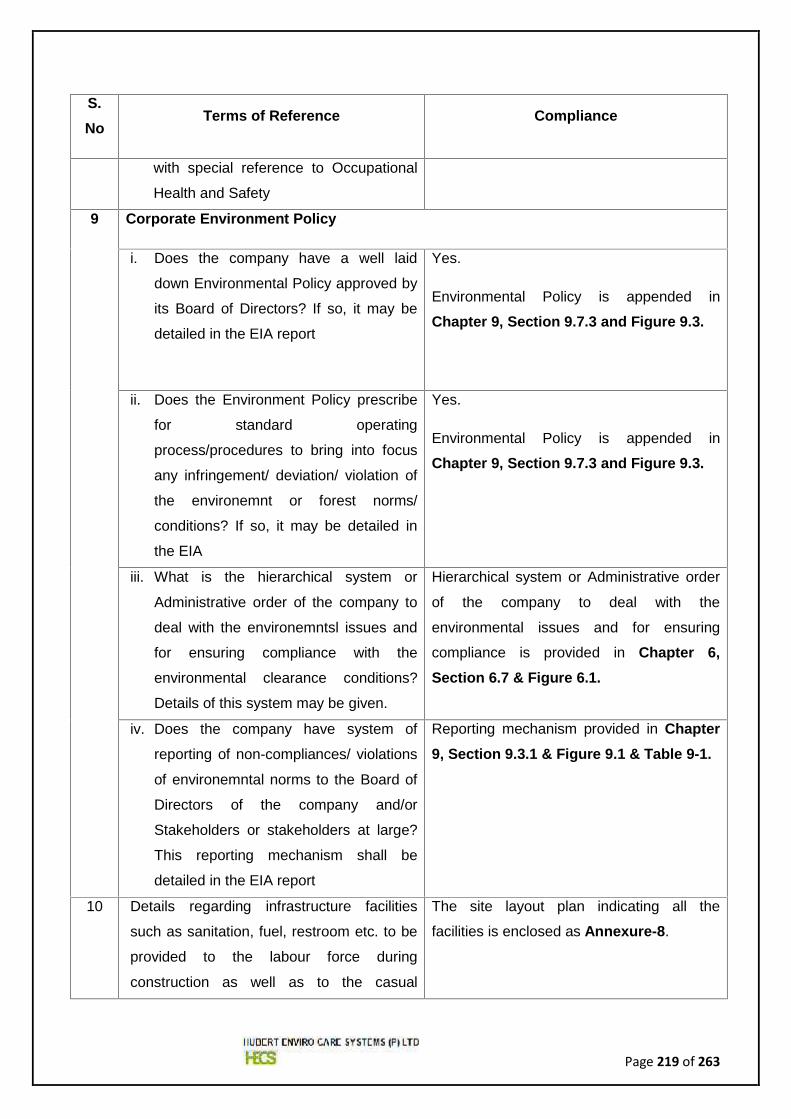
Page 219 of 263
S.No
Terms of Reference Compliance
with special reference to Occupational
Health and Safety
9 Corporate Environment Policy
i. Does the company have a well laid
down Environmental Policy approved by
its Board of Directors? If so, it may be
detailed in the EIA report
Yes.
Environmental Policy is appended in
Chapter 9, Section 9.7.3 and Figure 9.3.
ii. Does the Environment Policy prescribe
for standard operating
process/procedures to bring into focus
any infringement/ deviation/ violation of
the environemnt or forest norms/
conditions? If so, it may be detailed in
the EIA
Yes.
Environmental Policy is appended in
Chapter 9, Section 9.7.3 and Figure 9.3.
iii. What is the hierarchical system or
Administrative order of the company to
deal with the environemntsl issues and
for ensuring compliance with the
environmental clearance conditions?
Details of this system may be given.
Hierarchical system or Administrative order
of the company to deal with the
environmental issues and for ensuring
compliance is provided in Chapter 6,Section 6.7 & Figure 6.1.
iv. Does the company have system of
reporting of non-compliances/ violations
of environemntal norms to the Board of
Directors of the company and/or
Stakeholders or stakeholders at large?
This reporting mechanism shall be
detailed in the EIA report
Reporting mechanism provided in Chapter9, Section 9.3.1 & Figure 9.1 & Table 9-1.
10 Details regarding infrastructure facilities
such as sanitation, fuel, restroom etc. to be
provided to the labour force during
construction as well as to the casual
The site layout plan indicating all the
facilities is enclosed as Annexure-8.
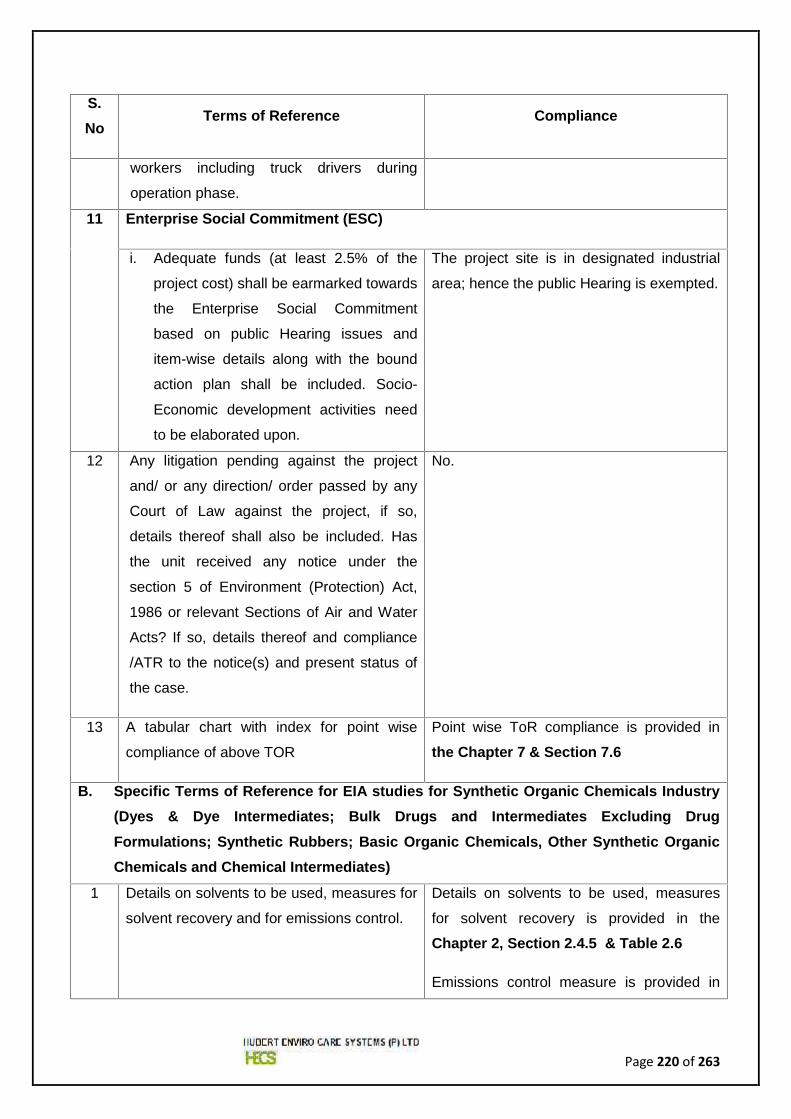
Page 220 of 263
S.No
Terms of Reference Compliance
workers including truck drivers during
operation phase.
11 Enterprise Social Commitment (ESC)
i. Adequate funds (at least 2.5% of the
project cost) shall be earmarked towards
the Enterprise Social Commitment
based on public Hearing issues and
item-wise details along with the bound
action plan shall be included. Socio-
Economic development activities need
to be elaborated upon.
The project site is in designated industrial
area; hence the public Hearing is exempted.
12 Any litigation pending against the project
and/ or any direction/ order passed by any
Court of Law against the project, if so,
details thereof shall also be included. Has
the unit received any notice under the
section 5 of Environment (Protection) Act,
1986 or relevant Sections of Air and Water
Acts? If so, details thereof and compliance
/ATR to the notice(s) and present status of
the case.
No.
13 A tabular chart with index for point wise
compliance of above TOR
Point wise ToR compliance is provided in
the Chapter 7 & Section 7.6
B. Specific Terms of Reference for EIA studies for Synthetic Organic Chemicals Industry(Dyes & Dye Intermediates; Bulk Drugs and Intermediates Excluding DrugFormulations; Synthetic Rubbers; Basic Organic Chemicals, Other Synthetic OrganicChemicals and Chemical Intermediates)
1 Details on solvents to be used, measures for
solvent recovery and for emissions control.
Details on solvents to be used, measures
for solvent recovery is provided in the
Chapter 2, Section 2.4.5 & Table 2.6
Emissions control measure is provided in
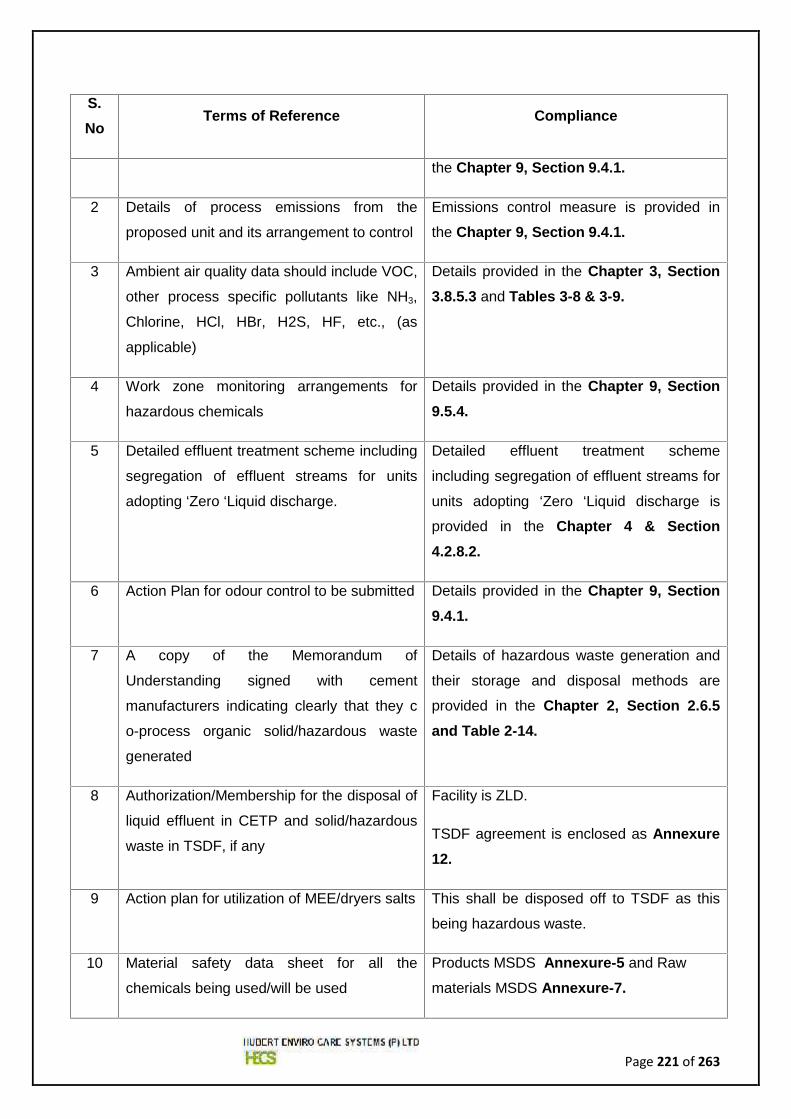
Page 221 of 263
S.No
Terms of Reference Compliance
the Chapter 9, Section 9.4.1.
2 Details of process emissions from the
proposed unit and its arrangement to control
Emissions control measure is provided in
the Chapter 9, Section 9.4.1.
3 Ambient air quality data should include VOC,
other process specific pollutants like NH3,
Chlorine, HCl, HBr, H2S, HF, etc., (as
applicable)
Details provided in the Chapter 3, Section3.8.5.3 and Tables 3-8 & 3-9.
4 Work zone monitoring arrangements for
hazardous chemicals
Details provided in the Chapter 9, Section9.5.4.
5 Detailed effluent treatment scheme including
segregation of effluent streams for units
adopting ‘Zero ‘Liquid discharge.
Detailed effluent treatment scheme
including segregation of effluent streams for
units adopting ‘Zero ‘Liquid discharge is
provided in the Chapter 4 & Section4.2.8.2.
6 Action Plan for odour control to be submitted Details provided in the Chapter 9, Section9.4.1.
7 A copy of the Memorandum of
Understanding signed with cement
manufacturers indicating clearly that they c
o-process organic solid/hazardous waste
generated
Details of hazardous waste generation and
their storage and disposal methods are
provided in the Chapter 2, Section 2.6.5and Table 2-14.
8 Authorization/Membership for the disposal of
liquid effluent in CETP and solid/hazardous
waste in TSDF, if any
Facility is ZLD.
TSDF agreement is enclosed as Annexure12.
9 Action plan for utilization of MEE/dryers salts This shall be disposed off to TSDF as this
being hazardous waste.
10 Material safety data sheet for all the
chemicals being used/will be used
Products MSDS Annexure-5 and Raw
materials MSDS Annexure-7.
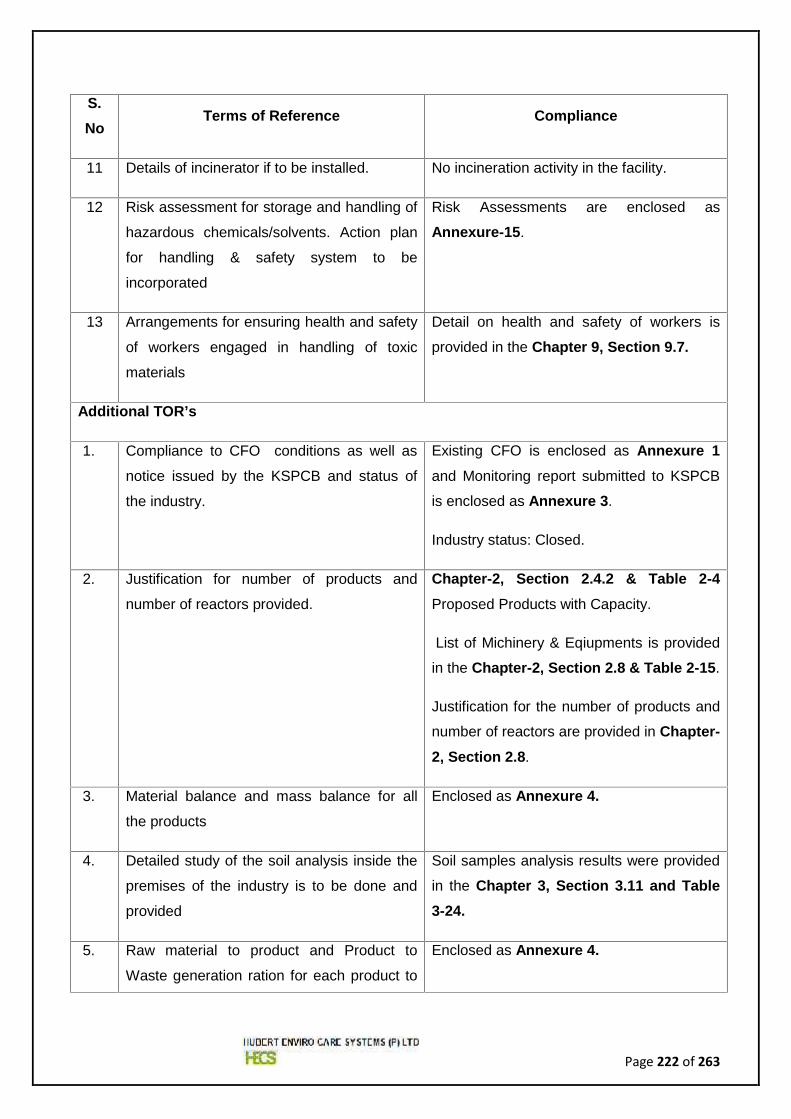
Page 222 of 263
S.No
Terms of Reference Compliance
11 Details of incinerator if to be installed. No incineration activity in the facility.
12 Risk assessment for storage and handling of
hazardous chemicals/solvents. Action plan
for handling & safety system to be
incorporated
Risk Assessments are enclosed as
Annexure-15.
13 Arrangements for ensuring health and safety
of workers engaged in handling of toxic
materials
Detail on health and safety of workers is
provided in the Chapter 9, Section 9.7.
Additional TOR’s
1. Compliance to CFO conditions as well as
notice issued by the KSPCB and status of
the industry.
Existing CFO is enclosed as Annexure 1and Monitoring report submitted to KSPCB
is enclosed as Annexure 3.
Industry status: Closed.
2. Justification for number of products and
number of reactors provided.
Chapter-2, Section 2.4.2 & Table 2-4Proposed Products with Capacity.
List of Michinery & Eqiupments is provided
in the Chapter-2, Section 2.8 & Table 2-15.
Justification for the number of products and
number of reactors are provided in Chapter-2, Section 2.8.
3. Material balance and mass balance for all
the products
Enclosed as Annexure 4.
4. Detailed study of the soil analysis inside the
premises of the industry is to be done and
provided
Soil samples analysis results were provided
in the Chapter 3, Section 3.11 and Table3-24.
5. Raw material to product and Product to
Waste generation ration for each product to
Enclosed as Annexure 4.
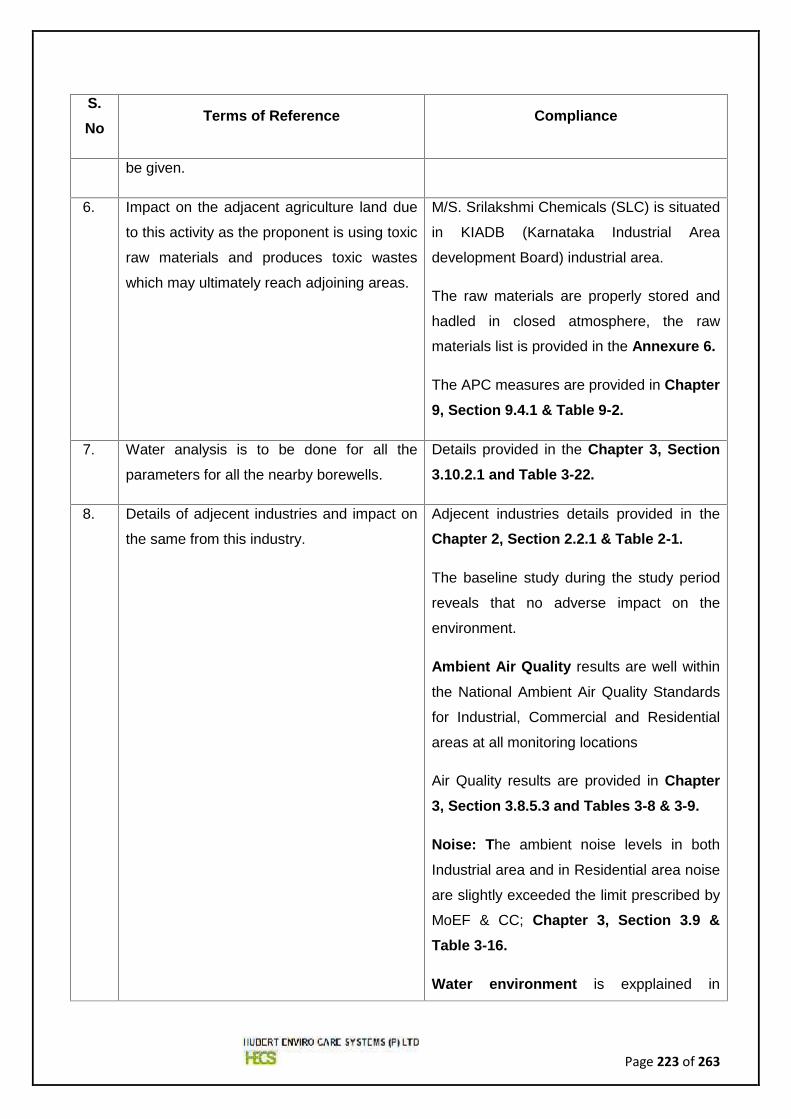
Page 223 of 263
S.No
Terms of Reference Compliance
be given.
6. Impact on the adjacent agriculture land due
to this activity as the proponent is using toxic
raw materials and produces toxic wastes
which may ultimately reach adjoining areas.
M/S. Srilakshmi Chemicals (SLC) is situated
in KIADB (Karnataka Industrial Area
development Board) industrial area.
The raw materials are properly stored and
hadled in closed atmosphere, the raw
materials list is provided in the Annexure 6.
The APC measures are provided in Chapter9, Section 9.4.1 & Table 9-2.
7. Water analysis is to be done for all the
parameters for all the nearby borewells.
Details provided in the Chapter 3, Section3.10.2.1 and Table 3-22.
8. Details of adjecent industries and impact on
the same from this industry.
Adjecent industries details provided in the
Chapter 2, Section 2.2.1 & Table 2-1.
The baseline study during the study period
reveals that no adverse impact on the
environment.
Ambient Air Quality results are well within
the National Ambient Air Quality Standards
for Industrial, Commercial and Residential
areas at all monitoring locations
Air Quality results are provided in Chapter3, Section 3.8.5.3 and Tables 3-8 & 3-9.
Noise: The ambient noise levels in both
Industrial area and in Residential area noise
are slightly exceeded the limit prescribed by
MoEF & CC; Chapter 3, Section 3.9 &Table 3-16.
Water environment is expplained in

Page 224 of 263
S.No
Terms of Reference Compliance
Chapter 3, Section 3.10. Surface water
results Table 3-19 & Ground water results
Table 3-22.
Soil: Soil quality monitoring results are
given in Chapter 3, Section 3.11.1 Table3-24.
9. Existing greenbelt details and proposed with
design to be provided.
The total land area is 5056 sq m (1.25
Acres) and the Greenbelt area is 1845 Sq.
mt (0.45 Acres, 36.5 %).
Existing and proposed greenbelt details
provided in the Chapter 6, Section 6.5.
10. MEE is not in the present layout plan. This
shall be incorporated and modofied layout
plan and scheme and design including
capacity of the same to be provided.
Layout plan is enclosed as Annexure 8.
MEE location is shown in the layout.
MEE scheme and design , Annexure 13.
11. Scheme for Storage and disposal of
hazardous waste as per the hazardous
waste handling and disposal rule to be
provided.
Hazardous waste Management is provided
in the Chapter 2, Section 2.6.5 and Table2-14.
12. Storage and handling method of bromine in
the process.
Stored in a Wooden box filled with sand and
kept in Cool & Dry Place
13. Alternative solvent to Chloroform and EDC in
the process may be given.
It is a process demand, so could not be
replaced.
14. Safety measures taken in the hydrogenation
process to be explained in EIA and explore
the possibility of using alternative catalysts
for hydrogenation process.
Hydrogenation process will be carried out in
completely protected manner.
It is a process demand, so could not be
replaced.
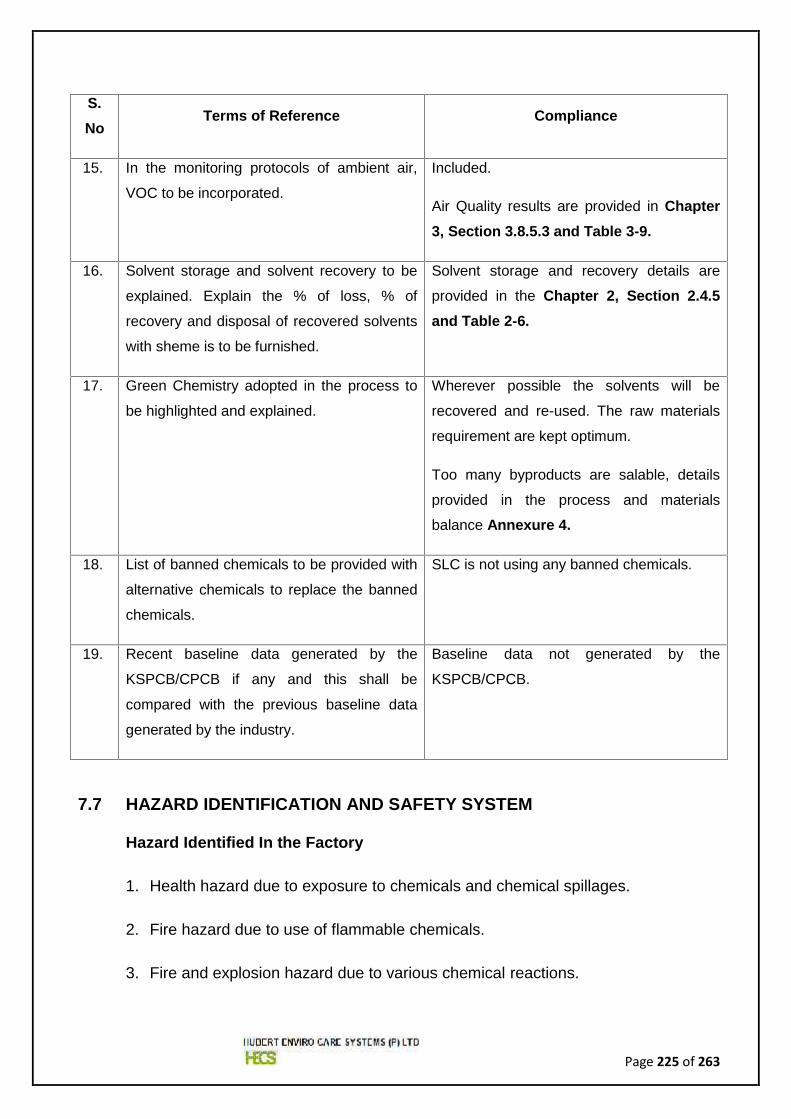
Page 225 of 263
S.No
Terms of Reference Compliance
15. In the monitoring protocols of ambient air,
VOC to be incorporated.
Included.
Air Quality results are provided in Chapter3, Section 3.8.5.3 and Table 3-9.
16. Solvent storage and solvent recovery to be
explained. Explain the % of loss, % of
recovery and disposal of recovered solvents
with sheme is to be furnished.
Solvent storage and recovery details are
provided in the Chapter 2, Section 2.4.5and Table 2-6.
17. Green Chemistry adopted in the process to
be highlighted and explained.
Wherever possible the solvents will be
recovered and re-used. The raw materials
requirement are kept optimum.
Too many byproducts are salable, details
provided in the process and materials
balance Annexure 4.
18. List of banned chemicals to be provided with
alternative chemicals to replace the banned
chemicals.
SLC is not using any banned chemicals.
19. Recent baseline data generated by the
KSPCB/CPCB if any and this shall be
compared with the previous baseline data
generated by the industry.
Baseline data not generated by the
KSPCB/CPCB.
7.7 HAZARD IDENTIFICATION AND SAFETY SYSTEM
Hazard Identified In the Factory
1. Health hazard due to exposure to chemicals and chemical spillages.
2. Fire hazard due to use of flammable chemicals.
3. Fire and explosion hazard due to various chemical reactions.
Page 226 of 263
Scenario Based Emergency Actions
1. Action plan in case of Solvent leakage from flange joints or from bottom valve
etc.,
a. Shift In-charge / Department Head shall be informed immediately.
b. Access the situation.
c. Only trained personnel shall approach the area using suitable personnel
protective equipments.
d. Stop leakage by closing isolation valve.
e. Stop hot work in surrounding area.
f. Isolate the power supply of the respective area.
g. Other than the needy all shall evacuate the area.
h. Cover drains / isolate from other plants with the help of sand or soil.
i. Affected persons shall move to fresh air and seek medical help further.
2. Action plan in case of Fire in Centrifuge due to Solvent vapors
a. Shout and break MCP
b. Trained personnel shall fight the fire with suitable PPEs.
c. Extinguish fire with DCP / CO2 / Foam extinguisher.
d. In case the fire not controlled with the use of portable fire extinguishers, start
fighting by using fire hydrant system with mobile foam unit.
e. Other than the needy all shall evacuate the area.
f. Close valves on solvent pipe lines.
g. Cooldown MLR tank by water spray.
h. Isolate the power supply of the respective area.
i. Close / isolate the drains with sand or soil.
j. Affected persons should be given first aid and moved for medical attention.
3. Action plan in case of Fire or Explosion
Page 227 of 263
a. Shout and break MCP.
b. Trained personnel shall fight the fire with suitable PPEs.
c. Extinguish with DCP / CO2 / Foam Extinguishers installed at site.
d. In case the fire not controlled with the use of portable fire extinguishers, start
fighting by using fire hydrant system and use mobile foam unit for solvent
fire.
e. Isolate the power supply of the respective area.
f. Other than the needy all shall evacuate the area.
g. Cooldown nearby receivers / service tank, reactors etc by water spray.
h. Isolate interconnection of tanks, reactors, service tank, charging valves,
receivers etc.
i. Other pipelines are to be checked for isolation.
j. Close / isolate the drains with sand or soil.
k. Affected persons shall be given first aid and moved for medical attention.
4. Action plan in case of Toxic Release
a. Shift In-charge / Department Head shall be informed immediately.
b. Only trained personnel shall approach the area using suitable personnel
protective equipments like SCBA.
c. Check the wind direction; decide route of escape and evacuating persons
shall run perpendicular to the wind direction and not against / along the wind
direction.
d. Evacuating personnel should use wet handkerchief on their nose.
e. Inform the neighbourhood if required and if they are likely to be affected.
f. Ensure that only essential personnel are in the affected areas.
Page 228 of 263
g. Rescue the persons trapped / injured.
h. Person present in other buildings should close their windows and doors to
prevent any entry of leaked gases.
i. Trace the source of leakage or spillage and isolate the system from other
equipment.
j. Isolate the electrical supply to the affected area.
k. Trap the leakage into a suitable scrubber.
l. Affected persons shall be given first aid and moved for medical attention.
5. Action plan in case of Electric Fire or Shock
a. Isolate the power supply to the affected area immediately before approaching
the site.
b. Do not use water for extinguishing the fire. Use CO2 type or DCP type or dry
sand to extinguishing the fire.
c. Remove any flammable or combustible material from the vicinity of the
incident.
d. Remove the affected person to an open area and check his breathing.
e. If he is unconscious and not breathing initiate artificial resuscitation
procedure.
f. Do first aid for any burn injury.
g. Physically isolate the burnt electrical components. Do not energize till the
entire circuitry is checked with megger or other devices with safety
mechanisms.
6. Action plan in case of leakage or rupture of Solvent / Fuel storage tanks
a. Area shall be evacuated immediately and cordoned off.
Page 229 of 263
b. Affected persons shall be thoroughly washed using clean water and given
necessary medical aid.
c. Personnel entering the area should make use of suitable personnel
protective equipments.
d. Leaked tank must be depressurized immediately by transferring remaining
quantity into another tank or container.
e. Leakage source must be traced and plugged.
f. Isolate the nearby electrical points and prevent any fire being brought
nearby. As a precaution mobilize extra fire extinguishers to the spot to tackle
fire if caught. Spilled material spreading should be contained in a dyke and
transferred to container or it must be absorbed on sand or earth.
g. The contaminated sand or earth must be neutralized and then dumped at
safe place or burned in the fire pit. (flammable liquids should not be absorbed
by combustible solids like saw dust or combustible fibres)
h. If a spilled material in to the trench of electrical cables, then it shall be
drained with natural gradient and wash with large quantity of water
continuously after de energising the cable.
i. If a spilled material gets into the storm water drain or sewer line then it must
be flushed with a continuous flow of large stream of clean water till it is
neutralized fully.
7. Action plan in case of Compressed Gas Cylinder Leakage
a. Move the cylinders to well ventilated area, and barricade the area. Never try
to repair the leaks when the equipment under pressure.
b. Immediately contact supplier to get the necessary information and help.
c. If fire catches to cylinder, do not try to extinguish the cylinder fire. Only cool
(by pouring water) and protect the nearby equipments from the safe distance.
8. Action plan in case of Cryogenic Gas (Liquid Nitrogen) Leakage
Page 230 of 263
a. Allow the spillage to evaporate by providing good ventilation.
b. If you feel the ventilation is insufficient, immediately evacuate the area.
9. Action plan in case of Water Reactive Chemical Spillage
a. Do not put water on the spill.
b. If it is liquid, use neutralizing agent and inert material like dry sand to absorb
spillage.
c. If it is powder / crystalline, avoid generating dusty conditions, sweep up
material.
d. Placed to bag, label the bag and send to ETP for safe disposal.
e. Decontaminate spill site with suitable neutralizing material.
f. Wash the spill area.
10. Action plan in case of Leakage through Pipe Line, Barrel / Drum
a. If the leak in a pipe line, immediately stop the supply to corresponding pipe
line
b. If the leak in a barrel or drum, do not move or transport that barrel or drum.
c. Immediately transfer that content to another non leak barrel or drum.
d. Transferred barrel / drum should be compatible with the material.
e. After the material transferred, empty drums are to be neutralized, washed
and then send to ETP for safe disposal.
f. To remove the spilled material from that area, procedure to be followed
based on the nature of material / chemical.
Page 231 of 263
CHAPTER – 8Project Benefits
Page 232 of 263
8. PROJECT BENEFITS
8.1 PROJECT BENEFITS
The project is of commercial manufacturing of Active Pharmaceutical Ingredients
and Chemical Intermediates that will play a vital role in the respective sector thereby
address the market demand and Social benefits.
The products manufactured at this facility will be exported that will aid in adding to
the revenue of the nation.
The corporate social responsibilities which are taken up by the company will
improve the well-being of the society and the corporate responsibilities towards the
protection of the environment will help in conserving the ecosystem.
It will also provide employment opportunities for additional population.
Page 233 of 263
CHAPTER – 9Environmental Management Plan
Page 234 of 263
9. ENVIRONMENTAL MANAGEMENT PLAN
9.1 Introduction
This Environmental Management Plan (EMP) for the M/s. Sri Lakshmi Chemicals,
identifies the principles, procedures and methods that will be used to control and
minimize the environmental impacts of the proposed operational activities
associated with the expansion project development. It is intended to ensure that
commitments made by the Sri Lakshmi Chemicals to minimize project related
environmental and social impacts.
As part of our ongoing commitment to excellence in environmental and social
performance we will ensure the following:
Fulfill all environmental conditions associated with project approvals.
Develop, promote and foster a shared sense of responsibility for
environmental and performance of the project.
Promote environmental awareness and understanding among employees
and contractors through training, identification of roles and responsibilities
towards environmental management
Linking project performance to overall environmental performance.
To monitor the environmental performance throughout the project and
implement an adaptive management approach for continuous improvement
and to meet the regulations.
9.2 Objectives of EMP
To suggest the formation of a core group (Environment Management Cell)
responsible for implementation of environmental control & protective
measures as well as monitoring of such implementation.
To ensure project components are compliant with all laws and approval
conditions.
Continue baseline monitoring
Facilitate a continual review of post construction and operation activities.
To suggest preventive and mitigation measures to minimize adverse impact
and to maximize beneficial impacts like.
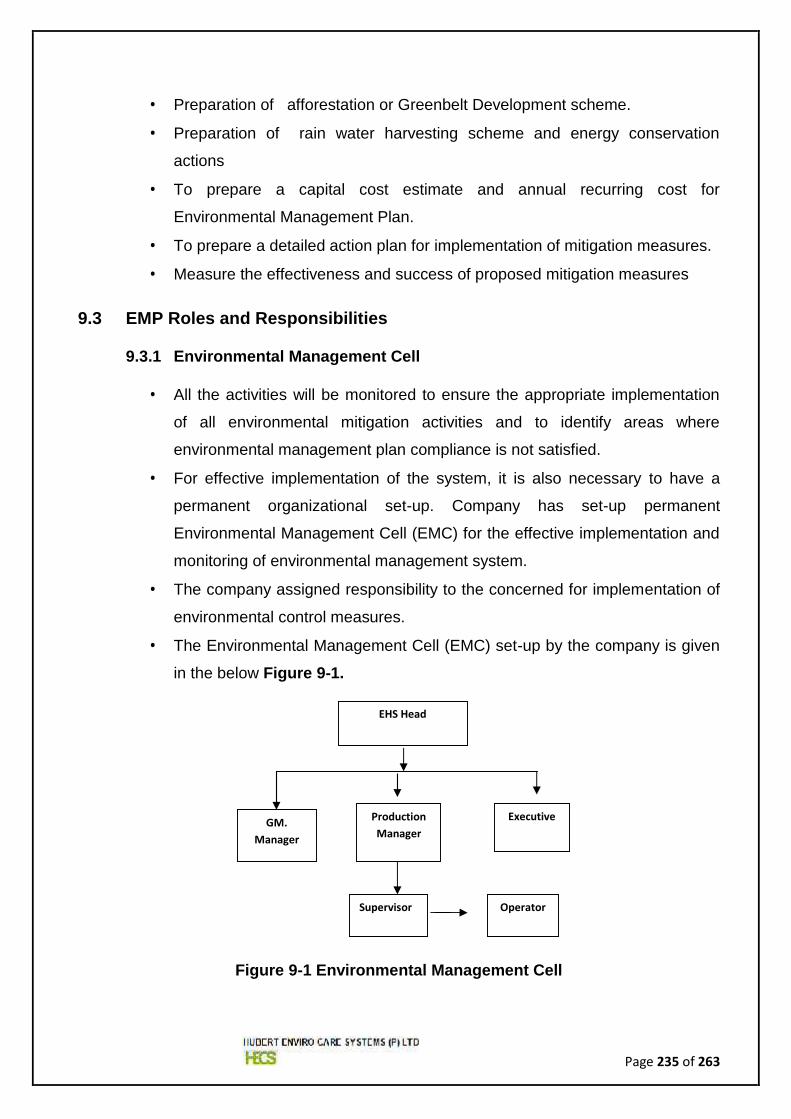
Page 235 of 263
Preparation of afforestation or Greenbelt Development scheme.
Preparation of rain water harvesting scheme and energy conservation
actions
To prepare a capital cost estimate and annual recurring cost for
Environmental Management Plan.
To prepare a detailed action plan for implementation of mitigation measures.
Measure the effectiveness and success of proposed mitigation measures
9.3 EMP Roles and Responsibilities
9.3.1 Environmental Management Cell
All the activities will be monitored to ensure the appropriate implementation
of all environmental mitigation activities and to identify areas where
environmental management plan compliance is not satisfied.
For effective implementation of the system, it is also necessary to have a
permanent organizational set-up. Company has set-up permanent
Environmental Management Cell (EMC) for the effective implementation and
monitoring of environmental management system.
The company assigned responsibility to the concerned for implementation of
environmental control measures.
The Environmental Management Cell (EMC) set-up by the company is given
in the below Figure 9-1.
Figure 9-1 Environmental Management Cell
EHS Head
GM.Manager
ProductionManager
Executive
Supervisor Operator
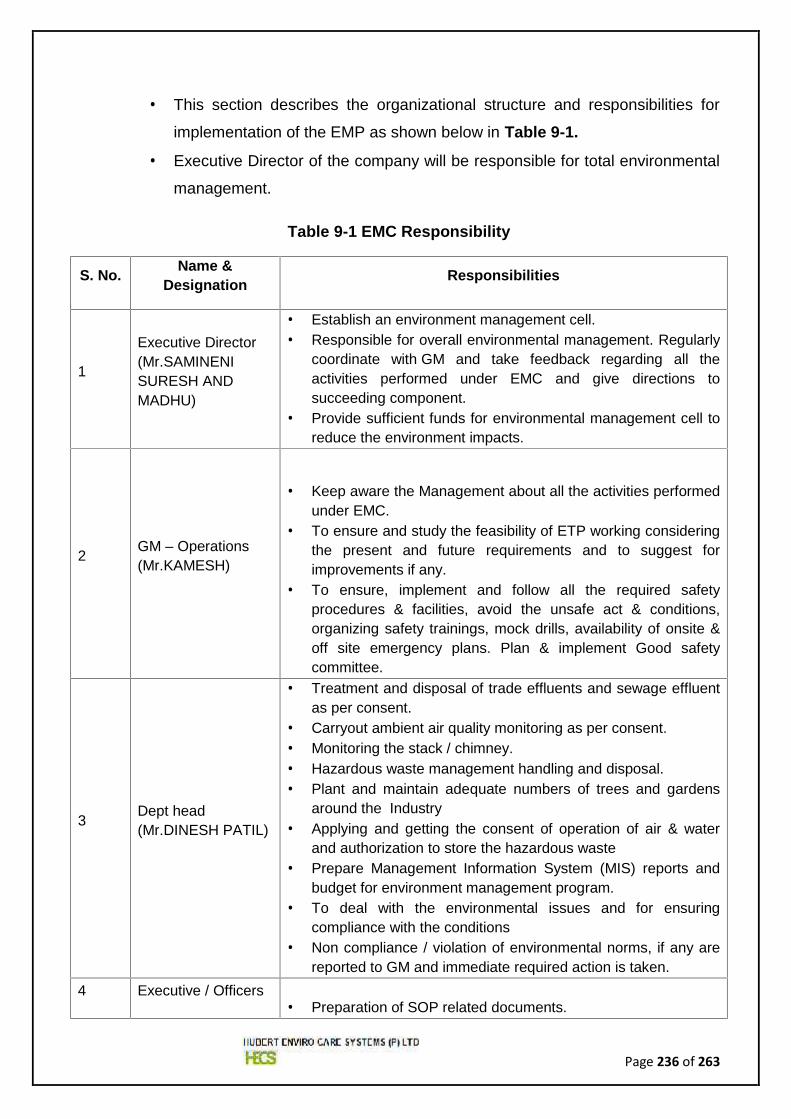
Page 236 of 263
This section describes the organizational structure and responsibilities for
implementation of the EMP as shown below in Table 9-1.
Executive Director of the company will be responsible for total environmental
management.
Table 9-1 EMC Responsibility
S. No. Name &Designation Responsibilities
1
Executive Director(Mr.SAMINENISURESH ANDMADHU)
Establish an environment management cell. Responsible for overall environmental management. Regularly
coordinate with GM and take feedback regarding all theactivities performed under EMC and give directions tosucceeding component.
Provide sufficient funds for environmental management cell toreduce the environment impacts.
2 GM – Operations(Mr.KAMESH)
Keep aware the Management about all the activities performedunder EMC.
To ensure and study the feasibility of ETP working consideringthe present and future requirements and to suggest forimprovements if any.
To ensure, implement and follow all the required safetyprocedures & facilities, avoid the unsafe act & conditions,organizing safety trainings, mock drills, availability of onsite &off site emergency plans. Plan & implement Good safetycommittee.
3 Dept head(Mr.DINESH PATIL)
Treatment and disposal of trade effluents and sewage effluentas per consent.
Carryout ambient air quality monitoring as per consent. Monitoring the stack / chimney. Hazardous waste management handling and disposal. Plant and maintain adequate numbers of trees and gardens
around the Industry Applying and getting the consent of operation of air & water
and authorization to store the hazardous waste Prepare Management Information System (MIS) reports and
budget for environment management program. To deal with the environmental issues and for ensuring
compliance with the conditions Non compliance / violation of environmental norms, if any are
reported to GM and immediate required action is taken.4 Executive / Officers
Preparation of SOP related documents.
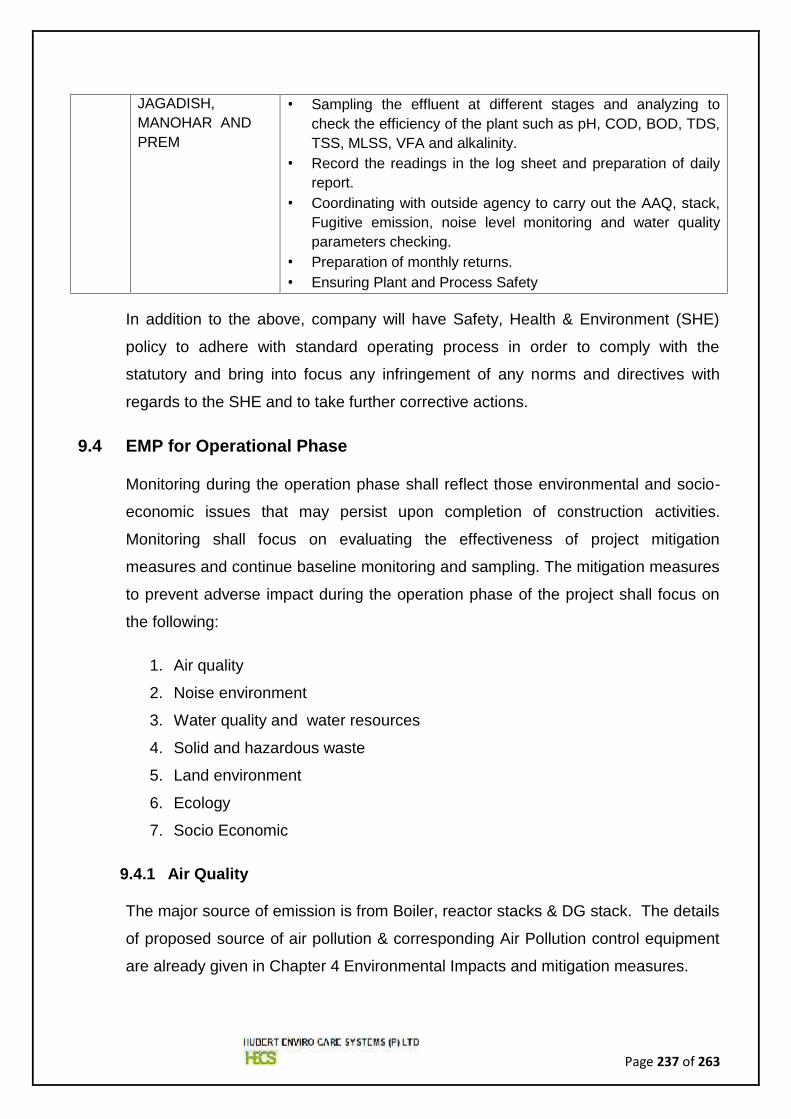
Page 237 of 263
JAGADISH,MANOHAR ANDPREM
Sampling the effluent at different stages and analyzing tocheck the efficiency of the plant such as pH, COD, BOD, TDS,TSS, MLSS, VFA and alkalinity.
Record the readings in the log sheet and preparation of dailyreport.
Coordinating with outside agency to carry out the AAQ, stack,Fugitive emission, noise level monitoring and water qualityparameters checking.
Preparation of monthly returns. Ensuring Plant and Process Safety
In addition to the above, company will have Safety, Health & Environment (SHE)
policy to adhere with standard operating process in order to comply with the
statutory and bring into focus any infringement of any norms and directives with
regards to the SHE and to take further corrective actions.
9.4 EMP for Operational Phase
Monitoring during the operation phase shall reflect those environmental and socio-
economic issues that may persist upon completion of construction activities.
Monitoring shall focus on evaluating the effectiveness of project mitigation
measures and continue baseline monitoring and sampling. The mitigation measures
to prevent adverse impact during the operation phase of the project shall focus on
the following:
1. Air quality
2. Noise environment
3. Water quality and water resources
4. Solid and hazardous waste
5. Land environment
6. Ecology
7. Socio Economic
9.4.1 Air Quality
The major source of emission is from Boiler, reactor stacks & DG stack. The details
of proposed source of air pollution & corresponding Air Pollution control equipment
are already given in Chapter 4 Environmental Impacts and mitigation measures.
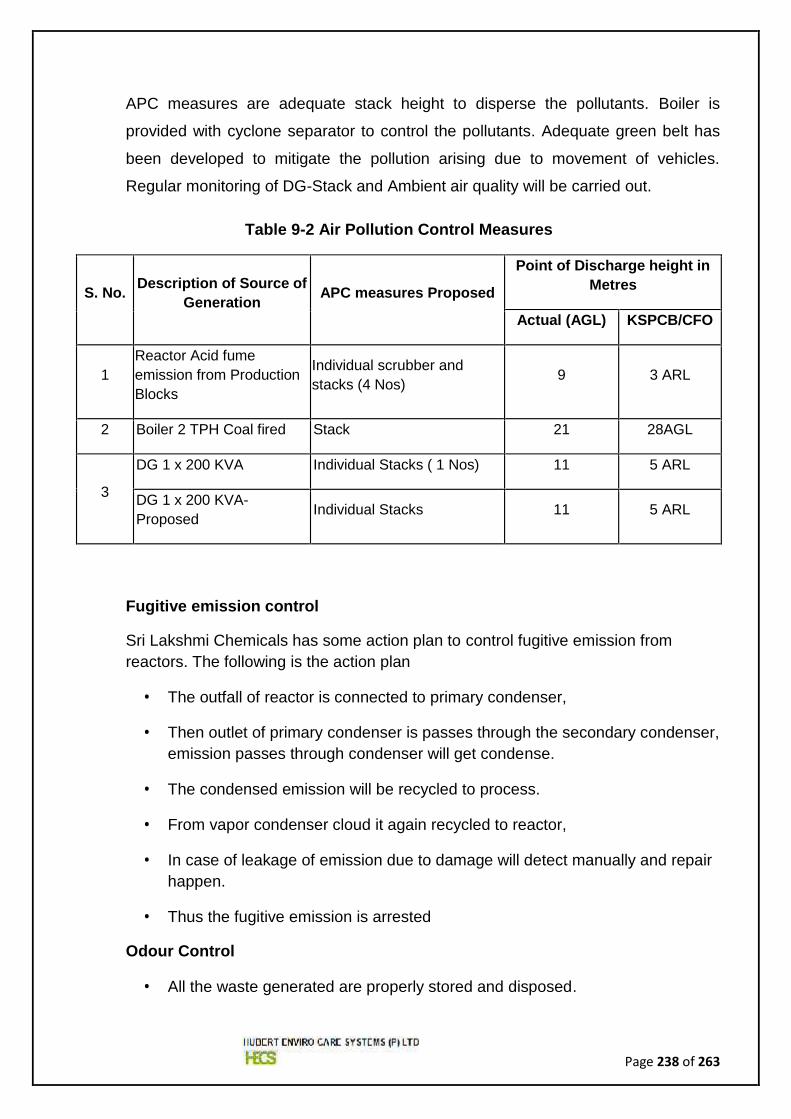
Page 238 of 263
APC measures are adequate stack height to disperse the pollutants. Boiler is
provided with cyclone separator to control the pollutants. Adequate green belt has
been developed to mitigate the pollution arising due to movement of vehicles.
Regular monitoring of DG-Stack and Ambient air quality will be carried out.
Table 9-2 Air Pollution Control Measures
S. No. Description of Source ofGeneration APC measures Proposed
Point of Discharge height inMetres
Actual (AGL) KSPCB/CFO
1Reactor Acid fumeemission from ProductionBlocks
Individual scrubber andstacks (4 Nos) 9 3 ARL
2 Boiler 2 TPH Coal fired Stack 21 28AGL
3
DG 1 x 200 KVA Individual Stacks ( 1 Nos) 11 5 ARL
DG 1 x 200 KVA-Proposed Individual Stacks 11 5 ARL
Fugitive emission control
Sri Lakshmi Chemicals has some action plan to control fugitive emission fromreactors. The following is the action plan
The outfall of reactor is connected to primary condenser,
Then outlet of primary condenser is passes through the secondary condenser,emission passes through condenser will get condense.
The condensed emission will be recycled to process.
From vapor condenser cloud it again recycled to reactor,
In case of leakage of emission due to damage will detect manually and repairhappen.
Thus the fugitive emission is arrested
Odour Control
All the waste generated are properly stored and disposed.
Page 239 of 263
The emissions are properly vent out through stacks of adequate height.
All the chemicals including products are handled in closed manner to control
the odour.
9.4.2 Noise Environment
The major source of noise pollution in the industry is DG sets, boilers, reactors, Air
compressors, Boiler feed water pumps. DG sets are provided with integral acoustic
enclosures. Also the ambient noise levels will be ensured within the ambient
standards by inbuilt design of mechanical equipment and buildings apart from
vegetation along the periphery and at various locations within the industry premises.
The plant will be specifically designed with due consideration on minimizing noise
pollution. Higher noise levels will be felt only near the active working areas and
therefore the workers are provided with personal protective equipment as a safety
measure.
Following measures are proposed to mitigate negative impact of operation phase of
the project on the surrounding noise environment.
i. All the noise generating equipments will be designed / operated to ensure
that noise level does not exceed 75-70 dB (A) at plant boundary as per the
requirement of Central / State Pollution Control Board.
ii. Noise generating sources will be maintained properly to minimize noise
generated by them.
iii. Wherever feasible, acoustic enclosures will be provided for compressors, DG
iv. Compliance with noise control norms will be given due importance at the time
of purchase of various equipments and it will be mentioned while placing the
purchase orders and guarantee for noise standards will be sought from
suppliers.
v. Moreover, all the personnel working in other high noise generating areas too
will be provided with sufficient ear protecting devices.
vi. Green belt will act as a noise barrier.
vii. Training will be imparted to personnel to generate awareness about effects of
noise and importance of using PPEs.
Page 240 of 263
9.4.3 Water and Wastewater Management
Total water requirement is 24.8 KLD of which fresh water requirement is 13.3 KLD;
Water source from the KIADB and Private tankers.
Zero liquid discharge system will be maintained in the facilities. The wastewater
management is detailed in the Chapter 4 & Section 4.2.8.2.
9.4.4 Solid and Hazardous waste Management
Solid and hazardous wastes generated in the facility and their disposal methods are
detailed in the Chapter 2 & Section 2.6.5.
9.4.4.1 Solvent Recovery
Solvent Recovery & Re-Use is detailed in the Chapter 2 and Section 2.4.5.
9.4.4.2 Land Environment
Following measures are proposed to mitigate negative impact during operational
phase of the project on the land environment.
Air emissions are effectively controlled by use of scrubbers and therefore
deposition of air pollutants in and around the premises and surrounding area is
not envisaged.
Disposal of solid waste is carried out through authorized vendor.
Plant is being maintained ZLD. No effluent is discharged directly on land without
treatment., impact on the land environment is not envisaged.
Hazardous materials are prohibited to be drained or dumped in the premises.
Accidental spills shall be cleaned, reported and monitored.
Thus, no impact on land is envisaged due to discharge of gaseous emission,
solid waste or liquid effluent from the proposed increment in the production
capacity.
9.4.5 Ecology
The proposed project is equipped with the treatment system and the treated effluent
will be recycled to cooling tower and boiler feed through softener. Solid wastes
generated during the operation phase are disposed off through authorized vendor
Page 241 of 263
and hence no impact is anticipated due to solid waste in and around the site. The
air pollution control devices are already in place in the facility will control release of
air pollutants to a greater extent, however green belt consisting of shrubs and trees
around the periphery of the site has been planned to intercept and arrest air
pollutants released at various heights and to attenuate the increased quantity of air
pollutants released into the environment. It is expected that the ecology of the
region is preserved by these mitigation measures.
9.4.6 Socio – Economic Environment
Due to the proposed project various modes of indirect employment i.e.
transportation, increased business opportunities to shopkeepers, small scale
business entrepreneurs etc. will help for the development of local area.
9.5 AVAILABLE SAFETY SYSTEMS
9.5.1 Fire Hydrant System
A pressurized (7 kg/cm2); automatically operated Fire Hydrant System has been
installed in the plant with rings and wet risers around all blocks to achieve maximum
coverage. Water reservoir of 200 m3 (Hydrant Tank) capacity is provided for
approximately 2 hr fire fighting. Following are the details of the system.
Jockey pump of 40 m3/hrs @ 60m head capacity with pressure switches
Main electrical pump of 130 m3/hrs @ 70m head capacity pressure switchesand delivers water at 6 kg/cm2
Yard Hydrant points - 8 Nos.
Hose Boxes – 7 Nos. (Each Hose Box contains 2 Nos. of hoses and 1 No. ofNozzle)
Hose Reel Drums – 1 Nos.
Foam Concentrate tank of capacity 1000 Lts
Water Monitor – 1 No.
Mobile Foam Unit
Two way fire brigade inlet
Page 242 of 263
Automatic sprinkler system in chemical storage tank area.
9.5.2 Fire Extinguisher
Suitability of fire extinguishers:
Depending on the combustible material, fires have been classified into four types.
Suitability of extinguishing media for different fires is provided in the following Table9-3.
Table 9-3 Suitability of extinguishing media for different fires
S. No Class of fire Suitable Fire Extinguisher
1. Class A:Organic Material i.e. wood, papers, rubber & plastics. DCP, Mechanical Foam
2.Class B:Flammable Liquid and Flammable Gases i.e., PetroleumProducts, Paints, Chemicals etc.
Mechanical Foam, CO2
and DCP
3.Class C:Electrical DCP and CO2
4.Class D:Flammable Metals i.e. Lithium, Sodium, and Potassium etc. Special DCP, Sand
The company has trained personnel for fire fighting and intends to improve the fire
fighting skills of employee by conducting frequent training on Fire fighting.
The unit has different types (CO2, ABC, Water Jet, Mechanical Foam, DCP and
sand buckets) of portable fire extinguishers placed in all prominent places of the
factory. Table 9-4 shows area wise fire extinguisher.
Table 9-4 Extinguisher based on area
LocatonNos
DCP CO2Water
with Foam
Production Block 1 12 5 1
Ware House 6 2 1
Raw Material 5 4 2
Tank Area 4 2 1
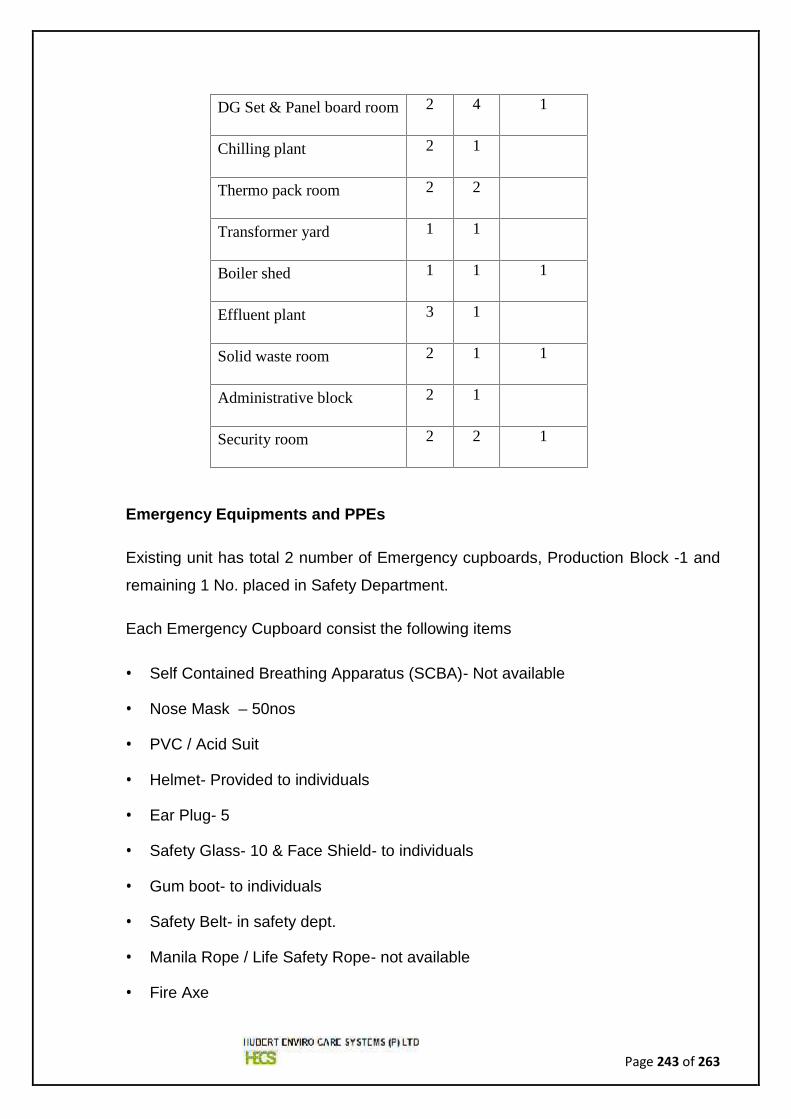
Page 243 of 263
DG Set & Panel board room 2 4 1
Chilling plant 2 1
Thermo pack room 2 2
Transformer yard 1 1
Boiler shed 1 1 1
Effluent plant 3 1
Solid waste room 2 1 1
Administrative block 2 1
Security room 2 2 1
Emergency Equipments and PPEs
Existing unit has total 2 number of Emergency cupboards, Production Block -1 and
remaining 1 No. placed in Safety Department.
Each Emergency Cupboard consist the following items
Self Contained Breathing Apparatus (SCBA)- Not available
Nose Mask – 50nos
PVC / Acid Suit
Helmet- Provided to individuals
Ear Plug- 5
Safety Glass- 10 & Face Shield- to individuals
Gum boot- to individuals
Safety Belt- in safety dept.
Manila Rope / Life Safety Rope- not available
Fire Axe

Page 244 of 263
Fire Proximity Suit
Resuscitator
Spill Kit
Safety Ladder
Emergency Flameproof Torches
Hand gloves-10nos
Operation of SCBA (Self Contained Breathing Apparatus)
Procedure for wearing Equipment:
Extend shoulder straps and waist belt. Put on the equipment.
Fasten the buckle and then pull the ends of waist belt away from
buckle until secure and comfortable on the hip. Tuck ends in belt
loops.
Pull down the shoulder straps until the equipment is secure and comfortable.
Tuck strap ends under waist belt.
Extend face piece head harness straps, leaving center straps in position. Put
neck strap over neck
Before opening the cylinder valve press reset button.
Open the cylinder valve fully to pressurize the system and check the pressure
gauge & Carry out pressure leak test.
Procedure for wearing Face piece
Fit harness overhead. Pull it back until the head strap fits
smoothly.
Adjust mask until it fits properly
Tighten the neck straps and temple straps evenly and tighten
the front strap as necessary.
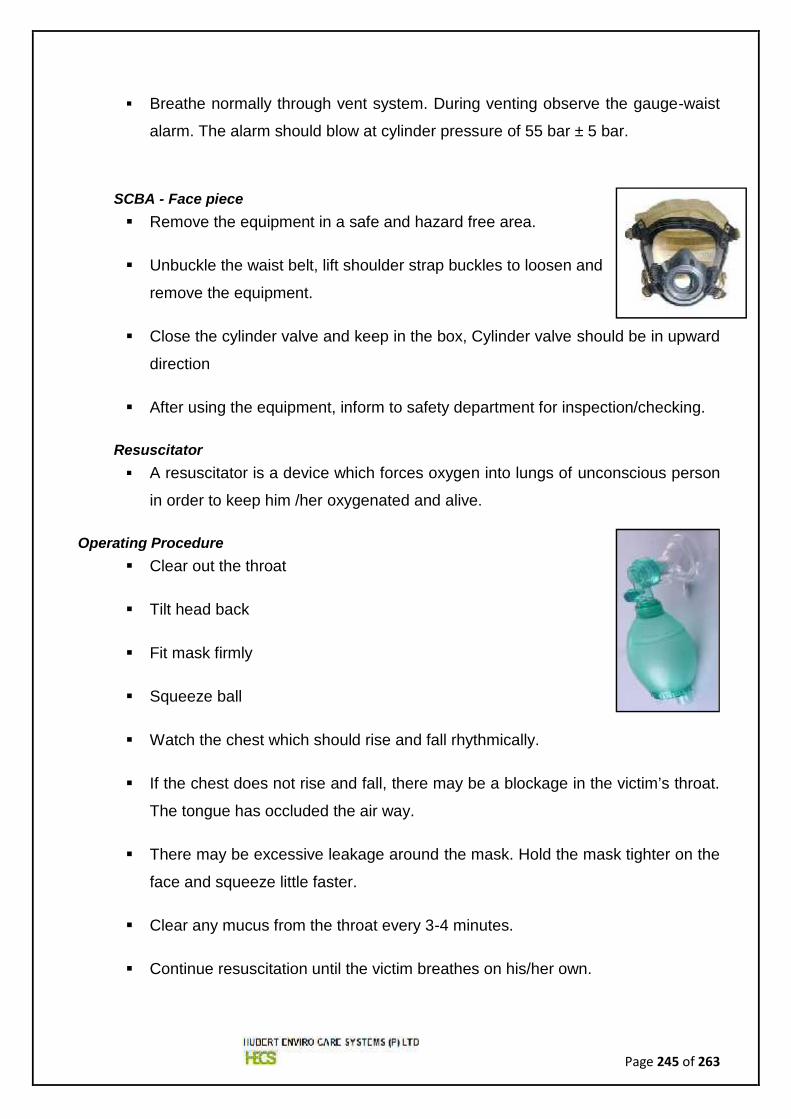
Page 245 of 263
Breathe normally through vent system. During venting observe the gauge-waist
alarm. The alarm should blow at cylinder pressure of 55 bar ± 5 bar.
SCBA - Face piece Remove the equipment in a safe and hazard free area.
Unbuckle the waist belt, lift shoulder strap buckles to loosen and
remove the equipment.
Close the cylinder valve and keep in the box, Cylinder valve should be in upward
direction
After using the equipment, inform to safety department for inspection/checking.
Resuscitator A resuscitator is a device which forces oxygen into lungs of unconscious person
in order to keep him /her oxygenated and alive.
Operating Procedure Clear out the throat
Tilt head back
Fit mask firmly
Squeeze ball
Watch the chest which should rise and fall rhythmically.
If the chest does not rise and fall, there may be a blockage in the victim’s throat.
The tongue has occluded the air way.
There may be excessive leakage around the mask. Hold the mask tighter on the
face and squeeze little faster.
Clear any mucus from the throat every 3-4 minutes.
Continue resuscitation until the victim breathes on his/her own.
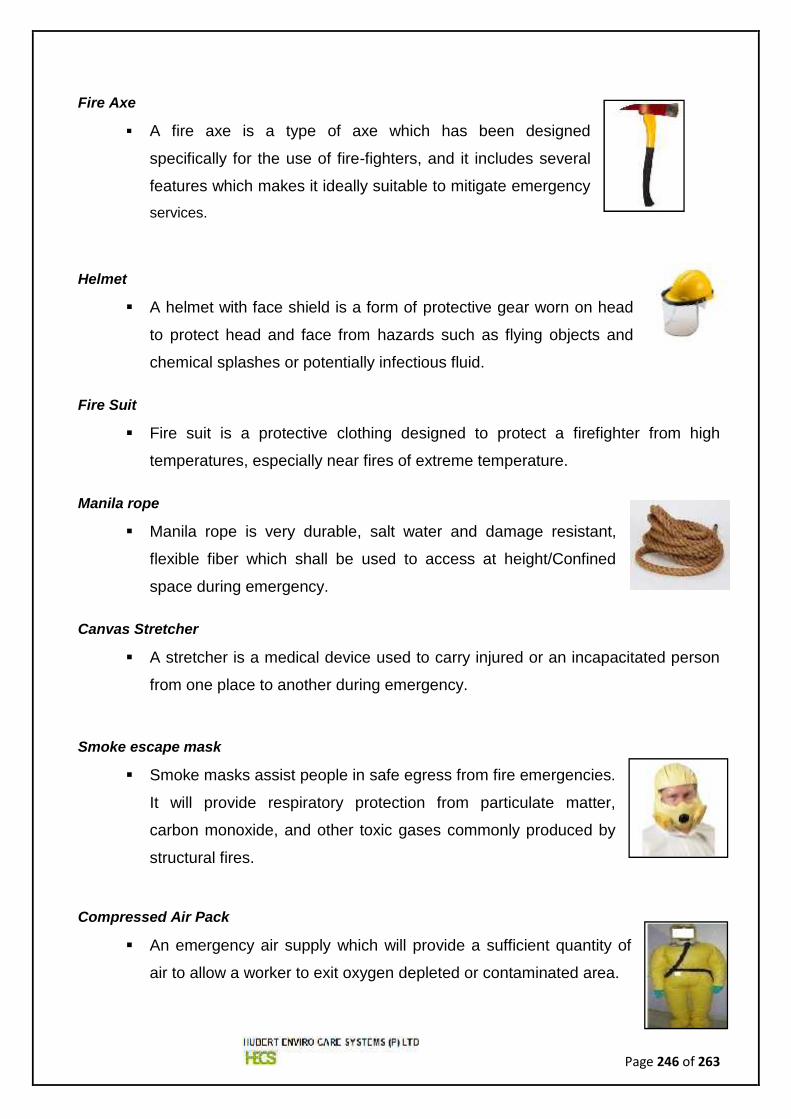
Page 246 of 263
Fire Axe
A fire axe is a type of axe which has been designed
specifically for the use of fire-fighters, and it includes several
features which makes it ideally suitable to mitigate emergencyservices.
Helmet
A helmet with face shield is a form of protective gear worn on head
to protect head and face from hazards such as flying objects and
chemical splashes or potentially infectious fluid.
Fire Suit
Fire suit is a protective clothing designed to protect a firefighter from high
temperatures, especially near fires of extreme temperature.
Manila rope
Manila rope is very durable, salt water and damage resistant,
flexible fiber which shall be used to access at height/Confined
space during emergency.
Canvas Stretcher
A stretcher is a medical device used to carry injured or an incapacitated person
from one place to another during emergency.
Smoke escape mask
Smoke masks assist people in safe egress from fire emergencies.
It will provide respiratory protection from particulate matter,
carbon monoxide, and other toxic gases commonly produced by
structural fires.
Compressed Air Pack
An emergency air supply which will provide a sufficient quantity of
air to allow a worker to exit oxygen depleted or contaminated area.
Page 247 of 263
Powered Air purifying respirator
Powered Air Purifying Respirator (PAPR) is a device equipped with a face piece,
hood or helmet, breathing tube, canister, cartridge, filter, canister with filter or
cartridge with filter and a powered blower.
PAPR utilizes a powered mechanism to move ambient air through an air-
purifying element(s) to remove contaminants from the ambient air.
Safety torch
Compact and simple to use, this torch is designed for use in
emergency situations or wherever the need arises for a handheld
safety torch.
Spill Emergency Mitigation Procedure
Spill Kit is kept in all Emergency cupboard.
Once the spill is observed, Spill Kit shall be collected from the nearest
area/emergency cupboard installed and neutralizing agent (if required) based on
the nature of the spill. In case if the spill is not controlled, immediately declare
the emergency as per emergency response procedure.
While handling the spill, use most appropriate PPE's like SCBA, chemical suit,
acid/ alkali proof hand gloves, face shield, safety goggles, gum boots or even
respiratory masks with suitable cartridges.
Once the spill is controlled using Sorbent pad/Boom collect in a double
polythene bag and secure with the plastic ties. Dispose it as per applicable
disposal procedure.
Report the incident of spill to EHS department through online incident reporting
System.
Once in a month, the items of the Spill Kit shall be inspected and recorded by
EHS representatives of the individual area.
Page 248 of 263
9.5.3 Eye Wash Fountain and Safety Shower
The unit has total 2 Nos. of Eye wash fountain / Safety showers at Production
Block.
9.5.4 Work Zone Monitoring Equipments
The unit has multi gas / toxic gas and oxygen detectors in that multi gas detector
can be used to check oxygen, LEL, VOC, CO and H2S concentration in atmosphere
and also in confined spaces like inside the reactor, overhead tanks, underground
tanks, sump etc and oxygen detector can be used for checking oxygen
concentration in atmosphere and also in confined spaces like inside the reactor,
overhead tanks, underground tanks, sump etc.
9.5.5 Wind Sack / Wind Direction Indicator
Wind sacks are placed above the Administration Block buildings.
9.6 OCCUPATIONAL HEALTH CENTRE (OHC)
SLC has done agreement with Dr. Krishnamurthy’s Hospital & Rehab Centre,
Inside Naya kaman, Bidar-585 401, Karnataka for their valuable service during
emergency along with 24/7 ambulance facility.
9.6.1 First Aid Boxes
A first aid kit is a collection of supplies and equipment for use in giving first aid. First
Aid boxes are available in Security Room (ECC), Admin Block and at OHC. First Aid
items will be issued to injure only by authorized persons.
Following are the contents of First Aid Box,
a. Dettol – Antiseptic solution
b. Ciplox – Eye Drops
c. Soframycin – Skin ointment
d. Silverex – Burn ointment
e. Betadine – Microbicidal solution
Page 249 of 263
f. Iodex – Pain reliever
g. Sterilized Cotton Wool
h. Surgical Paper Tape
i. Small Sterilized Dressings
j. Medium Sterilized Dressings
k. Roller Bandage – 5 cm wide
l. Roller Bandage – 10cm wide
m. Band Aid
n. Crocin / Paracetamol Tablet
Along with the above safety systems, company also ensured the below safety
features to ensure Zero Accident.
No ignitable zones are declared and marked so.
Work permit system with strict compliance.
Dedicated chemical storage area with good ventilation and exhaust system
and all chemical are stored as per compatibility.
Dyke walls provided for the day storage chemical tanks.
All reactors provided with safety valves followed by rupture discs and relief
valve outlets are extended.
Calibration is ensured for the gauges of pressure, temperature and vacuum.
All reactors will be hydro tested and certified by the competent person once in
a year.
Body earthing provided to all equipments involved in the process, electrical
earthing, static earthing and instrument earthing provided wherever required.
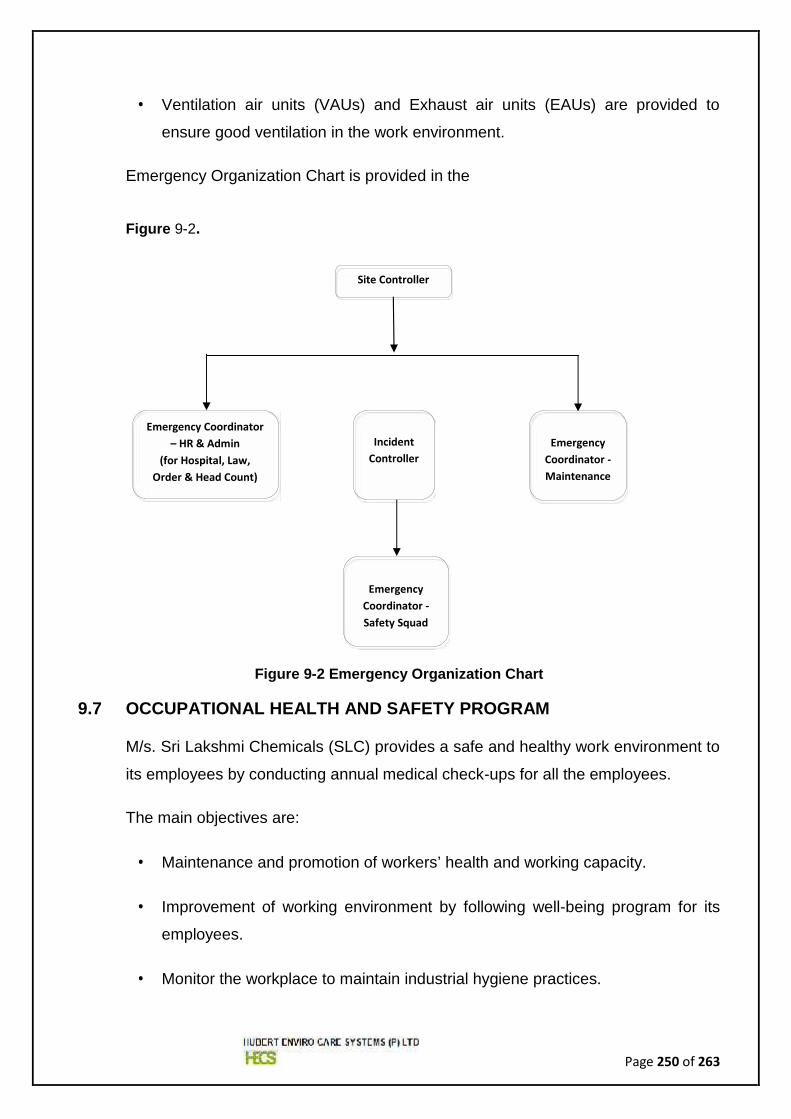
Page 250 of 263
Ventilation air units (VAUs) and Exhaust air units (EAUs) are provided to
ensure good ventilation in the work environment.
Emergency Organization Chart is provided in the
Figure 9-2.
Figure 9-2 Emergency Organization Chart
9.7 OCCUPATIONAL HEALTH AND SAFETY PROGRAM
M/s. Sri Lakshmi Chemicals (SLC) provides a safe and healthy work environment to
its employees by conducting annual medical check-ups for all the employees.
The main objectives are:
Maintenance and promotion of workers’ health and working capacity.
Improvement of working environment by following well-being program for its
employees.
Monitor the workplace to maintain industrial hygiene practices.
Site Controller
IncidentController
Emergency Coordinator– HR & Admin
(for Hospital, Law,Order & Head Count)
EmergencyCoordinator -Maintenance
EmergencyCoordinator -Safety Squad

Page 251 of 263
Development of work culture in a direction which will support health and safety
at work and thereby promoting positive social climate for smooth operation that
will enhance productivity.
SLC allocates a fund of 1.5 Lakhs .
Area monitoring is done.
Employees undergo annual health check-up.
All personnel are provided with personal Protective equipments individually as
required.
9.7.1 Operation Phase
General Functions of the safety committee are;
Conduct routine workplace inspections.
Provide Personal Protective Equipment.
Develop and implement safe work procedures and rules.
Provide on-going safety training & Enforce safety rules and appropriate
discipline.
Promote safety awareness and reduce the potential for injury/loss.
Identify workplace hazards.
Enforce of safety rules, measure safety performance & reduce
frequency/severity of injuries.
9.7.2 Occupational Health Monitoring
Medical Surveillance Program: Medical surveillance program is essential to assess
and monitor employees' health and fitness both prior to employment and during the
course of work; to determine fitness for duty and to provide emergency and other
treatment as needed. Effectiveness of a medical program depends on active
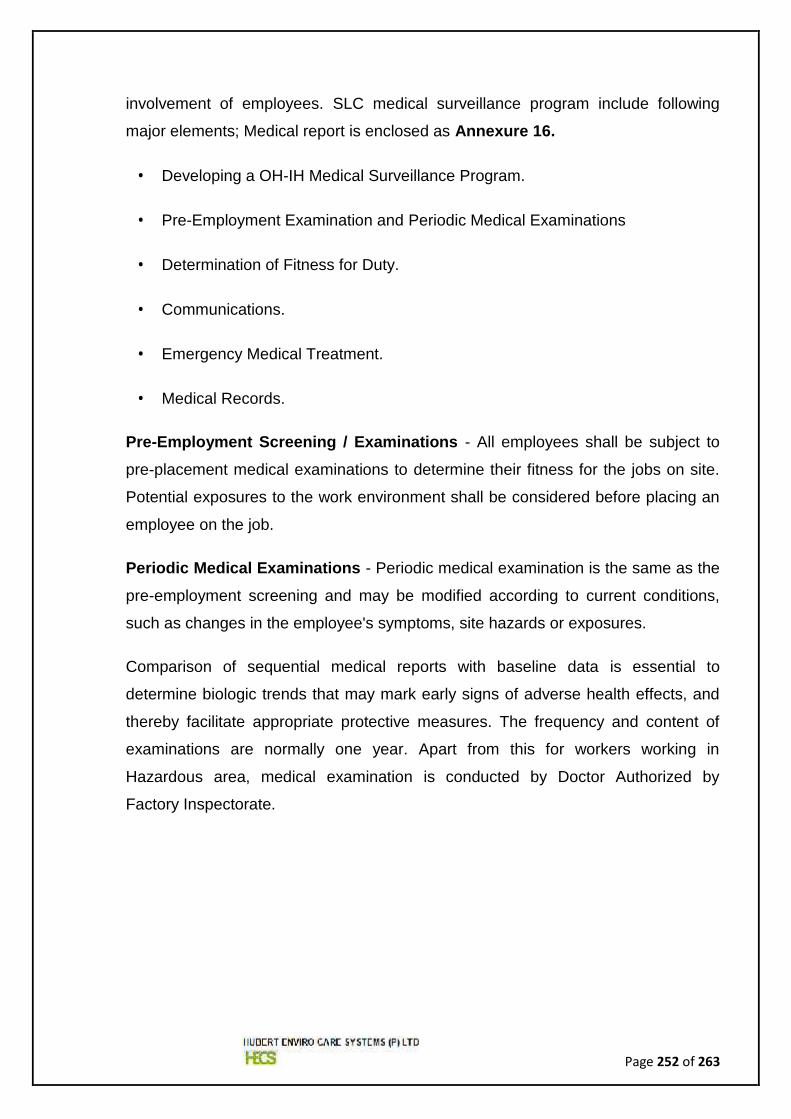
Page 252 of 263
involvement of employees. SLC medical surveillance program include following
major elements; Medical report is enclosed as Annexure 16.
Developing a OH-IH Medical Surveillance Program.
Pre-Employment Examination and Periodic Medical Examinations
Determination of Fitness for Duty.
Communications.
Emergency Medical Treatment.
Medical Records.
Pre-Employment Screening / Examinations - All employees shall be subject to
pre-placement medical examinations to determine their fitness for the jobs on site.
Potential exposures to the work environment shall be considered before placing an
employee on the job.
Periodic Medical Examinations - Periodic medical examination is the same as the
pre-employment screening and may be modified according to current conditions,
such as changes in the employee's symptoms, site hazards or exposures.
Comparison of sequential medical reports with baseline data is essential to
determine biologic trends that may mark early signs of adverse health effects, and
thereby facilitate appropriate protective measures. The frequency and content of
examinations are normally one year. Apart from this for workers working in
Hazardous area, medical examination is conducted by Doctor Authorized by
Factory Inspectorate.
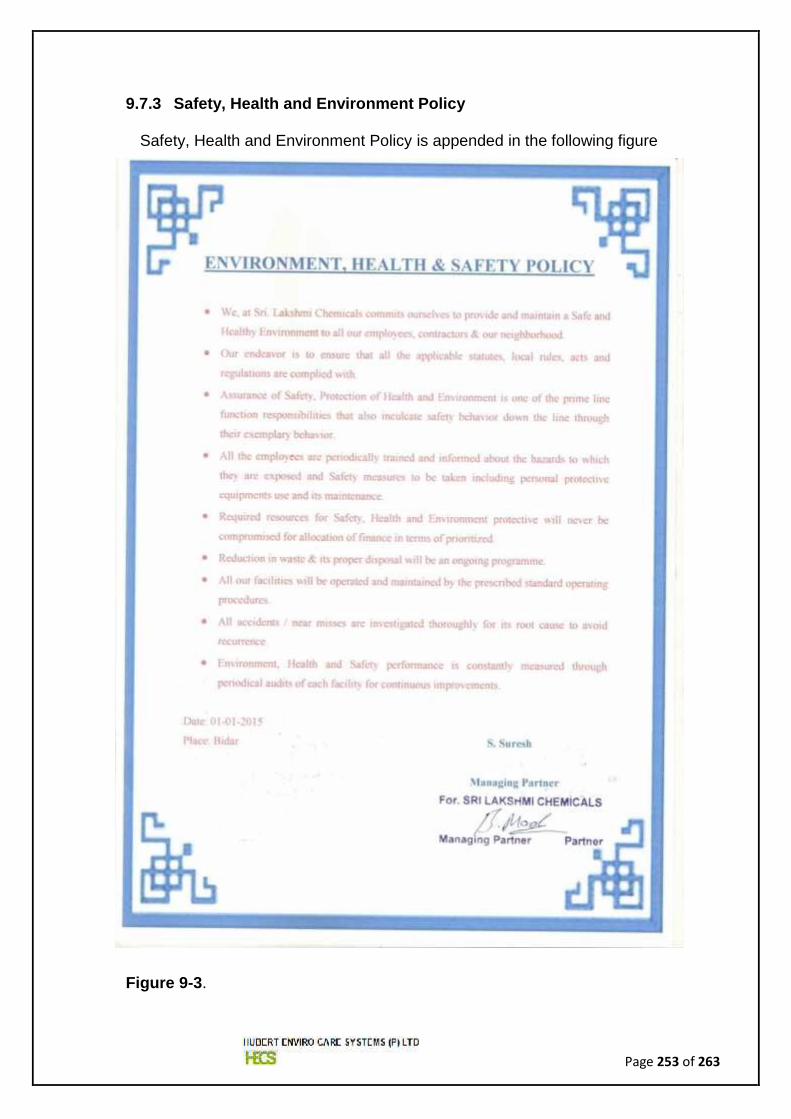
Page 253 of 263
9.7.3 Safety, Health and Environment Policy
Safety, Health and Environment Policy is appended in the following figure
Figure 9-3.
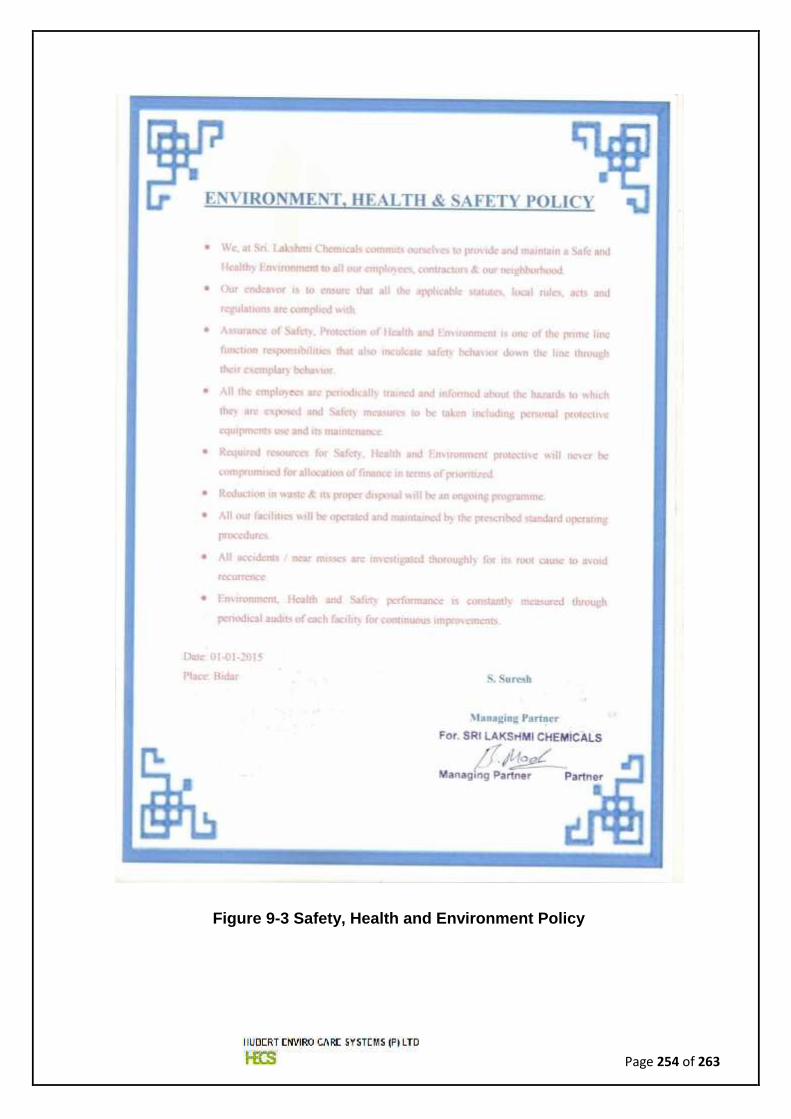
Page 254 of 263
Figure 9-3 Safety, Health and Environment Policy
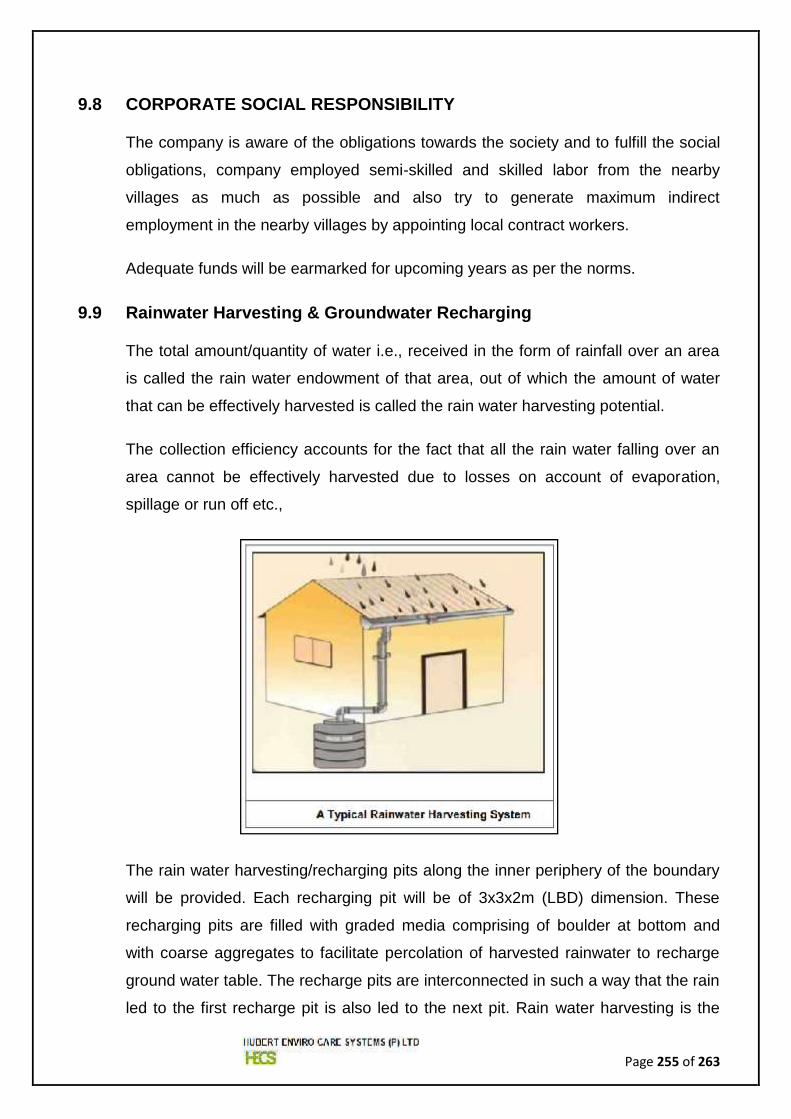
Page 255 of 263
9.8 CORPORATE SOCIAL RESPONSIBILITY
The company is aware of the obligations towards the society and to fulfill the social
obligations, company employed semi-skilled and skilled labor from the nearby
villages as much as possible and also try to generate maximum indirect
employment in the nearby villages by appointing local contract workers.
Adequate funds will be earmarked for upcoming years as per the norms.
9.9 Rainwater Harvesting & Groundwater Recharging
The total amount/quantity of water i.e., received in the form of rainfall over an area
is called the rain water endowment of that area, out of which the amount of water
that can be effectively harvested is called the rain water harvesting potential.
The collection efficiency accounts for the fact that all the rain water falling over an
area cannot be effectively harvested due to losses on account of evaporation,
spillage or run off etc.,
The rain water harvesting/recharging pits along the inner periphery of the boundary
will be provided. Each recharging pit will be of 3x3x2m (LBD) dimension. These
recharging pits are filled with graded media comprising of boulder at bottom and
with coarse aggregates to facilitate percolation of harvested rainwater to recharge
ground water table. The recharge pits are interconnected in such a way that the rain
led to the first recharge pit is also led to the next pit. Rain water harvesting is the
Page 256 of 263
techniques through which rain water is captured from the roof catchments with
closed pipe system (without mixing surface water to avoid the spillage
contamination) into the recharge pits. The rain water harvesting and storm water
management layout is provided in the Annexure 8.
Ground coverage = 1303 Sq. mt
Collection efficiencies of 80% = 1042.4 Sq. mt
Runoff of coefficients for Roofs Conventional = 0.70 to 0.80
Runoff of coefficients taken as = 0.75
Annual average rainfall for Bidar district = 827mm
(Source:Ground Water Information Booklet,
Bidar District, Karnataka,2008
Volume of water received (m3) = Area of catchment in Sq.mt x
Runoff coefficient x Rainfall per day (m)
Volume of water received (m3) = (1042.4x 0.75 x 0. 827)/365
= 1.77 KL/Day
Page 257 of 263
CHAPTER – 10Summary & Conclusion
Page 258 of 263
10. SUMMARY & CONCLUSION
10.1 Summary
An environmental Impact Assessment Study has been carried out and assessed for
the proposed project based on the TOR and baseline quality data collected for the
study area. Identification and anticipation of the potential environmental impacts due
to the proposed project with a delineation of appropriate impact mitigation measures
in an Environmental Management plan during both construction and operation
phases is provided in the EIA report prepared.
The proposed project will ensure that the industrial activities relevant to the project
are environmentally sound with no adverse impacts posed on the natural
environment in the surrounding area.
The marginal impacts that might be caused by the proposed activity will be
mitigated by the existing pollution control and environmental management
measures.
In a true and a larger sense, in view of the considerable benefits from the project
with no major impacts, the proposed project is said to be more beneficial to the
nation.
The EMP that will be implemented for the operation phase of the project will include:
Air Pollution control and management
Noise Control and Management
Hazardous and Solid waste Management
Sewage treatment and Management
Effluent treatment and Management
Hazardous and solid waste management
Risk Assessment and Onsite emergency Plan
Page 259 of 263
In order to effectively implement the EMP planned, the environmental management
system will be fully adhered.
10.2 Conclusion
The baseline study carried out for the study area indicates that all the physical,
chemical and biological characteristics of the environmental attributes in the
surrounding area are mostly within the permissible limits except few minor
exceedences.
Based on this environmental assessment, the possible impacts during post-project
phase are anticipated and the necessary adequate control measures are formulated
to meet the statutory compliances.
With very minute negative impacts, the project positively leads to commercial
business opportunities, Employment opportunities, increased revenue and
infrastructural development.
Thus this project may kindly be granted Environmental Clearance.
Page 260 of 263
CHAPTER – 11Disclosure of Consultant
Page 261 of 263
11. DISCLOSURE OF CONSULTANT
In order to assess the potential environmental impacts due to the proposed
expansion of the Bulk Drugs and Intermediates Manufacturing Unit by M/s. Sri
Lakshmi Chemicals Limited, Plot No. 73 D, KIADB Industrial Area, Nizampur village,
BidarTaluk, Bidar Dt, Karnataka. Sri Lakshmi Chemicals has engaged Hubert
Enviro Care Systems (P) Limited, Chennai to undertake EIA study. The nature of
consultancy service rendered covers terrestrial environmental assessment.
22.1 Brief Profile of Hubert Enviro Care Systems (P) Limited (HECS)
Enviro Care Systems was started in the year of 1997 by Dr. J.R.Moses with the
vision to serve the world in all environmental related problems by completing the
latest technological advancements available.
In the year 2004, Enviro Care Systems became Hubert Enviro Care Systems (P)
Ltd after having collaboration with Hubert Stavoren B.V. for higher Technology.
The company provides total pollution control solutions to several industries like
Thermal Power Plant, Pharma, R&D Facilities, Electroplating and Manufacturing, IT
Parks, Residential Complexes, Dairies, Food Processing, Textile mills, Breweries,
etc.
The company is specialized in executing projects right from concept development,
supply, erection, commissioning and operation on turnkey basis. HECS has
successfully executed more than 200 environmental engineering projects for
various industrial sectors both in India and overseas.
HECS has state-of-art facilities to provide quality environmental consultancy and
engineering solutions.
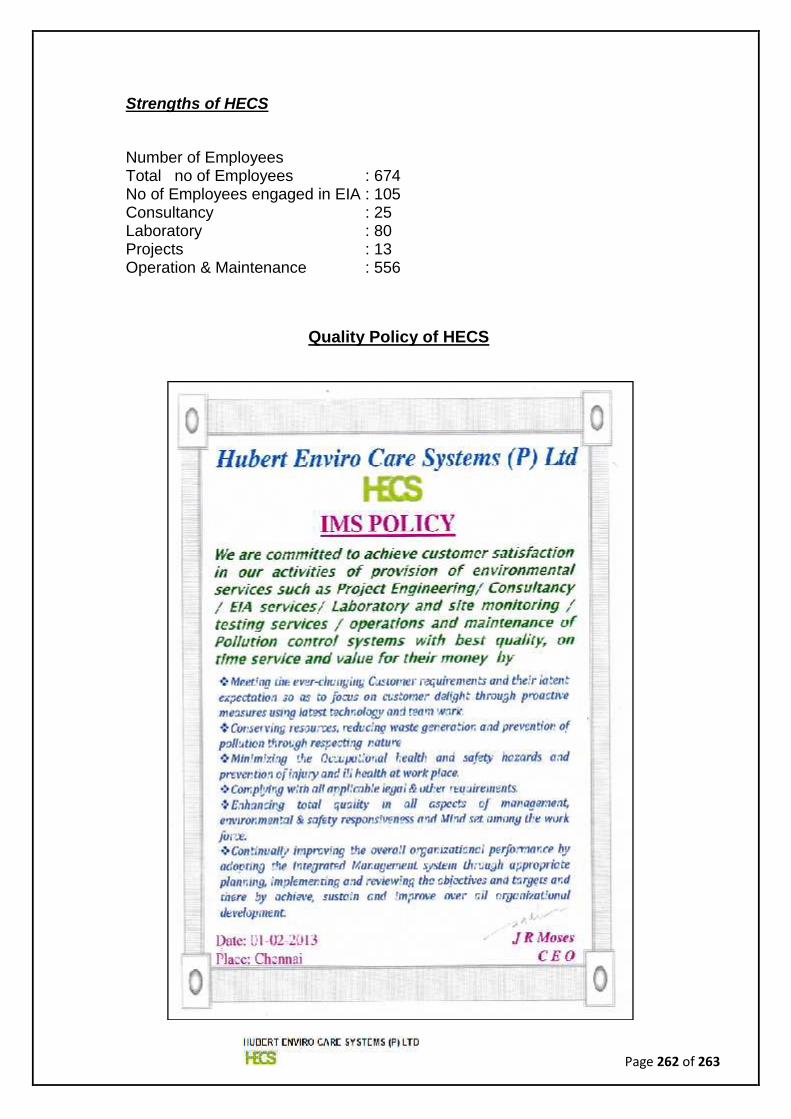
Page 262 of 263
Strengths of HECS
Number of EmployeesTotal no of Employees : 674No of Employees engaged in EIA : 105Consultancy : 25Laboratory : 80Projects : 13Operation & Maintenance : 556
Quality Policy of HECS

Page 263 of 263
QCI-NABET - EIA Accreditation
Consultancy Hubert Enviro Care Systems Pvt. Ltd.,Chennai
NABET Certificate No NABET/ EIA/ 1618/SA 0015
MoEFF Reg. Lab F.No. Q-15018/29/2007-CPW
National Accreditation Board for Education & Training (NABET) is a constituent
board of the Quality Council of India (QCI). QCI, NABET has accredited HECS for
carrying out Category ‘A & Category B’ EIA studies in the following sectors:
Mining of minerals including Open cast only (Sector # 1 as per NABETscheme)
*Offshore and onshore oil and gas exploration development & production
(Sector # 2 as per NABET scheme)
Thermal Power Plants (Sector # 4 as per NABET scheme)
Petroleum refining industry (Sector # 10 as per NABET scheme)
Petro-chemical complexes (industries based on processing of petroleum
fractions & natural gas and/or reforming to aromatics) (Sector # 18 as perNABET scheme)
Synthetic organic chemicals industry (dyes & dye intermediates, bulk drugs and
intermediates excluding drug formulations, synthetic rubbers, basic organic
chemicals, other synthetic organic chemicals and chemical intermediates)
(Sector # 21 as per NABET scheme)
Oil & gas transportation pipeline (crude and refinery/petrochemical products),
passing through national parks/sanctuaries/coral reefs/ecologically sensitive
areas including LNG terminal (Sector # 27 as per NABET scheme)
*Industrial Estates/Parks/Complexes/Areas, Export Processing Zone (EPZs),
Special Economic Zones (SEZs), Biotech Parks and Leather Complexes
(Sector # 31 as per NABET scheme)
Common Effluent Treatment Plants (CETPs) (Sector # 36 as per NABETscheme)
Page 264 of 264
Building and large construction projects including shopping malls, multiplexes,
commercial complexes, housing estates, hospitals, institutions (Sector # 38 asper NABET scheme)
Townships and Area development projects (Sector # 39 as per NABETscheme)
Note:- List ‘A’ – Accredited EIA Consultant Organizations Complying with Version 3
of the Scheme – as on 10th April, 2017 (#)
Further details may be seen on the following URL: www.hecs.in

HUBERT ENVIRO CARE SYSTEMS (P) LIMITEDA-21, III-Phase, Behind Lions Club School,
Thiru vi ka Industrial Estate, Guindy, Chennai – 600 032Ph: +91-44-43635555; Fax: +91-44-43635500