squat defects and rolling contact fatigue clusters ·...
TRANSCRIPT

THESIS FOR THE DEGREE OF DOCTOR OF PHILOSOPHY IN SOLID ANDSTRUCTURAL MECHANICS
Squat defects and rolling contact fatigue clustersNumerical investigations of rail and wheel deterioration mechanisms
ROBIN ANDERSSON
Department of Industrial and Materials ScienceCHALMERS UNIVERSITY OF TECHNOLOGY
Gothenburg, Sweden 2018

Squat defects and rolling contact fatigue clustersNumerical investigations of rail and wheel deterioration mechanismsROBIN ANDERSSONISBN 978-91-7597-710-2
c© ROBIN ANDERSSON, 2018
Doktorsavhandlingar vid Chalmers tekniska högskolaNy serie nr. 4391ISSN 0346-718XDepartment of Industrial and Materials ScienceChalmers University of TechnologySE-412 96 GothenburgSwedenTelephone: +46 (0)31-772 1000
Chalmers ReproserviceGothenburg, Sweden 2018

Squat defects and rolling contact fatigue clustersNumerical investigations of rail and wheel deterioration mechanismsROBIN ANDERSSONDepartment of Industrial and Materials ScienceChalmers University of Technology
AbstractSquat defects, a type of localised rolling contact fatigue damage appearing on rail surfaceswith rail break as an ultimate consequence, have concerned infrastructure managers forthe last couple of decades. In recent years similar types of defects—so-called studs—thatare visually resembling squats, have started to appear. In contrast to conventional rollingcontact fatigue of rails, these defects are associated with a thin surface layer of brittlematerial—a “white etching layer”. The wheel counterpart of squats/studs are called“rolling contact fatigue clusters”. Despite significant research efforts, the exact initiationmechanisms of the defects are still unknown and it is difficult to relate the occurrence ofsquats/studs and rolling contact fatigue clusters to specific operational scenarios.
The current work aims to deepen the understanding of squat/stud and rolling con-tact fatigue cluster initiation by comparing and ranking predicted damage from variouspotential causes of initiation under different operational scenarios. Special emphasis is puton local surface irregularities. These are studied using dynamic vehicle–track interactionsimulations to evaluate the impact of e.g. irregularity size, vehicle velocity, wheel–railfriction conditions and position relative to a sleeper. It is seen that surface irregularitiesmight cause substantial fatigue impact. Rolling contact fatigue initiation connected tooperational scenarios of specific interest are studied more in detail by mapping dynamiccontact stresses from simulations of vehicle–track interaction to finite element models forsubsequent stress analyses and ranking of operational scenarios via ratchetting responseand low cycle fatigue impact. Among the results, it is seen that larger irregularities andhigher wheel–rail friction promote higher fatigue impact. In order to study the influenceof irregularity geometry when macroscopic cracks are present, dynamic contact stressesare mapped onto finite element models of a cracked rail head. The severity is assessedusing an equivalent stress intensity factor, which is seen to increase with the size of theirregularity. This effect holds also for clusters of irregularities. It is furthermore seen thateven a shallow irregularity can make a substantial impact.
The influence of white etching layers is investigated by simulating thermally induced phasetransformations occurring in spots on rail and wheel surfaces, subjected to subsequentmechanical loading. The influence of axle load and wheel–rail friction is investigated withrespect to fatigue impact. It is seen that the axle load has a rather low influence whereasan increased frictional loading increases the fatigue impact considerably.
Keywords: Squats, studs, rolling contact fatigue clusters, rolling contact fatigue, railsurface irregularities, dynamic vehicle–track interaction, fracture mechanics
i

ii

PrefaceThe following work was carried out between April 2013 and May 2018 at the Departmentof Applied Mechanics and the Department of Industrial and Materials Science at ChalmersUniversity of Technology. It was conducted as a part of the project MU31 – “Squats inrails and RCF clusters on wheels” within the Centre of Excellence CHARMEC (CHalmersRailway MEChanics, www.charmec.chalmers.se). The project was partly financed withinthe European Horizon 2020 Joint Technology Initiative Shift2Rail through contract no.730841. Some of the computations were performed on resources at Chalmers Centrefor Computational Science and Engineering (C3SE) provided by the Swedish NationalInfrastructure for Computing (SNIC).
AcknowledgementsFirst of all, I would like to thank my main supervisor Elena Kabo and co-supervisors AndersEkberg, Fredrik Larsson and Peter Torstensson for all their support, encouragement andcommitment during these years. It has been very instructive and also fun to work together.
I would furthermore like thank my co-author Johan Ahlström. I also feel gratitudetowards members of the project’s reference group as well as participants in the Swedish–Austrian CHARMEC workshops, who have contributed to fruitful discussions. Moreover, Iwould like to thank friends and colleagues at the divisions of Material and ComputationalMechanics and Dynamics for a nice working environment.
Last, but definitely not least, I would like to thank my family for their support andpatience throughout the years.
Gothenburg, May 2018Robin Andersson
iii

iv

ThesisThis thesis consists of an extended summary and the following appended papers:
Paper AR. Andersson, P. T. Torstensson, E. Kabo, and F. Larsson. The influenceof rail surface irregularities on contact forces and local stresses. VehicleSystem Dynamics 53.1 (2015), 68–87. doi: 10.1080/00423114.2014.982890
Paper BR. Andersson, P. T. Torstensson, E. Kabo, and F. Larsson. An efficient ap-proach to the analysis of rail surface irregularities accounting for dynamictrain–track interaction and inelastic deformations. Vehicle System Dynam-ics 53.11 (2015), 1667–1685. doi: 10.1080/00423114.2015.1081701
Paper CR. Andersson, P. T. Torstensson, E. Kabo, F. Larsson, and A. Ekberg.Integrated analysis of dynamic vehicle–track interaction and plasticityinduced damage in the presence of squat defects. Wear 366-367 (2016),139–145. doi: 10.1016/j.wear.2016.05.014
Paper DR. Andersson, F. Larsson, and E. Kabo. Evaluation of stress intensityfactors under multiaxial and compressive conditions using low order dis-placement or stress field fitting. Engineering Fracture Mechanics 189(2018), 204–220. doi: 10.1016/j.engfracmech.2017.11.015
Paper ER. Andersson, J. Ahlström, E. Kabo, F. Larsson, and A. Ekberg. Numeri-cal investigation of crack initiation in rails and wheels in the presence ofwhite etching layers. Submitted for international publication (2018)
Paper F R. Andersson. Assessment of rolling contact fatigue cracks in the vicinityof rail surface irregularities. Submitted for international publication (2018)
Papers A–E were prepared in collaboration with the co-authors. The author of this thesiswas responsible for the major progress of the work, i.e. took part in planning the papers,developed the numerical models, carried out the simulations, interpreted the results andwrote the main part of the papers. The dynamic vehicle–track interaction software usedfor parts of the analyses in Papers A–C and F was developed by Peter Torstensson.
v

vi
Contents
Abstract i
Preface iii
Acknowledgements iii
Thesis v
Contents vii
I Extended Summary 1
1 Introduction 11.1 Background . . . . . . . . . . . . . . . . . . . . . . . . . . . . . . . . . . . 11.2 Aim and scope of research . . . . . . . . . . . . . . . . . . . . . . . . . . . 31.3 Outline . . . . . . . . . . . . . . . . . . . . . . . . . . . . . . . . . . . . . 4
2 Fundamentals of squat/RCF cluster formation 4
3 Overview of potential damage mechanisms 73.1 Rolling contact fatigue damage . . . . . . . . . . . . . . . . . . . . . . . . 73.2 Dynamic loads . . . . . . . . . . . . . . . . . . . . . . . . . . . . . . . . . 93.3 Thermal damage . . . . . . . . . . . . . . . . . . . . . . . . . . . . . . . . 9
4 Modelling of wheel–rail contact 114.1 Basic concepts of rolling contact . . . . . . . . . . . . . . . . . . . . . . . 114.2 Analytical solutions . . . . . . . . . . . . . . . . . . . . . . . . . . . . . . 13
4.2.1 Normal contact – Hertz solution . . . . . . . . . . . . . . . . . . . 134.2.2 Tangential contact – Carter solution . . . . . . . . . . . . . . . . . 14
4.3 Kalker’s complete and simplified theories . . . . . . . . . . . . . . . . . . . 164.4 Finite element method . . . . . . . . . . . . . . . . . . . . . . . . . . . . . 17
5 Simulation of dynamic vehicle–track interaction 185.1 Method of moving Green’s functions . . . . . . . . . . . . . . . . . . . . . 185.2 Transient finite element analysis . . . . . . . . . . . . . . . . . . . . . . . 225.3 Multibody simulation . . . . . . . . . . . . . . . . . . . . . . . . . . . . . 23
6 Analysis of rail and wheel damage 236.1 Stress–strain analysis . . . . . . . . . . . . . . . . . . . . . . . . . . . . . . 236.2 Numerical approaches to RCF and fracture mechanics . . . . . . . . . . . 26
6.2.1 Maximum contact stresses and forces . . . . . . . . . . . . . . . . . 26
vii

6.2.2 Surface fatigue index . . . . . . . . . . . . . . . . . . . . . . . . . . 276.2.3 Tγ approach . . . . . . . . . . . . . . . . . . . . . . . . . . . . . . 276.2.4 Equivalent stress/strain . . . . . . . . . . . . . . . . . . . . . . . . 286.2.5 Jiang–Sehitoglu fatigue parameter . . . . . . . . . . . . . . . . . . 296.2.6 Fracture mechanics . . . . . . . . . . . . . . . . . . . . . . . . . . . 30
6.3 Thermal loading and damage . . . . . . . . . . . . . . . . . . . . . . . . . 34
7 Summary of appended papers 357.1 Paper A: The influence of rail surface irregularities on contact forces and
local stresses . . . . . . . . . . . . . . . . . . . . . . . . . . . . . . . . . . 357.2 Paper B: An efficient approach to the analysis of rail surface irregularities
accounting for dynamic train–track interaction and inelastic deformations 387.3 Paper C: Integrated analysis of dynamic vehicle–track interaction and
plasticity induced damage in the presence of squat defects . . . . . . . . . 387.4 Paper D: Evaluation of stress intensity factors under multiaxial and com-
pressive conditions using low order displacement or stress field fitting . . . 397.5 Paper E: Numerical investigation of crack initiation in rails and wheels in
the presence of white etching layers . . . . . . . . . . . . . . . . . . . . . . 407.6 Paper F: Assessment of rolling contact fatigue cracks in the vicinity of rail
surface irregularities . . . . . . . . . . . . . . . . . . . . . . . . . . . . . . 42
8 Conclusions, main results and future work 43
References 46
viii

Part IExtended Summary
1 Introduction
1.1 BackgroundSince the 19th century, railway traffic has been an important mode of transportation forpassengers and freight. Its ability to transport large volumes efficiently is of increasingimportance, not least from an environmental perspective. One reason for the efficiencyis that rolling resistance decreases with an increase of the stiffness of the contactingbodies [49]. Wheels and rails are made of steel, which causes the rolling resistance tobe relatively low. The tyres of road vehicles are on the other hand produced of rubber,which is considerably more flexible than steel and thus provides a higher rolling resistancein contact with asphalt. Johnson [49] has estimated the rolling resistance of a road tyreto be approximately 100 times higher than the rolling resistance of a railway wheel.
According to the Hertzian theory of contact [41], the maximum contact pressure be-tween wheel and rail increases with the material’s stiffness [49]. This means that thebenefit of using a stiff wheel and rail material, such as steel, comes with the drawback ofhigh contact pressures. Consider, for example, a wheelset carrying an axle load of 22.5tonnes. Half the load, i.e. 11.25 tonnes, will be transferred to the rail through a contactpatch of a size similar to the area of a thumb nail, cf. methods in [48] for estimations.Additional loads in the form of friction forces are also present in wheel–rail contacts,especially when the wheel is braked, accelerated or negotiating curves. The resultingstress magnitudes are of a scale rarely seen within engineering.
The high stresses in the wheel–rail contact may cause different types of deterioration, suchas wear and plastic deformation. Another frequently occurring deterioration phenomenonis the initiation and growth of cracks under rolling contact loading. This phenomenon,which occurs on both wheels and rails, is referred to as Rolling Contact Fatigue (RCF)and is usually caused by ratchetting and/or low cycle fatigue [33]. This thesis treatstwo types of defects that are associated to RCF: squats, that appear on rails, and RCFclusters, appearing on wheel treads.
According to the UIC Code of rail defects [77], squats can be defined as “[...] a wideningand a localised depression of the rail/wheel contact band, accompanied by a dark spotcontaining cracks with a circular arc or V shape”, cf. Figure 1.1. If no actions are takenand the squat cracks are free to grow, they might cause a rail break [40]. This is of coursesomething that infrastructure managers want to avoid and is also the reason for the effortsthat have been made to understand the root causes of squat formation.
1

Figure 1.1: A typical squat-like defect found in Stockholm, Sweden. Two distinct lobes areclearly visible. Also note the V-shaped surface breaking crack and the slight widening ofthe running band.
RCF clusters on wheels can be defined as a “[...] localised damage effect which can occurin the centre of the wheel tread” [29], cf. Figure 1.2. These are prone to crack propagation,with the potential of detaching wheel tread material. This leads to higher loads, whichin turn promote further damage on the wheel (and also on the running gear and trackcomponents) and a higher rate of deterioration. This is something that vehicle ownerswant to avoid, which motivates a research interest in understanding root causes andinitiation mechanisms.
2

Figure 1.2: Typical Rolling Contact Fatigue (RCF) cluster on a wheel tread. Adoptedfrom Paper E.
Conventional RCF is, as mentioned above, considered to be responsible for initiatingsquats in rails and RCF clusters on wheels. In addition, another potential initiator hasbeen linked to rail and wheel defects, namely brittle so-called White Etching Layers(WELs). At least some of these are thought to be formed due to thermally inducedmaterial phase transformation. Rail defects believed to be triggered by the occurance ofWELs are known as “studs” [40]. These defects visually resemble squats, cf. Figure 1.1. Inorder to find effective mitigating actions to squats, studs and RCF clusters it is importantto understand similarities and differences between thermally induced defects and theconventional RCF counterparts, as will be further discussed.
1.2 Aim and scope of researchIn order to develop rational countermeasures to prevent the development of squats andRCF clusters, their root causes must be known and understood. Even though some mainfeatures have been identified, it is still difficult to explain why initiation occurs in somesituations but not in other. The overall aim of this thesis is to forward the understandingof squats and RCF clusters through numerical simulations. As discussed in Chapter 3,such an approach should preferably be able to account for several physical phenomena,for example:
3

• high-frequency wheel–rail interaction, especially when a rail surface irregularity isimpacted by a wheel
• nonlinear material response due to plastic deformation in the vicinity of a squat/RCFcluster
• high contact stresses
• material phase transformations due to thermal loading
To this end, an in-house program is used to simulate dynamic vehicle–track interaction,while finite element simulations are used to evaluate the resulting material response. Allthe aforementioned phenomena are considered in Papers A–F.
There are, of course, some restrictions on the subjects covered in this thesis. Firstly,the focus is on numerical simulations. Experiments and field investigations employedto contrast simulation results are taken from the literature. Furthermore, wear is notexplicitly modelled, even though its influence might, in some cases, be significant. Finally,since the initiation phase is of most practical interest, the main focus of the studies is onthe relatively early stages of squat/RCF cluster development.
1.3 OutlineThe remainder of this extended summary is outlined as follows. Chapter 2 contains ageneral survey of squats and RCF clusters. A more detailed literature review regardingspecific initiation causes is presented in Chapter 3. Chapters 4–6 are devoted to strategiesfor studying squats/studs and RCF clusters using computer simulations. To facilitatethe discussion, the topic is divided into three chapters: modelling of wheel–rail contact,simulation of vehicle–track interaction and analysis of rail and wheel damage. Chapter 7contains summaries of the appended papers. Conclusions and suggestions for future workare found in Chapter 8.
2 Fundamentals of squat/RCF cluster forma-tion
The history of squats dates back to the 1950s, when black spots with embedded cracksstarted to appear on the rail surface of Japanese railway lines [42]. The problem was givenfurther attention after the Shinkansen high speed line was opened in 1964, as the blackspots began causing “Shinkansen shelling”, which in some cases lead to rail breaks [61].Some hypotheses regarding the root cause involved surface initiated RCF, effects relatedto wheel torque (all wheels were driven), wheel flats and entrapment of e.g. stones betweenthe wheel and the rail. It was furthermore observed that the Shinkansen shelling did notappear in dry tunnels [61]. Eventually, it was possible to attenuate the problem on theShinkansen line by rail grinding and rail profile modification [61].
4

At almost the same time, similar defects started to appear in Great Britain, wherethey were named “squats”. This subject caught the interest of researchers from the mid1970s. It could be concluded that surface initiated RCF is the physical mechanism atwork when squats are formed [38]. These type of cracks tend to grow a few millimetresat a shallow angle to the rail surface until a critical depth is reached. Then the cracktypically branches, either upwards causing spalling or downwards possibly resulting in arail break [19]. Grassie et al. [38, 40] have mentioned several key findings from the earlysquat research. Some of these observations include:
• Squats appear where the driving traction is high.
• Sqauts are not found in tunnels.
• Squats tend to appear on straight lines and in mild curves.
• Squats tend not to appear on heavy haul lines.
The two first items are generally expected in the case of surface initiated RCF. Hightraction will result in large amounts of plastic deformation that will promote RCF crackinitiation. Lubrication, here in the form of rain water, will then facilitate RCF crackgrowth once cracks are formed [16]. The two latter items are reflecting that excessivesurface tractions will result in significant wear that will grind away initiated RCF cracks.
Some confusion occurred when it was eventually realised that a type of defect, visu-ally resembling a squat, did not share the typical signs of surface initiated RCF. Thesedefects lacked the amount of plastic deformation typically related to surface initiated RCFand seemed to originate from a thin and brittle material layer known as a White EtchingLayer (WEL) [40]. The name originates from the light appearance of these layers afterbeing etched with a mixture of nitric acid and ethanol, see e.g. [92]. Even though differenthypotheses have been presented, at least some of the WELs seem to consist of martensite,originating from thermal loading [36]. Other than the presence of WELs, it has beenobserved that this “new” type of defect develops significantly faster than the classic squat.According to Grassie et al. [40] some 10 MGT of traffic is needed for initiation. This isapproximately one tenth compared to conventional squat initiation. On the other hand, itwas also noted that these new cracks did not seem to be as prone to cause rail breaks assquats. Grassie et al. [40] have proposed that these new defects should be called “studs”to distinguish them from the conventional squats.
To summarise, two different, but visually similar, rail surface defects exist: squatsand studs. Squats stem from surface initiated RCF cracks which might cause transverserail failure or shelling. Stud cracks, on the other hand, initiate in the vicinity of surfacelayers of martensite and can cause shelling, but do not seem to cause rail breaks.
RCF clusters on wheels have historically been given less attention than squats andstuds. One possible reason is that squats have been considered more serious since theymight cause rail breaks and subsequent derailments. Nonetheless, RCF clusters, followed
5

by shelling of the wheel tread, might lead to high dynamic impact loads which promotefurther damage to the wheel, but also to the running gear, track components etc. Onekey characteristic of RCF clusters is that they initiate locally on the wheel tread [29] withextension around the circumference as the cluster expands. This is in contrast to othertypes of wheel RCF that often initiate around the entire wheel tread.
There are similarities between squats/studs appearing on rail surfaces and RCF clustersappearing on wheel treads. For example, they both involve locally initiated surface defectsand subsequent crack growth. Where they differ is mainly in how crack propagation and(final) fracture proceeds. Knowledge gained from squat/stud research can therefore beapplied also on RCF clusters to a large extent. This chapter, and most of the work in theappended papers, mainly treats squats and studs, but as discussed, initiation mechanismsof squats/studs should largely be valid also for RCF clusters. It should however be keptin mind that there are differences between the stress states in rails and wheels, e.g.:
• When the rail is loaded it will deflect and thus introduce bending stresses which arenot present in wheels.
• Residual stresses after manufacturing differ between rails and wheels [17, 63].
• The wheels are regularly subjected to thermal loads stemming from tread braking.As a consequence, tensile residual stresses can occur in the surface [33]. Rails are onthe other hand susceptible to the surrounding temperature as a cold climate mightintroduce tensile stresses due to constrained thermal deformation.
• For a given position along a rail, the running band is essentially the same overtime. This is not the case for a wheel tread that will have different contact positionsdepending on e.g. curve and switch negotiations.
These effects will all affect crack initiation and propagation. The remaining part of thisthesis will focus on squats/studs, but highlight similarities and differences to RCF clusterswhen needed.
In order to deepen the knowledge about the formation of squats/studs and RCF clusters,and to form a basis for effective mitigation strategies, the overall initiation mechanismspresented in this chapter must be related to more specific damage related studies. This isthe subject of the next chapter.
6

3 Overview of potential damage mechanismsA general overview on squats and studs can be found in the works by Grassie et al. [38–40].Further, general experiences from squats in Australia and the Netherlands have beendescribed in Daniel et al. [27] and Zoeteman et al. [104] respectively.
This chapter provides a literature survey regarding the mechanisms behind squat/studformation. To facilitate the overview, the discussion is treated under three differentsubsections: RCF damage, dynamic loads and thermal damage. The headlines are chosento reflect the topics of the appended papers rather than making a stringent categorisationof possible crack initiation and growth mechanisms. There are no rigid borders betweenthe subjects. Thermal damage can for example introduce a surface irregularity that causeshigher dynamic loads, which in turn could initiate additional RCF damage.
3.1 Rolling contact fatigue damageRolling contact fatigue differs in several ways from fatigue stemming from other types ofloading. As an example, Ekberg and Kabo [33] mention that the loading conditions aremultiaxial with out of phase stress components. RCF cracks are furthermore subjectedto compressive loading during most parts of the load cycle, whereby mode II and IIIloading are typically the dominating modes of deformation1. It has however been difficultto obtain stable mode II crack growth in laborotory experiments as the cracks tend toarrest or branch into mode I cracks [15]. Researchers have therefore put a lot of effort intounderstanding how RCF cracks can propagate due to the significant shear loads despitecrack closure. Bower [16] used simulations to investigate three different possibilities, allrelated to the presence of a fluid:
• Lubrication of the crack faces, which lowers the crack face friction and thus facilitatesmode II propagation.
• The fluid fills the crack and exerts a pressure on the crack faces, enabling bothmode I and II loading.
• The fluid is entering the crack and gets entrapped and forced towards the crack tipdue to crack mouth closure. This results in both mode I and II loading.
Bold et al. [15] used biaxial testing to produce a cycle of mode I loading followed bymode II loading, resembling the conditions of the aforementioned entrapment model,and obtained crack growth on the plane of the maximum shear stress range. Wong etal. [95] examined under which conditions a RCF crack deviates from coplanar growth andbranches. They found that both the “mode I effective stress intensity range” (see [95] fordefinition) as well as the interaction of the mode I and II load cycles play important roles.Kaneta et al. [59] later used twin-disc experiments and presented a photomicrographshowing a crack network where water has reached the tips of approximately 1 mm long
1See Section 6.2.6 for a definition of stress intensity factors and modes of deformation.
7

cracks. They furthermore managed to initiate defects similar to squats in the sameexperiment. To the best knowledge of the author, this is the only time experimentallyinduced squat initiation has been reported in the literature.
The aforementioned studies have provided significant insight in the growth of RCFcracks in general, including squats. There are also studies focusing more on squats inparticular. One of these were performed by Clayton and Allery [24]. They distinguishedbetween two different initiation categories for a squat-like defect: initiation from smallsurface indentations and initiation from fine cracks appearing at the gauge corner sideof the rail surface. In a later research review, Clayton [23] described squats as surfaceinitiated RCF defects and mentioned indentations caused by WELs as possible initiationtriggers. Kondo et al. [61] described the Japanese experience of Shinkansen shellingand suggested four different initiation mechanisms (which all relate to RCF in one wayor another): 1) Surface initated RCF 2) Effect of torque since all wheels are driven 3)Dynamic loads from wheel flats 4) Other, such as rail inclusions or dents caused byentrapped ballast stones etc. Simon et al. [84] performed tribological and metallurgicalexaminations of a number of squats and presented a possible initiation mechanism. Theunderlying idea is that the rail surface can be divided into longitudinal contact strips.These are subjected to different loading conditions, leading to different amounts of plasticdeformation, which in turn introduce different types of microstructures (as well as WELs).As the material becomes more and more dissimilar between the contact strips, the borderstend to be prone to crack initiation, which in turn might initiate a squat. Jörg et al. [50]introduced the “Squat staircase concept”, which aims at describing squat formation ina qualitative way. The idea is that certain parameters linked to squat formation (forexample contact conditions, wear, traction and system stiffness), which would not causea problem taken individually, can be combined in such a way that a squat initiationthreshold is reached. Rail surface irregularities, for example, appear frequently on railsurfaces, but are not a guarantee for squat initiation. However, if combined with tractionand some other unfavourable parameters, squat initiation could appear according to thetheory. This approach could also explain the seeming randomness in squat formation.The question that remains is then to identify which conditions that are necessary forsquats to initiate and relate them to operational scenarios.
So far, the squat formation process has been discussed up until the point of crackinitiation, but the subject of existing squat cracks has also been studied in several publica-tions. Bogdański et al. [14] used Finite Element (FE) analysis to investigate, among otherthings, how bulk stresses and liquid entrapment affect Stress Intensity Factors (SIFs).More studies followed in Bogdański et al. [13] and Bogdański and Brown [12], where, e.g.,crack face friction and branching were examined. Farjoo et al. [35] used finite elementanalysis to investigate the influence of, e.g., bending stresses on SIFs. The importance ofwater entrapment was also considered. Farjoo et al. [34] have furthermore showed thatSIFs increase with softer track foundation, which could explain the occurrence of squatsclose to areas with poor ballast (where the rail consequently deflects more).
8

3.2 Dynamic loadsDynamic loads, caused by e.g. rail surface irregularities, can cause wheel–rail contact forcemagnitudes considerable higher than the corresponding static load. Since these load peakswill relate to more severe RCF damage, it is of great interest to study dynamic phenomenain relation to squats. This is typically done either by measurements or simulations. Theformer method allows for online squat identification, as done by Molodova et al. [68,69], who used axle box acceleration data to identify typical squat frequencies. Axle boxacceleration data in relation to squats have also been presented by Kaewunruen et al. [54].
Computer simulations are of course well suited to analyse dynamic wheel–rail contactforces, either in the context of squats, or rail surface irregularities that might develop intosquats. Li et al. [66] developed a three dimensional transient FE2 model and simulatedthe contact force response as a wheel traversed rail surface irregularities. The distancebetween peak values of the contact forces were related to visible rail damage of fieldsamples. A squat growth hypothesis was presented and eventually supported by fieldobservations, cf. Li et al. [64]. The FE model was later validated by Molodova et al. [67] bycomparing simulated results to corresponding results provided from axle box accelerationmeasurements. Li et al. [65] have also used the model to investigate how the influence ofbolt pretension of fishplates (used in insulation joints) influences squat initiation. Later,Zhao et al. have used similar models to investigate the influence of small rail surfaceirregularities [99], small areas of low friction [100] and fastening modelling in the contextof surface irregularities [98]. Furthermore, Zhao et al. [96] have used field examinations incombination with the aforementioned FE model as well as a two-dimensional model tostudy local rolling contact fatigue defects in railway wheels. These defects resemble RCFclusters and it is suggested in the study that indentations on the wheel tread are essentialfor RCF cluster formation.
Naeimi et al. [72] used transient FE simulations together with a multiaxial fatiguecriterion to identify crack initiation angles. These were later compared to a field sampleand some agreement was found. Deng et al. [28] used a similar modelling technique tostudy different squat geometries with respect to fatigue life as well as number of cyclesto ratchetting failure. In contrast to the aforementioned studies, which mainly relateto crack initiation, Zhao et al. [101] also used explicit FEM to compute stress intensityfactors of a cracked rail head during a wheel passage.
3.3 Thermal damageAs touched upon previously, so-called White Etching Layers (WELs) consist of a hardand brittle material phase. Since the brittle material may shatter, it is believed thatWELs are prone to crack initiation. It should however be noted that WELs may alsoremain intact. WELs are commonly believed to contain martensite. This material phasehas a larger volume than pearlite [1]. Martensite formation may therefore cause tensile
2See Section 5.2 for a background to transient finite element analysis.
9

residual stresses in the vicinity of the martensite, which promotes RCF initiation.
As pointed out by e.g. Vargolici et al. [92], there are two common ways of explain-ing WEL formation—mechanical or thermal origin. The kind of damage associated tostuds seem to lack significant plastic deformation, therefore the latter initiation mechanismwill be the main focus here. The idea is then that heat is causing a temperature increase ofthe steel, which, if severe enough, will cause austenization. If this state is followed by rapidcooling, another phase transformation will occur and a thin layer of martensite will form.For a general discussion on WEL in relation to RCF, see e.g. Carroll and Beynon [20, 21].
In addition to studies regarding the WEL phenomena itself, several publications treatWEL in relation to squats and studs3. Pal et al. [73] have performed metallurgicalinvestigations of squats found in field and also suggested that a WEL can act as aninitiator of conventional squats [74]. Steenbergen and Dollevoet [86, 87] have describeda possible initiation and growth mechanism where the initiation takes place in a WEL.Even though grinding is often used to remove squat and stud defects, Steenbergen [88]points out that it can also be harmful, especially in the case of heat treated grades, in thesense that a WEL might be introduced by grinding. Scott et al. [81] simulated tractioncontrol systems and showed that the temperature increase caused by adhesion recoveryafter wheel slip can cause martensite formation in some situations. Naeimi et al. [71] useda coupled thermomechanical three-dimensional FE analysis to study frictional heatingappearing in the wheel–rail contact as well as the resulting temperature increase andstress–strain response. It was found that the austenization temperature was reached athigh creepage levels (26% in the simulation). Bernsteiner et al. [11] have used results fromcomputer simulations and test rig experiments to show that austenization and subsequentWEL formation on rail surfaces are possible during some circumstances. Fletcher [36]used the boundary element method to study a stud crack in the presence of a mechanicalcontact load in combination with a thermal load and computed, among other things,stress intensity factors. The study was followed up by Fletcher and Sanusi [37], where theinfluence of volume expansion due to phase transformation from pearlite to martensitewas investigated. It was shown that the formation of a WEL might accelerate crackgrowth due to unfavourable stress distributions.
A related area, which is mainly important in relation to RCF clusters, but has bearingon studs, is that of martensite formed during wheel flat formation4. This topic wasinvestigated by Jergéus [44, 46] via two-dimensional FE simulations that included phasetransformation. Residual stresses as well as resulting martensite depths were evaluated.The results were later compared to full scale field experiments followed by sectioning andmetallurgical examination, see Jergéus et al. [45] and Ahlström and Karlsson [2].
3Note that not all authors apply this terminology. The name “squat” figures also in the context ofWELs.
4In the case of studs, the corresponding phenomenon is a “wheel burn” mark on the rail head.
10

4 Modelling of wheel–rail contactThe ability to accurately resolve wheel–rail contact stresses is of great importance in arolling contact fatigue assessment, especially in cases related to squats and RCF clusters.To this end, the analysis of a wheel rolling along a rail requires the application of a rollingcontact theory able to predict the size of the contact patch as well as the magnitudeand distribution of the normal contact pressure. However, most often it is not sufficientto consider the normal contact pressure alone. Tangential shear tractions, stemmingfrom frictional slip inside the contact patch, often have a substantial contribution to thestress state. The resultants to the tangential tractions are known as creep forces andoccur during, e.g., curving, acceleration and braking of the rail vehicle. The creep forcesare important for the dynamic behaviour of the vehicle and depend on certain rollingcharacteristics described below. The contact stress distribution will also determine thestress field inside the wheel and the rail. This stress field will govern propagation ofsurface initiated cracks.
The following chapter begins with the introduction of a few basic concepts. It is followed bysome analytical solutions to the rolling contact problem. Although there are limitations tothese theories, they provide an inexpensive way to compute contact stresses, and increasethe overall insight into the subject. The chapter continues with more general theories thatrequire numerical solutions. Rolling contact analysis is a wide research topic in itself andis only covered briefly here. See e.g. Johnson [48] and Kalker [57] for thorough discussionson the subject.
4.1 Basic concepts of rolling contactIn this section, basic concepts of rolling contact are illustrated by considering a wheel(here denoted body 1) with radius R rolling along a tangent track (here denoted body 2).The bodies are initially considered to be rigid. The translational velocity is denoted v andthe angular velocity Ω, see Figure 4.1. If v = RΩ, there is no relative velocity between thewheel and the rail and the corresponding points on the wheel and rail are said to “stick”to each other. This situation is known as free rolling. The other possibility, where v 6= RΩis known as “slip”, which means that there is relative motion between a contacting pointon the wheel and the corresponding point on the rail. In the extreme case, Ω = 0 whilev 6= 0 and the wheel slides along the rail. For a more detailed introduction to rollingcontact, see e.g. [82].
If the deformation of the contacting bodies is taken into account, the contact point willbe replaced by a contact area. This allows for an intermediate state between stick andfull slip, where there is stick in part of the contact patch and slip in the remaining part.The ability to characterise the situation thus requires that the motion of particles insidethe contact patch is resolved, see Figure 4.2. The velocity of a point is then divided intotwo parts; one stemming from rigid body motion (v1, v2) and one due to deformation (u1,u2). The so-called slip velocity S is then introduced as the velocity difference between
11

Ωv
R
2
1
Figure 4.1: A wheel, denoted body 1, with radius R is rolling along a rail, denoted body 2,at a translational velocity v and an angular velocity Ω.
two, originally opposite, points [48, 57, 82]1:
S = v1 + u1 − (v2 + u2) (4.1)
where ˙〈•〉 denotes time derivative. By rearranging the terms and introducing the longitu-dinal creepage2 as
ξ = v1 − v2v
(4.2)
The slip velocity can be expressed as
S = ξv + u1 − u2 (4.3)
By using the Coulomb model as a constitutive model of the friction, it is possible toformally define areas of stick and slip respectively [57, 82]:
Stick region: S = 0, |q (x)| ≤ p (x)µ (4.4)
Slip region: S 6= 0, q (x) = −µp (x) S
|S| (4.5)
where p (x) is the wheel–rail contact pressure, q (x) denotes the interfacial shear tractionand µ is the friction coefficient.
1It is sometimes convenient to use an Eulerian description of motion, where the reference frame istracing the contact patch and the material is considered to flow into the contact, see, e.g., [48, 57, 82]. Inthat case u is replaced by the material time derivative.
2The spin creepeage, occuring from a difference in angular velocity in the plane of contact, is notconsidered here. For details, see e.g. [48, 57].
12

v1 + u1
v2 + u2
2
1
Figure 4.2: Relative velocity between two, originally aligned, particles in rolling-slidingcontact.
4.2 Analytical solutions
4.2.1 Normal contact – Hertz solutionIn 1882 Hertz [41] presented a theory on elastic bodies in contact. The theory, which iswidely used within contact mechanics, is based on the following assumptions [48, 82]:• Isotropic, linear elastic material.
• Small strains.
• The topology of the contacting surfaces close to the contact patch can be approxi-mately described by quadratic functions.
• The bodies in contact can be approximated as elastic half-spaces, which impliesthat the contact area is small compared to the contacting bodies. This excludesthe analysis of bodies where the contacting surfaces fit each other well and thusproduce a large contact area, so-called conformal contact.
• Frictionless contact surfaces. This requirement is not relevant in the case of quasi-identical materials in contact3.
If these requirements are fulfilled, the contact patch will become elliptical with semiaxesa and b [48], see Figure 4.3. The magnitudes of a and b depend, in a nonlinear fashion,on the loading, the elastic properties and the radii of curvature of the contacting bodies.
If N denotes the resulting normal contact force, the maximum contact pressure p0is given by
p0 = 3N2πab (4.6)
The pressure distribution over the contact patch is then obtained as
p (x, y) = p0
√1−
(x− xa
)2−(y − yb
)2(4.7)
3This means that the shear modulus G and Poisson’s ratio ν of bodies 1 and 2 fulfill G11−2ν1
= G21−2ν2
[82].
13

ab
xy
p (x, y)(x, y)
p (x, y)
Figure 4.3: Schematic illustration of a Hertzian pressure distribution.
where x and y are coordinates along the surface and (x,y) is the center of the contactpatch [48], see Figure 4.3.
The aforementioned limitations are often violated to some extent in the contact be-tween wheel and rail. Plasticity, just to take one example, will bound the magnitude ofthe contact pressure and influence the size of the contact patch. Nevertheless, the closedform solution offers many benefits, not least in a vehicle–track interaction analysis wherecomputational speed is an important issue.
4.2.2 Tangential contact – Carter solutionOne of the pioneers within the area of rolling contact was Carter, who studied tractiverolling of cylinders, i.e. line contact [22]. The corresponding pressure distributionis obtained by letting b → ∞ in Equation (4.7). For convenience, x is furthermoreassumed to originate from the center of the contact patch, resulting in the relationp (x) = p0
√1−
(xa
)2. Carter showed that, in the case of Coulomb friction, the sheartraction distribution can be obtained as a superposition of two parts, see e.g. [48]:
q (x) = q′ (x) + q′′ (x) (4.8)
whereq′ (x) = µp (x) = µp0
√1−
(xa
)2, − a ≤ x ≤ a (4.9)
q′′ (x) = − caµp0
√
1− (x− d)2
c2, − (c− d) ≤ x ≤ a (4.10)
Here, c is the half-length of the stick zone and d is the distance from the center of thestick zone to the center of the contact patch, see Figure 4.4. The maximum creep force isobtained during full slip conditions, i.e. when q′′ (x) vanishes and q (x) = µp (x).
14

x
x
xa a
d
c c
Slip Stick
q′ (x)
q′′ (x)
q (x)
Figure 4.4: Sketch of the shear stress distribution in tractive rolling, according to theCarter solution. Here, a denotes half-length of the contact patch, c is the half-length ofthe stick zone and d is the distance from the center of the contact to the midpoint of thestick zone.
By integrating the shear traction it is possible to obtain the resulting creep force Q as:
Q =∫ a
−a
q (x) dx (4.11)
It can be shown, see e.g. [48], that the creepage is related to the creep force Q as:
ξ = −µaR
(1−
√1− Q
µN
)(4.12)
where N is the resulting normal force, 1R = 1
R1+ 1
R2with Ri being the radius of body i.
When the creepage becomes sufficiently high, the contact patch will reach a state of fullslip and the creep force saturates at Q = µN . The principal appearance is shown in aso-called creep curve as presented in Figure 4.5. The curve becomes horizontal during fullslip conditions, which is a consequence of the Coulomb friction model assumption. A realworld creep curve might look somewhat different, e.g. due to the influence of so-calledthird body layers. To some extent it is in practice possible to control the slope of thecreep curve inside the slip zone by the introduction of so-called friction modifiers [63, 89].
15

x
x
Creepage
Creep
forcemagnitude
µN
Stick–slip Full slip
Free rolling
Figure 4.5: Schematic relation between creepage and creep force magnitude according tothe Carter theory.
4.3 Kalker’s complete and simplified theories
As mentioned above, the Carter solution is restricted to two-dimensional situations. Sev-eral approximate theories of three-dimensional rolling contact (also including lateral andspin creepage) have been presented throughout the years, see e.g. Kalker [58]. A milestoneoccurred in 1979 when Kalker presented what has become known as his complete theory4
of rolling contact [56, 57]. It is here presumed that the contacting bodies can be consideredas linear elastic half-spaces [82]. The theory was implemented by use of the BoundaryElement Method5 (BEM) in the computer software CONTACT [93], which is able tocompute the pressure and traction distributions between general (to the point of theunderlying assumptions) bodies in rolling contact. It should be noted that some of theoriginal limitations, such as restriction to non-conformal contact, can be circumvented [94].
Kalker has also presented a simplified theory, on which the algorithm FASTSIM [55] isbased. The main difference, as compared to the complete theory, is that the displacementof one surface point is considered to depend only on the surface tractions in that particularpoint [58]. That is not presumed in the complete theory, where the surface displacementin one point depends on the surface tractions in all points. FASTSIM is considered to befast [58] and is often used multibody simulation software6 [82].
4Other names such as Kalker’s variational theory and Kalker’s exact theory occur in the literature [82].5See Section 6.1 for a description of the Boundary Element Method.6See Section 5.3 for a discussion on such software.
16

4.4 Finite element methodThe most general way to solve the rolling contact problem is probably provided by theFinite Element Method (FEM), which is a method to solve partial differential equations inan approximate manner, see e.g. [25, 103]. FEM makes it possible to relax presumptionssuch as elastic half-spaces, linear elasticity, isotropy etc. The limiting factor is thus ratherthe computational cost than assumptions related to the underlying theory.
The generality of the FE approach makes it suitable as a reference to assess the va-lidity of the classical contact theories mentioned previously. One such comparison wasdone by Telliskivi and Olofsson [91] who computed the maximum contact pressure as wellas contact patch size using FEM (including an elasto-plastic constitutive model), CON-TACT and Hertz theory. It was found that the maximum pressure became quite similarbetween the three methods when contact occurred on top of the rail. The agreement washowever poor during flange contact, partly because the half-space assumption is violatedas the contact becomes conformal. Zhao and Li [102] utilised an explicit FE analysis tosolve the transient problem of a cylindrical wheel in frictional rolling on top of a rail. Theposition of the contact patch in combination with a linear elastic material model allowedfor a comparison with CONTACT and Hertz theory. Good agreement in terms of sizeof the contact patch as well as contact stresses were found. In a succeeding study, themodel was enhanced with an isotropic hardening plasticity model [97]. It was shown thatin the case of plastic flow, the contact patch size increases and becomes egg shaped ratherthan elliptic, while the maximum contact pressure decreases. It was also shown that it isnot possible to decouple the normal and tangential problems under such conditions, as iscommonly done otherwise.
Within solid mechanics, a so-called Lagrangian description of the motion is usuallyemployed. This means that specific particles are tracked during motion. In an FE setting,the FE mesh is thus connected to the body of interest and will distort during deformation,which might cause problems when large deformations occur. Further, if a wheel is rollinga long distance along the rail, the full circumference of the wheel must be discretized by adense mesh in order resolve the contact stresses. This is computationally expensive. Asan alternative, the so-called Arbitrary Lagrangian-Eulerian description can be employed.It is then possible to use the undeformed configuration following from a rigid body motionas a reference configuration. In many applications that configuration will furthermore bemore or less constant in time, which means that the mesh refinement can be concentratedto the area of contact, which decreases the computational cost significantly. See e.g. [31]for a thorough description of the subject.
17

5 Simulation of dynamic vehicle–track inter-action
Tractive and braking forces are transferred to the rail vehicle through the relatively smallcontact patch between the wheel and the rail. Contact forces will affect the vehicledynamics, but vehicle dynamics will also affect the contact forces. In many situationsthis condition makes it necessary to account for the dynamic vehicle–track interactionin order to get detailed information on the contact stresses, which in turn is needed forfatigue and strength assessments. Different approaches to vehicle–track dynamics aretherefore discussed in this chapter. Special emphasis is put on the method of movingGreen’s functions since it is utilised in several of the appended papers. The correspondingsection has previously been presented in the licentiate thesis by Andersson [9], but isreiterated here for clarity.
5.1 Method of moving Green’s functionsThe convolution integral method, also known as the Duhamel integral method, is usedto compute the dynamic response of linear systems subjected to general load histories.The concept is demonstrated in the subsequent example, which follows [26], where also arather extensive background is provided.
For illustration, a system with one translational degree of freedom (DOF), u(t), de-scribing the position of a mass m attached to a linear spring with stiffness k is considered.The system is subjected to an impulse acting during the time td:
I =∫ td
0F (t) dt (5.1)
where t is the time and F (t) is the force. If the mass is initially at rest, the equation ofmotion and its initial conditions can be stated as
mu+ ku =F (t), 0 ≤ t ≤ td0, t > td
(5.2)
u (0) = u (0) = 0 (5.3)
where u and u are the first and second time derivatives of the displacement, respectively.Integrating Equation (5.2) over the interval 0 ≤ t ≤ td gives the following relation
mu (td) + kuavgtd = I (5.4)
where uavg is the the average displacement. Consider now the solution for td → 0 whereby
mu(0+) = I (5.5)
18

which yields the following initial conditions for interval t > td of Equation (5.2)u (0+) = I
m
u (0+) = 0(5.6)
Solving the resulting differential equation for t > 0 gives
u (t) = I
mωnsin (ωnt) (5.7)
where ωn =√
km . The unit impulse response, also known as a so-called Green’s function,
denoted G (t), is obtained by putting I = 1:
G (t) = 1mωn
sin (ωnt) (5.8)
Equation (5.8) describes how a suspended mass will oscillate due to a unit impulse actingover a short time. This result can be exploited when the mass is subjected to an entireload history. The impulse due to a load F (τ) acting during the small time interval dτcan be expressed as
dI = F (τ) dτ (5.9)Combining Equations (5.7)–(5.9) gives the displacement increment at time point t due tothe load applied at time τ :
du (t) = dI
mωnsin (ωn (t− τ)) = F (τ)G (t− τ) dτ (5.10)
The total displacement response at an arbitrary time point t is obtained by summing thecontributions of all impulse responses from the previous time steps:
u (t) =∫ t
0F (τ)G (t− τ) dτ (5.11)
In this example, the Green’s function G (t− τ) was derived for the case of an undamped1-DOF system. However, Equation (5.11) represents a general (as long as the superpo-sition principle holds) expression for how the dynamic response can be obtained. Formore complicated systems, like a track model consisting of beam elements resting ondiscrete springs and dampers, the Green’s functions are not derived analytically. InsteadFrequency Response Functions (FRFs), i.e. functions describing the response in one pointof the dynamic system due to a harmonic excitation at another point, are computed in astandard manner using the system matrices of an FE model. The Green’s functions canthen be obtained by computing the inverse Fourier transform of the FRFs [76].
In this thesis, Green’s functions are used to evaluate the dynamic response beneatha wheel moving along a track. To this end, the concept of moving Green’s functions isintroduced [76]. For simplicity a homogeneous rail is henceforth considered although theconcept can easily be extended to involve discrete sleeper support. A general Green’s
19

N (τ) w (x, t)
xp (τ)
Figure 5.1: The load N (τ) acting at coordinate xp at time τ causes the displacementw (x, t) for t > τ .
function, which is allowed to vary both in time and along the longitudinal coordinate x, isestablished: G = G (x, t). The wheel’s position is described by xp (t) and the wheel–railnormal contact force is denoted N (t). The rail displacement w (x, t) due to an appliedcontact force N (t), see Figure 5.1, is calculated as
w (x, t) =∫ t
0N (τ)G (x− xp (τ) , t− τ) dτ (5.12)
As touched upon previously, the displacement of the rail beneath the wheel is typically ofprimary interest. Therefore it is sufficient to consider the dynamic response at the wheel’scurrent position. This is also the point of excitation. If the wheel is restricted to moveonly at constant velocity v, the load position at time t = τ becomes xp (τ) = x0 + vτ ,where x0 is the initial position. Hence, by use of Equation (5.12) the displacement beneaththe wheel (indicated by ~) can be expressed as
w (x0 + vt, t) = w (t) =∫ t
0N (τ)G (v (t− τ) , t− τ) dτ (5.13)
If the Green’s function G, the load history applied to the wheel N (τ), as well as the timedifference t − τ is known, it is possible to evaluate the integral. Note that for a givendynamic system and constant velocity v, the Green’s function is a function of time alone.The moving Green’s function Gv (t− τ) is now introduced and Equation (5.13) becomes
w (t) =∫ t
0N (τ) Gv (t− τ) dτ (5.14)
The moving Green’s function Gv (t) is obtained by considering position v (t− τ) of G (x, t)at time t− τ . Figure 5.2 schematically illustrates how a moving Green’s function Gv (t)(indicated by the thick solid line) is obtained from a generic Green’s function G = G (x, t).
20

x
G (x, t)
t
t1
vt1
Gv (t1)
Figure 5.2: The surface indicates a generic Green’s function G = G (x, t) from which themoving Green’s function Gv (t) (marked by the thick solid line) of a point travelling witha constant velocity v is constructed.
The method of moving Green’s functions is implemented in an in-house software fordynamic vehicle–track interaction—RAVEN, see Paper B. Note that the method isnot restricted to solve the dynamic response of a track. This is utilised in most of thesimulations in the appended papers, where Green’s functions are also used to computewheel displacements. A summary of benefits and drawbacks of the described modellingtechnique are:
+ Pre-calculated Green’s functions enable fast simulations.
+ High-frequency dynamic behaviour can be accounted for without adding significantcomputational costs.
– Only the response of linear systems can be analysed, which means that non-linear characteristics of e.g. ballast (or suspension if modelling the vehicle) are notcaptured. In contrast, the cause of excitation (in this case the wheel–rail contactforce) can be due to non-linear phenomena (in this case the non-linear wheel—railcontact stiffness).
– The trajectory of the contact point needs to be prescribed, which makes themodelling technique inappropriate for investigations of low-frequency lateral vehicledynamics (e.g. dynamic stability analyses).
21

5.2 Transient finite element analysisOne great benefit of using a finite element approach is the possibility to directly incorpo-rate nonlinearities stemming from e.g. frictional contact and plasticity. As mentionedpreviously, this makes it possible to relax assumptions related e.g. to the contact model.By considering the full transient response it is possible to analyse the full problem ofrolling contact. In many situations it is then possible to write the resulting equations ofmotion on the following form, cf. [25]:
Ma + Ca + Ka = f (5.15)
where M is the mass matrix, C is the damping matrix, K is the stiffness matrix, f is theload vector, a are the nodal displacements and ˙〈•〉 denotes time derivatives. One commonand quite general method to solve Equation (5.15) is to reformulate the time derivatives interms of finite differences and then use direct numerical integration. Two main classes ofintegration schemes exist, namely explicit and implicit methods [25]. The former expressesthe displacements of the next time step (n+ 1) solely in terms of quantities related toprevious time steps:
an+1 = f (an, an, an,an−1, . . . ) (5.16)
Implicit methods, on the other hand, express the displacements of time step n + 1 interms of quantities related to previous time steps as well as the next (n+ 1):
an+1 = f (an+1, an+1,an, an, an, . . . ) (5.17)
There are two important differences between explicit and implicit solution methods:explicit schemes are only conditionally stable, which means that a too large time step willcause numerical instabilities. Implicit schemes, on the other hand, are unconditionallystable, allowing for larger time steps. However, the computational cost of taking one timestep is lower for an explicit method than for an implicit. If the high frequency dynamics isof importance, as is often the case during e.g. a wheel passage over a surface irregularity,it is often efficient to use an explicit solver since many time steps are required even fora short travel distances. Note that although the principles above are illustrated usinga problem from solid mechanics, the integration schemes are applicable also to otherengineering disciplines.
Some benefits and drawbacks of transient FEM are:
+ Dynamics, contact modelling, stress evaluation etc. can be incorporated into asingle analysis.
+ No formal need for approximate theories, such as the elastic half-space assumptionused in Hertzian contact theory.
– The overall solution is computationally expensive.
22

5.3 Multibody simulationDynamic vehicle–track interaction is commonly analysed using so-called multibody simu-lation software. Well-known titles in this genre include SIMPACK, GENSYS, VAMPIRE,ADAMS/Rail and NUCARS [43]. The vehicle is typically considered to consist of rigidbodies (although some software allow for flexible bodies as well) connected via flexibleelements resembling suspensions, dampers etc. The resulting equations of motion of thesystem are then formulated automatically by the software. As mentioned before, anaccurate wheel–rail model is, in general, nonlinear, which adds additional constraintsto the system of equations. Even though many different analysis options are commonlyavailable, the most relevant in the context of this thesis is numerical time integration ofthe full nonlinear system in order to resolve the wheel–rail contact stresses. It is howeverimportant to note that it is necessary for the software to include high-frequency dynamicsif a small rail surface irregularity (e.g. a dimple as in Paper A–C and Paper F) is to beanalysed. For a thorough discussion on multibody simulations, see e.g. Iwnicki (ed.) [43].
6 Analysis of rail and wheel damageThe ultimate goal of dynamic vehicle–track interaction simulations in general and wheel–rail contact stress analyses in particular, is often to relate the corresponding results tosome sort of deterioration assessment. Within railway engineering two such mechanismsare of particular interest—rolling contact fatigue and wear. In this thesis, the emphasis ison the former. The RCF impact is usually quantified through either some crack initiationcriterion or by means of fracture mechanics. Some of the available alternatives are treatedin this chapter.
6.1 Stress–strain analysisBefore any fatigue (or fracture) assessment criterion can be used, it is commonly necessaryto know the state of stress and strain within the body of interest. In the field of railwaymechanics, essentially three methods are used to obtain these—analytical methods, theBoundary Element Method (BEM) and the Finite Element Method (FEM).
Analytical methods, to begin with, are often restricted to linear elastic isotropic materialsand only valid under special conditions. This does, however, not prevent them frombeing useful in many situations. The most common example is probably Hertzian contacttheory, from which it is possible to evaluate contact stresses that can be used to derivethe stress fields in the contacting bodies [48]. No analytical methods are however used forstress or strain evaluation of the analysed bodies in the appended papers.
As an alternative, BEM approaches might be used. These are based on the existence of afundamental solution that fulfils the boundary value problem for a unit point load [25].For linear problems, more complicated load cases can then be obtained as combinations
23

and scalings of unit loads. The fundamental solution must be known beforehand, whichoften puts restriction on the generality of the solution. On the other hand it is possibleto incorporate e.g. stress singularities in the fundamental solution, which is convenientwithin fracture mechanics, see Section 6.2.6. Once the fundamental solution is known,BEM only requires the discretization of the body’s surface and not the entire volume.This often leads to a drastic decrease of the computational cost, as a three-dimensionalproblem can be treated as a two-dimensional etc. [25]. BEM is a rather popular methodwithin railway mechanics where the computer implementations of Kalker’s completetheory [57] is probably the most famous example. An implementation of this theory isused in Paper A–Paper C and Paper F.
Various aspects of FEM have been treated in Sections 4.4 and 5.2. Its usefulness insolving general solid mechanics problems has already been mentioned. However, applyingconventional FEM to cracked bodies is problematic for several reasons; it can be cumber-some to achieve a good mesh quality in the vicinity of the crack, which makes it laboriousto change crack geometry or analyse crack growth. Another disadvantage is that finitestresses will be obtained at crack tips, even though the theory of elasticity predicts a stresssingularity, see Section 6.2.6. These problems have largely been resolved with methodssuch as the eXtended Finite Element Method (XFEM), see Belytschko and Black [10]and Moës et al. [70].
XFEM constitutes a large research topic in itself and will not be covered in detail here.The method will instead be briefly illustrated via an example following Moës et al. [70].To this end a cracked isotropic linear elastic two-dimensional body is considered. Thecrack does not coincide with element boundaries, but is embedded inside the relevantelements, see Figure 6.1. In the example there are two elements completely split by thecrack, one element containing the crack tip and nine elements not containing any crack atall. The FE approximation of the displacement field uh (x, y) belonging to the latter nineelements follows the standard format:
uh (x, y) = N (x, y)a (6.1)
where N (x, y) are shape functions and a are the nodal displacements.
The conventional FE formulation above does not hold for the elements cut by thecrack. Consider for example a case where the lower boundary of Figure 6.1 is clamped anda load in the y-direction is applied to the upper boundary. The vertical displacement ofthe upper crack face must be larger than on the lower. A crack splitting an element will inother words introduce a discontinuity in the displacement field. This can be accounted forby enriching the standard FE approximation of the cracked elements with an additionalterm:
uh (x, y) = N (x, y)a + N (x, y)H (x, y)b (6.2)where b are additional degrees of freedom and the Heaviside function H (x, y) is definedas:
H (x, y) =
1, y > 0−1, y < 0
(6.3)
24

The singularity occurring inside the crack tip element can be captured by adding thefollowing enrichment to the standard FE approximation:
uh (x, y) = N (x, y)a +4∑
i=1N (x, y)Fi (r, θ) ci (6.4)
where (r, θ) are polar coordinates originating from the crack tip, see Figure 6.3, ci areadditional (enriched) nodal degrees of freedom and Fi (r, θ) contain asymptotic crack tipfunctions, cf. [70]:
F1 (r, θ) =√r sin
(θ
2
)(6.5)
F2 (r, θ) =√r cos
(θ
2
)(6.6)
F3 (r, θ) =√r sin
(θ
2
)sin (θ) (6.7)
F4 (r, θ) =√r cos
(θ
2
)sin (θ) (6.8)
For the sake of simplicity, the example above contains several simplifications. It is, forexample, not necessary to use the same shape functions for the standard FE approxima-tion and the enrichment functions, the crack tip enrichment is not restricted to only theelement containing the crack tip and the crack does not have to be aligned with the globalcoordinate system. Nevertheless the example illustrates the overall idea with XFEM,which is to allow modelling of cracks not following the element boundaries. The cracktopology is instead provided only implicitly. This allows for easy modifications of crackgeometries compared to conventional FE procedures.
XFEM is used in Paper D and Paper F.
25

x
x
x
y
uh (x, y) = N (x, y)a + N (x, y)H (x, y)b
uh (x, y) = N (x, y)a +∑4
i=1 N (x, y)Fi (r, θ) ci
Figure 6.1: FE mesh with a crack embedded within three elements and the correspondingXFEM approximation.
6.2 Numerical approaches to RCF and fracture me-chanics
6.2.1 Maximum contact stresses and forcesA straight forward approach for evaluating the risk of possible RCF damage is to extractmaximum wheel–rail contact stresses and the corresponding resulting forces from adynamic vehicle–track analysis. In a two-dimensional case, this results in four RCFimpact candidates: maximum normal pressure p (x), shear traction q (x), normal force Nand creep force Q. The overhead cost related to an assessment of these quantities is lowsince they are typically directly available as an output from multibody simulation tools.Some benefits and drawbacks are listed below:
+ The influence of local surface irregularities can be accounted for if a sufficientlyaccurate contact model is used.
– No detailed material response is taken into consideration.
– The RCF impact measures are rough with only implicit links to RCF initiationmechanisms.
This approach is used in Paper A.
26

6.2.2 Surface fatigue indexThe surface fatigue index, FIsurf, was developed as an engineering tool, to be used ine.g. multibody dynamic simulations, for fast assessment of the risk for surface initiatedRCF [32]. The idea is to parametrize the loading in terms of the normal force N and thetraction coefficient, defined as the creep force to the normal force ratio: f = Q/N . Underthe assumptions of Hertzian contact and full slip, it is possible to relate the stress stateinduced by the loading to the one needed for ratchetting to take place. This is quantifiedby dimensionless surface fatigue index, FIsurf [32]:
FIsurf = f − 2πabk3N (6.9)
where a and b are semiaxes of the elliptic contact patch and k is the (cyclic) yield stressin pure shear. Some benefits and drawbacks of the model are listed below.
+ Low computational cost, which allows for online implementation in simulationsof dynamic vehicle–track interaction.
+ Clear relation to a RCF initiation mechanism.
– Discrete surface irregularities cannot be accounted for since the assumption ofHertzian contact is not fulfilled.
– Only full slip conditions are considered.
– No detailed material response is taken into consideration.
This RCF impact model is not used in the appended papers since it was not developed toaccount for discrete surface irregularities.
6.2.3 Tγ approachThe so-called wear number Tγ, which is a measure of the dissipated energy insidethe contact patch, is defined as the product between in-plane creep forces and theircorresponding creepages:
Tγ = Txγx + Tyγy (6.10)
where Tx and Ty are longitudinal and lateral creep forces, while γx and γy are thelongitudinal and lateral creepages respectively1. By introducing a damage functioncalibrated towards field observations, it has been possible to relate the wear number notonly to wear, but also to RCF damage [18]. Some benefits and drawbacks are listed below.
+ Low computational cost that allows for online implementation in simulations ofdynamic vehicle–track interaction.
+ The competitive mechanism between wear and RCF is taken into account.1Note that this notation is not consistent with the one introduced in Chapter 4, where the longitudinal
creep force and creepage are denoted Q and ξ respectively. It is nevertheless kept to be in accordancewith the literature.
27

– The damage function must be calibrated towards the conditions under which itshould be used.
This RCF impact model is not used in the appended papers since calibration of thedamage function would be needed to account for surface irregularities.
6.2.4 Equivalent stress/strainAs touched upon previously, one of the mechanisms behind surface initiated RCF isratchetting, i.e. unrestrained accumulation of strain under cyclic loading. This initiationmode is particularly relevant if the directions of the surface tractions do not vary overtime [33]. By employing a suitable material model, able to capture nonlinear hardening,it is possible to study this phenomenon in an FE analysis. The state of stress and strainis however multiaxial and for a convenient analysis it is therefore necessary to introducesingle scalar values to represent the stress and strain. Since metal plasticity is considered,the influence of hydrostatic stresses are negligible. To this end, the equivalent von Misesstrain is introduced as a scalar representation of the strain:
ε =√
23
√(εxx − εyy)2 + (εyy − εzz)2 + (εzz − εxx)2 + 6
(ε2xy + ε2yz + ε2xz
)(6.11)
where εij is a component of the total strain tensor. Similarly, the equivalent von Misesstress is introduced as a scalar representation of the stress:
σ = 1√2
√(σxx − σyy)2 + (σyy − σzz)2 + (σzz − σxx)2 + 6
(σ2
xy + σ2yz + σ2
xz
)(6.12)
where σij contains the components of the stress tensor. By plotting the von Mises stressagainst the strain it is possible to graphically indicate whether or not a state of shakedownis obtained. Some benefits and drawbacks are listed below.
+ This method can capture potential RCF initiation due to ratchetting.
+ The approach is rather general and suitable also in cases of local surface irregu-larities.
– Detailed stress and strain fields, typically obtained at a high computational cost,must be provided.
– An advanced material model is required to predict accurate evolution of localstresses and strains.
– The criterion is local whereas, in reality, fatigue is a “semi-local” phenomenonsince steep stress gradients might initiate a crack which is soon halted.
This approach is used in Papers B and C.
28

6.2.5 Jiang–Sehitoglu fatigue parameterIf the surface tractions change directions over time, the net accumulation of strain willbecome low. Instead of ratchetting, low cycle fatigue will then become the dominatingmode of RCF initiation in terms of damage accumulation [33]. This effect can be capturedusing the Jiang–Sehitoglu low cycle fatigue criterion [47]. The idea is to project stressesand strains onto a material plane, see Figure 6.2, in order to obtain the correspondingnormal stress σ, normal strain ε, shear stress τ and engineering shear strain γ. TheJiang–Sehitoglu fatigue parameter can then be evaluated for a particular plane i accordingto:
FPi =⟨
∆ε2 σmax
⟩+ cJ∆γ∆τ (6.13)
Whereσmax = max
t∈L[σ (t)] (6.14)
∆ε = maxt∈L
[ε (t)]−mint∈L
[ε (t)] (6.15)
∆τ = maxt,t∈L
[∣∣τ (t)− τ(t)∣∣] (6.16)
∆γ = maxt,t∈L
[∣∣γ (t)− γ(t)∣∣] (6.17)
cJ is a material parameter, t and t are instants in time related to the current load cycleL. Further, τ and γ are the vectorial shear stress and engineering shear strain of thestudied plane and 〈•〉 = 1/2 (| • |+ •). Note that the 〈•〉 notation is not present in [47]but occurs in different forms in the literature, cf. [53, 79]. The material plane giving thehighest fatigue parameter is typically taken as representative for the fatigue damage:
FP = max[⟨
∆ε2 σmax
⟩+ cJ∆γ∆τ
](6.18)
where the maximization should be carried out over all material plane orientations. FPcan then be related to the fatigue life Nf in the following manner [47]:
(FP − FP0)mNf = C (6.19)
where FP0, m and C are three additional material parameters. Some benefits anddrawbacks are listed below.
+ The approach explicitly accounts for the influence of plastic deformation onfatigue damage.
+ The approach is rather general and can handle the influence of local surfaceirregularities.
– Detailed stress and strain fields, typically obtained at a high computational cost,must be provided.
29

(a)
n
σ
τ
(b)
Figure 6.2: (a) Example of different material plane orientations in a point. Unlike in thefigure, the material planes are rotated about all axes in an analysis. (b) Normal stress σand shear stress τ acting on a material plane defined by the unit normal vector n.
– It is computationally expensive to calculate the fatigue parameter for all materialplanes and positions of interest.
– The criterion is local whereas, in reality, fatigue is a “semi-local” phenomenonsince steep stress gradients might initiate a crack which is soon halted.
FP is used as a measure of RCF impact in Paper B, Paper C and Paper E.
6.2.6 Fracture mechanicsFor a linear elastic material response, stress magnitudes go to infinity in the vicinity of asharp crack tip. It thus appears that the stress magnitudes are not useful quantifiers forthe severity of a loaded crack. A more suitable choice is to use so-called Stress IntensityFactors (SIFs) defined as [62]:
KI = limr→0
σyy (r, θ = 0)√
2πr
KII = limr→0
σxy (r, θ = 0)√
2πr (6.20)
KIII = limr→0
σyz (r, θ = 0)√
2πr
where r and θ are polar coordinates originating from the crack tip, see Figure 6.3.KI, KII and KIII are related to crack opening, in-plane shear and out-of-plane shear,
30

x
y
r
θ
Figure 6.3: A crack with two coordinate systems originating from the crack tip—the polarr, θ-system and the Cartesian x, y-system (with z pointing out of the plane) respectively.
respectively, see Figure 6.4. Note that SIFs are only relevant under (predominantly) linearelastic conditions. This is commonly referred to as Linear Elastic Fracture Mechanics(LEFM) [30].
Figure 6.4: Opening mode (mode I), in plane shear mode (mode II) and out of plane shearmode (mode III).
The SIFs can be expressed as functions of the crack length a and nominal stress σ0 [30]:
K = gσ0√πa (6.21)
where g is a function of the geometry and load characteristics. Values of g are availablein handbooks for a wide range of problems. Fracture is expected when K reaches acritical value Kc, known as the fracture toughness [30]. K ≥ Kc might thus be used as afracture criterion. It should be noted that fracture tends to appear in mode I and KI istherefore commonly of most concern. This is however often not the case for RCF cracks,see Section 3.1.
SIFs are useful, not only for prediction of brittle failure, but also in the assessmentof fatigue crack growth. If the SIF range ∆K, defined as ∆K = Kmax −Kmin over a load
31

cycle, is greater than a threshold value ∆Kth, crack growth is expected. Several attemptshave been made to formulate crack growth models. One of the first models, which is stillthe most common, is often referred to as Paris law. It can be expressed as [30, 75]:
da
dN= C (∆K)m (6.22)
where dadN is the crack growth per load cycle, i.e. the crack growth rate, while C and m
are material parameters. RCF cracks are associated with mixed mode nonproportionalloading and crack closure, which are outside the validity of the original Paris law [33].Nevertheless, this does not prevent that other SIF based propagation criteria are employed,or that the SIFs are used as overall fatigue impact factors.
In complicated general situations, such as a railway wheel traversing a cracked railsurface, it is not possible to find analytical SIF solutions and they must hence be es-timated. One attractive way of achieving this is to use FEM or XFEM. Throughoutthe last decades, significant efforts have been devoted to how this can be done and sev-eral methods exist, see e.g. [62]. In the following the focus will be restricted to two methods.
The first, and probably most common approach, available in several commercial FEcodes, is based on the J-integral, defined as [78, 90]:
J =∫
Γ
(Wdy − Ti
∂ui
∂xdΓ)
(6.23)
where W is the strain energy density, ui the displacements, Ti is the traction vector andΓ is an arbitrary contour that should be taken counterclockwise (i.e. start on the lowercrack face and end on the upper) as in Figure 6.5. If the material is linear elastic, J canbe related to the SIFs [62]. For implementation purposes, it is often convenient to rewritethe classical J-integral of Equation (6.23) into a domain integral, cf. [83]. If the crackfaces are traction free and the material is elastic (not restricted to linear elasticity), it canbe shown that J , pertaining to the energy release rate, becomes path independent [62]. Asthe path independence makes it possible to avoid the singularity close to the crack tip, themesh can be made rather coarse. Note however that RCF problems are usually associatedwith crack closure and the assumption of traction free crack faces is thus violated.
The second SIF evaluation approach brought up here is more straight forward thanthe J-integral method. It starts off from LEFM theory and the asymptotic functionsdescribing the displacement fields close to the crack tip. Presuming plane strain conditions,traction free crack surfaces and neglecting higher order terms, it is possible to express thedisplacements in the x-, y- and z-direction as [90]:
ux = (1 + ν)4πE
√2πr(
(5− 8ν) cos θ2− cos 3θ
2
)KI + (1 + ν)
4πE√
2πr(
(9− 8ν) sin θ2
+ sin 3θ2
)KII
uy = (1 + ν)4πE
√2πr(
(7− 8ν) sin θ2− sin 3θ
2
)KI −
(1 + ν)4πE
√2πr(
(3− 8ν) cos θ2
+ cos 3θ2
)KII (6.24)
uz = 2 (1 + ν)πE
√2πr sin θ
2KIII
32
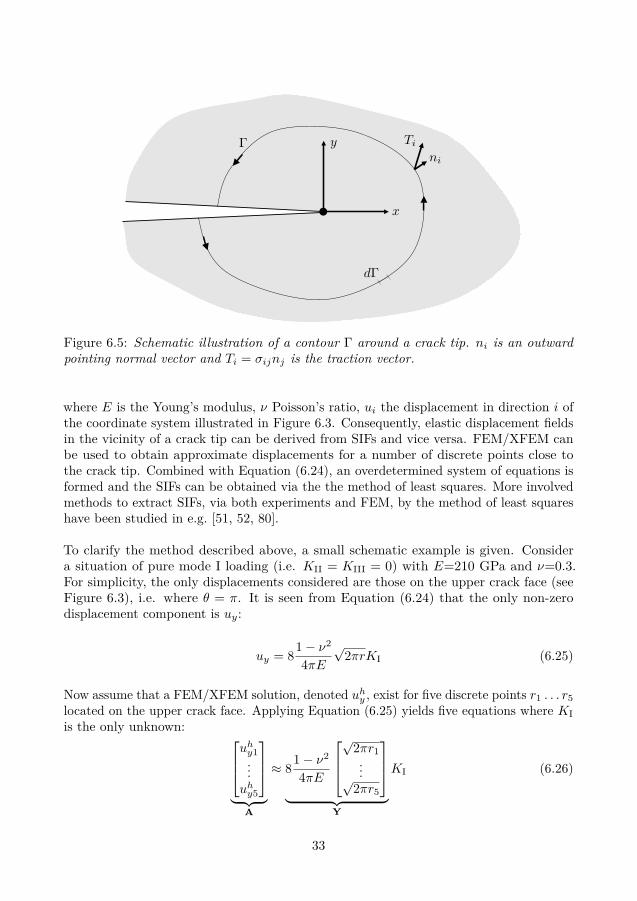
x
yΓ Ti
ni
dΓ
Figure 6.5: Schematic illustration of a contour Γ around a crack tip. ni is an outwardpointing normal vector and Ti = σijnj is the traction vector.
where E is the Young’s modulus, ν Poisson’s ratio, ui the displacement in direction i ofthe coordinate system illustrated in Figure 6.3. Consequently, elastic displacement fieldsin the vicinity of a crack tip can be derived from SIFs and vice versa. FEM/XFEM canbe used to obtain approximate displacements for a number of discrete points close tothe crack tip. Combined with Equation (6.24), an overdetermined system of equations isformed and the SIFs can be obtained via the the method of least squares. More involvedmethods to extract SIFs, via both experiments and FEM, by the method of least squareshave been studied in e.g. [51, 52, 80].
To clarify the method described above, a small schematic example is given. Considera situation of pure mode I loading (i.e. KII = KIII = 0) with E=210 GPa and ν=0.3.For simplicity, the only displacements considered are those on the upper crack face (seeFigure 6.3), i.e. where θ = π. It is seen from Equation (6.24) that the only non-zerodisplacement component is uy:
uy = 81− ν2
4πE√
2πrKI (6.25)
Now assume that a FEM/XFEM solution, denoted uhy , exist for five discrete points r1 . . . r5
located on the upper crack face. Applying Equation (6.25) yields five equations where KIis the only unknown:
uh
y1...uh
y5
︸ ︷︷ ︸A
≈ 81− ν2
4πE
√2πr1...√
2πr5
︸ ︷︷ ︸Y
KI (6.26)
33

0 2 4 6 8 100
2
4
6
8
r [mm]
u y[µ
m]
Analytical solutionFE solutionLeast squares estimate
Figure 6.6: Schematic illustration of the asymptotic displacement field close to a crack tipunder mode I loading. The solid line represents the exact solution, the circles are samplingpoints of the FE solution and the dashed line is a least squares fit of the FE results.
The least squares approximation is then obtained as
KI =(ATA
)−1ATY (6.27)
The procedure is illustrated schematically in Figure 6.6. The difference between the exactsolution and the least squares fit of the FE solution reflects the error of the estimatedKI compared to the exact. There are of course many delicate questions related to themethod, e.g. how crack closure can be handled and sampling points selected. This andseveral other issues are discussed in Paper D, where the approach is applied to RCFcracks (thus treating mixed mode loading and crack closure) and results are compared toJ-integral evaluations.
6.3 Thermal loading and damageThe mechanical properties of steel depend to a large extent on the phase2 content, which inturn is a function of the temperature history, see e.g. [85]. This is an important topic withinrail and wheel manufacturing. The main concern in the context of this thesis is the risk ofwheel and rail damage in the form of studs on rails or RCF clusters on wheels due to phasetransformations. As touched upon in Section 3.3, the idea is that frictional heating due tosliding in the wheel–rail contact might cause a temperature increase of the pearlite beyondthe austenization temperature. When the heat source is removed, the relatively highconductivity of the steel will effectively cool the hot area and cause a rapid temperaturedecrease, possibly leading to martensite formation and the creation of a white etching layer.
2A material domain that has a microstructure (or composition) distinguishable from other domains ofthe material [85].
34

The mechanical properties, such as the yield stress, of the material are typically bothphase and temperature dependent and will hence change during the process describedabove. The residual stresses, that affect damage formation, will thus be related to themechanical and thermal loading in a highly nonlinear manner. This makes FE analysis asuitable tool for the corresponding stress evaluation, see e.g. Jergéus [46] and Ahlström [1].
The constitutive model needed to describe the phase transformation can be made highlycomplex to involve different physical phenomena. Paper E focusses on rapid temperaturechanges and some physical phenomena are therefore neglected. As an example, transfor-mation from austenite into martensite is of great importance, while transformation fromaustenite into e.g. pearlite or bainite is of less interest. This limits the demands on theconstitutive model to the inclusion of austenization and martensite transformation. Tothis end, a simplified approach based on the work by Jergéus [44, 46] is used.
7 Summary of appended papersThe following chapter contains summaries of the appended papers. The inclusion ofoverall topics are shown in Table 7.1.
Table 7.1: Overall content of the appended papers.
Paper A B C D E FDynamic vehicle–track interaction X X X XRCF initiation X X XFracture mechanics X XThermal damage X
7.1 Paper A: The influence of rail surface irregulari-ties on contact forces and local stresses
The initiation of squats has been linked to the occurance of rail surface irregularities. Thispaper investigates the influence of rail surface irregularities in the form of dimples, but alsosome cases of corrugation, on the overall RCF impact, quantified by maximum wheel–railcontact stresses and forces. To this end, an in-house code for dynamic vehicle–trackinteraction, RAVEN, is utilised. The overall idea, summarised in Figure 7.1 is to computethe displacements of the wheel and track via the computationally efficient method ofmoving Green’s functions, see Section 5.1. The wheel and rail displacements are thenused as input to a contact model based on an implementation of Kalker’s complete theory,see Section 4.3. Output in the form of the resulting normal contact force is used as inputto the calculation of wheel and rail displacements of the next time step. Contact stresses
35

and the resulting contact forces are saved for post-processing.
Altogether, 486 operational scenarios are analysed in a parametric study involving thesize of surface dimples, position in relation to sleepers, friction coefficient, velocity andcreepage. It is shown that even relatively shallow surface irregularities might cause asubstantial RCF impact. How the different RCF impact factors are affected by thedifferent input parameters is presented and discussed. As an example, the influence onRCF impact of dimple semi-length a and depth h are investigated, see Figure 7.2. Inaddition, three different types of corrugation are studied in combination with differentmagnitudes of velocity, friction coeffcient and creepage. It is found that the evaluatedRCF impact from rail surface dimples is larger than for the studied cases of corrugation.
Evaluate convolution integrals:wR (t) =
∫ t
0 N (τ) GR,v (t− τ) dτwW (t) =
∫ t
0 N (τ) GW (t− τ) dτ
wR (t), wW (t)
Contact model
N (t)
Surface irregularityGR,v
GW
p (x, t)q (x, t)N (t)Q (t)
Evaluate Green’s functionsPre-processing
Simulation
Results
Figure 7.1: Flow chart describing the in-house vehicle–track interaction code RAVEN.GR,v and GW are Green’s functions for rail and wheel, wR (t) and wW (t) are displacementsof rail and wheel at the current position, and N (t) is the resulting normal contact forcein the current position. The output consists of time histories of contact pressure p (x, t)and shear traction q (x, t) and corresponding normal and shear forces N (t) and Q (t)respectively. Surface irregularities, e.g. dimples and corrugation patterns, are introducedas input to the contact model.
36

0.6 0.8 1 1.2 1.43.4
3.5
3.6
3.7
3.8
h [mm]
pmax
0.6 0.8 1 1.2 1.42.6
2.7
2.8
2.9
3
h [mm]
pmax
0.6 0.8 1 1.2 1.40.9
0.95
1
1.05
1.1
h [mm]
Nmax
0.6 0.8 1 1.2 1.40.9
1
1.1
1.2
h [mm]
Nmax
0.6 0.8 1 1.2 1.41
1.05
1.1
1.15
1.2
h [mm]
Nmax
0.6 0.8 1 1.2 1.42
3
4
5
h [mm]
pmax
Figure 10: Maximum normal contact stress, pmax, and normal force Nmax, plot-ted against depth h for (from above) a=4 mm, 6 mm and 8 mm.
Figure 7.2: Two RCF impact measures, maximum contact pressure pmax and the maximumcontact force Nmax, plotted as functions of dimple depth h. Three different dimple semi-lengths are considered. From above: a=4, 6 and 8 mm. Adopted from Paper A.
37

7.2 Paper B: An efficient approach to the analysis ofrail surface irregularities accounting for dynamictrain–track interaction and inelastic deformations
This paper continues the work in Paper A by investigating how the computed contactstress histories can be used in combination with finite element analysis in order to evaluatethe RCF impact. The FE analyses involve nonlinear mixed kinematic and isotropic hard-ening models fitted against cyclic experimental data of a rail material. The RCF impactis quantified using two different RCF impact measures: the accumulated von Mises strain,see Section 6.2.4, and the Jiang–Sehitoglu fatigue parameter, see Section 6.2.5. Thesemeasures reflect the two overall RCF initiation mechanisms: ratchetting and low cyclefatigue, respectively. The procedure is finally demonstrated through numerical examplesinvolving rail surface irregularities. The method presented in this paper constitutes thefoundation of the analyses in Paper C.
7.3 Paper C: Integrated analysis of dynamic vehicle–track interaction and plasticity induced damagein the presence of squat defects
A number of parameter combinations identified in Paper A are analysed in accordancewith the procedure proposed in Paper B. This includes a small, medium sized and largedimple, lower and higher friction coefficient as well as a double dimple representing acluster of defects. The effect of a limited region of low friction, resulting in a state offull slip and subsequent recovery, is also examined. It is shown that a higher frictioncoefficient (and thereby higher wheel–rail shear tractions) has a significant impact on theRCF impact, see Figure 7.3. It is furthermore evident that the RCF impact increaseswith dimple size and that defect clusters have a detrimental effect. It is finally shown thatthe impact of a low friction section on a rail is comparable with that of a small surfacedimple.
38

0 0.5 1 1.5 2 2.5 3 3.5 4 4.5 5 5.5 60
100
200
300
400
500
600
700
800
ǫ [%]
σvM
[ MPa
]
Max. ǫ int. pointMax σvM int. point
Figure 7.3: Stress–strain response in the vicinity of a dimple for a case with relatively highfriction loading. Results from two integration points are considered: the point subjected tothe highest von Mises stress of all load cycles and the point with the largest accumulatedvon Mises strain after the final load cycle. Adopted from Paper C.
7.4 Paper D: Evaluation of stress intensity factors un-der multiaxial and compressive conditions usinglow order displacement or stress field fitting
There are several complicating factors related to the evaluation of Stress Intensity Factors(SIFs) of RCF cracks. First of all, the loading is typically multiaxial, which means thatmode I–III SIFs are all activated. Secondly, the loading is compressive during part ofa wheel passage and special care must be taken to avoid non-physical negative mode ISIFs. In this study it is proposed that SIFs can be accurately evaluated for RCF cracksby least squares fitting of a low order displacement ansatz towards an XFEM solution,see Sections 6.1 and 6.2.6. The accuracy is demonstrated by comparing the proposedapproach to handbook solutions and J-integral results for pure mode I, II and III loading.Special emphasis is put on compressive conditions, see Figure 7.4. The ability to separatebetween mode I and II SIFs as well as convergence with mesh size are also demonstrated.The procedure is finally applied to evaluate SIFs for an inclined half-circular RCF crackembedded in a 3D rail head. The procedure presented in this paper constitutes thefoundation of the analyses in Paper F.
39

5 10 15 20 25 30 35 40 45 50−0.14
−0.12
−0.10
−0.08
−0.06
−0.04
−0.02
0.00
ruh
K KI,t
Theoretical valueKI, ua = AKbK + ARBMbRBMKI, ua = AKbK + ARBMbRBM + Aεbε
KI from J-integral
Figure 7.4: A case of compressive mode I loading is considered. The vertical axis showsa normalised mode I SIF. The horizontal axis shows a cut-off distance ru, used in theSIF evaluation scheme, expressed in terms of element lengths. Two different ansatzes areconsidered. The three-term ansatz can account also for constant strain fields and moreaccurate results are thus obtained. Theroetical values and J-integral results are shown forreference. Adopted from Paper D.
7.5 Paper E: Numerical investigation of crack initia-tion in rails and wheels in the presence of whiteetching layers
Stud defects on rail crowns and RCF clusters on wheel treads have been linked to the pres-ence of white etching layers (WELs). This study utilises three-dimensional FE analyses tostudy how the axle load (12.5/25 tonnes), traction coefficient (0/0.4) and WEL thickness(500 µm on rails and 1000 µm on wheels) affect the propensity for crack initiation. Byprescribing a temperature history it is possible to model the resulting material phasetransformation and capture the phase dependent elasto-plastic material response.
The phase transformation algorithm consists of the following steps:
• Pearlite, austenite and martensite are represented by their respective volume frac-tions: vp, va, vm, which can vary between 0 and 1 and should add up to 1 in eachintegration point. When the analysis starts, it is presumed that vp = 1.
• If the temperature reaches the austenization temperature Taust during heating, the
40

volume fraction of austenite instantly becomes 1, i.e. va = 1.
• The volume fraction martensite obtained during a temperature decrease is modelledusing an empirical relation known as the Koistinen–Marburger equation [60]:
vm = 1− exp(−0.011 (TMs − T )), T ≤ TMs (7.1)
where T is the current temperature and TMs is a material parameter.
To illustrate the behaviour of the model Taust=850 C and TMs=270 C are adopted. Theresulting phase transformations are presented in Figure 7.5 (a) for heating and (b) coolingrespectively.
0 200 400 600 800 1,0000
0.2
0.4
0.6
0.8
1
Temperature [C]
Volumefra
ction[–]
vpvavm
02004006008001,0000
0.2
0.4
0.6
0.8
1
Temperature [C]
Volumefra
ction[–]
vpvavm
(a) (b)
Figure 7.5: Illustration of phase transformation during a temperature increase (a) andtemperature decrease (b). vp, va and vm denote the volume fraction of pearlite, austeniteand martensite respectively. Adopted from Paper E.
Subsequent mechanical load cases are included by simulations featuring moving Hertzianloads. Fatigue damage is quantified by the Jiang–Sehitoglu fatigue parameter, seeSection 6.2.5 and Figure 7.6. The study shows that the axle load has a minor impacton wheel and rail damage. An increased frictional load does on the other hand increasethe damage significantly. Although the WEL is modelled to be twice as thick on wheelsas compared to rails, similar trends are observed. Finally, the effect of eccentric wheelpassages are considered. It is seen that the predicted fatigue damage becomes more thantwice as high compared to a centric wheel passage for the cases studied. This might helpexplaining why stud cracks often grow from the gauge corner side of the rail surface.
41

0 0.5 1 1.5 2 2.5 3 3.5 4
−0.4
−0.2
0
0
1
2
3
4
5x 10⁵
0 0.5 1 1.5 2 2.5 3 3.5 4
−0.4
−0.2
0
0
1
2
3
4
5x 10⁵
[mm]
[Pa]
[mm][Pa]
Figure 7.6: Distribution of the Jiang–Sehitoglu fatigue parameter FP in the vicinity of aWEL in a rail. Axle load 25 tonnes and no frictional load. The upper and lower plotsrefer to evaluation planes along and perpendicular to the rolling direction, respectively.Identified critical material planes are indicated by projected normal vectors. The FEdiscretization is indicated by black lines. Adopted from Paper E.
7.6 Paper F: Assessment of rolling contact fatiguecracks in the vicinity of rail surface irregularities
As been discussed in Papers A–C, rail surface irregularities in the form of dimplesgenerate contact pressure peaks as well as dynamic impact loads. These effects might inturn promote further deterioration of the rail material. This study considers cracks in thevicinity of surface dimples and assess their severity with the help of equivalent SIF ranges.To this end, three-dimensional dimples as well as realistic wheel and rail profiles areconsidered in a dynamic vehicle–track interaction analysis similar to those conducted inPapers A–C. The resulting contact pressures are then mapped onto a three-dimensionalFE model representing a rail section with embedded XFEM cracks. SIFs are evaluated ina post-processing step with help of the method described in Paper D. An equivalent SIFrange is employed to characterise the multiaxial loading of the crack. It is shown thatthe equivalent SIF range for a crack increases ∼10–20% in the presence of a small dimpleand ∼30–40% for a large dimple as compared to the situation of a smooth rail surface,see Figure 7.7. It is found that also dimples as shallow as 0.125 mm might increase theequivalent SIF range by ∼15%. Double dimples are furthermore examined to investigatepossible cluster effects. It is seen that the trends are similar to those obtained for singledimples. Equivalent SIF ranges are, in other words, expected to increase with dimple size.
42

4 4.5 5 5.5 6 6.5 7 7.5 81
1.1
1.2
1.3
1.4
1.5
a [mm]
∆K
eq/∆
Keq
,ref
5 mm7.5 mm10 mm5 mm7.5 mm10 mm
Figure 7.7: Influence of dimple semi-length a on equivalent SIF range ∆Keq. Single anddouble dimple results are indicated by solid and dashed lines, respectively. Crack lengthsare indicated in the legend. Note that the equivalent SIF ranges are scaled with valuescorresponding to a smooth rail surface, ∆Keq,ref. Adopted from Paper F.
8 Conclusions, main results and future workThis chapter summarises the main results of the appended papers and provide sugges-tions for future work. In general, the current work has contributed in the developmentof numerical procedures to facilitate the analysis of squat/RCF cluster initiation andsubsequent crack analysis. This involves:
• Methods for mapping contact stresses from dynamic simulations onto finite elementmodels able to capture nonlinear hardening plasticity (Paper B).
• Subsequent RCF assessments based on accumulated strain and the Jiang–Sehitoglufatigue parameter (Paper B).
• A procedure for evaluation of stress intensity factors, with particular focus on RCFcracks, using results from XFEM/FEM analyses in commercial software (Paper D).Special emphasis is given to crack closure.
• A simulation procedure for mapping contact stresses from dynamic simulationsonto an XFEM model featuring a cracked rail head, allowing for subsequent SIFevaluation (Paper F).
There are also several practical implications of the work in the appended papers. Theseinvolve:
• Surface irregularities in the form of dimples can cause a substantial impact on thepropensity for RCF initiation (Paper A).
43
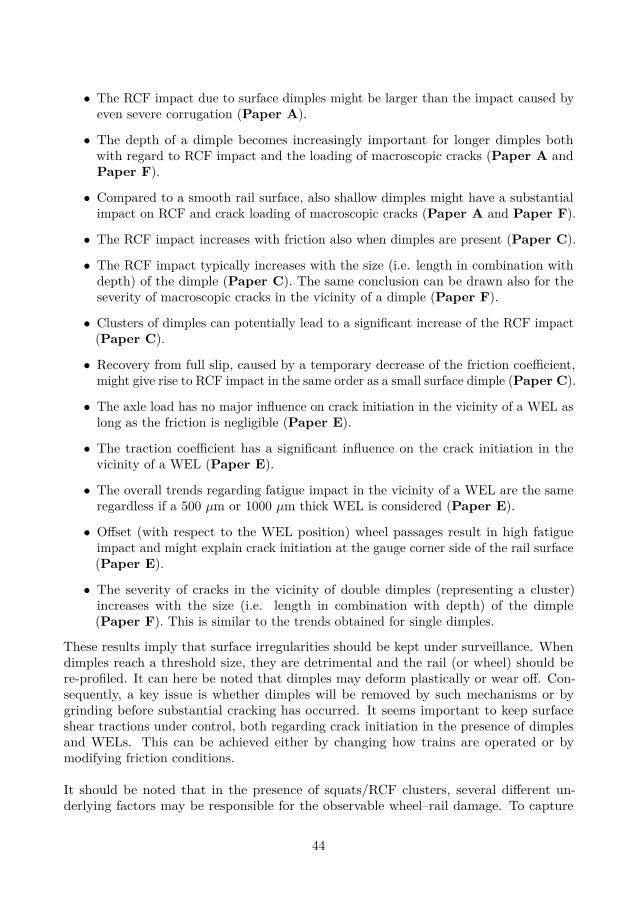
• The RCF impact due to surface dimples might be larger than the impact caused byeven severe corrugation (Paper A).
• The depth of a dimple becomes increasingly important for longer dimples bothwith regard to RCF impact and the loading of macroscopic cracks (Paper A andPaper F).
• Compared to a smooth rail surface, also shallow dimples might have a substantialimpact on RCF and crack loading of macroscopic cracks (Paper A and Paper F).
• The RCF impact increases with friction also when dimples are present (Paper C).
• The RCF impact typically increases with the size (i.e. length in combination withdepth) of the dimple (Paper C). The same conclusion can be drawn also for theseverity of macroscopic cracks in the vicinity of a dimple (Paper F).
• Clusters of dimples can potentially lead to a significant increase of the RCF impact(Paper C).
• Recovery from full slip, caused by a temporary decrease of the friction coefficient,might give rise to RCF impact in the same order as a small surface dimple (Paper C).
• The axle load has no major influence on crack initiation in the vicinity of a WEL aslong as the friction is negligible (Paper E).
• The traction coefficient has a significant influence on the crack initiation in thevicinity of a WEL (Paper E).
• The overall trends regarding fatigue impact in the vicinity of a WEL are the sameregardless if a 500 µm or 1000 µm thick WEL is considered (Paper E).
• Offset (with respect to the WEL position) wheel passages result in high fatigueimpact and might explain crack initiation at the gauge corner side of the rail surface(Paper E).
• The severity of cracks in the vicinity of double dimples (representing a cluster)increases with the size (i.e. length in combination with depth) of the dimple(Paper F). This is similar to the trends obtained for single dimples.
These results imply that surface irregularities should be kept under surveillance. Whendimples reach a threshold size, they are detrimental and the rail (or wheel) should bere-profiled. It can here be noted that dimples may deform plastically or wear off. Con-sequently, a key issue is whether dimples will be removed by such mechanisms or bygrinding before substantial cracking has occurred. It seems important to keep surfaceshear tractions under control, both regarding crack initiation in the presence of dimplesand WELs. This can be achieved either by changing how trains are operated or bymodifying friction conditions.
It should be noted that in the presence of squats/RCF clusters, several different un-derlying factors may be responsible for the observable wheel–rail damage. To capture
44

the effects from all of these, several different physical phenomena need to be accountedfor. These include dynamic vehicle–track interaction, wheel–rail contact, nonlinear (andpossibly anisotropic) material response, progressive deterioration of the material, crackinitiation, crack propagation etc. Preferably, all these effects should be accounted for inan integrated manner and studied for a variety of operational scenarios. Each scenarioshould in turn consist of a large number of train passages. However, such an approachwould hardly work in practice due to high computational costs etc. A less expensiveprocedure is to study some of the effects individually, or in combination, as done in thisthesis. An alternative, and suggestion for future work, would be to study some of theeffects more in detail using e.g. finite element analysis and then produce meta-models ofthe response. If, for example, the Jiang–Sehitoglu fatigue parameter is evaluated for alarge number of surface irregularities, friction conditions etc., it would be possible to fit ameta-model to the corresponding results. Unlike the underlying finite element simulations,the meta-model would be fast and could be incorporated directly into a vehicle–trackinteraction simulation, allowing for extensive parametric studies. This type of analyseswould be suitable to identify potentially problematic areas along a railway line.
In contrast to the broad but not so detailed analyses mentioned above, it could also befruitful to combine, e.g., XFEM with a suitable crack propagation criterion in order tosimulate realistic crack growth given certain operational scenarios. This would howeverrequire a criterion able to capture the specific characteristics of RCF cracks.
Another topic that is possible to improve as future work is the analyses related tomaterial phase transformation in relation to stud/RCF cluster simulations. More involvedphase transformation models, including evolution laws for state variables etc., could beintroduced. Further, it could be important to also model the source of the frictionalheating. In that way it would be possible to start off with an operational scenario, predictthe temperature increase in the wheel and the rail, obtain a size of the white etchinglayers and finally make a crack initiation assessment. It would, in other words, be possibleto directly relate the risk of crack initiation to how the trains are operated.
Last, but not least, it is always necessary to relate the conclusions drawn in numer-ical simulations to experimental results and field observations. In that way it couldbecome more clear which RCF impact measures that are the most relevant. This is,however, often easier said than done as it is complicated and time consuming to performfull-scale fatigue experiments. Further, the test conditions are typically not possible tocontrol in detail. Therefore it is probably more fruitful to rely on test rig and laboratorytests in order to achieve well controlled experiments.
45

References[1] J. Ahlström. Residual stresses generated by repeated local heating events — Mod-
elling of possible mechanisms for crack initiation. Wear 366.SI (2016), 180–187.issn: 0043-1648. doi: 10.1016/j.wear.2016.05.029.
[2] J. Ahlström and B. Karlsson. Microstructural evaluation and interpretation of themechanically and thermally affected zone under railway wheel flats. Wear 232.1(1999), 1–14. issn: 0043-1648. doi: 10.1016/S0043-1648(99)00166-0.
[3] R. Andersson. Assessment of rolling contact fatigue cracks in the vicinity of railsurface irregularities. Submitted for international publication (2018).
[4] R. Andersson et al. Numerical investigation of crack initiation in rails and wheelsin the presence of white etching layers. Submitted for international publication(2018).
[5] R. Andersson, F. Larsson, and E. Kabo. Evaluation of stress intensity factorsunder multiaxial and compressive conditions using low order displacement orstress field fitting. Engineering Fracture Mechanics 189 (2018), 204–220. doi:10.1016/j.engfracmech.2017.11.015.
[6] R. Andersson et al. An efficient approach to the analysis of rail surface irregular-ities accounting for dynamic train–track interaction and inelastic deformations.Vehicle System Dynamics 53.11 (2015), 1667–1685. doi: 10.1080/00423114.2015.1081701.
[7] R. Andersson et al. The influence of rail surface irregularities on contact forcesand local stresses. Vehicle System Dynamics 53.1 (2015), 68–87. doi: 10.1080/00423114.2014.982890.
[8] R. Andersson et al. Integrated analysis of dynamic vehicle–track interaction andplasticity induced damage in the presence of squat defects. Wear 366-367 (2016),139–145. doi: 10.1016/j.wear.2016.05.014.
[9] R. Andersson. “Surface defects in rails — Potential influence of operational pa-rameters on squat initiation”. Licentiate thesis. Gothenburg, Sweden: ChalmersUniversity of Technology, 2015. 79 pp.
[10] T. Belytschko and T. Black. Elastic crack growth in finite elements with minimalremeshing. International Journal for Numerical Methods in Engineering 45.5(1999), 601–620. issn: 0029-5981.
[11] C. Bernsteiner et al. Development of white etching layers on rails: simulations andexperiments. Wear 366 (2016), 116–122. issn: 0043-1648. doi: 10.1016/j.wear.2016.03.028.
[12] S. Bogdański and M. W. Brown. Modelling the three-dimensional behaviour ofshallow rolling contact fatigue cracks in rails. Wear 253.1-2 (2002), 17–25. doi:10.1016/S0043-1648(02)00078-9.
[13] S. Bogdański, M. Olzak, and J. Stupnicki. Numerical modelling of a 3D railRCF ’squat’-type crack under operating load. Fatigue and Fracture of EngineeringMaterials and Structures 21.8 (1998), 923–935.
[14] S. Bogdański, M. Olzak, and J. Stupnicki. Numerical stress analysis of rail rollingcontact fatigue cracks. Wear 191.1-2 (1996), 14–24.
46
[15] P. E. Bold, M. W. Brown, and R. J. Allen. Shear mode crack growth and rollingcontact fatigue. Wear 144.1 (1991), 307–317. issn: 0043-1648. doi: 10.1016/0043-1648(91)90022-M.
[16] A. F. Bower. Influence of crack face friction and trapped fluid on surface initiatedrolling contact fatigue cracks. Journal of Tribology 110.4 (1988), 704–711. issn:0742-4787. doi: 10.1115/1.3261717.
[17] F. Brunel et al. Prediction of the initial residual stresses in railway wheels inducedby manufacturing. Journal of Thermal Stresses 36.1 (2013), 37–55. issn: 0149-5739.doi: 10.1080/01495739.2012.720542.
[18] M. C. Burstow. Whole Life Rail Model Application and Development for RSSB– Continued development of an RCF damage parameter. Report. Rail Safety andStandards Board, 2004.
[19] D. F. Cannon et al. Rail defects: An overview. Fatigue and Fracture of EngineeringMaterials and Structures 26.10 (2003), 865–886. doi: 10.1046/j.1460-2695.2003.00693.x.
[20] R. I. Carroll and J. H. Beynon. Rolling contact fatigue of white etching layer: Part1. Crack morphology. Wear 262.9-10 (2007), 1253–1266. issn: 0043-1648. doi:10.1016/j.wear.2007.01.003.
[21] R. I. Carroll and J. H. Beynon. Rolling contact fatigue of white etching layer.Part 2. Numerical results. Wear 262.9-10 (2007), 1267–1273. issn: 0043-1648. doi:10.1016/j.wear.2007.01.002.
[22] F. W. Carter. On the Action of a Locomotive Driving Wheel. Proceedings of theRoyal Society of London. Series A, Containing Papers of a Mathematical andPhysical Character 112.760 (1926), 151–157. issn: 0950-1207.
[23] P. Clayton. Tribological aspects of wheel-rail contact: a review of recent experimen-tal research. Wear 191.1 (1996), 170–183. issn: 0043-1648. doi: 10.1016/0043-1648(95)06651-9.
[24] P. Clayton and M. B. P. Allery. Metallurgical aspects of surface damage problemsin rails. Canadian Metallurgical Quarterly 21.1 (1982), 31–46.
[25] R. D. Cook et al. Concepts and applications of finite element analysis. 4th ed. NewYork: Wiley, 2002. 719 pp. isbn: 0471356050.
[26] R. R. Craig and A. J. Kurdila. Fundamentals of Structural Dynamics. 2nd ed.Hoboken, New Jersey: John Wiley & Sonc, Inc., 2006. 728 pp. isbn: 978-0-471-43044-5.
[27] W. J. T. Daniel, S. Pal, and M. Farjoo. Rail squats: Progress in understandingthe Australian experience. Proceedings of the Institution of Mechanical Engineers,Part F: Journal of Rail and Rapid Transit 227.5 (2013), 481–492. doi: 10.1177/0954409713500950.
[28] X. Deng et al. “Residual fatigue life evaluation of rail at squats seeds using 3Dexplicit finite element analysis”. International Conference on Ageing of Materials& Structures. Proceedings of the International Conference on Ageing of Materials& Structures. 2014.
[29] R. Deuce. Wheel tread damage - an elementary guide. Technical report. 2007.
47

[30] N. E. Dowling. Mechanical behavior of materials: engineering methods for defor-mation, fracture and fatigue. 3d ed. Upper Saddle River, N.J: Pearson PrenticeHall, 2007. 912 pp. isbn: 0132256096.
[31] A. Draganis. “Numerical simulation of thermomechanically coupled transient rollingcontact - An arbitrary Lagrangian-Eulerian approach”. PhD thesis. Gothenburg,Sweden: Chalmers University of Technology, 2014. 116 pp.
[32] A. Ekberg, E. Kabo, and H. Andersson. An engineering model for prediction ofrolling contact fatigue of railway wheels. Fatigue and Fracture of EngineeringMaterials and Structures 25.10 (2002), 899–909. doi: 10.1046/j.1460-2695.2002.00535.x.
[33] A. Ekberg and E. Kabo. Fatigue of railway wheels and rails under rolling contactand thermal loading—an overview. Wear 258.7 (2005), 1288–1300. issn: 0043-1648.doi: 10.1016/j.wear.2004.03.039.
[34] M. Farjoo, W. Daniel, and P. A. Meehan. Modelling a squat form crack on a raillaid on an elastic foundation. Engineering Fracture Mechanics 85 (2012), 47–58.doi: 10.1016/j.engfracmech.2012.02.004.
[35] M. Farjoo et al. Stress intensity factors around a 3D squat form crack and predictionof crack growth direction considering water entrapment and elastic foundation.Engineering Fracture Mechanics 94 (2012), 37–55. doi: 10.1016/j.engfracmech.2012.07.011.
[36] D. I. Fletcher. Numerical simulation of near surface rail cracks subject to thermalcontact stress. Wear 314.1-2 (2014), 96–103. doi: 10.1016/j.wear.2013.11.021.
[37] D. I. Fletcher and S. H. Sanusi. The potential for suppressing rail defect growththrough tailoring rail thermo-mechanical properties. Wear 366 (2016), 401–406.issn: 0043-1648. doi: 10.1016/j.wear.2016.06.022.
[38] S. L. Grassie. Squats and squat-type defects in rails: The understanding to date.Proceedings of the Institution of Mechanical Engineers, Part F: Journal of Railand Rapid Transit 226.3 (2012), 235–242. doi: 10.1177/0954409711422189.
[39] S. L. Grassie. Studs and squats: The evolving story. Wear 366 (2016), 194–199.issn: 0043-1648. doi: 10.1016/j.wear.2016.03.021.
[40] S. L. Grassie et al. Studs: A squat-type defect in rails. Proceedings of the Institutionof Mechanical Engineers, Part F: Journal of Rail and Rapid Transit 226.3 (2012),243–256. doi: 10.1177/0954409711421462.
[41] H. Hertz. Über die Berührung fester elastischer Körper. Journal für die reine undangewandte Mathematik 92 (1882), 156–171.
[42] M. Ishida. Rolling contact fatigue (RCF) defects of rails in Japanese railways andits mitigation strategies. Electronic Journal of Structural Engineering 13.1 (2013),67–74.
[43] S. Iwnicki, ed. Handbook of railway vehicle dynamics. 1st ed. Boca Raton: CRC/Taylor& Francis, 2006. 526 pp. isbn: 0849333210.
[44] J. Jergéus. Martensite formation and residual stresses around railway wheelflats. Proceedings of the Institution of Mechanical Engineers, Part C: Journalof Mechanical Engineering Science 212.1 (1998), 69–79. issn: 0954-4062. doi:10.1243/0954406981521051.
48

[45] J. Jergéus et al. Full-scale railway wheel flat experiments. Proceedings of theInstitution of Mechanical Engineers, Part F: Journal of Rail and Rapid Transit213.1 (1999), 1–13. issn: 0954-4097. doi: 10.1243/0954409991530985.
[46] J. Jergéus. “Railway Wheel Flats. Martensite Formation, Residual Stresses, andCrack Propagation”. PhD Thesis. Gothenburg, Sweden: Chalmers University ofTechnology, 1998. 115 pp.
[47] Y. Jiang and H. Sehitoglu. A model for rolling contact failure. Wear 224.1 (1999),38–49.
[48] K. L. Johnson. Contact Mechanics. New York: Cambridge University Press, 1987.452 pp. isbn: 0521347963.
[49] K. L. Johnson. The Strength of Surfaces in Rolling Contact. Proceedings of theInstitution of Mechanical Engineers, Part C: Journal of Mechanical EngineeringScience 203.3 (1989), 151–163. issn: 0954-4062. doi: 10.1243/PIME_PROC_1989_203_100_02.
[50] A. Jörg et al. “The Squat condition of rail materials - A novel approach to Squatprevention”. CM2015 – 10th International Conference on Contact Mechanics ofWheel / Rail Systems.
[51] S. H. Ju. Simulating stress intensity factors for anisotropic materials by the least-squares method. International Journal of Fracture 81.3 (1996), 283–297.
[52] S. H. Ju. Simulating three-dimensional stress intensity factors by the least-squaresmethod. International Journal for Numerical Methods in Engineering 43.8 (1998),1437–1451.
[53] E. Kabo and A. Ekberg. Material defects in rolling contact fatigue of railwaywheels - The influence of defect size. Wear 258.7-8 (2005), 1194–1200. doi: 10.1016/j.wear.2004.03.070.
[54] S. Kaewunruen, M. Ishida, and S. Marich. Dynamic Wheel–Rail Interaction OverRail Squat Defects. Acoustics Australia 43.1 (2015), 97–107. issn: 0814-6039. doi:10.1007/s40857-014-0001-4.
[55] J. J. Kalker. A Fast Algorithm for the Simplified Theory of Rolling Contact.Vehicle System Dynamics 11.1 (1982), 1–13. issn: 0042-3114. doi: 10.1080/00423118208968684.
[56] J. J. Kalker. The computation of three-dimensional rolling contact with dry friction.International Journal for Numerical Methods in Engineering 14.9 (1979), 1293–1307. issn: 0029-5981. doi: 10.1002/nme.1620140904.
[57] J. J. Kalker. Three-dimensional elastic bodies in rolling contact. Vol. 2. Dordrecht:Kluwer, 1990. 314 pp. isbn: 9780792307129.
[58] J. J. Kalker. Wheel-rail rolling contact theory. Wear 144.1 (1991), 243–261. issn:0043-1648. doi: 10.1016/0043-1648(91)90018-P.
[59] M. Kaneta et al. A possible mechanism for rail dark spot defects. Journal ofTribology 120.2 (1998), 304–309.
[60] D. P. Koistinen and R. E. Marburger. A general equation prescribing the extent ofthe austenite-martensite transformation in pure iron-carbon alloys and plain carbonsteels. Acta Metallurgica 7.1 (1959), 59–60. issn: 0001-6160. doi: 10.1016/0001-6160(59)90170-1.
49

[61] K. Kondo, K. Yoroizaka, and Y. Sato. Cause, increase, diagnosis, countermeasuresand elimination of Shinkansen shelling. Wear 191.1 (1996), 199–203. issn: 0043-1648. doi: 10.1016/0043-1648(95)06727-2.
[62] M. Kuna. Finite Elements in Fracture Mechanics: Theory - Numerics - Applications.Vol. 201. Dordrecht: Springer Netherlands, 2013. 447 pp. isbn: 9789400766792.
[63] R. Lewis and U. Olofsson, eds. Wheel–rail interface handbook. Cambridge: Wood-head Publishing, 2009. 842 pp. isbn: 9781439801468.
[64] Z. Li et al. Squat growth—Some observations and the validation of numericalpredictions. Wear 271.1-2 (2011), 148–157. doi: 10.1016/j.wear.2010.10.051.
[65] Z. Li et al. Differential wear and plastic deformation as causes of squat at tracklocal stiffness change combined with other track short defects. Vehicle SystemDynamics 46.S1 (2008), 237–246. doi: 10.1080/00423110801935855.
[66] Z. Li et al. An investigation into the causes of squats-Correlation analysis andnumerical modeling. Wear 265.9-10 (2008), 1349–1355. doi: 10.1016/j.wear.2008.02.037.
[67] M. Molodova et al. Validation of a finite element model for axle box acceleration atsquats in the high frequency range. Computers and Structures 141 (2014), 84–93.doi: 10.1016/j.compstruc.2014.05.005.
[68] M. Molodova et al. Automatic detection of squats in railway infrastructure. IEEETransactions on Intelligent Transportation Systems 15.5 (2014), 1980–1990. doi:10.1109/TITS.2014.2307955.
[69] M. Molodova et al. Parametric study of axle box acceleration at squats. Proceedingsof the Institution of Mechanical Engineers, Part F: Journal of Rail and RapidTransit 229.8 (2015), 841–851. issn: 0954-4097. doi: 10.1177/0954409714523583.
[70] N. Moës, J. Dolbow, and T. Belytschko. A finite element method for crack growthwithout remeshing. International Journal for Numerical Methods in Engineering46.1 (1999), 131–150.
[71] M. Naeimi et al. Thermomechanical analysis of the wheel-rail contact using acoupled modelling procedure. Tribology International 117 (2018), 250–260. doi:10.1016/j.triboint.2017.09.010.
[72] M. Naeimi, Z. Li, and R. Dollevoet. Nucleation of squat cracks in rail, calculation ofcrack initiation angles in three dimensions. Journal of Physics: Conference Series628.1 (2015). issn: 1742-6588. doi: 10.1088/1742-6596/628/1/012043.
[73] S. Pal et al. Metallurgical and physical understanding of rail squat initiation andpropagation. Wear 284-285 (2012), 30–42. doi: s10.1016/j.wear.2012.02.013.
[74] S. Pal, W. J. T. Daniel, and M. Farjoo. Early stages of rail squat formation and therole of a white etching layer. International Journal of Fatigue 52 (2013), 144–156.issn: 0142-1123. doi: 10.1016/j.ijfatigue.2013.02.016.
[75] P. C. Paris, M. P. Gomez, and W. E. Anderson. A rational analytic theory offatigue. The trend in engineering 13.1 (1961), 9–14.
[76] A. Pieringer. “Time-domain modelling of high-frequency wheel/rail interaction”.PhD thesis. Gothenburg, Sweden: Chalmers University of Technology, 2011. 107 pp.
[77] Rail defects. 4th ed. UIC Code 712. Paris: International Union of Railways, 2002.107 pp. isbn: 2-7461-0341-9.
50

[78] J. R. Rice. A path independent integral and approximate analysis of strain con-centration by notches and cracks. Journal of Applied Mechanics 35.2 (1968), 379–386.
[79] J. W. Ringsberg. Life prediction of rolling contact fatigue crack initiation. Inter-national Journal of Fatigue 23.7 (2001), 575–586. doi: 10.1016/S0142-1123(01)00024-X.
[80] R. J. Sanford and J. W. Dally. A general method for determining mixed-modestress intensity factors from isochromatic fringe patterns. Engineering FractureMechanics 11.4 (1979), 621–633. issn: 0013-7944.
[81] D. Scott, D. I. Fletcher, and B. J. Cardwell. Simulation study of thermally initiatedrail defects. Proceedings of the Institution of Mechanical Engineers, Part F: Journalof Rail and Rapid Transit 228.2 (2014), 113–127. issn: 0954-4097. doi: 10.1177/0954409712465697.
[82] M. Shahzamanian Sichani. “On Efficient Modelling of Wheel-Rail Contact in VehicleDynamics Simulation”. PhD thesis. Stockholm, Sweden: KTH Royal Institute ofTechnology, 2016. 97 pp.
[83] C. F. Shih, B. Moran, and T. Nakamura. Energy release rate along a three-dimensional crack front in a thermally stressed body. International Journal ofFracture 30.2 (1986), 79–102. issn: 0376-9429.
[84] S. Simon et al. Tribological characterization of rail squat defects. Wear 297.1-2(2013), 926–942. doi: 10.1016/j.wear.2012.11.011.
[85] W. F. Smith and J. Hashemi. Foundations of materials science and engineering.4th ed. Boston: McGraw-Hill Higher Education, 2006. 1032 pp. isbn: 0071256903.
[86] M. Steenbergen and R. Dollevoet. On the mechanism of squat formation on trainrails - Part I: Origination. International Journal of Fatigue 47 (2013), 361–372.doi: 10.1016/j.ijfatigue.2012.04.023.
[87] M. Steenbergen and R. Dollevoet. On the mechanism of squat formation on trainrails - Part II: Growth. International Journal of Fatigue 47 (2013), 373–381. doi:10.1016/j.ijfatigue.2012.04.019.
[88] M. Steenbergen. Rolling contact fatigue in relation to rail grinding. Wear 356-357(2016), 110–121. issn: 0043-1648. doi: 10.1016/j.wear.2016.03.015.
[89] R. Stock et al. Material concepts for top of rail friction management — Classifica-tion, characterisation and application. Wear 366 (2016), 225–232. issn: 0043-1648.doi: 10.1016/j.wear.2016.05.028.
[90] C. T. Sun and Z. H. Jin. Fracture mechanics. Waltham, MA: Academic Press,2012. 337 pp. isbn: 9780123850010.
[91] T. Telliskivi and U. Olofsson. Contact mechanics analysis of measured wheel-rail profiles using the finite element method. Proceedings of the Institution ofMechanical Engineers, Part F: Journal of Rail and Rapid Transit 215.2 (2001),65–72. issn: 0954-4097. doi: 10.1243/0954409011531404.
[92] O. Vargolici et al. Influence of the initial surface state of bodies in contact on theformation of white etching layers under dry sliding conditions. Wear 366 (2016),209–216. issn: 0043-1648. doi: 10.1016/j.wear.2016.06.023.
51

[93] E. A. H. Vollebregt. User guide for CONTACT, Rolling and sliding contact withfriction. Technical report TR09-03, version 17.1. VORtech BV. 2017. url: www.kalkersoftware.org.
[94] E. A. H Vollebregt and G. Segal. Solving conformal wheel-rail rolling contactproblems. Vehicle System Dynamics 52.1 (2014), 455–468. issn: 0042-3114. doi:10.1080/00423114.2014.906634.
[95] S. L. Wong et al. A branch criterion for shallow angled rolling contact fatiguecracks in rails. Wear 191.1-2 (1996), 45–53.
[96] X. Zhao et al. Local rolling contact fatigue and indentations on high-speed railwaywheels: Observations and numerical simulations. International Journal of Fatigue103 (2017), 5–16. issn: 0142-1123. doi: 10.1016/j.ijfatigue.2017.05.014.
[97] X. Zhao and Z. Li. A three-dimensional finite element solution of frictional wheel-rail rolling contact in elasto-plasticity. Proceedings of the Institution of MechanicalEngineers, Part J: Journal of Engineering Tribology 229.1 (2015), 86–100. doi:10.1177/1350650114543717.
[98] X. Zhao, Z. Li, and R. Dollevoet. Influence of the fastening modeling on thevehicle-track interaction at singular rail surface defects. Journal of Computationaland Nonlinear Dynamics 9.3 (2014). doi: 10.1115/1.4025895.
[99] X. Zhao, Z. Li, and R. Dollevoet. The vertical and the longitudinal dynamicresponses of the vehicle-track system to squat-type short wavelength irregularity.Vehicle System Dynamics 51.12 (2013), 1918–1937. doi: 10.1080/00423114.2013.847466.
[100] X. Zhao et al. A study on high-speed rolling contact between a wheel and acontaminated rail. Vehicle System Dynamics 52.10 (2014), 1270–1287. doi: 10.1080/00423114.2014.934845.
[101] X. Zhao et al. A study on dynamic stress intensity factors of rail cracks at highspeeds by a 3D explicit finite element model of rolling contact. Wear 366 (2016),60–70. issn: 0043-1648. doi: 10.1016/j.wear.2016.06.001.
[102] X. Zhao and Z. Li. The solution of frictional wheel–rail rolling contact with a 3Dtransient finite element model: Validation and error analysis. Wear 271.1 (2011),444–452. issn: 0043-1648. doi: 10.1016/j.wear.2010.10.007.
[103] O. C. Zienkiewicz and R. L. Taylor. Finite Element Method: Vol. 1: The Basis.5th ed. San Diego: Elsevier Science & Technology Books, 2000. 689 pp. isbn:9780750650496.
[104] A. Zoeteman, R. Dollevoet, and Z. Li. Dutch research results on wheel/rail interfacemanagement: 2001-2013 and beyond. Proceedings of the Institution of MechanicalEngineers, Part F: Journal of Rail and Rapid Transit 228.6 (2014), 642–651. doi:10.1177/0954409714524379.
52