sporian microsystems, inc - energy.gov - 06... · advanced ceramic materials and packaging...
TRANSCRIPT

Sporian Microsystems, Inc.www.sporian.comTPOC: Dr. Kevin HarshBPOC: Dr. Michael Usrey
Advanced Ceramic Materials and Packaging Technologies for Realizing Sensors for Concentrating Solar Power Systems.DOE SBIR programGrant #: DE‐SC0009232
April 20, 2016

2
Acknowledgement
This material is based upon SBIR work supported by the Department of Energy under
Award Number DE-SC0009232.

3
DisclaimerThis report was prepared as an account of work sponsored by an
agency of the United States Government. Neither the United States Government nor any agency thereof, nor any of their employees, makes
any warranty, express or implied, or assumes any legal liability or responsibility for the accuracy, completeness, or usefulness of any
information, apparatus, product, or process disclosed, or represents that its use would not infringe privately owned rights. Reference herein to any specific commercial product, process, or service by trade name, trademark, manufacturer, or otherwise does not necessarily constitute or imply its endorsement, recommendation, or favoring by the United States Government or any agency thereof. The views and opinions of
authors expressed herein do not necessarily state or reflect those of the United States Government or any agency thereof.

4
Overview
• Sporian Introduction
• Cross-Cutting Power Generation Sensors
• CSP Project Motivation
• Current Effort Progress Update

5
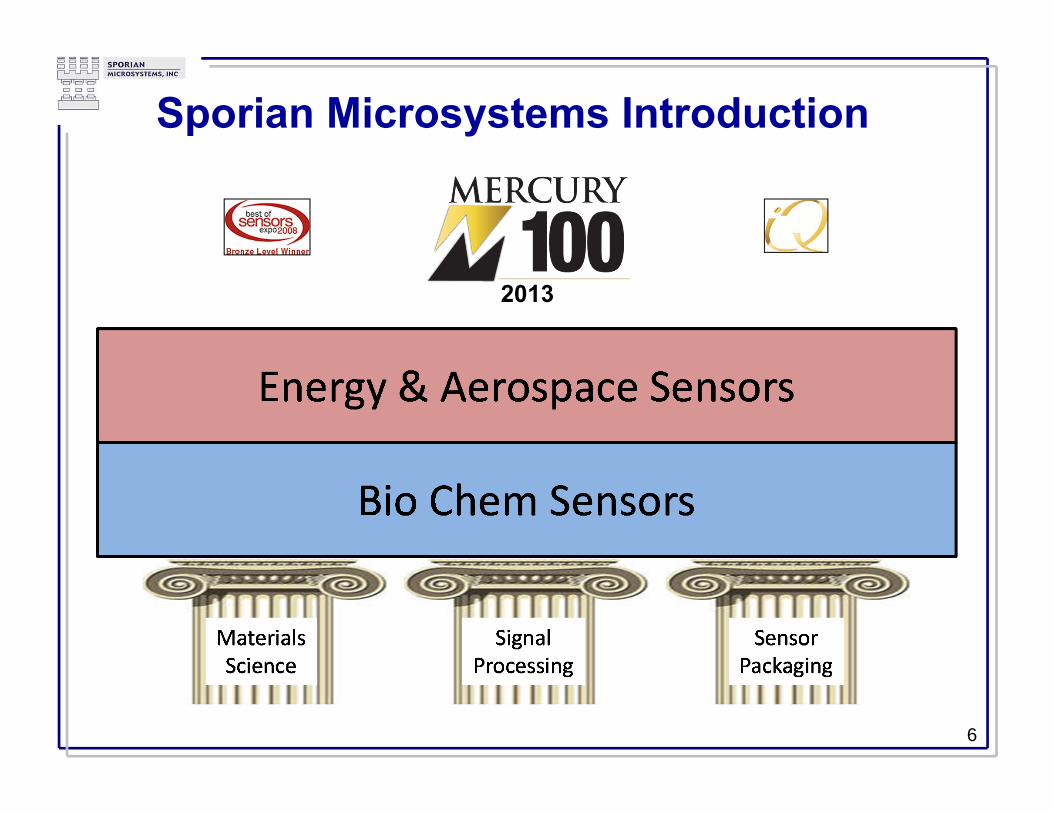
Sporian Microsystems Introduction
6
2013

Sporian Microsystems IntroductionAdvanced Sensor
Technologies• Sporian develops advanced sensors and sensor systems for a range of
applications.
Advanced Electronics &
Hardware Packaging
Leading edge signal
Conditioning & Smart Electronics
Novel Materials Science
Core Technical Competencies
Biological &Chemical
• Specific• Selective• Gas Composition• Biomedical• Hyperspectral
Imaging
Energy &Aerospace
• Very High Temperature
• Harsh Environments• Asset monitoring• Condition-Based
Maintenance
Advanced Sensor Technologies
7

8
Sporian Cross-Cutting Power Generation Sensor Technology
Pyrolysis~ 1000 oC
UV Light
Transparent Solid or film
Fully denseceramic
Cross-linking
Liquid precursor
Starting Chemicals Synthesis
PDC Synthesized by Thermal Decomposition of Polymeric Precursors
Demonstrated HT Sensor Technology: ▪ Thermo-resistive temperature sensor▪ Piezo-resistive pressure sensor▪ Capacitive based pressure sensor ▪Anemometric flow sensors
PDC Sensor
~3mm

Features, Advantages & BenefitsFeatures Advantages Benefits Polymer derived ceramic materials
• Operating temperature >1000C w/o liquid cooling or fiber routing
• Highly oxidation/corrosion resistant• Thermal shock resistant• Low creep rate & diffusion rate
• Lower weight, smaller size• Lower cost, low-maintenance• Higher durability• Higher operational availability
Temperature / pressure sensor suite
• Improved T-compensation of pressure measurements
• Opportunity for redundancy and/or sensor fusion
• Lower weight, smaller size• Higher accuracy
Immersion sensing at source
• Eliminate capillary tubes • Lower cost, higher accuracy• Lower weight• Avoid failure mechanism• Improved dynamic response
Smart signal conditioning electronics
• Compatible with existing systems• Temperature compensation• Signature analysis
• Lower cost• Higher operational availability
9
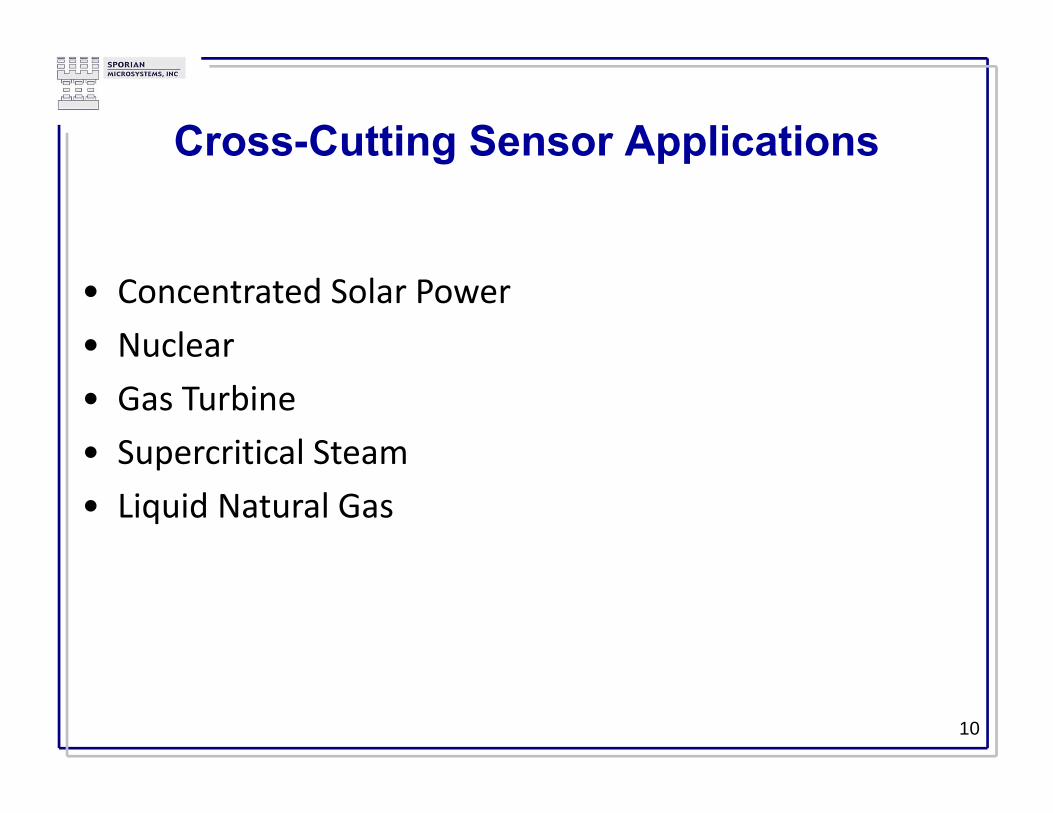
Cross-Cutting Sensor Applications
• Concentrated Solar Power• Nuclear• Gas Turbine• Supercritical Steam• Liquid Natural Gas
10
11
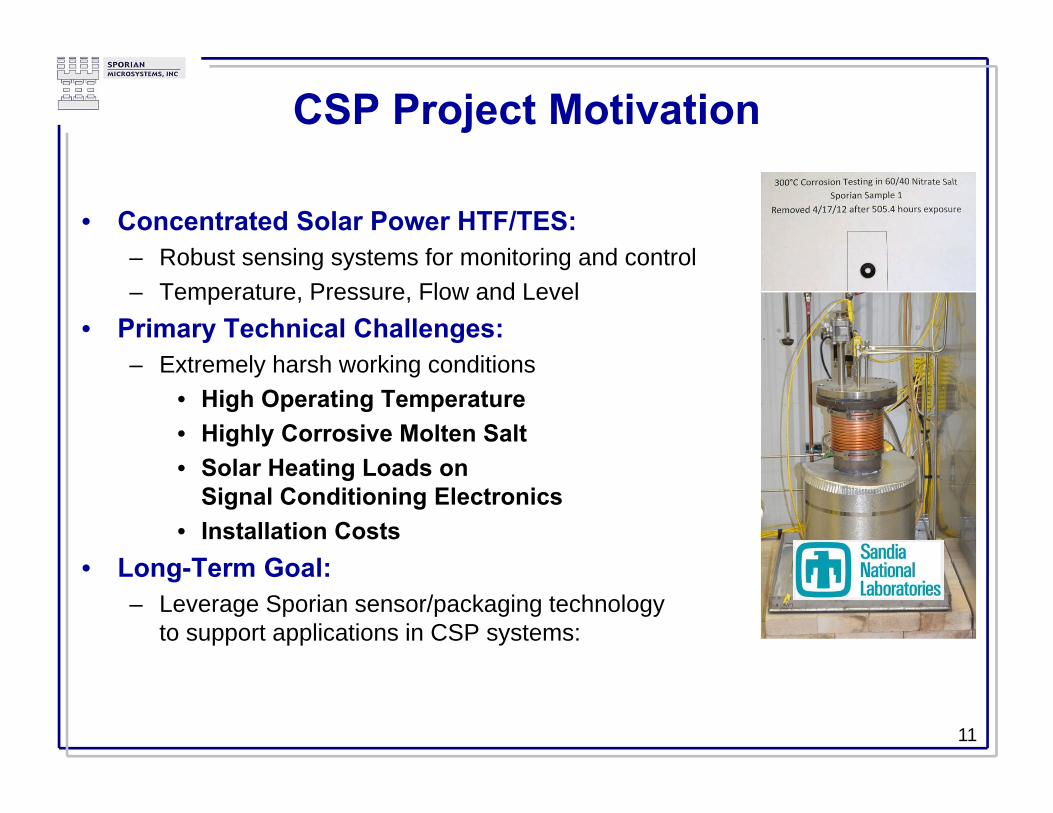
CSP Project Motivation
• Concentrated Solar Power HTF/TES:– Robust sensing systems for monitoring and control– Temperature, Pressure, Flow and Level
• Primary Technical Challenges:– Extremely harsh working conditions
• High Operating Temperature• Highly Corrosive Molten Salt• Solar Heating Loads on
Signal Conditioning Electronics• Installation Costs
• Long-Term Goal: – Leverage Sporian sensor/packaging technology
to support applications in CSP systems:

Overview of the SBIR Effort• Phase II: December 23, 2013 to June 22, 2016 • Primary PII Efforts/Tasks
– Work with Stakeholders to guide the development and facilitate transition.
– Materials compatibility– Develop designs for CSP HTF/TES fluid capable pressure/temperature
(P/T) sensor and flow/temperature (F/T) sensor.• Developed common hardware useful in range of HTF/TES fluid
– Rigorous testing of prototypes in lab scale environments.• Material HTF/TES fluid corrosion testing (sensor and packaging materials)
• Performance testing
– Revise designs and construct next generation prototypes.– Demonstration of next generation prototypes including demonstration
in OEM application relevant environment test systems.• Focus of this presentation
12

13
Stakeholder HTF Sensor Requirements
CSP Type Tower (T): 550 to 600°C. Trough (Tr): 500°C. Dish (D): 700°C. DOE EERE MURI (M): 1300°C.
Sensor Types / Location(s)
Receiver inlet and outlet: flow rate, temperature and pressure. (T, Tr, D) Steam generator inlet: flow rate and pressure. (T, Tr) Thermal energy storage tank: level. (T, Tr)
Sensor PackagingMaterials
Nickel-based superalloys (T, Tr) Stabilized austenitic stainless steel and carbon steel (T, Tr). SiC, alumina and graphite (T, Tr).
Pressure Range 0-870 psi (T, Tr). Range 290-2200 psi (D)
Mass Flow Rate 700 kg/sec (T). 30 kg/sec (Tr). <1 kg/sec (D)
I/O Signals Current: Analog signal: 0-10VDC/4-20mA. (T, Tr, D) Future: Digital output. (T, Tr, D)
System Integration
Sensors/conditioning system can be located 300-500 feet from control systems. (T, Tr, D)
Sensor system should be weather proof with heavy solar load. (T, Tr, D)

14
500hr Solar Salt Exposure Testing3 Different CSP Relevant Inorganic Salts and Test Facility in UW
HOT Fluid Mixture
M.P. [oC]
T.S.B.P. [oC]
Test T[oC]
Duration [hour]
Cp[J/g-K]
V.P. @800°C
Corrosion with SS
Cost [$/kg]
DOE’s Target 250 800 1.5 <1atm Excellent <1NaNO3 KNO3 228 600 550oC 500 hr 1.5 <1atm Good ~1K2LiNa2CO3 397 >830 650oC 500 hr 1.8 <1atm Fair ~2KCl MgCl2 426 >1418 750oC 500 hr na <0.1atm Fair ~0.2
PDC Samples before/after Cleaning
Nitrate Salt550 °C
Carbonate650 °C
Chloride Salt750 °C

15
• First test of Sporian Hardware in a flowing molten salt environment
SkyTrough® Test Schematic

16
Sporian Test HardwarePrototype Flow Sensor Prototype Pressure Sensor
Instrumented Pipe Section
Flow Sensor Element
Mounting Flange
MI Cable
Pressure Sensor Element
Temperature Compensating
Readout Electronics

17
Installed Instrumented Pipe Section
Cabling To DAQ/Electronics (Van)
Installation Location
Test Site
Photos used with permission of SkyFuel

18
Test Duration
• Sensors installed duration ‐ ~720 hours (~30 days)– Exposed to molten/flowing salt ~ 80 hours, – Solidified salt for ~630,
• 10 total cycles ambient to > 200oC • Ambient temps ranged from 2oF‐60oF

Sensor Performance• Pressure Sensors
– 2/3 survived complete. • Durability/stability demonstrated
– 1 Failed at exterior cable connector – likely due to cold/water ingress• Replaced with backup sensor mid test
– Sensors re‐tested at Sporian after loop test ‐ no noticeable difference in performance.
• Flow sensors– 4 flow sensors tested – performed to expectations. – 1 intentionally driven to failure ‐ dialing in drive power settings. – 2 failed during system down times (test days 4 and 5)
• functional at shutdown, not functional upon arrival for next day testing. • ceramic sensor cracked, believed due to solidification
19

20
Sensor Performance - Continued• Typical flow sensor data set. • Varied Pump motor drive freq.(0‐45 Hz) • No reference flow sensor available• Error bars = sensor noise & flow instability
– High frequency noise (+/‐ 0.1% of full scale) – electrical
– Low frequency noise (+/‐ 3% full scale) ‐flow instability?
‐0.7
‐0.6
‐0.5
‐0.4
‐0.3
‐0.2
‐0.1
0
0.1
0 10 20 30 40 50
Flow
Sen
sor S
igna
l Cha
nge (Ohm
s)
Pump Motor Speed (rpm)
Pump Drive Frequency (Hz)
Sporian Estimated Flow (gpm)
15 6.7 +/‐ 0.3530 12.9 +/‐ 0.3545 19.4 +/‐ 0.35

21
SkyTrough® Transient Conditions• Example flow sensor data set when system was partially obstructed
3.96
3.965
3.97
3.975
3.98
3.985
3.99
50 100 150 200 250
Sensor Signal (resistance)
Time (sec)
Pump increased from 30‐45 Hz

22
Next Steps
• SBIR Period of Performance ends June 22, 2016– Remaining effort focused on
• Hardware optimization• Lab‐scale reliability testing, particularly salt solidifacation• Additional molten salt loop testing at >500oC• Identifying additional trough/tower demonstration opportunities