s&p/jpx jgb vix® and the japanese yen: part 1 · s&p/jpx jgb vix and the japanese yen: ......
TRANSCRIPT
CONTRIBUTORS
Yoshiki Obayashi Managing Director Applied Academics yoshiki.obayashi @appliedacademics.com
John White Managing Director Applied Academics john.white @appliedacademics.com
S&P/JPX JGB VIX® and the Japanese Yen: Part 1 SCOPE OF THE PAPER
This is the first installment of a two-part empirical paper exploring the interaction between Japanese yen exchange rates and forward-looking Japanese Government Bond (JGB) volatility as measured by the S&P/JPX JGB VIX. This paper analyzes the economic interaction between interest rate volatility and FX returns and presents basic but novel empirical insights linking the two. The second installment, to be published in January 2017, will focus on the application of these insights to FX trading and risk management.
Highlights
• The S&P/JPX JGB VIX helps isolate the yield spread component of implied yen exchange rate volatility.
• 80% of implied USD/JPY volatility is explained by implied spread and Nikkei volatilities.
• Implied USD-JPY yield spread volatility has strong in-sample predictive power for USD/JPY.
CURRENT MACROECONOMIC LANDSCAPE
The introduction of quantitative and qualitative monetary easing (QQE) with yield curve control on Sept. 21, 2016, reaffirmed the Bank of Japan’s (BOJ’s) commitment to monetary easing until core CPI inflation exceeds its 2% target and maintains stability above that figure. However, many market participants suspect that the BOJ is running out of options, given the gradual reduction in their massive JGB purchase program.1 The precarious nature of the current policy framework is likely to motivate the BOJ to maintain a near-term status quo, but a surge in the yen’s value could press policymakers to act, despite their emptying toolbox. In addition, FX hedging costs are creeping higher for Japanese market participants that are considering overseas assets as an alternative to the depressed JGB yield environment; in some cases, they are already prohibitively high. This macroeconomic backdrop beams a spotlight on the interaction between JGBs and yen-based exchange rates.
1 Source: BOJ, https://www.boj.or.jp/en/mopo/measures/mkt_ope/ope_f/index.htm/ and http://www3.boj.or.jp/market/en/menu_o.htm.
This macroeconomic backdrop beams a spotlight on the interaction between JGBs and yen-based exchange rates.
RESEARCH
S&P/JPX JGB VIX and the Japanese Yen: Part 1 December 2016
FOREIGN EXCHANGE AND INTEREST RATES
The relationship between the S&P/JPX JGB VIX and yen exchange rates is best understood initially through principles linking currencies and interest rates. We begin with a review of the uncovered interest rate parity (UIP), a well-studied hypothesis that states that the interest rate differential between two currencies reflects the expected change in their exchange rate. The UIP therefore provides an interpretation of exchange rate risk, measured by volatility, as the sum of interest rate spread risk and a risk premium. This decomposition sets the stage for the S&P/JPX JGB VIX to shine as part of a forward-looking measure for the interest rate spread component of yen exchange rate risk, which appears to possess distinct predictive properties.
Uncovered Interest Rate Parity
The UIP hypothesizes that if two currencies have different interest rates, market participants on aggregate must expect the higher-yielding currency to depreciate and offset the yield spread over the relevant horizon. If this were not true, the theory surmises that rational market participants would then sell the lower-yielding currency against the other to earn positive expected returns and push the spot rate until the UIP was restored.
This framework also accommodates the existence of a risk premium for bearing exposure to certain exchange rates. A “safe haven” currency like the yen that is expected to appreciate sharply during “bad times” (for example, a global financial crisis) is likely to have a negative risk premium, because market participants on the other side of the trade are likely to demand payment to provide such insurance-like payoffs. In the presence of a risk premium, the expected depreciation of the higher-yielding currency need not completely offset the yield differential.
The UIP can be stated concisely as:
Expected Change in Spot Rate = Yield Differential + Risk Premium
An econometrically rigorous treatment of the UIP is complicated and beyond the scope of this paper, but for our present purposes, we will consider interest rate spreads and time-varying risk premia as the primary drivers of FX risk, based on the UIP hypothesis.
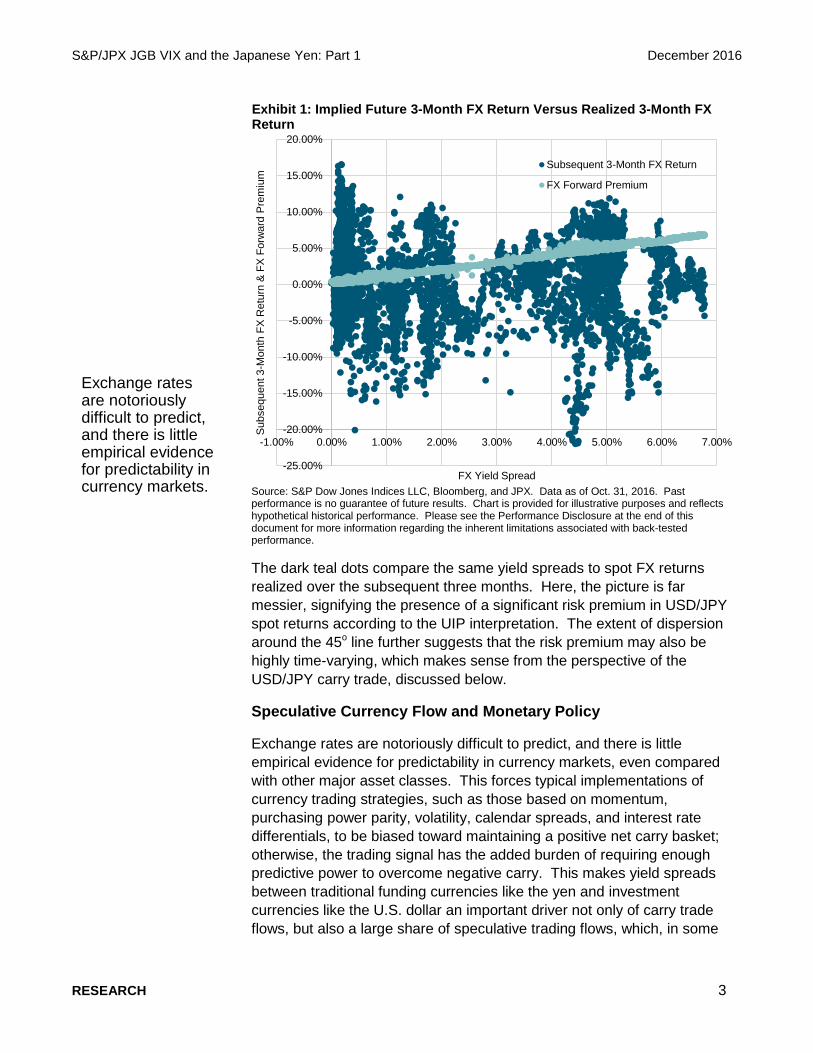
Exhibit 1 shows two sets of points to illustrate how the relationship between foreign exchange and interest rates is at once tight (covered interest rate parity [CIP]), but also complicated (UIP). The light blue dots show the relationship between the 3-month USD-JPY yield spread and the future spot return implied by the 3-month forward FX price. The two fall on a nearly straight line, as predicted by the CIP, which is a stronger condition than the UIP and largely enforceable by no-arbitrage, making it immune to the elusive forces of a risk premium.
This framework also accommodates the existence of a risk premium for bearing exposure to certain exchange rates.
RESEARCH 2
S&P/JPX JGB VIX and the Japanese Yen: Part 1 December 2016
Exhibit 1: Implied Future 3-Month FX Return Versus Realized 3-Month FX Return
Source: S&P Dow Jones Indices LLC, Bloomberg, and JPX. Data as of Oct. 31, 2016. Past performance is no guarantee of future results. Chart is provided for illustrative purposes and reflects hypothetical historical performance. Please see the Performance Disclosure at the end of this document for more information regarding the inherent limitations associated with back-tested performance.
The dark teal dots compare the same yield spreads to spot FX returns realized over the subsequent three months. Here, the picture is far messier, signifying the presence of a significant risk premium in USD/JPY spot returns according to the UIP interpretation. The extent of dispersion around the 45o line further suggests that the risk premium may also be highly time-varying, which makes sense from the perspective of the USD/JPY carry trade, discussed below.
Speculative Currency Flow and Monetary Policy
Exchange rates are notoriously difficult to predict, and there is little empirical evidence for predictability in currency markets, even compared with other major asset classes. This forces typical implementations of currency trading strategies, such as those based on momentum, purchasing power parity, volatility, calendar spreads, and interest rate differentials, to be biased toward maintaining a positive net carry basket; otherwise, the trading signal has the added burden of requiring enough predictive power to overcome negative carry. This makes yield spreads between traditional funding currencies like the yen and investment currencies like the U.S. dollar an important driver not only of carry trade flows, but also a large share of speculative trading flows, which, in some
-25.00%
-20.00%
-15.00%
-10.00%
-5.00%
0.00%
5.00%
10.00%
15.00%
20.00%
-1.00% 0.00% 1.00% 2.00% 3.00% 4.00% 5.00% 6.00% 7.00%
Sub
sequ
ent 3
-Mon
th F
X R
etur
n &
FX
Forw
ard
Pre
miu
m
FX Yield Spread
Subsequent 3-Month FX Return
FX Forward Premium
Exchange rates are notoriously difficult to predict, and there is little empirical evidence for predictability in currency markets.
RESEARCH 3
S&P/JPX JGB VIX and the Japanese Yen: Part 1 December 2016
significant but nebulous way, interacts with the more fundamental UIP hypothesis.
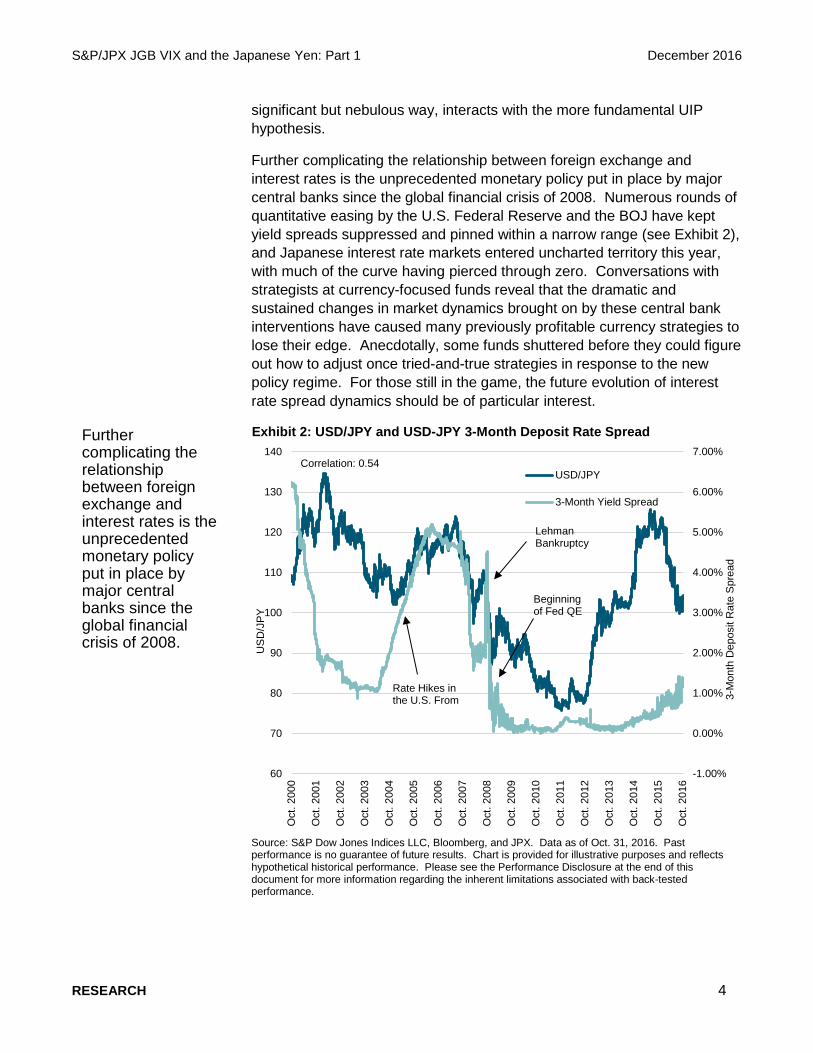
Further complicating the relationship between foreign exchange and interest rates is the unprecedented monetary policy put in place by major central banks since the global financial crisis of 2008. Numerous rounds of quantitative easing by the U.S. Federal Reserve and the BOJ have kept yield spreads suppressed and pinned within a narrow range (see Exhibit 2), and Japanese interest rate markets entered uncharted territory this year, with much of the curve having pierced through zero. Conversations with strategists at currency-focused funds reveal that the dramatic and sustained changes in market dynamics brought on by these central bank interventions have caused many previously profitable currency strategies to lose their edge. Anecdotally, some funds shuttered before they could figure out how to adjust once tried-and-true strategies in response to the new policy regime. For those still in the game, the future evolution of interest rate spread dynamics should be of particular interest.
Exhibit 2: USD/JPY and USD-JPY 3-Month Deposit Rate Spread
Source: S&P Dow Jones Indices LLC, Bloomberg, and JPX. Data as of Oct. 31, 2016. Past performance is no guarantee of future results. Chart is provided for illustrative purposes and reflects hypothetical historical performance. Please see the Performance Disclosure at the end of this document for more information regarding the inherent limitations associated with back-tested performance.
-1.00%
0.00%
1.00%
2.00%
3.00%
4.00%
5.00%
6.00%
7.00%
60
70
80
90
100
110
120
130
140
Oct
. 200
0
Oct
. 200
1
Oct
. 200
2
Oct
. 200
3
Oct
. 200
4
Oct
. 200
5
Oct
. 200
6
Oct
. 200
7
Oct
. 200
8
Oct
. 200
9
Oct
. 201
0
Oct
. 201
1
Oct
. 201
2
Oct
. 201
3
Oct
. 201
4
Oct
. 201
5
Oct
. 201
6
3-M
onth
Dep
osit
Rat
e S
prea
d
US
D/J
PY
USD/JPY
3-Month Yield Spread
Rate Hikes in the U.S. From
Correlation: 0.54
Lehman Bankruptcy
Beginning of Fed QE
Further complicating the relationship between foreign exchange and interest rates is the unprecedented monetary policy put in place by major central banks since the global financial crisis of 2008.
RESEARCH 4
S&P/JPX JGB VIX and the Japanese Yen: Part 1 December 2016
FOREIGN EXCHANGE AND INTEREST RATE VOLATILITY
The exposition up to this point is a mere snapshot of an already well-established empirical literature regarding the economic linkage between FX returns and interest rates; however, much less has been written about the relationship between their respective volatilities or any predictive power they may possess with respect to currency returns. This is in contrast to the rich body of research and investable products that use equity implied volatility, namely the CBOE VIX Index®, as a market-timing signal. Perhaps this disparity exists in part because the VIX series of benchmark volatility indices has only recently been expanded to fixed income markets.
A study by Della Corte, Ramadorai, and Sarno (2016) touches on a related theme, finding cross-sectional FX return predictability in currency variance risk premia among G10 currencies. An industry piece by Merrill Lynch titled “Yen Volatility Nexus” (2006) also looks at the relationship between FX volatility and returns; it uses yield spread adjusted by implied FX volatility as a signal to time the USD/JPY carry trade. Neither study considers predictability from an isolation of the yield spread component of FX volatility, which is the focus of this paper.
While we provide no rigorous theoretical justification as to why the isolation of yield spread volatility may help predict currency returns, the empirical results outlined below provide compelling insights when interpreted through the lens of the various roles played by interest rates in currency markets, as discussed in previous sections.
Historical Realized Volatility
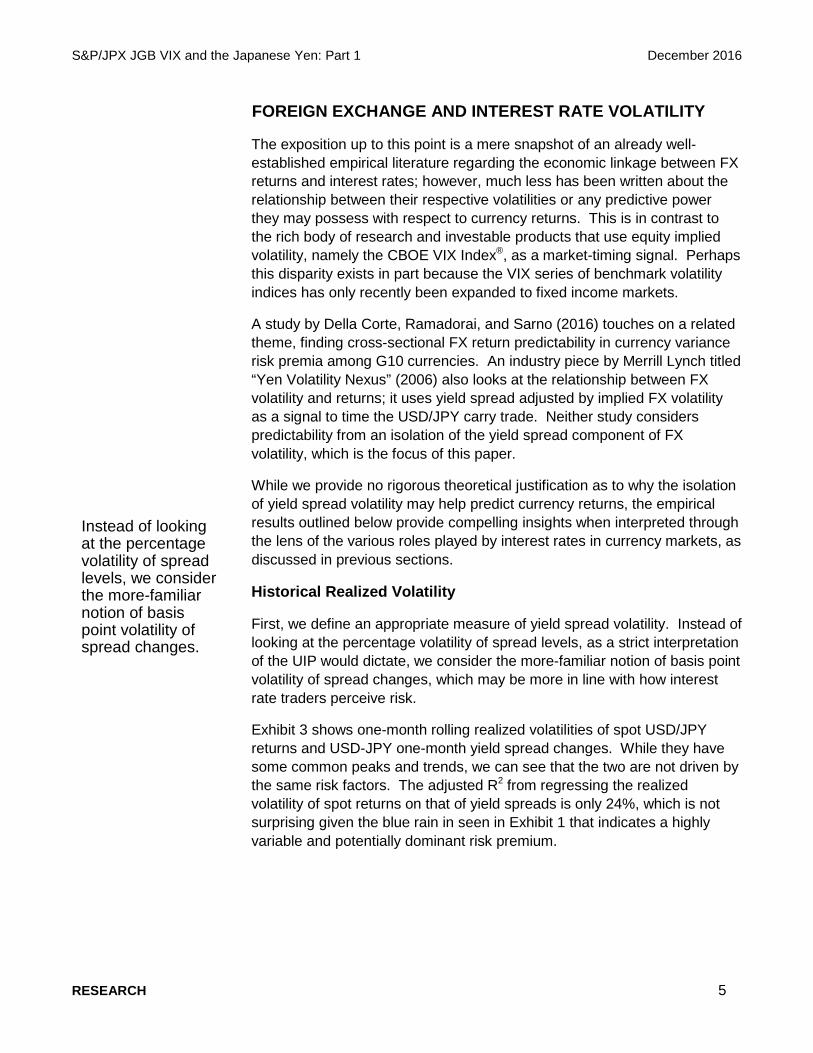
First, we define an appropriate measure of yield spread volatility. Instead of looking at the percentage volatility of spread levels, as a strict interpretation of the UIP would dictate, we consider the more-familiar notion of basis point volatility of spread changes, which may be more in line with how interest rate traders perceive risk.
Exhibit 3 shows one-month rolling realized volatilities of spot USD/JPY returns and USD-JPY one-month yield spread changes. While they have some common peaks and trends, we can see that the two are not driven by the same risk factors. The adjusted R2 from regressing the realized volatility of spot returns on that of yield spreads is only 24%, which is not surprising given the blue rain in seen in Exhibit 1 that indicates a highly variable and potentially dominant risk premium.
Instead of looking at the percentage volatility of spread levels, we consider the more-familiar notion of basis point volatility of spread changes.
RESEARCH 5
S&P/JPX JGB VIX and the Japanese Yen: Part 1 December 2016
Exhibit 3: Realized Spread Basis Point Volatility Versus Realized FX Spot Volatility
Source: S&P Dow Jones Indices LLC, Bloomberg, and JPX. Data as of Oct. 31, 2016. Past performance is no guarantee of future results. Chart is provided for illustrative purposes and reflects hypothetical historical performance. Please see the Performance Disclosure at the end of this document for more information regarding the inherent limitations associated with back-tested performance.
Yield Spread Implied Volatility Measure
Having empirically confirmed our intuition that yield spread volatility has risk drivers distinct from overall FX volatility, we now construct a forward-looking measure of spread volatility by leveraging the growing series of VIX indices across asset classes and regions. The VIX series of options-implied volatility measures differ from realized volatility and model-driven volatility forecasts in that they seek to track the fair market value of future volatility.
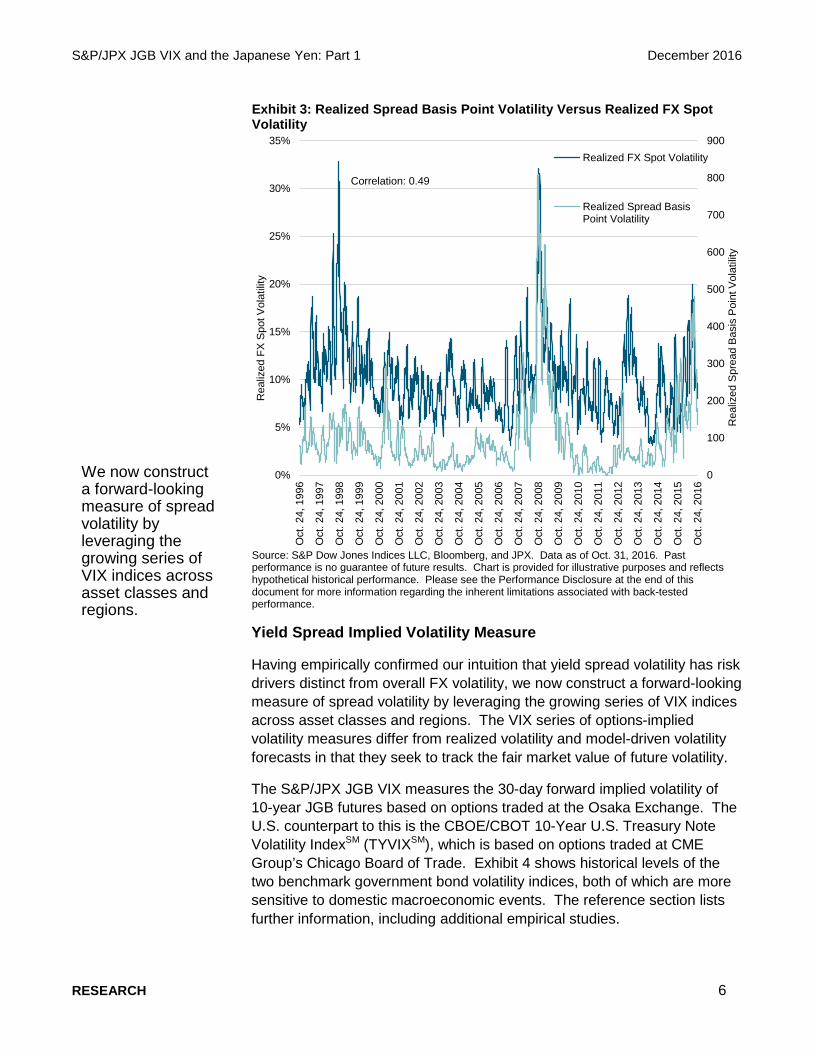
The S&P/JPX JGB VIX measures the 30-day forward implied volatility of 10-year JGB futures based on options traded at the Osaka Exchange. The U.S. counterpart to this is the CBOE/CBOT 10-Year U.S. Treasury Note Volatility IndexSM (TYVIXSM), which is based on options traded at CME Group’s Chicago Board of Trade. Exhibit 4 shows historical levels of the two benchmark government bond volatility indices, both of which are more sensitive to domestic macroeconomic events. The reference section lists further information, including additional empirical studies.
0
100
200
300
400
500
600
700
800
900
0%
5%
10%
15%
20%
25%
30%
35%
Oct
. 24,
199
6
Oct
. 24,
199
7
Oct
. 24,
199
8
Oct
. 24,
199
9
Oct
. 24,
200
0
Oct
. 24,
200
1
Oct
. 24,
200
2
Oct
. 24,
200
3
Oct
. 24,
200
4
Oct
. 24,
200
5
Oct
. 24,
200
6
Oct
. 24,
200
7
Oct
. 24,
200
8
Oct
. 24,
200
9
Oct
. 24,
201
0
Oct
. 24,
201
1
Oct
. 24,
201
2
Oct
. 24,
201
3
Oct
. 24,
201
4
Oct
. 24,
201
5
Oct
. 24,
201
6
Rea
lized
Spr
ead
Bas
is P
oint
Vol
atili
ty
Rea
lized
FX
Spo
t Vol
atili
ty
Realized FX Spot Volatility
Realized Spread BasisPoint Volatility
Correlation: 0.49
We now construct a forward-looking measure of spread volatility by leveraging the growing series of VIX indices across asset classes and regions.
RESEARCH 6
S&P/JPX JGB VIX and the Japanese Yen: Part 1 December 2016
Exhibit 4: TYVIX Versus S&P/JPX JGB VIX
Source: S&P Dow Jones Indices LLC, Bloomberg, and JPX. Data as of Oct. 31, 2016. Past performance is no guarantee of future results. Chart is provided for illustrative purposes and reflects hypothetical historical performance. Please see the Performance Disclosure at the end of this document for more information regarding the inherent limitations associated with back-tested performance.
Before we mix these two ingredients together to calculate an implied volatility measure for yield spreads (SpIV), we convert the unit of the S&P/JPX JGB VIX and TYVIX from percentage price volatility to basis point yield volatility, which measures the expected volatility of bond yields, instead of price. While there are many ways to model this conversion, we use the following simple approximation assuming minimal switch risk of the cheapest-to–deliver (CTD) bond.
• Basis point yield volatility = 100 x percentage price volatility / modified duration
0
2
4
6
8
10
12
14
16
Jan.
15,
200
8M
ay. 1
5, 2
008
Sep.
15,
200
8Ja
n. 1
5, 2
009
May
. 15,
200
9Se
p. 1
5, 2
009
Jan.
15,
201
0M
ay. 1
5, 2
010
Sep.
15,
201
0Ja
n. 1
5, 2
011
May
. 15,
201
1Se
p. 1
5, 2
011
Jan.
15,
201
2M
ay. 1
5, 2
012
Sep.
15,
201
2Ja
n. 1
5, 2
013
May
. 15,
201
3Se
p. 1
5, 2
013
Jan.
15,
201
4M
ay. 1
5, 2
014
Sep.
15,
201
4Ja
n. 1
5, 2
015
May
. 15,
201
5Se
p. 1
5, 2
015
Jan.
15,
201
6M
ay. 1
5, 2
016
Sep.
15,
201
6
Inde
x Le
vel (
%)
TYVIX
S&P/JPX JGB VIX
Lehman Bankruptcy
Tohoku Earthquake
BOJ Stimulus / Bond Purchase
First ever: 10-Year JGB Negative Yield Close
Black Monday: Day after S&P Global Ratings downgrades U.S. debt rating
U.S. Treasuries sell off heavily, May 29, 2009
The basis point yield volatility formulations allow us to construct a forward-looking gauge of the basis point USD-JPY yield spread volatility.
RESEARCH 7
S&P/JPX JGB VIX and the Japanese Yen: Part 1 December 2016
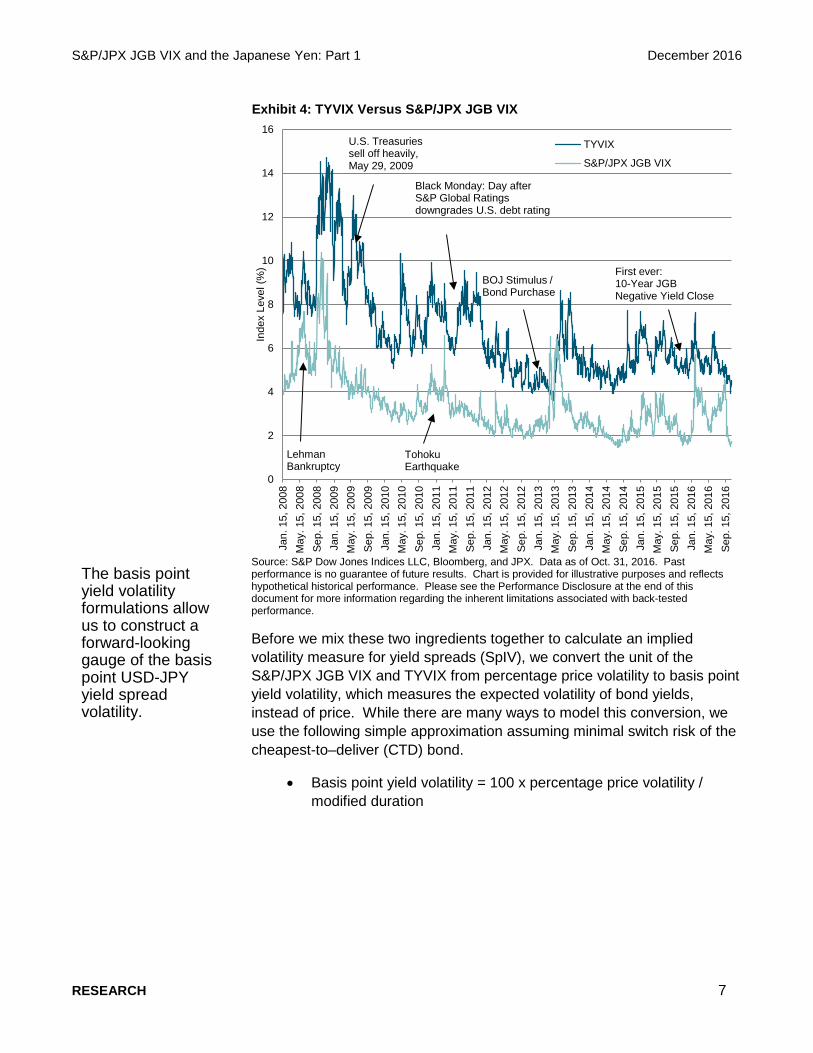
The basis point yield volatility formulations allow us to construct a forward-looking gauge of the basis point USD-JPY yield spread volatility from the previous section.
SpIV = 100 × �Var�Δ(y$ − y¥)�
= 100 × �Var(Δy$)− 2Cov(Δy$,Δy¥) + Var(Δ_y¥)
= 100 × ��TYVIX
DTY�2− 2
TYVIXDTY
JGBVIXDJGB
ρ + �JGBVIX
DJGB�2
where DTY and DJGB are the modified durations of the CTD bonds into the Treasury and JGB futures contracts, respectively, and ρ is the correlation between the CTD yield changes Δy$ and y¥. For ρ, as there are no traded options that allow us to estimate a model-independent implied correlation, we use a rolling six-month correlation of realized CTD yield changes as an ad hoc proxy.
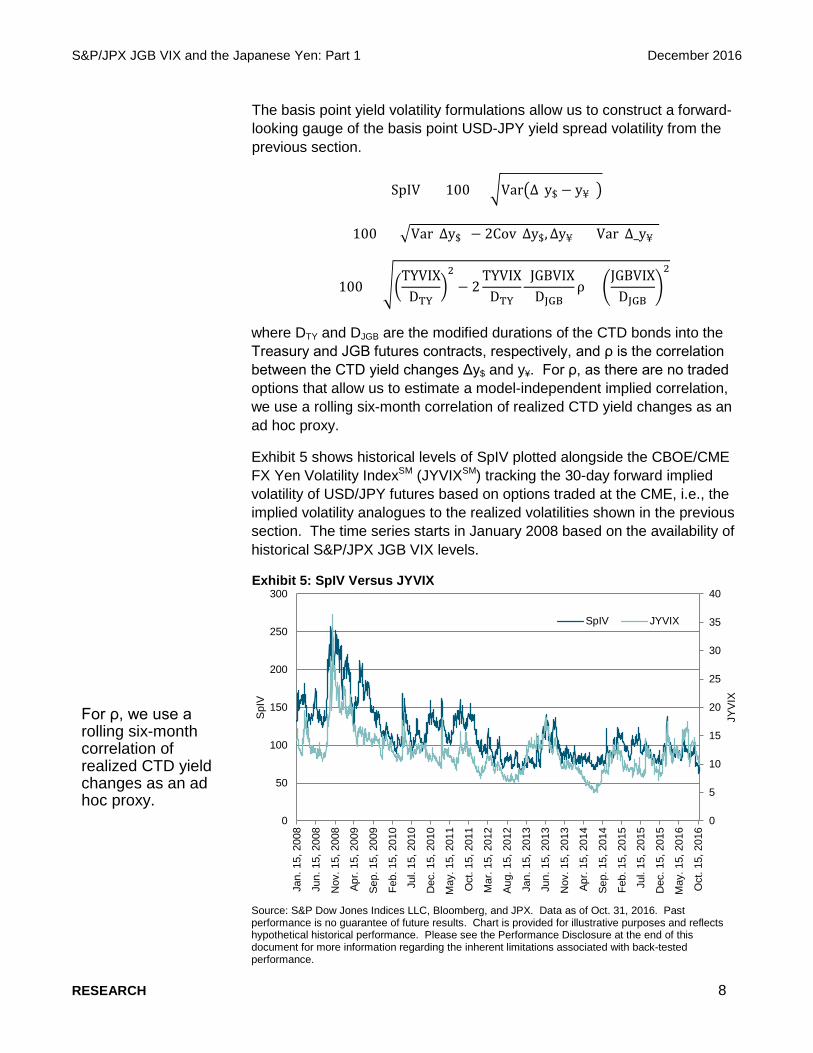
Exhibit 5 shows historical levels of SpIV plotted alongside the CBOE/CME FX Yen Volatility IndexSM (JYVIXSM) tracking the 30-day forward implied volatility of USD/JPY futures based on options traded at the CME, i.e., the implied volatility analogues to the realized volatilities shown in the previous section. The time series starts in January 2008 based on the availability of historical S&P/JPX JGB VIX levels.
Exhibit 5: SpIV Versus JYVIX
Source: S&P Dow Jones Indices LLC, Bloomberg, and JPX. Data as of Oct. 31, 2016. Past performance is no guarantee of future results. Chart is provided for illustrative purposes and reflects hypothetical historical performance. Please see the Performance Disclosure at the end of this document for more information regarding the inherent limitations associated with back-tested performance.
0
5
10
15
20
25
30
35
40
0
50
100
150
200
250
300
Jan.
15,
200
8
Jun.
15,
200
8
Nov
. 15,
200
8
Apr.
15, 2
009
Sep.
15,
200
9
Feb.
15,
201
0
Jul.
15, 2
010
Dec
. 15,
201
0
May
. 15,
201
1
Oct
. 15,
201
1
Mar
. 15,
201
2
Aug.
15,
201
2
Jan.
15,
201
3
Jun.
15,
201
3
Nov
. 15,
201
3
Apr.
15, 2
014
Sep.
15,
201
4
Feb.
15,
201
5
Jul.
15, 2
015
Dec
. 15,
201
5
May
. 15,
201
6
Oct
. 15,
201
6
JYV
IX
SpI
V
SpIV JYVIX
For ρ, we use a rolling six-month correlation of realized CTD yield changes as an ad hoc proxy.
RESEARCH 8
S&P/JPX JGB VIX and the Japanese Yen: Part 1 December 2016
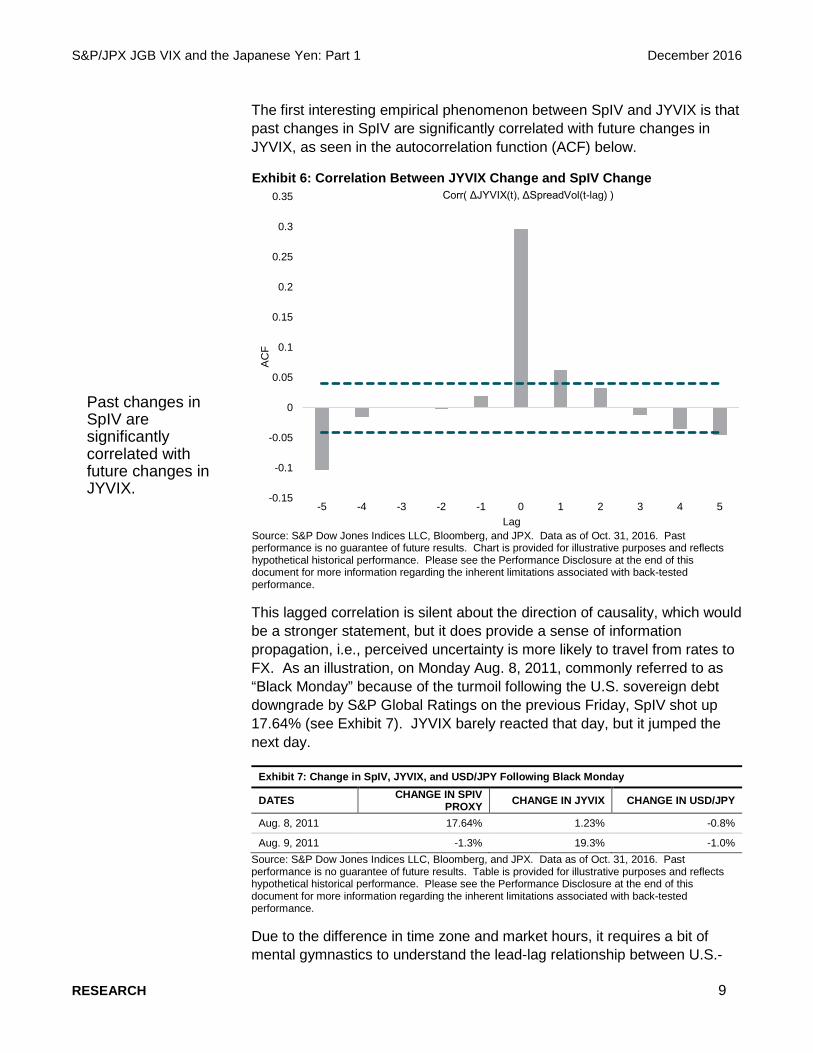
The first interesting empirical phenomenon between SpIV and JYVIX is that past changes in SpIV are significantly correlated with future changes in JYVIX, as seen in the autocorrelation function (ACF) below.
Exhibit 6: Correlation Between JYVIX Change and SpIV Change
Source: S&P Dow Jones Indices LLC, Bloomberg, and JPX. Data as of Oct. 31, 2016. Past performance is no guarantee of future results. Chart is provided for illustrative purposes and reflects hypothetical historical performance. Please see the Performance Disclosure at the end of this document for more information regarding the inherent limitations associated with back-tested performance.
This lagged correlation is silent about the direction of causality, which would be a stronger statement, but it does provide a sense of information propagation, i.e., perceived uncertainty is more likely to travel from rates to FX. As an illustration, on Monday Aug. 8, 2011, commonly referred to as “Black Monday” because of the turmoil following the U.S. sovereign debt downgrade by S&P Global Ratings on the previous Friday, SpIV shot up 17.64% (see Exhibit 7). JYVIX barely reacted that day, but it jumped the next day.
Exhibit 7: Change in SpIV, JYVIX, and USD/JPY Following Black Monday
DATES CHANGE IN SPIV PROXY CHANGE IN JYVIX CHANGE IN USD/JPY
Aug. 8, 2011 17.64% 1.23% -0.8%
Aug. 9, 2011 -1.3% 19.3% -1.0% Source: S&P Dow Jones Indices LLC, Bloomberg, and JPX. Data as of Oct. 31, 2016. Past performance is no guarantee of future results. Table is provided for illustrative purposes and reflects hypothetical historical performance. Please see the Performance Disclosure at the end of this document for more information regarding the inherent limitations associated with back-tested performance.
Due to the difference in time zone and market hours, it requires a bit of mental gymnastics to understand the lead-lag relationship between U.S.-
-0.15
-0.1
-0.05
0
0.05
0.1
0.15
0.2
0.25
0.3
0.35
-5 -4 -3 -2 -1 0 1 2 3 4 5
AC
F
Lag
Corr( ΔJYVIX(t), ΔSpreadVol(t-lag) )
Past changes in SpIV are significantly correlated with future changes in JYVIX.
RESEARCH 9
S&P/JPX JGB VIX and the Japanese Yen: Part 1 December 2016
and Japan-based indices. The S&P/JPX JGB VIX is calculated during Japan market hours and TYVIX and JYVIX are calculated during U.S. market hours, so we are able to record all relevant data needed at the U.S. close to observe SpIV and JYVIX simultaneously without generating spurious correlations from asynchronous data.
Regression Analysis
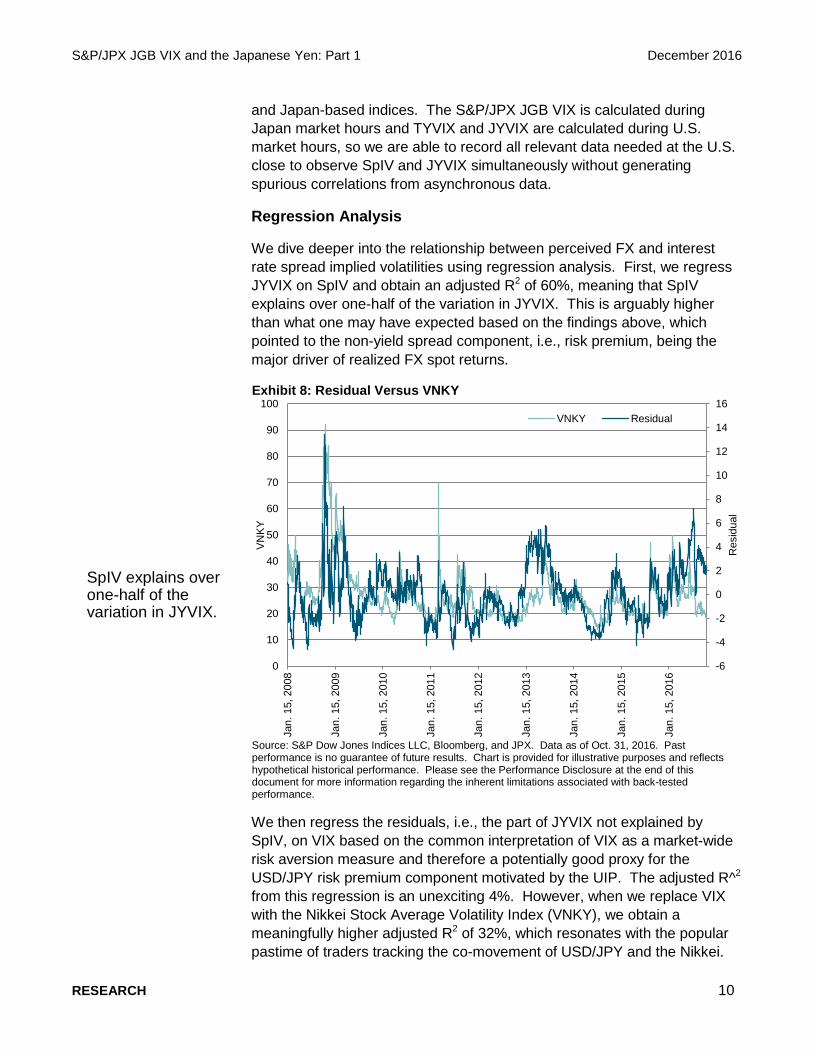
We dive deeper into the relationship between perceived FX and interest rate spread implied volatilities using regression analysis. First, we regress JYVIX on SpIV and obtain an adjusted R2 of 60%, meaning that SpIV explains over one-half of the variation in JYVIX. This is arguably higher than what one may have expected based on the findings above, which pointed to the non-yield spread component, i.e., risk premium, being the major driver of realized FX spot returns.
Exhibit 8: Residual Versus VNKY
Source: S&P Dow Jones Indices LLC, Bloomberg, and JPX. Data as of Oct. 31, 2016. Past performance is no guarantee of future results. Chart is provided for illustrative purposes and reflects hypothetical historical performance. Please see the Performance Disclosure at the end of this document for more information regarding the inherent limitations associated with back-tested performance.
We then regress the residuals, i.e., the part of JYVIX not explained by SpIV, on VIX based on the common interpretation of VIX as a market-wide risk aversion measure and therefore a potentially good proxy for the USD/JPY risk premium component motivated by the UIP. The adjusted R^2 from this regression is an unexciting 4%. However, when we replace VIX with the Nikkei Stock Average Volatility Index (VNKY), we obtain a meaningfully higher adjusted R2 of 32%, which resonates with the popular pastime of traders tracking the co-movement of USD/JPY and the Nikkei.
-6
-4
-2
0
2
4
6
8
10
12
14
16
0
10
20
30
40
50
60
70
80
90
100
Jan.
15,
200
8
Jan.
15,
200
9
Jan.
15,
201
0
Jan.
15,
201
1
Jan.
15,
201
2
Jan.
15,
201
3
Jan.
15,
201
4
Jan.
15,
201
5
Jan.
15,
201
6
Res
idua
l
VN
KY
VNKY Residual
SpIV explains over one-half of the variation in JYVIX.
RESEARCH 10
S&P/JPX JGB VIX and the Japanese Yen: Part 1 December 2016
Theories abound as to why USD/JPY and the Nikkei appear so intertwined, mostly based on fund flow arguments, but we will leave that discussion for another time.
For good measure, we throw both SpIV and VNKY into a multiple regression and obtain an adjusted R^2 of 78%. Thus, we conclude that implied interest rate spreads and Japanese equity volatilities explain the majority of implied FX volatility. One caveat here is that the S&P/JPXJGB VIX and TYVIX both track the 30-day implied volatilities of 10-year bond futures, and these relationships may vary as one moves across the interest rate volatility surface, so the results reported here should be interpreted with restricted generality.
SpIV and USD/JPY Returns
Now we get to the most intriguing empirical property of SpIV to be uncovered in this paper—its ability to predict in-sample FX returns using a parsimonious signal design that was inspired by the Stabilis family of volatility-based asset rotation strategies, which uses implied volatility indices to define regimes. The regimes are defined by upward and downward crossings of six-month rolling quantile bands of the signal; in this case, we define a “high” regime when the signal crosses the 60th percentile from below and a “low” regime when it crosses the 40th percentile from above. The objective is to study whether SpIV-based regimes have the ability to separate FX returns.
Building on the piece by Merrill Lynch (2006), we construct regimes based on various risk-adjusted yield spread signals. The authors’ original rationale for dividing by implied FX volatility was that, in a traditional carry trade, the interest rate differential is locked in and the residual risk is the depreciation of the higher-yielding currency. Therefore, when FX volatility-adjusted spread is high, more market participants are likely to enter the trade and put downward pressure on the yen. We agree with this rationale, but we also believe that it does not preclude yield spread volatility from having distinct predictive power for spot or carry returns, since yield spreads interact with exchange rates through many channels besides a buy-and-hold carry trade mechanism, as discussed above.
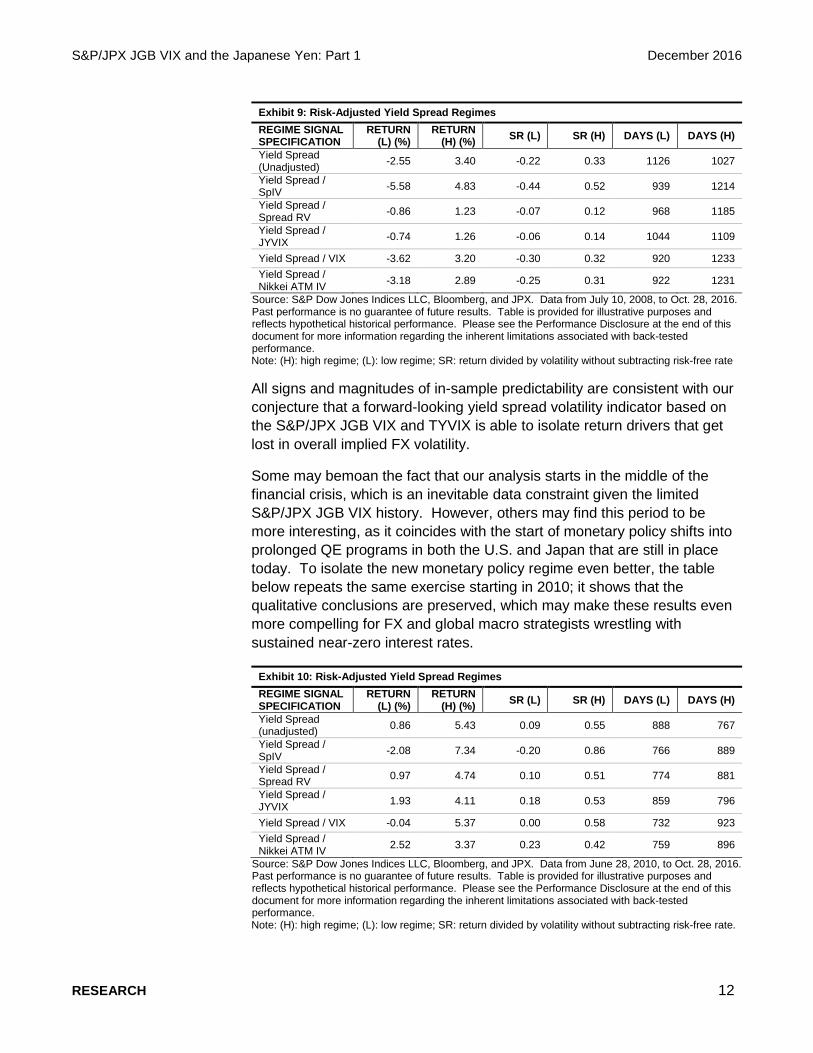
The table below summarizes the FX return separation results for the high and low regimes based on yield spreads divided by various volatility measures. The unadjusted yield spread does a decent job on its own of separating USD/JPY returns into a low spread regime, with -2.55% average return, and a high regime, with 3.40% average return, annualized, for an in-sample separation of 5.95%. Adjusting by SpIV boosts this separation to a remarkable 10.41%. In contrast, adjusting by the realized volatility of yield spreads does more harm than good, and the same can be said of JYVIX. The same story holds if we contrast volatility-adjusted returns in columns four and five of Exhibit 9.
Adjusting by the realized volatility of yield spreads does more harm than good, and the same can be said of JYVIX.
RESEARCH 11
S&P/JPX JGB VIX and the Japanese Yen: Part 1 December 2016
Exhibit 9: Risk-Adjusted Yield Spread Regimes REGIME SIGNAL SPECIFICATION
RETURN (L) (%)
RETURN (H) (%) SR (L) SR (H) DAYS (L) DAYS (H)
Yield Spread (Unadjusted) -2.55 3.40 -0.22 0.33 1126 1027
Yield Spread / SpIV -5.58 4.83 -0.44 0.52 939 1214
Yield Spread / Spread RV -0.86 1.23 -0.07 0.12 968 1185
Yield Spread / JYVIX -0.74 1.26 -0.06 0.14 1044 1109
Yield Spread / VIX -3.62 3.20 -0.30 0.32 920 1233 Yield Spread / Nikkei ATM IV -3.18 2.89 -0.25 0.31 922 1231
Source: S&P Dow Jones Indices LLC, Bloomberg, and JPX. Data from July 10, 2008, to Oct. 28, 2016. Past performance is no guarantee of future results. Table is provided for illustrative purposes and reflects hypothetical historical performance. Please see the Performance Disclosure at the end of this document for more information regarding the inherent limitations associated with back-tested performance. Note: (H): high regime; (L): low regime; SR: return divided by volatility without subtracting risk-free rate
All signs and magnitudes of in-sample predictability are consistent with our conjecture that a forward-looking yield spread volatility indicator based on the S&P/JPX JGB VIX and TYVIX is able to isolate return drivers that get lost in overall implied FX volatility.
Some may bemoan the fact that our analysis starts in the middle of the financial crisis, which is an inevitable data constraint given the limited S&P/JPX JGB VIX history. However, others may find this period to be more interesting, as it coincides with the start of monetary policy shifts into prolonged QE programs in both the U.S. and Japan that are still in place today. To isolate the new monetary policy regime even better, the table below repeats the same exercise starting in 2010; it shows that the qualitative conclusions are preserved, which may make these results even more compelling for FX and global macro strategists wrestling with sustained near-zero interest rates.
Exhibit 10: Risk-Adjusted Yield Spread Regimes REGIME SIGNAL SPECIFICATION
RETURN (L) (%)
RETURN (H) (%) SR (L) SR (H) DAYS (L) DAYS (H)
Yield Spread (unadjusted) 0.86 5.43 0.09 0.55 888 767
Yield Spread / SpIV -2.08 7.34 -0.20 0.86 766 889
Yield Spread / Spread RV 0.97 4.74 0.10 0.51 774 881
Yield Spread / JYVIX 1.93 4.11 0.18 0.53 859 796
Yield Spread / VIX -0.04 5.37 0.00 0.58 732 923 Yield Spread / Nikkei ATM IV 2.52 3.37 0.23 0.42 759 896
Source: S&P Dow Jones Indices LLC, Bloomberg, and JPX. Data from June 28, 2010, to Oct. 28, 2016. Past performance is no guarantee of future results. Table is provided for illustrative purposes and reflects hypothetical historical performance. Please see the Performance Disclosure at the end of this document for more information regarding the inherent limitations associated with back-tested performance. Note: (H): high regime; (L): low regime; SR: return divided by volatility without subtracting risk-free rate.
RESEARCH 12
S&P/JPX JGB VIX and the Japanese Yen: Part 1 December 2016
We finish this paper with a teaser for the second part of this two-part empirical study, which will take these basic empirical findings and explore ways to exploit them through simple systematic strategies.
An Illustrative Carry Strategy Using SpIV-Based Regimes
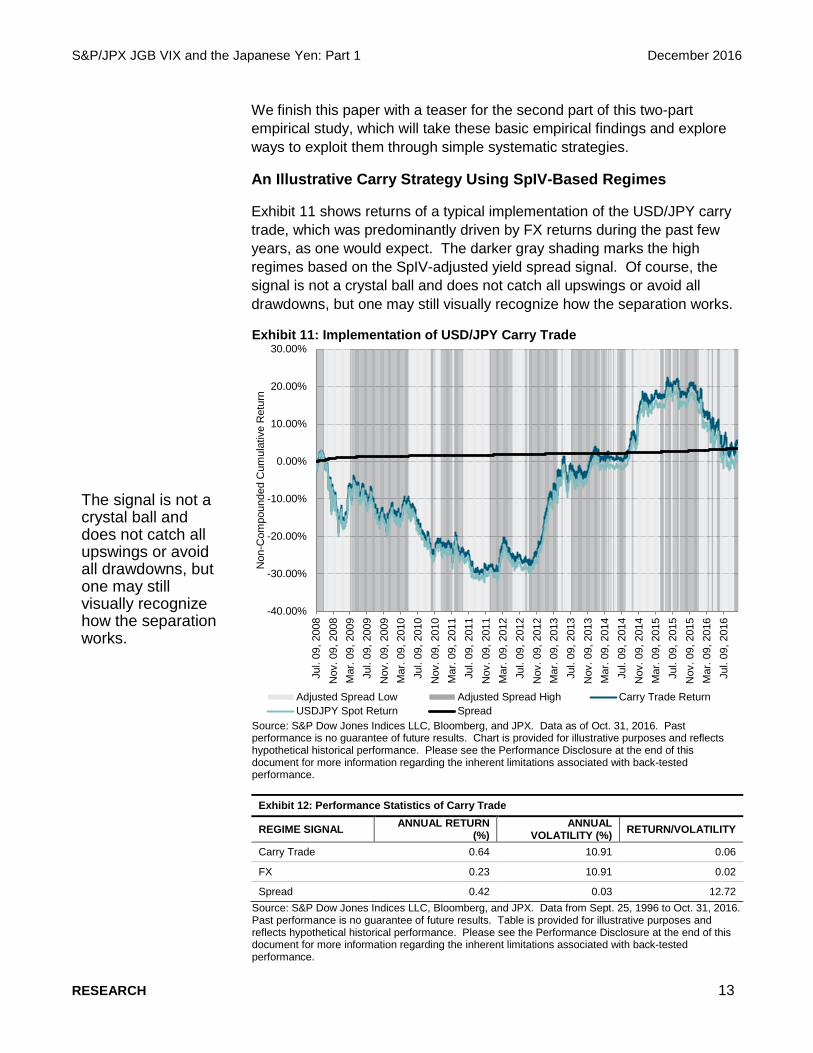
Exhibit 11 shows returns of a typical implementation of the USD/JPY carry trade, which was predominantly driven by FX returns during the past few years, as one would expect. The darker gray shading marks the high regimes based on the SpIV-adjusted yield spread signal. Of course, the signal is not a crystal ball and does not catch all upswings or avoid all drawdowns, but one may still visually recognize how the separation works.
Exhibit 11: Implementation of USD/JPY Carry Trade
Source: S&P Dow Jones Indices LLC, Bloomberg, and JPX. Data as of Oct. 31, 2016. Past performance is no guarantee of future results. Chart is provided for illustrative purposes and reflects hypothetical historical performance. Please see the Performance Disclosure at the end of this document for more information regarding the inherent limitations associated with back-tested performance.
Exhibit 12: Performance Statistics of Carry Trade
REGIME SIGNAL ANNUAL RETURN (%)
ANNUAL VOLATILITY (%) RETURN/VOLATILITY
Carry Trade 0.64 10.91 0.06
FX 0.23 10.91 0.02
Spread 0.42 0.03 12.72 Source: S&P Dow Jones Indices LLC, Bloomberg, and JPX. Data from Sept. 25, 1996 to Oct. 31, 2016. Past performance is no guarantee of future results. Table is provided for illustrative purposes and reflects hypothetical historical performance. Please see the Performance Disclosure at the end of this document for more information regarding the inherent limitations associated with back-tested performance.
-40.00%
-30.00%
-20.00%
-10.00%
0.00%
10.00%
20.00%
30.00%
Jul.
09, 2
008
Nov
. 09,
200
8M
ar. 0
9, 2
009
Jul.
09, 2
009
Nov
. 09,
200
9M
ar. 0
9, 2
010
Jul.
09, 2
010
Nov
. 09,
201
0M
ar. 0
9, 2
011
Jul.
09, 2
011
Nov
. 09,
201
1M
ar. 0
9, 2
012
Jul.
09, 2
012
Nov
. 09,
201
2M
ar. 0
9, 2
013
Jul.
09, 2
013
Nov
. 09,
201
3M
ar. 0
9, 2
014
Jul.
09, 2
014
Nov
. 09,
201
4M
ar. 0
9, 2
015
Jul.
09, 2
015
Nov
. 09,
201
5M
ar. 0
9, 2
016
Jul.
09, 2
016
Non
-Com
poun
ded
Cum
ulat
ive
Ret
urn
Adjusted Spread Low Adjusted Spread High Carry Trade ReturnUSDJPY Spot Return Spread
The signal is not a crystal ball and does not catch all upswings or avoid all drawdowns, but one may still visually recognize how the separation works.
RESEARCH 13
S&P/JPX JGB VIX and the Japanese Yen: Part 1 December 2016
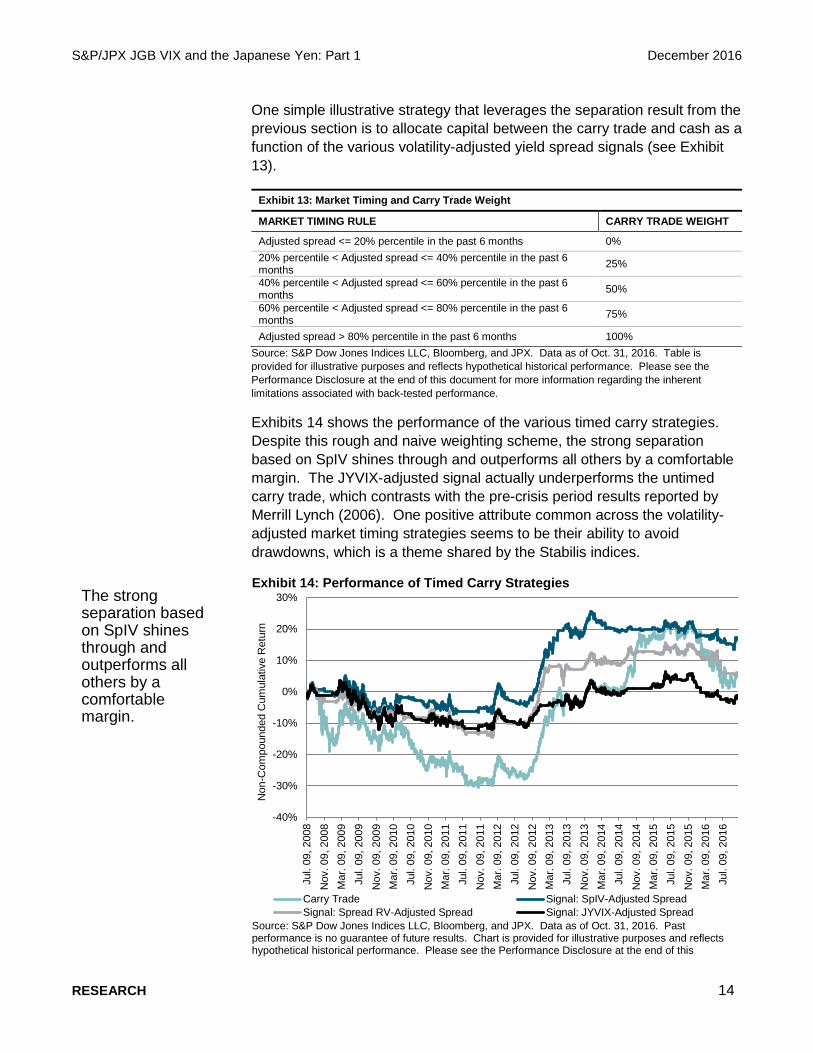
One simple illustrative strategy that leverages the separation result from the previous section is to allocate capital between the carry trade and cash as a function of the various volatility-adjusted yield spread signals (see Exhibit 13).
Exhibit 13: Market Timing and Carry Trade Weight
MARKET TIMING RULE CARRY TRADE WEIGHT
Adjusted spread <= 20% percentile in the past 6 months 0% 20% percentile < Adjusted spread <= 40% percentile in the past 6 months 25%
40% percentile < Adjusted spread <= 60% percentile in the past 6 months 50%
60% percentile < Adjusted spread <= 80% percentile in the past 6 months 75%
Adjusted spread > 80% percentile in the past 6 months 100% Source: S&P Dow Jones Indices LLC, Bloomberg, and JPX. Data as of Oct. 31, 2016. Table is provided for illustrative purposes and reflects hypothetical historical performance. Please see the Performance Disclosure at the end of this document for more information regarding the inherent limitations associated with back-tested performance.
Exhibits 14 shows the performance of the various timed carry strategies. Despite this rough and naive weighting scheme, the strong separation based on SpIV shines through and outperforms all others by a comfortable margin. The JYVIX-adjusted signal actually underperforms the untimed carry trade, which contrasts with the pre-crisis period results reported by Merrill Lynch (2006). One positive attribute common across the volatility-adjusted market timing strategies seems to be their ability to avoid drawdowns, which is a theme shared by the Stabilis indices.
Exhibit 14: Performance of Timed Carry Strategies
Source: S&P Dow Jones Indices LLC, Bloomberg, and JPX. Data as of Oct. 31, 2016. Past performance is no guarantee of future results. Chart is provided for illustrative purposes and reflects hypothetical historical performance. Please see the Performance Disclosure at the end of this
-40%
-30%
-20%
-10%
0%
10%
20%
30%
Jul.
09, 2
008
Nov
. 09,
200
8M
ar. 0
9, 2
009
Jul.
09, 2
009
Nov
. 09,
200
9M
ar. 0
9, 2
010
Jul.
09, 2
010
Nov
. 09,
201
0M
ar. 0
9, 2
011
Jul.
09, 2
011
Nov
. 09,
201
1M
ar. 0
9, 2
012
Jul.
09, 2
012
Nov
. 09,
201
2M
ar. 0
9, 2
013
Jul.
09, 2
013
Nov
. 09,
201
3M
ar. 0
9, 2
014
Jul.
09, 2
014
Nov
. 09,
201
4M
ar. 0
9, 2
015
Jul.
09, 2
015
Nov
. 09,
201
5M
ar. 0
9, 2
016
Jul.
09, 2
016
Non
-Com
poun
ded
Cum
ulat
ive
Ret
urn
Carry Trade Signal: SpIV-Adjusted SpreadSignal: Spread RV-Adjusted Spread Signal: JYVIX-Adjusted Spread
The strong separation based on SpIV shines through and outperforms all others by a comfortable margin.
RESEARCH 14

S&P/JPX JGB VIX and the Japanese Yen: Part 1 December 2016
document for more information regarding the inherent limitations associated with back-tested performance.
RESEARCH 15
S&P/JPX JGB VIX and the Japanese Yen: Part 1 December 2016
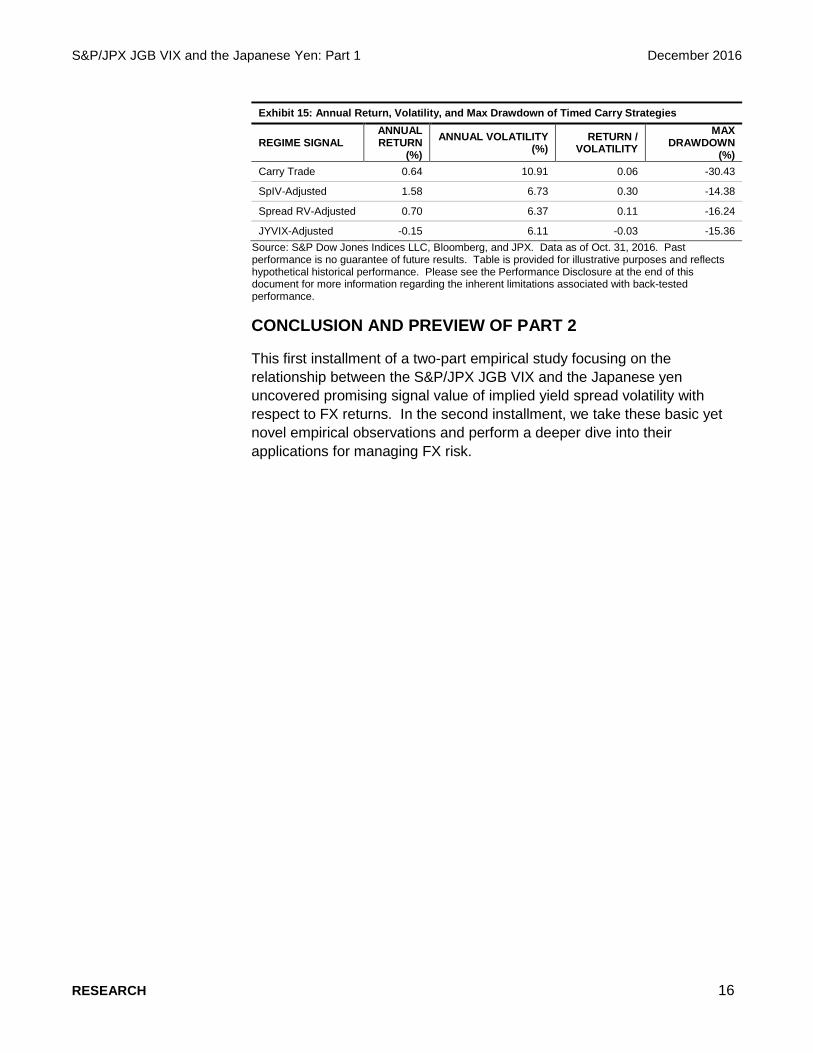
Exhibit 15: Annual Return, Volatility, and Max Drawdown of Timed Carry Strategies
REGIME SIGNAL ANNUAL RETURN
(%) ANNUAL VOLATILITY
(%) RETURN /
VOLATILITY MAX
DRAWDOWN (%)
Carry Trade 0.64 10.91 0.06 -30.43
SpIV-Adjusted 1.58 6.73 0.30 -14.38
Spread RV-Adjusted 0.70 6.37 0.11 -16.24
JYVIX-Adjusted -0.15 6.11 -0.03 -15.36 Source: S&P Dow Jones Indices LLC, Bloomberg, and JPX. Data as of Oct. 31, 2016. Past performance is no guarantee of future results. Table is provided for illustrative purposes and reflects hypothetical historical performance. Please see the Performance Disclosure at the end of this document for more information regarding the inherent limitations associated with back-tested performance.
CONCLUSION AND PREVIEW OF PART 2
This first installment of a two-part empirical study focusing on the relationship between the S&P/JPX JGB VIX and the Japanese yen uncovered promising signal value of implied yield spread volatility with respect to FX returns. In the second installment, we take these basic yet novel empirical observations and perform a deeper dive into their applications for managing FX risk.
RESEARCH 16
S&P/JPX JGB VIX and the Japanese Yen: Part 1 December 2016
REFERENCES
CBOE (2015). Introduction to the TYVIX Index. http://www.cboe.com/micro/volatility/tyvix/pdf/tyvixguidepart1.pdf
CBOE (2015). Compendium of Empirical Findings. http://www.cboe.com/micro/volatility/tyvix/pdf/tyvixguidepart3.pdf
Merrill Lynch FX Strategy Group (2006). The yen-volatility nexus.
Pasquale Della Corte, Tarun Ramadorai, and Lucio Sarno (2016). Volatility risk premia and exchange rate predictability. Journal of Financial Economics, Volume 120, Issue 1, Pages 21 – 40.
S&P Dow Jones & Japan Exchange Group (2015). S&P/JPX JGB VIX Methodology. https://spindices.com/documents/methodologies/methodology-sp-jpx-jgb-vix.pdf http://www.jpx.co.jp/markets/derivatives/sp-jpx-jgb-vix/nlsgeu0000017vg5-att/WhitePaper.pdf
S&P Dow Jones & Japan Exchange Group (2015). S&P/JPX JGB VIX: Basic Empirical Properties. http://www.spindices.com/documents/research/research-jpx-jgb-vix-basic-empirical-properties.pdf
TYVIX. Online primer on TYVIX. http://www.tyvix101.com
RESEARCH 17
S&P/JPX JGB VIX and the Japanese Yen: Part 1 December 2016
PERFORMANCE DISCLOSURE The S&P JGB VIX was launched on October 2, 2015. All information presented prior to an index’s Launch Date is hypothetical (back-tested), not actual performance. The back-test calculations are based on the same methodology that was in effect on the index Launch Date. Complete index methodology details are available at www.spdji.com.
S&P Dow Jones Indices defines various dates to assist our clients in providing transparency. The First Value Date is the first day for which there is a calculated value (either live or back-tested) for a given index. The Base Date is the date at which the Index is set at a fixed value for calculation purposes. The Launch Date designates the date upon which the values of an index are first considered live: index values provided for any date or time period prior to the index’s Launch Date are considered back-tested. S&P Dow Jones Indices defines the Launch Date as the date by which the values of an index are known to have been released to the public, for example via the company’s public website or its datafeed to external parties. For Dow Jones-branded indices introduced prior to May 31, 2013, the Launch Date (which prior to May 31, 2013, was termed “Date of introduction”) is set at a date upon which no further changes were permitted to be made to the index methodology, but that may have been prior to the Index’s public release date.
Past performance of the Index is not an indication of future results. Prospective application of the methodology used to construct the Index may not result in performance commensurate with the back-test returns shown. The back-test period does not necessarily correspond to the entire available history of the Index. Please refer to the methodology paper for the Index, available at www.spdji.com for more details about the index, including the manner in which it is rebalanced, the timing of such rebalancing, criteria for additions and deletions, as well as all index calculations.
Another limitation of using back-tested information is that the back-tested calculation is generally prepared with the benefit of hindsight. Back-tested information reflects the application of the index methodology and selection of index constituents in hindsight. No hypothetical record can completely account for the impact of financial risk in actual trading. For example, there are numerous factors related to the equities, fixed income, or commodities markets in general which cannot be, and have not been accounted for in the preparation of the index information set forth, all of which can affect actual performance.
The Index returns shown do not represent the results of actual trading of investable assets/securities. S&P Dow Jones Indices LLC maintains the Index and calculates the Index levels and performance shown or discussed, but does not manage actual assets. Index returns do not reflect payment of any sales charges or fees an investor may pay to purchase the securities underlying the Index or investment funds that are intended to track the performance of the Index. The imposition of these fees and charges would cause actual and back-tested performance of the securities/fund to be lower than the Index performance shown. As a simple example, if an index returned 10% on a US $100,000 investment for a 12-month period (or US $10,000) and an actual asset-based fee of 1.5% was imposed at the end of the period on the investment plus accrued interest (or US $1,650), the net return would be 8.35% (or US $8,350) for the year. Over a three year period, an annual 1.5% fee taken at year end with an assumed 10% return per year would result in a cumulative gross return of 33.10%, a total fee of US $5,375, and a cumulative net return of 27.2% (or US $27,200).
RESEARCH 18
S&P/JPX JGB VIX and the Japanese Yen: Part 1 December 2016
GENERAL DISCLAIMER Copyright © 2016 by S&P Dow Jones Indices LLC, a part of S&P Global. All rights reserved. Standard & Poor’s ®, S&P 500 ® and S&P ® are registered trademarks of Standard & Poor’s Financial Services LLC (“S&P”), a subsidiary of S&P Global. Dow Jones ® is a registered trademark of Dow Jones Trademark Holdings LLC (“Dow Jones”). Trademarks have been licensed to S&P Dow Jones Indices LLC. Redistribution, reproduction and/or photocopying in whole or in part are prohibited without written permission. This document does not constitute an offer of services in jurisdictions where S&P Dow Jones Indices LLC, Dow Jones, S&P or their respective affiliates (collectively “S&P Dow Jones Indices”) do not have the necessary licenses. All information provided by S&P Dow Jones Indices is impersonal and not tailored to the needs of any person, entity or group of persons. S&P Dow Jones Indices receives compensation in connection with licensing its indices to third parties. Past performance of an index is not a guarantee of future results.
It is not possible to invest directly in an index. Exposure to an asset class represented by an index is available through investable instruments based on that index. S&P Dow Jones Indices does not sponsor, endorse, sell, promote or manage any investment fund or other investment vehicle that is offered by third parties and that seeks to provide an investment return based on the performance of any index. S&P Dow Jones Indices makes no assurance that investment products based on the index will accurately track index performance or provide positive investment returns. S&P Dow Jones Indices LLC is not an investment advisor, and S&P Dow Jones Indices makes no representation regarding the advisability of investing in any such investment fund or other investment vehicle. A decision to invest in any such investment fund or other investment vehicle should not be made in reliance on any of the statements set forth in this document. Prospective investors are advised to make an investment in any such fund or other vehicle only after carefully considering the risks associated with investing in such funds, as detailed in an offering memorandum or similar document that is prepared by or on behalf of the issuer of the investment fund or other vehicle. Inclusion of a security within an index is not a recommendation by S&P Dow Jones Indices to buy, sell, or hold such security, nor is it considered to be investment advice.
These materials have been prepared solely for informational purposes based upon information generally available to the public and from sources believed to be reliable. No content contained in these materials (including index data, ratings, credit-related analyses and data, research, valuations, model, software or other application or output therefrom) or any part thereof (Content) may be modified, reverse-engineered, reproduced or distributed in any form or by any means, or stored in a database or retrieval system, without the prior written permission of S&P Dow Jones Indices. The Content shall not be used for any unlawful or unauthorized purposes. S&P Dow Jones Indices and its third-party data providers and licensors (collectively “S&P Dow Jones Indices Parties”) do not guarantee the accuracy, completeness, timeliness or availability of the Content. S&P Dow Jones Indices Parties are not responsible for any errors or omissions, regardless of the cause, for the results obtained from the use of the Content. THE CONTENT IS PROVIDED ON AN “AS IS” BASIS. S&P DOW JONES INDICES PARTIES DISCLAIM ANY AND ALL EXPRESS OR IMPLIED WARRANTIES, INCLUDING, BUT NOT LIMITED TO, ANY WARRANTIES OF MERCHANTABILITY OR FITNESS FOR A PARTICULAR PURPOSE OR USE, FREEDOM FROM BUGS, SOFTWARE ERRORS OR DEFECTS, THAT THE CONTENT’S FUNCTIONING WILL BE UNINTERRUPTED OR THAT THE CONTENT WILL OPERATE WITH ANY SOFTWARE OR HARDWARE CONFIGURATION. In no event shall S&P Dow Jones Indices Parties be liable to any party for any direct, indirect, incidental, exemplary, compensatory, punitive, special or consequential damages, costs, expenses, legal fees, or losses (including, without limitation, lost income or lost profits and opportunity costs) in connection with any use of the Content even if advised of the possibility of such damages.
S&P Dow Jones Indices keeps certain activities of its business units separate from each other in order to preserve the independence and objectivity of their respective activities. As a result, certain business units of S&P Dow Jones Indices may have information that is not available to other business units. S&P Dow Jones Indices has established policies and procedures to maintain the confidentiality of certain non-public information received in connection with each analytical process.
In addition, S&P Dow Jones Indices provides a wide range of services to, or relating to, many organizations, including issuers of securities, investment advisers, broker-dealers, investment banks, other financial institutions and financial intermediaries, and accordingly may receive fees or other economic benefits from those organizations, including organizations whose securities or services they may recommend, rate, include in model portfolios, evaluate or otherwise address.
RESEARCH 19