summary jpx wp_en_no9
TRANSCRIPT

1 1 1 1
Impacts of
Speedup of Market System
on Price Formations
using Artificial Market Simulations
SPARX Asset Management Co., Ltd.
Japan Securities Clearing Corporation
Osaka Exchange, Inc.
The University of Tokyo
CREST, JST
Takanobu Mizuta
Yoshito Noritake
Satoshi Hayakawa
Kiyoshi Izumi
JPX Working Paper 【Summary】
Vol. 9, 31th March 2015
2
This material was compiled based on the results of research and studies by directors, officers,
and/or employees of Japan Exchange Group, Inc., its subsidiaries, and affiliates (hereafter
collectively “the JPX group”) with the intention of seeking comments from a wide range of
persons from academia, research institutions, and market users. The views and opinions in this
material are the writer's own and do not constitute the official view of the JPX group. This
material was prepared solely for the purpose of providing information, and was not intended to
solicit investment or recommend specific issues or securities companies. The JPX group shall
not be responsible or liable for any damages or losses arising from use of this material. This
English translation is intended for reference purposes only. In cases where any differences
occur between the English version and its Japanese original, the Japanese version shall prevail.
This translation is subject to change without notice. The JPX group shall accept no responsibility
or liability for damages or losses caused by any error, inaccuracy, misunderstanding, or changes
with regard to this translation.

3 3 3 3
(1) Introduction
(2) Artificial Market Model
(3) Simulation Results
(4) Empirical Study to Compare
(5) Summary & Future Works

4 4 4 4
(1) Introduction
(2) Artificial Market Model
(3) Simulation Results
(4) Empirical Study to Compare
(5) Summary & Future Works

5 5 5 5
Speedup of Exchange System
How much speedup is best? How much speedup is best?
Increasing liquidity by increasing providing liquidity traders
Increasing cost for systems of Markets and investors
Because of competition between Markets and big investors demands
5
conflicting GOOD
BAD

6 6 6 6
Does Market speed purely effect market efficiency?
Artificial Market Simulation
(Multi-Agent Simulation) 6
What are Mechanisms?
How much enough speedup is Market system?
-> So many factors cause price formation :
An empirical study cannot isolate the pure contribution
-> So many factors cause price formation :
An empirical study cannot isolate the pure contribution
-> Analysis Micro Process: Impossible by empirical study -> Analysis Micro Process: Impossible by empirical study
-> No Market experienced more Speedup:
Impossible by empirical study
-> No Market experienced more Speedup:
Impossible by empirical study
Need Discussions

7 7 7 7
(1) Introduction
(2) Artificial Market Model
(3) Simulation Results
(4) Empirical Study to Compare
(5) Summary & Future Works
8 8 8 8
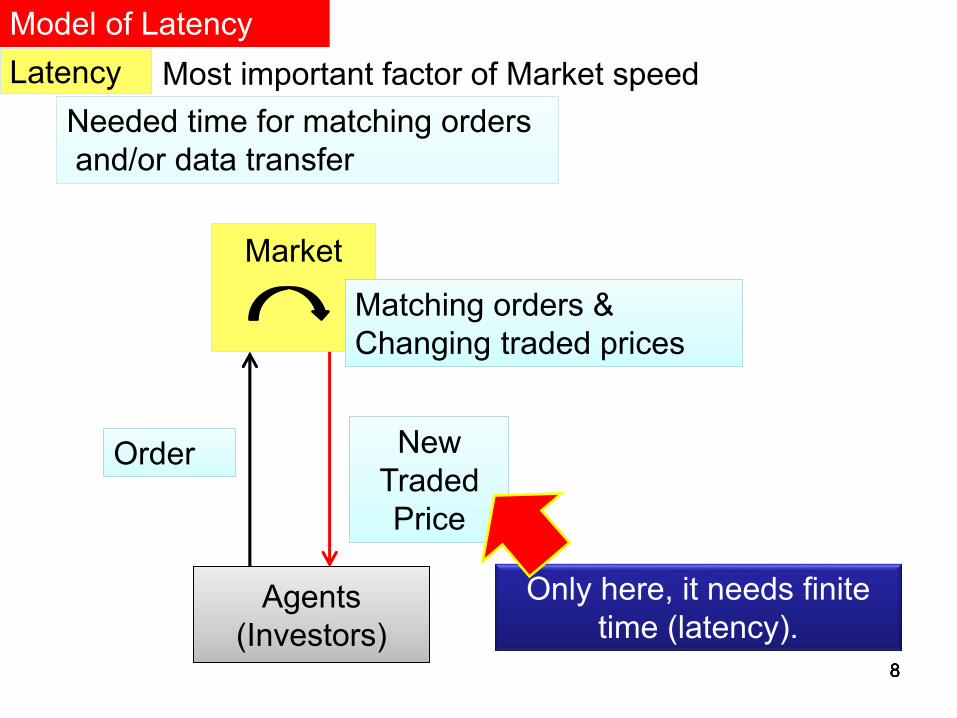
Model of Latency
Agents
(Investors)
Agents
(Investors)
Market
Market
Order Order New
Traded
Price
New
Traded
Price
Matching orders &
Changing traded prices
Matching orders &
Changing traded prices
Only here, it needs finite
time (latency).
Latency Latency
Needed time for matching orders
and/or data transfer
Needed time for matching orders
and/or data transfer
Most important factor of Market speed

Order & Price change
Order & Price change
True Price
Observed
Price
Latency
constant = δl
Order
interval
exponential
random
numbers
Avg. = δo
Difference
Most cases, agents know True Price
True and Observed prices are difference
9
δl / δo > 1 δl / δo > 1
δl / δo ≪ 1 δl / δo ≪ 1

10
* Continuous Double Auction: to implement realistic latency
* Simple Agent model: to avoid arbitrary result
Same Model as JPX Working Paper vol.2; Mizuta et. al. 2013
Agents (Investors) Model
t
jj
t
jhjt
f
j
i ji
t
je urwP
Pw
wr ,,2,1
,
, log1
Fundamental Technical noise
Expected Return ,i jw
Strategy
Weight
↑ Different
for each agent
heterogeneous 1000 agents
Replicate traditional Stylized Facts
and Replicate Micro Structures
Latency has Micro Structure Time Scale, MilliSeconds Latency has Micro Structure Time Scale, MilliSeconds

11 11 11 11
(1) Introduction
(2) Artificial Market Model
(3) Simulation Results
(4) Empirical Study to Compare
(5) Summary & Future Works

12 12 12 δl/δo>1: increasing Volatility, decreasing Kurtosis (flatter fat tail)
⇒ be inefficient?
δl/δo>1: increasing Volatility, decreasing Kurtosis (flatter fat tail)
⇒ be inefficient?
0
5
10
15
20
0.00%
0.01%
0.02%
0.03%
0.04%
0.05%
0.06%
0.0
01
0.0
02
0.0
05
0.0
10
.02
0.0
50
.1
0.2
0.5 1 2 5
10
Ku
rto
sis
Vo
lati
lity
δl / δo
Volatility & Kurtosis(δr/δo=1)
Volatility
Kurtosis
δl/δo: latency / order interval
δr/δo: return calculation period / order interval
δl/δo: latency / order interval
δr/δo: return calculation period / order interval

13 13 13
0
0.5
1
1.5
2
2.5
0.00%
0.02%
0.04%
0.06%
0.08%
0.10%
0.12%
0.0
01
0.0
02
0.0
05
0.0
1
0.0
2
0.0
5
0.1
0.2
0.5 1 2 5
10
Ku
rto
sis
Vo
lati
lity
δl / δo
Volatility & Kurtosis(δr/δo=10)
Volatility
Kurtosis
δl/δo>1:Volatility is flat, Increasing Kurtosis (fatter fat tail)
⇒ be inefficient?
δl/δo>1:Volatility is flat, Increasing Kurtosis (fatter fat tail)
⇒ be inefficient?
We should use the way independent of return calculation period

14 14
We can measure Market Inefficiency Directly,
not estimation in simulation studies.
Market Inefficiency
If Market was perfect efficient, Market prices were exactly same as the fundamental price. This Market Inefficiency is defined actual difference between market and fundamental prices. -> We can not use this definition for an empirical study. Experimental study for human sometimes uses this definition.
Independent of return calculation period
Market Inefficiency =Average of Market Price − Fundamental Price
Fundamental Price

15 15 15
δl / δo > 1 : be Inefficient
0.27%
0.28%
0.29%
0.30%
0.31%
0.32%
0.0
01
0.0
02
0.0
05
0.0
1
0.0
2
0.0
5
0.1
0.2
0.5 1 2 5
10
Mar
ket
Inef
fici
ency
δl / δo
Market Inefficiency
Right side δl / δo = 0.5, Market becomes Inefficient Right side δl / δo = 0.5, Market becomes Inefficient

16 16 16
δl / δo > 1 : Wider Bid Ask Spread δl / δo > 1 : Wider Bid Ask Spread
0.135%
0.140%
0.145%
0.150%
0.0
01
0.0
02
0.0
05
0.0
1
0.0
2
0.0
5
0.1
0.2
0.5 1 2 5
10
Bid
Ask
Sp
read
δl / δo
Bid Ask Spread

17 17 17
δl / δo > 1 : Increasing Execution Rate δl / δo > 1 : Increasing Execution Rate
32.0%
32.2%
32.4%
32.6%
32.8%
0.0
01
0.0
02
0.0
05
0.0
1
0.0
2
0.0
5
0.1
0.2
0.5 1 2 5
10
Exec
uti
on
Rat
e
δl / δo
Execution Rate

18 18 18
Increasing Execution Rate especially
near the fundamental price
Increasing Execution Rate especially
near the fundamental price
29.0%
29.5%
30.0%
30.5%
31.0%
31.5%
32.0%
32.5%
33.0%
9,9
40
9,9
50
9,9
60
9,9
70
9,9
80
9,9
90
10
,00
0
10
,01
0
10
,02
0
10
,03
0
10
,04
0
10
,05
0
10
,06
0
Exe
cuti
on
Rat
e
True Price
Execution Rate for True Prices Fundamental Price = 10,000
δl / δo = 0.001
δl / δo = 10

19 19 19
Observed Price < True Price: More Buy Market Orders: Positive estimated returns Observed Price > True Price: More Sell Market Orders: Negative estimated returns Observed Price < True Price: More Buy Market Orders: Positive estimated returns Observed Price > True Price: More Sell Market Orders: Negative estimated returns
δl / δo
Execution Rate Avg.
Estimated Return of agents
Sum
Buy Market
Sell Limit
Orders
Sell Market
Buy Limit
Orders
10 Observed P. < True P. 32.5% 28.9% 3.5% 0.28%
Observed P. > True P. 32.5% 3.6% 28.9% -0.27%
0.001 --- 31.2% 15.6% 15.6% 0.00%

Unnecessary market following trades Unnecessary market following trades
But, agents cannot change Estimate price, quickly But, agents cannot change Estimate price, quickly
Observed Price > True Price Observed Price < True Price
Too High Estimated P.
⇒ Market Buy order
↑ If agents knew True P.
they did not order.
Too High Estimated P.
⇒ Market Buy order
↑ If agents knew True P.
they did not order.
Observed P.
True P.
Upward trend
Estimated P.
(near Fundamental Price)
Too Low Estimated P.
⇒ Market Sell order
↑ If agents knew True P.
they did not order.
Too Low Estimated P.
⇒ Market Sell order
↑ If agents knew True P.
they did not order.
Stop market trend Stop market trend

21 21 21 21
Stop market trend Stop market trend
Market becomes Inefficient
Expanding Bid Ask Spread Expanding Bid Ask Spread
21
Mechanism of Large Latency(δl/δo>1) making Market Inefficient
Increasing Execution Rate Increasing Execution Rate
Decreasing Limit orders near Market Price, relatively Decreasing Limit orders near Market Price, relatively
But, agents cannot change
Estimate price, quickly
But, agents cannot change
Estimate price, quickly
Unnecessary market
following trades
Unnecessary market
following trades Especially near
Fundamental Price
Especially near
Fundamental Price
Large Latency

22 22 22 22
(1) Introduction
(2) Artificial Market Model
(3) Simulation Results
(4) Empirical Study to Compare
(5) Summary & Future Works

23 23 23
1:Uno, 2012
2~6:In this study
1:Uno, 2012
2~6:In this study
No. Analysis Period arrowhead Order No.
Avg. for day Avg. names
Calculation Period (min)
Avg. δo (ms) = Period (ms) /
Order No.
Latency δl (ms)
δl / δo
1 December 2009 (one month) Before 2,833 270 5,718 3,000 0.525
2 2 August 2010 - 18 November 2011
After
14,621 355 1,457 4.5 0.003
3 21 November 2011 - 26 November 2014 28,974 385 797 4.5 0.006
4 27 October 2014 - 26 November 2014 66,044 385 350 4.5 0.013
5 31 October 2014 (one day) 87,109 385 265 4.5 0.017
6 4 November 2014 (one day) 114,027 385 203 4.5 0.022
Before arrowhead
It is Possible that Market is Chronically Inefficient
After arrowhead
Market is NOT Chronically Inefficient
by the Mechanism we showed

24 24 24
0.000
0.005
0.010
0.015
0.020
0.025
10
/27
10
/28
10
/29
10
/30
10
/31
11
/4
11
/5
11
/6
11
/7
11
/10
11
/11
11
/12
11
/13
11
/14
11
/17
11
/18
11
/19
11
/20
11
/21
11
/25
11
/26
δl /
δo
Month / Day
δl/δo for business day 27 October 2014~26 November 2014
Even though near 31 October 2014, Bank of Japan announced
“Expansion of the Quantitative and Qualitative Monetary Easing”,
Market is NOT Chronically Inefficient by the Mechanism we showed
Even though near 31 October 2014, Bank of Japan announced
“Expansion of the Quantitative and Qualitative Monetary Easing”,
Market is NOT Chronically Inefficient by the Mechanism we showed

25 25 25
0.00
0.02
0.04
0.06
0.08
0.10
0.12
0.14
8:0
0
9:0
0
10
:00
11
:00
12
:00
13
:00
14
:00
15
:00
8:0
0
9:0
0
10
:00
11
:00
12
:00
13
:00
14
:00
15
:00
8:0
0
9:0
0
10
:00
11
:00
12
:00
13
:00
14
:00
15
:00
δl /
δo
δl/δo for 1 minute
31 October 2014~5 November 2014
31 October 4 November 5 November
31 October 2014 at 13:44 Japan time, Bank of Japan announced it.
For a few minutes after the announcement, orders are crowded.
We cannot deny market inefficiency for less than one minute.
Market is NOT Inefficient even for one minute Market is NOT Inefficient even for one minute
Future Works Future Works

26 26 26 26
(1) Introduction
(2) Artificial Market Model
(3) Simulation Results
(4) Empirical Study to Compare
(5) Summary & Future Works

27 27 27 27
Summary
* The ratio (δl/δo) is key parameter,
Latency(δl) per Order Interval (δo)
* Enough fast market system is required δl << δo.
* Stop market trend -> Large Latency
-> agents cannot change Estimate price, quickly
-> Unnecessary market following trades
-> Increasing Execution Rate -> Expanding Bid Ask
Spread
-> Market becomes Inefficient
* Before arrowhead:
It is Possible that Market is Chronically Inefficient
* After arrowhead:
Market is NOT Inefficient even for one minute

28 28 28 28
Future Works
* We should discuss the case of very crowded orders
for less than one minute, for example, at announced
great market impacting information.
-> needed simulation and empirical studies
<- Certainly, such very short time scale event
does not effect to general investors much.
<-> It may effect to High Frequency Trading very much.
* We should discuss it in more kinds of agents.
(For example: High Frequency Trading such as
Market Maker strategy, Arbitrage Strategy, and so on.)

29 29 29 29 29
Appendix

30 30
order
book
sell price buy
84 101
176 100
99 2
98 77
Definition of Market/Limit order In this study
A little difference from actual market
limit
market market limit
market market Exist matching order
Order executed immediately
Exist matching order
Order executed immediately
No matching order
Order not executed immediately
No matching order
Order not executed immediately
buy buy sell sell
Agents decide an order price,
if exist matching order, market order else limit order
Agents decide an order price,
if exist matching order, market order else limit order
All agents decide an order price