southern cross electrical engineering limited
TRANSCRIPT

2010 Annual Report
Southern Cross Electrical Engineering Limited
For
per
sona
l use
onl
y

2
Southern Cross Electrical Engineering Limited Annual Report 2010
2
Contents
Directors’ report (including corporate governance statement and remuneration report) .......................................................... 10Balance sheet ......................................................................... 31Statement of changes in equity ...................................... 32Statement of comprehensive income .......................... 33Statement of cash flow ....................................................... 34Index to notes to the financial statements ................. 35Notes to the financial statements .................................. 36Directors’ declaration .......................................................... 72Independent auditor’s report .......................................... 73Lead auditor’s independence declaration................... 75ASX additional information .............................................. 77
Southern Cross Electrical Engineering Limited Annual Report 2010
For
per
sona
l use
onl
y

3
Southern Cross Electrical Engineering Limited Annual Report 2010
3
Southern Cross was established in 1978 and together with its overseas group of companies, is a dedicated provider of large scale specialised electrical, control and instrumentation services for major construction projects. Southern Cross is committed to outstanding client service and as a result is proud to have fostered long-standing relationships with customers including Woodside, BHP Billiton, Rio Tinto, Barrick Gold, Newmont, Goldfields and Alcoa.
The range of services and expertise we offer our clients through the project lifecycle includes:
• Constructability reviews;• Material procurement, transport and logistics;• Electrical and instrumentation installation (“E&I”);• Installation pre-commissioning and commissioning;• Shutdown maintenance and installations;• Installation contractual verification documentation; and• Manufacturers’ data and maintenance manuals.
With teams currently located in Australia, South America and Africa, Southern Cross is well positioned to execute its four pillars strategy by providing highly skilled professionals throughout the world for large scale projects in the following sectors:
• Australian Mining;• Oil & Gas;• International Mining; and• Infrastructure.
During 2010, Southern Cross maintained its focus on large scale minerals and metals construction projects and re-entered the oil and gas market through the:
Southern Cross Electrical Engineering Limited Annual Report 2010
What we doWho we are,
• Award of the electrical and instrumentation contract for the off-take and storage facilities at the Pluto LNG project.• Delivery of the Tiwest expansion project at Kwinana.• Continued delivery of expansion projects at Cape Lambert for Rio Tinto.• Overhead power line construction and electrical installation on the ammonium nitrate facility at the Brockman 4 project for Rio Tinto.
In addition to the above, Southern Cross has increased its capacity and experience in its key markets through the:
• The acquisition of Hindle Offshore Services that provides E&I services to offshore exploration assets.• The acquisition of K.J. Johnson & Co, an overhead power line business that further strengthens Southern Cross’ service offering to resources clients in remote regions.• The acquisition of Oceanic, an electrical construction business based in Queensland, that specialises in the emerging coal seam gas industry.
Southern Cross’ ability to grow in its core markets is supported by the respect of our clients, our independence as an E&I contractor and our enhanced corporate team and project delivery capability. Southern Cross’ strong reputation and financial position has allowed the business to prepare for the upcoming Australian LNG projects and the new phase of minerals investment in sectors such as iron ore, gold and nickel around the world.
Southern Cross’ strategy to support remote, energy and resources construction projects around the globe remains as strong now as it has been in the last 30 years.
For
per
sona
l use
onl
y

4
Southern Cross Electrical Engineering Limited Annual Report 2010
4
Southern Cross Electrical Engineering Limited Annual Report 2010
Image courtesy of Woodside
Safety
In November, Southern Cross announced it had been awarded the electrical and instrumentation contract for the off-take and storage facilities at Woodside’s Pluto facility in Western Australia.
For
per
sona
l use
onl
y

5
Southern Cross Electrical Engineering Limited Annual Report 2010Southern Cross Electrical Engineering Limited Annual Report 2010
50
45
40
35
30
25
20
15
10
5
0
700,000
600,000
500,000
400,000
300,000
200,000
100,000
0
2003-042004-05 2005-06 2006-07
45.91
24.89
31.00
16.40
9.71
6.51
3.90
2007-082008-09
2009-10Financial year
Hou
rs w
orke
dTRCFR
SCEE TRCFR (2003 - 2010)Southern Cross was again awarded the Western Australian safety award by NECA for its safety performance at Pluto.
For the sixth year in a row Southern Cross produced a result of zero LTIs for 2010 and also reduced the Medical Treatment Injuries (MTI) to an all time low of four MTI’s that resulted in a further drop to the Total Recordable Cases Frequency Rate (“TRCFR”) down to 3.90.
Safety is Southern Cross’ highest value and this has been retained and delivered throughout the year on all our projects.
Southern Cross continued on its program of continuous improvement initiatives in 2010 which have lead to improvements and implementation including:
• Improved reporting mechanisms in project accountability.
• Accreditation for the Company’s environmental management system to AS/NZS ISO 14001.
• Implementation of an indigenous training and recruitment program.
• Certification to AS/NZS 4801 for the Company’s occupational health and safety management systems.
• Successful surveillance audits on site and in head office renewing Southern Cross’s AS/NZS ISO 9001/2008 certification.
For
per
sona
l use
onl
y

6
Southern Cross Electrical Engineering Limited Annual Report 2010
6
Over the 32 years that I have been involved with Southern Cross, 2010 has been one of the most challenging yet satisfying years.
Chairman’s Review
Southern Cross Electrical Engineering Limited Annual Report 2010
For
per
sona
l use
onl
y

7
Southern Cross Electrical Engineering Limited Annual Report 2010
On the basis of the Company’s 2010 results and its future prospects, the Board of Directors has declared a 4.5 cents per share fully franked dividend which takes the full year dividend to 6.5 cents per share. This is in line with the dividends paid in 2009 and represents the confidence the Board has in our business going forward.
Strategic InitiativesSouthern Cross has a clearly defined strategy for growing the business, which is centred around:
• Mining and mineral processing projects in Australia;• Mining and mineral processing projects Internationally for our Blue Chip clients;• Oil & Gas; and • Infrastructure.
Execution of this strategy commenced in 2009 and results are being delivered through a number of achievements across the year.
In November, Southern Cross announced it had been awarded the electrical and instrumentation contract for the off-take and storage facilities at Woodside’s Pluto facility in Western Australia. To date on this project, Southern Cross has performed over 244,000 man-hours with zero lost time injuries (“LTIs”). This outstanding performance has been recognised not only by Woodside but also the National Electrical Contractors Association (“NECA”) with Southern Cross being awarded the state winner of the 2010 NECA safety award for the Pluto project. Southern Cross will now be considered for the national NECA safety award, an award we have won on numerous occasions in recent years.
Pluto is a significant project for the Company because it signals our re-entry into the important Oil and Gas market. Continued positive performance on Pluto, including our safety performance, will help position Southern Cross for the many Oil & Gas projects that are scheduled to commence over the coming years.
Chairman’s Review
Dear Shareholders
Southern Cross Electrical Engineering Ltd (“Southern Cross” or “the Company”) achieved full year revenue for 2010 of $97.4 million, which was just below our 2009 revenue of $100.3 million. The net profit after tax (“NPAT”) for 2010 before the business acquisition costs and amortisation of customer contract intangibles was $11.7 million and on a statutory basis, NPAT was $8.7 million. This was lower than 2009’s NPAT of $15.5 million due primarily to the lower international revenue, which historically generates better margins than in Australia.
Over the 32 years that I have been involved with Southern Cross, 2010 has been one of the most challenging yet satisfying years. Electrical contractors are the last to commence work on site, so are last to experience the market downturn, but equally last to experience a market upturn. This effectively buffered the Company across 2009 with the effects being felt in 2010 as other contractors saw their businesses begin to see signs of growth.
During the year Southern Cross, K.J.Johnson and Hindles continued working with its long established clients, completing works for Rio Tinto at its Cape Lambert and Brockman 4 projects. Oceanic continues to maintain its preferred contractor status with BP, Caltex and QGC. These long- term relationships will be one of the key drivers of the Group’s future growth.
Whilst there has been a lower level of construction in 2010, I was pleased that Southern Cross was able to grow revenue in its core Australian business. Operational efficiencies for our Australian projects delivered improved margins on this work, which was also pleasing. In contrast the international segment of the business was substantially lower due to a lack of quality projects on which Southern Cross could tender.
There are clear signs that a number of our blue chip international clients have begun new projects and I believe Southern Cross is well positioned to win work on these projects.
Gianfranco TomasiChairman
For
per
sona
l use
onl
y

8
Southern Cross Electrical Engineering Limited Annual Report 2010
During the year Southern Cross completed the acquisitions of Hindles, K.J Johnson & Co and Oceanic. These companies are important planks in Company’s strategic plan because they:
• Deliver additional capacity and experience in the oil and gas industry;
• Extend the Group’s presence in Queensland, a state that has a substantial amount of resource projects that are expected to commence over the coming years, particularly in the Coal Seam Methane/LNG areas. Queensland is an important location for servicing the Papua New Guinea LNG market; and
• Increasing the company’s power line construction capacity, which is important with the number of greenfield resource project opportunities.
It has been pleasing to see these businesses perform in line with expectations in their first year as part of the Southern Cross group. Over the near term further integration of these businesses is expected to yield substantial growth in their respective specialist areas.
Chairman’s Review (continued)
For
per
sona
l use
onl
y

9
Southern Cross Electrical Engineering Limited Annual Report 2010
Finally I would like to thank the contribution of everyone in the Southern Cross group and particularly Simon Buchhorn, the Company’s Chief Operating Officer, who assumed the role of acting Chief Executive Officer whilst the Managing Director recruitment process was being undertaken. Simon’s 28 years of experience with Southern Cross resulted in the Company continuing to achieve the objectives it set itself at the start of 2010.
With $40 million currently on the order book, 2011 will be another solid year for Southern Cross. The Group has $250 million worth of international and domestic tenders currently in the decision phase, as well as a healthy pipeline of opportunity in its key sectors. Southern Cross expects to secure a number of new projects in the coming months, further increasing the order book for FY2011 and beyond.
Gianfranco TomasiChairman
People and processes
During the year, the team at Southern Cross has achieved a significant amount. Led initially by Stephen Pearce who contributed to the development of the Company’s strategy and structural transformation, through to the recent appointment of Simon High as Managing Director. Simon’s depth of experience in the international resources markets, especially Oil & Gas, and his proven ability to successfully grow companies in a structured and sustainable manner, will be a valuable asset to the business.
Management and the Board made a conscious decision at the start of 2010 to retain our key people across what we expected to be a slower year. This was considered to be important because we were very confident that our clients would re-commence their expansion plans. We believe the experience of these people is important to maintaining our reputation, our core competitive advantage.
Over the next 12 months the industry will start to experience the capacity constraints that were experienced in 2008. Southern Cross recognises this issue and has been investing in apprentices as well as working with indigenous communities to increase the number of skilled people entering our business.
For
per
sona
l use
onl
y

10
Southern Cross Electrical Engineering Limited Annual Report 2010
Gianfranco TomasiChairperson, Non-Executive Director Frank has over 40 years experience in the electrical construction industry.
Frank has been the owner and Chairman of the Company since 1978. Prior to SCEE, he worked at Transfield (WA) Pty Ltd from 1968 – 1978, serving as the National Electrical Manager from 1971 – 1978.
Frank holds an Electrical Engineering Certificate (NSW), MAICD.
Brian CarmanNon-Executive Director Brian commenced work with SCEE in 1981 as a contracts manager and progressed to Managing Director. He held this position through to his retirement in August 2007.
Brian has over 35 years experience in the electrical construction industry having served in senior positions with Mt Newman Mining Company, Soake Electrical and Transel Pty Ltd.
Brian is a member of the Audit and Risk Management Committee and is the Chairman of the Nomination and Remuneration Committee.
Directors’ ReportFor the year ended 30 June 2010
Your directors submit their report for Southern Cross Electrical Engineering Limited (“Southern Cross”, “SCEE” or “the Company”) the year ended 30 June 2010.
Directors
The names and details of the Company’s directors in office during the financial year and until the date of this report are as follows. Directors were in office for this entire period unless otherwise stated.
Simon HighManaging Director Simon High has over 34 years’ experience in many aspects of the resource industry (oil & gas as well as mineral processing) on a global basis. He graduated in the UK with a Bachelor of Science Degree in Civil Engineering and has worked in Project Management roles in the UK, Norway, Europe and South Africa.
For the past 18 years he has worked in corporate management roles as Engineering Director, Managing Director, President and Chief Operating Officer with John Brown Engineers & Constructors, Aberdeen; Kvaerner Oil & Gas, Houston; United Construction, Australia; Clough Limited, Perth, Western Australia and currently Southern Cross Electrical Engineering. He has proven experience in CAPEX and OPEX contracting roles where he has been responsible for execution of world size projects, both offshore and onshore in addition to growing new and existing businesses. Mr. High has a track record in developing strong customer relations based on industry knowledge, performance and trust.
Simon’s qualifications are B.Sc (Civil Engineering), FIEA and MAICD.
For
per
sona
l use
onl
y

11
Southern Cross Electrical Engineering Limited Annual Report 2010
Douglas Fargher Independent Non-Executive Director Douglas has over 37 years experience in the construction and mining industry in Australia and overseas.
Douglas has served in a range of senior maintenance and operating roles in underground and open cut mining and was previously a Project Manager with Rio Tinto, specialising in construction of new and brown field projects including Dampier Port Upgrade.
Douglas’ qualifications are BE (Mechanical), MIE Aust, CP Eng, MAICD.
Douglas is a member of the Audit and Risk Management Committee and the Nomination and Remuneration Committee.
John Cooper Independent Non-Executive Director
John has over 30 years engineering and construction experience in Australia and overseas and has provided consultancy services for a number of years to the major projects industry. John’s qualifications are B.Sc (Building) (Hons), FIE Aust, FAICD, FAIM.
John was previously the Australian Chief Executive of Murray & Roberts and a Director and General Manager of Concrete Constructions Group.John is the Chairman of the Audit and Risk Management Committee and a member of the Nomination and Remuneration Committee.
John has been a director of the following listed companies over the last three years:
Clough Limited August (2006 to 2010) Murray and Roberts International Limited (January 2008 to 2010).
Stephen brings over 20 years experience in senior management roles in the mining, oil and gas, and utilities industries. He previously held the position of Chief Financial Officer with Alinta Limited, an $8bn energy and utility company based in Western Australia.
Stephen has a Bachelor of Business from RMIT, has a Graduate Diploma in Company Secretarial Practice, and is a Chartered Accountant, a Chartered Secretary and a Member of the Australian Institute of Company Directors.
Stephen is a director of Amadeus Energy Limited (July 2008 to present), Chairman of Surtron Technologies Pty Ltd and a member of the Western Australian Business and Industry Committee for the Salvation Army.
Stephen resigned from SCEE on 26 February 2010.
Stephen Pearce Managing Director (resigned 26 February 2010 )
For
per
sona
l use
onl
y
12
Southern Cross Electrical Engineering Limited Annual Report 2010Southern Cross Electrical Engineering Limited Annual Report 2010
Directors’ Report (continued)
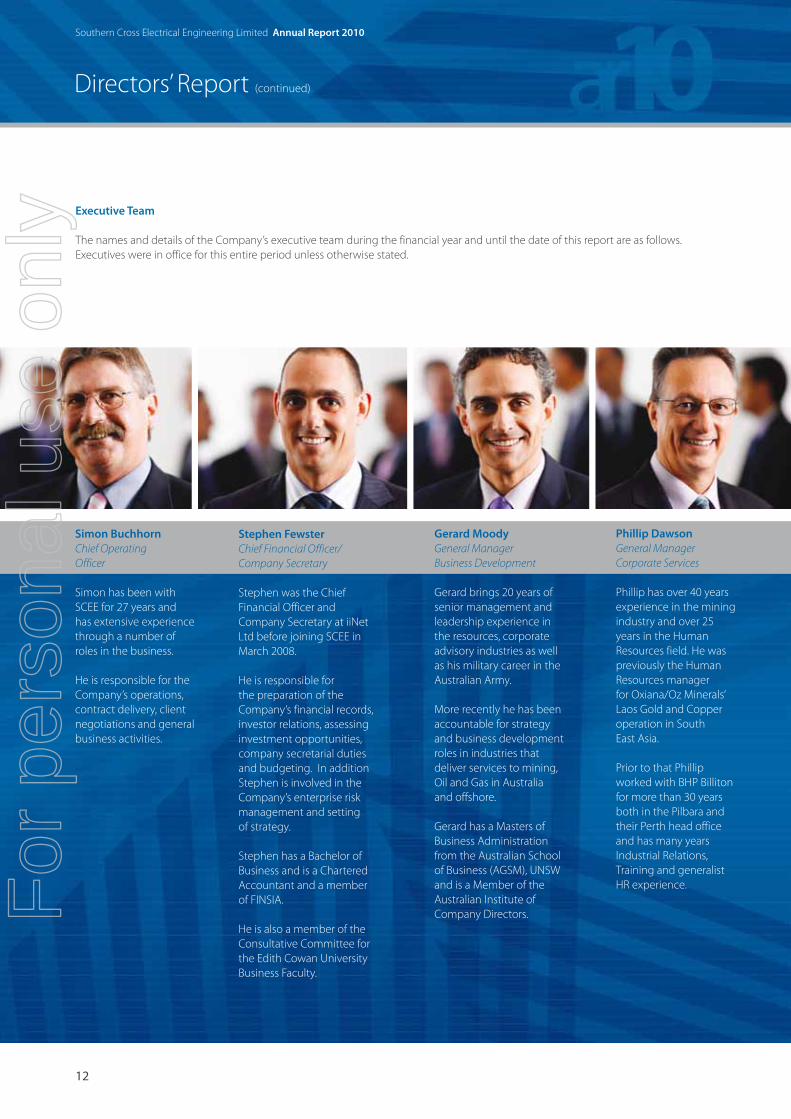
Executive Team
The names and details of the Company’s executive team during the financial year and until the date of this report are as follows. Executives were in office for this entire period unless otherwise stated.
Stephen FewsterChief Financial Officer/Company Secretary
Stephen was the Chief Financial Officer and Company Secretary at iiNet Ltd before joining SCEE in March 2008.
He is responsible for the preparation of the Company’s financial records, investor relations, assessing investment opportunities, company secretarial duties and budgeting. In addition Stephen is involved in the Company’s enterprise risk management and setting of strategy.
Stephen has a Bachelor of Business and is a Chartered Accountant and a member of FINSIA.
He is also a member of the Consultative Committee for the Edith Cowan University Business Faculty.
Gerard MoodyGeneral Manager Business Development
Gerard brings 20 years of senior management and leadership experience in the resources, corporate advisory industries as well as his military career in the Australian Army.
More recently he has been accountable for strategy and business development roles in industries that deliver services to mining, Oil and Gas in Australia and offshore.
Gerard has a Masters of Business Administration from the Australian School of Business (AGSM), UNSW and is a Member of the Australian Institute of Company Directors.
Phillip DawsonGeneral Manager Corporate Services
Phillip has over 40 years experience in the mining industry and over 25 years in the Human Resources field. He was previously the Human Resources manager for Oxiana/Oz Minerals’ Laos Gold and Copper operation in South East Asia.
Prior to that Phillip worked with BHP Billiton for more than 30 years both in the Pilbara and their Perth head office and has many years Industrial Relations, Training and generalist HR experience.
Simon BuchhornChief Operating Officer
Simon has been with SCEE for 27 years and has extensive experience through a number of roles in the business.
He is responsible for the Company’s operations, contract delivery, client negotiations and general business activities.
For
per
sona
l use
onl
y

13
Southern Cross Electrical Engineering Limited Annual Report 2010Southern Cross Electrical Engineering Limited Annual Report 2010
13
There are clear signs that a number of our blue chip international clients have begun new projects and I believe Southern Cross is well positioned to win work on these projects.
Southern Cross Electrical Engineering Limited Annual Report 2010
For
per
sona
l use
onl
y

14
Southern Cross Electrical Engineering Limited Annual Report 2010Southern Cross Electrical Engineering Limited Annual Report 2010
Directors’ Report (continued)
Interests in the shares and options of the company and related bodies corporateAs at the date of this report, the interests of the directors in the shares and options of Southern Cross Electrical Limited were:
Director Number of ordinary shares
Number of options over ordinary shares
Gianfranco Tomasi 61,200,000 -
Simon High - -
Brian Carman 2,000,000 -
John Cooper 100,000 -
Douglas Fargher 200,000 -
Directors’ Meetings
The number of directors’ meetings (including meetings of committees of directors) and number of meetings attended by each of the directors of the Company during the financial year are:
Director Board Meetings
Audit and Risk Management Committee Meetings
Nomination and Remuneration Committee Meetings
Number of meetings held: 11 4 6
Number of meetings attended:
Gianfranco Tomasi# 11 N/A N/A
Stephen Pearce* 7 N/A N/A
Brian Carman 10 3 6
John Cooper 10 4 6
Douglas Fargher 11 4 6
# Gianfranco Tomasi is not a member of the Audit and Risk Management Committee and the Nomination and Remuneration Committee. As the Board Chairman, Mr Tomasi has a standing invitation to attend committee meetings.* Stephen Pearce resigned as a director on 26 February 2010. Stephen was not a member of the Audit and Risk Management Committee and the Nomination and Remuneration Committee. As the Managing Director, Stephen had a standing invitation to attend committee meetings.
Dividends
Cents per share
Total amount
Declared and paid during the period (fully franked at 30%)
Final franked dividend for 2009 4.50 5,439,706
Interim franked dividend for 2010 2.00 2,473,579
Proposed and not recognised as a liability (fully franked at 30%)
Final franked dividend for 2010 4.50 5,588,052For
per
sona
l use
onl
y

15
Southern Cross Electrical Engineering Limited Annual Report 2010Southern Cross Electrical Engineering Limited Annual Report 2010
Principal Activities
The principal activities during the year of the entities within the consolidated group was the provision of large scale specialised electrical, control and instrumentation installation and testing services for the resources, infrastructure and heavy industrial sectors. The group’s major projects were during 2010 were:
• Pluto;• Tiwest;
Operating and Financial Review
A review of operations of the consolidated entity during the financial year, the results of those operations, the changes in the state of affairs and the likely developments in the operations of the consolidated entity are set out in the Chairman’s Report.
Operating results for the year were: 2010 2009
Revenue $97,375,796 $100,321,904
Net profit after income tax $8,675,437 $15,464,156
Significant Changes in the State of Affairs
There have been no significant changes in the state of affairs of the Company or Group during this financial year.
Significant Events After Balance Date
Other than the dividend declared above, there are no matters or circumstances that have arisen since the end of the financial year which significantly affected or may significantly affect the operations of the consolidated entity, the results of those operations, or the state of affairs of the consolidated entity in subsequent financial years.
Likely Developments and Expected Results
Other than as referred to in this report, further information as to the likely developments in the operations of the consolidated entity would, in the opinion of the directors, be likely to result in unreasonable prejudice to the consolidated entity.
Environmental Regulation and Performance
The operations of the Group are subject to the environmental regulations that apply to our clients. During 2010 the Group complied with the regulations.
Share Options
During the reporting period, 500,000 shares were issued at a price of $1.15 per share on the exercise of options previously granted as remuneration.
No options were issued during the year.
• Brockman 4; and• Cape Lambert.
For
per
sona
l use
onl
y

16
Southern Cross Electrical Engineering Limited Annual Report 2010Southern Cross Electrical Engineering Limited Annual Report 2010
Directors’ Report (continued)
Expiry date Exercise price Number of shares
28 November 2012 $1.15 166,667
28 November 2013 $1.15 166,667
28 November 2014 $1.15 166,666
4 March 2013 $1.15 93,334
4 March 2014 $1.15 157,407
4 March 2015 $1.15 166,666
917,407
Share Options (continued)
At the date of this report unissued ordinary shares of the Company under options are:
Indemnification and Insurance of Directors and Officers
During or since the end of the financial year, the Company has paid premiums in respect of a contract insuring all the directors of the Company against a liability incurred in their role as directors of the Company, except where:
a) the liability arises out of conduct involving a wilful breach of duty; orb) there has been a contravention of Sections 182 or 183 of the Corporations Act 2001.
The total amount of insurance contract premiums paid was $18,307 (2009: $19,821).
Proceedings on Behalf of Company
No person has applied for leave of Court to bring proceedings on behalf of the Company or intervene in any proceedings to which the Company is a party for the purpose of taking responsibility on behalf of the Company for all or any part of those proceedings.
The Company was not a party to any such proceedings during the year.
Non-audit ServicesThe board of directors, in accordance with advice from the audit committee, is satisfied that the provision of non-audit services during the year is compatible with the general standard of independence for auditors imposed by the Corporations Act 2001.
The directors are satisfied that the services disclosed below did not compromise the external auditor’s independence for the following reasons:
All options expire on the earlier of their expiry date or termination of the employee’s employment. The vesting of the options is conditional on the employee being employed on the vesting date and the Company achieving a minimum total shareholder return (“TSR”). Further details are contained in the Remuneration Report.
• all non-audit services are reviewed and approved by the audit committee prior to commencement to ensure they do not adversely affect the integrity and objectivity of the auditor; and
• the nature of the services provided do not compromise the general principles relating to auditor independence in accordance with APES 110: Code of Ethics for Professional Accountants set by the Accounting Professional and Ethical Standards Board.
During the year ended 30 June 2010 the external auditors performed an agreed upon procedures engagement on the acquired working capital position of Oceanic Industries Pty Ltd.
Auditor’s Independence Declaration
The lead auditor’s independence declaration for the year ended 30 June 2010 has been received and can be found on page 75.
For
per
sona
l use
onl
y

17
Southern Cross Electrical Engineering Limited Annual Report 2010Southern Cross Electrical Engineering Limited Annual Report 2010
Remuneration reportRemuneration report – audited
This Remuneration Report outlines the director and executive remuneration arrangements of the Group in accordance with the requirements of the Corporations Act 2001 and its Regulations. For the purposes of this report Key Management Personnel (KMP) of the Group are defined as those persons having authority and responsibility for planning, directing and controlling the major activities of the Company and the Group, directly or indirectly, including any director (whether executive or otherwise) of the parent company and includes the five executives in the Parent and the Group receiving the highest remuneration.
For the purposes of this report, the term ‘executive’ encompasses the Chief Executive, senior executives, general managers and secretaries who meet the definition of an executive under the Corporations Act 2001.
Nomination and Remuneration Committee
The Nomination and Remuneration Committee of the Board of Directors is responsible for determining and reviewing remuneration arrangements for the directors and executive.The Nomination and Remuneration Committee assesses the appropriateness of the nature and amount of remuneration of executives on a periodic basis by reference to relevant employment market conditions with the overall objective of ensuring maximum stakeholder benefit from the retention of a high quality, high performing director and executive team.
Remuneration Philosophy
The performance of the Group depends upon the quality of its directors and executives. To prosper, the Group must attract, motivate and retain highly skilled directors and executives.To this end the Group embodies the following principles in its remuneration framework:
• provide competitive rewards to attract high calibre executives;• link executive rewards to shareholder value;• have a significant portion of executive remuneration ‘at risk’; and• establish appropriate, demanding performance hurdles for variable executive remuneration.
Remuneration Structure
In accordance with best practice corporate governance, the structure of the non-executive director and executive remuneration is separate and distinct.
Non- Executive Director Remuneration
Objective
The Board seeks to set aggregate remuneration at a level that provides the Group with the ability to attract and retain directors of the highest calibre, whilst incurring a cost that is acceptable to shareholders.
Structure
The Constitution and the ASX Listing Rules specify that the aggregate remuneration of non-executive directors shall be determined from time to time by a general meeting. The aggregate remuneration as approved by shareholders at the annual general meeting held on 26 November 2008 is $600,000 per year.
The amount of aggregate remuneration sought to be approved by shareholders and the fee structure is reviewed annually. The Board considers advice from external consultants as well as the fees paid to non-executive directors of comparable companies when undertaking the annual review process.
Each non-executive director receives a base fee of $55,000 for being a director of the Group. The chairman of the Company’s Board receives an annual fee of $120,000. An additional fee of $7,500 is also paid for each Board committee on which a non-executive director sits and $10,000 if the director is a Chair of a Board Committee. Directors receive superannuation at the statutory rate in addition to their director fees and committee fees. The payment of additional fees for serving on a committee recognises the additional time commitment required by the non-executive directors who serve on one or more sub-committees.
The non-executive directors do not receive retirement benefits, nor do they participate in any incentive programs.
The remuneration of non-executive directors for the period ended 30 June 2010 and 30 June 2009 is detailed in table 1 of this report.
Executive Remuneration
Objectives
The Group aims to reward executives with a level and mix of remuneration commensurate with their position and responsibilities within the Group so as to:
• reward executives for Group, business unit and individual performance against targets set by reference to appropriate benchmarks;• align the interests of executives with those of shareholders; and• ensure remuneration is competitive by market standards.
For
per
sona
l use
onl
y

18
Southern Cross Electrical Engineering Limited Annual Report 2010Southern Cross Electrical Engineering Limited Annual Report 2010
Directors’ Report (continued)
Remuneration report (continued)
Structure
In determining the level and make-up of executive remuneration, the Nomination and Remuneration Committee reviews comparative Australian listed companies as well as referencing independent research on executive remuneration.The Company has entered into contracts of employment with the Managing Director and the executives. Details of these contracts contain the following key elements:
• Fixed remuneration;• At risk remuneration; – Short term incentive (STI); and – Long term incentive.
The proportion of fixed remuneration and variable remuneration (potential and long term incentives) for each executive is set out in table 1.
Fixed Remuneration
Objective
Fixed remuneration is reviewed annually by the Nomination and Remuneration Committee. This process consists of a review of company, business unit and individual performance, relevant comparative remuneration externally and internally and, where appropriate external research.
Structure
Executives are given the opportunity to receive their fixed (primary) remuneration in a variety of forms including cash and fringe benefits such as motor vehicles. It is intended that the manner of payment chosen will be optimal for the recipient without undue cost for the Group. There are no guaranteed base pay increases for any executive.
Variable Remuneration – Short Term Incentive (STI)
Objective
The purpose of the STI program is to link the achievement of the Group’s operational targets with the remuneration received by the executives charged with meeting those targets. The total potential STI available is set at a level so as to provide sufficient incentive to the executive to achieve the operational targets and such that the cost to the Group is reasonable in the circumstances.
Structure
Actual STI payments granted to each executive depend on the extent to which specific targets as set at the beginning of the financial year are met.
The targets consist of a number of Key Performance Indicators (KPIs) covering both financial and non-financial, corporate and individual measures of performance.
The financial KPI used to assess performance is net profit after tax compared to budget. This objective accounts for 50% of the Managing Director’s STI and the executive team’s STI. The non-financial KPIs are business planning and strategy execution, systems and process improvements, health and safety, and people development. These KPIs account for 50% of the Managing Director’s STI and 50% of the executive team’s STI. No bonus is awarded where performance falls below the minimum threshold. These measures were chosen as they represent the key drivers for the short term success of the business and provide a framework for delivering long term value.
The performance evaluation in respect of the year ended 30 June 2010 has taken place in accordance with this process. The Nomination and Remuneration Committee recommends the cash incentive to be paid to the individuals for approval by the board. The method of assessment was chosen as it provides the committee with an objective assessment of the individual’s performance.
Variable Remuneration – Long Term Incentive (LTI)
Objective
The objective of the LTI plan is to retain and reward the members of the executive management team in a manner which aligns this element of remuneration with the creation of shareholder wealth.
Structure
LTI grants to executives are delivered at the discretion of the Nomination and Remuneration Committee in the form of options under the Senior Management Long Term Incentive Plan. During the year ended 30 June 2010, there were nil options issued.
Consequences of performance on shareholder wealth
In considering the Group’s performance and benefits for shareholder wealth, the remuneration committee have regard to the following indices in respect of the current year and the previous four financial years.F
or p
erso
nal u
se o
nly

19
Southern Cross Electrical Engineering Limited Annual Report 2010Southern Cross Electrical Engineering Limited Annual Report 2010
2010 2009 2008*
Profit attributable to owners of the company
8,675,437 15,464,156 11,312,261
Dividends paid 7,913,285 7,200,000 9,756,478
Change in share price
13% (22%) 22%
Return on capital employed
26% 62% 44%
Remuneration report (continued)
* The Company was admitted on the Official List of Australian Securities Exchange on 26 November 2007 and official quotation commenced on 28 November 2007.
Profit is considered as one of the financial performance targets in setting the STI. Profit amounts for 2008 to 2010 have been calculated in accordance with Australian Accounting Standards (AASBs).
The overall level of key management personnel compensation takes into account the performance of the Group over a number of years.
Employment Contracts
All executives have non-fixed term employment contracts. The company or executive may terminate the employment contract by providing the other party notice as follows:
Executive Role Notice Period
Stephen Pearce Managing Director (resigned 26 February 2010)
12 months
Simon High Managing Director (appointed 2 August 2010)
12 months*
Simon Buchhorn Chief Operating Officer
3 months
Stephen Fewster Chief Financial Officer 3 months
Gerard Moody General Manager Business Development
6 months
Phillip Dawson General Manager Corporate Services
6 months
* Simon High must provide six months notice to the Company prior to resignation. All other executives must provide notice as per above.
The Group retains the right to terminate a contract immediately by making a payment in lieu of the notice period. An executive may be terminated immediately for a breach of their employment conditions. Upon termination the executive are entitled to receive their accrued annual leave and long service leave together with any superannuation benefits. There are no other termination payment entitlements.
For
per
sona
l use
onl
y

20
Southern Cross Electrical Engineering Limited Annual Report 2010Southern Cross Electrical Engineering Limited Annual Report 2010
Directors’ Report (continued)
Table 1 Remuneration of Key Management PersonnelDetails of the nature and amount of each major element of remuneration of each director of the Company, each of the four named Company executives and relevant Group executives who receive the highest remuneration and other key management personnel are:
in AUD Note
Short-term Post-emploment Termination
benefits$
Share-based
paymentsTotal $
Proportion of remuneration performance
related %
Value of options as proportion
of remunera-
tion %Salary &
fees $
STI cash bonus
$(A)
Non-monetary benefits $
Total $Super-
annuation benefits $
Options and rights
(B) $
Directors
Non-executive directors
Gianfranco Tomasi, Chairman 1 2010 120,000 120,000 10,800 130,800 -
2009 100,000 - - 100,000 9,000 - - 109,000 - -
Brian Carman 2010 72,500 72,500 6,528 79,028
2009 72,500 - - 72,500 6,528 - - 79,028 - -
John Cooper 2010 72,500 72,500 6,528 79,028
2009 72,500 - - 72,500 6,528 - - 79,028 - -
Douglas Fargher 2010 70,000 70,000 6,300 76,300
2009 70,000 - - 70,000 6,300 - - 76,300 - -
Executive directors
Gianfranco Tomasi, Executive Chairman 1 2010 - - - - - - - - - -
2009 44,444 - - 44,444 4,000 159,698 - 208,142 - -
Stephen Pearce, Managing Director 2 2010 329,466 158,956 - 488,422 9,641 - 65,716 563,778 39.9% 11.7%
2009 399,892 - - 399,892 35,998 - 36,389 472,279 7.7% 7.7%
Executives
Simon Buchhorn, Chief Operating Officer 2010 246,677 50,650 - 297,327 49,992 - 20,533 367,852 19.4% 5.6%
2009 185,040 50,000 - 235,040 100,004 - 45,528 380,572 25.1% 12.0%
Stephen Fewster, Chief Financial Officer 2010 248,562 104,700 - 353,262 22,397 - 23,581 399,240 32.1% 5.9%
2009 248,561 27,650 - 276,211 22,397 - 51,258 349,866 22.6% 14.7%
Gerard Moody, General Manager Business Development 3 2010 220,185 25,500 - 245,685 19,818 - - 265,504 9.6% -
2009 91,744 - - 91,744 8,258 - - 100,002 - -
Phillip Dawson, General Manager Corporate Services 4 2010 201,835 - - 201,835 18,168 - - 220,003 - -
2009 35,698 - - 35,698 3,238 - - 38,936 - -
Total 2010 1,581,725 339,806 - 1,921,531 150,172 - 109,830 2,181,533 20.6% 5.0%
Total 2009 1,320,379 77,650 - 1,398,029 202,251 159,698 133,175 1,893,153 11.1% 7.0%
1. Gianfranco Tomasi resigned as an executive on 1 September 2008 and remains as a non executive director and chairman2. Stephen Pearce was appointed as Managing Director on 18 August 2008 and resigned on 26 February 20103. Gerard Moody was appointed General Manager Business Development on 2 February 20094. Phillip Dawson was appointed General Manager Corporate Services on 28 April 2009
Remuneration report (continued)
For
per
sona
l use
onl
y

21
Southern Cross Electrical Engineering Limited Annual Report 2010Southern Cross Electrical Engineering Limited Annual Report 2010
Remuneration report (continued)
Notes in relation to the table of directors’ and executive officers’ remuneration – audited
A. The short term incentive bonus is for performance during the respective financial year using the criteria set out on pages 17 -19. The amount was finally determined after performance reviews were completed and approved by the Nomination and Remuneration Committee.
B. The fair value of the options is calculated at the date of grant using the Black-Scholes option model and due to the options having market related vesting conditions, a Monte Carlo Simulation analysis was performed. The use of a Monte Carlo Simulation model simulates multiple future price projections for both SCEE shares and the shares of the peer group they are tested against. The value derived from the Black-Scholes option pricing model is allocated to each reporting period evenly over the period from grant date to vesting date. The value disclosed is the fair value of the options recognised in this reporting period.
Details of performance related remuneration – audited
Details of the Group’s policy in relation to the proportion of remuneration that is performance related is discussed on pages 17 -19.
Analysis of bonuses included in remuneration - audited
Details of the vesting profile of the short term incentive cash bonuses awarded as remuneration to the Managing Director and the four named executives are detailed below.
Short term incentive bonus
Included in remuneration
$ (A)
% vested in year
% forfeited
in year
Managing Director
Stephen Pearce (B) 158,956 95% 5%
Executives
Simon Buchhorn 50,650 57% 43%
Stephen Fewster(C) 104,700 90% 10%
Gerard Moody (D) 25,500 85% 15%
Phillip Dawson (E) - 0% 0%
A. Amounts included in remuneration for the financial year represent the amount that vested in the financial year based on achievement of personal goals and satisfaction of specified performance criteria set for the 2009 financial year.
No amounts vest in future financial years in respect of the bonus schemes for the 2009 financial year.
The 2010 financial year short term incentive will be assessed by the Nomination and Remuneration Committee based on achievement of personal goals and satisfaction of specified performance criteria set for the 2010 financial year.
B. Mr Pearce resigned on 26 February 2010 and was therefore is not eligible to receive a short term incentive for the 2010 financial year. Mr Pearce’s short term incentive for the 2009 financial year was paid in the 2010 financial year. The 2009 financial year short term incentive was assessed by the Nomination and Remuneration Committee based on achievement of personal goals and satisfaction of specified performance criteria set for the 2009 financial year.
C. Included in Mr Fewster’s short term incentive bonus is a discretionary bonus of $35,000 that the Board awarded for the successful completion of the acquisitions of Hindles, K.J. Johnson & Co and Oceanic Industries.
D. Mr Moody’s short term incentive included in remuneration was pro-rated based on his commencement date of 2 February 2009.
E. Mr Dawson was appointed on 28 April 2009 and was therefore not eligible to receive a short term incentive.
For
per
sona
l use
onl
y

22
Southern Cross Electrical Engineering Limited Annual Report 2010Southern Cross Electrical Engineering Limited Annual Report 2010
Directors’ Report (continued)
Remuneration report (continued)
Granted Terms and Conditions for each GrantVested
As at 30 June 2010
ForfeitedAs at 30 June
2010
No. Grant date
Fair value per option
at grant date ($)
Exercise price per
option ($)
Vesting Date
Expiry Date No. % No. %
Executives
Simon Buchhorn
166,66728 November
20070.21 1.15
28 November 2008
28 November 2012
166,667 100% - -
Simon Buchhorn
166,66728 November
20070.22 1.15
28 November 2009
28 November 2013
166,667 100% - -
Simon Buchhorn
166,66628 November
20070.23 1.15
28 November 2010
28 November 2014
- - - -
Stephen Fewster
166,667 4 March 2008 0.21 1.15 4 March 2009 4 March 2013 93,334 56% 73,333 44%
Stephen Fewster
166,667 4 March 2008 0.22 1.15 4 March-2010 4 March 2014 157,408 94% 9,259 6%
Stephen Fewster
166,666 4 March 2008 0.23 1.15 4 March-2011 4 March 2015 - - - -
Stephen Pearce
500,000 29 April 2009 0.23 1.1526 November
200926 November
2013500,000 100% - -
Stephen Pearce
500,000 29 April 2009 0.24 1.1526 November
201026 November
2014- - 500,000* 100%
Stephen Pearce
500,000 29 April 2009 0.26 1.1526 November
201126 November
2015- - 500,000* 100%
1,084,076 93% 1,082,592 81%
Options granted as compensation – audited
Details on options over ordinary shares in the Company that were granted as compensation to key management and details on options that vested during the reporting period are as follows:
Table 2 Compensation Options : Granted and vested during 2009 and 2010 (Consolidated)
* Under the rules of the LTI plan, Mr Pearce forfeited his options that had not vested at the date of his resignation. These options have been excluded from the percentage forfeited total calculation.
No options have been granted during the financial year or since the end of the financial year. Other than 500,000 options with a value of $575,000 exercised by Mr Pearce after his date of resignation, no options were exercised or lapsed.
The above options expire on the earlier of the expiry date or termination of the individual’s employment. The options are exercisable for four years after vesting date. In addition to a continuing employment service condition, the vesting is conditional upon the following conditions:
1. The Options will vest and only become exercisable in accordance with the following tranches:
(a) one third of the Options will vest on the first anniversary after the grant date subject to the operation of the Threshold TSR Performance Hurdles;
(b) one third of the Options will vest on the second anniversary after the grant date subject to the operation of the Threshold TSR Performance Hurdles; and
(c) one third of the Options will vest on the third anniversary after the grant date subject to the operation of the Threshold TSR Performance Hurdles.
For
per
sona
l use
onl
y

23
Southern Cross Electrical Engineering Limited Annual Report 2010Southern Cross Electrical Engineering Limited Annual Report 2010
Remuneration report (continued)
The Threshold TSR Performance Hurdles (and thus the level of vesting) for each of the three tranches will be measured separately at each of the above vesting dates. Therefore the level of vesting for any one tranche is independent of the other two tranches. “TSR” means the Total Shareholder Return for a particular company for a 12 month period which is calculated as follows:
(closing share price of the applicable company’s shares on the ASX on the last day of the 12 month period minus opening share price of that company’s shares on the ASX on the first day of the 12 month period plus any dividends declared per share during the 12 month period) divided by (the opening share price of the applicable company’s shares on the ASX on the first day of the 12 month period).
“Comparative TSR” means the TSR of the following companies provided that any of the following companies whose shares are not quoted on the ASX for the relevant 12 month period will not be included:
Ausenco Ltd Lycopodium Ltd Cardno LtdWorley Parsons Ltd Sedgmen Ltd Clough LtdMonadelphous Ltd Fleetwood Ltd Coote Industrial LtdCampbell Brothers Ltd Ammtec Ltd Nomad LtdGRD Ltd Mermaid Marine Ltd VDM Group LtdMac Services Ltd Coffey Ltd
”Threshold TSR Performance Hurdles” means as follows:
(i) No Options will vest unless the percentile ranking of the Company’s TSR for the relevant 12 month period as against the Comparative TSRs for the relevant 12 month period is at or above the 50th percentile;
(ii) If the Company’s TSR for the relevant 12 month period as against Comparative TSRs is:
a) at the 50th percentile, then 50% of the Options will vest; b) between the 51st and 74th percentile then for each percentile over the 50th, an additional 2% of the Options will vest; and c) at or above the 75th percentile then 100% of the Options will vest.
2. Any Options that do not vest and become exercisable in accordance with the vesting conditions in will automatically lapse.
3. Subject to any variation of the Rules, the exercise period in respect of each Option commences on the date that the Options vest in accordance with the above conditions, and ends on the fourth anniversary of the commencement of the exercise period in respect of that Option (“Exercise Period”).
4. Any Option that is not exercised before the end of the Exercise Period will automatically lapse.
5. A Share acquired as a result of the exercise of an Option must not be sold, transferred or otherwise dealt with if doing so would result in a breach of the Listing Rules, the ASTC Settlement Rules or the terms of any restriction agreement with the Company.
6. All Shares allotted on exercise of Options will rank pari passu in all respects with other fully paid ordinary shares in the Company then on issue.
During the 2010 financial year Mr Pearce, Mr Buchhorn and Mr Fewster had options that met the continuous service vesting condition. At the vesting date these options were tested against the Threshold TSR Performance Hurdles. On the 28 November 2009 the Company’s TSR was in the 75th percentile and therefore 100% of Mr Pearce’s and Mr Buchhorn’s November 2013 options vested. On the 4 March 2010 the Company’s TSR was in the 72nd percentile and therefore 94% of Mr Fewster’s March 2014 options vested. The remaining 6% of Mr Fewster’s March 2014 options have been cancelled.For details on the options, please refer to note 29.
There were no alterations to the terms and conditions of options granted as remuneration since their grant date.During the period 1,000,000 options were forfeited due to Mr Stephen Pearce resigning prior to the options’ vesting date.The maximum grant, which will be payable assuming the service and performance criteria is met, is equal to the number of options multiplied by the fair value at the grant date. The minimum grant payable assuming that service and performance are not met is zero.
For
per
sona
l use
onl
y

24
Southern Cross Electrical Engineering Limited Annual Report 2010Southern Cross Electrical Engineering Limited Annual Report 2009
Corporate Governance Statement
24
Southern Cross Electrical Engineering Limited Annual Report 2010
For
per
sona
l use
onl
y
25
Southern Cross Electrical Engineering Limited Annual Report 2010
Corporate Governance Statement
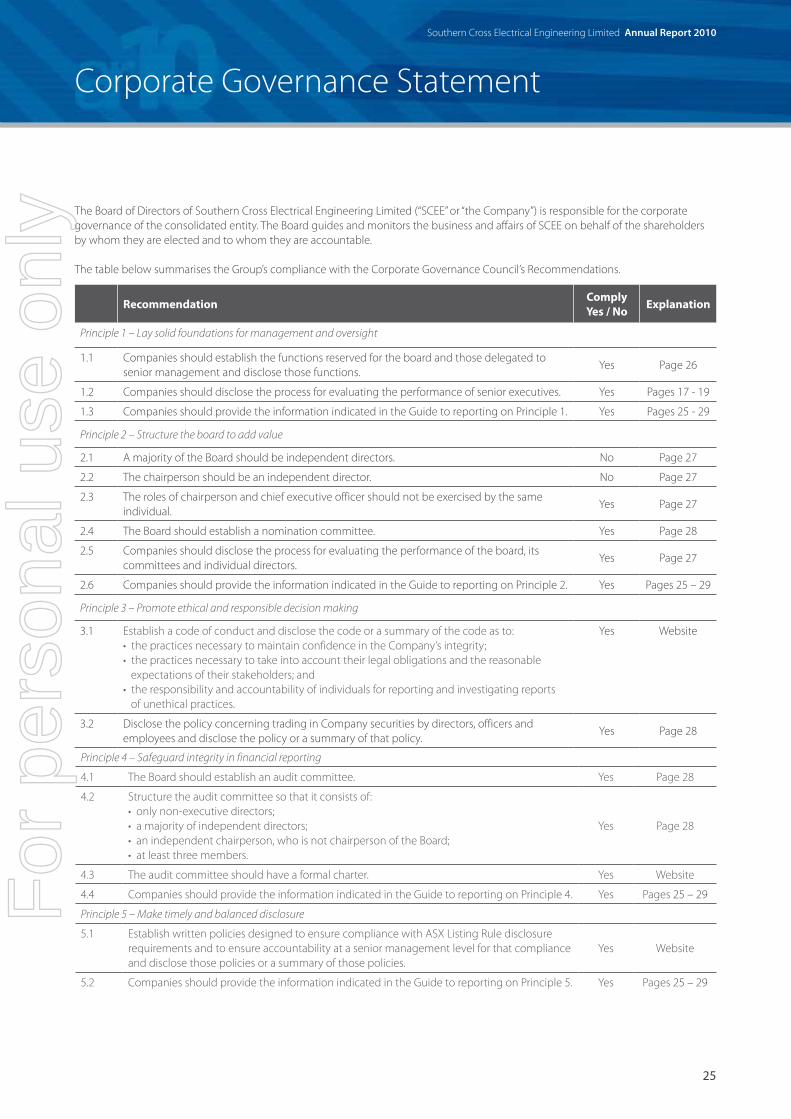
Recommendation ComplyYes / No Explanation
Principle 1 – Lay solid foundations for management and oversight
1.1 Companies should establish the functions reserved for the board and those delegated to senior management and disclose those functions.
Yes Page 26
1.2 Companies should disclose the process for evaluating the performance of senior executives. Yes Pages 17 - 19
1.3 Companies should provide the information indicated in the Guide to reporting on Principle 1. Yes Pages 25 - 29
Principle 2 – Structure the board to add value
2.1 A majority of the Board should be independent directors. No Page 27
2.2 The chairperson should be an independent director. No Page 27
2.3 The roles of chairperson and chief executive officer should not be exercised by the same individual.
Yes Page 27
2.4 The Board should establish a nomination committee. Yes Page 28
2.5 Companies should disclose the process for evaluating the performance of the board, its committees and individual directors.
Yes Page 27
2.6 Companies should provide the information indicated in the Guide to reporting on Principle 2. Yes Pages 25 – 29
Principle 3 – Promote ethical and responsible decision making
3.1 Establish a code of conduct and disclose the code or a summary of the code as to:• the practices necessary to maintain confidence in the Company’s integrity;• the practices necessary to take into account their legal obligations and the reasonable expectations of their stakeholders; and• the responsibility and accountability of individuals for reporting and investigating reports of unethical practices.
Yes Website
3.2 Disclose the policy concerning trading in Company securities by directors, officers and employees and disclose the policy or a summary of that policy.
Yes Page 28
The Board of Directors of Southern Cross Electrical Engineering Limited (“SCEE” or “the Company”) is responsible for the corporate governance of the consolidated entity. The Board guides and monitors the business and affairs of SCEE on behalf of the shareholders by whom they are elected and to whom they are accountable.
The table below summarises the Group’s compliance with the Corporate Governance Council’s Recommendations.
Principle 4 – Safeguard integrity in financial reporting
4.1 The Board should establish an audit committee. Yes Page 28
4.2 Structure the audit committee so that it consists of:• only non-executive directors;• a majority of independent directors;• an independent chairperson, who is not chairperson of the Board;• at least three members.
Yes Page 28
4.3 The audit committee should have a formal charter. Yes Website
4.4 Companies should provide the information indicated in the Guide to reporting on Principle 4. Yes Pages 25 – 29
Principle 5 – Make timely and balanced disclosure
5.1 Establish written policies designed to ensure compliance with ASX Listing Rule disclosure requirements and to ensure accountability at a senior management level for that compliance and disclose those policies or a summary of those policies.
Yes Website
5.2 Companies should provide the information indicated in the Guide to reporting on Principle 5. Yes Pages 25 – 29
For
per
sona
l use
onl
y

26
Southern Cross Electrical Engineering Limited Annual Report 2010
Corporate Governance Statement (continued)
Principle 6 – Respect the rights of shareholders
6.1 Design and disclose a communication strategy to promote effective communication with shareholders and encourage effective participation at general meetings.
Yes Website
6.2 Companies should provide the information indicated in the Guide to reporting on Principle 6. Yes Pages 25 – 29
Principle 7 – Recognise and manage risk
7.1 Companies should establish policies for the oversight and management of material business risks and disclose a summary of those policies.
Yes Page 28
7.2 The board should require management to design and implement the risk management and internal control system to manage the company’s material business risks and report to it on whether those risks are being managed effectively. The Board should disclose that management has reported to it as to the effectiveness of the company’s management of its material business risk.
Yes Page 28
7.3 The board should disclose whether it has received assurance from the chief executive officer (or equivalent) and the chief financial officer (or equivalent) that the declaration provided in accordance with section 259A of the Corporations Act is founded on a sound system of risk management and internal control and that the system is operating effectively in all material respects in relation to financial reporting risks.
Yes Page 29
7.4 Companies should provide the information indicated in the Guide to reporting on Principle 7. Yes Pages 25 – 29
Principle 8 – Remuneration fairly and responsibly
8.1 The Board should establish a remuneration committee. Yes Page 29
8.2 Clearly distinguish the structure of non-executive directors’ remuneration from that of executive directors and senior executives.
Yes Pages 17 - 20
8.3 Companies should provide the information indicated in the Guide to reporting on Principle 8. Yes Pages 25 – 29
Recommendation Comply Yes / No Reference
SCEE’s corporate governance practices were in place throughout the year ended 30 June 2010, unless otherwise stated. SCEE complies in all material respects with the Council’s best practice recommendations.
Various corporate governance practices are discussed within this statement. For further information on corporate governance policies adopted by SCEE refer to our website:www.scee.com.au
Board Functions
The Board seeks to identify the expectations of the shareholders, as well as other regulatory and ethical expectations and obligations. In addition, the Board is responsible for identifying areas of significant business risk and ensuring arrangements are in place to adequately manage those risks.
To ensure that the Board is well equipped to discharge its responsibilities it has established guidelines for the nomination and selection of directors and for the operation of the Board.The responsibility for the operation and administration of the company is delegated, by the Board, to the Managing Director and the executive management team.
The Board ensures that this team is appropriately qualified and experienced to discharge their responsibilities and has in place procedures to assess the performance of the Managing Director and the executive management team.
Whilst at all times the Board retains full responsibility for guiding and monitoring the company, in discharging its stewardship it makes use of sub-committees. Specialist committees are able to focus on a particular responsibility and provide informed feedback to the Board.
To this end the Board has established the following committees:
• Audit and Risk Management Committee; and
• Nomination and Remuneration Committee.
The roles and responsibilities of these committees are discussed throughout this Corporate Governance Statement. The Board is responsible for ensuring that management’s objectives and activities are aligned with the expectations and risk identified by the Board. The Board has a number of mechanisms in place to ensure this is achieved including:
For
per
sona
l use
onl
y

27
Southern Cross Electrical Engineering Limited Annual Report 2010
• Board approval of a strategic plan designed to meet stakeholders’ needs and manage business risk;
• ongoing development of the strategic plan and approving initiatives and strategies designed to ensure continued growth and success of the entity; and
• implementation of budgets by management and monitoring progress against budgets – via the establishment and reporting of both financial and non-financial key performance indicators.
Other functions reserved to the Board include:
• approval of the annual and half-yearly financial reports;
• approving and monitoring the progress of major capital expenditure, capital management, and acquisitions and divestitures;
• ensuring that any significant risks that arise are identified, assessed, appropriately managed and monitored; and
• reporting to shareholders.
Structure of the Board
The skills, experience and expertise relevant to the position of director held by each director in office at the date of the annual report is included in the Directors’ Report on pages 10 and 11. Directors of the Company are considered to be independent when they are independent of management and free from any business or other relationship that could materially interfere with – or could reasonably be perceived to materially interfere with – the exercise of their unfettered and independent judgement.
In the context of director independence, ‘materiality’ is considered from both the company and individual director perspective. The determination of materiality requires consideration of both quantitative and qualitative elements. An item is presumed to be quantitatively immaterial if it is equal or less than 5% of the appropriate base amount. It is presumed to be material (unless there is qualitative evidence to the contrary) if it is equal to or greater than 10% of the appropriate base amount.
Qualitative factors considered include whether a relationship is strategically important, the competitive landscape, the nature of the relationship and the contractual or other arrangements governing it and other factors which point to the actual ability of the director in question to shape the direction of the company’s loyalty.
In accordance with the definition of independence above, and the materiality thresholds set, Mr J Cooper and Mr D Fargher are considered to be independent directors.
There are procedures in place, agreed by the Board, to enable directors, in furtherance of their duties, to seek independent professional advice at the company’s expense.
The Board believes that while the Chairman is not independent, the composition of the Board with its combined skills and capability, best serve the interests of the shareholders.
The term in office held by each director in office at the date of this report is as follows:
Director Term in office (Years) Role
Gianfranco Tomasi 32 Non-Executive Director
Brian Carman 22 Non-Executive Director
John Cooper 3 Non-Executive Director
Douglas Fargher 3 Non-Executive Director
Performance
The performance of the Board and key executives is reviewed regularly against both measurable and qualitative indicators. During the reporting period, the Nomination and Remuneration Committee conducted performance evaluations of the executive team and the Board undertook performance evaluations of its performance.
These evaluations involved an assessment of each Board member’s and key executive’s performance against specific and measurable qualitative and quantitative performance criteria. The performance criteria against which directors and executives are assessed are aligned with the financial and non-financial objectives of SCEE.
Trading Policy
Under the company’s Share Trading Policy, a director, executive or other employee must not trade in any securities of the company at any time when they are in possession of unpublished, price-sensitive information in relation to those securities. A Director or Executive is not allowed to deal in Securities of the Company as a matter of course in the following periods:
• from balance date to the release of annual or half yearly results;
• within the period of 1 month prior to the issue of a prospectus; and
• where there is in existence price sensitive information that has not been disclosed because of an ASX Listing Rule exception.
For
per
sona
l use
onl
y

28
Southern Cross Electrical Engineering Limited Annual Report 2010
Corporate Governance Statement (continued)
Directors and Executives should wait at least 2 hours after the relevant release before dealing in Securities so that the market has had time to absorb the information.
Before commencing to trade, a director, executive or other employee must first notify the company secretary of their intention to do so. The notification must state that the proposed purchase or sale is not as a result of access to, or being in possession of, price sensitive information that is not currently in the public domain. As required by the ASX Listing Rules, the company notifies the ASX of any transaction conducted by the directors in the securities of the company.
Audit and Risk Management Committee
The Board has an Audit and Risk Management Committee which operates under a charter approved by the Board. It is the Board’s responsibility to ensure that an effective internal control framework exists within the entity. This includes internal controls to deal with both the effectiveness and efficiency of significant business processes, the safeguarding of assets, the maintenance of proper accounting records and the reliability of financial information as well as non-financial considerations such as the benchmarking of operational key performance indicators. The Board has delegated responsibility for the establishing and maintaining a framework of internal control and ethical standards to the Audit and Risk Management Committee.
The committee also provides the Board with additional assurance regarding the reliability of financial information for inclusion in the financial reports. All members of the Audit and Risk Management Committee are non-executive directors. The members of the audit committee during the year were:
J. Cooper (Chairman)D. FargherB. Carman
Qualifications of audit committee members
J. Cooper has over 31 years experience in the management of risks associated with the industry in which we operate.
D. Fargher has over 38 years experience in the management of risks associated with the construction industry.
B. Carman has significant experience in the management of SCEE having served as the managing director of SCEE for 19 years.
Risk
The Board determines the company’s risk profile and is responsible for overseeing and approving risk management strategy and policies, internal compliance and internal control. The company’s process of risk management and internal compliance and control includes:
• establishing the company’s goals and objectives, and implementing and monitoring strategies and policies to achieve these goals and objectives;
• continuously identifying and measuring risks that might impact upon the achievement of the company’s goals and objectives, and monitoring the environment for emerging factors and trends that affect these risks;
• formulating risk management strategies to manage identified risks, and designing and implementing appropriate risk management policies and internal controls; • monitoring the performance of, and continuously improving the effectiveness of, risk management systems and internal compliance and controls, including an annual assessment of the effectiveness of risk management and internal compliance and control. To this end, comprehensive practices are in place that are directed towards achieving the following objectives:
– effectiveness and efficiency in the use of the company’s resources; – compliance with applicable laws and regulations; and – preparation of reliable published financial information.
For details on the number of meetings of the Audit and Risk Management Committee held during the year and the attendees at those meetings, refer to page 14 of the Directors’ Report.
Managing Director and CFO Certification
The Managing Director and Chief Financial Officer have provided a written statement to the Board that:
• their views provided on the company’s and consolidated entity’s financial reports are founded on a sound system of risk management and internal compliance and control which implements the financial policies adopted by the Board; and
• that the company’s and consolidated entity’s risk management and internal compliance and control systems are operating effectively in all material respects.
Nomination and Remuneration Committee
It is the company’s objective to provide maximum stakeholder benefit from the retention of a high quality Board and executive team by remunerating directors and key executives fairly and appropriately with reference to relevant employment market conditions. To assist in achieving this objective, the Nomination and Remuneration Committee links the nature and amount of executive directors’ and officers’ emoluments to the company’s financial and operational performance.
For
per
sona
l use
onl
y

29
Southern Cross Electrical Engineering Limited Annual Report 2010
The expected outcomes of the remuneration structure are:
• retention and motivation of key executives;
• attraction of quality management to the Company; and
• performance incentives which allow executives to share the rewards of the success of SCEE.
For full discussion of the company’s remuneration philosophy and framework and the remuneration received by directors and executives in the current period, please refer to the Remuneration Report, which is contained within the Directors’ Report.
In relation to the issuing of options, discretion is exercised by the Board, having regard to the overall performance of SCEE and the performance of the individual during the period.
The SCEE Senior Management Long Term Incentive Plan rules have been approved by shareholders.
There is no scheme to provide retirement benefits, other than statutory superannuation, to directors. The Board is responsible for determining and reviewing compensation arrangements for the directors themselves and the executive team.
The Board has established a remuneration committee, comprising three non-executive directors including two independent directors. Members of the Nomination and Remuneration Committee throughout the year were:
B. Carman (Chairman) D. Fargher J. Cooper
The committee is also responsible for ensuring that the Board continues to operate within the established guidelines, including when necessary, selecting candidates for the position of director.
For details of directors’ attendance at meetings of the Nomination and Remuneration Committee, refer to page 14 of the Directors’ Report.
Signed in accordance with a resolution of the directors.
Gianfranco TomasiDirector23rd August 2010
For
per
sona
l use
onl
y

30
Southern Cross Electrical Engineering Limited Annual Report 2010
Financial Statements
30
Southern Cross Electrical Engineering Limited Annual Report 2010
For
per
sona
l use
onl
y

31
Southern Cross Electrical Engineering Limited Annual Report 2010
As at 30 June 2010
Consolidated
Note 2010 $
2009$
Assets
Current Assets
Cash and cash equivalents 14 7,497,712 31,305,768
Trade and other receivables 15 12,464,990 9,770,452
Inventories 16 1,268,865 893,165
Construction work in progress 17 15,680,806 329,258
Prepayments 18 40,780 -
Total Current assets 36,953,153 42,298,643
Non-Current Assets
Property, plant and equipment 21 12,519,400 7,505,358
Deferred tax assets 12 - 1,603,847
Goodwill and intangible assets 33 17,851,851 -
Total Non-current Assets 30,371,251 9,109,205
TOTAL ASSETS 67,324,404 51,407,848
LIABILITIES
Current Liabilities
Trade and other payables 22 9,199,104 6,696,521
Loans and borrowings 25 1,998,923 293,809
Employee benefits 23 2,756,932 1,720,390
Current tax payable - 1,327,383
Total current liabilities 13,954,959 10,038,103
Non-Current Liabilities
Loans and borrowings 25 2,935,492 61,609
Employee benefits 23 278,879 70,578
Deferred tax liability 12 2,735,103 -
Total non-current liabilities 5,949,474 132,187
TOTAL LIABILITIES 19,904,433 10,170,290
NET ASSETS 47,419,971 41,237,558
EQUITY
Contributed Equity 26 24,964,368 19,777,237
Reserves (128,586) (361,716)
Retained earnings 22,584,189 21,822,037
Total equity attributable to equity holders of the Company 47,419,971 41,237,558
TOTAL EQUITY 47,419,971 41,237,558
The above balance sheet should be read in conjunction with the accompanying notes.
Balance Sheet
Southern Cross Electrical Engineering Limited Annual Report 2010
For
per
sona
l use
onl
y

32
Southern Cross Electrical Engineering Limited Annual Report 2010
Statement of Changes in EquityAs at 30 June 2010
Share capital
$
Translation reserve
$
Options reserve
$
Retained earnings
$
Total equity
$
Balance at 1 July 2008 19,792,706 97,823 76,514 13,335,544 33,302,587
Total comprehensive income for the period
Profit for the period - - - 15,464,156 15,464,156
Other comprehensive income
Foreign currency translation - (669,228) - - (669,228)
Total comprehensive income - (669,228) - 15,464,156 14,794,928
Transactions with owners, recorded directly in equity
Increase to issue costs (15,469) - - - (15,469)
Dividends to equity holders - - - (7,200,000) (7,200,000)
Peru earnings reserve reclassified to equity - - - 222,337 222,337
Cost of share based payments - - 133,175 - 133,175
Total transactions with owners (15,469) - 133,175 (6,977,663) (6,859,957)
Balance at 30 June 2009 19,777,237 (571,405) 209,689 21,822,037 41,237,558
Balance at 1 July 2009 19,777,237 (571,405) 209,689 21,822,037 41,237,558
Total comprehensive income for the period
Profit for the period - - - 8,675,437 8,675,437
Foreign currency translation - 121,336 - - 121,336
Total comprehensive income - 121,336 - 8,675,437 8,796,773
Transactions with owners, recorded directly in equity
Issue of ordinary shares 5,187,131 - - - 5,187,131
Dividends to equity holders - - - (7,913,285) (7,913,285)
Cost of share based payments - - 111,794 - 111,794
Total transactions with owners 5,187,131 - 111,794 (7,913,285) (2,614,360)
Balance at 30 June 2010 24,964,368 (450,069) 321,483 22,584,189 47,419,971
The above statement of changes in equity should be read in conjunction with the accompanying notes.
Consolidated
Southern Cross Electrical Engineering Limited Annual Report 2010
For
per
sona
l use
onl
y

33
Southern Cross Electrical Engineering Limited Annual Report 2010
The above income statements should be read in conjunction with the accompanying notes.
Statement of Comprehensive IncomeFor the year ended 30 June 2010
Consolidated
Note 2010 $
2009$
Contract Revenue 6 97,375,796 100,321,904
Contract expenses (66,777,334) (63,757,970)
Gross profit 30,598,462 36,563,934
Other income/(loss) 7 (32,235) 406,680
Employee benefits expenses 9 (8,453,897) (6,386,594)
Occupancy expenses (739,074) (535,375)
Administration expenses (2,260,511) (2,385,942)
Other expenses 8 (845,009) (738,704)
Business combination expenses 32 (1,871,790) -
Depreciation expense 11 (1,537,977) (1,141,972)
Amortisation of customer contract intangibles 33 (1,133,152) -
Results from operations 13,724,817 25,782,027
Finance income 432,160 1,220,251
Finance expenses (298,232) (4,839,426)
Net finance expense 10 133,928 (3,619,175)
Profit before income tax 13,858,745 22,162,852
Income tax expense 12 (5,183,308) (6,698,696)
Profit after income tax 8,675,437 15,464,156
Attributable to:
Members of the parent 8,675,437 15,464,156
Earnings per share:
Basic earnings per share 13 7.11 12.89
Diluted earnings per share 13 7.11 12.89
Consolidated Comprehensive Income Statement
Profit for the period 8,675,437 15,464,156
Other comprehensive income
Foreign currency translation differences for foreign operations 121,336 (669,228)
Income tax on other comprehensive income - -
Other comprehensive income for the period, net of income tax 121,336 (669,228)
Total comprehensive income for the period 8,796,773 14,794,928
Attributed to Owners of the Company 8,796,773 14,794,928
Southern Cross Electrical Engineering Limited Annual Report 2010
For
per
sona
l use
onl
y

34
Southern Cross Electrical Engineering Limited Annual Report 2010Southern Cross Electrical Engineering Limited Annual Report 2010
For the year ended 30 June 2010
Consolidated
Note 2010 $
2009$
Cash flows from operating activities
Cash receipts from customers 98,628,622 97,274,228
Cash paid to suppliers and employees (93,756,236) (73,786,153)
Interest received 432,160 1,220,251
Interest paid (298,232) (250,915)
Income taxes paid (4,847,779) (8,754,856)
Net cash from operating activities 27 158,535 15,702,555
Cash flows from investing activities
Acquisition of subsidiaries, net of cash (19,734,960) 114,458
Proceeds from the sale of assets 6,614 -
Acquisition of property, plant and equipment (1,185,055) (2,084,614)
Net cash from (used in) investing activities (20,913,401) (1,970,156)
Cash flows from financing activities
Proceeds from exercise of options 26 575,000 -
Payments for share issue costs - (15,469)
Proceeds from borrowings 4,975,000 -
Repayment of borrowings (757,153) (791,619)
Dividends paid 26 (7,913,285) (7,200,000)
Net cash from (used in) financing activities (3,120,438) (8,007,088)
Net increase in cash and cash equivalents (23,875,304) 5,725,311
Cash and cash equivalents at 1 July 31,305,768 25,689,555
Effect of exchange rate fluctuations on cash held 67,248 (109,098)
Cash and cash equivalents at 30 June 14 7,497,712 31,305,768
The above cash flow statement should be read in conjunction with the accompanying notes.
Statement of Cash FlowF
or p
erso
nal u
se o
nly

35
Southern Cross Electrical Engineering Limited Annual Report 2010
Index to notes to the Financial ReportFor the year ending 30 June 2010
35
Southern Cross Electrical Engineering Limited Annual Report 2010
1. Reporting entity 2. Basis of preparation 3. Significant accounting policies 4. Determination of fair values5. Segment reporting 6. Revenue 7. Other income / (loss) 8. Other expenses 9. Employee benefits expense 10. Finance income and expense 11. Depreciation and amortisation expense 12. Income tax expense 13. Earnings per share 14. Cash and cash equivalents 15. Trade and other receivables16. Inventories17. Construction work in progress18. Prepayments 19. Investments in subsidiaries 20. Parent entity disclosures21. Property, plant and equipment 22. Trade and other payables 23. Employee benefits 24. Financial instruments 25. Loans and borrowings 26. Capital and reserves 27. Reconciliation of cash flows from operating activities 28. Related parties 29. Share-based payments30. Commitments 31. Contingencies32. Acquisition of subsidiaries33. Intangible assets – customer contracts and goodwill34. Subsequent events 35. Auditor’s remuneration
For
per
sona
l use
onl
y

36
Southern Cross Electrical Engineering Limited Annual Report 2010
Notes to the Financial ReportFor the year ending 30 June 2010 (continued)
1. Reporting entity
Southern Cross Electrical Engineering Limited (the Company) is a company domiciled in Australia. The address of the Company’s registered office is 41 Macedonia Street Naval Base, Western Australia. The consolidated financial statements for the year ended 30 June 2010 comprise the Company and its subsidiaries (together referred to as the “Group” and individually as “Group entities”).
Southern Cross Electrical Engineering Limited (the parent) is a company incorporated in Australia whose shares are publicly traded on the Australian Stock Exchange. The nature of the operations and principal activities of the Group are described in the Directors’ Report.
2. Basis of preparation
(a) Statement of compliance
The financial report is a general purpose financial report which has been prepared in accordance with Australian Accounting Standards (“AASBs”) (including Australian Accounting Interpretations) adopted by the Australian Accounting Standards Board (AASB) and the Corporations Act 2001. The consolidated financial report of the Group complies with International Financial Reporting Standards (IFRSs) and interpretations adopted by the International Accounting Standards Board (IASB).
The consolidated financial statements were authorised for issue by the Board of Directors on 23rd August 2010.
(b) Basis of measurement
The consolidated financial statements have been prepared on the historical cost basis except for the following material items in the statement of financial position:
• Derivative financial instruments are measured at fair value;
• Financial instruments at fair value through profit or loss are measured at fair value; and
• Share-based payment arrangements are measured at fair value.
The methods used to measure fair values are discussed further in note 4.
(c) Functional and presentation currency (i) Functional and presentation currency
Both the functional and presentation currency of Southern Cross Electrical Engineering Limited and its Australian subsidiaries are Australian dollars ($). The functional currency in Tanzanian subsidiary is United States dollars and Neuvos soles for the Peruvian subsidiary. The overseas functional currencies are translated to presentation currency (see below).
(ii) Transactions and balances Transactions in foreign currencies are initially recorded in the functional currency by applying the exchange rates ruling at the date of the transaction. Monetary assets and liabilities denominated in foreign currencies are translated at the rate of exchange ruling at the balance sheet date. Non-monetary items that are measured in terms of historical cost in a foreign currency are translated using the exchange rate as at the date of the initial transaction. Non-monetary items measured at fair value in a foreign currency are translated using the exchange rates at the date when the fair value was determined.
(iii) Translation of Group Entities functional currency to presentation currency
The results of the overseas subsidiaries are translated into Australian Dollars as at the date of each transaction. Assets and liabilities are translated at exchange rates prevailing at balance date.
Exchange variations resulting from the translation are recognised in the foreign currency translation reserve in equity. (d) Use of estimates and judgements
The preparation of financial statements in conformity with AASBs requires management to make judgements, estimates and assumptions that affect the application of accounting policies and the reported amounts of assets, liabilities, income and expenses. Actual results may differ from these estimates. Estimates and underlying assumptions are reviewed on an ongoing basis. Revisions to accounting estimates are recognised in the period in which the estimate is revised and in any future periods affected.
Information about critical judgements in applying accounting policies that have the most significant effect on the amounts recognised in the financial statements is included in the following notes:
• Note 17 – construction work in progress;• Note 29 – measurement of share based payments;• Note 24 – valuation of financial instruments; and• Note 33 – recoverable amount for testing goodwill.
(e) Corporations Act amendments
During the year the Company has adopted the recent changes to the Corporations Act opting not to disclose parent company statements.
For
per
sona
l use
onl
y

37
Southern Cross Electrical Engineering Limited Annual Report 2010
3. Significant accounting policies
The accounting policies set out below have been applied consistently to all periods presented in these consolidated financial statements, and have been applied consistently by Group entities.
(a) Basis of consolidation
(i) Subsidiaries
Subsidiaries are entities controlled by the Group. The financial statements of subsidiaries are included in the consolidated financial statements from the date that control commences until the date control ceases. The accounting policies of subsidiaries have been changed when necessary to align them with the policies adopted by the Group.
(ii) Transactions eliminated on consolidation
Intra-group balances, and any unrealised income and expenses arising from intra-group transactions, are eliminated in preparing the consolidated financial statements. Unrealised gains arising from transactions with equity accounted investees are eliminated against the investments to the extent of the Group’s interest in the investee. Unrealised losses are eliminated in the same way as unrealised gains, but only to the extent that there is no evidence of impairment.
Gains and losses are recognised when the contributed assets are consumed or sold by the equity accounted investee or, if not consumed or sold by the equity accounted investee, when the Group’s interest in such entities is disposed of. (b) Foreign currency
(i) Foreign currency transactions
Transactions in foreign currencies are translated to the respective functional currencies of Group entities at exchange rates at the dates of the transactions.
Monetary assets and liabilities denominated in foreign currencies at the reporting date are retranslated to the functional currency at the foreign exchange rate at that date. The foreign currency gain or loss on monetary items is the difference between amortised cost in the functional currency at the beginning of the period, adjusted for effective interest and payments during the period, and the amortised cost in foreign currency translated at the exchange rate at the end of the period. Non-monetary assets and liabilities denominated in foreign currencies that are measured at fair value are retranslated to the functional currency at the exchange rate at the date that the fair value was determined.
Foreign currency differences arising on retranslation are recognised in profit or loss, except for differences arising on the retranslation of available-for-sale equity instruments or a financial liability designated as a hedge of the net investment in a foreign operation, or qualifying cash flow hedges which are recognised directly in equity.
(ii) Foreign operations The assets and liabilities of foreign operations, including goodwill and fair value adjustments arising on acquisition, are translated to Australian dollars at exchange rates at the reporting date. The income and expenses of foreign operations, excluding foreign operations in hyperinflationary economies, are translated to Australian dollars at exchange rates at the dates of the transactions.
Foreign currency differences are recognised directly in equity in a foreign currency translation reserve (“FCTR”). When a foreign operation is disposed of, in part or in full, the relevant amount in the FCTR is transferred to profit or loss. Foreign exchange gains and losses arising from a monetary item receivable from or payable to a foreign operation, the settlement of which is neither planned nor likely in the foreseeable future, are considered to form part of a net investment in a foreign operation and are recognised directly in equity in the FCTR.
(c) Cash and cash equivalents
Cash and cash equivalents in the balance sheet comprise cash at bank and on hand and short term deposits with an original maturity of three months or less that are readily convertible to known amounts of cash and which are subject to an insignificant risk of changes in value.
For the purposes of the Cash Flow Statement, cash and cash equivalents consist of cash and cash equivalents as defined above, net of outstanding bank overdrafts.
(d) Financial instruments
(i) Non-derivative financial assets
The Group initially recognises loans and receivables and deposits on the date that they are originated. All other financial assets (including assets designated at fair value through profit or loss) are recognised initially on the trade date at which the Group becomes a party to the contractual provisions of the instrument.
For
per
sona
l use
onl
y

38
Southern Cross Electrical Engineering Limited Annual Report 2010
Notes to the Financial ReportFor the year ending 30 June 2010 (continued)
(d) Financial instruments (continued)
The Group derecognises a financial asset when the contractual rights to the cash flows from the asset expire, or it transfers the rights to receive the contractual cash flows on the financial asset in a transaction which substantially all the risks and rewards of ownership of the financial asset are transferred. Any interest in transferred financial assets that is created or retained by the Group is recognised as a separate asset or liability.
Financial assets and liabilities are offset and the net amount presented in the statement of financial position when, and only when, the Group has a legal right to offset the amounts and intends either to settle on a net basis or to realise the asset and settle the liability simultaneously. Financial assets at fair value through profit or loss
A financial asset is classified at fair value through profit or loss if it is classified as held for trading or is designated as such upon initial recognition. Financial assets are designated at fair value through profit or loss it the Group manages such investments and makes purchase and sale decisions based on their fair value in accordance with the Group’s documented risk management or investment strategy. Upon initial recognition attributable transaction costs are recognised in the profit or loss when incurred.
Financial asset at fair value through profit or loss are measured at fair value, and changes therein are recognised in profit or loss.
Loans and receivables Loans and receivables are non-derivative financial assets with fixed or determinable payments that are not quoted in an active market. Such assets are recognised initially at fair value plus any directly attributable transaction costs. Subsequent to initial recognition loans and receivables are measured at amortised cost using the effective interest method, less any impairment losses.
Loans and receivables comprise trade and other receivables (see note 15).
Cash and cash equivalents comprise cash balances and call deposits with original maturities of three months or less.
(ii) Non-derivative financial liabilities
The Group initially recognises debt securities issued and subordinated liabilities on the date they are originated.
All other financial liabilities (including liabilities designated at fair value through profit or loss) are recognised initially on the trade date at which the Group becomes party to the contractual provisions of the instrument. The Group derecognises a financial liability when its contractual obligations are discharged or cancelled or expire. Financial assets and liabilities are offset and the net amount presented in the statement of financial position when, and only when, the Group has a legal right to offset the amounts and intends either to settle on a net basis or to realise the asset and settle the liability simultaneously.
The Group has the following non-derivative financial liabilities: loans and borrowings and trade and other payables.
(iii) Share capital
Ordinary shares Ordinary shares are classified as equity. Incremental costs directly attributable to the issue of ordinary shares and share options are recognised as a deduction from equity, net of any tax effects.
(e) Property, plant and equipment
(i) Recognition and measurement
Items of property, plant and equipment are measured at cost less accumulated depreciation and impairment losses. Cost includes expenditure that is directly attributable to the acquisition of the asset. The cost of self-constructed assets includes the cost of materials and direct labour, any other costs directly attributable to bringing the asset to a working condition for its intended use, and the costs of dismantling and removing the items and restoring the site on which they are located.
Purchased software that is integral to the functionality of the related equipment is capitalised as part of that equipment. Borrowing costs related to the acquisition or construction of qualifying assets are recognised in profit or loss as incurred. When parts of an item of property, plant and equipment have different useful lives, they are accounted for as separate items (major components) of property, plant and equipment.
Gains and losses on disposal of an item of property, plant and equipment are determined by comparing the proceeds from disposal with the carrying amount of property, plant and equipment and are recognised net within “other income” in profit or loss.
For
per
sona
l use
onl
y

39
Southern Cross Electrical Engineering Limited Annual Report 2010
(ii) Subsequent costs The cost of replacing part of an item of property, plant and equipment is recognised in the carrying amount of the item if it is probable that the future economic benefits embodied within the part will flow to the Group and its cost can be measured reliably. The carrying amount of the replaced part is derecognised. The costs of the day-to-day servicing of property, plant and equipment are recognised in profit or loss as incurred.
(iii) Depreciation
Depreciation is calculated over the depreciable amount, which is the cost of an asset, or other amount substituted for cost, less its residual value.
Depreciation is recognised in profit or loss on a straight-line basis over the estimated useful lives of each part of an item of property, plant and equipment, since this most closely reflects the expected pattern of consumption of the future economic benefits embodied in the asset. Leased assets are depreciated over the shorter of the lease term and their useful lives unless it is reasonably certain that the Group will obtain ownership by the end of the lease term. Land is not depreciated.
The estimated useful lives for the current and comparative periods are as follows:
Buildings 40 years Leasehold improvements 6 – 38 years Plant and equipment 2 – 10 years Motor vehicles 2 – 10 years Office furniture and fittings 2 – 10 years
Depreciation methods, useful lives and residual values are reviewed at each reporting date.
(f) Intangible assets
(i) Goodwill
Change in accounting policy As from 1 July 2009, the Group has adopted the revised AASB 3 Business Combinations (2008) and the amended AASB 127 Consolidated and Separate Financial Statements (2008). Revised AASB 3 and AASB 127 have been applied prospectively to business combinations with an acquisition date on or after 1 July 2009.
The change in accounting policy had no impact on earnings per share. For details on the initial recognition and measurement of goodwill related to business combinations that occurred during the financial year ended 30 June 2010, see note 32.
Subsequent measurement Goodwill is considered to have an indefinite life and is measured at cost less accumulated impairment losses.
(ii) Other intangible assets
Other intangibles that are acquired by the Group and have finite useful lives are measured at cost less accumulated amortisation and accumulated impairment losses.
(iii) Subsequent expenditure
Subsequent expenditure is capitalised only when it increases the future economic benefits embodied in the specific asset to which it relates. All other expenditure including expenditure on internally generated goodwill and brands, is recognised in profit or loss as incurred.
(iv) Amortisation
Amortisation is calculated over the cost of the asset, or another amount substituted for cost, less its residual value.
Amortisation is recognised in profit or loss on a straight-line basis over the estimated useful lives of intangible assets, other than goodwill, from the date that they are available for use, since this most closely reflects the expected pattern of consumption of the future economic benefits embodied in the asset. The estimated useful lives for the current period is as follows:
• Customer contracts 1 – 5 years
Amortisation methods, useful lives and residual values are reviewed at each financial year-end and adjusted if appropriate.
(g) Leased assets Leases in terms of which the Group assumes substantially all the risks and rewards of ownership are classified as finance leases. Upon initial recognition the leased asset is measured at an amount equal to the lower of its fair value and the net present value of the minimum lease payments. Subsequent to initial recognition, the asset is accounted for in accordance with the accounting policy applicable to that asset.
Other leases are operating leases and are not recognised in the Group’s statement of financial position.
For
per
sona
l use
onl
y

40
Southern Cross Electrical Engineering Limited Annual Report 2010
Notes to the Financial ReportFor the year ending 30 June 2010 (continued)
(h) Inventories
Inventories are measured at the lower of cost and net realisable value. The cost of inventories is based on the first-in first-out principle, and includes expenditure incurred in acquiring the inventories, production or conversion costs and other costs incurred in bringing them to their existing location and condition. In the case of work in progress, cost includes an appropriate share of production overheads based on normal operating capacity.
Net realisable value is the estimated selling price in the ordinary course of business, less the estimated costs of completion and selling expenses.
(i) Construction work in progress Construction work in progress represents the gross unbilled amount expected to be collected from customers for contract work performed to date. It is measured at cost plus profit recognised to date (see note 3(m)(i)) less progress billings and recognised losses.
Cost includes all expenditure related directly to specific projects and an allocation of fixed and variable overheads incurred in the Group’s contract activities based on normal operating capacity. If payments received from customers exceed the income recognised, then the difference is presented as deferred income in the balance sheet.
(j) Impairment
(i) Financial assets
A financial asset not carried at fair value through the profit or loss is assessed at each reporting date to determine whether there is objective evidenced that it is impaired.
A financial asset is impaired if objective evidence indicates that a loss event has occurred after the initial recognition of the asset, and that the loss event had a negative effect on the estimated future cash flows of the asset that can be estimated reliably.
Objective evidence that financial asset (including equity securities) are impaired can include default or delinquency by a debtor, restructuring of an amount due to the Group on terms that the Group would not consider otherwise, indications that a debtor or issuer will enter bankruptcy, the disappearance of an active market for a security. In addition, for an investment in an equity security, a significant prolonged decline in its fair value below its cost is objective evidence of impairment.
The Group considers evidence of impairment for receivables and held-to-maturity investment securities at both a specific asset level and collective level. All individually significant receivables and held- to-maturity investment securities are assessed for specific impairment. All individually significant receivables and held-to-maturity investment securities found not to be specifically impaired are then collectively assessed for any impairment that has been incurred but not yet identified. Receivables and held-to-maturity investment securities that are not individually significant are collectively assessed for impairment by grouping together receivables and held-to-maturity investment securities with similar risk characteristics.
In assessing collective impairment the Group uses historical trends of the probability of default, timing of recoveries and the amount of loss incurred, adjusted for management’s judgement as to whether current economic and credit conditions are such that actual losses are likely to be greater or less than suggested by historical trends.
An impairment loss in respect of a financial asset measured at amortised cost is calculated as the difference between its carrying amount, and the present value of the estimated future cash flows discounted at the original effective interest rate. Losses are recognised in profit or loss and reflected in an allowance account against receivables. When a subsequent event causes the amount of impairment loss to decrease, the decrease in impairment loss is reversed through profit or loss.
(ii) Non-financial assets The carrying amounts of the Group’s non-financial assets, other than biological assets, investment property, inventories and deferred tax assets, are reviewed at each reporting date to determine whether there is any indication of impairment. If any such indication exists then the asset’s recoverable amount is estimated. For goodwill and intangible assets that have indefinite lives or that are not yet available for use, the recoverable amount is estimated each year at the same time.
The recoverable amount of an asset or cash-generating unit is the greater of its value in use and its fair value less costs to sell. In assessing value in use, the estimated future cash flows are discounted to their present value using a pre-tax discount rate that reflects current market assessments of the time value of money and the risks specific to the asset. For the purpose of impairment testing, assets are grouped together into the smallest group of assets that generates cash inflows from continuing use that are largely independent of the cash inflows of other assets or groups of assets (the “cash-generating unit”).
For
per
sona
l use
onl
y

41
Southern Cross Electrical Engineering Limited Annual Report 2010
The goodwill acquired in a business combination, for the purpose of impairment testing, is allocated to cash-generating units that are expected to benefit from the synergies of the combination. The Group’s corporate assets do not generate separate cash inflows. If there is an indication that a corporate asset may be impaired, then the recoverable amount is determined for the CGU to which the corporate asset belongs.
An impairment loss is recognised if the carrying amount of an asset or its cash-generating unit exceeds its recoverable amount. Impairment losses are recognised in profit or loss. Impairment losses recognised in respect of cash-generating units are allocated first to reduce the carrying amount of any goodwill allocated to the units and then to reduce the carrying amount of the other assets in the unit (group of units) on a pro rata basis. An impairment loss in respect of goodwill is not reversed. In respect of other assets, impairment losses recognised in prior periods are assessed at each reporting date for any indications that the loss has decreased or no longer exists. An impairment loss is reversed if there has been a change in the estimates used to determine the recoverable amount. An impairment loss is reversed only to the extent that the asset’s carrying amount does not exceed the carrying amount that would have been determined, net of depreciation or amortisation, if no impairment loss had been recognised.
(k) Employee benefits
(i) Long-term employee benefits
The Group’s net obligation in respect of long-term employee benefits is the amount of future benefit that employees have earned in return for their service in the current and prior periods plus related on costs; that benefit is discounted to determine its present value, and the fair value of any related assets is deducted. The discount rate is the yield at the reporting date on AAA credit-rated or government bonds that have maturity dates approximating the terms of the Group’s obligations.
(ii) Termination benefits Termination benefits are recognised as an expense when the Group is demonstrably committed, without realistic possibility of withdrawal, to a formal detailed plan to either terminate employment before the normal retirement date or to provide termination benefits as a result of an offer made to encourage voluntary redundancy.
Termination benefits for voluntary redundancies are recognised as an expense if the Group has made an offer encouraging voluntary redundancy, it is probable that the offer will be accepted, and the number of acceptances can be estimated reliably.
(iii) Short-term benefits Short term employee benefit obligations are measured on an undiscounted basis and are expensed as the related service is provided.
A liability is recognised for the amount expected to be paid under short-term cash bonus or profit-sharing plans if the Group has a present legal or constructive obligation to pay this amount as a result of past service provided by the employee and the obligation can be estimated reliably.
(iv) Share-based payment transactions
The grant date fair value of options granted to employees is recognised as an employee expense, with a corresponding increase in equity, over the period that the employees become unconditionally entitled to the options. The amount recognised as an expense is adjusted to reflect the number of awards for which the related service and non-market vesting conditions are expected to be met, such that the amount is ultimately recognised as an expense is based on the number of awards that do not meet the related service and non-market performance conditions at the vesting date.
(l) Provisions
A provision is recognised if, as a result of a past event, the Group has a present legal or constructive obligation that can be estimated reliably, and it is probable that an outflow of economic benefits will be required to settle the obligation. Provisions are determined by discounting the expected future cash flows at a pre-tax rate that reflects current market assessments of the time value of money and the risks specific to the liability. The unwinding of the discount is recognised as finance cost. (m) Revenue Revenue is recognised and measured at the fair value of the consideration received or receivable to the extent it is probable that the economic benefits will flow to the Group and the revenue can be reliably measured. The following specific recognition criteria must also be met before revenue is recognised:
For
per
sona
l use
onl
y

42
Southern Cross Electrical Engineering Limited Annual Report 2010
Notes to the Financial ReportFor the year ending 30 June 2010 (continued)
(m) Revenue (continued)
(i) Construction contracts
Contract revenue includes the initial amount agreed in the contract plus any variations in contract work, claims and incentive payments to the extent that it is probable that they will result in revenue and can be measured reliably. As soon as the outcome of a construction contract can be estimated reliably, contract revenue and expenses are recognised in profit or loss in proportion to the stage of completion.
The stage of completion is assessed by reference to surveys of work performed. When the outcome of a construction contract cannot be estimated reliably, contract revenue is recognised only to the extent of contract costs incurred that are likely to be recoverable. An expected loss is recognised immediately in profit or loss.
(ii) Services
Revenue from services rendered is recognised in profit or loss in proportion to the stage of completion of the transaction at the reporting date. The stage of completion is assessed by reference to surveys of work performed.
All revenue is stated net of the amount of goods and services tax (GST).
(n) Lease payments
Payments made under operating leases are recognised in profit or loss on a straight-line basis over the term of the lease. Lease incentives received are recognised as an integral part of the total expense, over the term of the lease.
Minimum lease payments made under finance leases are apportioned between the finance expense and the reduction of the outstanding liability. The finance expense is allocated to each period during the lease term so as to produce a constant periodic rate of interest on the remaining balance of the liability.
(o) Finance income and expenses
Finance income comprises interest income on funds invested, dividend income and changes in the fair value of financial assets at fair value through profit or loss. Interest income is recognised as it accrues in profit or loss, using the effective interest method. Dividend income is recognised in profit or loss on the date that the Group’s right to receive payment is established, which in the case of quoted securities is the ex-dividend date.
Finance expenses comprise interest expense on borrowings, bank charges and lease payments. All borrowing costs are recognised in profit or loss using the effective interest method.
Foreign currency gains and losses are reported on a net basis.
(p) Income tax
Income tax expense comprises current and deferred tax. Income tax expense is recognised in profit or loss except to the extent that it relates to items recognised directly in equity, in which case it is recognised in equity.
Current tax is the expected tax payable on the taxable income for the year, using tax rates enacted or substantively enacted at the reporting date, and any adjustment to tax payable in respect of previous years.
Deferred tax is recognised using the balance sheet method, providing for temporary differences between the carrying amounts of assets and liabilities for financial reporting purposes and the amounts used for taxation purposes. Deferred tax is not recognised for the following temporary differences: the initial recognition of assets or liabilities in a transaction that is not a business combination and that affects neither accounting nor taxable profit, and differences relating to investments in subsidiaries and jointly controlled entities to the extent that it is probable that they will not reverse in the foreseeable future. In addition, deferred tax is not recognised for taxable temporary differences arising on the initial recognition of goodwill. Deferred tax is measured at the tax rates that are expected to be applied to the temporary differences when they reverse, based on the laws that have been enacted or substantively enacted by the reporting date. Deferred tax assets and liabilities are offset if there is a legally enforceable right to offset current tax liabilities and assets and they relate to income taxes levied by the same tax authority on the same taxable entity, or on different tax entities, but they intend to settle current tax liabilities and assets on a net basis or their tax assets and liabilities will be realised simultaneously.
A deferred tax asset is recognised to the extent that it is probable that future taxable profits will be available against which the temporary difference can be utilised.
Deferred tax assets are reviewed at each reporting date and are reduced to the extent that it is no longer probable that the related tax benefit will be realised.
Additional income taxes that arise from the distribution of dividends are recognised at the same time as the liability to pay the related dividend is recognised.
For
per
sona
l use
onl
y

43
Southern Cross Electrical Engineering Limited Annual Report 2010
(q) Goods and services tax
Revenue, expenses and assets are recognised net of the amount of goods and services tax (GST), except where the amount of GST incurred is not recoverable from the taxation authority. In these circumstances, the GST is recognised as part of the cost of acquisition of the asset or as part of the expense.
Receivables and payables are stated with the amount of GST included. The net amount of GST recoverable from, or payable to, the ATO is included as a current asset or liability in the balance sheet.
Cash flows are included in the statement of cash flows on a gross basis. The GST components of cash flows arising from investing and financing activities which are recoverable from, or payable to, the ATO are classified as operating cash flows.
(r) Earnings per share
The Group presents basic and diluted earnings per share (EPS) data for its ordinary shares. Basic EPS is calculated by dividing the profit or loss attributable to ordinary shareholders of the Company by the weighted average number of ordinary shares outstanding during the period. Diluted EPS is determined by adjusting the profit or loss attributable to ordinary shareholders and the weighted average number of ordinary shares outstanding for the effects of all dilutive potential ordinary shares, which comprise convertible notes and share options granted to employees.
(s) Segment reporting
Determination and presentation of operating segments As of 1 July 2009 the Group determines and presents operating segments based on the information that is internally provided to the Managing Director (“MD”), who is the Group’s chief operating decision maker. This change in accounting policy is due to the adoption of IFRS 8 Operating Segments. Previously operating segments were determined and presented in accordance with AASB 114 Segment Reporting. The new accounting policy in respect of segment operating disclosures is presented as follows.
Comparative segment information has been re-presented in conformity with the transitional requirements of such standard. Since the change in accounting policy only impacts presentation and disclosure aspects, there is no impact on earnings per share.
An operating segment is a component of the Group that engages in business activities from which it may earn revenues and incur expenses, including revenues and expenses that relate to transactions with any of the Group’s components.
All operating segments’ operating results are reviewed regularly by the Group’s MD to make decisions about resources to be allocated to the segment and assess its performance, and for which discrete financial information is available.
Segment results that are reported to the MD include items directly attributable to a segment as well as those that can be allocated on a reasonable basis. Unallocated items comprise mainly corporate assets (primarily the Company’s headquarters), head office expenses, and income tax assets and liabilities.
Segment capital expenditure is the total cost incurred during the period to acquire property, plant and equipment, and intangible assets other than goodwill. (t) Financial guarantees
Financial guarantee contracts are measured at their fair values initially and subsequently measured at the higher of:
- the amount of obligation under the contract, as determined in accordance with AASB 137 Provisions, Contingent Liabilities and Contingent Assets; and
- the amount recognised initially less cumulative amortisation recognised in accordance with revenue recognition policies.
The fair value of financial guarantee contracts has been assessed using a probability weighted discounted cash flow approach. The probability has been based on:
- the likelihood of the guaranteed party defaulting in a year period;
- the proportion of the exposure that is not expected to be recovered due to the guaranteed party defaulting; and
- the maximum loss exposed if the guaranteed party were to default.
(u) Presentation of financial statements
The Group applies revised AASB 101 Presentation of Financial Statements (2007), which became effective as of 1 January 2009. As a result, the Group presents in the consolidated statement of changes in equity all owner changes in equity, whereas all non-owner changes in equity are presented in the consolidated statement of comprehensive income. This presentation has been applied in these financial statements.
Comparative information has been re-presented so that it is also in conformity with the revised standard. Since the change in accounting policy only impacts presentation aspects, there is no impact on earnings per share.
For
per
sona
l use
onl
y

44
Southern Cross Electrical Engineering Limited Annual Report 2010
Notes to the Financial ReportFor the year ending 30 June 2010 (continued)
(v) New standards and interpretations not yet adopted
The following standards, amendments to standards and interpretations have been identified as those which may impact the entity in the period of initial application. They are available for early adoption at 30 June 2010, but have not been applied preparing this financial report:
• AASB 9 Financial Instruments includes requirements for the classification and measurement of financial assets resulting from th first par of Phase 1 of the project to replace AASB 139 Financial Instruments: Recognition and Measurement. AASB 9 will become mandatory for the Group’s 30 June 2014 financial statements. Retrospective application is generally required, although there are exceptions, particularly if the entity adopts the standard for the year ended 30 June 2012 or particularly if the entity adopts the standard for the year ended 30 June 2012 or earlier. The Group has not yet determined the potential effect of the standard.
• AASB 124 Related Party Disclosures (revised December 2009) simplifies and clarifies the intended meaning of the definition of a related party and provides a partial exemption from the disclosures requirements for government- related entities. The amendments, which will become mandatory for Group’s 30 June 2012 financial statements, are not expected to have any impact on the financial statements.
• AASB 2009-5 Further amendments to Australian Accounting Standards arising from the Annual Improvements Process affect various AASBs resulting in minor changes for presentation, disclosure, recognition and measurement purposes. The amendments, which become mandatory for the Group’s 30 June 2011 financial statements, are not expected to have any significant impact on the financial statements.
• AASB 2009-8 Amendments to Accounting Standards – Amendments to Australian Accounting Standards – Group Cash-settled Share-based Payment Transactions resolves diversity in practice regarding the attribution of cash-settled share-based payments between different entities within a group. As a result of the amendments AI 8 Scope of AASB 2 and AI 11 AASB 2 – Group Treasury Share Transactions will be withdrawn from the application date. The amendments, which become mandatory for the Group’s 30 June 2011 financial statements, are not expected to have a significant impact on the financial statements.
4. Determination of fair values
A number of the Group’s accounting policies and disclosures require the determination of fair value, for both financial and non-financial assets and liabilities. Fair values have been determined for measurement and / or disclosure purposes based on the following methods.
Where applicable, further information about the assumptions made in determining fair values is disclosed in the notes specific to that asset or liability.
(i) Property, plant and equipment
The fair value of property, plant and equipment recognised as a result of a business combination is based on market values. The market value of property is the estimated amount for which a property could be exchanged on the date of valuation between a willing buyer and a willing seller in an arm’s length transaction after proper marketing wherein the parties had each acted knowledgeably, prudently and without compulsion. The market value of items of plant, equipment, fixtures and fittings is based on the quoted market prices for similar items.
(ii) Inventories The fair value of inventories acquired in a business combination is determined based on its estimated selling price in the ordinary course of business less the estimated costs of completion and sale, and a reasonable profit margin based on the effort required to complete and sell the inventories.
(iii) Trade and other receivables
The fair value of trade and other receivables, excluding construction work in progress, but including service concession receivables, is estimated as the present value of future cash flows, discounted at the market rate of interest at the reporting date.
(iv) Derivatives
The fair value of forward exchange contracts is based on their listed market price, if available. If a listed market price is not available, then fair value is estimated by discounting the difference between the contractual forward price and the current forward price for the residual maturity of the contract using a risk-free interest rate (based on government bonds). (v) Non-derivative financial liabilities
Fair value, which is determined for disclosure purposes, is calculated based on the present value of future principal and interest cash flows, discounted at the market rate of interest at the reporting date. In respect of the liability component of convertible notes, the market rate of interest is determined by reference to similar liabilities that do not have a conversion option. For finance leases the market rate of interest is determined by reference to similar lease agreements.
For
per
sona
l use
onl
y

45
Southern Cross Electrical Engineering Limited Annual Report 2010
(vi) Share-based payment transactions
The fair value of employee stock options is measured using an appropriate option pricing model. Measurement inputs include share price on measurement date, exercise price of the instrument, expected volatility (based on weighted average historic volatility adjusted for changes expected due to publicly available information), weighted average expected life of the instruments (based on historical experience and general option holder behaviour), expected dividends, and the risk-free interest rate (based on government bonds). Service and non-market performance conditions attached to the transactions are not taken into account in determining fair value.
5. Segment reporting
Revenue is principally derived by the Group from the provision of electrical and instrumentation services to the resources, energy and infrastructure sectors. The Group therefore operates within one operating segment.
In presenting information on the basis of geographical segments, segment revenue is based on the geographical location of customers. Segment assets are based on the geographical location of the assets.
2010 2009
Revenue Non-current assets
Revenue Non-current assets
Australia 96,375,419 32,972,370 95,200,140 8,549,429
South America 1,000,377 535,486 5,562,999 559,776
Eliminations - (3,136,605) (441,235) -
97,375,796 30,371,251 100,321,904 9,109,205
One customer of the Group’s Australian segment represents approximately $30m (2009: nil) of the Group’s total revenue.
Consolidated
2010 2009
Contract revenue 97,375,796 100,321,904
97,375,796 100,321,904
Consolidated
2010 2009
Other (31,370) 435,101
Net gain/(loss) on sale of non-current assets (865) (28,421)
(32,235) 406,680
Consolidated
2010 2009
Repairs and maintenance (149,199) (220,166)
Motor vehicles (645,536) (489,476)
Other (50,274) (29,062)
(845,009) (738,704)
6. Revenue
7. Other income/(loss)
8. Other expensesFor
per
sona
l use
onl
y

46
Southern Cross Electrical Engineering Limited Annual Report 2010
Notes to the Financial ReportFor the year ending 30 June 2010 (continued)
Consolidated
2010 2009
Remuneration, bonuses and on-costs (7,978,672) (5,770,612)
Amounts provided for employee entitlements (363,431) (482,807)
Share based payments expense (111,794) (133,175)
(8,453,897) (6,386,594)
Consolidated
2010 2009
Interest income on bank deposits 432,160 1,220,251
Finance income 432,160 1,220,251
Interest expense on bank borrowings (86,597) (36,568)
Finance charges payable under hire purchase contracts (17,022) (53,860)
Bank charges (117,973) (160,486)
Foreign exchange gain (loss) - (913,697)
Bank guarantee fees (76,640) -
Realised loss on derivatives - (3,674,815)
Finance expense (298,232) (4,839,426)
Net finance income and expense 133,928 (3,619,175)
Consolidated
2010 2009
Buildings (111,784) (16,784)
Leasehold improvements (72,749) (29,641)
Plant and equipment (534,449) (467,823)
Motor vehicles (535,732) (501,854)
Office furniture and equipment (283,263) (125,870)
(1,537,977) (1,141,972)
Amortisation of customer contract intangibles (1,133,152) -
9. Employee benefits expense
10. Finance income and expense
11. Depreciation and amortisation expense
The above employee benefits expense does not include employee benefits expense recorded within contract expenses.
For
per
sona
l use
onl
y

47
Southern Cross Electrical Engineering Limited Annual Report 2010
Consolidated
2010 2009
(a) Income Statement
Current tax expense
Current period (844,358) (7,552,034)
(844,358) (7,552,034)
Deferred tax expense
Origination and reversal of temporary differences (4,338,950) 853,338
Income tax expense reported in the income statement (5,183,308) (6,698,696)
(b) Amounts charged or credited directly to equity
Expenses relating to initial public offering - (4,641)
Income tax expense reported in equity - (4,641)
Accounting profit before income tax 13,858,745 22,162,852
Add back non-Australian entities loss 289,661 -
14,148,406 22,162,852
Income tax using the Company’s domestic tax rate of 30% (2009: 30%) 4,244,552 6,648,856
Tax effect of permanent differences
Non deductible acquisition costs 561,537 -
Non deductible contract intangible amortisation 317,356 -
Other 59,493 49,404
938,386 49,404
Effect of different tax rate applicable to Denver branch of 35% (2009: 35%) 370 436
Income tax expense reported in the income statement 5,183,308 6,698,696
The applicable effective tax rates are: 36.6% 30.2%
12. Income tax expense
The higher weighted average effective tax rate for the Company for 2010 is a result of costs associated with acquisitions in 2010 not being deductible for tax purposes.
For
per
sona
l use
onl
y

48
Southern Cross Electrical Engineering Limited Annual Report 2010
Notes to the Financial ReportFor the year ending 30 June 2010 (continued)
Consolidated
Balance Sheet Movement recognised in Income Statement
Movement recognised in Equity
2010 2009 2010 2009 2010 2009
Deferred tax liabilities
Forward contracts - - - (167,978) - -
Retentions - (22,777) (22,777) (156,658) - -
Work in progress (4,704,242) (98,777) 4,605,465 (372,774) - -
Property, plant and equipment (23,099) (10,544) 12,556 (34,770) - -
Prepayments (12,234) - 12,234 - - -
(4,739,575) (132,098) 4,607,478 (732,181) - -
Deferred tax assets
Accruals 435,044 230,451 (204,592) (212,451) - -
Employee benefits 970,143 537,290 (432,852) (45,625) - -
Unrealised foreign exchange losses - 1,826 1,826 (1,826) - -
Sundry debtors - 96,185 96,185 (96,185) - -
Property, plant and equipment 19,159 -
(19,159) - - -
Future IPO related tax benefits (Income statement)
428,976 643,464 214,488 214,488 - -
Future IPO related tax benefits 151,152 226,728 75,576 75,576 - -
Other - - - (55,133) - -
2,004,473 1,735,945 (268,528) (121,157) - -
Net deferred tax assets/(liabilities) (2,735,102) 1,603,847 4,338,950 (853,338)
Deferred Tax Assets and Liabilities
12. Income tax expense (continued)
For
per
sona
l use
onl
y
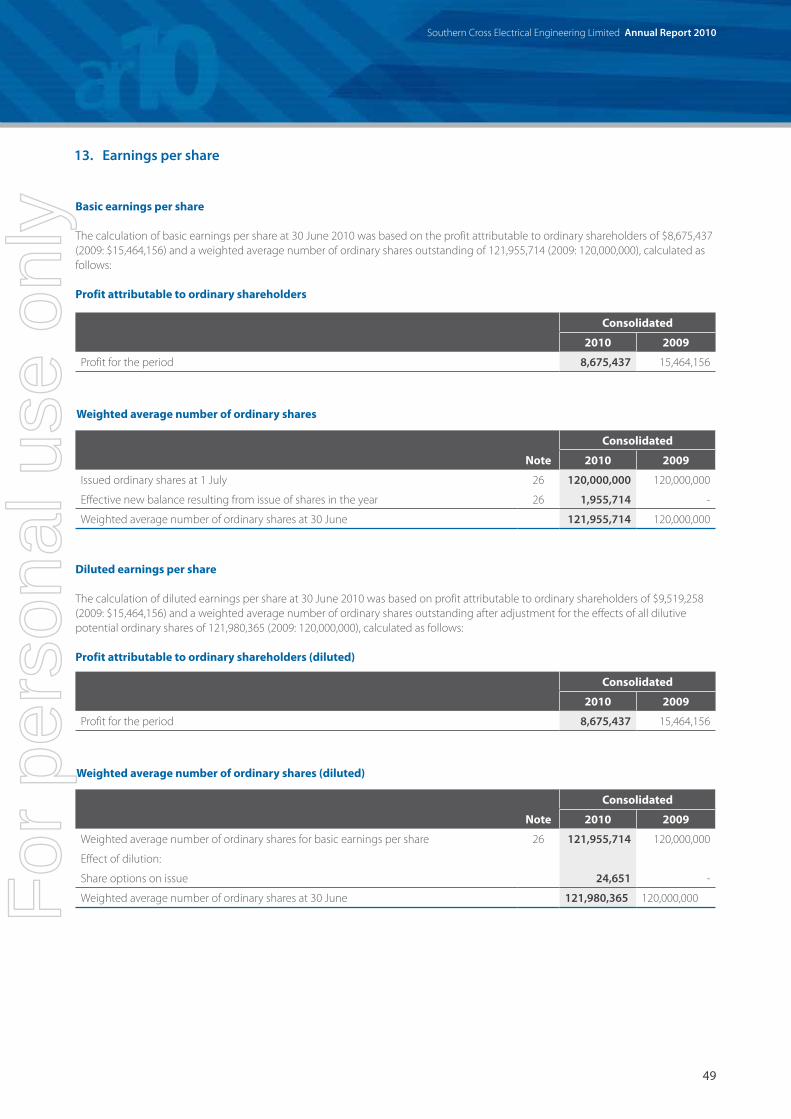
49
Southern Cross Electrical Engineering Limited Annual Report 2010
Basic earnings per share
The calculation of basic earnings per share at 30 June 2010 was based on the profit attributable to ordinary shareholders of $8,675,437 (2009: $15,464,156) and a weighted average number of ordinary shares outstanding of 121,955,714 (2009: 120,000,000), calculated as follows: Profit attributable to ordinary shareholders
Consolidated
2010 2009
Profit for the period 8,675,437 15,464,156
Consolidated
2010 2009
Profit for the period 8,675,437 15,464,156
Note
Consolidated
2010 2009
Issued ordinary shares at 1 July 26 120,000,000 120,000,000
Effective new balance resulting from issue of shares in the year 26 1,955,714 -
Weighted average number of ordinary shares at 30 June 121,955,714 120,000,000
Note
Consolidated
2010 2009
Weighted average number of ordinary shares for basic earnings per share 26 121,955,714 120,000,000
Effect of dilution:
Share options on issue 24,651 -
Weighted average number of ordinary shares at 30 June 121,980,365 120,000,000
Weighted average number of ordinary shares
Weighted average number of ordinary shares (diluted)
Diluted earnings per share
The calculation of diluted earnings per share at 30 June 2010 was based on profit attributable to ordinary shareholders of $9,519,258 (2009: $15,464,156) and a weighted average number of ordinary shares outstanding after adjustment for the effects of all dilutive potential ordinary shares of 121,980,365 (2009: 120,000,000), calculated as follows:
Profit attributable to ordinary shareholders (diluted)
13. Earnings per share
For
per
sona
l use
onl
y

50
Southern Cross Electrical Engineering Limited Annual Report 2010
Notes to the Financial ReportFor the year ending 30 June 2010 (continued)
Consolidated
2010 2009
Bank balances 4,474,599 10,324,075
Short term deposits 3,025,113 20,981,693
Cash and cash equivalents in the statement of cash flows 7,497,712 31,305,768
Consolidated
2010 2009
Raw materials and consumables – at cost 1,268,865 893,165
1,268,865 893,165
Consolidated
2010 2009
Prepayments 40,780 -
40,780 -
Consolidated
2010 2009
Current
Trade receivables (a) 10,280,315 9,694,529
Retentions (b) - 75,923
Tax receivable 2,184,675 -
12,464,990 9,770,452
Consolidated
2010 2009
Costs incurred to date 31,588,820 32,547,044
Recognised profit 11,859,762 12,788,343
Progress billings (27,767,776) (45,006,129)
Amounts due from customers 15,680,806 329,258
Retentions on construction work in progress - -
Progress billings receivable on construction contracts in progress – at cost 15,680,806 329,258
14. Cash and cash equivalent
16. Inventories
18. Prepayments
15. Trade and other receivables
17. Construction work in progress
The effective interest rate on short-term bank deposits was 3.0% (2009: 4.3%); these deposits are all on call.
(a) Trade receivablesTrade receivables are non-interest bearing and are generally on 30 day terms. A provision for impairment loss has not been recog-nised due to the collection record of the counterparties the Group transacts with.
(b) RetentionsRetentions relate to amounts withheld by clients under the terms of the Group’s construction agreements. These are remitted by the client upon completion of the contracted works.
Work in progress represents the gross unbilled amount expected to be collected from customers for contract work performed to date. It is measured at cost. Cost includes all expenditure related directly to specific projects.F
or p
erso
nal u
se o
nly

51
Southern Cross Electrical Engineering Limited Annual Report 2010
Consolidated
2010 2009
Result of the parent entity
Profit/(Loss) for the period 5,235,543 16,722,473
Other comprehensive income (62,264) (22,092)
Total comprehensive income for the period (62,264) (22,092)
Financial position of parent entity at year end 5,173,279 16,700,381
Current assets 25,816,641 41,482,104
Total assets 58,789,011 50,031,533
Current liabilities 12,412,328 9,130,102
Total liabilities 15,460,848 9,262,289
Total equity of the parent entity comprising of:
Share capital 24,964,369 19,777,237
Reserves 230,765 181,235
Retained earnings/(Accumulated losses) 18,133,029 20,810,771
Total Equity 43,328,163 40,769,243
19. Investments in subsidiaries
The consolidated financial statements include the financial statements of Southern Cross Electrical Engineering Ltd and the subsidiaries listed in the following table.
Country of Incorporation
Equity Interest(%)
2010 2009
Cruz Del Sur Ingenieria Electra (Peru) S.A Ltd Peru 100 100
Southern Cross Electrical Engineering (WA) Pty Ltd Australia 100 100
SCEE Tanzania Pty Ltd Tanzania 100 100
SCEE Ghana Pty Ltd Ghana 100 100
K.J. Johnson & Co. Pty Ltd Australia 100 -
FMC Corporation Pty Ltd Australia 100 -
Oceanic Industries Pty Ltd Australia 100 -
Hazquip Industries Pty Ltd Australia 100 -
20. Parent entity disclosures
As at, and throughout, the financial year ending 30 June 2010 the parent company of the Consolidated entity was Southern Cross Electrical Engineering Ltd.
Parent entity contingenciesThe parent entity has issued bank guarantees, which are included in the contingencies note 31. At 30 June 2010 there were guarantees of performance of a subsidiary in existence.F
or p
erso
nal u
se o
nly

52
Southern Cross Electrical Engineering Limited Annual Report 2010
Notes to the Financial ReportFor the year ending 30 June 2010 (continued)
21. Property, plant and equipment
Consolidated
Land and Buildings
Leasehold Improvements
Plant and equipment
Motor Vehicles
Office Furniture and
EquipmentTotal
Cost
Balance at 1 July 2008 916,321 1,113,266 5,447,847 4,169,387 497,544 12,144,365
Additions - 978,295 123,470 735,924 391,477 2,229,166
Disposals - - - (332,645) (1,870) (334,515)
Balance at 30 June 2009 916,321 2,091,561 5,571,317 4,572,666 887,151 14,039,016
Balance at 1 July 2009 916,321 2,091,561 5,571,317 4,572,666 887,151 14,039,016
Additions from acquisitions 3,800,000 41,266 899,063 517,672 92,372 5,350,373
Additions - 15,500 720,819 2,209 548,035 1,286,563
Disposals - - (77,041) - - (77,041)
Balance at 30 June 2010 4,716,321 2,148,327 7,114,158 5,092,547 1,527,558 20,598,911
Depreciation and impairment losses
Balance at 1 July 2008 - (309,097) (3,069,083) (2,022,102) (181,367) (5,581,649)
Depreciation for the year (16,784) (29,641) (440,391) (501,854) (153,302) (1,141,972)
Disposals - - - 189,761 202 189,963
Balance at 30 June 2009 (16,784) (338,738) (3,509,474) (2,334,195) (334,467) (6,533,658)
Balance at 1 July 2009 (16,784) (338,738) (3,509,474) (2,334,195) (334,467) (6,533,658)
Depreciation for the year (111,784) (72,749) (534,449) (535,732) (283,264) (1,537,977)
Disposals - - (7,876) - - (7,876)
Balance at 30 June 2010 (128,568) (411,487) (4,051,798) (2,869,927) (617,731) (8,079,511)
Carrying amounts
At 1 July 2008 916,321 804,169 2,378,764 2,147,285 316,177 6,562,716
At 30 June 2009 899,537 1,752,823 2,061,843 2,238,471 552,684 7,505,358
At 1 July 2009 899,537 1,752,823 2,061,843 2,238,471 552,684 7,505,358
At 30 June 2010 4,587,753 1,736,840 3,062,360 2,222,620 909,827 12,519,400
22. Trade and other payables
Consolidated
2010 2009
Current
Trade payables 4,660,880 3,625,066
Accrued expenses 3,072,887 2,000,102
Other creditors 833,399 372,734
Goods and services tax payable 631,938 698,619
9,199,104 6,696,521
Due to the short term nature of these payables, their carrying value is assumed to approximate their fair value.The Group’s exposure to currency and liquidity risk related to trade and other payables is disclosed in note 24.
For
per
sona
l use
onl
y

53
Southern Cross Electrical Engineering Limited Annual Report 2010
Consolidated
2010 2009
Current
Annual leave 2,283,519 1,123,743
Long service leave 473,413 596,647
2,756,932 1,720,390
Non-current
Long service leave 278,879 70,578
23. Employee benefits
A provision has been recognised for employee entitlements relating to long service leave. In calculating the present value of future cash flows in respect of long service leave, the probability of long service leave being taken is based on historical data. The measurement and recognition criteria relating to employee benefits has been included in note 3 to this report.
24. Financial instruments Overview
The Group has exposure to the following risks from their use of financial instruments:
• credit risk• liquidity risk• market risk.
This note presents information about the Group’s exposure to each of the above risks, their objectives, policies and processes for measuring and managing risk, and the management of capital. Further quantitative disclosures are included throughout this financial report.
The Board of Directors has overall responsibility for the establishment and oversight of the risk management framework. The Board has established the Audit and Risk Management Committee, which is responsible for developing and monitoring risk management policies. The committee reports regularly to the Board of Directors on its activities.
Risk management policies are established to identify and analyse the risks faced by the Group, to set appropriate risk limits and controls, and to monitor risks and adherence to limits. Risk management policies and systems are reviewed regularly to reflect changes in market conditions and the Group’s activities. The Group, through their training and management standards and procedures, aim to develop a disciplined and constructive control environment in which all employees understand their roles and obligations.
The Audit and Risk Management Committee oversees how management monitors risk and reviews the adequacy of the risk management framework in relation to the risks faced by the Group.
Credit risk
Credit risk is the risk of financial loss to the Group if a customer or counterparty to a financial instrument fails to meet its contractual obligations, and arises principally from the Group’s receivables from customers.
Exposure to credit risk
The carrying amount of the Group’s financial assets represents the maximum credit exposure. The Group’s maximum exposure to credit risk at the reporting date was:
Carrying amount
2010 2009
Cash 7,497,712 31,305,768
Trade and other receivables 12,464,990 9,770,452
For
per
sona
l use
onl
y

54
Southern Cross Electrical Engineering Limited Annual Report 2010
Notes to the Financial ReportFor the year ending 30 June 2010 (continued)
Gross Impairment Gross Impairment
2010 2010 2009 2009
Not past due 10,736,479 - 6,570,178 -
Past due 0-30 days 1,311,629 - 1,127,521 -
Past due 30-60 days 400,779 - 1,933,042 -
Past due 90 days and over 16,103 - 139,711 -
More than one year - - - -
12,464,990 - 9,770,452 -
24. Financial instruments (continued)
Trade and other receivables
The Group’s exposure to credit risk is influenced mainly by the individual characteristics of each customer. The demographics of the Group’s customer base, including the default risk of the industry and country in which customers operate, has less of an influence on credit risk. Approximately 68 percent (2009: 64 percent) of the Group’s trade receivables are attributable to transactions with two major customers. Geographically, the concentration of credit risk is within Australia and industry wise the concentration is within the mining, and oil and gas industry.
When entering into new customer contracts for service, the Group only enters into contracts with reputable companies. Management monitors the Group’s exposure on a monthly basis.
88 percent (2009: 75 percent) of the Group’s current customers have been transacting with the Group for several years, and losses have occurred infrequently if at all. In monitoring customer credit risk, customers are grouped according to their credit characteristics, including whether they are an individual or legal entity, aging profile, maturity and existence of previous financial difficulties. The Group does not require collateral in respect of trade and other receivables.
The Group has not established an allowance for impairment that represents their estimate of incurred losses in respect of trade and other receivables as it not considered necessary based on the payment history of their client base.
The Group’s maximum exposure to credit risk for trade receivables at the reporting date by geographic region was:
Carrying amount
2010 2009
Australia 12,464,990 9,770,452
12,464,990 9,770,452
Impairment losses
The aging of the Group’s trade receivables at the reporting date was:
Based on historic default rates, the Group believes no impairment allowance is necessary in respect of trade receivables as the customers have a good credit history with the Group.There was no renegotiation in credit terms during the period.
Liquidity risk
Liquidity risk is the risk that the Group will not be able to meet its financial obligations as they fall due. The Group’s approach to managing liquidity is to ensure, as far as possible, that it will always have sufficient liquidity to meet its liabilities when due, under both normal and stressed conditions, without incurring unacceptable losses or risking damage to the Group’s reputation.
The Group uses project costing to assess the cash flows required for each project currently underway and entered into. Management monitors cash flow using rolling forecasts and annual budgets that are monitored at a Board level on a monthly basis.
For
per
sona
l use
onl
y

55
Southern Cross Electrical Engineering Limited Annual Report 2010
24. Financial instruments (continued)
The following are the contractual maturities of financial liabilities, including estimated interest payments and excluding the impact of netting agreements:
Effective rate
Carrying amount
Contractual cash flows
6 mths or less
6-12 mths
1-2 years
2-5 years
More than 5 years
Non-derivative financial assets
Cash and cash equivalents 3.0% 7,595,545 7,595,545 7,595,545 - - - -
Trade and other receivables - 12,464,990 12,464,990 12,464,990 - - - -
20,060,935 20,060,935 20,060,935 - - - -
Non-derivative financial liabilities
Finance lease liabilities 7.9% 351,415 415,355 125,002 125,002 165,351 - -
Bank borrowings 7.6% 4,583,000 5,090,069 995,451 964,670 1,836,998 1,292,950 -
Trade and other payables - 9,199,104 9,199,104 9,199,104 - - - -
14,133,519 14,704,528 10,319,557 1,089,672 2,002,349 1,292,950 -
30 June 2009
Effective rate
Carrying amount
Contractual cash flows
6 mths or less
6-12 mths
1-2 years
2-5 years
More than 5 years
Non-derivative financial assets
Cash and cash equivalents 4.3% 31,305,768 31,305,768 31,305,768 - - - -
Trade and other receivables - 9,770,452 9,770,452 9,770,452 - 770,790 - -
41,405,478 41,405,478 41,405,478 - 770,790 - -
Non-derivative financial liabilities
Finance lease liabilities 7.9% 355,418 371,508 183,026 126,873 46,708 14,901 -
Trade and other payables - 6,696,521 6,696,521 6,696,521 - - - -
7,051,939 7,068,029 6,879,547 126,873 46,708 14,901 -
Consolidated 30 June 2010
Market Risk
Market risk is the risk that changes in market prices, such as foreign exchange rates, interest rates and equity prices will affect the Group’s income or the value of its holdings of financial instruments. The objective of market risk management is to manage and control market risk exposures within acceptable parameters, while optimising the return.
The Group enters into derivatives, and also incurs financial liabilities, in order to manage market risks. All such transactions are carried out within the guidelines set by the Audit and Risk Management Committee.
Currency risk
The Group is exposed to currency risk on sales, purchases and borrowings that are denominated in a currency other than the functional currency in which they are measured. The Group has exposures to the United States dollar (USD) and Peru nuevo sol (PEN).
In respect of other monetary assets and liabilities denominated in foreign currencies, the Group ensures that its net exposure is kept to an acceptable level by buying or selling foreign currencies at spot rates when necessary to address short-term imbalances.
For
per
sona
l use
onl
y

56
Southern Cross Electrical Engineering Limited Annual Report 2010
Notes to the Financial ReportFor the year ending 30 June 2010 (continued)
Average rate Reporting date spot rate
2010 2009 2010 2009
USD:AUD 0.88 0.75 0.86 0.80
USD USD
30 June 2010
30 June 2009
Cash 751,844 3,187,760
Trade receivables - 3,619,397
Trade and other payables - (5,077)
Gross balance sheet exposure 751,844 6,802,080
Exposure to currency risk
The Group’s exposure to USD risk was as follows, based on notional amounts:
The following significant exchange rates applied during the year:
Sensitivity analysisA 10 percent strengthening of the Australian dollar against the following currencies at 30 June would have increased (decreased) equity and profit or loss by the amounts shown below. This analysis assumes that all other variables, in particular interest rates, remain constant. The analysis is performed on the same basis for 2009.
24. Financial instruments (continued)
Consolidated
Profit or loss Equity
10% increase
10% decrease
10% increase
10% decrease
30 June 2010
USD (64,802) 79,203 (30,918) 37,788
30 June 2009
USD (618,371) 755,787 (980) 1,198
Interest rate risk
ProfileAt the reporting date the interest rate profile of the Company’s and the Group’s interest-bearing financial instruments was:
Consolidated Carrying amount
2010 2009
Fixed rate instruments
Financial liabilities 351,415 (355,418)
Variable rate instruments
Financial assets 7,497,712 31,305,768
Financial liabilities 4,583,000 -
For
per
sona
l use
onl
y

57
Southern Cross Electrical Engineering Limited Annual Report 2010
24. Financial instruments (continued)
Fair value sensitivity analysis for fixed rate instruments
The Group does not account for any fixed rate financial assets and liabilities at fair value through profit or loss, and the Group does not designate derivatives (forward exchange contracts) as hedging instruments under a fair value hedge accounting model. Therefore a change in interest rates at the reporting date would not affect profit or loss.
Cash flow sensitivity analysis for variable rate instruments
A change of 100 basis points in interest rates at the reporting date would have increased (decreased) equity and profit or loss by the amounts shown below. This analysis assumes that all other variables, in particular foreign currency rates, remain constant. The analysis is performed on the same basis for 2009.
Profit or loss Equity
100bp increase
100bp decrease
100bp increase
100bp decrease
30 June 2010
Variable rate instruments 85,473 (188,118) - -
Cash flow sensitivity (net) 85,473 (188,118) - -
30 June 2009
Variable rate instruments 313,058 (313,058) - -
Cash flow sensitivity (net) 313,058 (313,058) - -
Fair values
Fair values versus carrying amounts
The fair values of financial assets and liabilities equates to the carrying values shown in the balance sheet.
Interest rates used for determining fair value
The interest rates used to discount estimated cash flows, where applicable, are the weighted average effective interest rate applicable during the period, and were as follows:
2010 2009
Cash 3.0% 4.3%
Trade receivables n/a n/a
Forward exchange contracts n/a n/a
Loans and borrowings 8.6% n/a
Leases 7.9% 7.9%
Trade and other payables n/a n/aFor
per
sona
l use
onl
y

58
Southern Cross Electrical Engineering Limited Annual Report 2010
Notes to the Financial ReportFor the year ending 30 June 2010 (continued)
24. Financial instruments (continued)
Other Price Risk
The Group is not directly exposed to any other price risk.
Capital Management
The Board’s policy is to maintain a strong capital base so as to maintain investor, creditor and market confidence and to sustain future development of the business. The Board of Directors has not implemented a formal capital management policy however they have implemented a dividend policy.
The Group intends to distribute to shareholders approximately 50% of net profit after tax in the form of fully franked dividends, subject to general business and financial conditions, the Group’s taxation position, its working capital and future capital expenditure requirements, the availability of sufficient franking credits and any other factors the Board considers relevant.
There were no changes in the Group’s approach to capital management during the year.
The Group is not subject to externally imposed capital requirements.
25. Loans and borrowings
This note provides information about the contractual terms of the Group’s interest-bearing loans and borrowings which are measured at amortised cost. For more information about the Group’s exposure to interest rate, liquidity and risk, see note 24.
Consolidated
2010 2009
Current liabilities
Secured bank loan 1,668,000 -
Finance lease liabilities 330,923 293,809
1,998,923 293,809
Non-current liabilities
Secured bank loan 2,915,000 -
Finance lease liabilities 20,492 61,609
2,935,492 61,609
On 26 February 2010, the Group entered into a $5 million cash advance facility for the acquisition of Oceanic. The average interest rate charged in 2010 was 7.59%. The bank facilities are secured by a fixed and floating charge over the assets of the Group with a maturity date of 26 February 2013. Repayments are made on a quarterly basis.
The above hire purchase liabilities are carried in the accounts at their carrying value and are secured over the assets that are subject to the hire purchase agreement.
For
per
sona
l use
onl
y

59
Southern Cross Electrical Engineering Limited Annual Report 2010
26. Capital and reserves
Share capital
Consolidated2010
Consolidated2009
Note Number $ Number $
Ordinary shares
Issued and fully paid 124,178,939 24,964,368 120,000,000 19,777,237
Movements in shares on issue
Balance at the beginning of the financial year 120,000,000 19,777,237 120,000,000 19,792,706
Conversion of ordinary shares (i) 500,000 575,000 - -
Shares issued as part of initial public offering (ii) 3,678,939 4,612,131 - -
Cost of capital raising (iii) - - - (15,469)
Balance at the end of the financial year 124,178,939 24,964,368 120,000,000 19,777,237
(i) 500,000 options were exercised at a price of $1.15 each(ii) Shares issued as consideration for the acquisition of FMC Corporation Pty Ltd, Oceanic Industries Pty Ltd and Hazquip Australia Pty Ltd(iii) Additional GST charged on the initial ASX listing during 2009.
The Company does not have authorised capital or par value in respect of its issued shares.The holders of ordinary shares are entitled to receive dividends as declared from time to time and are entitled to one vote per share at meetings of the Company. All shares rank equally with regard to the Company’s residual assets.
Translation reserve
The translation reserve comprises all foreign currency differences arising from the translation of the financial statements of foreign operations.
Option reserve
The option reserve records the fair value of share based payments provided to employees.
Dividends
Dividends recognised in the current year by the Group are:
Cents per share
Total amount Franked Date of
payment
2010
Final 2009 ordinary 4.5 5,439,706 Franked 23 October 2009
Interim 2010 ordinary 2.0 2,473,579 Franked 1 April 2010
Total amount 7,913,285
2009
Final 2008 ordinary 4.0 4,800,000 Franked 26 September 2008
Interim 2009 ordinary 2.0 2,400,000 Franked 3 April 2009
Total amount 7,200,000
Franked dividends declared or paid during the year were franked at the tax rate of 30%.After 30 June 2010 the following dividends were declared by the directors for 2010. The dividends have not been provided for. The declaration and subsequent payment of dividends has no income tax consequences.
For
per
sona
l use
onl
y

60
Southern Cross Electrical Engineering Limited Annual Report 2010
Notes to the Financial ReportFor the year ending 30 June 2010 (continued)
Cents per share
Total amount Franked Date of
payment
Final 2010 ordinary 4.5 5,588,052 Franked 5 November 2010
The financial effect of these dividends have not been brought to account in the financial statements for the financial year ended 30 June 2010 and will be recognised in subsequent financial reports.
Company
2010 2009
Franking account balance 5,268,525 5,982,694
The above available amounts are based on the balance of the dividend franking account at year-end adjusted for:
(a) franking credits that will arise from the payment of the current tax liabilities; and(b) franking debits that will arise from the payment of dividends recognised as a liability at the year end.
The ability to utilise the franking credits is dependent upon there being sufficient available profits to declare dividends. Subsequent to the balance sheet date the Company received a tax instalment refund and declared a 4.5 cents per share dividend which is not recognised as a liability. The impact of these two items on the franking account is to reduce the balance to $1,552,712.
26. Capital and reserves (continued)
27. Reconciliation of cash flows from operating activities
Consolidated
2010 2009
Cash flows from operating activities
Profit for the period 8,675,437 15,464,156
Adjustments for:
Depreciation 2,671,129 1,141,972
(Gain)/Loss on sale of property, plant and equipment 865 (86,037)
Equity-settled share-based payment transactions 111,794 133,715
(Increase)/decrease in assets
Change in trade and other receivables 1,284,196 1,047,520
Change in work in progress (15,351,548) 1,242,579
Change in inventories (2,890) (527,651)
Other receivables - 172,672
Change in prepayments (13,810) 1,114,683
Increase/(decrease) in liabilities
Change in trade and other payables 1,417,885 (1,589,939)
Change in provisions and employee benefits 1,029,947 (354,954)
Change in income tax payable (4,003,420) (1,202,824)
Change in deferred income tax 4,338,950 (853,337)
Net cash from operating activities 158,535 15,702,555
For
per
sona
l use
onl
y

61
Southern Cross Electrical Engineering Limited Annual Report 2010
28. Related parties
Details of Key Management Personnel
Directors
Gianfranco Tomasi Chairman (non-executive) Stephen Pearce Managing Director Resigned 26 February 2010Brian Carman Director (non-executive) John Cooper Director (non-executive) Douglas Fargher Director (non-executive) Executives
Simon Buchhorn Chief Operating Officer Stephen Fewster Chief Financial Officer/Company Secretary Gerard Moody General Manager Business Development Appointed 2 February 2009Phillip Dawson General Manager Corporate Services Appointed 28 April 2009
On 15 June 2010 the Company announced the appointment of Mr Simon High as Managing Director. Mr High commenced with the Company on the 2 August 2010.
There were no other changes of key management people after reporting date and before the date the financial report was authorised for issue.
Key management personnel compensation
The key management personnel compensation is as follows:
Consolidated
2010 2009
Short-term employee benefits 1,947,019 1,474,493
Post-employment benefits 124,684 125,787
Share-based payments 111,794 133,175
2,183,497 1,733,455
Individual directors and executives compensation disclosures
Information regarding individual directors and executives’ compensation and some equity instruments disclosures as permitted by Corporations Regulations 2M.3.03 are provided in the Remuneration Report section of the Directors’ Report on pages 11 to 18.Apart from the details disclosed in this note, no director has entered into a material contract with the Group since the end of the previous financial year and there were no material contracts involving directors’ interests existing at year-end.
Other key management personnel transactions
The following table provides the total amount of transactions that were entered into with related parties for the relevant financial year. The terms and conditions of the transactions with the related parties were no more favourable than those available, or which might reasonably be expected to be available, on similar transactions to non-director related entities on an arm’s length basis.
For
per
sona
l use
onl
y

62
Southern Cross Electrical Engineering Limited Annual Report 2010
Notes to the Financial ReportFor the year ending 30 June 2010 (continued)
Transactions value year ended 30 June
Note 2010 2009
Other related parties
F & A Tomasi Superannuation Fund Rental income (i) 192,443 185,968
Frank Tomasi Family Trust Rental income (ii) 5,200 148,038
G & A Tomasi Rental income (iii) 126,650 125,756
Frank Tomasi Family Trust Rental income (iv) 32,011 30,670
(i) F & A Tomasi Superannuation Fund owns the properties at 41 and 44 Macedonia St, Naval Base WA, which are leased to Southern Cross Electrical Engineering Limited.
(ii) Frank Tomasi Family Trust owns the properties at 35 Herbert Way, Wickham and the Brooklyn Park camp facilities in Boddington which are leased to Southern Cross Electrical Engineering Limited.
(iii) G & A Tomasi own the properties at Lot 2 Covehill Road Tasmania and 45, 47, 49 & 51 Macedonia Street, Naval Base WA which are leased to Southern Cross Electrical Engineering Limited.
(iv) Frank Tomasi Family Trust owns the property which is leased to the Denver branch of Southern Cross Electrical Engineering Limited.
Gianfranco Tomasi and spouse are sole directors of Frank Tomasi Nominees Pty Ltd and are the sole shareholders. Frank Tomasi Nominees Pty Ltd as trustee for the Frank Tomasi Family Trust is a major shareholder of Southern Cross Electrical Engineering Ltd.
Under the terms of each of the above property leases, the rent payable is subject to an annual review. This review adjusts the annual rent by the movement in the consumer price index. At the completion of every third year the annual rent is subject to a market review.
The rental payments made above are all at normal market rates and were reviewed by an independent valuer in June 2009.
Options and rights over equity instruments
The movement during the reporting period in the number of options over ordinary shares in Southern Cross Electrical Engineering Limited held, directly, indirectly or beneficially, by each key management person, including their related parties, is as follows:
28. Related parties (continued)
Other key management personnel transactions (continued)
Held at 1 July 2009
Granted as compensation Exercised Cancelled Held at 30
June 2010
Vested during the
year
Vested and exercisable at 30 June
2010
Directors
Stephen Pearce Managing Director
1,500,000 - - (1,000,000) 500,000* 500,000 -
Executives
Simon Buchhorn Chief Operating Officer
500,000 - - - 500,000 166,667 333,334
Stephen FewsterChief Financial Officer
426,667 - - (9,259) 417,408 157,408 250,742
2,426,667 - - (1,009,259) 1,417,408 824,075 584,076
* Stephen Pearce resigned on 26 February 2010 and these represent the options held at resignation. Other key management have not received options or rights during the period.
For
per
sona
l use
onl
y

63
Southern Cross Electrical Engineering Limited Annual Report 2010
28. Related parties (continued)
Options and rights over equity instruments (continued)
Held at 1 July 2008
Granted as compensation Exercised Other
changesHeld at 30 June 2009
Vested during the
year
Vested and exercisable at 30 June
2009
Directors
Stephen Pearce Managing Director
- 1,500,000 - - 1,500,000 - -
Executives
Simon Buchhorn Chief Operating Officer
500,000 - - - 500,000 166,667 166,667
Stephen FewsterChief Financial Officer
500,000 - - (73,333) 426,667 93,334 93,334
1,000,000 1,500,000 - (73,333) 2,426,667 260,001 260,001
Where a participant ceases employment prior to the vesting of their share options, the share options are forfeited unless cessation of employment is due to termination initiated by the Company or death. In the event of a change of control of the Company, all options that have not lapsed may be exercised.
Movements in shares
The movement during the reporting period in the number of ordinary shares in Southern Cross Electrical Engineering Limited held, directly, indirectly or beneficially, by each key management person, including their related parties, is as follows:
Held at 1 July 2009 Purchases
Received on exercise of
optionsSales Held at 30
June 2010
Directors
Gianfranco Tomasi 61,914,844 - - 714,844 61,200,000
Stephen Pearce 33,250 - - - 33,250*
Brian Carman 1,870,000 130,000 - - 2,000,000
John Cooper 100,000 - - - 100,000
Douglas Fargher 200,000 - - - 200,000
Executives
Simon Buchhorn 600,000 - - - 600,000
Stephen Fewster - - - - -
Gerard Moody - - - - -
Phillip Dawson - - - - -
*Stephen Pearce resigned on 26 February 2010 and these represent the options held at resignation.
For
per
sona
l use
onl
y

64
Southern Cross Electrical Engineering Limited Annual Report 2010
Notes to the Financial ReportFor the year ending 30 June 2010 (continued)
Held at 1 July 2008 Purchases
Received on exercise of
optionsSales Held at 30
June 2009
Directors
Gianfranco Tomasi 61,200,000 714,844 - - 61,914,844
Stephen Pearce - 33,250 - - 33,250
Brian Carman 1,500,000 370,000 - - 1,870,000
John Cooper 100,000 - - - 100,000
Douglas Fargher 100,000 100,000 - - 200,000
Executives
Simon Buchhorn 500,000 100,000 - - 600,000
Stephen Fewster - - - - -
Gerard Moody - - - - -
28. Related parties (continued)
Options and rights over equity instruments (continued)
29. Share-based payments
On 30 October 2007 a Senior Management Long Term Incentive Plan that entitles key management personnel and senior employees to purchase shares in the Company was offered to the executives. During the period options were granted to the executives. In accordance with the disclosure contained in the prospectus, the options are exercisable at $1.15.
The terms and conditions of the grants are as follows. All options are to be settled by physical delivery of shares.
Grant date / employees entitled Number of instruments Vesting conditions Contractual life
of options
Option grant to Simon Buchhorn on 28 November 2007
166,667 Employed 1 year after grant date and exceed Performance Hurdle
4 years after vesting
Option grant to Simon Buchhorn on 28 November 2007
166,667 Employed 2 years after grant date and exceed Performance Hurdle
4 years after vesting
Option grant to Simon Buchhorn on 28 November 2007
166,666 Employed 3 years after grant date and exceed Performance Hurdle
4 years after vesting
Option grant to Stephen Fewster on 4 March 2008
166,667 Employed 1 year after grant date and exceed Performance Hurdle
4 years after vesting
Option grant to Stephen Fewster on 4 March 2008
166,667 Employed 2 years after grant date and exceed Performance Hurdle
4 years after vesting
Option grant to Stephen Fewster on 4 March 2008
166,666 Employed 3 years after grant date and exceed Performance Hurdle
4 years after vesting
Option grant to Stephen Pearce on 29 April 2009
500,000 Employed 1 year after 26 November 2008 and exceed Performance Hurdle
4 years after vesting
Option grant to Stephen Pearce on 29 April 2009
500,000 Employed 2 years after 26 November 2008 and exceed Performance Hurdle
4 years after vesting
Option grant to Stephen Pearce on 29 April 2009
500,000 Employed 3 years after 26 November 2008 and exceed Performance Hurdle
4 years after vesting
Total share options 2,500,000
For
per
sona
l use
onl
y

65
Southern Cross Electrical Engineering Limited Annual Report 2010
Weightedaverage
exercise price2010
Number ofOptions
2010
Weightedaverage
exercise price2009
Number ofOptions
2009
Outstanding at 1 July $1.15 2,426,667 $1.15 1,000,000
Exercised during the period $1.15 (500,000) - -
Granted during the period $1.15 - $1.15 1,500,000
Cancelled during the period $1.15 (1,009,259) $1.15 (73,333)
Outstanding at 30 June $1.15 917,408 $1.15 2,426,667
Exercisable at 30 June $1.15 584,076 $1.15 260,001
29. Share-based payments (continued)
The options outstanding at 30 June 2010 all have an exercise price of $1.15 and a weighted average contractual life of 6 years. No options were exercised during the year.
During the year ended 30 June 2009 the Company’s shareholders approved the issue of 1,500,000 employee options to Mr Pearce under the Senior Management Long Term Incentive Plan. The key terms of the options issued are as follows:
• Each option is over 1 unissued share;• Each option is granted at no cost;• The exercise price of each option is $1.15, which is payable by the holder on exercise of each vested option;• The options will vest, and only become exercisable, in three annual tranches commencing from the anniversary date of grant and provided that the Performance Hurdles are achieved; and• The exercise period for the options will expire on the date 4 years after vesting.
The weighted average fair value of the options granted during the year was $0.24. The price was calculated using the Black-Scholes option model and due to the options having vesting conditions, a Monte Carlo Simulation analysis was performed. The use of a Monte Carlo Simulation model simulates multiple future price projections for both SCEE shares and the shares of the peer group they are tested against. The following inputs were used to determine their value.
Tranche 1 Tranche 2 Tranche 3
Underlying share price $0.84 $0.84 $0.84
Exercise price of options $1.15 $1.15 $1.15
Risk-free rate 3.4% 3.4% 3.4%
Volatility factor 60% to 80% 60% to 80% 60% to 80%
Dividend yield 5% 5% 5%
Legal duration 4.6 years 5.6 years 6.6 years
Effective life 2.6 years 3.6 years 4.6 years
Performance Hurdle
The company uses a relative Total Shareholder Return (TSR) as the performance hurdle for the LTI plan. In assessing whether the performance hurdles for each grant have been met, the Group will source independent data from an external adviser, which provides both the Company’s TSR growth from the commencement of each grant date and that of the pre-selected peer group. The peer group selected reflects the Group’s competitors for capital and talent.
The Group’s performance against the hurdle is determined according to the Company’s ranking against the peer group TSR growth over the performance period.
• Where the Company is ranked at the 51st percentile (target performance), 50% of the share options will vest;• Where the Company is ranked at the 75th percentile (target performance), 100% of the share options will vest;• Where the Company is ranked below the 51st percentile (target performance), the options will lapse;• For rankings between the 51st and the 75th percentile, a sliding scale will be applied to determine the proportion of share options that vest.
For
per
sona
l use
onl
y

66
Southern Cross Electrical Engineering Limited Annual Report 2010
Notes to the Financial ReportFor the year ending 30 June 2010 (continued)
30. Commitments
Leasing commitments
Operating lease commitments – as lessee
The Group has entered into commercial property leases. These leases have an average life of 7 years remaining with options to renew at the end of the initial term.
Future minimum rentals payable under non-cancellable operating leases as at 30 June 2010 are:
Consolidated
2010 2009
Within one year 272,592 272,592
After one but no more than five years 1,090,368 1,090,368
After more than five years 629,688 902,280
Total minimum lease payments 1,992,648 2,265,240
Under the terms of each of the above property leases, the rent payable is subject to an annual review. This review adjusts the annual rent by the movement in the consumer price index. At the completion of every third year the annual rent is subject to a market review.
Finance lease and hire purchase commitments –as lessee
The Group has finance lease and hire purchase contracts for various items of plant and equipment. These contracts expire within 1 and 3 years. Ownership of the asset passes to the company on completion of the final payment.
Finance lease and hire purchase commitments of the group are payable as follows:
Consolidated
Future minimum lease
payments2010
$
Present value of minimum lease
payments2010
$
Future minimum lease
payments2009
$
Present value of minimum lease
payments2009
$
Less than one year 128,882 128,882 309,899 309,899
Between one and five years 165,350 165,350 61,609 61,609
Total minimum lease payments 294,232 294,232 371,508 371,508
Less amounts representing finance charges (35,010) (35,010) (16,090) (16,090)
Present value of minimum lease payments 259,222 259,222 355,418 355,418
31. Contingencies
The directors are of the opinion that provisions are not required in respect of these matters, as it is not probable that a future sacrifice of economic benefits will be required or the amount is not capable of reliable measurement.
Consolidated
2010 2009
Bank Guarantees 11,491,261 6,940,406
Total bank guarantee facilities at 30 June 2010 were $20,000,000 and the unused portion was $8,508,739. This facility is subject to annual review.
For
per
sona
l use
onl
y

67
Southern Cross Electrical Engineering Limited Annual Report 2010
32. Acquisition of subsidiaries
Business Combination – FMC Corporation Pty Ltd
This business combination was part of the Group’s strategy to expand operations in oil and gas, and continue the long term strategy to grow the business.
On the 1st July 2009, the Group obtained control of FMC Corporation Pty Limited (“FMC”) by acquiring 100% of the shares in FMC. FMC is an unlisted private company that operates as an electrical contractor, predominantly in the maintenance, design and inspection of electrical works in Australia.
The total cost for the combination was $4,127,381, made up of $2,668,144 cash and the Group issued 882,353 shares which were trading at $0.98 at the date of acquisition, equating to a fair value of $864,706 and deferred payments totalling $594,531. There is also additional consideration of $500,000 which is subject to earnings hurdles and deferred payments totalling $750,000 subject to Mr Craig Hindle being employed by the Group on the first anniversary and the second anniversary. Under AASB 3 Business Combinations, the deferred payments to be paid to the vendors is required to be recognised as remuneration and is not included as consideration.
The fair value of the identifiable assets and liabilities of FMC as at the date of acquisition were:
Pre acquisition
carrying amounts $
Fair value adjustments
$
Recognised values on
acquisition $
Cash 332,733 - 332,733
Trade receivables 923,863 - 923,863
Property, plant and equipment 159,387 - 159,387
Other Assets 28,222 (1,251) 26,971
Trade and other payables (286,384) - (286,384)
Financial liabilities (61,763) - (61,763)
Tax liabilities (134,626) - (134,626)
Net identifiable assets and liabilities 961,432 (1,251) 960,181
Goodwill on acquisition 3,167,200
4,127,381
Cost of the combination
Cash 2,668,144
Deferred payments 594,531
Shares issued, at fair value 864,706
Total Cost of the combination 4,127,381
The cash outflow of the acquisition is as follows
Net cash acquired 332,733
Cash paid (2,668,144)
Net consolidation cash outflow (2,335,411)
Pre-acquisition carrying amounts were determined based on applicable AASB standards immediately before the acquisition. The values of assets and liabilities recognised on acquisition are their fair values.
The goodwill recognised on the acquisition of $3,167,200 is attributable mainly to the skills and technical talent of the acquired business’s work force and the synergies expected to be achieved from integrating FMC into the Group’s existing electrical contracting business. None of the goodwill is expected to be deductible for tax purposes.
In the year ended 30 June 2010, FMC contributed revenue of $5,353,949 and a profit of $655,443 which is included in the consolidated income statement.
For
per
sona
l use
onl
y

68
Southern Cross Electrical Engineering Limited Annual Report 2010
Notes to the Financial ReportFor the year ending 30 June 2010 (continued)
Business Combination – K J Johnson Pty Ltd
On 7 August 2009, the Group obtained control of certain assets and liabilities from K J Johnson Pty Ltd (“KJJ”) necessary to conduct KJJ’s business as a power line construction specialist.
The total cost for the combination was $9,447,226. The business combination was part of the Group’s strategy to expand electrical contracting operations, and continue the long term strategy to grow the business.
The fair value of the identifiable assets and liabilities as at the date of acquisition were:
32. Acquisition of subsidiaries (continued)
Pre acquisition
carrying amounts $
Fair value adjustments
$
Recognised values on
acquisition $
Land and buildings 1,354,861 2,445,139 3,800,000
Property, plant and equipment 976,000 - 976,000
Inventory 100,000 - 100,000
Intangible assets - customer contract - 1,057,852 1,057,852
Employee entitlements (102,774) - (102,774)
Net identifiable assets 2,328,087 3,502,991 5,831,078
Goodwill on acquisition 3,616,148
9,447,226
Cost of the combination
Consideration paid satisfied in cash 9,447,226
Total Cost of the combination 9,447,226
The cash outflow of the acquisition is as follows
Cash paid (9,447,226)
Net consolidation cash outflow (9,447,226)
Pre-acquisition carrying amounts were determined based on applicable AASB standards immediately before the acquisition. The values of assets and liabilities recognised on acquisition are their estimated fair values.
The goodwill recognised on the acquisition of $3,616,148 is attributable mainly to the skills and technical talent of the acquired business’s work force and the synergies expected to be achieved from integrating the company into the Group’s existing electrical contracting business. None of the goodwill is expected to be deductible for tax purposes.
The contract intangibles recognised represents a valuation of customer contracts which existed as at the date of acquisition.In the year ended 30 June 2010, KJJ contributed revenue of $12,747,824 and a profit of $2,088,416 which is included in the consolidated income statement. If the acquisition had occurred on 1 July 2009, management estimates that KJJ would have contributed revenue of $12,747,824 and profit of $2,088,416. In determining these amounts, management has assumed that the fair value adjustments, determined provisionally, that arose on the date of acquisition would have been the same if the acquisition had occurred on 1 July 2009.F
or p
erso
nal u
se o
nly

69
Southern Cross Electrical Engineering Limited Annual Report 2010
32. Acquisition of subsidiaries (continued)
Business Combination – Oceanic Industries Pty Ltd
On the 26 February 2010, the Group obtained control of Oceanic Industries Pty Ltd (“Oceanic”) by acquiring 100% of the shares. Oceanic is an unlisted private company that operates as an electrical contractor, predominantly in the maintenance, design and inspection of electrical works in Australia.
The total cost for the combination was $12,373,694 made up of $8,626,269 cash and the Group issued 2,796,586 shares which were trading at $1.34 at the date of acquisition, equating to a fair value of $3,747,425.
The business combination was part of the Group’s strategy to expand operations into Queensland oil and gas industry, and continue the long term strategy to grow the business. If the acquisition had occurred on 1 July 2009, management estimates that Oceanic would have contributed revenue of $8,200,000 and consolidated profit of $746,000. In determining these amounts, management has assumed that the fair value adjustments, determined provisionally, that arose on the date of acquisition would have been the same if the acquisition had occurred on 1 July 2009.
Pre-acquisition carrying amounts were determined based on applicable AASB standards immediately before the acquisition. The values of assets and liabilities recognised on acquisition are their fair values.
The goodwill recognised on the acquisition of $10,390,802 is attributable mainly to the skills and technical talent of the acquired business’s work force and the synergies expected to be achieved from integrating Oceanic into the Group’s existing electrical contracting business. None of the goodwill is expected to be deductible for tax purposes. In the year ended 30 June 2010, Oceanic contributed revenue of $2,492,601 and a profit of $149,014 which is included in the consolidated income statement.
Pre acquisition
carrying amounts $
Fair value adjustments
$
Recognised values on
acquisition $
Cash 673,946 - 673,946
Trade receivables 1,409,727 - 1,409,727
Property, plant and equipment 424,393 - 424,393
Inventory 272,811 - 272,811
Intangible assets - customer contract - 753,000 753,000
Other assets 15,572 - 15,572
Trade and other payables (798,313) - (798,313)
Financial liabilities (299,387) - (299,387)
Tax liabilities (356,736) - (356,736)
Other liabilities (112,122) - (112,122)
Net identifiable assets and liabilities 1,229,891 753,000 1,982,891
Goodwill on acquisition 10,390,803
12,373,694
Cost of the combination
Cash 7,886,116
Cash Settlement adjustment 740,153
Shares issued, at fair value 3,747,425
Total Cost of the combination 12,373,694
The cash outflow of the acquisition is as follows
Net cash acquired 673,946
Cash paid (8,626,269)
Net consolidation cash outflow (7,952,323)For
per
sona
l use
onl
y

70
Southern Cross Electrical Engineering Limited Annual Report 2010
Notes to the Financial ReportFor the year ending 30 June 2010 (continued)
33. Intangible assets – customer contracts and goodwill
Reconciliation of carrying amount
Cost
Note Goodwill$
Customer Contracts
$
Total$
Balance as at 1 July 2008 - - -
Acquisitions through business combinations - - -
Balance as at 31 June 2009 - - -
Balance as at 1 July 2009 - - -
Acquisitions through business combinations 32 17,174,151 1,810,852 18,985,003
Balance as at 30 June 2010 17,174,151 1,810,852 18,985,003
Amortisation and impairment losses
Balance as at 1 July 2008 - - -
Impairment loss - - -
Amortisation - - -
Balance as at 30 June 2009 - - -
Balance as at 1 July 2009 - - -
Impairment loss - - -
Amortisation - (1,133,152) (1,133,152)
Balance as at 30 June 2010 - (1,133,152) (1,133,152)
Carrying amounts
At 1 July 2008 - - -
At 30 June 2009 - - -
At 1 July 2009 - - -
At 30 June 2010 17,174,151 677,700 17,851,851
Impairment testing for cash-generating units containing goodwill
For the purpose of impairment testing, goodwill is allocated to the Group’s operating divisions which represent the lowest level within the Group at which goodwill is monitored for internal management purpose.
The aggregate carrying amounts of goodwill allocated to each unit are as follows:
Consolidated
2010 2009
FMC Corporation Pty Ltd 3,167,200 -
K.J. Johnson & Co Pty Ltd 3,616,148 -
Oceanic Industries Pty Ltd 10,390,803 -
17,174,151 -
For
per
sona
l use
onl
y

71
Southern Cross Electrical Engineering Limited Annual Report 2010
33. Intangible assets – customer contracts and goodwill (continued)
The recoverable amount of the above cash generating units (“CGUs”) was based on their value in use. The carrying amount of the CGUs was determined to be lower than their recoverable amounts and therefore no impairment charged has been recognised.
The CGU valuations are sensitive to changes in the discount rate. The Group has further tested all CGU’s identified during the year by increasing the discount rate for each of the CGU’s by an additional 2.0 percent. The sensitised testing confirmed that no impairment would be recognised under this scenario.
Value in use was determined by discounting the future cash flows generated from the continuing use of the CGU. The calculation of value in use was based on the following key assumptions:
• Cash flows were projected based on past experience, actual operating results and independent research on the markets the CGUs operate.
• Revenue for 2011 is based on historical results. The anticipated annual revenue growth included in the cash flow projections has been based on growth rates that have been independently forecasted by BIS Shrapnel. The margins included in the projected cash flow are the same rate that has been achieved historically.
• For K.J. Johnson & Co and Oceanic Industries a pre-tax discount rate of 19% was applied in determining the recoverable amounts of the units. For FMC Corporation a pre-tax discount rate of 22% was applied. These discount rates were estimated based on past experience, and industry average weighted cost of capital, which was based on debt leveraging of 10% at a market rate of 8.6%.
34. Subsequent events
Other than the following, there are no matters or circumstances that have arisen since the end of the financial year which significantly affected or may significantly affect the operations of the consolidated entity, the results of those operations, or the state of affairs of the consolidated entity in subsequent financial years.
Dividends declared
On 23 August 2010 the Company declared it will pay a 4.5 cents per share fully franked final dividend. This dividend is not recorded as a liability on the balance sheet date.
35. Auditors’ remuneration
Consolidated
2010 2009
Remuneration of KPMG Australia as the auditor of the parent entity for:
- Auditing or reviewing the financial report 178,600 94,000
- Acquisition agreed upon procedures 43,725 -
Remuneration of KPMG related practices as auditor of the financial report of a subsidiary
- 6,000
222,325 100,000
For
per
sona
l use
onl
y

72
Southern Cross Electrical Engineering Limited Annual Report 2010
1. In the opinion of the directors of Southern Cross Electrical Engineering Limited (the “Company”):
a. the financial statements and notes, and the Remuneration report in the Directors’ report, set out on pages 10 to 23, are in accordance with the Corporations Act 2001, including:
i. giving a true and fair view of the Company’s and the Group’s financial position as at 30 June 2010 and of the performance, for the financial year ended on that date; and
ii. complying with Australian Accounting Standards (including the Australian Accounting Interpretations) and the Corporations Regulations 2001;
b. the financial report also complies with International Financial Reporting Standards as disclosed in note 2(a),
c. there are reasonable grounds to believe that the Company will be able to pay its debts as and when they become due and payable.
2. The directors have been given the declarations required by Section 295A of the Corporations Act 2001 from the managing director and chief financial officer for the financial year ended 30 June 2010.
This declaration is made in accordance with a resolution of the Board of Directors.
Signed in accordance with a resolution of the directors:
Gianfranco TomasiDirectorPerth23 August 2010
Directors’ declarationF
or p
erso
nal u
se o
nly

KPMG, an Australian partnership and a member firm of the KPMG networkof independant member firms affiliated with KPMG International, a Swiss cooperative. 73
For
per
sona
l use
onl
y

74
Southern Cross Electrical Engineering Limited Annual Report 2010
For
per
sona
l use
onl
y

KPMG, an Australian partnership and a member firm of the KPMG networkof independant member firms affiliated with KPMG International, a Swiss cooperative. 75
For
per
sona
l use
onl
y

76
Southern Cross Electrical Engineering Limited Annual Report 2010
ASXAdditional Information76
Southern Cross Electrical Engineering Limited Annual Report 2010
For
per
sona
l use
onl
y

77
Southern Cross Electrical Engineering Limited Annual Report 2010
ASX Additional Information
Additional information required by the ASX Limited Listing Rules and not disclosed elsewhere in this report is set out below.
Shareholdings (as at 18 August 2010)
Substantial shareholders
The number of shares held by substantial shareholders and their associates are set out below:
Shareholder Number NumberGianfranco Tomasi 61,200,000 49.3%Acorn Capital 12,510,295 10.1%Aviva Investors 8,334,860 6.7%Hunter Hall Investment Management Limited 8,000,000 6.4%
Voting rights
Ordinary sharesRefer to note 25 in the financial statements.
Options There are no voting rights attached to the options.
Distribution of equity security holders
Number of equity security holders
Category Ordinary shares Options
1 - 1,000 86 -
1,001 - 5,000 305 -
5,001 - 10,000 214 -
10,001 - 100,000 294 -
100,001 and over 34 3
933 3
The number of shareholders holding less than a marketable parcel of ordinary shares is 15.
Securities Exchange
The Company is listed on the Australian Securities Exchange. The Home exchange is Perth.
Other information
Southern Cross Electrical Engineering Limited, incorporated and domiciled in Australia, is a publicly listed company limited by shares.
For
per
sona
l use
onl
y

78
Southern Cross Electrical Engineering Limited Annual Report 2010
Name Number of ordinary shares held
Percentage of capital held
FRANK TOMASI NOMINEES PTY LTD 61,200,000 49.28
NATIONAL NOMINEES LIMITED 12,970,212 10.44
J P MORGAN NOMINEES AUSTRALIA LIMITED 9,475,442 7.63
COGENT NOMINEES PTY LIMITED 7,459,000 6.01
CITICORP NOMINEES PTY LIMITED 4,590,702 3.70
HSBC CUSTODY NOMINEES (AUSTRALIA) LIMITED 2,146,178 1.73
CARMAN SUPER PTY LTD 2,000,000 1.61
WYLLIE GROUP PTY LTD 1,500,000 1.21
MR JORN WILLIAM HENRY GRANGER 1,398,293 1.13
MR RAYMOND JOHN WISE 1,398,293 1.13
ZERO NOMINEES PTY LTD 954,000 0.77
CITICORP NOMINEES PTY LIMITED 938,139 0.76
QUINHIN PTY LTD 882,353 0.71
ROLLASON PTY LTD 754,374 0.61
RBC DEXIA INVESTOR SERVICES AUSTRALIA NOMINEES PTY LIMITED 612,500 0.49
MR NIGEL GRANT TAYLOR 551,155 0.44
MR SIMON BUCHHORN 500,000 0.40
ROLLASON PTY LTD 387,600 0.31
ZIZIPHUS PTY LTD 382,000 0.31
MR CARMELO NUNZIO SCOLARO 350,000 0.28
110,450,241 88.94
Twenty largest shareholders
ASX Additional Information (continued)
For
per
sona
l use
onl
y
Offices and OfficersOffices and Officers
Company Secretary
Stephen Fewster
Principal Registered OfficeSouthern Cross Electrical Engineering Limited41 Macedonia StreetNaval Base Western Australia 6165
Telephone: +618 9410 1833Facsimile: +618 9410 2504
Locations of Share Registry
PerthComputershare Limited31 Howe StreetOsborne Park Western Australia 6017
Telephone: +618 9323 2000
Southern Cross Electrical Engineering Limited Annual Report 2010
79
For
per
sona
l use
onl
y

Southern Cross Electrical Engineering LimitedABN 92 009 307 046EC 001681
41 Macedonia Street, Naval Base WA 6165Phone: +618 9410 1833Facsimile: +618 9410 2504
For
per
sona
l use
onl
y