soil washing with a surfactant solution: pilot test at a ... · soil washing with a surfactant...
TRANSCRIPT
Soil washing with a surfactant solution: Pilot test at a gas station
(Laval, Québec, Canada)
By: Maxime Grenier, M.Sc. student - INRSRichard Martel, Research supervisor - INRSLuc Trépanier, Uta Gabriel, Clarisse D.-Rancourt and Thomas Robert - INRSJean-Marc Lauzon - TechnoRem
Context
• Gasoline is persistent in soils and groundwater
• Most conventional in situ remediation technologies cannot or struggle to reach environmental standards for groundwater and soil quality
In situ technologies limitations
• Slurping: At residual saturation, gasoline is immobile and unrecoverable (in the saturated zone).
• Chemical oxidation: Gasoline adsorbed or trapped into pore spaces resists to oxidation.
• Soil washing:– Generates huge volume of washing solutions that
have to be treated or disposed of– Ingredients costs make this technology non
economical if not recycled
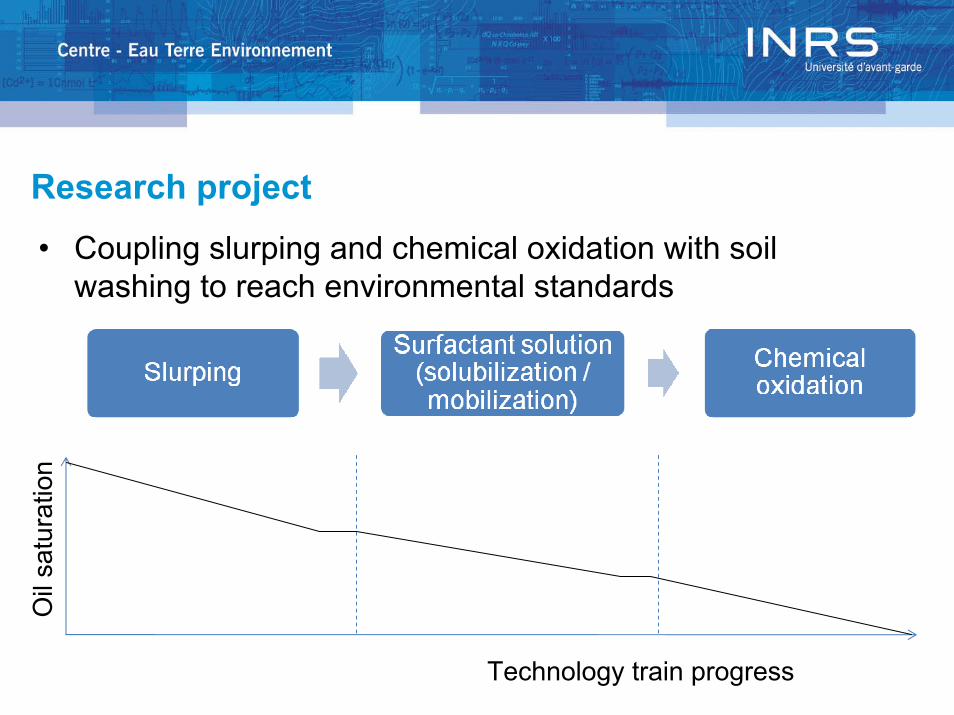
Research project
• Coupling slurping and chemical oxidation with soil washing to reach environmental standards
Oil
satu
ratio
n
Technology train progress
Surfactant solution theory
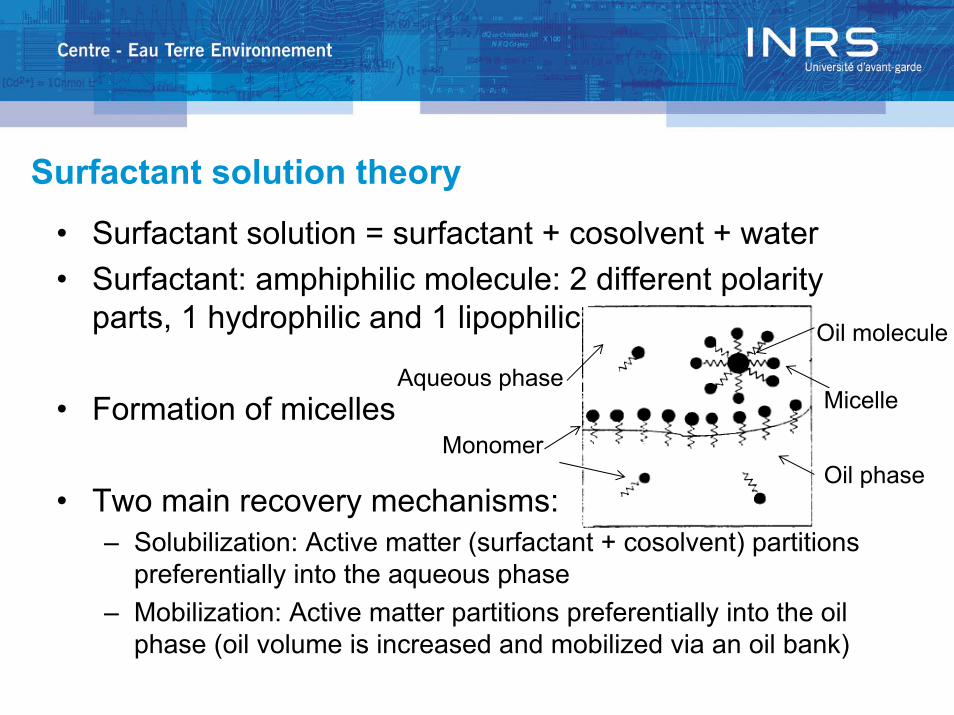
• Surfactant solution = surfactant + cosolvent + water• Surfactant: amphiphilic molecule: 2 different polarity
parts, 1 hydrophilic and 1 lipophilic
• Formation of micelles
• Two main recovery mechanisms:– Solubilization: Active matter (surfactant + cosolvent) partitions
preferentially into the aqueous phase– Mobilization: Active matter partitions preferentially into the oil
phase (oil volume is increased and mobilized via an oil bank)
Oil phase
Aqueous phase
Monomer
Oil molecule
Micelle
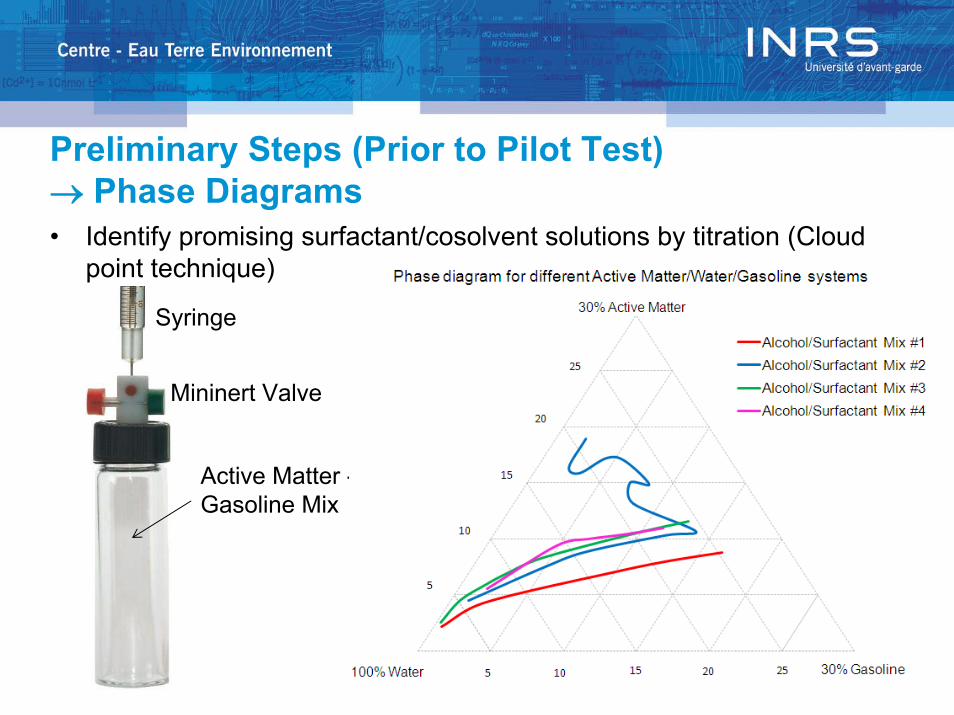
Preliminary Steps (Prior to Pilot Test)→ Phase Diagrams• Identify promising surfactant/cosolvent solutions by titration (Cloud
point technique)
Syringe
Mininert Valve
Active Matter - Water -Gasoline Mix
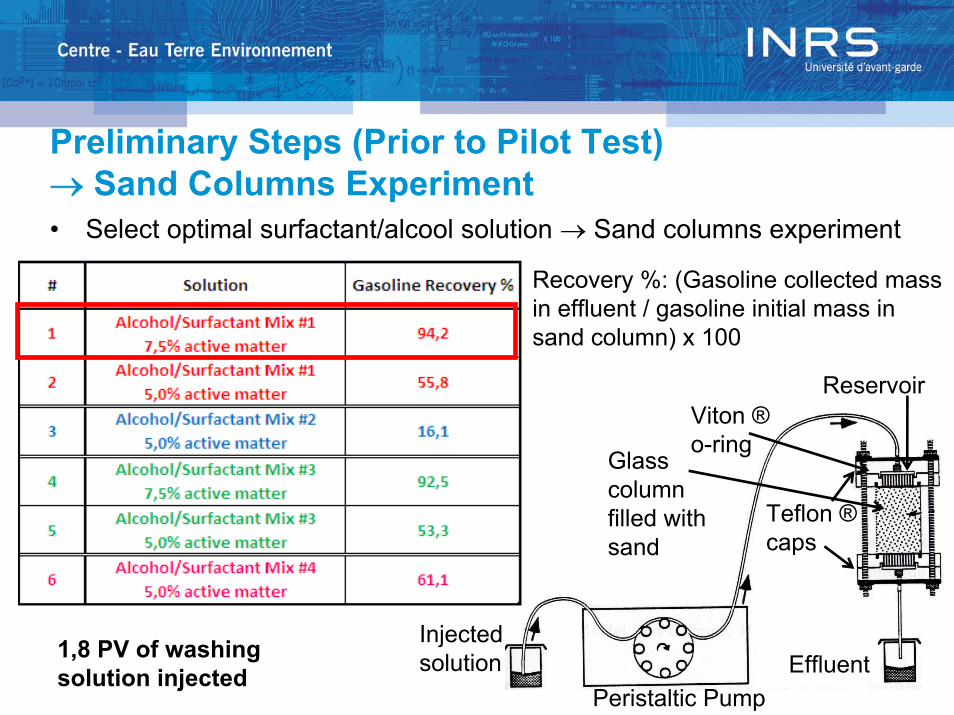
Preliminary Steps (Prior to Pilot Test)→ Sand Columns Experiment• Select optimal surfactant/alcool solution → Sand columns experiment
Injected solution
Peristaltic PumpEffluent
Glass column filled with sand
Teflon ®caps
Viton ®o-ring
Reservoir
Recovery %: (Gasoline collected mass in effluent / gasoline initial mass in sand column) x 100
1,8 PV of washing solution injected
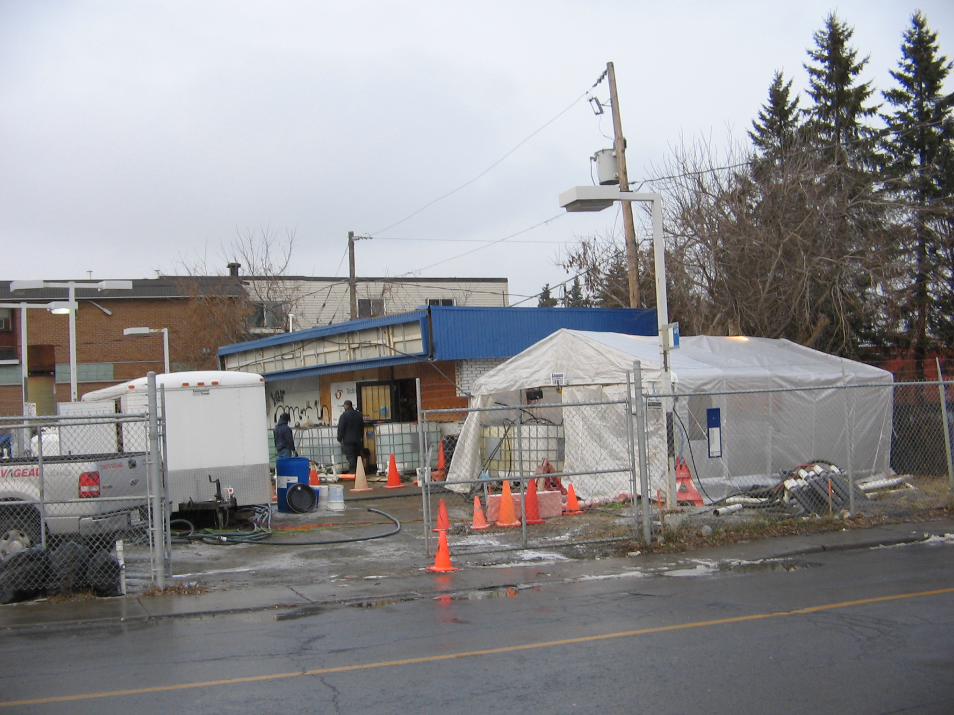
Field Context• Gas station location: Laval, Québec (5km north of
Montréal)• Two spill/leak episodes (1962 and 2005) from pipes
and underground storage tank (UST)• Estimated plume area: 2500 m2
• Geology: Silty sand with limestone boulders underlain by a fractured limestone bedrock.
• Water table at 7,0 m depth• Slurping was made over a period of 12 months
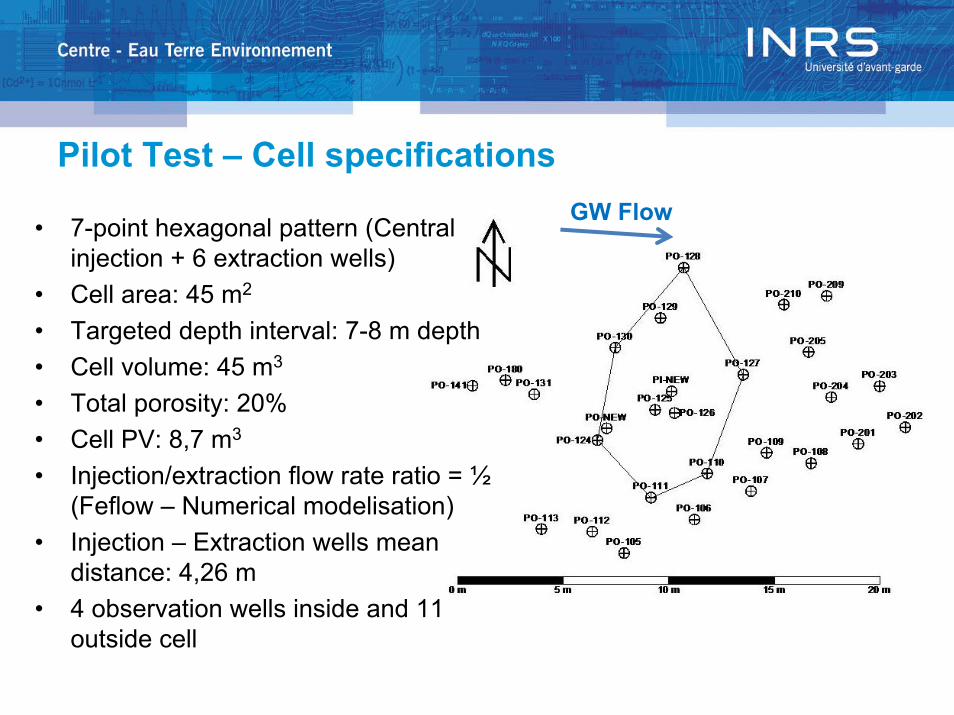
Pilot Test – Cell specificationsGW Flow• 7-point hexagonal pattern (Central
injection + 6 extraction wells)• Cell area: 45 m2
• Targeted depth interval: 7-8 m depth• Cell volume: 45 m3
• Total porosity: 20%• Cell PV: 8,7 m3
• Injection/extraction flow rate ratio = ½(Feflow – Numerical modelisation)
• Injection – Extraction wells mean distance: 4,26 m
• 4 observation wells inside and 11 outside cell
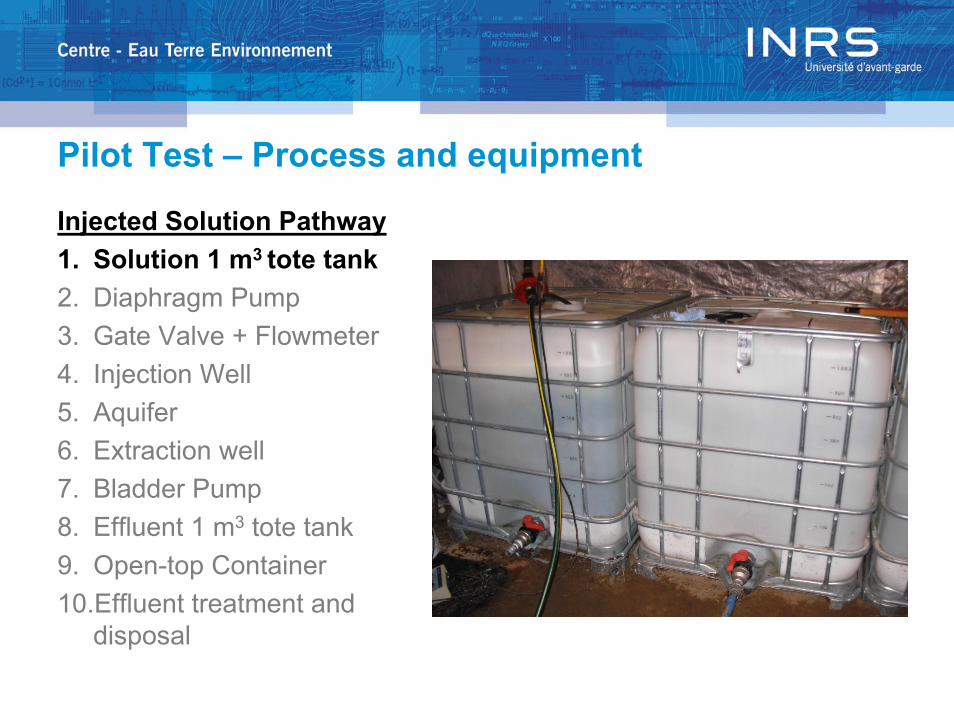
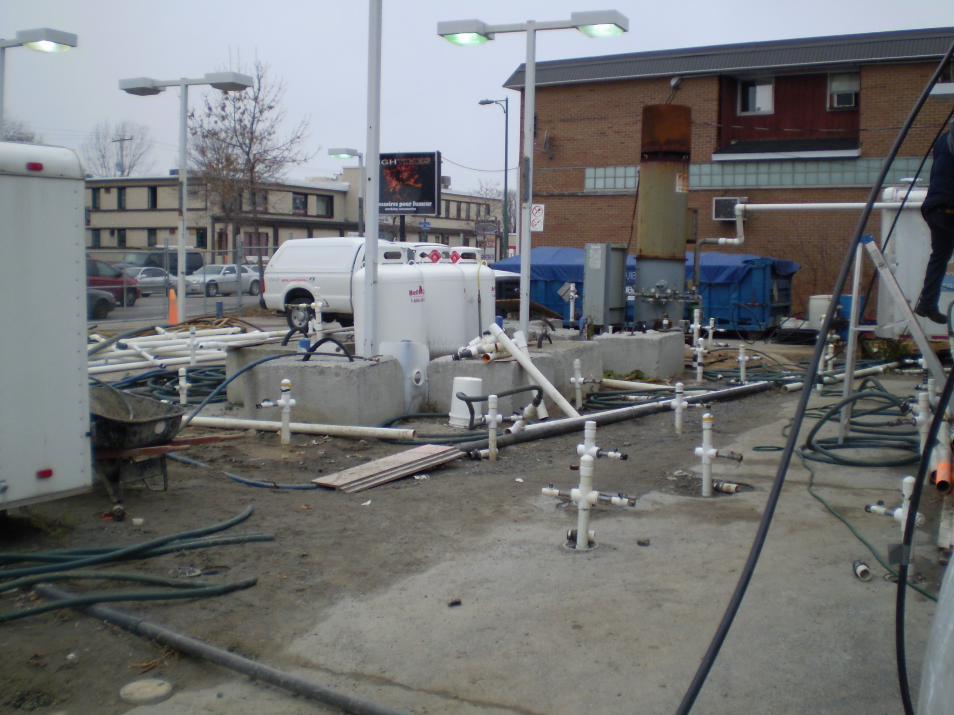
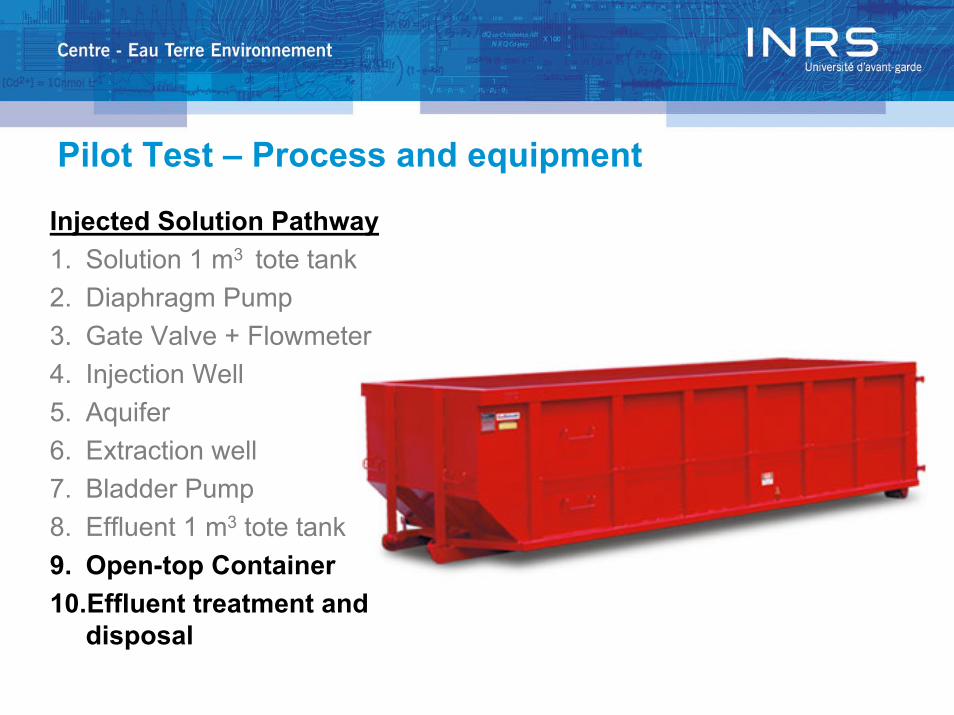
Pilot Test – Process and equipment
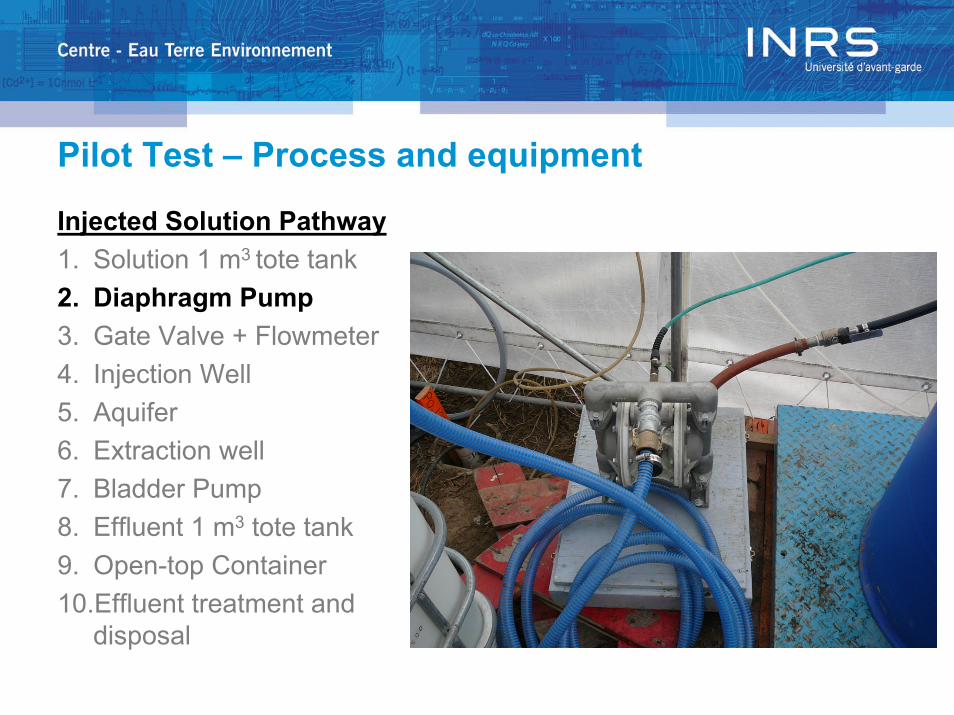
Injected Solution Pathway1. Solution 1 m3 tote tank2. Diaphragm Pump3. Gate Valve + Flowmeter4. Injection Well5. Aquifer6. Extraction well7. Bladder Pump8. Effluent 1 m3 tote tank9. Open-top Container10.Effluent treatment and
disposal
Pilot Test – Process and equipment
Injected Solution Pathway1. Solution 1 m3 tote tank2. Diaphragm Pump3. Gate Valve + Flowmeter4. Injection Well5. Aquifer6. Extraction well7. Bladder Pump8. Effluent 1 m3 tote tank9. Open-top Container10.Effluent treatment and
disposal
Pilot Test – Process and equipment
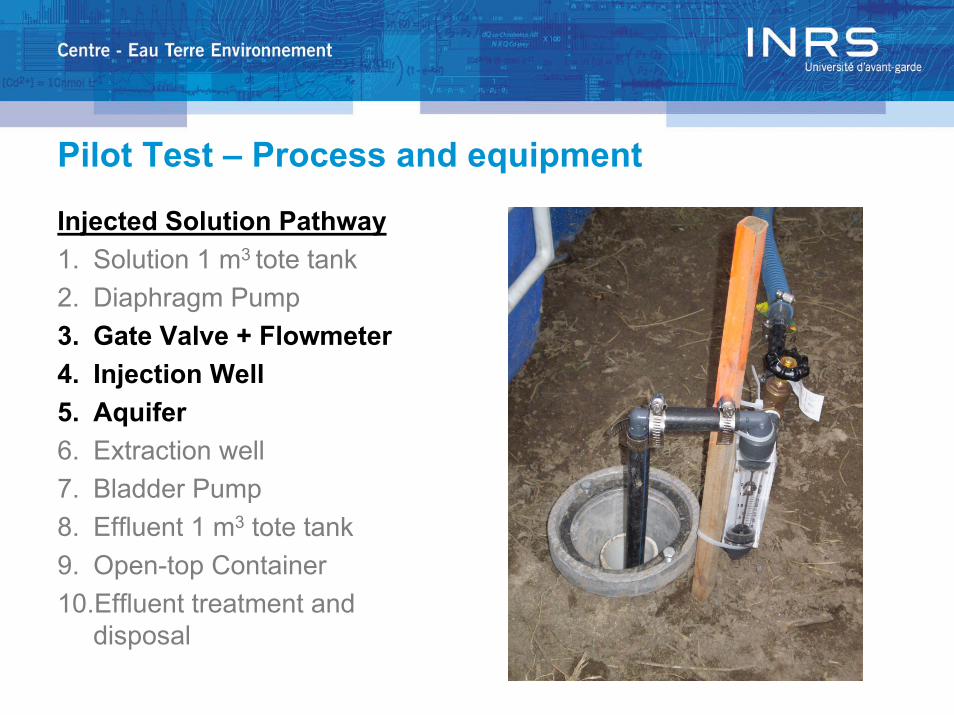
Injected Solution Pathway1. Solution 1 m3 tote tank2. Diaphragm Pump3. Gate Valve + Flowmeter4. Injection Well5. Aquifer6. Extraction well7. Bladder Pump8. Effluent 1 m3 tote tank9. Open-top Container10.Effluent treatment and
disposal
Pilot Test – Process and equipment
Injected Solution Pathway1. Solution 1 m3 tote tank2. Diaphragm Pump3. Gate Valve + Flowmeter4. Injection Well5. Aquifer6. Extraction well7. Bladder Pump8. Effluent 1 m3 tote tank9. Open-top Container10.Effluent treatment and
disposal
Pilot Test – Process and equipment
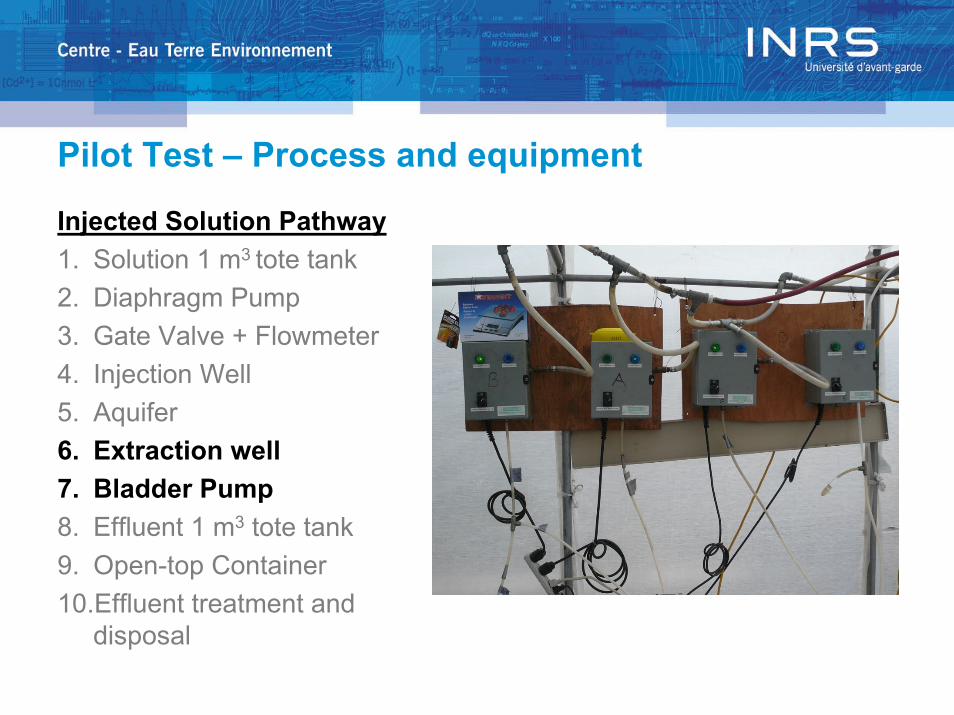
Injected Solution Pathway1. Solution 1 m3 tote tank2. Diaphragm Pump3. Gate Valve + Flowmeter4. Injection Well5. Aquifer6. Extraction well7. Bladder Pump8. Effluent 1 m3 tote tank9. Open-top Container10.Effluent treatment and
disposal
Pilot Test – Process and equipment
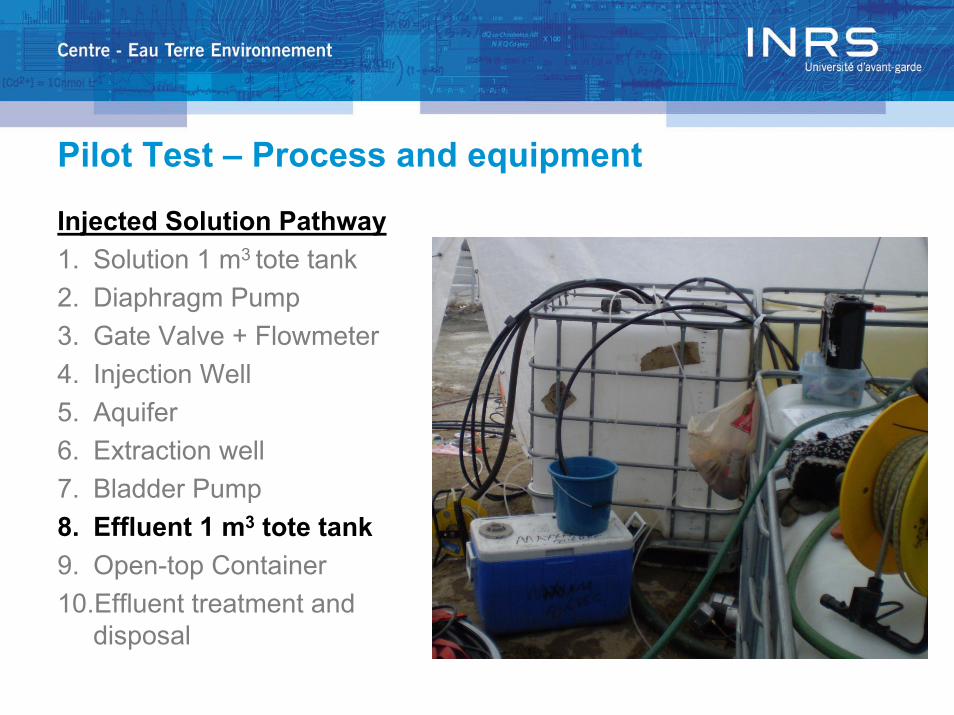
Injected Solution Pathway1. Solution 1 m3 tote tank2. Diaphragm Pump3. Gate Valve + Flowmeter4. Injection Well5. Aquifer6. Extraction well7. Bladder Pump8. Effluent 1 m3 tote tank9. Open-top Container10.Effluent treatment and
disposal

Pilot Test – Costs of chemicals
• 300 kg of pure surfactant at 10,80$/kg = 3 240 $
• 300 kg of cosolvent at 3,70$/kg = 1 110 $
• 180 kg of salt (NaCl) at 0,55$/kg = 100 $
• 5 kg of polymer at 11,90$/kg = 60$
Total cost of chemicals = 4510 $ (45 m3 of contaminated soil)
Unit cost ≈ 100 $/m3 of contaminated soil
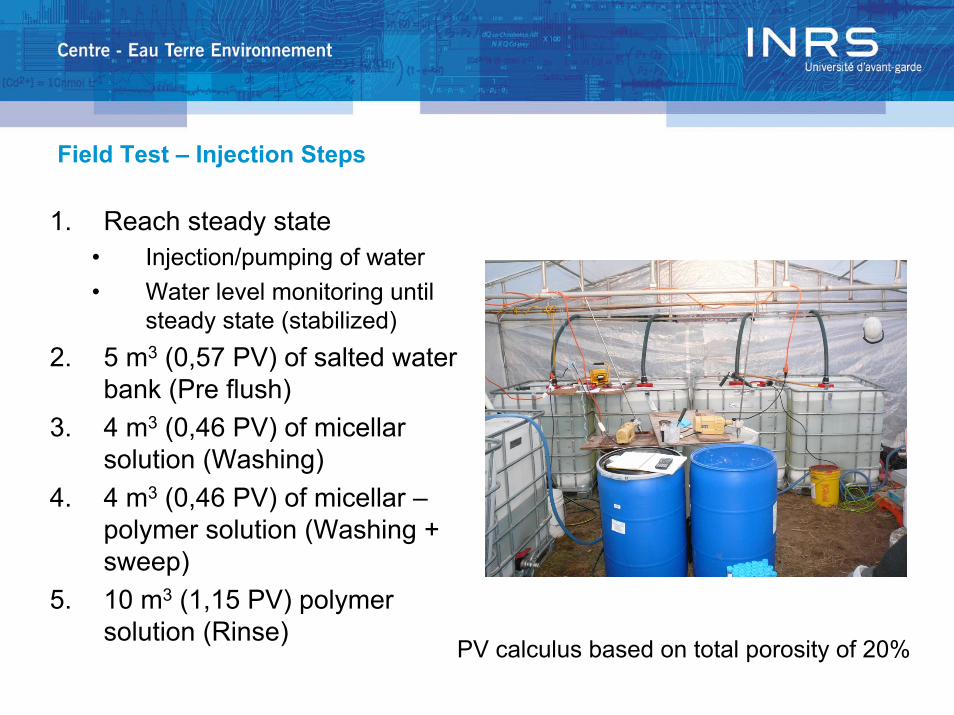
Field Test – Injection Steps
1. Reach steady state• Injection/pumping of water• Water level monitoring until
steady state (stabilized)2. 5 m3 (0,57 PV) of salted water
bank (Pre flush)3. 4 m3 (0,46 PV) of micellar
solution (Washing)4. 4 m3 (0,46 PV) of micellar –
polymer solution (Washing + sweep)
5. 10 m3 (1,15 PV) polymer solution (Rinse)
PV calculus based on total porosity of 20%
Field Test – Water Sampling
Objectives• Establish initial
conditions in the cell• Follow the injected
fluids in the cell• Measure recovered
gasoline from the cell
Sampling locations• Extraction wells• Injection well• Observation wells• Effluent reservoir• Injection reservoir
Over 500 liquid samples taken
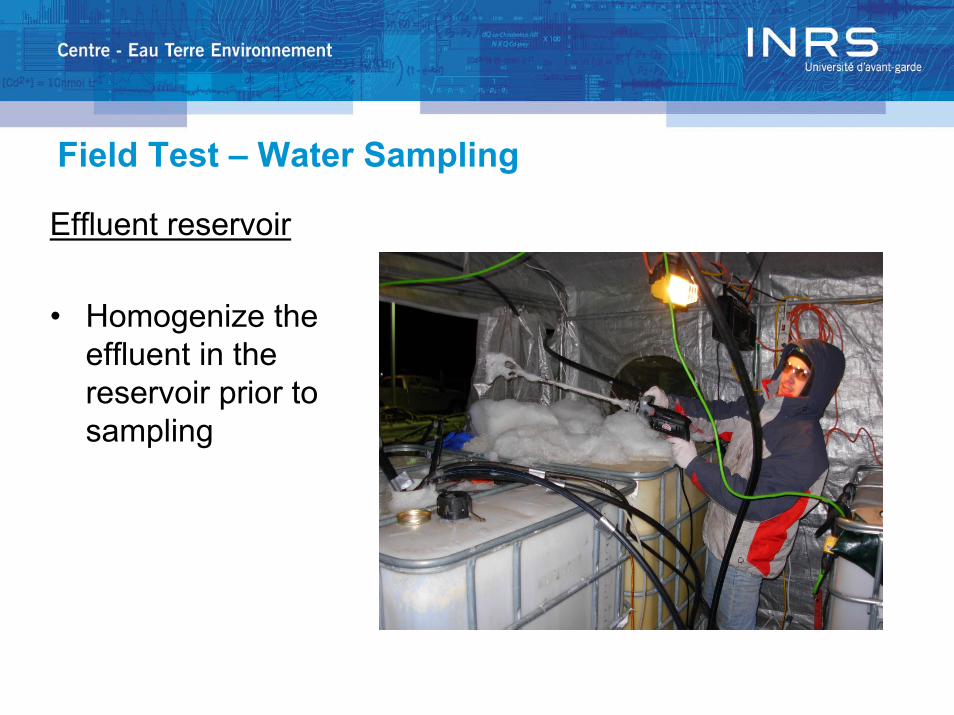
Field Test – Water Sampling
Effluent reservoir
• Homogenize the effluent in the reservoir prior to sampling
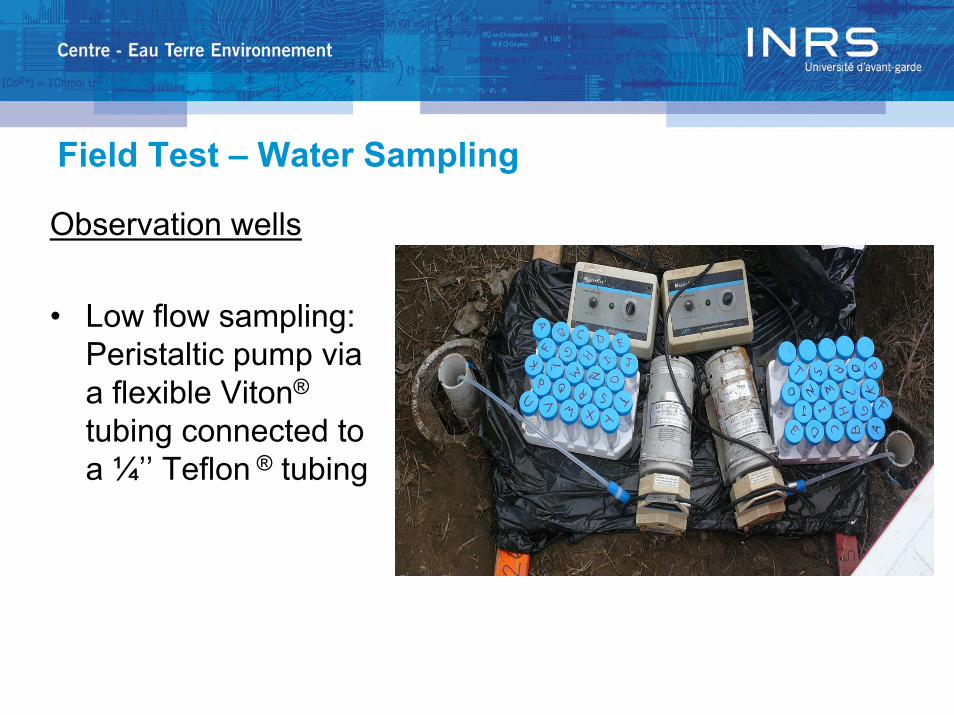
Field Test – Water Sampling
Observation wells
• Low flow sampling: Peristaltic pump via a flexible Viton®
tubing connected to a ¼’’ Teflon ® tubing
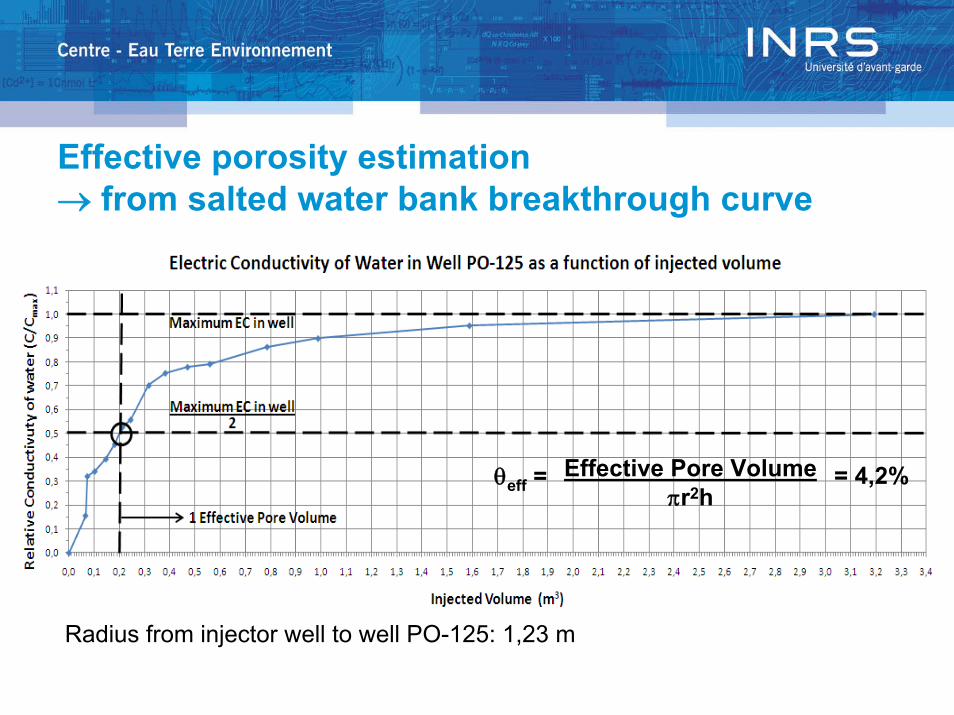
Effective porosity estimation→ from salted water bank breakthrough curve
θeff = Effective Pore Volumeπr2h
= 4,2%
Radius from injector well to well PO-125: 1,23 m
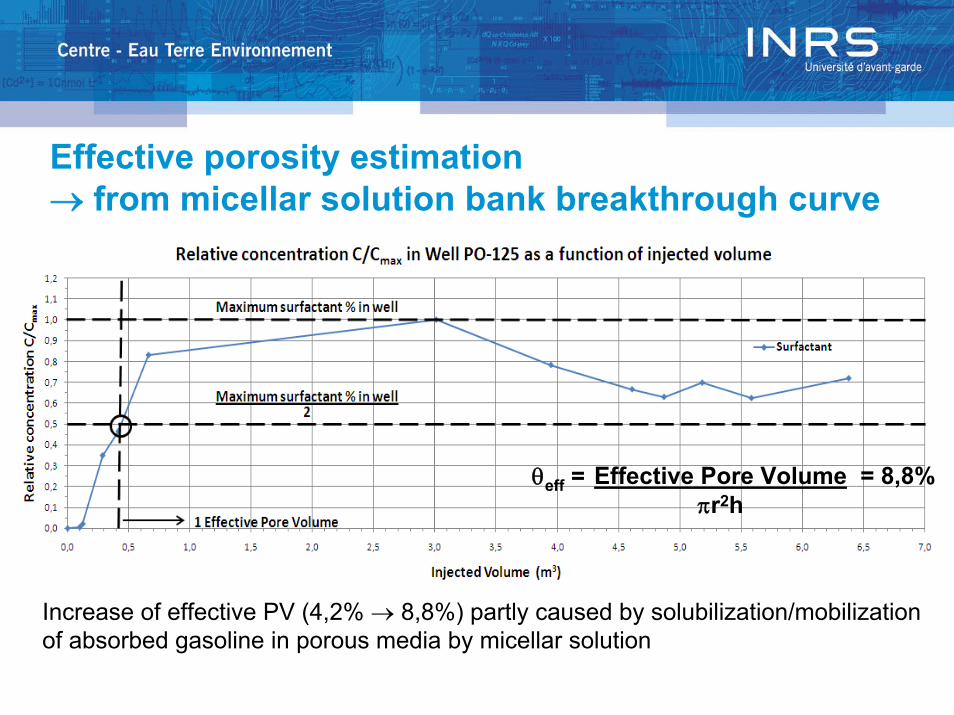
Effective porosity estimation→ from micellar solution bank breakthrough curve
θeff = Effective Pore Volumeπr2h
= 8,8%
Increase of effective PV (4,2% → 8,8%) partly caused by solubilization/mobilization of absorbed gasoline in porous media by micellar solution
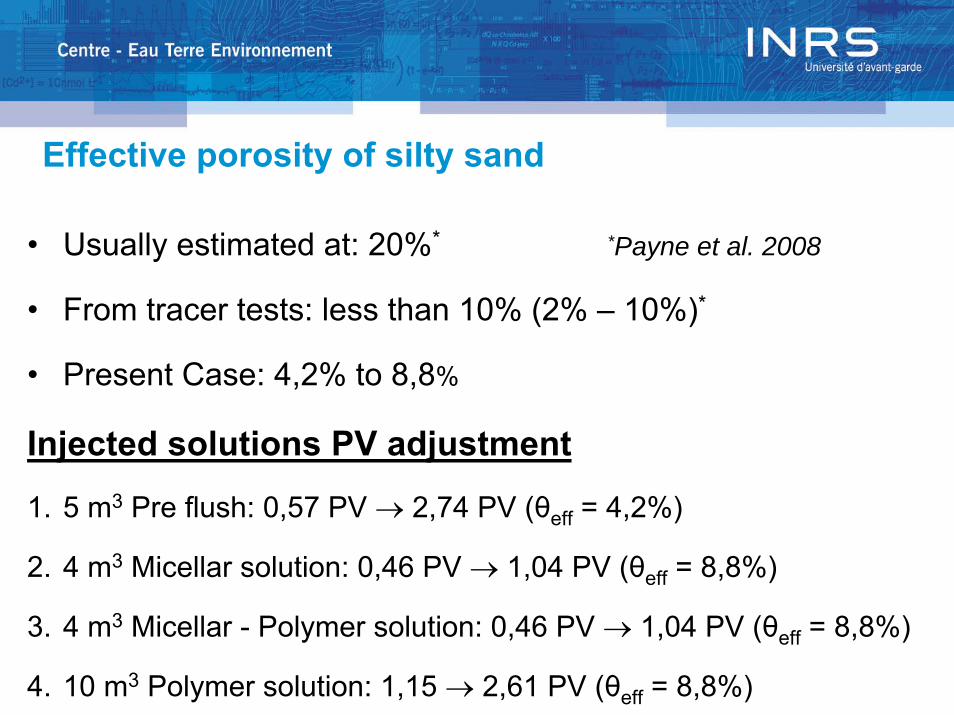
Effective porosity of silty sand
• Usually estimated at: 20%* *Payne et al. 2008
• From tracer tests: less than 10% (2% – 10%)*
• Present Case: 4,2% to 8,8%
Injected solutions PV adjustment
1. 5 m3 Pre flush: 0,57 PV → 2,74 PV (θeff = 4,2%)
2. 4 m3 Micellar solution: 0,46 PV → 1,04 PV (θeff = 8,8%)
3. 4 m3 Micellar - Polymer solution: 0,46 PV → 1,04 PV (θeff = 8,8%)
4. 10 m3 Polymer solution: 1,15 → 2,61 PV (θeff = 8,8%)
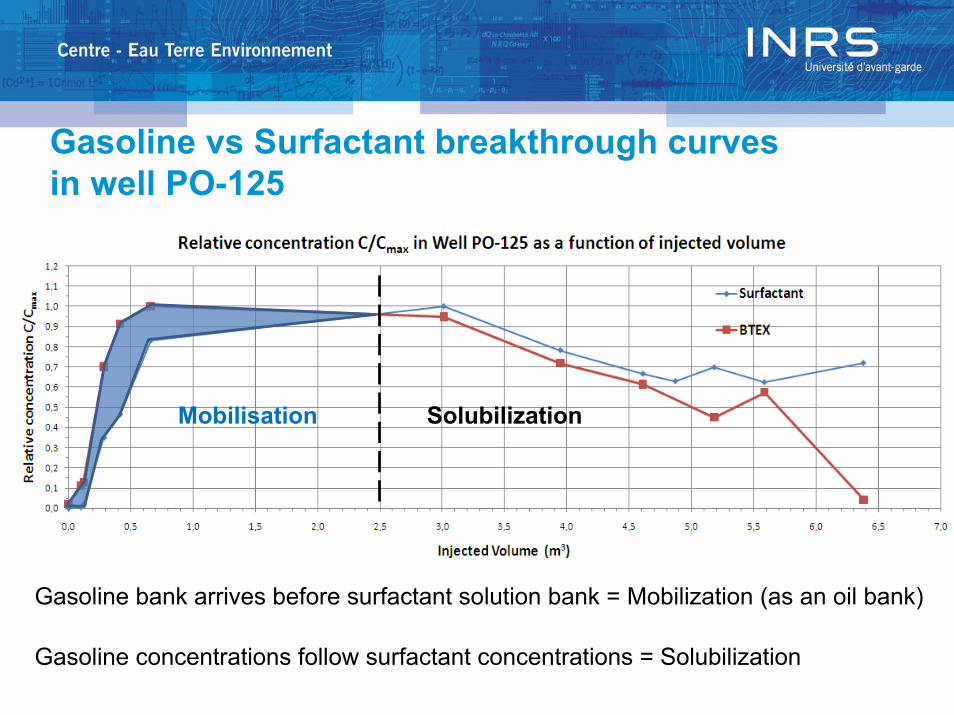
Gasoline vs Surfactant breakthrough curvesin well PO-125
Gasoline bank arrives before surfactant solution bank = Mobilization (as an oil bank)
Gasoline concentrations follow surfactant concentrations = Solubilization
Mobilisation Solubilization
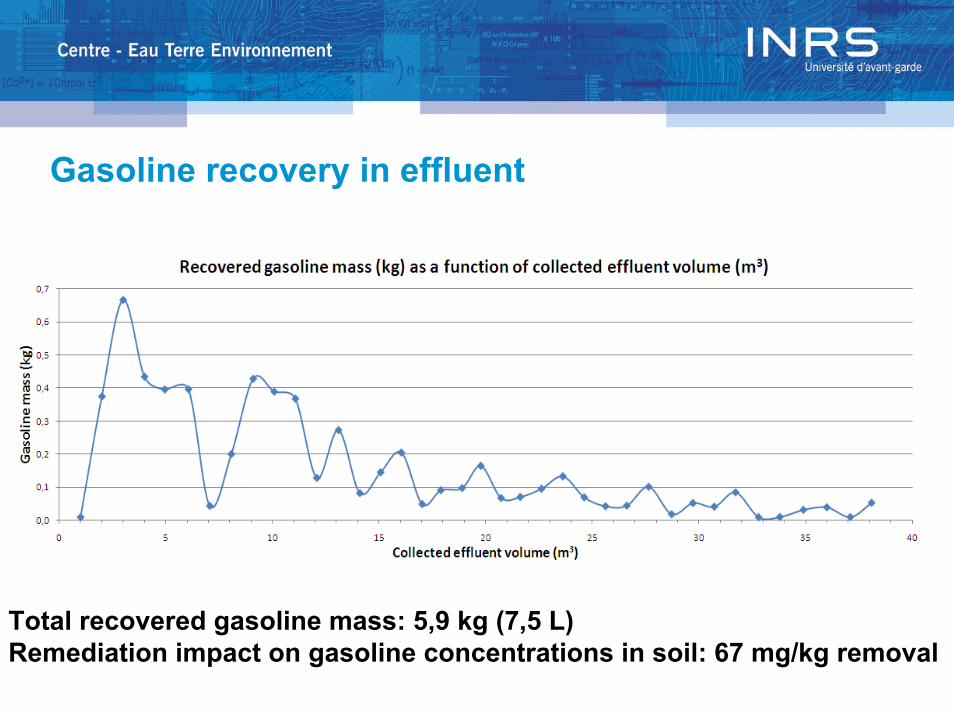
Gasoline recovery in effluent
Total recovered gasoline mass: 5,9 kg (7,5 L)Remediation impact on gasoline concentrations in soil: 67 mg/kg removal
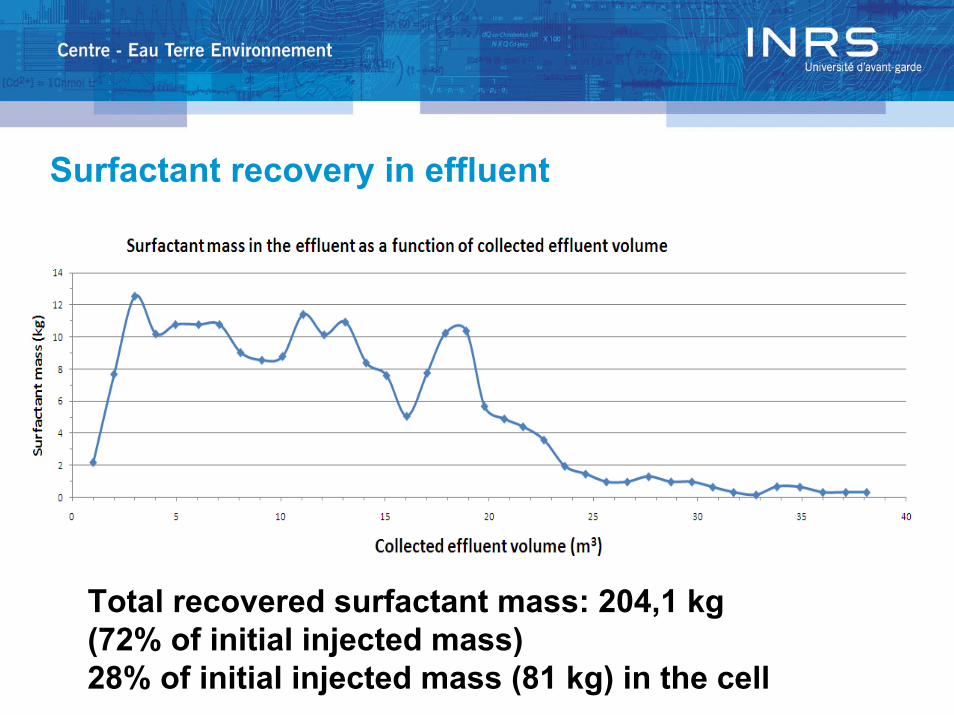
Surfactant recovery in effluent
Total recovered surfactant mass: 204,1 kg (72% of initial injected mass)28% of initial injected mass (81 kg) in the cell
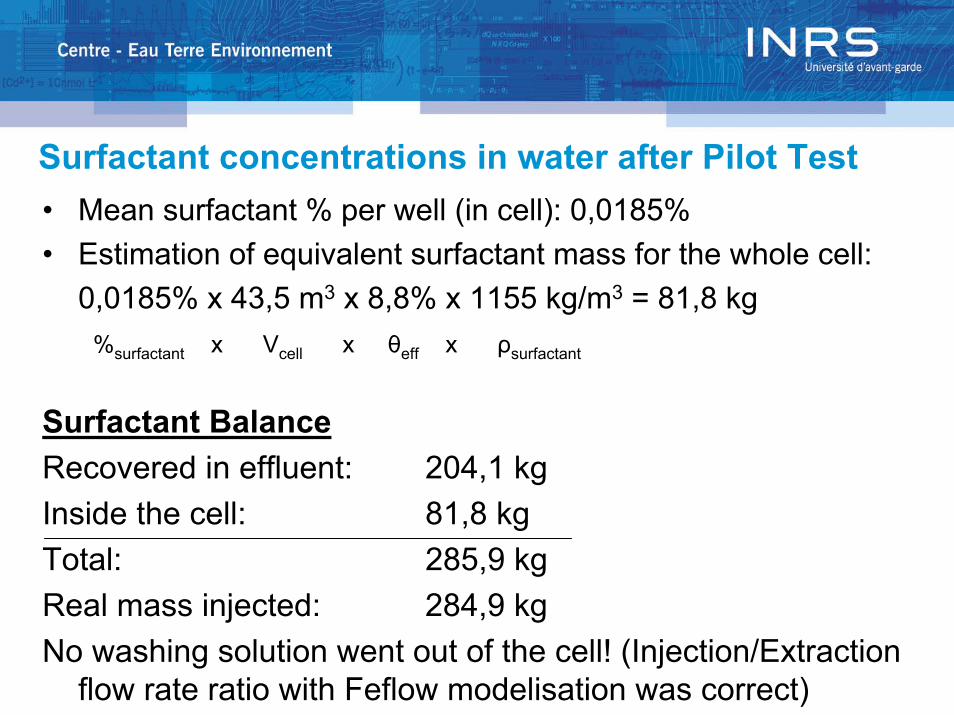
Surfactant concentrations in water after Pilot Test • Mean surfactant % per well (in cell): 0,0185%• Estimation of equivalent surfactant mass for the whole cell:
0,0185% x 43,5 m3 x 8,8% x 1155 kg/m3 = 81,8 kg%surfactant x Vcell x θeff x ρsurfactant
Surfactant BalanceRecovered in effluent: 204,1 kgInside the cell: 81,8 kgTotal: 285,9 kgReal mass injected: 284,9 kgNo washing solution went out of the cell! (Injection/Extraction
flow rate ratio with Feflow modelisation was correct)
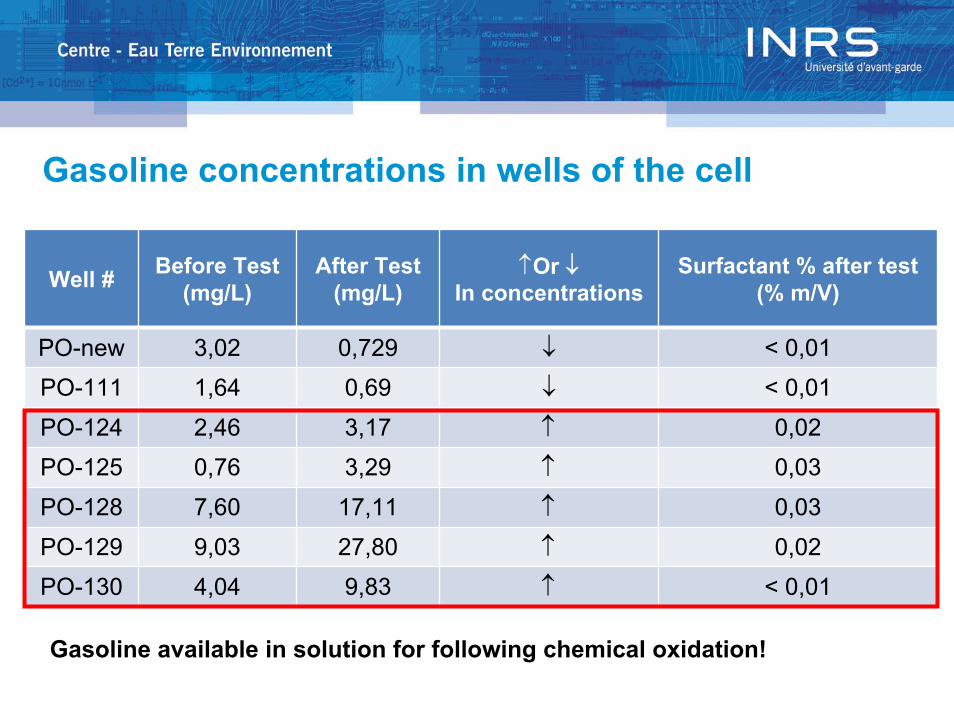
Gasoline concentrations in wells of the cell
Well # Before Test(mg/L)
After Test(mg/L)
↑Or ↓In concentrations
Surfactant % after test(% m/V)
PO-new 3,02 0,729 ↓ < 0,01PO-111 1,64 0,69 ↓ < 0,01
PO-124 2,46 3,17 ↑ 0,02PO-125 0,76 3,29 ↑ 0,03
PO-128 7,60 17,11 ↑ 0,03
PO-129 9,03 27,80 ↑ 0,02PO-130 4,04 9,83 ↑ < 0,01
Gasoline available in solution for following chemical oxidation!
Conclusion• Laboratory tests are necessary prior to soil washing
(eg: phase diagrams and sand columns)• Ingredients costs for soil washing: 100$/m3 of contaminated soil
(Lower cost for a larger project)• Effective porosity must be determined via tracer test prior to
washing solution injection.• Effective porosity will increase during soil washing and is related to
initial oil saturation • Gasoline is recovered by two mechanisms: Mobilization and
Solubilization• Impact of washing solution remediation:
– Direct: Decreases gasoline mass in soils– Indirect: Helps chemical oxidation by bringing adsorbed / trapped
gasoline into solution to be oxidized

Thank you!
Questions?