polysaccharide-surfactant interaction -
DESCRIPTION
In our present work, we have studied the adsorption of cationic surfactants of varied chain lengths onto cellulose at different physicochemical conditions and in the presence of different neutral electrolytesand urea. The role of hydration over the binding interaction of surfactants has been critically examined. Thechanges of free energy due to the binding of surfactants to cellulose under different physicochemicalconditions have been evaluated using an integrated form of the Gibbs adsorption equation. The nature of surfactant-cellulose interaction has also been analyzed from thermodynamic considerations.TRANSCRIPT
POLYSACCHARIDE-SURFACTANT INTERACTION PART: 1
ADSORPTION OF CATIONIC SURFACTANTS AT
CELLULOSE-WATER INTERFACE
Chapter-2
POLYSACCHARIDE-SURFACTANT INTERACTION PART-1ADSORPTION OF CATIONIC SURFACTANTS AT CELLULOSE-
WATER INTERFACE
Introduction
Recently, extensive studies have been made on the interaction of cationic and anionic surfactants
with natural and synthetic polymers.1-5 Such studies are found to be of importance from fundamental and
technological standpoints. In the last two decades, thermodynamic and kinetic aspects of binding of
cationic and anionic surfactants to proteins5-8 and nucleic acids9 have been extensively investigated using
various experimental techniques. Compared to this, the study of interaction of ionic surfactants with
different types of polysaccharides has been undertaken in depth only in recent years with many interesting
results. The physicochemical principles involved in cellulose-surfactant interactions are known for a long
time to be closely associated with detergent action and laundry cleaning of oiled fabrics.10-12 By use of
equilibrium dialysis and other techniques, the extent of binding of surfactants to soluble cellulose
derivatives has been investigated under different physicochemical conditions.13-16 Goddard et al.17,18 in their
reviews have extensively covered the techniques and principles used for the study of interaction of
surfactants with cellulose derivatives. Lindman and co-workers19-22 and others23 have studied the interaction
of ionic surfactants with hydrophobically modified cellulose and other derivatives using different
physicochemical conditions. Interactions of surfactants with cellulose have been studied by few workers
recently.24-26 Giles and Arshid27, 28 from the adsorption of a series of chemically related solutes onto
cellulose and chitin have reported that cellulose is hydrophobic in nature.
In our present work, we have studied the adsorption of cationic surfactants of varied chain lengths
onto cellulose at different physicochemical conditions and in the presence of different neutral electrolytes
and urea. The role of hydration over the binding interaction of surfactants has been critically examined. The
changes of free energy due to the binding of surfactants to cellulose under different physicochemical
conditions have been evaluated using an integrated form of the Gibbs adsorption equation. The nature of
surfactant-cellulose interaction has also been analyzed from thermodynamic considerations.
Experimental Section
Materials:
Highly pure cellulose (TLC-Grade) was obtained from CSIR Centre for Biochemicals, New
Delhi. The cationic surfactants cetyltrimethyl ammonium bromide (CTAB), myristyltrimethyl ammonium
bromide (MTAB), and dodecyltrimethyl ammonium bromide (DTAB) were obtained from Nakarai
Chemicals Ltd. (Guaranteed Reagent), Japan, and TCI (GR), Japan, respectively. The purity and critical
micelle concentration (cmc) of the surfactants have been determined by measurement of surface tension of
(41)
solutions as a function of surfactant concentration. The values of cmc for CTAB, MTAB, and DTAB were
found to be 0.89, 3.4, and 13.4 mM, respectively, which agreed with those reported earlier.7,9,29 Other
common electrolytes, acids, and urea used were of analytical grade. Urea was recrystallized from warm
alcohol before use. Double distilled water was used all throughout the experimental work.
Before use, cellulose was dehydrated completely in a vacuum desiccator containing concentrated
sulfuric acid for 7 days, and then the dried cellulose was kept in a desiccator containing anhydrous CaCl2.
Stock quantities of phosphate buffer solution of desired pH 6.0 and 8.0 and acetate buffer of pH
4.0 were used in these experiments. The ionic strength of the solution was maintained by direct addition of
calculated amount of NaCl.
Adsorption Experiment:
In the adsorption experiments, a fixed amount, W (equal to 2 x 10⁻⁴ kg), of dried cellulose was
taken in different standard joint stoppered round bottom conical flasks (capacity 100 mL). Then a fixed
volume, V (equal to 20 mL), of solutions of different molar concentrations ( tC2 ) was taken into each flask.
The flasks were then sealed and shaken gently on a horizontal shaker for 24 h at constant temperature. The
flasks were taken away from the shaker and kept undisturbed for another 24 h. The temperature of the
systems was kept constant by an air thermostat (± 0.1°C accuracy). After attainment of equilibrium, the
supernatant in the bottle was found by spectroscopic examination to be free from suspended particles after
centrifugation at 7000 rpm. The concentration of the surfactant (C2) in the supernate was estimated by the
dye partition technique.30,31 Here 1mL of surfactant solution (after proper dilution) was taken in a set of
standard joint stoppered test tubes (capacity 60 mL) and to it 1 mL of dye solution (disulphine blue of
concentration 200 mg/L in 50N H2SO4) was added. After 10 min, 10 mL of chloroform was added into each
test tube. The test tubes were then stoppered tightly and shaken vigorously for 10 min and then kept
undisturbed for another 45 min at 30 °C in a thermostatic chamber. The organic layer was withdrawn by a
syringe and absorbance was read in a spectrophotometer (Hitachi U 2000) at 625 nm. The concentration of
surfactant (C2) was calculated using a standard curve obtained from the measurement of the absorbance of
the surfactant solutions of known concentrations.
The moles of surfactant adsorbed per kilogram of cellulose ( 12Γ ) at a bulk concentration C2 can be
calculated using relation (1)
( )2212 1000
CCV tt
−=Γ (2.1)
Where Vt stands for volume of the surfactant solution in mL per kg of cellulose and is equal to
V/W. The limit of standard deviation in the measurement of 12Γ was found to be less than 6%calculated for
ten sets, and the errors are shown in Figure 1.
(42)
Results and Discussion
Cellulose is a polysaccharide made up of monomeric glucose residues forming a linear polymer
chain. It is fibrous, tough, and water insoluble unbranched homopolysaccharide of 10,000 or more glucose
units connected by 1-4 glycosidic bonds. These 1-4 bonds are in β configuration as a result of which the D-
glucose chain assumes an extended conformation and undergoes side by side aggregation into insoluble
fibrils. Linear chains of cellulose in the fibrils are held together by cross links of a large number of
hydrogen bonds.32,33 Each glucose residue of the linear polymer may involve interchain hydrogen bond
formation, but few hydroxyl groups may combine with external water molecules as a result of polymer
hydration. The surface of cellulose powder is significantly hydrophilic in nature. Recently Banerjee and
Chattoraj34 have shown from the isopiestic vapor pressure experiments that two and three molecules of
water are adsorbed per glucose residue of the polysaccharide chain of cellulose at 30 and 37 °C,
respectively, at unit water activity.
In figs. 2.1-2.2, the extent of adsorption of CTAB from the aqueous solution to the surface of 1 kg
of cellulose ( 12Γ ) has been plotted against equilibrium concentration (C2) of surfactant in the bulk liquid
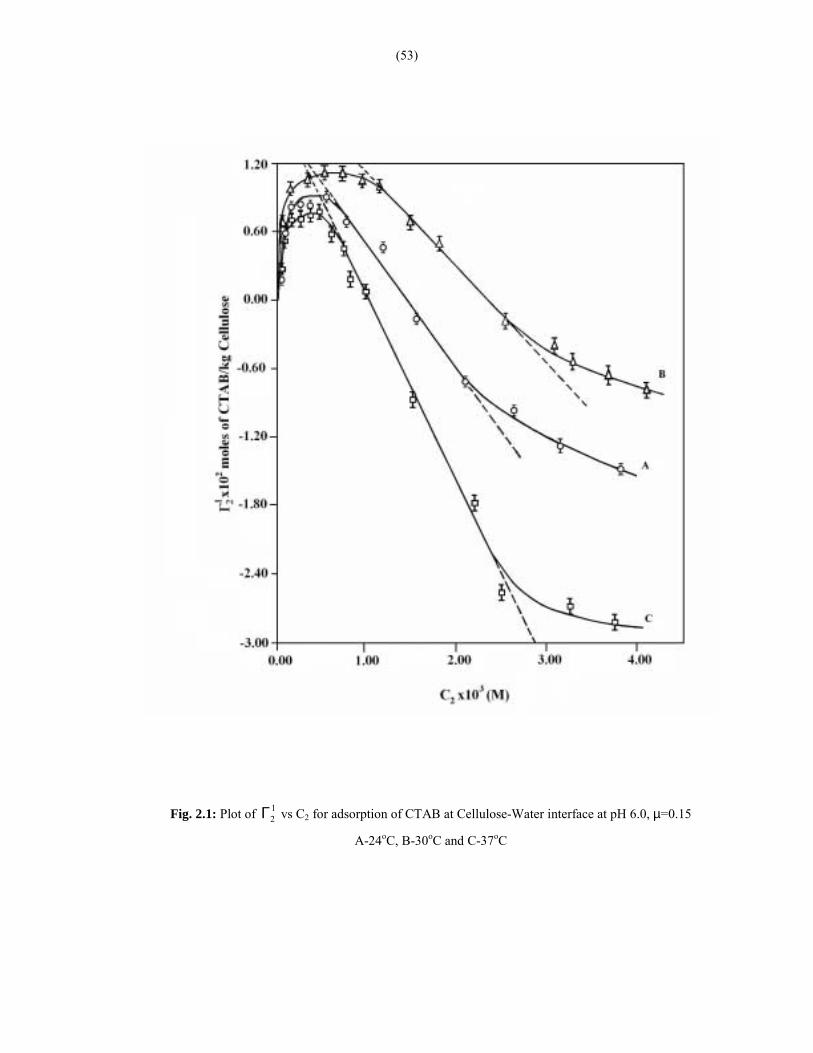
medium. All isotherms are type IV in shape according to the classification given by Schay.35 An interesting
feature of all these adsorption isotherms is that 12Γ increases with increase of C2 from zero until the
adsorption reaches maximum positive value m2Γ at a critical concentration mC2 . In most cases, mC2 is less
than bulk cmc of CTAB. The value of 12Γ in all cases sharply decreases from m
2Γ until it becomes zero. On
further increase of C2, 12Γ becomes negative.
According to equation (2.1), 12Γ depends on the difference between tC2 and C2 both estimated for
bulk solution before and after adsorption. The difference tC2 -C2 may result from preferential accumulation
of surfactant at the cellulose interface or from it�s desorption from the surface depending on the value of
C2. The value of tC2 -C2 may also depend on the relative state of preferential hydration or dehydration of
dry cellulose in the presence of bulk surfactant solution which may result on the swelling or deswelling of
the polysaccharide depending on the value of C2. As a result of combined effects of all these, tC2 may be
greater or less than C2, so that 12Γ may become positive or negative at a given value of C2.
Since the surfactant solution in contact with surface is dilute, one can assume that its molarity
(C2) and molality (m2) in the bulk solution are same. Also for such a solution Wt is equal to Vt, where Wt is
the weight of the solvent in grams per kilogram of cellulose. Replacing tC2 , C2, and Wt terms by
11
2
11
2 1000,
1000nMn
nMnt
t
and 11 Mnt , respectively, one finds from equation (2.1).8
(43)
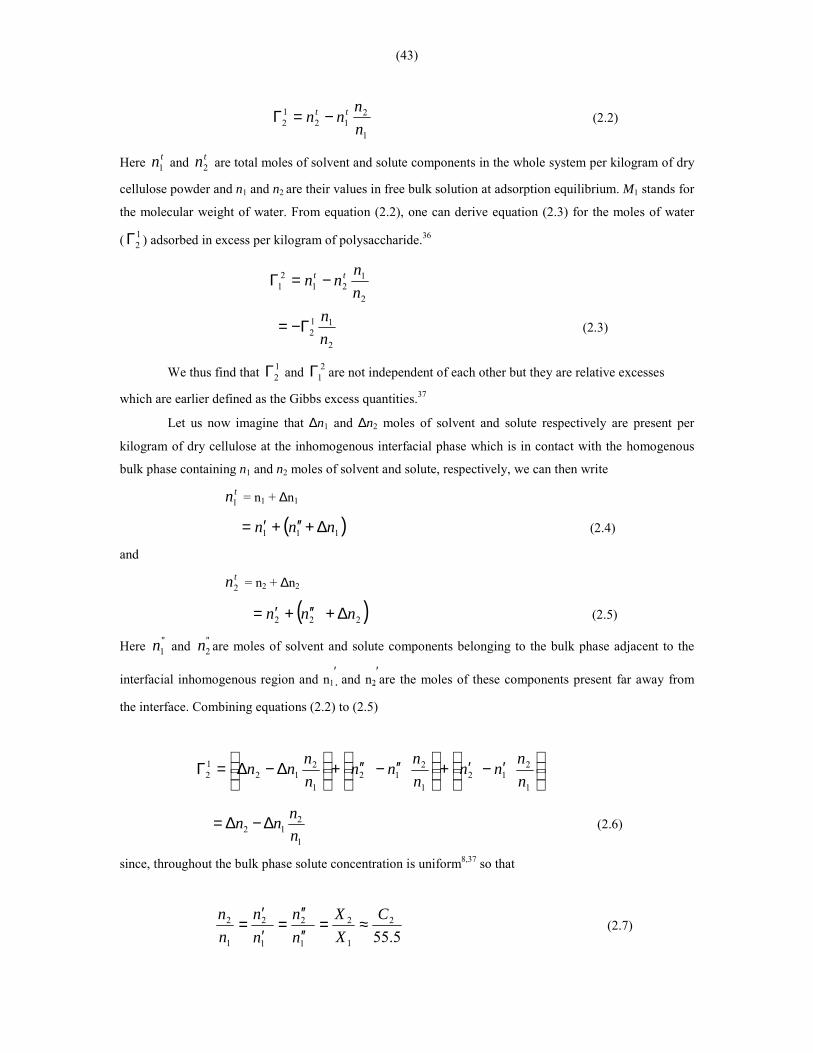
1
212
12 n
nnn tt −=Γ (2.2)
Here tn1 and tn2 are total moles of solvent and solute components in the whole system per kilogram of dry
cellulose powder and n1 and n2 are their values in free bulk solution at adsorption equilibrium. M1 stands for
the molecular weight of water. From equation (2.2), one can derive equation (2.3) for the moles of water
( 12Γ ) adsorbed in excess per kilogram of polysaccharide.36
2
121
21 n
nnn tt −=Γ
2
112 n
nΓ−= (2.3)
We thus find that 12Γ and 2
1Γ are not independent of each other but they are relative excesses
which are earlier defined as the Gibbs excess quantities.37
Let us now imagine that ∆n1 and ∆n2 moles of solvent and solute respectively are present per
kilogram of dry cellulose at the inhomogenous interfacial phase which is in contact with the homogenous
bulk phase containing n1 and n2 moles of solvent and solute, respectively, we can then write
tn1 = n1 + ∆n1
( )111 nnn ∆+′′+′= (2.4)
and
tn2 = n2 + ∆n2
( )222 nnn ∆+′′+′= (2.5)
Here "1n and "
2n are moles of solvent and solute components belonging to the bulk phase adjacent to the
interfacial inhomogenous region and n1′ and n2
′ are the moles of these components present far away from
the interface. Combining equations (2.2) to (2.5)
′−′+
′′−′′+
∆−∆=Γ
1
212
1
212
1
212
12 n
nnnnnnn
nnnn
1
212 n
nnn ∆−∆= (2.6)
since, throughout the bulk phase solute concentration is uniform8,37 so that
5.55
2
1
2
1
2
1
2
1
2 CXX
nn
nn
nn
≈=′′′′
=′′
= (2.7)
(44)
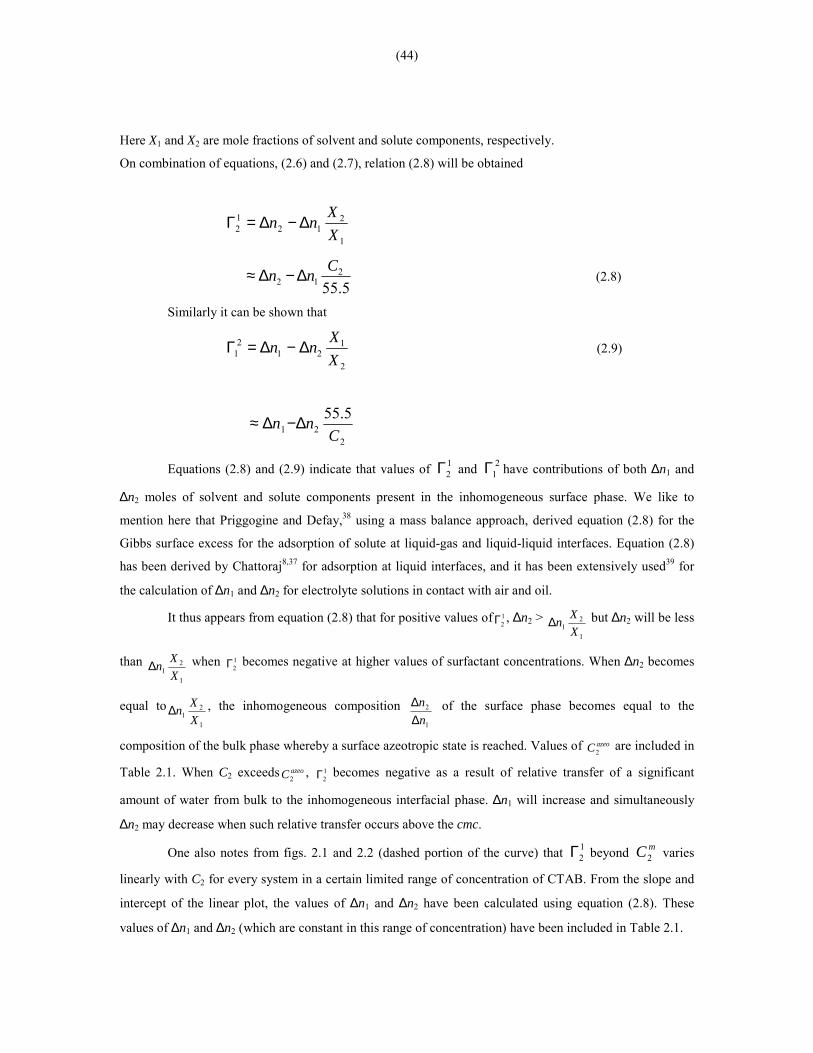
Here X1 and X2 are mole fractions of solvent and solute components, respectively.
On combination of equations, (2.6) and (2.7), relation (2.8) will be obtained
1
212
12 X
Xnn ∆−∆=Γ
5.55
212
Cnn ∆−∆≈ (2.8)
Similarly it can be shown that
2
121
21 X
Xnn ∆−∆=Γ (2.9)
2
215.55
Cnn ∆−∆≈
Equations (2.8) and (2.9) indicate that values of 12Γ and 2
1Γ have contributions of both ∆n1 and
∆n2 moles of solvent and solute components present in the inhomogeneous surface phase. We like to
mention here that Priggogine and Defay,38 using a mass balance approach, derived equation (2.8) for the
Gibbs surface excess for the adsorption of solute at liquid-gas and liquid-liquid interfaces. Equation (2.8)
has been derived by Chattoraj8,37 for adsorption at liquid interfaces, and it has been extensively used39 for
the calculation of ∆n1 and ∆n2 for electrolyte solutions in contact with air and oil.
It thus appears from equation (2.8) that for positive values of 12Γ , ∆n2 >
1
21 X
Xn∆ but ∆n2 will be less
than 1
21 X
Xn∆ when 12Γ becomes negative at higher values of surfactant concentrations. When ∆n2 becomes
equal to1
21 X
Xn∆ , the inhomogeneous composition 1
2
nn
∆∆ of the surface phase becomes equal to the
composition of the bulk phase whereby a surface azeotropic state is reached. Values of azeoC2 are included in
Table 2.1. When C2 exceeds azeoC2, 1
2Γ becomes negative as a result of relative transfer of a significant
amount of water from bulk to the inhomogeneous interfacial phase. ∆n1 will increase and simultaneously
∆n2 may decrease when such relative transfer occurs above the cmc.
One also notes from figs. 2.1 and 2.2 (dashed portion of the curve) that 12Γ beyond mC2 varies
linearly with C2 for every system in a certain limited range of concentration of CTAB. From the slope and
intercept of the linear plot, the values of ∆n1 and ∆n2 have been calculated using equation (2.8). These
values of ∆n1 and ∆n2 (which are constant in this range of concentration) have been included in Table 2.1.
(45)
One finds from Table 2.1 that the ratio 2
1
nn
∆∆ is of the order 10 000. At this stage, water (moles)
bound per glucose residue is of the order of 100 whereas that of CTAB is 0.001. In the linear region of the
plot of 12Γ -C2, the average concentration of CTAB equal to 55.5
1
2
nn
∆∆ and its magnitude equal to azeoC2
is
higher than the bulk cmc of CTAB. The value of mC2is close to the cmc of CTAB. We thus notice that as C2
exceeds mC2, CTAB molecules present in the surface bound phase surrounding cellulose tend to form
micellar aggregrates at the interface even when C2> azeoC2. This observation may be of some importance for
interpretation of the mechanism of detergent action.
In Fig. 2.1, the isotherms for adsorption of CTAB by cellulose at different temperatures have been
compared with each other at pH 6.0 and ionic strength 0.15. One finds that with increase of temperature,
from 24 to 30°C values of m2Γ (as well as ∆n2) increase, whereas its value decreases, when temperature
increases from 30 to 37°C. From Table 2.1, one also notes that ∆n1 increases significantly and
monotonously with increase of temperature. Thus, the effect of interaction of water to cellulose is mixed up
with temperature dependent hydrophobic interaction of CTAB to cellulose so that the result of m2Γ as
function of temperature is not regular in nature.
Nonionic polysaccharide cellulose on binding CTAB becomes positively charged. The effect of
ionic strength on the values of m2Γ (vide Table 2.2) indicates that electrostatic effect for the CTAB-
cellulose binding process is insignificant. We also note (vide Table 2.2) that at pH 4.0, 6.0, and 8.0, values
of m2Γ are 0.0112, 0.0076, and 0.0093 mol of CTAB per kg of cellulose at 24 °C and at ionic strength 0.15.
One can relate this change all at high ionic strength to the change in hydration and alteration of
conformation of cellulose with pH. Moles of CTAB bound per mole of glucose remain in the range 0.001-
0.008 whereas in the absence of CTAB, 2-10 molecules of water34 can attach per glucose residue. It thus
appears that only a small fraction of glucose residues can be accessible for binding of CTAB.
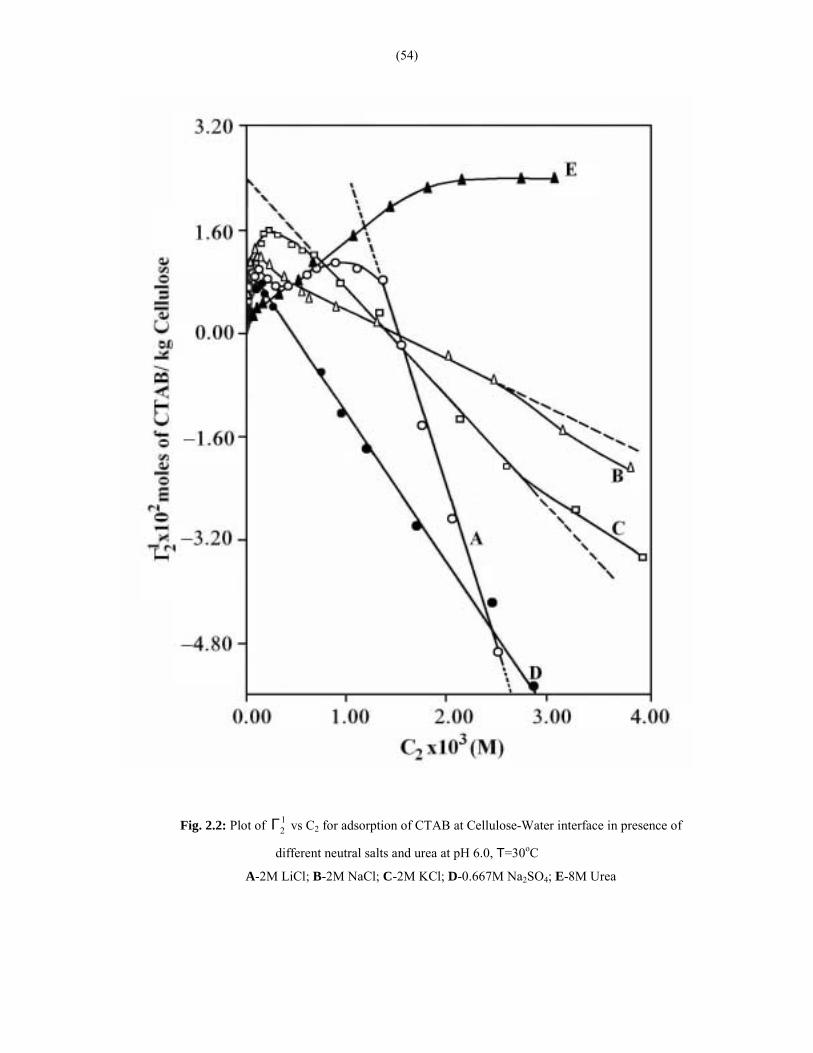
It has already been shown from isopiestic experiments34 that in the presence of excess salts (of
nearly 2.0 ionic strength) such as Na2SO4, KCl, NaCl, and LiCl, water molecules bound to glucose residue
are 21, 14, 16, and 12, respectively. One finds from Table 2.2 and also from Fig. 2.2 that m2Γ values in the
presence of these excess salts are relatively high and their values stand in the order
KCl > NaCl > LiCl > Na2SO4
It appears that m2Γ has a close relation with hydrated states of cellulose in the presence of excess
salts. Urea is known to behave as a water structure breaker,40 and hydrophobicity of cellulose surface is
enhanced in the presence of 6M urea, as a result of which m2Γ becomes 0.03 mol of CTAB per kg cellulose
(vide Table 2.2). With further increase of C2 from mC2 , m2Γ remains apparently constant and positive. It is
(46)
well known29 that in the presence of 6M urea, cmc of CTAB has increased to a large extent so that value of
C2 does not attain the value of azeoC2 in the range of concentration considered by us.
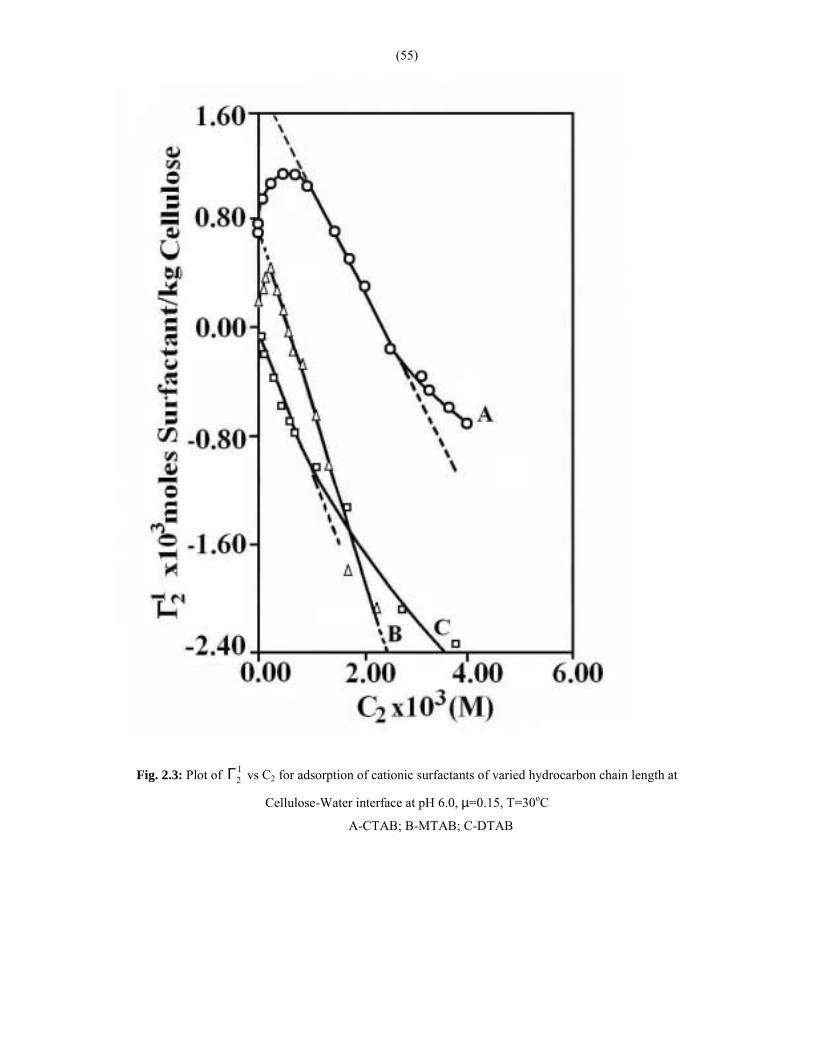
In Fig. 2.3, the isotherms for adsorption of CTAB, MTAB, and DTAB to cellulose have been
compared under identical physicochemical conditions. The most interesting observation is that 12Γ for
DTAB is always negative and there is no maximum in the 12Γ -C2 plot. Hydrocarbon chain length for this
surfactant is insufficient for excess positive adsorption of DTAB to the hydrophilic surface of cellulose.
When the −− 2CH group in the hydrocarbon chain is increased from 12 to 14 for MTAB, m2Γ becomes
positive but its magnitude is small. However, its value becomes maximum for CTAB bearing 16
−− 2CH groups. This is indicating involvement of hydrophobic interaction of CTAB with the
hydrophobic region existing predominantly in the hydrophilic surface of cellulose. We also observe with
interest that value of ∆n2 is almost zero for DTAB but its positive value increases as one passes from
MTAB to CTAB.
From this, one can again conclude that there exists some hydrophobic spot or small islands in the
cellulose fiber surrounded by large areas covered by bound water. CTAB and MTAB possessing long
hydrophobic groups may occupy fractions of these hydrophobic spots by overcoming the effect due to the
water binding to cellulose. In the case of DTAB, the binding does not occur in excess since surrounding
water at the interface is sufficient to resist such binding interaction by hydrophobic effects.
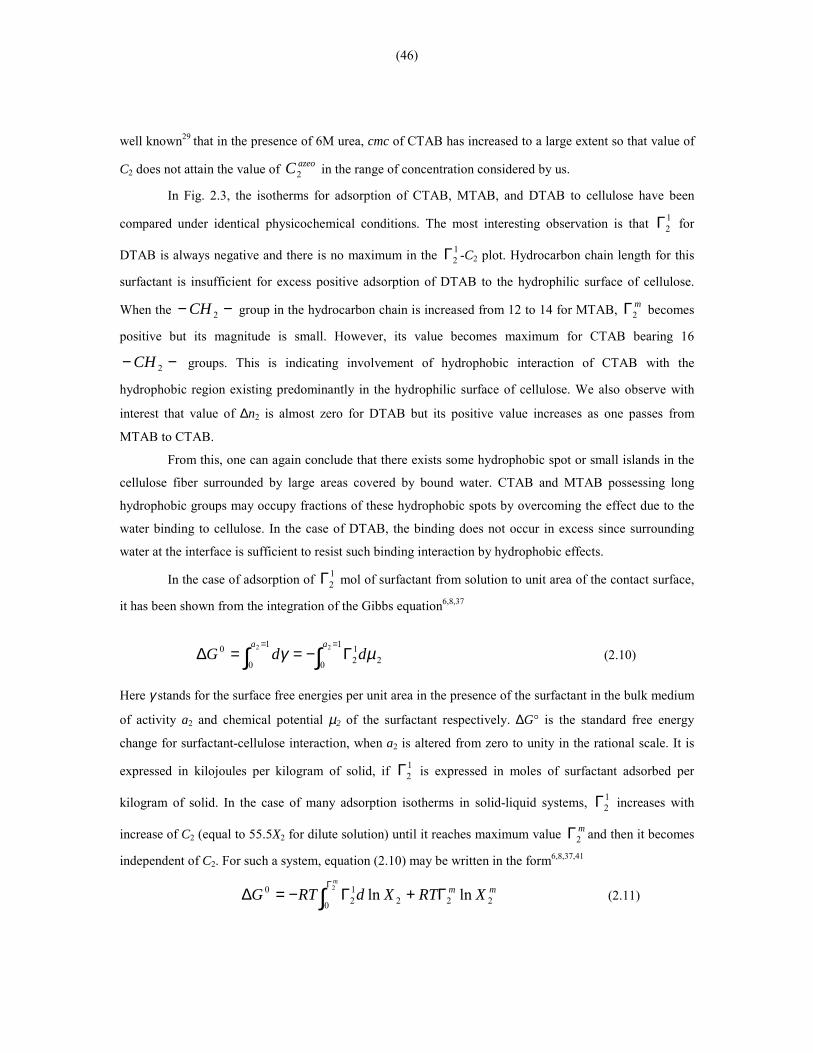
In the case of adsorption of 12Γ mol of surfactant from solution to unit area of the contact surface,
it has been shown from the integration of the Gibbs equation6,8,37
2
1
0
12
1
0
0 22 µγ ddGaa
∫∫==
Γ−==∆ (2.10)
Here γ stands for the surface free energies per unit area in the presence of the surfactant in the bulk medium
of activity a2 and chemical potential µ2 of the surfactant respectively. ∆G° is the standard free energy
change for surfactant-cellulose interaction, when a2 is altered from zero to unity in the rational scale. It is
expressed in kilojoules per kilogram of solid, if 12Γ is expressed in moles of surfactant adsorbed per
kilogram of solid. In the case of many adsorption isotherms in solid-liquid systems, 12Γ increases with
increase of C2 (equal to 55.5X2 for dilute solution) until it reaches maximum value m2Γ and then it becomes
independent of C2. For such a system, equation (2.10) may be written in the form6,8,37,41
∫Γ
Γ+Γ−=∆m
mm XRTXdRTG 2
0 22212
0 lnln (2.11)
(47)
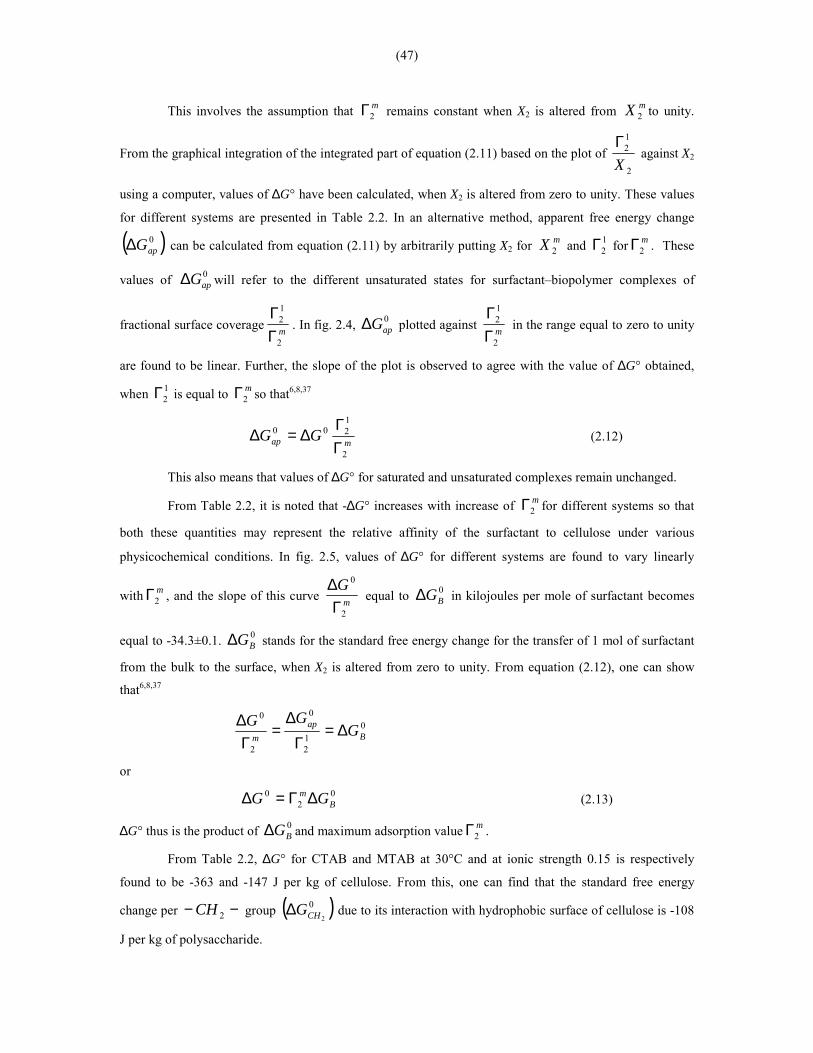
This involves the assumption that m2Γ remains constant when X2 is altered from mX 2 to unity.
From the graphical integration of the integrated part of equation (2.11) based on the plot of 2
12
XΓ
against X2
using a computer, values of ∆G° have been calculated, when X2 is altered from zero to unity. These values
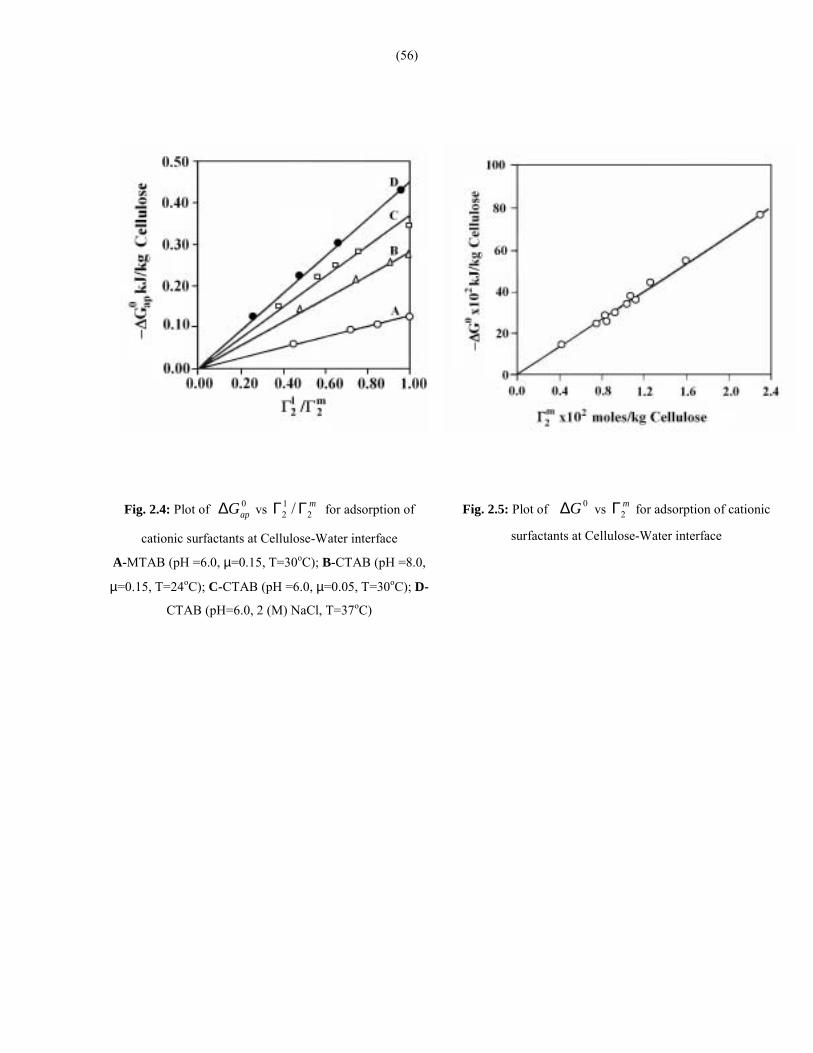
for different systems are presented in Table 2.2. In an alternative method, apparent free energy change
( )0apG∆ can be calculated from equation (2.11) by arbitrarily putting X2 for mX 2 and 1
2Γ for m2Γ . These
values of 0apG∆ will refer to the different unsaturated states for surfactant�biopolymer complexes of
fractional surface coverage m2
12
ΓΓ
. In fig. 2.4, 0apG∆ plotted against m
2
12
ΓΓ
in the range equal to zero to unity
are found to be linear. Further, the slope of the plot is observed to agree with the value of ∆G° obtained,
when 12Γ is equal to m
2Γ so that6,8,37
map GG2
1200
ΓΓ
∆=∆ (2.12)
This also means that values of ∆G° for saturated and unsaturated complexes remain unchanged.
From Table 2.2, it is noted that -∆G° increases with increase of m2Γ for different systems so that
both these quantities may represent the relative affinity of the surfactant to cellulose under various
physicochemical conditions. In fig. 2.5, values of ∆G° for different systems are found to vary linearly
with m2Γ , and the slope of this curve m
G
2
0
Γ∆
equal to 0BG∆ in kilojoules per mole of surfactant becomes
equal to -34.3±0.1. 0BG∆ stands for the standard free energy change for the transfer of 1 mol of surfactant
from the bulk to the surface, when X2 is altered from zero to unity. From equation (2.12), one can show
that6,8,37
012
0
2
0
Bap
m GGG ∆=Γ
∆=
Γ∆
or
02
0B
m GG ∆Γ=∆ (2.13)
∆G° thus is the product of 0BG∆ and maximum adsorption value m
2Γ .
From Table 2.2, ∆G° for CTAB and MTAB at 30°C and at ionic strength 0.15 is respectively
found to be -363 and -147 J per kg of cellulose. From this, one can find that the standard free energy
change per −− 2CH group ( )02CHG∆ due to its interaction with hydrophobic surface of cellulose is -108
J per kg of polysaccharide.
(48)
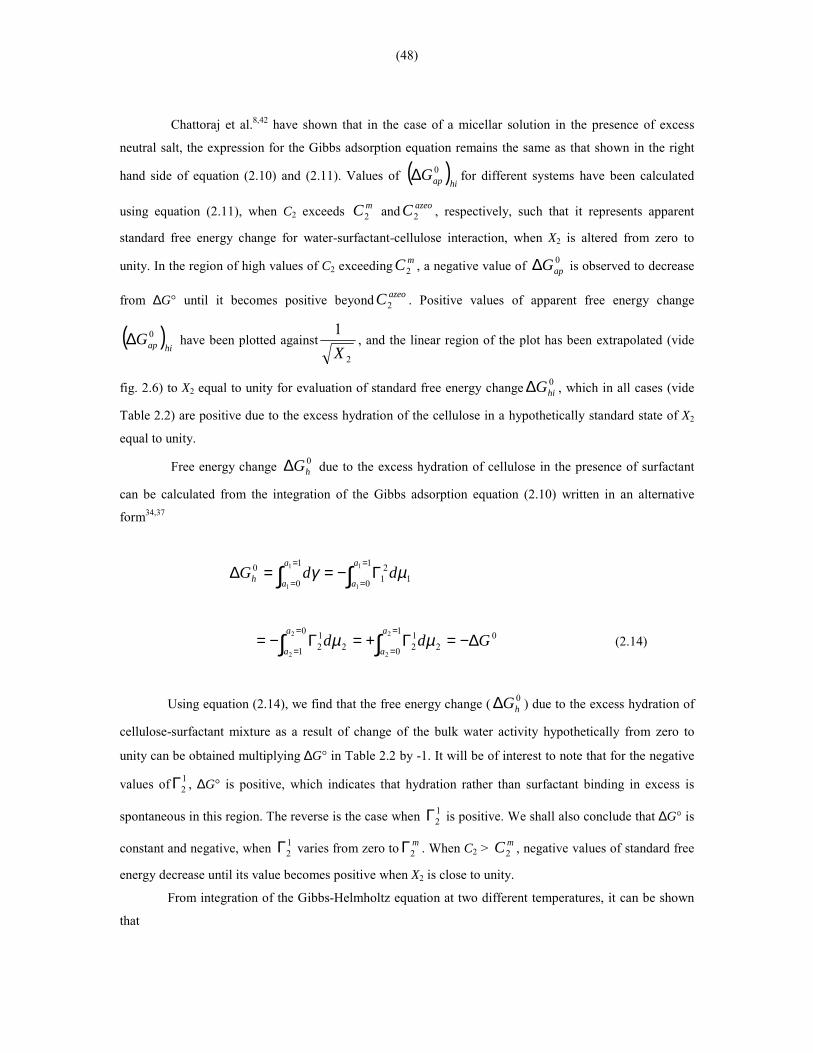
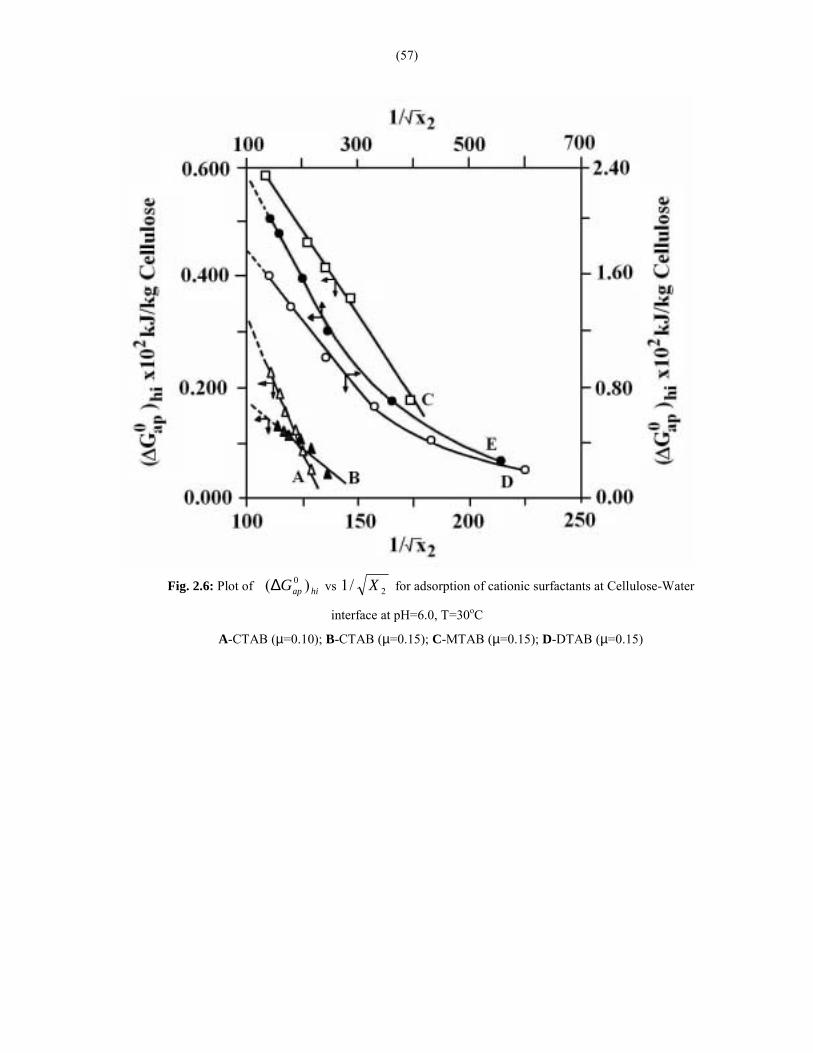
Chattoraj et al.8,42 have shown that in the case of a micellar solution in the presence of excess
neutral salt, the expression for the Gibbs adsorption equation remains the same as that shown in the right
hand side of equation (2.10) and (2.11). Values of ( )hiapG 0∆ for different systems have been calculated
using equation (2.11), when C2 exceeds mC2 and azeoC2 , respectively, such that it represents apparent
standard free energy change for water-surfactant-cellulose interaction, when X2 is altered from zero to
unity. In the region of high values of C2 exceeding mC2 , a negative value of 0apG∆ is observed to decrease
from ∆G° until it becomes positive beyond azeoC2 . Positive values of apparent free energy change
( )hiapG 0∆ have been plotted against
2
1X
, and the linear region of the plot has been extrapolated (vide
fig. 2.6) to X2 equal to unity for evaluation of standard free energy change 0hiG∆ , which in all cases (vide
Table 2.2) are positive due to the excess hydration of the cellulose in a hypothetically standard state of X2
equal to unity.
Free energy change 0hG∆ due to the excess hydration of cellulose in the presence of surfactant
can be calculated from the integration of the Gibbs adsorption equation (2.10) written in an alternative
form34,37
1
1
0
21
1
0
0 1
1
1
1
µγ ddGa
a
a
ah ∫∫=
=
=
=Γ−==∆
02
1
0
122
0
1
12
2
2
2
2
Gdda
a
a
a∆−=Γ+=Γ−= ∫∫
=
=
=
=µµ (2.14)
Using equation (2.14), we find that the free energy change ( 0hG∆ ) due to the excess hydration of
cellulose-surfactant mixture as a result of change of the bulk water activity hypothetically from zero to
unity can be obtained multiplying ∆G° in Table 2.2 by -1. It will be of interest to note that for the negative
values of 12Γ , ∆G° is positive, which indicates that hydration rather than surfactant binding in excess is
spontaneous in this region. The reverse is the case when 12Γ is positive. We shall also conclude that ∆G° is
constant and negative, when 12Γ varies from zero to m
2Γ . When C2 > mC2 , negative values of standard free
energy decrease until its value becomes positive when X2 is close to unity.
From integration of the Gibbs-Helmholtz equation at two different temperatures, it can be shown
that
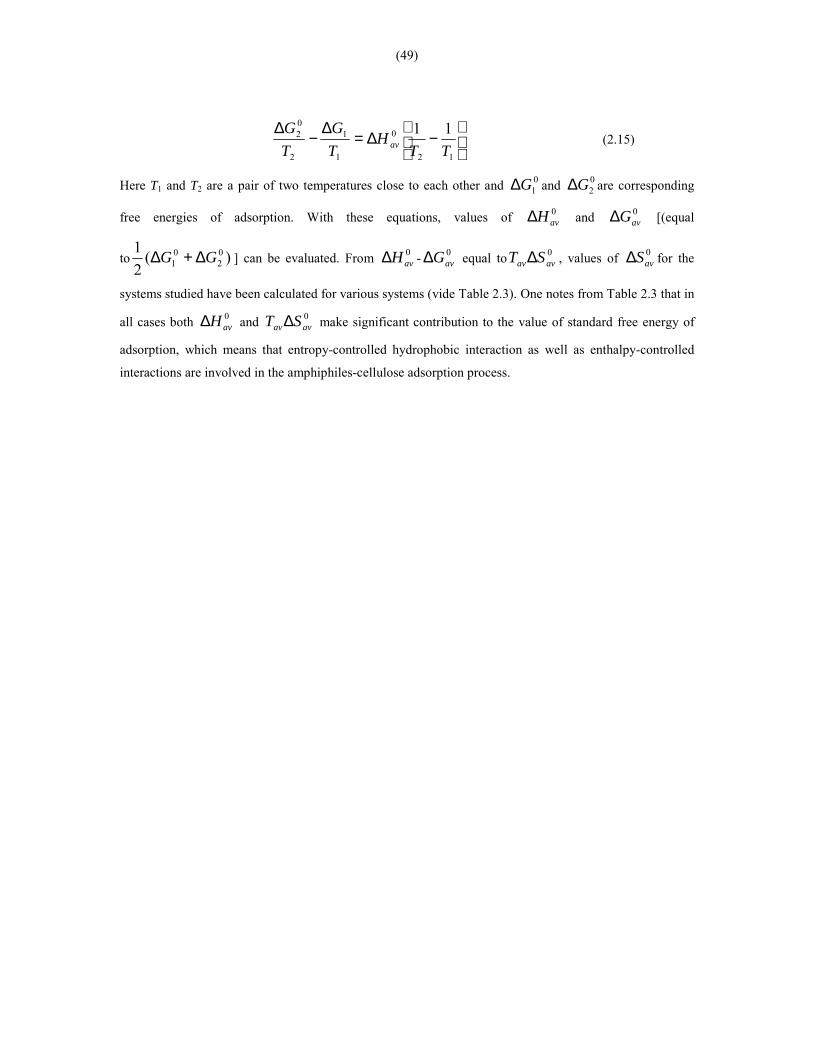
(49)
−∆=
∆−
∆
12
0
1
1
2
02 11
TTH
TG
TG
av (2.15)
Here T1 and T2 are a pair of two temperatures close to each other and 01G∆ and 0
2G∆ are corresponding
free energies of adsorption. With these equations, values of 0avH∆ and 0
avG∆ [(equal
to )(21 0
201 GG ∆+∆ ] can be evaluated. From 0
avH∆ - 0avG∆ equal to 0
avav ST ∆ , values of 0avS∆ for the
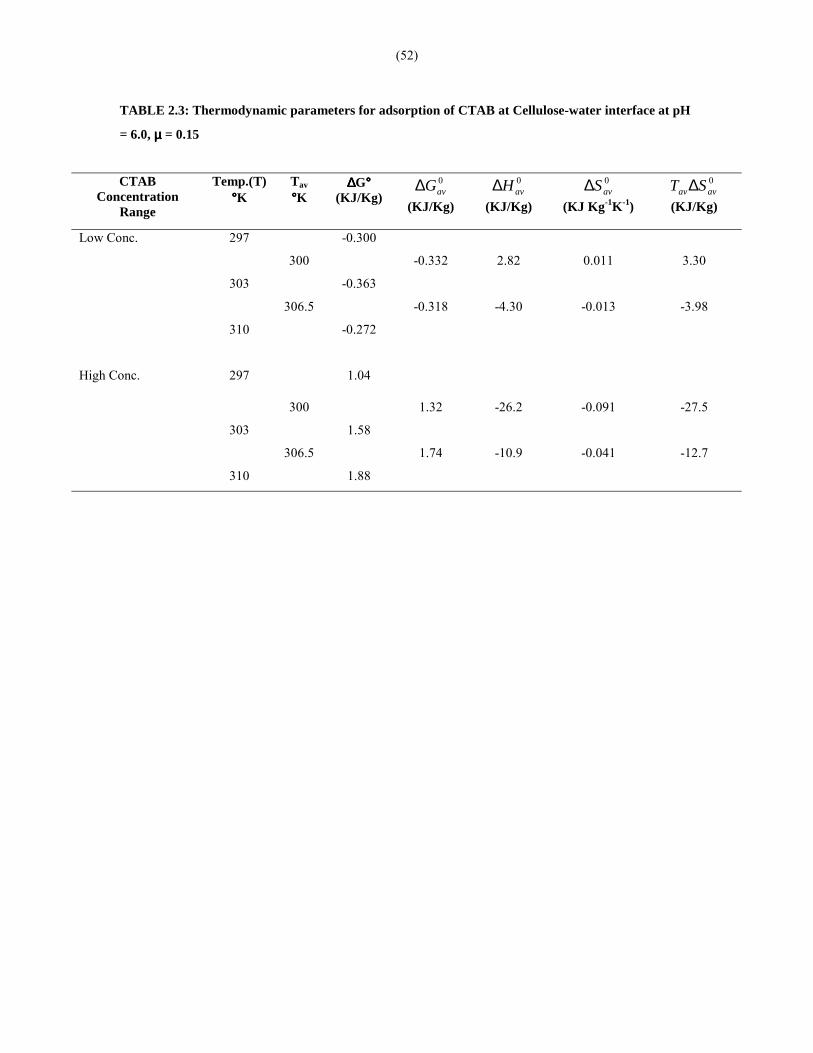
systems studied have been calculated for various systems (vide Table 2.3). One notes from Table 2.3 that in
all cases both 0avH∆ and 0
avav ST ∆ make significant contribution to the value of standard free energy of
adsorption, which means that entropy-controlled hydrophobic interaction as well as enthalpy-controlled
interactions are involved in the amphiphiles-cellulose adsorption process.
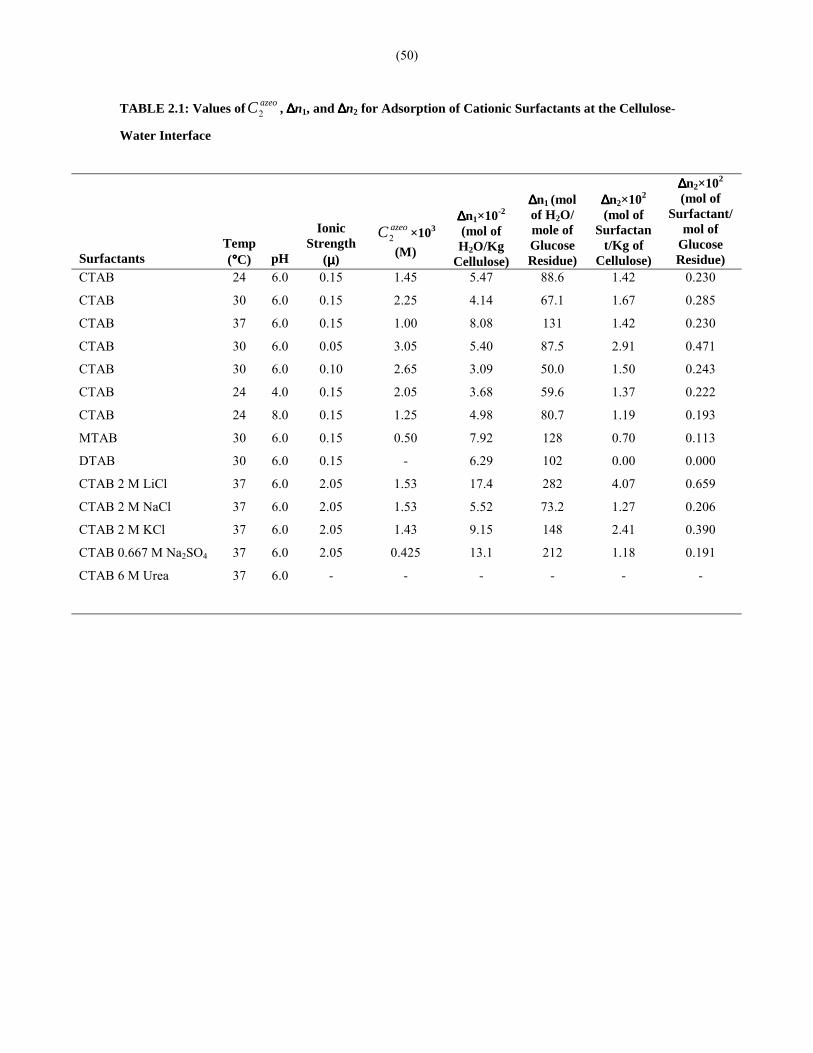
(50)
TABLE 2.1: Values of azeoC2 , ∆∆∆∆n1, and ∆∆∆∆n2 for Adsorption of Cationic Surfactants at the Cellulose-
Water Interface
SurfactantsTemp(°°°°C) pH
IonicStrength
(µµµµ)
azeoC2 ×103
(M)
∆∆∆∆n1×10-2
(mol ofH2O/Kg
Cellulose)
∆∆∆∆n1 (molof H2O/mole ofGlucoseResidue)
∆∆∆∆n2×102
(mol ofSurfactan
t/Kg ofCellulose)
∆∆∆∆n2×102
(mol ofSurfactant/
mol ofGlucoseResidue)
CTAB 24 6.0 0.15 1.45 5.47 88.6 1.42 0.230
CTAB 30 6.0 0.15 2.25 4.14 67.1 1.67 0.285
CTAB 37 6.0 0.15 1.00 8.08 131 1.42 0.230
CTAB 30 6.0 0.05 3.05 5.40 87.5 2.91 0.471
CTAB 30 6.0 0.10 2.65 3.09 50.0 1.50 0.243
CTAB 24 4.0 0.15 2.05 3.68 59.6 1.37 0.222
CTAB 24 8.0 0.15 1.25 4.98 80.7 1.19 0.193
MTAB 30 6.0 0.15 0.50 7.92 128 0.70 0.113
DTAB 30 6.0 0.15 - 6.29 102 0.00 0.000
CTAB 2 M LiCl 37 6.0 2.05 1.53 17.4 282 4.07 0.659
CTAB 2 M NaCl 37 6.0 2.05 1.53 5.52 73.2 1.27 0.206
CTAB 2 M KCl 37 6.0 2.05 1.43 9.15 148 2.41 0.390
CTAB 0.667 M Na2SO4 37 6.0 2.05 0.425 13.1 212 1.18 0.191
CTAB 6 M Urea 37 6.0 - - - - - -
(51)
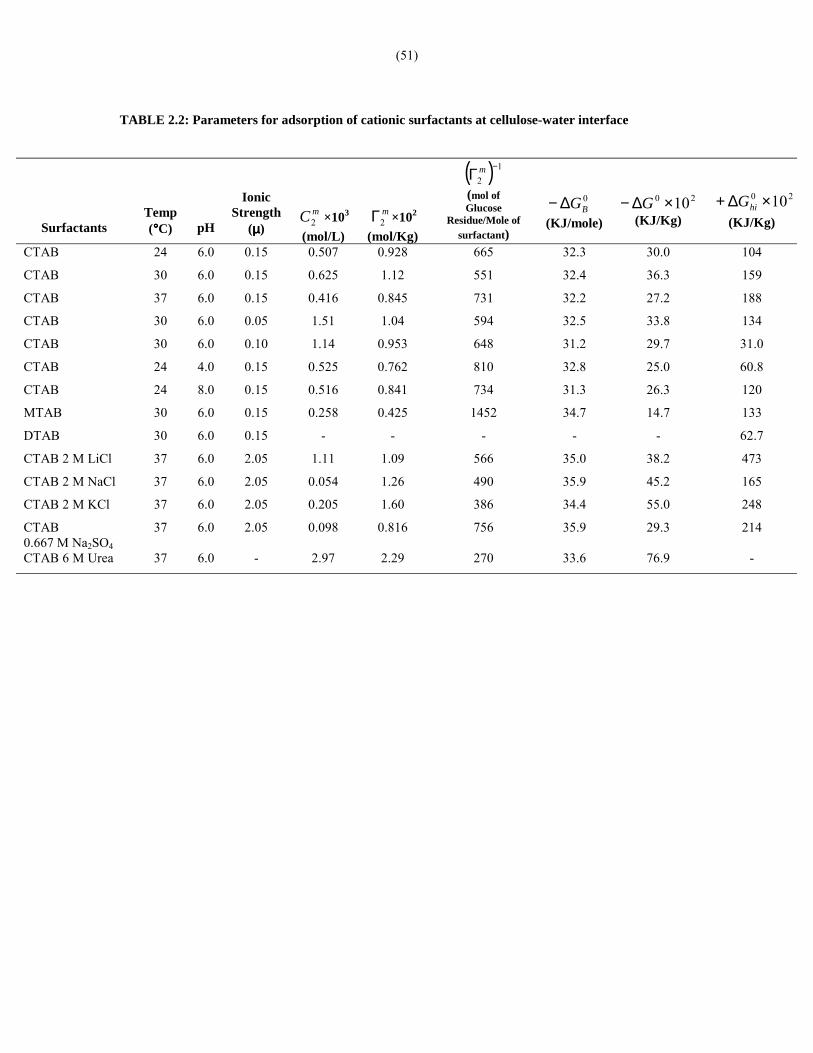
TABLE 2.2: Parameters for adsorption of cationic surfactants at cellulose-water interface
SurfactantsTemp(°°°°C) pH
IonicStrength
(µµµµ)mC2
×103
(mol/L)
m2Γ ×102
(mol/Kg)
( ) 12
−Γ m
(mol ofGlucose
Residue/Mole ofsurfactant)
0BG∆−
(KJ/mole)
20 10×∆− G(KJ/Kg)
20 10×∆+ hiG(KJ/Kg)
CTAB 24 6.0 0.15 0.507 0.928 665 32.3 30.0 104
CTAB 30 6.0 0.15 0.625 1.12 551 32.4 36.3 159
CTAB 37 6.0 0.15 0.416 0.845 731 32.2 27.2 188
CTAB 30 6.0 0.05 1.51 1.04 594 32.5 33.8 134
CTAB 30 6.0 0.10 1.14 0.953 648 31.2 29.7 31.0
CTAB 24 4.0 0.15 0.525 0.762 810 32.8 25.0 60.8
CTAB 24 8.0 0.15 0.516 0.841 734 31.3 26.3 120
MTAB 30 6.0 0.15 0.258 0.425 1452 34.7 14.7 133
DTAB 30 6.0 0.15 - - - - - 62.7
CTAB 2 M LiCl 37 6.0 2.05 1.11 1.09 566 35.0 38.2 473
CTAB 2 M NaCl 37 6.0 2.05 0.054 1.26 490 35.9 45.2 165
CTAB 2 M KCl 37 6.0 2.05 0.205 1.60 386 34.4 55.0 248
CTAB0.667 M Na2SO4
37 6.0 2.05 0.098 0.816 756 35.9 29.3 214
CTAB 6 M Urea 37 6.0 - 2.97 2.29 270 33.6 76.9 -
(52)
TABLE 2.3: Thermodynamic parameters for adsorption of CTAB at Cellulose-water interface at pH
= 6.0, µµµµ = 0.15
CTABConcentration
Range
Temp.(T)°°°°K
Tav
°°°°K∆∆∆∆G°°°°
(KJ/Kg)0avG∆
(KJ/Kg)
0avH∆
(KJ/Kg)
0avS∆
(KJ Kg-1K-1)
0avav ST ∆
(KJ/Kg)
Low Conc. 297 -0.300
300 -0.332 2.82 0.011 3.30
303 -0.363
306.5 -0.318 -4.30 -0.013 -3.98
310 -0.272
High Conc. 297 1.04
300 1.32 -26.2 -0.091 -27.5
303 1.58
306.5 1.74 -10.9 -0.041 -12.7
310 1.88
(53)
Fig. 2.1: Plot of 12Γ vs C2 for adsorption of CTAB at Cellulose-Water interface at pH 6.0, µ=0.15
A-24oC, B-30oC and C-37oC
(54)
Fig. 2.2: Plot of 12Γ vs C2 for adsorption of CTAB at Cellulose-Water interface in presence of
different neutral salts and urea at pH 6.0, Τ=30oC
A-2M LiCl; B-2M NaCl; C-2M KCl; D-0.667M Na2SO4; E-8M Urea
(55)
Fig. 2.3: Plot of 12Γ vs C2 for adsorption of cationic surfactants of varied hydrocarbon chain length at
Cellulose-Water interface at pH 6.0, µ=0.15, T=30oC
A-CTAB; B-MTAB; C-DTAB
(56)
Fig. 2.4: Plot of 0apG∆ vs m
212 / ΓΓ for adsorption of
cationic surfactants at Cellulose-Water interface
A-MTAB (pH =6.0, µ=0.15, T=30oC); B-CTAB (pH =8.0,
µ=0.15, T=24oC); C-CTAB (pH =6.0, µ=0.05, T=30oC); D-
CTAB (pH=6.0, 2 (M) NaCl, T=37oC)
Fig. 2.5: Plot of 0G∆ vs m2Γ for adsorption of cationic
surfactants at Cellulose-Water interface
(57)
Fig. 2.6: Plot of hiapG )( 0∆ vs 2/1 X for adsorption of cationic surfactants at Cellulose-Water
interface at pH=6.0, T=30oC
A-CTAB (µ=0.10); B-CTAB (µ=0.15); C-MTAB (µ=0.15); D-DTAB (µ=0.15)
(58)
References
1. Robb, I. D. Polymer Surfactant Interaction. In Anionic Surfactants-Physical Dekker: Chemistry of Surfactant
Action; Reynders, E. L., Ed.; Surfactant Science Series; Marcel New York, 1981; Vol. 11, Chapter 3.
2. Hayakwa, K.; Kwak, J. C. T. J. Phys. Chem. 1982, 86, 3866.
3. Kresheck, G. C.; Hargraves, W. A. J. Colloid Interface Sci. 1981, 83, 1.
4. Almgren, M.; Hansson, P.; Mukhtar, E.; Stam, J. V. Langmuir 1992, 8, 2405.
5. Goddard, E. D., Anathapadmanabhan, K. P., Eds. Interactions of Surfactants with polymer and proteins;
CRC Press: Boca Raton, FL, 1993.
6. Das, M.; Chattoraj, D. K. Colloids Surf. 1991, 61, 1.
7. Sadhukhan, B. K.; Chattoraj, D. K. In Surfactants in Solutions; Mittal, K. L., Lindman, B., Eds.; Plenum
Press: New York, 1984; Vol. 3, p 1249.
8. Chattoraj, D. K.; Birdi, K. S. Adsorption at interfaces and Gibbs Surface Excess; Plenum Press: New York,
1984.
9. Chatterjee, R.; Chattoraj, D. K. Biopolymers 1979, 18, 147.
10. Cutter, W. G.; Kissa, E. Detergency Theory and Technology; Marcel Dekker: New York, 1987.
11. Schwartz, A. M. In Surface and Colloid Science; Matieuer, Ed.; Wiley: New York, 1972; Vol. 5, p 195.
12. Lim, J.; Miller, C. A. In Surfactants in Solutions; Mittal, K. L., Shah, D. O., Eds.; Plenum Press: New
York and London, 1991; Vol. 12, p 491.
13. Jones, M. N. J. Colloid Interface Sci. 1967, 23, 36.
14. Shirahama, K. J. Colloid Polym. Sci. 1974, 252, 978.
15. Hayakawa, K.; Kwak, J. C. T. J. Phys. Chem. 1983, 87, 506.
16. Obhu, K.; Hiraishi, O.; Kashiwa, J. J. Am. Oil Chem. Soc. 1982, 59, 108.
17. Goddard, E. D. Colloids Surfs. 1986, 19, 255.
18. Goddard, E. D. In Surfactants in Solution; Mittal, K. L., Shah, D. O., Eds.; Plenum Press: New York and
London; 1990; Vol. 11.
19. Thuresso, K.; Nystrom, B.; Wang, G.; Lindman, B. Langmuir 1995, 11, 3730.
20. Nystrom, B.; Lindman, B. Macromolecules 1995, 28, 967.
21. Zhang, K.; Jonstromen, M.; Lindman, B. J. Phys. Chem. 1994, 98, 2459.
22. Piculell, L.; Lindman, B. Adv. Colloid Interface Sci. 1992, 41, 149.
23. Bloor, D. M.; Mwakibete, H. K. O.; Wyn-Jones, E. J. Colloid Interface Sci. 1996, 178, 334.
24. Martin, K; Helsten; E.; Klingborg, A. W. J. Am. Oil Chem. Soc.1989, 166, 1381.
25. Jukiewicz, K.; Janust, W.; Spraycha, R.; Stczypa, J. In Surfactants in Solution; Mittal, K. L., Ed.; Plenum
Press: New York and London, 1989; Vol. 9, p 371.
26. Sobisch, C. Tenside, Surfactants, Deterg. 1992, 29 (3), 199.
27. Arshid, F. M.; Giles, C. H.; Melure, E. C.; Ogilicic, A.; Rose, T. J. J. Chem. Soc. 1953, 67.
(59)
28. Arshid, F. M.; Giles, C. H.; Jain, S. K. J. Chem. Soc. 1956, 859.
29. Samanta, A.; Chattoraj, D. K. In Properties of Surfactants in Solution; Mittal, K. L., Bothorel, J., Eds.;
Plenum Press: New York, 1986.
30. Mukherjee, P. Anal. Chem. 1956, 28, 870.
31. Biswas, H. K.; Mondal, B. M. Anal. Chem. 1972, 44, 1636.
32. Lehninger, A. L. Principles of Biochemistry, 2nd ed.; CBS: Delhi, 1987; p 277.
33. Dey, P. M.; Brinson, K. In Advances in Carbohydrate Chemistry and Biochemistry; Tipson, R. S.; Horton,
D., Eds.; Academic Press, Inc.: New York, London, 1984; Vol. 42, p 294.
34. Banerjee, P.; Chattoraj, D. K. J. Indian Chem. Soc. 1993, 70, 1.
35. Schay, G. Surface and Colloid Science; Matiyeoic, E., Ed.; Wiley Interscience: New York, 1969; Vol. 2, p
155.
36. Nag A.; Sadhukhan, B.; Chattoraj, D. K.Colloids Surf. 1987, 116, 168.
37. Chattoraj, D. K. Indian J. Chem. 1981, 20A, 941.
38. Defay, R.; Priggogine, I.; Bellemans, A. Surface Tension and Adsorption (Translated by Everett, D. H.);
Longmans: London, 1966.
39. Ghosh, L. N.; Das, K. P.; Chattoraj, D. K. J. Colloid Interface Sci. 1988, 121, 278.
40. Franks, F. In Water A Comprehensive Treatise; Franks, F., Ed.; Plenum Press: New York and London,
1975; Vol. 4, Chapter 1, p 1.
41. Chattoraj, D. K.; Mahapatra, P. K.; Roy, A. M. Biophys. Chem. 1996, 63, 37.
42. Chattoraj, D. K. J. Phys. Chem. 1967, 71, 455.

(60)