soil carbon research program: project 12
TRANSCRIPT

SOIL CARBON RESEARCH PROGRAM: PROJECT 10 SOUTH AUSTRALIAN DRYLAND CROPPING
A collaborative project supported by the Climate Change Research Program of the Australian Department of Agriculture, Fisheries and Forestry and the Grains Research and Development Corporation involving staff and contributions from CSIRO, University of Western Australia, Department of Agriculture and Food of Western Australia, Victorian Department of Primary Industries, Murray Catchment Management Authority, Department of Environment and Natural Resources of South Australia, Queensland Government, University of New England, New South Wales Department of Primary Industries, The University of Tasmania, and The Tasmanian Institute of Agricultural Research.

SECTION C – FINAL RESEARCH REPORT
Project Title: South Australian dry-land cropping
Lead organisation and partner organisations: CSIRO Land & Water / Sustainable Agricultural Flagship
Department of Environment & Natural Resources
Project team: L Macdonald, T Herrmann, J Baldock.
Primary contact and contact details: Lynne M Macdonald Tim Herrmann
CSIRO Land & Water DENR,
Waite campus, Waite campus, Urrbrae, SA 5064 Urrbrae, SA 5064
08 82738111 08 83039638
[email protected] [email protected]
1

Table of Contents
EXECUTIVE SUMMARY ................................................................................................................................ 3 Acronyms ........................................................................................................................................................... 5 List of Figures ..................................................................................................................................................... 6 List of Tables ...................................................................................................................................................... 7 1.BACKGROUND: ............................................................................................................................................ 8 2. METHODOLOGY ......................................................................................................................................... 9 3. RESULTS OF THE PROJECT .................................................................................................................... 13 4. DISCUSSION ON RESULTS OF THE PROJECT ..................................................................................... 23 5. LIST OF FINDINGS OF THE PROJECT.................................................................................................... 26 6. FUTURE RESEARCH NEEDS ................................................................................................................... 27 7. PUBLICATIONS ......................................................................................................................................... 28 8. ACKNOWLEDGEMENTS .......................................................................................................................... 30 9. REFERENCES ............................................................................................................................................. 31 10. PLAIN ENGLISH SUMMARY ................................................................................................................. 32 Appendix 1: Variability in climatic variables in the Mid-North and Eyre Peninsula red-brown earth soil ...... 34 Appendix 2: Variability in topographic variables in the Mid-North and Eyre Peninsula red-brown earth soil 35 Appendix 3: Variability in management parameters within broadscale management systems in red-brown earths of South Australia .................................................................................................................................. 36
2

EXECUTIVE SUMMARY
Red-brown earth soils are key to the South Australian grains industry and cover a significant proportion of the
agricultural area (1637, 500 ha). These soils are particularly important to production in the Northern Yorke and
the Eastern and Lower Eyre Peninsula. Historically red-brown earths have suffered from erosion due to heavy-
handed management in the early years following clearance, but modern practices better consider manage surface
cover to reduce erosion risk. Due to the inherent soil fertility and high productive potential across a wide range
of crops, these soils are considered to have good potential to accumulate soil carbon. This research aimed to
identify land management practices with the potential to change soil carbon content in red-brown earth soils of
the Mid-North and Eyre Peninsula of South Australia.
A stratified random approach was used to ensure that landscape and management variability in the target soils of
the Mid-North and Eyre Peninsula were captured. The South Australian Land and Soil Information Framework,
(Department of Environment and Natural Resources, Government of South Australia), was used to map the red-
brown earths in both areas and to define the target regions. The large spatial coverage and random selection
provide data that can be considered a baseline survey of soil organic carbon stocks and fractions in red-brown
earth soils of the Mid-North and Eyre Peninsula. The wide coverage ensures relevance to the farming
community across the target regions.
More than 900 soil samples were collected over two field campaigns (2010; 2011) across the target areas of the
Mid-North and Eyre of South Australia. Samples were taken from 200 paddocks at 3 depths (0-10 cm; 10-20
cm; 20-30cm) and analysed for total organic, inorganic carbon, and mid-infra-red predictions used to estimate
particulate, humic, and resistant organic carbon fractions. Additional data was collected including climate data
(rainfall, temperature), topographic data (elevation, slope, aspect etc), and 5-10 years of management data (crop
type, tillage, stubble management, fertiliser additions, pasture rotation etc). In combination with the random
approach to sampling, the management data collected provides valuable information on current management
practices and how they have changed over the last 5 to 10 years.
Soil organic carbon stocks in the top 30 cm varied between 16 and 67 tonnes of carbon per hectare (Mg/ha),
with regional averages of 38 Mg/ha and 31 Mg/ha within the Mid-North and Eyre Peninsula respectively. As a
rule of thumb, 50% of the 30 cm SOC stock was accounted for in the top 10 cm and 75-80% in the top 20cm. In
general terms, there was a 2 Mg/ha increase in SOC stocks for every 50 mm increase in rainfall across the 300-
600mm rainfall zone, but variability was high. Based on mid-infra red prediction of soil organic matter
fractions, humic organic carbon accounted for approximately 50% of soil carbon stock, resistant organic carbon
for 25-30%, and particulate organic carbon for 20-25%. Results therefore indicated that the majority of carbon
(75-80%) in the sampled red-brown earth soils was contained within the more stable carbon pools and the
minority (20-25%) contained within the labile particulate fraction. Variability in SOC stocks in red-brown earths
was high and could be correlated with vapour pressure deficit above any other of the evaluated climatic,
topographic and management variables.
This research provides a current baseline of soil organic carbon stocks across red-brown earth soils of the Mid-
North and Eyre Peninsula. The dataset is spatially robust and ideal for parameterisation of regional modelling
scenarios relating to management and/or climate change. The collected management data represents a snap-shot
3

of current management practices on red-brown earths in the target region and how they have changed over the
last 10 years. Results indicated that no consistent effect of management could be measured above landscape
variability. Correlation with vapour pressure deficit above any other climatic, topographic or management
variables, might suggest that the best approach to increase SOC stocks is to maximise plant productivity through
addressing site specific limitations on plant growth.
4

Acronyms
C carbon
EM equivalent mass
GPS global positioining system
HOC humic organic carbon
MD mahalanobis distance
Mg/ha metric tonnes per hectare
MIR mid-infra red spectroscopy
N nitrogen
n number
NMR nuclear magnetic resonance
POC particulate organic carbon
RBE red-brown earth soils
ROC resistant organic carbon
SALSIF South Australian Land and Soil Information Framework
se standard error
TC total carbon
TIC total inorganic carbon
TOC total organic carbon
VPD vapour pressure deficit
5

List of Figures
Figure 1. Stratified random approach to site selection demonstrated on red-brown earth soils of the Eyre Peninsula with isohyets marked to guide weighing towards higher rainfall zones. Blue dots indicate potential sampling points at 5 km grid intersects. Red dots indicate actual sample points as selected from randomly generated list.
Figure 2. Examples of photographic archive of sample sites in South Australia. A deep exploratory core was sampled and characterised to confirm that the site was a red-brown earth soil type.
Figure 3: Frequency distributions of the top 30 cm soil organic carbon (SOC) stocks (t/ha) in red-brown earth soils of the Mid-North (n=131) and the Eyre Peninsula (n=69).
Figure 4. The soil organic stocks (Mg/ha) in the 0-10 cm, 10-20 cm and 20-30 cm depth layers of red-brown earth soils sampled from the Mid-North (orange, where n=133) and Eyre Peninsula (blue, where n=67) agricultural regions of South Australia. Error bars indicate standard deviation at each depth, and pie charts indicate the percentage of the 30 cm stock accounted for in each 10 cm depth incriment.
Figure 5. demonstrating a weak trend for increasing SOC stocks in the top 30 cm (a) and the contribution from 0-10 cm (b), 10-20 cm (c) and 20-30 cm (d) depths for red-brown earths sampled across South Australia.
Figure 6. the number of sites sampled per broad-scale agricultural system on red-brown earth soils within the Mid-North and Eyre Peninsula agricultural regions of South Australia, where: cropped sites were defined as having no pasture rotation in the last 5 years, and included cereal, legume, oilseed and hay rotations; crop-pasture systems include a rotations of 1-4 years of crop and 1-4 years of pasture; pasture systems represent 5 years of pasture with no crop rotation.
Figure 7. Soil organic carbon stocks (Mg/ha) in red-brown earth soils of the Mid-North and Eyre Peninsula under cropped systems (yellow), crop-pasture (green), and pasture systems (blue). The bar chart indicates averages, with standard errors.
Figure 8: correlation between measured and predicted total organic carbon content (TOC) and measured and predicted total inorganic carbon (TIC) in South Australian red-brown earth soils (n=964).
Figure 9: correlations between measured and predicted values for particulate organic carbon, humic organic carbon and resistant organic carbon. Data represent the calibration dataset for red-brown earth soils of South Australia, where n= 21.
Figure 10: the relationship between inorganic carbon content and the Mahalanobis Distance (MD) ratio, where the red line indicates a threshold level (MD ratio = 1) set at 95% confidence, below which predictions are considered robust, above which predictions have greater uncertainty due to poorer representation of sample type within the calibration dataset.
Figure 11: the contribution of component fractions to the soil organic carbon stocks (0-30 cm) in the Mid-North (n=126) and Eyre Penisula (n=63), where particulate organic carbon (POC), humic organic carbon (HOC) and resistant organic carbon (ROC) have been predicted through mid-infra red spectroscopy.
Figure 12: The soil organic carbon stocks (Mg/ha) in fractions at 0-10 cm, 10-20 cm and 20-30 cm depth layers of red-brown earth soils sampled from the Mid-North (orange, where n=133) and Eyre Peninsula (blue, where n=67). Data are based on mid-infra red predicted values for pasticulate organic carbon (POC), humic organic carbon (HOC), and resistant organic carbon (ROC) normalised by the measured total organic carbon stock for each depth layer. Error bars indicate standard deviation at each depth.
6

List of Tables
Table 1. Bulk density (g/cm3), gravel (%) and carbonate content (mg/g) of red brown earths soils of the Mid-North (n=133) and Eyre Peninsula (n=67) agricultural regions of South Australia. Data are provided for the 0-10 cm, 10-20 cm, and 20-30 cm depths, and indicate the average (x), with range (minimum-maximum).
Table 2: Climatic characteristics associated with the Mid-North and Eyre Peninsula sample populations. Based on a 5 year average, data indicate the mean (average) and the range (min-max) of summer and winter temperature, rainfall and vapour pressure deficit data extracted from SILO database based on the GPS coordinates of sample sites.
Table 3: Topographic characteristics associated with the Mid-North and Eyre Peninsula sample populations. Data indicate the mean (average) and the range (min-max) of summer and winter temperature, rainfall and vapour pressure deficit data extracted from SILO database based on the GPS coordinates of sample sites.
7

1.BACKGROUND:
Clearance of land for agricultural production has likely resulted in the reduction in soil organic carbon stocks
because the natural balance of inputs and outputs to the soil carbon cycle have been disrupted. Harvest
represents a reduction in the return of dead plant biomass to the soil system, while tillage, seeding, and nutrient
amendment alter the physical, chemical, and biological controls over the main output pathway, decomposition.
Further loss of soil organic carbon can occur where management leaves surfaces exposed to wind and water
erosion. This research aimed to identify land management practices with the potential to change soil carbon
content in red-brown earth soils within the Mid-North and Eyre Peninsula areas of South Australia.
South Australia produces a wide range of agricultural commodities across a diverse soil and climatic
environment. Cropping in South Australia largely consists of dry-land production of wheat, barley and oats,
canola and legume. Cereal production represents one of the largest sectors of the South Australian agricultural
industry, producing over 810,000 tonnes of barley, 110,000 tonnes of oats, and 2296,000 tonnes of wheat and
contributing over $1,400 million to the Australian economy (South Australian Farming Federation, and
Australian Bureau of Statistics, Agricultural Commodities). While continuous cropping systems contribute
strongly to this sector, crop-pasture rotational systems are also important in contributing to livestock products
which include over 10,000 tonnes of mutton, 22,000 tonnes of lamb, 6000 million litres of milk, and 93,000
tonnes of beef. The soils under agricultural production in South Australia vary widely and include hard red-
brown texture contrast soils, calcareous soils, deep loam soils, sand-over-clay soils, deep sands and cracking
clays.
The research project in South Australia was relatively small, with funds to include 200 sites in total. With a
large diverse landscape and a limited sample number, fertile red-brown earth (RBE) soils were chosen as the
target soil type which would form the basis of stratification. Red-brown earth soils cover a significant proportion
of the agricultural area (1637,500 ha) and are particularly important soils in the Northern Yorke and Eastern and
Lower Eyre Peninsula regions (Hall et al., 2009). RBEs have had historical management issues since
agricultural development in the late 1800s. Drought and unpredictable heavy rainfall, combined with structural
problems arising from excessive cultivation of these high silt soils, led to structural degradation following in the
early 1900’s. Structurally degraded soils are prone to erosion and crop establishment can be poor where seedling
emergence is hampered by surface soil hard-setting. The heavy-handed management practices used in the early
1900s have largely been replaced with practices that better consider surface management to protect the soils
from erosion. Despite reduced tillage, contour cultivation, and stubble retention erosion remains a serious
concern for RBE soils (Hall et al., 2009). However, due to the inherent soil fertility and high productive
potential for a wide range of crops, these soils are considered to have good potential to accumulate soil carbon.
A stratified random approach was deemed most appropriate and aimed to capture the spatial variability in
climatic, topographic, and management variables as well as capturing a realistic representation of the soil carbon
content of the target regions. The random approach was considered to introduce fewer spatial biases compared
to a targeted or volunteer based approach, and therefore would provide a current baseline of soil organic carbon
content and management practices across the red-brown earth soils of the Mid-North and Eyre Peninsula.
8

2. METHODOLOGY
2.1 A stratified random approach to site selection
The project adopted a stratified random design within each sampling region. Stratification was based on soil
type, specifically targeting red-brown-earth soils, and on rainfall to ensure random sampling points were
appropriately distributed across the region.
The South Australian Land and Soil Information Framework (SALSIF, held by DENR) was used to map the
distribution of RBEs within each region before superimposing a 5 km grid over RBE landscape (e.g. Figure 1).
Within the mapped RBE area, each grid intersect represented a possible sampling point. A 50 mm rainfall
stratification approach was superimposed over the RBE grid, and was used to ensure appropriate distribution
across each region (Mid-North, Eyre Peninsula). The number of random sample points within each rainfall zone
was weighted towards the higher rainfall areas, to account for the higher variation in soil carbon and
management practices expected with increasing rainfall. Within each rainfall zone, the list of possible sampling
points (grid intersects) was randomised. Where randomly selected sites proved unsuitable (e.g. falling on non-
agricultural land such as homesteads or roadways) the site was rejected and the next sampling point in the
randomised list was taken in replacement. Landholders were identified from local cadastre information, held by
DENR, and contacted to gain permission for access and soil sampling. Where a landholder could not provide the
minimum of 5 years management history the site was rejected and replaced with the next sample point in the
random list. Lack of management information and identification of non-target soil type were the main reasons
for random site rejection. One farmer denied access based on climate change scepticism. At the time of
sampling the soil target type was confirmed through characterisation of a deep exploratory core at the time of
sampling (e.g. Figure 2).
The sample points of a stratified random approach can be considered independent from one another and are
suitable for modelling spatial variability, such as mapping of soil carbon. With no apriori management
information the approach captures the dominant practices that occur across the region. The sample population
has fewer biases arising from prior assumptions of management practice and avoids dependence on volunteer
participation which may favour proactive landholders and exclude less engaged land-holders. There is a danger
that less commonly adopted management practices are not well represented in the random selection, but gaps
can be identified and supplemented in subsequent sampling campaigns. In addition to testing for differences
between broad-scale management system (e.g. cropped Vs pasture), this approach allows for more in depth
exploration of the management data to address research questions such as can specific management strategies
that influence soil organic carbon stocks be identified within the red brown earth agricultural landscape of
South Australia?
2.2 Soil samples and carbon analysis
More than 900 soil samples were collected over two field campaigns (2010; 2011). DENR managed the field
campaigns and sampling was contracted to Rural Solutions SA. Soil samples were collected and analysed in
accordance with the National protocols detailed in Sanderman et al., 2012 (see SCaRP Report No 1). Briefly, for
each site 10 intersects on a 25 m grid were sampled with a hydraulic trailer mounted corer and combined to
9

create composite soil samples of 0-10 cm, 10-20 cm, and 20-30 cm depths. Intact cores were sampled for bulk
density at 3 grid intersects at 3 depths. Soil samples were analysed for total carbon (TC), total inorganic carbon
(TIC), and total organic carbon (TOC). Supporting bulk density (BD) and gravel content measurements were
used to calculate the carbon content as metric tonnes per hectare (Mg/ha) based on an equivalent mass
calculation described in Sanderman et al., 2012 (see SCaRP Report No 1).
Mid-infra red spectra were collected for all soil samples and used to support the development of regionally
specific algorithms to predict soil organic carbon content and soil organic matter fractions (see Baldock et al,
SCaRP report No 2) building on the original work by Janik et al., (2007). The MIR-predictive approach was
used to estimate the total organic carbon (TOC), total inorganic carbon (TIC), particulate organic carbon (POC),
humic organic carbon (HOC) and, in combination with nuclear magnetic resonance (NMR) spectroscopy,
resistant organic carbon (ROC) content of samples. In addition to reporting the concentration of C (mg/g) within
these fractions, a Mahalanobis Distance (MD) ratio was provided to indicate how well represented the unknown
sample was within the known calibration dataset. The MD ratio was reported as an indicator of how reliable the
prediction was for any particular sample, where a MD ratio less than 1 indicated a robust prediction, and greater
than 1 indicated greater uncertainty in the prediction due to poor representation within the calibration dataset.
Where the MD ratio was greater than 1 predicted carbon fraction data was eliminated from further analysis.
The MIR approach was also used to predict clay content, silica content, pH, aluminium and iron, (Janik &
Skjemstad, 1995; Janik et al., 1998). However, these predictions were not used further as the error statistics (F-
value) indicated that many of the sample soils fell outside the calibration dataset, and also because there is likely
to be a high level of co-correlation between these predicted parameters and the carbon related predictions (i.e.
loading spectra have heavy reliance on same spectral regions).
2.3 Supporting data: climate and topography
Global Positioning System (GPS) data for each sampling site was used to extract relevant climatic (rainfall,
temperature, vapour pressure deficit in summer and winter seasons) and topographic data (elevation, slope,
aspect, profile curvature) from National database sources, consistent with methods described in Sanderman et
al., 2012 (see SCaRP Report No 1). These data variables were used to: i) describe the sampling environment
captured within the random approach; ii) to identify which parameters varied the most across the sample
population, across the regional datasets and within management system divisions; iii) to assess their impact on
soil carbon variability through multivariate regression approaches. Before use in statistical analysis
environmental and topographic variables were transformed as appropriate.
2.4 Management Data
The random approach with no apriori management information aimed to capture the variability in management
practices within the South Australian red-brown earth agricultural landscape. Management data (5-10 years) was
collected for key management descriptors including crop type, tillage and stubble management practices, pasture
type, grazing, and fertiliser (N, P) additions through return of land management questionnaires from land-
holders, as consistent with program protocols (Sanderman et al., 2012, see SCaRP Report No 1). While data
questionaries provided full management history up to 5 years (minimum requirement), management history up
10

to 10 years proved more problematic with many landholders unable to provide extended history. Based on 5
years of management history, sites were identified as belonging to one of 3 broad-scale production systems:
i) cropped systems included sites where the 5 year history was crop based without pasture rotation.
Continuous or rotational growth of cereal, legume, oilseed and hay crops are included;
ii) crop-pasture systems included those sites where pasture and crop rotations have both been included in
the past 5 years;
iii) pasture systems included those sites that had no crop rotation but some form of pasture for the last 5
years.
These broad-scale classes were subsequently used to test for differences in soil organic carbon content between
management system types (crop Vs crop-pasture Vs pasture). Further use of the management data required
transformation from the binary questionnaire format to values or indexes that could be used in more formal
statistical analysis. Data were first converted to a proportional basis for every variable collected (cereal crop,
legume crop, no tillage, minimum tillage, stubble grazed, stubble burnt etc) before specific practices were
grouped as a management ‘decision’ option (e.g. by crop type, by tillage option, by stubble option etc) and used
to create a Bray-Curtis index of similarity against a dummy reference practice. Thus, 7 indexes of management
practice were created: crop type, tillage type, stubble management, pasture type, pasture management, and
nitrogen and phosphorus fertiliser addition. Indexes were subsequently used to in testing for management
impacts on SOC stocks within and between systems.
2.5 Data Analysis
Traditional descriptive statistics (frequency distributions, standard deviations etc) were used to describe the
variability in single parameters (e.g. SOC stocks, the average of populations, and to test for differences between
populations (e.g. cropped versus pasture). Standard deviations were used to indicate the variability in the data
rather than standard errors due to unbalanced population sizes varying from n=10 to n>60.
A range of multivariate statistical approaches were used to assess the overall variability in the sample population
and to identify correlations between SOC stocks and environmental and management variables. Multivariate
methods were carried out in PRIMER (PRIMER-E, Plymouth Routines in Multivariate Ecological Research v.
6). Principal components was used to understand the main variability in climatic, topographic, and in
management variables across the dataset and within sub-populations of the dataset (within the Mid-North,
within the Eyre Peninsula, and within rainfall stratification zones). Environmental variables were transformed
and normalised as appropriate before analysis. Analysis of similarity (ANOSIM) was used to determine
significant differences between groups (e.g region, management system, rainfall zone), and is comparable to a
standard univariate analysis of variance (ANOVA) (Clarke & Gorley, 2006). ANOSIM reports the level of
dissimilarity between sample groups (global R, where 0 indicates no difference, and 1 indicates large difference)
and the associated level of significance (P). The BEST routine (based on rank correlations) with stepwise
selection (BVStep) was used to assess which combination of environmental and/or management parameters
correlated with SOC stocks (Clarke and Gorley, 2006). RELATE was used to assess the degree of corrlation
between sample relationships based on environmental and management variables.
11

Figure 1. Stratified random approach to site selection demonstrated on red-brown earth soils of the Eyre Peninsula with isohyets marked to guide weighing towards higher rainfall zones. Blue dots indicate potential sampling points at 5 km grid intersects. Red dots indicate actual sample points as selected from randomly generated list.
Figure 2. Examples of photographic archive of sample sites in South Australia. A deep exploratory core was sampled and characterised to confirm that the site was a red-brown earth soil type.
12

3. RESULTS OF THE PROJECT
Due to the red-brown earths stratification of the target areas, interpretation of this data is based on the
geographical area included within this specific sampling population, and therefore may differ from data
referring more generally to the Mid-North and Eyre Peninsula agricultural regions per se which include other
soil types and wider geographical coverage.
3.1 Regional comparison of the Mid-North and Eyre Peninsula red-brown earth soils
3.1.1 SOC stocks and occurance of carbonate soils
Red-brown earth soils were sampled from two agricultural regions in South Australia. The soil organic carbon
stocks varied from 20.3 – 63.2 Mg/ha in the Mid-North and from 16.1 to 67.4 Mg/ha in the Eyre Peninsula
(Figure 3). There was a small significant (P<0.01) difference between the SOC stock (equivalent mass) between
region, with averages of 37.7 Mg/ha and 30.9 Mg/ha for the Mid-North and Eyre Peninsula respectively.
Mid-North red-brown earth soils had on average 3 t/ha more carbon in the top 10 cm, and another 3 t/ha in the
10-20 cm layer compared to Eyre Peninsula red-brown earth soils (Figure 4). The difference in stocks was more
consistent in the 10-20 cm depth soil (R=0.126, P<0.001), with greater variation in both regions in the top 0-
10cm (R= 0.042, P=0.06). The bottom 20-30 cm did not contribute to difference in the SOC stocks between
regions. For both regions approximately 50% of the carbon stock was contained in the top 10 cm, 25-30% in the
10-20 cm and 20-25% in the 20-30 cm layer (Figure 4). The bulk densities of the soils were similar for both
regions while gravel contents were very variable at depth (Table 1).
Figure 3: Frequency distributions of the top 30 cm soil organic carbon (SOC) stocks (t/ha) in red-brown earth soils of the Mid-North (n=131) and the Eyre Peninsula (n=69).
0
5
10
15
20
25
30
0 15 20 25 30 35 40 45 50 55 60 65 70 75
freq
uenc
y of
occ
uran
ce
SOC stocks (Mg/ha)
0
5
10
15
20
25
30
0 15 20 25 30 35 40 45 50 55 60 65 70 75
.
SOC stocks (Mg/ha)
13

Figure 4. The soil organic stocks (Mg/ha) in the 0-10 cm, 10-20 cm and 20-30 cm depth layers of red-brown earth soils sampled from the Mid-North (orange, where n=133) and Eyre Peninsula (blue, where n=67) agricultural regions of South Australia. Error bars indicate standard deviation at each depth, and pie charts indicate the percentage of the 30 cm stock accounted for in each 10 cm depth incriment.
Of the 200 sites sampled, 85 sites (or 42.5%) had carbonate present in the top 30 cm. The presence of carbonate
in samples increased with increasing sample depth, with approximately 20%, 32% and 42% of samples
reporting a positive fizz test at 0-10 cm, 10-20 cm, and 20-30 cm depths respectively. The proportion of
carbonate soils was greater in Eyre Peninsula samples compared to Mid-North samples at all depths. As well as
more frequent occurrence at depth, the average inorganic carbon content was higher for Eyre Peninsula (12.5
mg/g) soils compared to the Mid-North (4.0 mg/g), with 20-30 cm samples as high as 68mg/g soil (Table 1).
Table 1. Bulk density (g/cm3), gravel (%) and carbonate content (mg/g) of red brown earths soils of the Mid-North (n=133) and Eyre Peninsula (n=67) agricultural regions of South Australia. Data are provided for the 0-10 cm, 10-20 cm, and 20-30 cm depths, and indicate the average (x), with range (minimum-maximum).
0
10
20
30
0 5 10 15 20 25 30So
il de
pth
laye
r (cm
)
SOC Stock with depth (Mg/ha)
50%29%
21%
Mid-North0-10 cm10-20 cm20-30 cm
51%25%
24%
Eyre Peninsula0-10 cm10-20 cm20-30 cm
x range x range x range
0-10 cm 1.4 1.2-1.7 7 0-30 0.46 0-9.6
10-20 cm 1.6 1.2-1.9 10 0-50 1.81 0-38.2
20-30 cm 1.5 1.2-2.3 14 0-60 4.00 0.56.9
x range x range x range
0-10 cm 1.4 0.9-1.6 11 0-40 1.03 0-9.9
10-20 cm 1.5 1.2-1.8 13 0-90 4.28 0-47.0
20-30 cm 1.5 1.1-1.9 12 0-33 12.5 0-68.7
Gravel content(%)
Bulk Density Carbonatemg/g)
Eyre Peninsula
Mid-North g/cm3
14
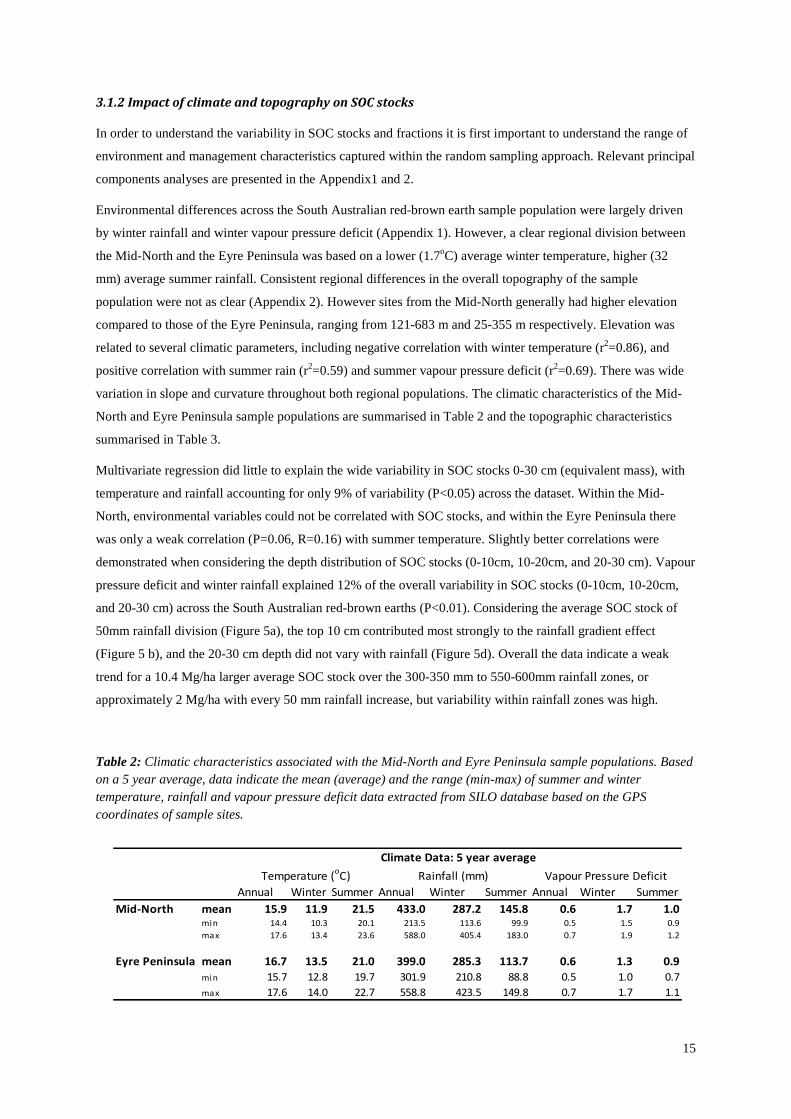
3.1.2 Impact of climate and topography on SOC stocks
In order to understand the variability in SOC stocks and fractions it is first important to understand the range of
environment and management characteristics captured within the random sampling approach. Relevant principal
components analyses are presented in the Appendix1 and 2.
Environmental differences across the South Australian red-brown earth sample population were largely driven
by winter rainfall and winter vapour pressure deficit (Appendix 1). However, a clear regional division between
the Mid-North and the Eyre Peninsula was based on a lower (1.7oC) average winter temperature, higher (32
mm) average summer rainfall. Consistent regional differences in the overall topography of the sample
population were not as clear (Appendix 2). However sites from the Mid-North generally had higher elevation
compared to those of the Eyre Peninsula, ranging from 121-683 m and 25-355 m respectively. Elevation was
related to several climatic parameters, including negative correlation with winter temperature (r2=0.86), and
positive correlation with summer rain (r2=0.59) and summer vapour pressure deficit (r2=0.69). There was wide
variation in slope and curvature throughout both regional populations. The climatic characteristics of the Mid-
North and Eyre Peninsula sample populations are summarised in Table 2 and the topographic characteristics
summarised in Table 3.
Multivariate regression did little to explain the wide variability in SOC stocks 0-30 cm (equivalent mass), with
temperature and rainfall accounting for only 9% of variability (P<0.05) across the dataset. Within the Mid-
North, environmental variables could not be correlated with SOC stocks, and within the Eyre Peninsula there
was only a weak correlation (P=0.06, R=0.16) with summer temperature. Slightly better correlations were
demonstrated when considering the depth distribution of SOC stocks (0-10cm, 10-20cm, and 20-30 cm). Vapour
pressure deficit and winter rainfall explained 12% of the overall variability in SOC stocks (0-10cm, 10-20cm,
and 20-30 cm) across the South Australian red-brown earths (P<0.01). Considering the average SOC stock of
50mm rainfall division (Figure 5a), the top 10 cm contributed most strongly to the rainfall gradient effect
(Figure 5 b), and the 20-30 cm depth did not vary with rainfall (Figure 5d). Overall the data indicate a weak
trend for a 10.4 Mg/ha larger average SOC stock over the 300-350 mm to 550-600mm rainfall zones, or
approximately 2 Mg/ha with every 50 mm rainfall increase, but variability within rainfall zones was high.
Table 2: Climatic characteristics associated with the Mid-North and Eyre Peninsula sample populations. Based on a 5 year average, data indicate the mean (average) and the range (min-max) of summer and winter temperature, rainfall and vapour pressure deficit data extracted from SILO database based on the GPS coordinates of sample sites.
Annual Winter Summer Annual Winter Summer Annual Winter SummerMid-North mean 15.9 11.9 21.5 433.0 287.2 145.8 0.6 1.7 1.0
min 14.4 10.3 20.1 213.5 113.6 99.9 0.5 1.5 0.9max 17.6 13.4 23.6 588.0 405.4 183.0 0.7 1.9 1.2
Eyre Peninsula mean 16.7 13.5 21.0 399.0 285.3 113.7 0.6 1.3 0.9min 15.7 12.8 19.7 301.9 210.8 88.8 0.5 1.0 0.7max 17.6 14.0 22.7 558.8 423.5 149.8 0.7 1.7 1.1
Temperature (oC) Rainfall (mm) Vapour Pressure DeficitClimate Data: 5 year average
15

Table 3: Topographic characteristics associated with the Mid-North and Eyre Peninsula sample populations. Data indicate the mean (average) and the range (min-max) of summer and winter temperature, rainfall and vapour pressure deficit data extracted from SILO database based on the GPS coordinates of sample sites.
Figure 5. demonstrating a weak trend for increasing SOC stocks in the top 30 cm (a) and the contribution from 0-10 cm (b), 10-20 cm (c) and 20-30 cm (d) depths for red-brown earths sampled across South Australia.
Latitude LongitudeElevation Aspect Slope TPI class Curvature
Mid-North mean 413 187 2.1 27 -0.0001min 121 4 0.1 1 -0.0022 -34.5 138.1max 683 360 8.8 43 0.0010 -32.5 139.4
Eyre Peninsula mean 136 215 1.79 23.72 0.00min 25 18 0.05 2.00 0.00 -34.6 135.4
max 355 360 6.67 43.00 0.00 -33.3 136.8
Sample regionTopographic Characteristics
0
10
20
30
40
50
60
70
350 400 450 500 600
SOC
Stoc
ks 0
-30c
m(M
g/ha
)
Annual rainfall zone (<mm)
0
10
20
30
40
50
60
350 400 450 500 600 350 400 450 500 600 350 400 450 500 600
b) c) d)
a)
16

3.1.3 Comparison of SOC stocks between management systems
In the Mid-North cropped, crop-pasture, and pasture systems were represented by 64, 59, and 10 sites
respectively, and in the Eyre Peninsula cropped and crop-pasture systems were represented by 39, and 28 sites
respectively (Figure 6).
Regional differences in SOC stocks remain evident, but there was no significant difference in SOC stocks
between broad-scale management system (Figure 7). On average the Mid-North cropped systems, and the crop-
pasture systems, contained 6.8 Mg/ha and 7.0 Mg/ha more carbon compared to the Eyre Peninsula.
It is often difficult to categorise agriculture beyond broad-scale management categories. However, the
management data was used to understand the amount and type of variability in specific management practices
that occurred within the broad-scale management system categories. Large variability in specific practices was
demonstrated across cropped and crop pasture systems (Appendix 3). Fertiliser addition (N, P) and crop/pasture
species accounted for the majority of variability, with stubble and tillage management varying to a smaller
extent. In cropped systems, there was comparatively less variation in fertiliser addition compared to crop-
pasture systems, but greater variability in stubble and tillage management. For research purposes, pasture
systems were considered an extreme example of crop-pasture rotation, with 5 or more years of pasture compared
to between 1 to 4 years of pasture. Considering the management gradient, and low pasture numbers (n=10) we
subsequently treated pastures as belonging to crop-pasture systems. The degree of correlation between
management practices and environmental variables was tested through RELATE routines and indicated no
correlation between the two in the Mid-North, and weak correlation (R=0.13, P<0.05) in the Eyre Peninsula.
Figure 6. the number of sites sampled per broad-scale agricultural system on red-brown earth soils within the Mid-North and Eyre Peninsula agricultural regions of South Australia, where: cropped sites were defined as having no pasture rotation in the last 5 years, and included cereal, legume, oilseed and hay rotations; crop-pasture systems include a rotations of 1-4 years of crop and 1-4 years of pasture; pasture systems represent 5 years of pasture with no crop rotation.
17

Figure 7. Soil organic carbon stocks (Mg/ha) in red-brown earth soils of the Mid-North and Eyre Peninsula under cropped systems (yellow), crop-pasture (green), and pasture systems (blue). The bar chart indicates averages, with standard errors.
0.0
0.1
0.2
0.3
0 15 20 25 30 35 40 45 50 55 60 65 70 75
freq
uenc
y of
occ
uran
ce
SOC stock 0-30cm (Mg/ha)
0.0
0.1
0.2
0.3
0.4
0 15 20 25 30 35 40 45 50 55 60 65 70 75
freq
uenc
y of
occ
uran
ce
SOC stock 0-30 cm (Mg/ha)
0.0
0.1
0.2
0.3
0 15 20 25 30 35 40 45 50 55 60 65 70 75
freq
uenc
y of
occ
uran
ce
SOC stock 0-30cm (Mg/ha)
0.0
0.1
0.2
0.3
0.4
0 15 20 25 30 35 40 45 50 55 60 65 70 75
freq
uenc
y of
occ
uran
ce
SOC stock 0-30cm (Mg/ha)
0.0
0.1
0.2
0.3
0 15 20 25 30 35 40 45 50 55 60 65 70 75
freq
uenc
y of
occ
uran
ce
SOC stock 0-30cm (Mg/ha)
0
10
20
30
40
50
Mid-North Eyre Peninsula
SOC
Stoc
ks 0
-30
cm(M
g/ha
)
18

Given the strong climatic divide between the Mid-North and the Eyre Peninsula further exploration of the
impact of management on SOC stocks was conducted within individual regions. Multiple regressions did not
identify any management variables (crop/pasture species, stubble, tillage, pasture management, and N and P
fertiliser addition) as contributing to variability in SOC stocks at the regional scale.
3.2 MIR-based predictions of SOC, SIC and fractions in red-brown earth soils of South Australia
Data indicate good correlation between measured and predicted TOC and TIC content with correlation above
90% (Figure 9). All MD ratios (n=964) were < 1 indicating good representation across calcareous and non-
calcareous soil samples. Predictions of organic matter fractions were based on smaller calibration datasets
(n=21), and demonstrate good correlation (>80%) between measured and predicted values (Figure 9). The
confidence in the predicted POC was lowest where samples contained high amounts of inorganic carbon (Figure
10), mainly those soils from 20-30 cm depths where the size of the POC fraction is also low, representing 14%
of the dataset. There was greatest confidence in prediction of the HOC fraction, where all predicted values
(n=964) had an MD ratio <1 (Figure 10). On the whole, ROC predictions were reliable, with only 3 % of ROC
predictions reporting a MD ratio greater than 1. Predicted TOC and TIC data was not used in further analysis
because measured values were available. Predicted fraction data was only used in further data analysis where the
MD ratio was less than 1 indicating good reliability in the data. Thus, the mid-North was represented by 126
sites, and the Eyre Peninsula by 63 sites.
Figure 8: correlation between measured and predicted total organic carbon content (TOC) and measured and predicted total inorganic carbon (TIC) in South Australian red-brown earth soils (n=964).
19

Figure 9: correlations between measured and predicted values for particulate organic carbon, humic organic carbon and resistant organic carbon. Data represent the calibration dataset for red-brown earth soils of South Australia, where n= 21.
Figure 10: the relationship between inorganic carbon content and the Mahalanobis Distance (MD) ratio, where the red line indicates a threshold level (MD ratio = 1) set at 95% confidence, below which predictions are considered robust, above which predictions have greater uncertainty due to poorer representation of sample type within the calibration dataset.
20

The contribution of carbon fractions to the SOC stocks in red-brown earth soils of the Mid-North and Eyre
Peninsula are summarised in Figure 11. HOC was consistently the largest fraction, accounting for approximately
45% of soil carbon. In these soils, ROC was the second largest fraction accounting for approximately 35 % of
the carbon, while POC was the smallest fraction accounting for approximately 20%. The relationship between
depth and soil organic carbon fractions is presented in Figure 13. Regional differences in SOC stocks (Figure 7)
were largely driven by differences less HOC in the 0-10 cm and 10-20 cm depths of the Eyre Peninsula, and in
lower ROC at all depths.
Figure 11: the contribution of component fractions to the soil organic carbon stocks (0-30 cm) in the Mid-North (n=126) and Eyre Penisula (n=63), where particulate organic carbon (POC), humic organic carbon (HOC) and resistant organic carbon (ROC) have been predicted through mid-infra red spectroscopy.
Figure 12: The soil organic carbon stocks (Mg/ha) in fractions at 0-10 cm, 10-20 cm and 20-30 cm depth layers of red-brown earth soils sampled from the Mid-North (orange, where n=133) and Eyre Peninsula (blue, where n=67). Data are based on mid-infra red predicted values for pasticulate organic carbon (POC), humic organic carbon (HOC), and resistant organic carbon (ROC) normalised by the measured total organic carbon stock for each depth layer. Error bars indicate standard deviation at each depth.
0
10
20
30
40
50
Mid-North Eyre Peninsula
SOC
stoc
k, 0
-30
cm (M
g/ha
)
POC
HOC
ROC
ROC35%
HOC46%
POC19%
Mid-North:
ROC36%
HOC44%
POC20%
Eyre Peninsula:
0
10
20
30
0 5 10 15
Soil
dept
h la
yer (
cm)
POC Stock with depth (Mg/ha)
0 5 10 15
HOC Stock with depth (Mg/ha)
0 5 10 15
ROC Stock with depth (Mg/ha)
21

Considering the POC, HOC, and ROC stocks as a multivariate dataset, VPD explained 17% of the variability (P<0.001), with no improvement when considering management variables. Within the Eyre Peninsula and within the Mid-North regions, no consistent/significant difference between cropped and crop-pasture systems in the distribution of carbon within fractions could be measured as variability within each system group was high.
Within the Mid-North region as a whole MV regression against environmental and management variables could not help explain the variability in soil carbon stocks in organic matter fractions. At best (non-significant, P=0.12) multivariate regression could only explain 12% variation through elevation, aspect, temperature, and stubble management. However, within the Eyre Peninsula multivariate regression identified stubble and tillage management, along with winter VPD and winter rainfall as contributing to explain 23% of the variabilty in soil carbon fraction stocks. Alone winter rainfall and VPD could explain only 16% of the variability at a non-significant level ( P=0.12), indicating that management has a role in influencing the carbon contained in fractions.
The results suggest that carbon fraction data is useful in helping to understand varaibility in SOC stocks, and further analysis will help identify relevant environmental and management variables that can be used to develop a spatial model.The full carbon fraction data became available for analysis in June and represents a complex multivariate dataset, and final data analysis within rainfall zones of the two regions is pending.
22

4. DISCUSSION ON RESULTS OF THE PROJECT
Site selection within this project was conducted based on a stratified random approach, with no apriori
management information, and therefore can be considered a baseline of current SOC stocks in red-brown-earth
soils of the sampled regions. The SOC stocks (0-30 cm) of red-brown earth soils in the Mid-North and Eyre
Peninsula of South Australia spanned approximately a 50 Mg/ha range within both regions, with averages of 38
Mg/ha and 31 Mg/ha respectively. The larger SOC stocks (0-30 cm) of the Mid-North were accounted for in the
top 20 cm, and were largely attributed to larger HOC in the top 20 cm and larger ROC throughout the 30 cm
depth.
At the regional scale, and also within 50 mm rainfall zones, spatial variation in SOC stocks was high, and was
best explained by vapour pressure deficit and/or rainfall. Vapour pressure deficit (VPD) is a measure of the
evaporative force caused by the difference between the water vapour in the air and the amount of water that the
air can hold, which varies with temperature. VPD is considered an indicator of plant water availability, where a
high VPD would indicate lower water availability, potentially limiting plant growth and therefore inputs to the
soil carbon cycle. The influence of climate on plant productivity and SOC stocks at a regional scale is widely
recognised (Nichols, 1984; Jobbagy & Jackson, 2000; Lal, 2004; Zwart & Bastiaanssen, 2004; Davidson &
Janssens, 2006) and therefore, the clear climatic division between the Mid-North and the Eyre Peninsula (based
on summer VPD/rainfall and winter temperatures, Appendix 1), provided a strong basis for subdividing the
dataset in further analysis.
The random sampling approach captured sites that represented cropping, crop-pasture or pasture systems on red-
brown earth soils. Based on these broad-scale groupings, no difference in SOC stocks could be measured above
the high spatial variability, perhaps suggesting that cropped systems in the regions can store as much carbon as
crop-pasture systems. Analysis of the management data highlights some limitations in trying to make
generalisations regarding broad-scale system type. Data clearly demonstrated wide variability in specific
management practices within any broad-scale management system. Based on this data, it was difficult to clearly
subdivide management systems, but a general gradient in management practices across the sampled agricultural
sites was demonstrated (Appendix 3). Large within system variability is likely to make it difficult to determine
statistical differences in SOC content between broad-scale system types. More-over, measure differences
between broad-scale system types does little to provide practical advice to landholders in terms of soil
management. For example, incorporation of pasture rotations to cropping systems would require the capacity to
manage stock for a profitable outcome, which is not always possible. Broad-scale classification does little to
acknowledge the type of decisions made by the land-holder on a year-to-year basis that take into account
variation in climate (e.g. breaking rains and long-term forecasts) and economic factors.
Management data was converted to decision orientated indexes and used in multivariate regression approaches
to further explore the impact of specific management practices on soil carbon. However, no clear relationship
between specific management options (tillage or stubble management, fertiliser addition, frequency of pasture
rotation) and total SOC stocks was evident. Previous research findings in different environments suggest that
inclusion of pasture rotations between cropping cycles can improve SOC stocks (Heenan et al., 1995; West &
Post, 2002). In the red-brown earth soils of the Mid-North and the Eyre Peninsula there was no evidence to
suggest that the frequency of pasture rotation improved SOC stocks. Permanent pasture was used as a surrogate
23
to represent the extreme end of a pasture-crop rotation system, however there are some co-variables which need
to be considered. Permanent pasture systems in the Mid-North region tend to occur on land that is considered
marginal for cropping – i.e. lower rainfall, hilltops, and shallower soils. Additionally the pasture systems
captured were largely unfertilised, with only 2 of the 10 pastures having low level fertiliser application, and the
rest applying no fertiliser.
Our inability to measure any difference in SOC stocks with management practice (frequency of rotation or
otherwise) may reflect the wide variability in climatic, topographic or management variables (e.g. fertiliser
addition), or may be limited by relatively short management history information. In a review of the Australian
literature, Sanderman et al., (2009) estimate that improved management of cropland, such as retaining stubble or
adopting no till practices, results in a relative gain of 0.2-0.3 Mg C ha-1 year-1 compared to conventional
management options. Considering the 5 year management history available, this would equate to aiming to
correlate management practices that potentially result in a 1.0 – 1.5 Mg C ha-1 against the much larger inherent
spatial variability demonstrated within the target regions. Within 50 mm rainfall zones (Figure 5) variability in
SOC stocks remained high ranging between 15 Mg C ha-1 at the lower rainfall (<350mm) to 26 Mg C ha-1
within the higher rainfall zone (<600 mm). Previous work in duplex red-brown earth soils (North-East Victoria)
report no impact of stubble management over a 10 year timeframe, while longer-term trial report significant
differences after 19 years (Chan et al., 2002) and after 24 years of (Bunemann et al., 2006) contrasting stubble
management treatments.
Although management indexes were not helpful in understanding the variability in total SOC stocks, they were
useful in preliminary analysis of SOC frcation data. Multivariate regression approaches indicated that stubble
and tillage management helped to explain a small amount of the variability in carbon stocks across fractions
(POC, HOC, ROC) in the Eyre Peninsula dataset, but VPD and rainfall were also influential. No relationship
was identified within the Mid-North, but further data analysis using these approaches within restricted rainfall
zones is underway and may help to identify which management and climatic variables to include in any future
spatial modelling. SOC fractions provide potential in helping to understand the impact of management on soil
carbon content for several reasons. Our data indicate that POC was consistently the smallest component of soil
organic matter accounting for approximately 20% of the stock. POC is the most labile fraction, with a tunover
time frame of 1-2 years, and therfore we would expect this fraction to be most responsive to management
practices on a short-term timeframe. HOC and ROC make up the majority of carbon stocks (~80%), and are
generally considered to turnover on a decadal (10 year plus) and centuary timescale respctively. Therefore data
that indicates longer-term carbon inputs would be useful. This could be achived within a modelling framework,
for example using climatic history to estimate biomass inputs. ROC, sometimes refered to as chrcoal-like or
CHAR, can account for a large proportion carbon in Australian soils (Skjemstad et al., 1999) and may largely
originate from historical bushfire events. Since the ROC component is highly recalcitrant in its chemistry it
could be considered an inherent component not influenced by agricultural management practices. However,
while current agriculture may have little impact on the turnover of ROC, it does not necessarily follow that ROC
has not been influenced by agricultural management. Considering the historical problems of erosion within the
Mid-North region, the presence or absence of ROC may be more heavily influenced by historical management
practices and landscape position. Previous research on red-brown earths in Southern and Western Australia
measured soil losses of 0.1 to 8 tonnes of soil per hectare, and up to 180 kg C per hectare in a single erosion
24

event (Malinda et al., 1998). Further research is required in order to quantify the effect of erosion on soil carbon
stocks.
Climate change poses a risk to the long-term viability of SOC stocks, and projections indicate that most
agricultural regions of Australia will become warmer and drier. Our data suggest that the lower rainfall zones
tend to have lower SOC stocks on average, approximately 2 Mg/ha per 50 mm rainfall reduction and consistent
with wider literature literature (Luo et al., 2010). This data provides a valuable quantitaive baseline to initialise
regionally specific modelling scenarios based on projected climate change for South Australian. The spatial
nature of the random site selection provides a robust dataset of current SOC stocks, and therefore has potential
to improve prediction outputs under specific climate scenarios such as changing rainfall patterns. Due to the
large spatial coverage such modelling exercises will be relevant across the red-brown earth cropping regions of
the Mid-North and Eyre Peninsula, rather than having limited inference space which may arise from spatial
clustering of alternative sample selection approaches.
It was clear that environmental factors which impact plant productivity have a strong driving influence on soil
carbon and its fractions. Therfore, it seems logical that management approaches which maximise plant
productivity may have the greatest potential in increasing soil organic carbon. In the targetted red-brown earth
soils, limitations to productivity are varied and include include subsoil constraints, aluminium and boron
toxicity, salinity, sodicity, nutrient deficit, poor structure etc. The collected bulk density information has
indicated that many of the sites have compacted sub-soil layers, where bulk densities above 1.6 g/cm3 will limit
root penetration. Another limitation, identified at specific sites through collaborative work within the Grains
Research and Development Corporation (GRDC) program, is low pH. The optimal pH for crop growth is
between 6 and 7.5, and where below pH 5 root growth and nutrient aquisition can become limiting.
Acidification is known to represent a serious threat to regions of the Mid-North but can be addressed through
application of lime to improve crop growth and yield (Farhoodi & Coventry, 2008). These results highlight the
importance of understanding a range of physical and chemical soil quality indicators (e.g. pH and clay content)
to maximise productivity at a given site. While our project focus has been on organic carbon, the role of the
mineral matrix in protecting soil organic matter is well known (Golchin et al., 1994; Skene et al., 1996; Oades,
1998). Future work to develop improved mid-infra red predictions of clay content, building on the foundation
wotrk of Janik and Skjemstad (Janik & Skjemstad, 1995; Janik et al., 1995; Janik et al., 1998; Skjemstad et al.,
1998; Rossel et al., 2006; Janik et al., 2007a; Janik et al., 2007b; Janik et al., 2009), would add considerable
power as a co-variable in data analysis and interpretation.
In summary, management effects on total SOC stocks in the red-brown earth soils could not be identified.
However, initial analysis of SOC fractions suggest that consideration of POC, HOC, and ROC may be useful in
helping to identify specific management practices that influence soil carbon.
25

5. LIST OF FINDINGS OF THE PROJECT
• In the Mid-North agricultural region of South Australia, red-brown earth soils contained between 20.4 and
65.4 Mg/ha organic carbon in the top 30 cm, with overall average of 38 Mg/ha. There was no evidence for
differences in SOC stocks between cropped and crop-pasture systems.
• In the Eyre Peninsula agricultural region of South Australia, red-brown earth soils contained between 16.1
and 67.4 Mg/ha organic carbon in the top 30 cm, with overall average of 31 Mg/ha. There was no evidence
for differences in SOC stocks between cropped and crop-pasture systems.
• A rule of thumb for the distribution of SOC within the top 30 cm of red-brown earth soils from the Mid-
North and Eyre Peninsula is for 50% of the SOC stock to be in the top 10 cm and 75-80% in the top 20cm.
• MIR-predictions of SOC fractions were most reliable for HOC, but proved less reliable in soils with low
organic carbon and high inorganic carbon were encountered (largely deep soils).
• Humus organic carbon (HOC) was consistently the dominant soil organic carbon fraction in the sampled red-
brown earth soils, accounting for approximately 45% of carbon.
• In general terms, there was a 2 Mg/ha increase in SOC stocks for every 50 mm increase in rainfall across the
300-600mm rainfall zone.
• Variability in SOC stocks in red-brown earths was high and could be correlated with vapour pressure deficit
above any other climatic, topographic or management variables. This suggests that the best approach to
increase SOC stocks is to maximise plant productivity through addressing site specific limitations on plant
growth.
26

6. FUTURE RESEARCH NEEDS
• Our ability to inform stakeholders regarding regional SOC stocks in South Australia is limited to red-brown
earth soils under dry-land agriculture. Additional data on other dominant soil types and land uses in South
Australia is urgently required in order to support possible participation in carbon markets. Other dominant
agricultural systems and soils types include dry-land cropping and pasture-cropping on Mallee deep sands,
clay spreading and delving on sand-over clay soil types, annual and intensive pasture systems across the
state.
• It would be valuable to extend the collected dataset to a modelling framework, incorporating estimates of
biomass production, and predicting the potential and attainable SOC stocks in red-brown earths within the
Mid-North and Eyre Peninsula regions. Such modelling outputs would be valuable in providing better
guidance to the farming community and in providing a robust basis for informing policy-based decision
making processes.
• Calcareous soils form the dominant soil type in South Australian, but measuring organic carbon, and
particularly carbon fractions, proves problematic with no standard reliable method currently available.
Before assessing the potential to store SOC in calcareous soils it would be valuable to further improve our
ability to measure soil organic carbon and fractions in these problematic soils.
• SOC stocks, particularly the more stable HOC fraction, change slowly and are influenced by a range of
environmental, soil, and management factors. Therefore it would be valuable for future research looking to
understand the impact of agricultural management on SOC stocks to measure key parameters such as
sand/clay content and pH, and capture longer management histories (or estimates of primary production).
• The risk of erosion in removing top soil and associated carbon is dependent on landscape position (elevation,
slope, aspect, profile curvature etc), prevailing climatic conditions (rain events, wind) and management
practices. Further research is required to quantify the impact of erosion across the Australian agricultural
landscape, and to better integrate the probability of erosion impacts into modelling of soil carbon.
• The lack of long-term agricultural trials in South Australia, and other dominant agricultural regions in
Australia, hampers our understanding of the long-term impact of agricultural management on soil organic
carbon stocks. Australian soils research would greatly benefit from renewed investment in well structured
replicated field trials that include a whole of system approach to productivity, soil carbon, and other key soil
parameters.
27

7. PUBLICATIONS
• Macdonald, L.M., 2012. Soil carbon: measurement, function, management. Soil Quality Workshop, Clare, South Australia, 19th June 2012.
• Macdonald, L.M., 2011. Soil sampling. ASSI/ASPAC Soil Carbon Workshop, University of Adelaide, 22nd November 2011.
• Soil carbon talk draws crowd, Natalie Sommerville, Northern Angus, 2nd November 2011.
• Macdonald, L.M., 2011. Soil Carbon Workshop, Yacka Moorundie Land Care group and Northern & Yorke NRM Board, Spalding Town Hall, 6th October 2011.
• Macdonald, L.M., Sanderman, J., 2011. Cycling the carbon and nutrient pathway: making soil organic matter work, Grassland Society of Southern Australia, Annual Conference, Hamilton, VIC, 2 June 2011.
• Grassland Society of Southern Australia Inc, The Farm Trader, May 2011. http://www.thefarmtrader.com.au/articles/farmers-society-of-southern-aus-inc
• Macdonald, L.M., 2011. The National Soil Carbon Research Program: South Australian highlights, Mid-North Young Guns workshop of Soil Carbon, Clare, SA, 18 April 2011.
• Macdonald, L.M., 2011. Soil carbon: function, management, measurement, Greening Australia Soil Carbon Workshop, Murray Town, SA, 11 March 2011
• Masters, B., Harding, A., 2011 Soil carbon levels measured in the Mid-North, The Northern Argus, 09 March 2011.
• Masters, B., Soil carbon levels measured on the Eyre Peninsula, Port Lincoln Times, February 2011.
28

The South Australian component of the DAFF National Soil Carbon Research Program
Lynne M Macdonald1, Tim Herrmann2, Jeffrey A Baldock1
1. CSIRO Land & Water, Sustainable Agricultural Flagship; 2. Department of Environment and Natural Resources, Government of South Australia
IntroductionThe DAFF and GRDC funded National Soil Carbon ResearchProgram (SCaRP 2009-2012) aims to provide information on thepotential for land management options to influence soil carboncontent. The research program will:
• assess the variation in soil carbon across the agriculturallandscape in target regions
• improve understanding of which types of management aremore likely to change soil carbon content
• develop rapid methods to predict soil carbon content
contact: Lynne Macdonaldphone: +61 8 8273 8111email: [email protected]://www.csiro.au/people/Lynne.Macdonald.html
Soil Samples• Composite sample: 10 cores from across a 25 x 25 m grid
• Depth: 0-10 cm, 10-20 cm, 20-30 cm
• Bulk Density: separate cores are collected for bulk density
Additional sampling at select sites:
• 10 individual cores from across the paddock
• sample depths extends to 1m
Carbon Analysis and Data• Total organic carbon is determined through combustion
• POC and HUM are predicted through MIR spectroscopy
• charcoal (ROC) is determined through NMR analysis
Outcomes• Data and findings from this research will be used to inform
Australia’s National Carbon Accounting System (NCAS)http://www.climatechange.gov.au/government/initiatives/national-carbon-accounting.aspx
Soil Organic Carbon Basics1. The amount of organic carbon in soil is a balance between
inputs of new material and the constant output lossesthrough decomposition (Fig 1):
2. Soil carbon is made up from different components orfractions:• particulate organic carbon (POC)• humus (HUM)• resistant organic carbon (ROC), e.g charcoal
3. Different fractions of soil organic carbon have differentfunctional roles in the soil system
4. Soil carbon is part of soil organic matter, which includesother important elements such as nitrogen
5. Decomposition of soil organic matter must occur fornutrients to be released
The South Australian project:In South Australia the SCaRP project aims to quantify theimpact of management on soil carbon content of red-brownearths in the Mid-North and Eyre Peninsula. The project has:
• randomly sampled 120 sites in the Mid-North and 80 sites onthe Eyre Peninsula (Figure X).
• analysed samples for total organic and inorganic carboncontent
• collected 10 years of management information (e.g.cropping/grazing regime, fertiliser inputs, tillage, yield) tointerpret soil carbon content
E
0 1 2 3 4 5A
B
C
D
F
N
25 m sampling grid
E
0 1 2 3 4 5A
B
C
D
F
NN
25 m sampling grid
Figure 2: Soil sampling in the Northern district, January 2010
Photographs taken by N Watkins and A Schapel, Rural Solutions
Acknowledgements: This research is funded by the Department of Agriculture Fisheries and Forestry and the Grains Research and Development Corporation. The project is a collaboration between CSIRO Land & Water and the Department of Environment and Natural Resources, Government of South Australia. Rural Solutions SA, in particular D Davenport, A Schapel, and the large field work team are thanked for mapping exercises and soil sampling.
More information: http://www.daff.gov.au/climatechange/australias-farming-future
Inputs: • plant litter (shoots and roots)• soil animals and their waste• organic amendments
Outputs:• decomposition/mineralisation• crop harvest and removal• leaching of dissolved carbon
CO2
Figure 1: Inputs and outputs in the soil carbon cycle
29

8. ACKNOWLEDGEMENTS
We extend thanks to the South Australian farming community for participation in this research project which
would not have been possible without their cooperation. This work was funded by the department of
Agriculture, Fisheries and Forestry, and the Grains Research and development Corporation. Amanda Schapel,
Rural Solutions SA, is thanked for coordination of field activities and thorough quality control of supporting
data including site information and bulk density data. The wider field crew at RuralSolutions SA are thanked for
ensuring soil collection and preparation and persisting to ensure the return of land-owner management
questionaries. Field crew members included David Davenport, Andrew Harding, Mary-Anne Young, Brett
Masters, Joshua Telfer, Tony Wilson, Terry Evans, David Woodard, Natalie Watkins, Rebecca Tonkin, Peter
Ciganovic, Glenn Bailey, Mark Sindicic, Trevor Dooley, Riaz Ahmed, Simone Lawson, Bart Dessart, and
Catherine Miles. Natallie Sommerville (Yacka Moorundie Landcare group), Millie Nicholls (Mid-North
Grasslands Working group), Anne Brown (Greening Australia), Murray Unkovich (University of Adelaide) are
thanked for organising and hosting various C workshops in the Mid-North region. Thanks are extended to David
Maschmedt, James Hall, and Jan Rowland for guidance and involvement in stratification and mapping at the
initial stages of the project. The laboratory technicians at CSIRO, are acknowledged for sample analysis and
include Bruce Hawke, Athina Puccini, Steve Szarvas, Kiralee Jury, Christina Asanopoulos, Alana Massalsky,
and Janine McGowan. David Clifford, CSIRO, is thanked for statistical discussions regarding future spatial
modelling.
30

9. REFERENCES
Bunemann, E. K., Heenan, D. P., Marschner, P. & McNeill, A. M. 2006. Long-term effects of crop rotation, stubble management and tillage on soil phosphorus dynamics. Australian Journal of Soil Research, 44, 611-618.
Chan, K. Y., Heenan, D. P. & Oates, A. 2002. Soil carbon fractions and relationship to soil quality under different tillage and stubble management. Soil & Tillage Research, 63, 133-139.
Clarke, K. R. & Gorley, R. N. 2006. PRIMER v6: User Manual/Tutorial., Plymouth, UK. Davidson, E. A. & Janssens, I. A. 2006. Temperature sensitivity of soil carbon decomposition and feedbacks to
climate change. Nature, 440, 165-173. Farhoodi, A. & Coventry, D. R. 2008. Field crop responses to lime in the mid-north region of South Australia.
Field Crops Research, 108, 45-53. Golchin, A., Oades, J. M., Skjemstad, J. O. & Clarke, P. 1994. SOIL-STRUCTURE AND CARBON
CYCLING. Australian Journal of Soil Research, 32, 1043-1068. Hall, J., Maschmedt, D. & Billing, B. 2009. The Soils of Southern South Australia, Department of Water, Land
and Biodiversity Conservation, Government of South Australia. Heenan, D. P., McGhie, W. J., Thomson, F. M. & Chan, K. Y. 1995. Decline in soil organic carbon and total
nitrogen in relation to tillage, stubble management, and rotation. Australian Journal of Experimental Agriculture, 35, 877-884.
Janik, L. J., Forrester, S. T. & Rawson, A. 2009. The prediction of soil chemical and physical properties from mid-infrared spectroscopy and combined partial least-squares regression and neural networks (PLS-NN) analysis. Chemometrics and Intelligent Laboratory Systems, 97, 179-188.
Janik, L. J., Merry, R. H., Forrester, S. T., Lanyon, D. M. & Rawson, A. 2007a. Rapid prediction of soil water retention using mid infrared spectroscopy. Soil Science Society of America Journal, 71, 507-514.
Janik, L. J., Merry, R. H. & Skjemstad, J. O. 1998. Can mid infrared diffuse reflectance analysis replace soil extractions? Australian Journal of Experimental Agriculture, 38, 681-696.
Janik, L. J. & Skjemstad, J. O. 1995. Characterisation and analysis of soils using mid-infra red partial least-squares. 2. Correlation with some laboratory data. Australian Journal of Soil Research, 33, 637-650.
Janik, L. J., Skjemstad, J. O., Shepherd, K. D. & Spouncer, L. R. 2007. The prediction of soil carbon fractions using mid-infrared-partial least square analysis. Australian Journal of Soil Research, 45, 73-81.
Jobbagy, E. G. & Jackson, R. B. 2000. The vertical distribution of soil organic carbon and its relation to climate and vegetation. Ecological Applications, 10, 423-436.
Lal, R. 2004. Soil carbon sequestration impacts on global climate change and food security. Science, 304, 1623-1627.
Luo, Z., Wang, E. & Sun, O. J. 2010. Soil carbon change and its responses to agricultural practices in Australian agro-ecosystems: A review and synthesis. Geoderma, 155, 211-223.
Malinda, D. K., Fawcett, R. G., Little, D., Bligh, K. & Darling, W. 1998. The effect of grazing, surface cover and tillage on erosion and nutrient depletion. Advances in Geoecology, 1217-1224.
Nichols, J. D. 1984. RELATION OF ORGANIC-CARBON TO SOIL PROPERTIES AND CLIMATE IN THE SOUTHERN GREAT PLAINS. Soil Science Society of America Journal, 48, 1382-1384.
Oades, J. M. 1998. The retention of organic matter in soils. Biogeochemistry, 5, 35-70. Rossel, R. A. V., Walvoort, D. J. J., McBratney, A. B., Janik, L. J. & Skjemstad, J. O. 2006. Visible, near
infrared, mid infrared or combined diffuse reflectance spectroscopy for simultaneous assessment of various soil properties. Geoderma, 131, 59-75.
Sanderman, J., Farquharson, R. & Baldock, J. 2009. Soil carbon sequestration potential: a review for Australian agriculture. Soil carbon sequestration potential: a review for Australian agriculture.
Skjemstad, J. O., Taylor, J. A. & Smernik, R. J. 1999. Estimation of charcoal (char) in soils. Communications in Soil Science and Plant Analysis, 30, 2283-2298.
Skene, T. M., Skjemstad, J. O., Oades, J. M. & Clarke, P. J. 1996. The influence of inorganic matrices on the decomposition of straw. Australian Journal of Soil Research, 34, 413-426.
West, T. O. & Post, W. M. 2002. Soil organic carbon sequestration rates by tillage and crop rotation: A global data analysis. Soil Science Society of America Journal, 66, 1930-1946.
Zwart, S. J. & Bastiaanssen, W. G. M. 2004. Review of measured crop water productivity values for irrigated wheat, rice, cotton and maize. Agricultural Water Management, 69, 115-133.
31

10. PLAIN ENGLISH SUMMARY
Project title: South Australian dry-land cropping
Lead organisation: CSIRO Land & Water
Consortium
organisations:
Department of Environment and Natural Resources, South Australia
Objectives This project aims to identify land management strategies with the potential to change soil carbon content in red-brown earth soils of the Mid-North and Eyre peninsula of South Australia. Soils contribute to National approaches looking to develop rapid tools to predict soil carbon content.
Location South Australia: Mid-North, Eyre Peninsula
Key activities More than 900 soil samples were collected over two field campaigns (2010; 2011) across the Mid-North and Eyre Peninsula agricultural regions of South Australia. Samples were taken from 200 paddocks at 3 depths (0-10 cm; 10-20 cm; 20-30cm) and analysed for total organic and inorganic carbon contents. Intact soil cores were also taken to measure the bulk density to allow calculation of carbon content based on mass (tonnes of carbon per hectare).
Additional data was collected including climate data (rainfall, temperature), topographic data (elevation, slope, aspect etc), and 5-10 years of management data (crop type, tillage, stubble management, fertiliser additions, pasture rotation etc).
Outcomes In the Mid-North agricultural region of South Australia, red-brown earth soils contained between 20.4 and 65.4 Mg/ha organic carbon in the top 30 cm, with overall average of 38 Mg/ha.
In the Eyre Peninsula agricultural region of South Australia, red-brown earth soils contained between 16.1 and 67.4 Mg/ha organic carbon in the top 30 cm, with overall average of 31 Mg/ha.
In general terms, there was a 2 Mg/ha increase in SOC stocks for every 50 mm increase in rainfall across the 300-600mm rainfall zone.
A rule of thumb for the distribution of SOC within the top 30 cm of red-brown earth soils from the Mid-North and Eyre Peninsula is for 50% of the SOC stock to be in the top 10 cm and 75-80% in the top 20cm.
Humus organic carbon (HOC) was often the dominant soil organic carbon fraction in the sampled red-brown earth soils.
Variability in SOC stocks in red-brown earths was high and could be correlated with vapour pressure deficit above any other climatic, topographic or management variables. This suggests that the best approach to increase SOC stocks is to maximise plant productivity through addressing site specific limitations on plant growth.
Implications This research provides a current baseline of soil organic carbon stocks across red-brown earth soils of the mid-North and Eyre Peninsula. The dataset is spatially robust and ideal for parameterising regional modelling scenarios relating to management and/or climate change. The collected management data represents a snap-shot of current management practices on red-brown earths in the target region and how they have changed over the last 10 years. Results indicate no consistent effect of
32

management above landscape variability, but correlation with vapour pressure deficit above any other climatic, topographic or management variables, suggests that the best approach to increase SOC stocks is to maximise plant productivity through addressing site specific limitations on plant growth.
Publications • Macdonald, L.M., 2012. Soil carbon: measurement, function, management. Soil Quality Workshop, Clare, South Australia, 19th June 2012.
• Macdonald, L.M., 2011. Soil sampling. ASSI/ASPAC Soil Carbon Workshop, University of Adelaide, 22nd November 2011.
• Soil carbon talk draws crowd, Natalie Sommerville, Northern Angus, 2nd November 2011.
• Macdonald, L.M., 2011. Soil Carbon Workshop, Yacka Moorundie Land Care group and Northern & Yorke NRM Board, Spalding Town Hall, 6th October 2011.
• Macdonald, L.M., Sanderman, J., 2011. Cycling the carbon and nutrient pathway: making soil organic matter work, Grassland Society of Southern Australia, Annual Conference, Hamilton, VIC, 2 June 2011.
• Grassland Society of Southern Australia Inc, The Farm Trader, May 2011. http://www.thefarmtrader.com.au/articles/farmers-society-of-southern-aus-inc
• Macdonald, L.M., 2011. The National Soil Carbon Research Program: South Australian highlights, Mid-North Young Guns workshop of Soil Carbon, Clare, SA, 18 April 2011.
• Macdonald, L.M., 2011. Soil carbon: function, management, measurement, Greening Australia Soil Carbon Workshop, Murray Town, SA, 11 March 2011
• Masters, B., Harding, A., 2011 Soil carbon levels measured in the Mid-North, The Northern Argus, 09 March 2011.
• Masters, B., Soil carbon levels measured on the Eyre Peninsula, Port Lincoln Times, February 2011.
33

Appendix 1: Variability in climatic variables in the Mid-North and Eyre
Peninsula red-brown earth soil
Principal components analysis of climatic variables across the Mid-North (orange) and Eyre Peninsula (blue)
sampling regions. Variables are 5 year averages of Winter (W) and Summer (S) temperature (Temp), rainfall
(Rain), and vapour pressure deficit (VPD). The figure demonstrates that regional differences in climate are
driven by winter temperature (W Temp) and summer rainfall (S Rain), but variability within each region is
driven by winter rainfall (W Rain) and winter vapour pressure deficit (W VPD).
Climatic variables are important in driving crop productivity and decomposition and therfore this analysis
povides a strong rational for dividing the sample population by region.
34

Appendix 2: Variability in topographic variables in the Mid-North and Eyre
Peninsula red-brown earth soil
Principal components analysis of topographic variables across the Mid-North (orange) and Eyre Peninsula
(blue) sampling regions. Variables are slope, elevation, TPI, curvature and aspect. The analysis demonstrates
that elevation is the mina parameter that differs between the Mid-North and the Eyre Peninsula, but that slope
and curvature are highly variable across both regions.
Elevation correlated to climatic variables that are likely to influence primary productivity, while variation in
slope and curvature are likely to influence how prone a particular point in the landscape is the effects of erosion
(loss or deposition).
35

Appendix 3: Variability in management parameters within broadscale
management systems in red-brown earths of South Australia
Principal components analysis demonstrating large variability in management practices within broad-scale
agricultural system type. Variables included similarity indexes based on 5 years of management data
representing crop/pasture type, nitrogen (N) and phosphorus (P) fertiliser addition, stubble management, tillage
management and grazing management. The analysis demonstrates that the agricultural landscape can be
considered a continuum in management intensity, and that different management variables are more/less
important in describing the variability within different systems.
Principal component 1 (49.5 %)
-4 -2 0 2 4 6 8-4
-2
0
2
crop
Tillage
Stubble
Pasture sp
Grazing
N
P
Prin
cipa
l com
pone
nt 2
(17.
8 %
)
36