sequestering carbon in soil
TRANSCRIPT
C-MASC 04-09
R. Lal Carbon Management and Sequestration Center
The Ohio State University Columbus, OH 43210 USA

Biota 620 Gt
Atmosphere 800 Gt
+4 Gt/yr
Soils 2,500 Gt
(i) SOC - 1,550 Gt (ii) SIC - 950 Gt
Ocean 38,400 Gt + 2.3 Gt/yr
(i) Surface layer: 670 Gt (ii) Deep layer: 36,730 Gt (iii) Total organic: 1,000 Gt
Fossil Fuels 4,130 Gt
(i) Coal: 3,510 Gt (ii) Oil: 230 Gt (iii) Gas: 140 Gt (iv) Other: 250 Gt
120 + 2.0 Gt/yr (photosynth) Plant respiration
60 + 1.6 Gt/yr
60 Gt/yr
8 Gt/yr Fossil fuel Combustion & Cement manufacture
90 Gt/yr
0.6+0.2 Gt/yr (Burial)
MRT = 5Yr
MRT = 25Yr
Mean Residence Time (MRT) = 400Yr
1.6 + 0.8 Gt/yr Deforestation
MRT = 6Yr
92.3 Gt/yr
Biofuel offset?
Lal, 2004

C-MASC 04-09
Ecosystem
Organic C Pool (Pg C to 1-m depth)
Range Mean % of Total
Flux (Pg C/yr)
Total in world soils 1395-2011 1580 100 60
Cropland soils 128-168 152 9.6 3
Grassland/Savannas 279-559 425 26.9 26
Plantations - 90 5.7 5
Forests - 704 44.5 17
57%

C-MASC 04-09
Farmers have custody of more environment than does any other group.
. . . . Paarlberg (1980)

C-MASC 04-09
1. It is a familiar property, 2. It involves direct measurement, 3. It can be measured in 4 dimensions (length,
width, depth, time), 4. It lends itself to repeated measurements over
the same site,
There are numerous advantages:

C-MASC 04-09
5. It is linked to ecosystem performance and services,
6. It is a key driver of soil formation, 7. It is important to soil fertility, 8. It has memory, 9. It has well defined properties,

C-MASC 04-09
10. It can be used in synergism with other indicators,
11. Its uncertainty can be quantified, 12. Its pathways across the landscape can be
followed, 13. It is an important archive of paleo-
environmental conditions.

C-MASC 02-09
Innovative Technology II
Innovative Technology I Subsistence
farming, none or low off-farm input soil degradation
New
equilibrium Adoption of
RMPs
20
40 60 80 100 120 140 160
40
60
80
100
0
20
Time (Yrs)
Accelerated erosion
Maximum Potential
Rate ΔY
ΔX
Attainable
Potential
C-MASC 04-09 Lal, 2004

Historic Loss from Terrestrial Biosphere = 456 Gt with 4 Gt of C emission = 1 ppm of CO2
The Potential Sink of Terrestrial Biospheres = 114 ppm
Assuming that up to 50% can be resequestered = 45 – 55 ppm
Cropland Soils: 1 Gt/yr Rangeland Soils: 1 Gt/yr Restoration of Degraded/Desertified: 1 Gt/yr Drawdown: 50 ppm of CO2 over 50 years
C-MASC 04/09

Reducing C-Based Input
Soil Carbon Sequestration
Avoiding Emissions
Controlling Erosion
Improving Energy Efficiency • Biofuels
Creating Negative C Emissions
Sequestering Carbon
Creating Positive Nutrient Budget
Mulching Cover cropping
Soil Amendments • Biochar • Manure • Zeolites
Chemical Fertilizers Biofertilizers
C-MASC 04/09

C-MASC 04-09
C Sequestration = C input > C output
C Depletion = C input < C output
C output = Erosion, Decomposition, leaching, Harvest
C input = Residues, Mulch, Compost, Amendment, Deposition

C-MASC 04-09

1. Physical: Aggregation, Illuviation
2. Chemical: Humification, Organo-Mineral complexation
3. Biological: Recalcitration of SOM
C-MASC 04-09

According to hierarchical model, 3 different classes of SOM are:
• Persistent Pool: > 250 µm macro-aggregates
• Transient Pool: 53-250 µm micro-aggregation
• Temporary Pool: <52 µm silt and clay contents
C-MASC 04-09 Lal, 2004
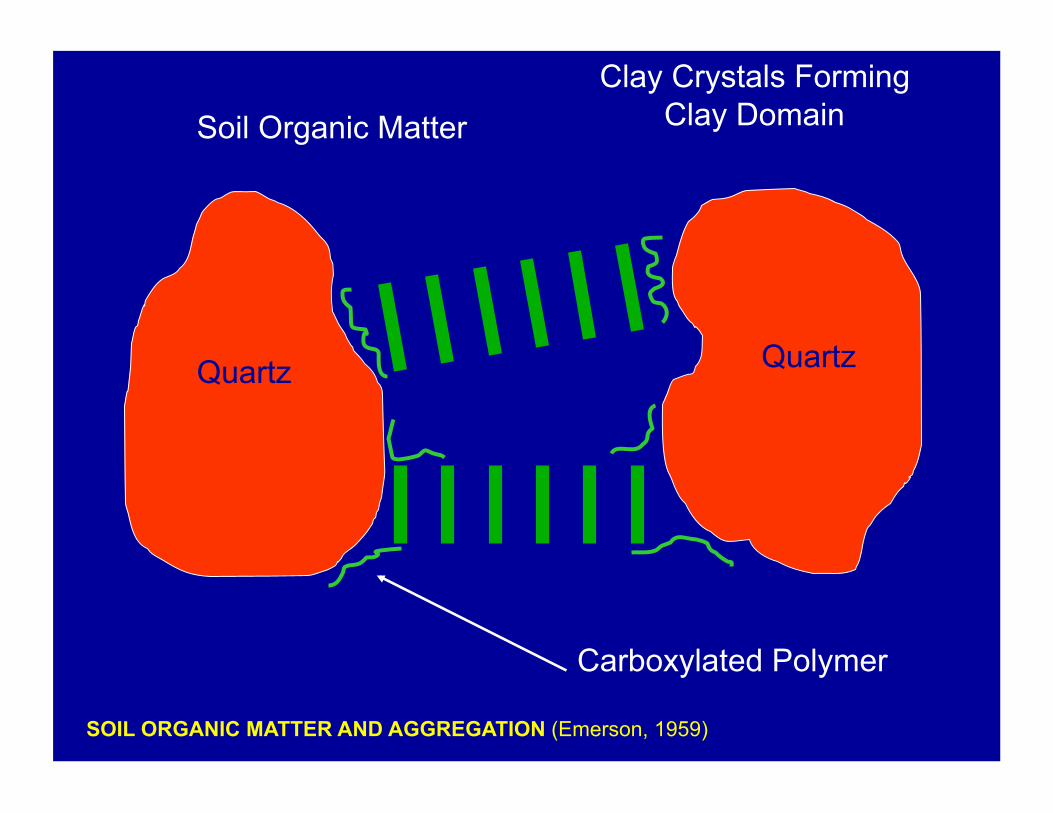
Quartz Quartz Pore
Space
Soil Organic Matter Clay Crystals Forming
Clay Domain
Carboxylated Polymer
SOIL ORGANIC MATTER AND AGGREGATION (Emerson, 1959)

1500 x 1 0 15 C in w orl d soil
1.4 x 10 15 g/ y r decompositi o n a nd e missio n to the a tmos p here
5.7 x 10 15 g/ y r C dis p l a ced d ue to erosion
3.99 x 10 15 g/ y r stored w ith i n t he
terrestri a l ecosystem
0.57 x 10 15 g/ y r tr a nsported to
the oce a n Lal, 2003

C-MASC 04-09
World…… 1.1 Pg C/y
USA…….. 15 Tg C/y
Brazil…… 60 Tg C/y
India…….. 4.8 - 7.2 Tg C/y
Iceland….. 0.01-0.02 Tg C/y
(60-250 Tg C/1000 yr)

C-MASC 04-09
1. Dynamic replacement of SOC at eroding sites and decrease in decomposition at depositional sites.
2. Deep burial of carbon.
3. The magnitude of the sink range from 0.1-1 Pg/y (Van Oost et al., 2007; Stallard, 1998; Smith et al., 2001).

C-MASC 4-09

A 10% substitution of petrol and diesel fuel is estimated to require:
• 43% of the current cropland area (USA) • 38% of the current cropland area (EU)
Which means forests and grasslands would need to be cleared to enable production of energy crops. C-MASC 04-09

1000-3500 L/L
C-MASC 04-09
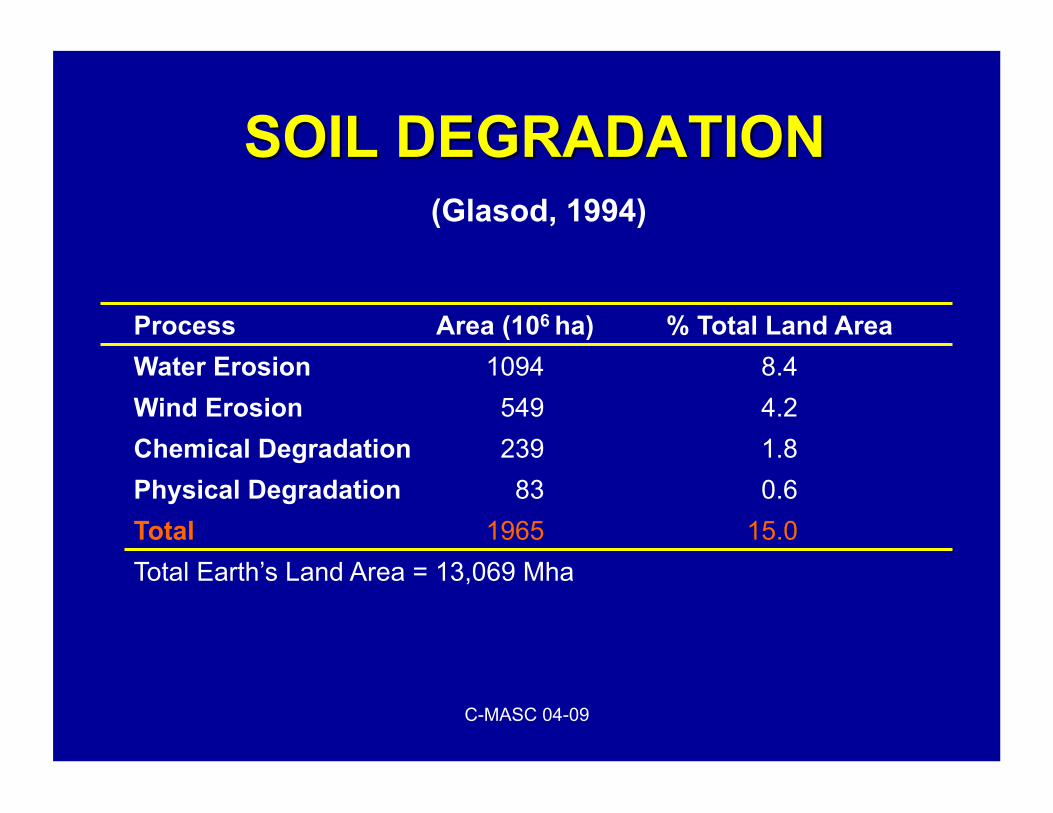
Process Area (106 ha) % Total Land Area Water Erosion 1094 8.4 Wind Erosion 549 4.2 Chemical Degradation 239 1.8 Physical Degradation 83 0.6 Total 1965 15.0 Total Earth’s Land Area = 13,069 Mha
C-MASC 04-09
(Glasod, 1994)

Parameter Value Area degraded (106 ha) 3506 % of land area 23.5 Total NPP loss (Tg C/y) 955 Total Population affected (billion) 1.54 % Total Population 23.9
C-MASC 04-09

Region Total Land Used Land Available Land ---------------Gha-------------------
Sub-Saharan Africa 1.05 0.157 0.893 South/Central America 0.98 0.147 0.833 Asia an Pacific 0.74 0.474 0.266 North America 0.43 0.232 0.158 Europe 0.32 0.202 0.118 North America 0.28 0.179 0.101 North Africa/Near East 0.04 0.04 0 World 3.82 1.452 2.368 Tropical Regions = 1.99 Gha Temperate Regions = 0.38 Gha

C sequestration through reclamation of salt affected soils in northern India (Recalculated from Garg, 1998; Lal et al., 1998).

Sub-catchment Carbon sequestration rate (Mg C ha-1y-1) Low High
Bingham River 3.8 5.2 Collie River Central East/James Well 3.8 5.2 Collie River East 3.3 4.4 Collie River South Branch 4.6 6.0 Harris river 8.5 11.5 Wellington Reservoir/ Collie River Central
6.6 9.0

0
10
20
30
40
50
60
70
80
90
100
No-Till Plow Till
SOC Concentration
C-MASC 04-09

C-MASC 04-09
Parameter Kg CE/ha Conventional Till No Till
1. Input 803 786 2. Output 6431 6688 3. Soil erosion -60 0 4. C Sequestration -500 500 5. Net C output 5871 7188 6. C Output : Input 7·3 9·1

(Derpsh, 2007)
C-MASC 04-09

High
Low Medium
Medium
Temperature
Moisture
Wet
Dry Cool Hot

C-MASC 04-09
Technology Temperate Tropics Highlands
Humid Sub-Humid Arid Humid Sub-Humid Arid Humid Sub-Humid Arid
No-Till
Cover Cropping
Manuring
Biochar
Agroforestry
Irrigation
INM
Improved Pasture

C-MASC 04-09
Technology Clay Silt Sandy Loam
Poorly Drained Well Drained Erodible Non-Erodible Erodible Droughty
No-Till
Cover Cropping
Manuring
Biochar
Agroforestry
Irrigation
INM
Improved Pasture

C-MASC 04-09
Depends on many factors:
1. Baseline or reference point.
2. Clay content and type.
3. Antecedent SOC pool.
4. Residue management.
5. Internal drainage.
6. Soil wetness.

C-MASC 04-09
Zero Emission Negative Emission
1. Reduces the rate of CO2 increase in the atmosphere
1. Removes CO2 from the atmosphere
2. High cost 2. Cost effectiveness
3. MMV essential 3. Dangerous leakage cannot occur
4. Ancillary benefits (EOR, CBM) 4. Ecosystem services
5. Reduces energy efficiency by 15% 5. Essential to food security

Strategy GHG Abatement (Euro/t CO2 E) Tillage and Residue Management - 50 Waste Recycling - 15 Degraded Land Restoration 10 Second Generation Biofuels 5 Pastureland Afforestation 10 Degraded Forest Restoration 12 Agriculture Conversion 25 Biomass Co-firing Power Plant 30 Coal C Capture & Sequestration 45 Gas Plant Capture & Sequestration 60
C-MASC 04-09

Soil Organic Matter and Food Security
Maintaining soil organic matter above the threshold (1.1% SOC in the root zone) is critical to sustaining soil quality because of the following:
– Improving soil structure – Controlling erosion – Increasing soil water holding capacity – Increasing nutrient reserves in soil – Improving use efficiency of input – Enhancing soil biotic activity – Strengthening nutrient recycling – Increasing crop yield – Improving nutritional quality of food

SUGGESTIONS FOR POLICY MAKERS (SHORT-TERM 30 YRS)
If the objective to mitigate CO2 and global warming policy makers may be better advised to focus on the following:
(i) Increase the efficiency of fossil fuel use, (ii) Conserve the existing forest and savannahs, (iii) Restore natural forests and grasslands or croplands that is not needed, (iv) Restore soil C pool, and (v) Trade C credits.
C-MASC 04-09

SUGGESTIONS FOR POLICY MAKERS (LONG-TERM >50 YRS)
Non-C Fuel Technology (H2)
C-MASC 04-09