soil c and n sequestration and fertility development under land recently converted from plantation...
TRANSCRIPT
This article was downloaded by: [Le Moyne College]On: 17 October 2014, At: 15:33Publisher: Taylor & FrancisInforma Ltd Registered in England and Wales Registered Number: 1072954 Registered office:Mortimer House, 37-41 Mortimer Street, London W1T 3JH, UK
New Zealand Journal of Agricultural ResearchPublication details, including instructions for authors and subscriptioninformation:http://www.tandfonline.com/loi/tnza20
Soil C and N sequestration and fertilitydevelopment under land recently convertedfrom plantation forest to pastoral farmingC. B. Hedley a b , B. H. Kusumo c , M. J. Hedley c , M. P. Tuohy c & M. Hawke da Massey University , Private Bag 11222, Palmerston North, 4442, New ZealandE-mail:b Landcare Research , Private Bag 11052, Manawatu Mail Centre, PalmerstonNorth, New Zealandc Massey University , Private Bag 11222, Palmerston North, 4442, New Zealandd Bay of Plenty Farm and Pastoral Research, New Zealand , 23 Glenroy PlaceRD4, Rotorua, New ZealandPublished online: 23 Feb 2010.
To cite this article: C. B. Hedley , B. H. Kusumo , M. J. Hedley , M. P. Tuohy & M. Hawke (2009) Soil C andN sequestration and fertility development under land recently converted from plantation forest to pastoralfarming, New Zealand Journal of Agricultural Research, 52:4, 443-453, DOI: 10.1080/00288230909510526
To link to this article: http://dx.doi.org/10.1080/00288230909510526
PLEASE SCROLL DOWN FOR ARTICLE
Taylor & Francis makes every effort to ensure the accuracy of all the information (the “Content”)contained in the publications on our platform. However, Taylor & Francis, our agents, and ourlicensors make no representations or warranties whatsoever as to the accuracy, completeness, orsuitability for any purpose of the Content. Any opinions and views expressed in this publication arethe opinions and views of the authors, and are not the views of or endorsed by Taylor & Francis.The accuracy of the Content should not be relied upon and should be independently verified withprimary sources of information. Taylor and Francis shall not be liable for any losses, actions, claims,proceedings, demands, costs, expenses, damages, and other liabilities whatsoever or howsoevercaused arising directly or indirectly in connection with, in relation to or arising out of the use of theContent.
This article may be used for research, teaching, and private study purposes. Any substantialor systematic reproduction, redistribution, reselling, loan, sub-licensing, systematic supply, ordistribution in any form to anyone is expressly forbidden. Terms & Conditions of access and use canbe found at http://www.tandfonline.com/page/terms-and-conditions
New Zealand Journal of Agricultural Research, 2009, Vol 52: 443-4531175-8775 (Online); 0028-8233 (Print) /09/5204-0443 © The Royal Society of New Zealand 2009
443
Soil C and N sequestration and fertility development under landrecently converted from plantation forest to pastoral farming
C. B. HEDLEY1,2
B. H. KUSUMO1
M. J. HEDLEY1
M. P. TUOHY1
M. HAWKE3
1Massey UniversityPrivate Bag 11222Palmerston North 4442, New Zealand
2Landcare ResearchPrivate Bag 11052, Manawatu Mail CentrePalmerston North, New Zealand
3Bay of Plenty Farm and Pastoral Research,New Zealand.
23 Glenroy PlaceRD4, Rotorua, New Zealand
Corresponding author:[email protected]
Abstract Soil organic matter accumulation andconcomitant fertility changes in soils recently con-verted from plantation forest to pastoral agriculturein the Taupo-Rotorua Volcanic Zone have been ob-served, with a probable soil C sequestration rate of6.1 t ha-1 year-1, and a soil N sequestration rate of0.451 ha-1 year-1, to 150 mm soil depth, for the first 5years after conversion attwo of three selected farms.Rapid increases in Olsen P were observed, with soilsreaching their optimum agronomic range within3-5 years after conversion, at two of three farms.A decreasing C:N ratio with time since conversionreflects improved fertility status, and implies thatin initial years of pasture establishment, N lossesare reduced due to its immobilisation into soil or-ganic matter. These research findings suggest thatland-use change from plantation forest to pastoralfarm, with inputs of N, P, K and S to soils, allowssignificant soil C and N sequestration for at least 5
years after conversion. This rate of C sequestrationcould be used as an offset for forest C sink loss infuture emissions trading systems. Further researchis required to at least 0.3 m depth to confirm thispreliminary study.
Keywords C:N ratio; Olsen P; pH; volcanicsoils
A09013; Online publication date 4 November 2009Received 17 February 2009; accepted 25 September 2009
INTRODUCTION
Plantation forest covers 7% (1.7 M ha) of NewZealand, 91% being Pinus radiata D. Don, and theKaingaroa Forest, on the volcanic soils of the CentralPlateau, North Island, is one of the largest plantedforests in the world. Here Pinus radiata growth rates(for 25-year-old trees) vary between 22 and 39 m3
ha"1 year1 (Kimberley et al. 2005), and are thereforesome of the highest growth rates globally (Carle etal. 2002). This outstanding production performanceis largely attributed to a deep rooting system (up to5 m) in these volcanic soils, plus a suitable climate(Molloy 1998). Despite this success, recent econom-ic trends have favoured deforestation of plantationforests and conversion to pastoral farming. In theTaupo-Rotorua area, 18% of the forest harvested in2005 has been converted to mainly dairy pasture,with a proposed conversion area of approximately60 000 ha (Brodnax 2007). This trend is mirrored onthe Canterbury Plains where almost 1000 ha havebeen converted.
Projected implications of this land-use changeinclude detrimental effects on air and water quality,due to increased nitrous oxide emissions and nitrateleaching, respectively, primarily due to dung andurine excreted by introduced grazing rum inants, andto a much lesser extent to increased use of nitrogenfertilisers (e.g., de Klein & Ledgard 2005). Also,this land-use change has impacted onNew Zealand'sgreenhouse gas accounting because forests plantedsince 1990 can be included as "forest sinks", i.e.,net consumers of carbon dioxide, during the firstcommitment period to the Kyoto Protocol, under
Dow
nloa
ded
by [
Le
Moy
ne C
olle
ge]
at 1
5:33
17
Oct
ober
201
4
444 New Zealand Journal of agricultural Research, 2009, Vol. 52
article 3.3. However, this diminishing forest sinkhas resulted in a projected additional 14.7 millionemission units (one emission unit is equivalent toone tonne of greenhouse gas emissions converted tocarbon dioxide equivalents by the global warmingpotential) being added to New Zealand's "net posi-tion" (New Zealand Climate Change Office 2007)of a deficit of 41.2 million units over the first com-mitment period of the Kyoto Protocol (2008-12).The Permanent Forest Sinks Initiative, introducedto curb this land-use change trend, has slowed therate of land conversion. However, it is likely thatsome deforestation will continue in New Zealand's1.7 million ha of plantation forest, much of it onrelatively productive agricultural soils, with increas-ing global returns from food production likely (ICFInternational 2008).
The New Zealand land use and Carbon analy-sis System ( luCaS) accounts and reports rates ofafforestation, reforestation and deforestation underArticle 3.3 of the Kyoto Protocol during the firstcommitment period (CP1) from 2008 12 (NewZealand ministry for the environment 2009). Itprovides regional estimates of stored soil C in forestsand soils and how these carbon stocks change withland use, and is best suited to providing national andregional averages. However, it is unlikely to captureindividual farm scale changes in soil carbon (ICFInternational 2008).
Farm scale soil carbon auditing should use acombination of spatial probability sampling andimproved measurement techniques (minasny et al.2006). Significant interest in the use of rapid in situfield collection of visual-NIR reflectance spectrafor soil carbon analysis (e.g., Gomez et al. 2008)provides the opportunity for rapid field estimation ofin situ soil carbon, and our research findings in thisarea are reported elsewhere (Kusumo et al. 2008).
The significant disruption of the soil profile whichoccurs as trees are ripped out during deforestation tobe replaced by pasture, suggests that spatial variabil-ity will be significant in this study. Pasture is estab-lished in soil profiles that can be highly variable overa distance of only a few metres. Significant inputsof nitrogen and phosphorus fertilisers are requiredto build up soil fertility in such soils, which havebeen under forest for several decades (wheadon &adam 2006). However, case studies report that pas-ture establishes very rapidly in these volcanic soils,with newly converted land producing over 1100 kgmilksolids ha–1 (wheadon & adam 2006).
A global review of the effects of conversion offorest land to pasture (murty et al. 2002) reported
widely different changes in soil C ranging from —51to +164%, at 109 case study areas. largest increaseswere found after conversion from native vegeta-tion to leguminous pastures in western australia,attributed to low initial soil C, application of fertil-iser and careful management to avoid overgrazing.maximum soil C decreases were recorded for a 20to 31-year-old pasture in Costa Rica, which hadreplaced wet tropical forest. another global review(Guo & Gifford 2002) concluded that soil C stocksincrease after land-use change from native forestto pasture (+8%), (n = 170), with precipitation andsampling depth having significant effects on themagnitude of change. Clearing of forest for pasturein areas with 2000 3000 mm precipitation seques-tered significantly more soil C stocks (+24%) com-pared with lower rainfall areas. also, soil C stocksincreased by 7 13% if sampling depth was less than1 m, but there was no change below 1 m, and nomarked differences between topsoil and subsoil Cchanges within the 1 m sampling depth. Kirschbaumet al. (2008) reported lower soil C stocks after af-forestation of pastoral sites to 18-year-old pine forestin australian Capital Territory, australia. Sites lost5.5tC ha–1 and 588 kg N ha–1 to 1 m sampling depth,although an additional 6.1tC ha–1 and 393 kg N ha–1
was contributed in above-ground litter. Scott et al.(2006) conducted a similar comparison of pine for-est and pasture C and N pools in the Rotorua region,New Zealand. They used the Roth-C soil C modelto model C accumulation on the forest floor duringthe first rotation of these forest stands as 12tC ha–1,with below ground inputs of 1.53 t C ha–1 year–1 toharvest, compared with steady state pasture inputsof 9 t C ha–1 year–1 to 0.3 m soil depth. The Roth-Csoil C model (Coleman & Jenkinson 1996) uses threelitter quality "classes" based on the decompositionrates of organic residues of differing composition(Scott et al. 2006). Scott et al. (2006) concludethat afforestation of pastures in New Zealand leadsto a decline in soil C and N cycling rates and soiltemperature, and that this decline may continue formultiple rotations so that plantation forest may notnecessarily be considered "C neutral" for the purposeof national carbon accounting after one rotation.
These studies highlight the fact that soil C and Nequilibrium shifts, which occur with land-use chang-es from plantation forest to pasture, are dependenton site specific edaphic, climatic and managementvariables. Post & Kwon (2000) found declining soilorganic carbon (SOC) levels where native forest wasconverted to pastures in Costa Rica, although at onesite, where soil type differed, there was a significant
Dow
nloa
ded
by [
Le
Moy
ne C
olle
ge]
at 1
5:33
17
Oct
ober
201
4
Hedley et al.—Soil development under forest-to-farm land-use change 445
increase in SOC. The soil at this site was a "richvolcanic soil". another study showed that 11 out of14 pasture conversion sites in Brazil showed soil Csequestration rates up to 740 kg C ha–1 year–1 over a20-year period since forest clearance (Post & Kwon2000). In New Zealand, land development of Tauposandy silt soils in the Central Volcanic Zone in the1950s, from native scrub to permanent pasture,increased soil C levels (0 150 mm soil depth) from4.2 to 6.3% after 25 years (walker et al. 1959), withhalf of the increase to a steady state occurring in thefirst 15 years (Jackman 1964). Fertiliser applicationswere typically 200 300 kg ha–1 of superphosphateat this time.
Our research, which aimed to assess the impactsof present land-use change from plantation forest toproductive pastures, in the Taupo-Rotorua VolcanicZone, on soil development in the first 5 years afterconversion, is able to report some important dataand trends in topsoil C and N changes.
METHODOLOGY
Site selectionThree farms on a range of soils were selected in theTaupo-Rotorua Volcanic Zone to assess soil changesand pasture development during the first 5 yearsafter conversion of plantation forest to productivepasture. land clearance involved tree removal witha large digger and bulldozing of organic debris intowindrows at tree felling. The area between windrowswas disc-cultivated, harrowed, rolled and sown withryegrass-white clover cultivars. The windrows werethen left for 2-3 years, for partial decomposition, be-fore incorporation into the soil. The more expensivemethod of mulching for incorporation was not usedat these sites. Mean annual rainfall is 1102 1401mm and air temperature is 11.9 12.8°C(1971-2000period). a t each farm, a permanent pasture site wassampled as well as one or two conversion sites oncomparable soil types. a t each site three transectswere chosen, and along each transect five positionswere sampled in may 2006.The three farms were:
Atiamuri(38°19.9 S, 176°2.7 E)• 1 -year conversion Pinus radiata to pasture• 5-year conversion Pinus radiata to pasture• Permanent pastureManawahe (37°59.8 S, 176°41.6 E)• 1 -year conversion Eucalyptus nitens to pasture• 5-year conversion Pinus radiata to pasture
• Permanent pastureTokoroa (38°9.9 S, 175°47.8 E)• 3-year conversion Pinus radiata to pasture• Permanent pasture
The conversion sites had previously been forestedfor 23 years at atiamuri; 26 years (Pinus radiata)and 10 years (Eucalyptus nitens) at manawahe; and63 years at Tokoroa. Pumice soils (Hewitt 1998) atatiamuri are mapped as Taupo sandy silts (Vucetich& wells 1978), consisting typically of 150 mm oftopsoil over a yellow-brown raw pumice subsoil(Orthic Pumice soils; Hewitt 1998). Tephric Recentsoils (Hewitt 1998) at manawahe have formed inKaharoa Ash, with little profile differentiation in thedark sandy raw pumice parent material. a t Tokoroa,the soils are older, more weathered deep fertile ashsoils, probably intergrade allophanic soils (Hewitt1998), with some pumice present in the profile.
during pasture seedbed preparation at the atia-muri and Tokoroa farms, capital dressings of diam-monium phosphate (daP) were added supplying upto 137 kg ha–1 P, with additions of mg, trace elementsand lime. after the initial year, conversion pasturesat all three properties typically receive two N dress-ings annually (autumn and spring) of between 74 and88 kg N ha–1 year–1 (Table 1).
Soil and pasture samplingSoils were sampled to 75 mm depth (five coresbulked per position, five positions per transect) forchemical analysis to assess soil fertility status; and to150 mm depth for total carbon and nitrogen analysis,during may 2006. Intact soil cores, 100 mm diam-eter and 80 mm in height, were also taken fromthe middle of each sample depth, at each samplingposition, for estimation of bulk density. annualpasture production was assessed from data col-lected between October 2004 and November 2006at 4 6 week intervals using the single trim and cuttechnique from small pasture exclusion cages (3 ×0.22 m2 per site) (Hawke 2004). annual dry matter(dm) yields are expressed per hectare.
Laboratory analysisSoils were air-dried and sieved (2 mm) before chemi-cal analysis. These air-dried soils were then analysedfor Olsen P, P retention, pH, cation exchange capac-ity (CeC), total C and total N. Herbage was oven-dried at 70°C, ground and then analysed for totalN. Standard laboratory analytical procedures wereused (Blakemore et al. 1987; landcare Researchenvironmental Chemistry laboratory 2009).
Dow
nloa
ded
by [
Le
Moy
ne C
olle
ge]
at 1
5:33
17
Oct
ober
201
4
446 New Zealand Journal of agricultural Research, 2009, Vol. 52
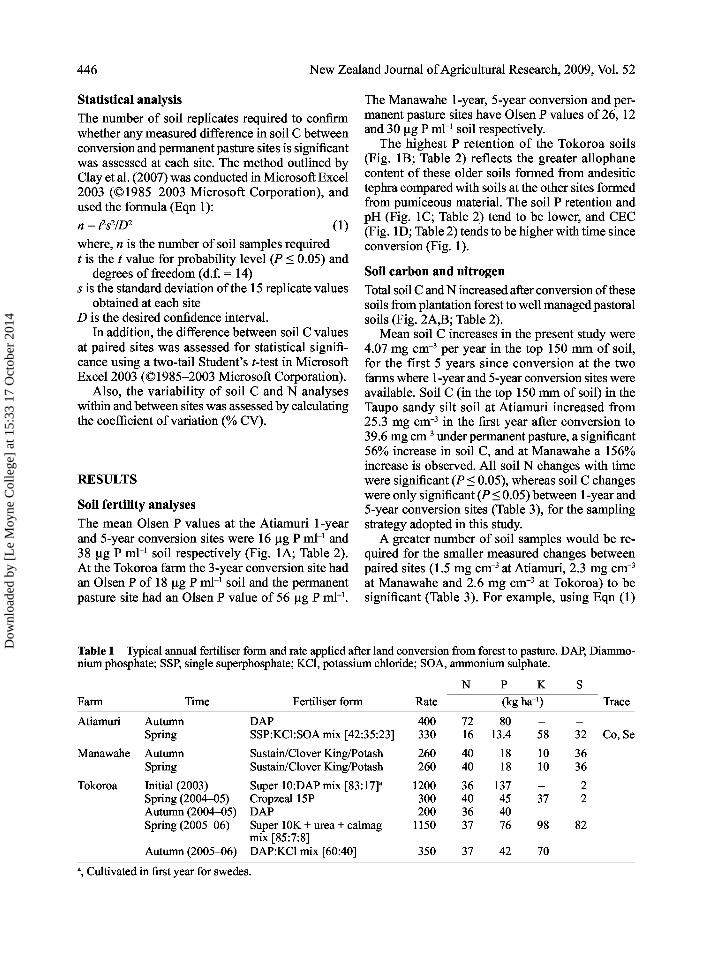
Statistical analysisThe number of soil replicates required to confirmwhether any measured difference in soil C betweenconversion and permanent pasture sites is significantwas assessed at each site. The method outlined byClay et al. (2007) was conducted in microsoft excel2003 (©1985-2003 microsoft Corporation), andused the formula (eqn 1):n = t2s2/D2 (1)
where, n is the number of soil samples requiredt is the t value for probability level (P 0.05) and
degrees of freedom (d.f. = 14)s is the standard deviation of the 15 replicate values
obtained at each siteD is the desired confidence interval.
In addition, the difference between soil C valuesat paired sites was assessed for statistical signifi-cance using a two-tail Student's t-test in microsoftexcel 2003 (©1985-2003 microsoft Corporation).
also, the variability of soil C and N analyseswithin and between sites was assessed by calculatingthe coefficient of variation (% CV).
RESULTS
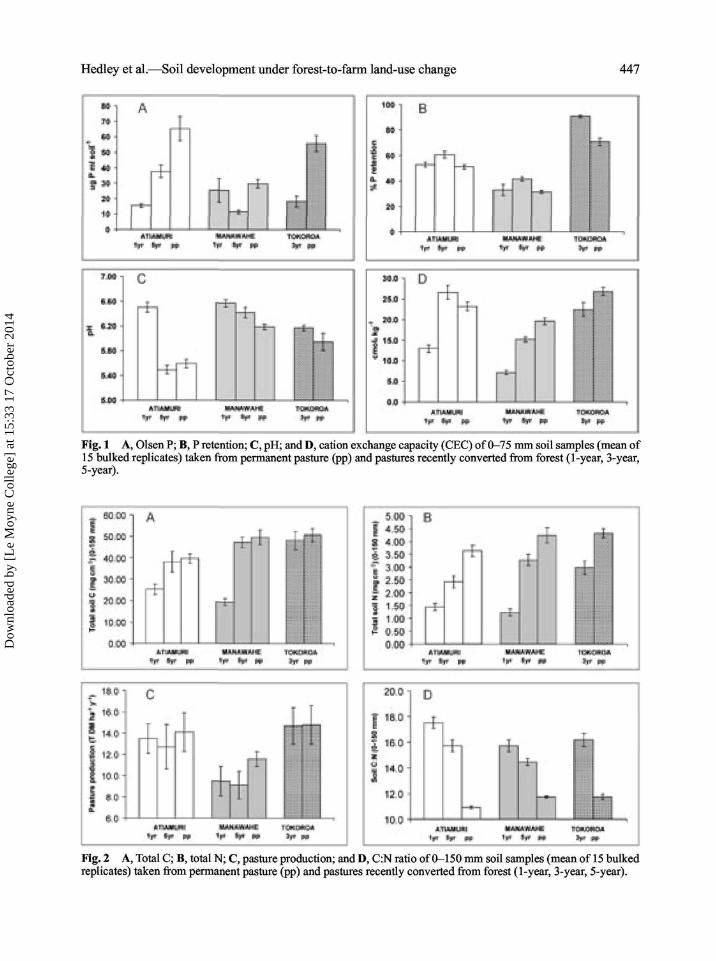
Soil fertility analysesThe mean Olsen P values at the atiamuri 1-yearand 5-year conversion sites were 16 µg P ml–1 and38 µg P ml–1 soil respectively (Fig. 1a; Table 2).a t the Tokoroa farm the 3-year conversion site hadan Olsen P of 18 µg P ml–1 soil and the permanentpasture site had an Olsen P value of 56 µg P ml–1.
The manawahe 1-year, 5-year conversion and per-manent pasture sites have Olsen P values of 26, 12and 30 µg P ml–1 soil respectively.
The highest P retention of the Tokoroa soils(Fig. 1B; Table 2) reflects the greater allophanecontent of these older soils formed from andesitictephra compared with soils at the other sites formedfrom pumiceous material. The soil P retention andpH (Fig. 1C; Table 2) tend to be lower, and CeC(Fig. 1d; Table 2) tends to be higher with time sinceconversion (Fig. 1).
Soil carbon and nitrogenTotal soil C and N increased after conversion of thesesoils from plantation forest to well managed pastoralsoils (Fig. 2a,B; Table 2).
mean soil C increases in the present study were4.07 mg cm–3 per year in the top 150 mm of soil,for the first 5 years since conversion at the twofarms where 1 -year and 5-year conversion sites wereavailable. Soil C (in the top 150 mm of soil) in theTaupo sandy silt soil at atiamuri increased from25.3 mg cm–3 in the first year after conversion to39.6 mg cm–3 under permanent pasture, a significant56% increase in soil C, and at manawahe a 156%increase is observed. al l soil N changes with timewere significant (P 0.05), whereas soil C changeswere only significant (P 0.05) between 1-year and5-year conversion sites (Table 3), for the samplingstrategy adopted in this study.
A greater number of soil samples would be re-quired for the smaller measured changes betweenpaired sites (1.5 mg cm–3 at atiamuri, 2.3 mg cm–3
at manawahe and 2.6 mg cm–3 at Tokoroa) to besignificant (Table 3). For example, using Eqn (1)
Table 1 Typical annual fertiliser form and rate applied after land conversion from forest to pasture. daP, diammo-nium phosphate; SSP, single superphosphate; KCl, potassium chloride; SOa, ammonium sulphate.
N KFarm
atiamuri
manawahe
Tokoroa
Time
autumnSpring
autumnSpring
Initial (2003)Spring (2004-05)autumn (2004-05)Spring (2005-06)
autumn (2005-06)
Fertiliser form
d a PSSP:KCl:SOamix [42:35:23]
Sustain/Clover King/PotashSustain/Clover King/Potash
Super 10:daPmix [83:17]a
Cropzeal 15Pd a PSuper 10K + urea + calmagmix [85:7:8]daP:KCl mix [60:40]
Rate
400330
260260
1200300200
1150
350
7216
4040
36403637
37
(kg ha-1)
8013.4
1818
137454076
42
_58
1010—37
98
70
_32
3636
22
82
Trace
Co, Se
a, Cultivated in first year for swedes.
Dow
nloa
ded
by [
Le
Moy
ne C
olle
ge]
at 1
5:33
17
Oct
ober
201
4
Hedley et al.—Soil development under forest-to-farm land-use change 447
»ft
1 «
m-H
3
rh
T H crin - h
• i - «T
îf
v ion
rhi ril
1
Fig. 1 A, Olsen P; B, P retention; C, pH; and D, cation exchange capacity (CeC) of 0-75 mm soil samples (mean of15 bulked replicates) taken from permanent pasture (pp) and pastures recently converted from forest (1-year, 3-year,5-year).
Fig. 2 A, Total C; B, total N; C, pasture production; and D, C:N ratio of 0-150 mm soil samples (mean of 15 bulkedreplicates) taken from permanent pasture (pp) and pastures recently converted from forest (1-year, 3-year, 5-year).
Dow
nloa
ded
by [
Le
Moy
ne C
olle
ge]
at 1
5:33
17
Oct
ober
201
4
448 New Zealand Journal of agricultural Research, 2009, Vol. 52
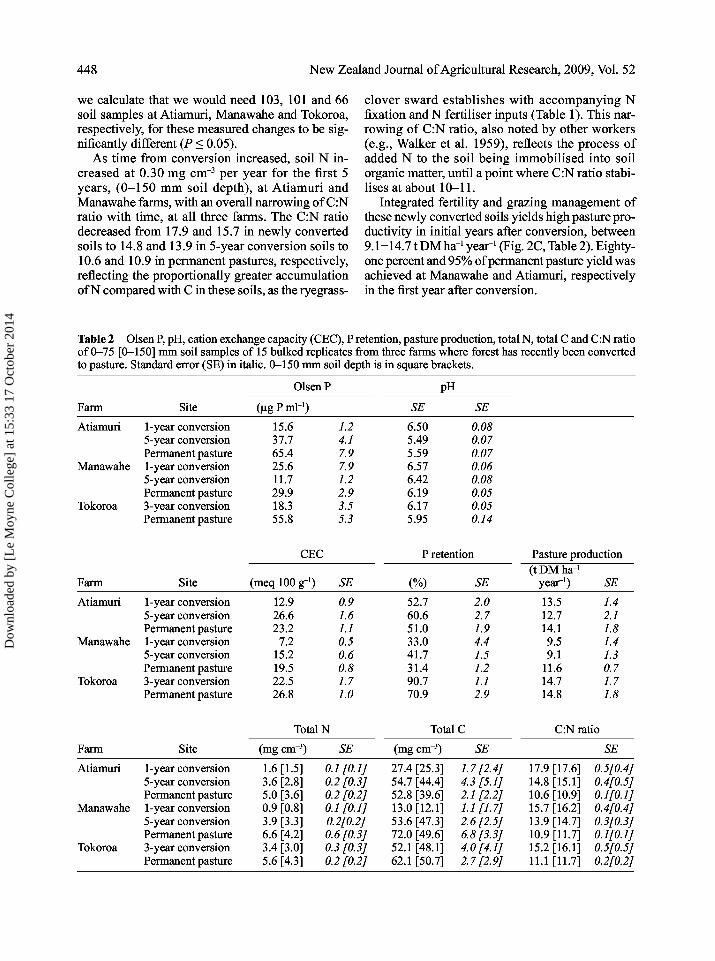
we calculate that we would need 103, 101 and 66soil samples at atiamuri, manawahe and Tokoroa,respectively, for these measured changes to be sig-nificantly different (P 0.05).
a s time from conversion increased, soil N in-creased at 0.30 mg cm–3 per year for the first 5years, (0-150 mm soil depth), at atiamuri andmanawahe farms, with an overall narrowing of C:Nratio with time, at all three farms. The C:N ratiodecreased from 17.9 and 15.7 in newly convertedsoils to 14.8 and 13.9 in 5-year conversion soils to10.6 and 10.9 in permanent pastures, respectively,reflecting the proportionally greater accumulationof N compared with C in these soils, as the ryegrass-
clover sward establishes with accompanying Nfixation and N fertiliser inputs (Table 1). This nar-rowing of C:N ratio, also noted by other workers(e.g., Walker et al. 1959), reflects the process ofadded N to the soil being immobilised into soilorganic matter, until a point where C:N ratio stabi-lises at about 10-11.
Integrated fertility and grazing management ofthese newly converted soils yields high pasture pro-ductivity in initial years after conversion, between9.1 14.7 t DM ha–1 year–1 (Fig. 2C, Table 2). eighty-one percent and 95% of permanent pasture yield wasachieved at manawahe and atiamuri, respectivelyin the first year after conversion.
Table 2 Olsen P, pH, cation exchange capacity (CeC), P retention, pasture production, total N, total C and C:N ratioof 0-75 [0-150] mm soil samples of 15 bulked replicates from three farms where forest has recently been convertedto pasture. Standard error (Se) in italic. 0-150 mm soil depth is in square brackets.
Olsen P pH
Farm Site (µgPml-1) SE SE
atiamuri
manawahe
Tokoroa
1-year conversion5-year conversionPermanent pasture1-year conversion5-year conversionPermanent pasture3-year conversionPermanent pasture
15.637.765.425.611.729.918.355.8
1.24.17.97.91.22.93.55.3
6.505.495.596.576.426.196.175.95
0.080.070.070.060.080.050.050.14
CeC P retention Pasture production
Farm
atiamuri
manawahe
Tokoroa
Site (meq 100 g–1) SE SE(tdmha-1
year–1) SE
1-year conversion5-year conversionPermanent pasture1-year conversion5-year conversionPermanent pasture3-year conversionPermanent pasture
12.926.623.2
7.215.219.522.526.8
0.91.61.10.50.60.81.71.0
52.760.651.033.041.731.490.770.9
2.02.71.94.41.51.21.12.9
13.512.714.19.59.1
11.614.714.8
1.42.11.81.41.30.71.71.8
Total N TotalC C:N ratio
Farm Site (mg cm–3) SE (mg cm–3) SE SE
atiamuri
manawahe
Tokoroa
1-year conversion5-year conversionPermanent pasture1-year conversion5-year conversionPermanent pasture3-year conversionPermanent pasture
1.63.65.00.93.96.63.45.6
[1.5][2.8][3.6][0.8][3.3][4.2][3.0][4.3]
0.1 [0.1]0.2 [0.3]0.2 [0.2]0.1 [0.1]0.2[0.2]0.6 [0.3]0.3 [0.3]0.2 [0.2]
21A [25.3]54.7 [44.4]52.8 [39.6]13.0 [12.1]53.6 [47.3]72.0 [49.6]52.1 [48.1]62.1 [50.7]
1.7 [2.4]4.3 [5.1]2.1 [2.2]1.1 [1.7]2.6[2.5]6.8 [3.3]4.0 [4.1]2.7 [2.9]
17.9 [17.6]14.8 [15.1]10.6 [10.9]15.7 [16.2]13.9 [14.7]10.9 [11.7]15.2 [16.1]11.1 [11.7]
0.5[0.4]0.4[0.5]0.1 [0.1]0.4[0.4]0.3[0.3]0.1 [0.1]0.5[0.5]0.2[0.2]
Dow
nloa
ded
by [
Le
Moy
ne C
olle
ge]
at 1
5:33
17
Oct
ober
201
4
Hedley et al.—Soil development under forest-to-farm land-use change 449
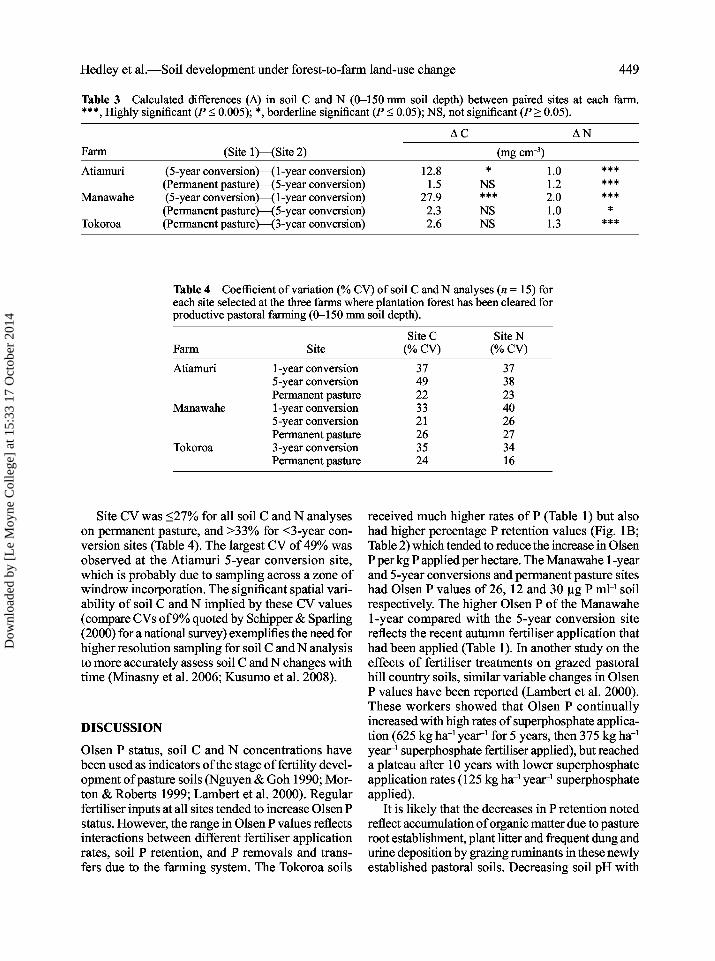
Table 3 Calculated differences ( ) in soil C and N (0-150 mm soil depth) between paired sites at each farm.***, Highly significant (P 0.005); *, borderline significant (P 0.05); NS, not significant (P 0.05).
Farm
atiamuri
manawahe
Tokoroa
(Site 1)—(Site 2)
(5-year conversion)—(1-year conversion)(Permanent pasture)—(5-year conversion)(5-year conversion)—(1-year conversion)(Permanent pasture)—(5-year conversion)(Permanent pasture)—(3-year conversion)
C
12.81.5
27.92.32.6
(mg cm–3)4c
NS4c 4c 4c
NSNS
1.01.22.01.01.3
N
*********
****
Table 4 Coefficient of variation (% CV) of soil C and N analyses (n = 15) foreach site selected at the three farms where plantation forest has been cleared forproductive pastoral farming (0-150 mm soil depth).
Farm
atiamuri
manawahe
Tokoroa
Site
1-year conversion5-year conversionPermanent pasture1-year conversion5-year conversionPermanent pasture3-year conversionPermanent pasture
SiteC(% CV)
3749223321263524
SiteN(% CV)
3738234026273416
Site CV was 27% for all soil C and N analyseson permanent pasture, and >33% for <3-year con-version sites (Table 4). The largest CV of 49% wasobserved at the atiamuri 5-year conversion site,which is probably due to sampling across a zone ofwindrow incorporation. The significant spatial vari-ability of soil C and N implied by these CV values(compare CVs of 9% quoted by Schipper & Sparling(2000) for a national survey) exemplifies the need forhigher resolution sampling for soil C and N analysisto more accurately assess soil C and N changes withtime (minasny et al. 2006; Kusumo et al. 2008).
DISCUSSION
Olsen P status, soil C and N concentrations havebeen used as indicators of the stage of fertility devel-opment of pasture soils (Nguyen & Goh 1990; mor-ton & Roberts 1999; lambert et al. 2000). Regularfertiliser inputs at all sites tended to increase Olsen Pstatus. However, the range in Olsen P values reflectsinteractions between different fertiliser applicationrates, soil P retention, and P removals and trans-fers due to the farming system. The Tokoroa soils
received much higher rates of P (Table 1) but alsohad higher percentage P retention values (Fig. 1B;Table 2) which tended to reduce the increase in OlsenP per kg P applied per hectare. The manawahe 1 -yearand 5-year conversions and permanent pasture siteshad Olsen P values of 26, 12 and 30 µg P ml–1 soilrespectively. The higher Olsen P of the manawahe1-year compared with the 5-year conversion sitereflects the recent autumn fertiliser application thathad been applied (Table 1). In another study on theeffects of fertiliser treatments on grazed pastoralhill country soils, similar variable changes in OlsenP values have been reported (lambert et al. 2000).These workers showed that Olsen P continuallyincreased with high rates of superphosphate applica-tion (625 kg ha–1 year–1 for 5 years, then 375 kg ha–1
year–1 superphosphate fertiliser applied), but reacheda plateau after 10 years with lower superphosphateapplication rates (125 kg ha–1 year–1 superphosphateapplied).
It is likely that the decreases in P retention notedreflect accumulation of organic matter due to pastureroot establishment, plant litter and frequent dung andurine deposition by grazing ruminants in these newlyestablished pastoral soils. decreasing soil pH with
Dow
nloa
ded
by [
Le
Moy
ne C
olle
ge]
at 1
5:33
17
Oct
ober
201
4
450 New Zealand Journal of agricultural Research, 2009, Vol. 52
time reflects the soil acidification process of protonrelease by roots during cycling of C, N and S typicalof legume-based pastures (Hedley et al. 1982).
The different trends observed for accumulationof soil C and soil N are probably due to differ-ent stabilisation processes (Nguyen & Goh 1990).Therefore soil C and N may reach equilibrium afterdifferent periods of time after this land-use change.agricultural soils have an equilibrium soil organiccarbon content for a given land use and managementregime, the time required to change from one equi-librium to another often being in the range of 10 100years, or even longer (Royal Society 2001). Nguyen& Goh (1990) reported increases in soil organiccarbon (SOC) for 15 16 years, and soil nitrogen for21 26 years when up to 376 kg ha–1 year–1 super-phosphate was applied to pastoral soils. metherell(2003) noted, at winchmore, New Zealand, that soilC increased dramatically after initial development(and fertiliser inputs), but after 50 years there wereno further soil C increases with fertiliser input. Infact, he noted a gradual decline in soil C at one hillcountry site (Ballantrae), which he suggested maybedue to an increase in stocking rate and pasture utili-sation as pasture development proceeded. lambertet al. (2000) and Schipper et al. (2007) also suggestthat, with time, intensification of grazing manage-ment may lead to soil C losses in permanent pastoralsoils. Schipper et al. (2007) re-sampled permanentpasture soils (probably converted to pasture between1840 and 1880) for soil C and soil N, sampled 17 30years previously, and inferred significant soil C andN losses over this time (1060 kg C ha–1 year–1, 91kg N ha–1 year–1).
The soil C increases of 156% observed atmanawahe are not as high as the highest increasesof 162 164% observed by Murty et al. (2002).
Beets et al. (2002) and Pinno & Bélanger (2008)discuss the importance of comparing whole soilprofiles when investigating forest to pasture land-usechange effects on soil C pools, because the deeperrooting systems of forest soils will allocate soil C togreater depths than the shallower rooting system ofpasture soils. Beets et al. (2002) found that surfacemineral soil C (0 100 mm) is approximately 4 t Cha–1 higher under pasture than pine forest in theirNew Zealand soils, but discuss reasons to comparesoils to greater depths not only because of soil C al-location to different depths under the two contrastingland uses, but also because of considerable redistri-bution of soil C during forest harvesting operations,with soil disturbance extending beyond the 0.30 mdepth suggested by the Intergovernmental Panel on
Climate Change (IPCC) for C accounting purposes(New Zealand ministry of agriculture & Forestry2009). Our sampling depth to 150 mm capturesthe zone where rapid accumulation of grass rootsoccurs after clover/grass seeding, and provides avaluable comparison with other studies where soilswere sampled to a similar depth (e.g., walker et al.(1959) (0 8 inches, 0 200 mm); Schipper & Spar-ling (2000) (0 100 mm); Nguyen & Goh (1990)(0 75 mm); Scott et al. (2006) (0 200 mm)). Ourstudy does not capture any differences at greaterdepths due to disruption of soil profiles when treesare uprooted, which can invert subsoils above top-soils in localised zones.
analysis of observed soil N changes, in our pres-ent study, using an N balance approach, indicatesthat N fixation rates for these soils are approximately340 kg N ha–1 year–1, with about 80 kg N ha–1 year–1
applied in fertiliser. ledgard & Steele (1992) reportthat N fixed in legume/grass pastures throughout theworld range from 13 to 682 kg N ha–1 year–1, with thecorresponding range for grazed pastures (assessedfor white clover pastures only) as 55 296 kg N ha–1
year–1. Jorgensen & ledgard (1997) comment thatmany of these quoted values for white clover areunderestimates because researchers frequently onlyaccount for N fixed by leaves ignoring the significantcontribution of N fixation by roots. They suggest acorrection factor of 1.7 should be used to accountfor N in the tissue below the cutting height when Nfixation in white clover is estimated by harvestingthe leaves only. This would increase the value of296 kg N ha–1 year–1 to 503 kg N ha–1 year–1. wenoted there was a very high proportion of clover(>50%) established in these new ryegrass-cloverswards which would help to explain high N fixationlevels.
These trends suggest total C is accumulating at arate of approximately 6.11tC ha–1 year–1, and totalN is accumulating at a rate of approximately 0.45 tN ha–1 year–1, in the atiamuri and manawahe soilsfor the first 5 years after conversion (0-150 mm soillayer).
If we assume that the equivalent of half of thepasture production is contributed as below groundorganic matter of which 58% is C, as discussed bywalker et al. ( 1959), then the pasture root mass aloneaccounts for 4.2tC ha–1 year–1. Other initial C inputsprobably include incorporated tree debris, which wasobserved during soil sampling. evidence of windrowincorporation into the atiamuri 5-year conversionsites was noted, where soil C levels varied between9.45 and 76.0 mg cm–3.
Dow
nloa
ded
by [
Le
Moy
ne C
olle
ge]
at 1
5:33
17
Oct
ober
201
4
Hedley et al.—Soil development under forest-to-farm land-use change 451
This research and that reported by others (e.g.,Walker et al. 1959; Jackman 1964; Nguyen & Goh1990) indicates that improving the fertility status ofhigh productivity New Zealand pastoral soils signifi-cantly increases soil C in surface horizons over theinitial decades after land-use change. However, morerecent research has shown that this increase slows toan equilibrium at approximately 50 years (Metherell2003), and soil C increases may be reversed withsustained intensification of grazing management(Lambert et al. 2000; Metherell 2003; Schipper etal. 2007).
The capital dressings of P applied in the first 2years after conversion resulted in optimum or nearoptimum Olsen P test values for pasture establish-ment, within the first 5 years at the Atiamuri (38 ugP ml"1 after 5 years) and Tokoroa farms (18 ug Pml"1 after 3 years) (Fig. 1A). These Allophanic soilsat Tokoroa require a lower optimum Olsen P range(20-30 ug P ml"1) than pumiceous soils (35-45 ugP ml"1) (Morton & Roberts 1999). At the Manawahesite, where pumiceous soils occur, Olsen P valuesremain sub-optimal even in the permanent pasturesite, presumably due to lower inputs of fertiliser.
We assume the marked increases in soil P statusare largely responsible for improved pasture yields,improvedN fixation (as discussed by Nguyen & Goh1990), and therefore a greater return of plant litterand dung to soil resulting in increases in soil C.
Significant apparent levels of soil N and soil Csequestration have been observed in these soils. SoilC sequestration in the initial years after conversionpartially offsets the forest sink capacity which hasbeen lost. Reported growth rates of Pinus radiatain this region are between 22 and 39 m3ha"] year1
(Kimberley et al. 2005). Assuming 25% fresh weightis C, these forests would then accumulate between5.2 and 9.7 t C ha"1 year1, so the recorded soil Csequestration rate of 6.11C ha"1 year1 (to 150 mm)is a significant offset, which could be included in Caccounting systems which assess forest biomass andsoil C changes. A more complete life cycle assess-ment would also include the indirect C costs of, forexample, added fertiliser, methane emissions fromgrazing ruminant animals, and nitrous oxide emis-sions from higher soil N levels.
The ability of these newly converted soils tosequester N suggests a large proportion of the Nfertiliser applications (between 76 and 88 kg N ha"1
year"1) and biologically fixedN is being immobilisedinto soil organic matter. This suggests that N leach-ing losses are slow, in initial years, which warrantsfurther investigation.
Further research is required to confirm theseinitial trends, with sampling to at least 0.3 m soildepth, for the soil changes under investigation. Inaddition, an assessment of soil spatial variability, asdescribed by Minasny et al. (2006), should ideallybe included in any further sampling surveys.
CONCLUSIONS
At all sites in this study where plantation forestry hadbeen converted to clover based pasture, applicationsof phosphatic and nitrogen fertiliser were associatedwith increasing topsoil phosphate status and dif-ferential increases in topsoil soil C andN contentscausing decreases in the C:N ratio of the topsoilorganic matter with time since conversion.
Changes in soil organic matter content causedby conversion were highly variable, reflecting soildisturbance during conversion but also reflectingdifferences in soil physical conditions and pasturevigour.
Significant soil C sequestration rates could beincluded as an offset in any C accounting of thisland-use change.
ACKNOWLEDGMENTS
The research group thanks Ian Elliott, Brian Mathis andTim Mackintosh for allowing this study to be undertakenon their farms.
REFERENCES
Beets PN, Oliver GR, Clinton PW 2002. Soil carbon inpodocarp/hardwood forest, and effects of conver-sion to pasture and exotic pine forest. Environmen-tal Pollution 116: S63-S73.
Blakemore LC, Searle PL, Daly BK 1987. Methods forchemical analysis of soils. New Zealand Soil Bu-reau Scientific Report 80. Wellington. 103 p.
Brodnax R 2007. The next chapter in regional policydevelopment to manage adverse effects of landuse intensification. Proceedings of the FLRCWorkshop Designing Sustainable Farms: Criti-cal Aspects of Soil and Water Management. In:Currie LD, Yates L ed. Occasional Report No.20. Fertilizer and Lime Research Centre, MasseyUniversity, Palmerston North, New Zealand. 8-9February 2007. P. 4.
Dow
nloa
ded
by [
Le
Moy
ne C
olle
ge]
at 1
5:33
17
Oct
ober
201
4
452 New Zealand Journal of Agricultural Research, 2009, Vol. 52
Carle JP, Vuorinen P, Del Lungo A 2002. Status and trendsin global forest plantation development. ForestProducts Journal 52(7/8): 12-23.
Clay DE, Kitchen N, Gregg Carlson C, Kleinjan J, ChangJ 2007. Using historical management to reduce soilsampling errors. Pp. 49-64. In: Pierce FJ, ClayD ed. GIS applications in agriculture. New York,CRC Press. 203 p.
Coleman K, Jenkmson DS 1996. RothC-26.3—a modelfor the turnoverof carbon in soil. In: Powlson DS,Smith P, Smith JU ed. Evaluation of soil organicmatter models. Berlin, Heidelberg, Springer-Ver-lag. Pp. 237-246.
De Klein CAM, Ledgard SF 2005. Nitrous oxide emissionsfrom New Zealand agriculture—key sources andmitigation strategies. Nutrient Cycling in Agro-ecosystems 72: 77-85.
Gomez C, Viscarra Rossel RA, McBratney AB 2008.Soil organic carbon prediction by hyperspectralremote sensing and field vis-NIR spectroscopy:an Australian case study. Geoderma 146(3-4):403-411.
Guo LB, Gifford RM 2002. Soil carbon stocks and landuse change: a meta analysis. Global Change Biol-ogy 8: 345-360.
Hawke MF 2004. Conversion of forestry land back toproduction pasture. In: Proceedings of the NewZealand Grassland Association 66: 157-162.
Hedley MJ, Nye PH, White RE 1982. Plant-inducedchanges in the rhizosphere of rape (BrassicaNapus var. Emerald) seedlings. New Phytologist91:31-44.
Hewitt AE 1998. New Zealand soil classification. LandcareResearch Science Series No. 1. Lincoln, Canter-bury, New Zealand, Manaaki Whenua Press.
ICF International 2008. Final report: Voluntary carbonmarket opportunities—soil carbon managementin New Zealand. MAF, Wellington, New Zealand,30 June 2008. 65 p. Available online at www.maf.-govt.nz/climatechange/reports/voluntary-carbon--mkt-opps/voluntary-carbon-market-opportunities.-pdf (date accessed 14 September 2009).
Jackman RH 1964. Accumulation of organic matter insome New Zealand soils under permanent pasture.Journal of Agricultural Research 7(4): 445-461.
Jorgensen F V, Ledgard SF 1997. Contribution from stolonsand roots to estimates of the total amount of N-2fixed by white clover (Trifolium repens L.). Annalsof Botany 80(5): 641-648.
Kimberley M, West G, Dean M, Knowles L 2005. The300 index—a volume productivity index forradiata pine. New Zealand Journal of Forestry49: 13-18.
Kirschbaum MUF, Guo LB, Gifford RM 2008. Observedand modelled soil carbon and nitrogen changesafter planting a Pinus radiata stand onto for-mer pasture. Soil Biology & Biochemistry 40:247-257.
Kusumo BH, Hedley CB, Hedley M J, Hueni A, Tuohy MP,Arnold GC 2008. The use of reflectance spectros-copy for in situ carbon and nitrogen analysis ofpastoral soils. Australian Journal of Soil Research46: 1-13.
Lambert MG, Clark DA, Mackay AD, Costall DA 2000.Effects of fertilizer application on nutrient statusand organic matter content of hill soils. NewZealand Journal of Agricultural Research 43:127-138.
Landcare Research Environmental Chemistry Laboratory2009. Available online at http://www.landear--eresearchco.nz/services/laboratories/eclab (dateaccessed 14 September 2009).
Ledgard SF, Steele KW 1992. Biological nitrogen fixationin mixed legume/grass pastures. Plant and Soil141: 137-153.
Metherell AK 2003. Management effects on soil carbonstorage in New Zealand pastures. In: Proceed-ings of the New Zealand Grassland Association65: 259-264.
Minasny B, McBratney AB, Mendonca-Santos ML, OdehIOA, Guyon B 2006. Prediction and digital map-ping of soil carbon storage in the Lower NamoiValley. Australian Journal of Soil Research 44(3):233-244.
Molloy L 1998. Soils of the New Zealand landscape—the living mantle. 2nd ed. Lincoln, New Zealand,Manaaki Whenua Press.
Morton JD, Roberts AHC 1999. Fertilizer use on NewZealand sheep and beef farms. Auckland, NewZealand. New Zealand Fertilizer Manufacturer'sAssociation. 36 p.
Murty D, Kirschbaum MUF, McMurtrie RE, McGilvrayH 2002. Does conversion of forest to agriculturalland change soil carbon and nitrogen? A reviewof the literature. Global Change Biology 8:105-123.
New Zealand Climate Change Office 2007. Availableonline at www.climatechange.govt.nz/resources/-reports/projected-balance-emissions-jun06 (dateaccessed 6 August 2009).
New Zealand Ministry of Agriculture and Foresty 2009.http://www.mafgovt.nz/mafhet/rural-nz/sustain--able-resource-use/climate/sinks-acitvities (dateaccessed 14 September 2009).
Dow
nloa
ded
by [
Le
Moy
ne C
olle
ge]
at 1
5:33
17
Oct
ober
201
4
Hedley et al.—Soil development under forest-to-farm land-use change 453
New Zealand Ministry for the Environment 2009. Report-ing under international climate change agreements.Available online at http://www.mfe.govt.nz/issues/-climate/lucas/international-agreements.html (dateaccessed 6 August 2009).
Nguyen ML, Goh KM 1990. Accumulation of soil suphurtractions in grazed pastures receiving long-termsuperphosphate applications. New Zealand Journalof Agricultural Research 33: 111-128.
Pinno BD, Bélanger N 2008. Ecosystem carbon gainsfrom afforestation in the Boreal Transition ecozoneof Saskatchewan (Canada) are coupled with thedevolution of Black Chernozems. Agriculture,Ecosystems & Environment 123(1-3): 56-62.
Post WM, Kwon KC 2000. Soil carbon sequestration andland-use change: processes and potential. GlobalChange Biology 6: 317-327.
Royal Society 2001. The role of land carbon sinks in miti-gating global climate change. Royal Society PolicyDocument 10/01. Royal Society, London. 27 p.
Schipper LA, Sparling GP 2000. Performance of soilcondition indicators across taxonomic groupsand land uses. Soil Science Society of AmericaJournal 64: 300-311.
Schipper LA, Baisden WT, Parfitt RL, Ross C, ClaydonJJ, Arnold G 2007. Large losses of soil C and Nfrom soil profiles under pasture in New Zealandduring the past 20 years. Global Change Biology13(6): 1138-1144.
Scott NA, Tate KR, Ross DJ, ParshotamA2006. Processesinfluencing soil carbon storage following affores-tation of pasture with Pinus radiata at differentstocking densities in New Zealand. AustralianJournal of Soil Research 44(2): 85-96.
Vucetich CG, Wells N 1978. Soils, agriculture and forestryof Waiotapu Region, Central North Island, NewZealand. New Zealand Soil Bureau Bulletin 31,Wellington, New Zealand.
Walker TW, Thapa BK, Adams AFR 1959. Studies onsoil organic matter: 3. Accumulation of carbon,nitrogen, sulfur, organic and total phosphorusin improved grassland soils. Soil Science 87:135-140.
Wheadon M, Adam B 2006. Forest converter's guide:south Waikato/Bay of Plenty forest to farmingproject. Fieldbook of Forest to Farming GroupField Day, 27 April 2006, Sustainable FarmingFund, Wellington.
Dow
nloa
ded
by [
Le
Moy
ne C
olle
ge]
at 1
5:33
17
Oct
ober
201
4