soil – hydrologic conditions after the windstorm 2004 in ...soil – hydrologic conditions after...
TRANSCRIPT
Soil – hydrologic conditions after the windstorm 2004 in the Tatra Mts
Peter Fleischer
Research station and Museum of TANAPTatranska Lomnica

The Tatra Mts huge mountain barrierThe Tatra Mts – huge mountain barrierspecific climate - downslope windsdownslope winds- precipitation regime

Windstorm November 19, 2004Windstorm November 19, 2004
windfall 12 000 havolume 2,3 mil m3wind gusts 230 km/h

History of large-scale windfalls since 1915History of large scale windfalls since 1915
19151941194119812004

Th T t Mt hi tThe Tatra Mts as an anemo-orographic system
-regional scale: spruce –larch forestg p- succesional stage- blocked forest development cycle-no climaxmicrosite scale:-microsite scale:
-pit and mound formation
20 km
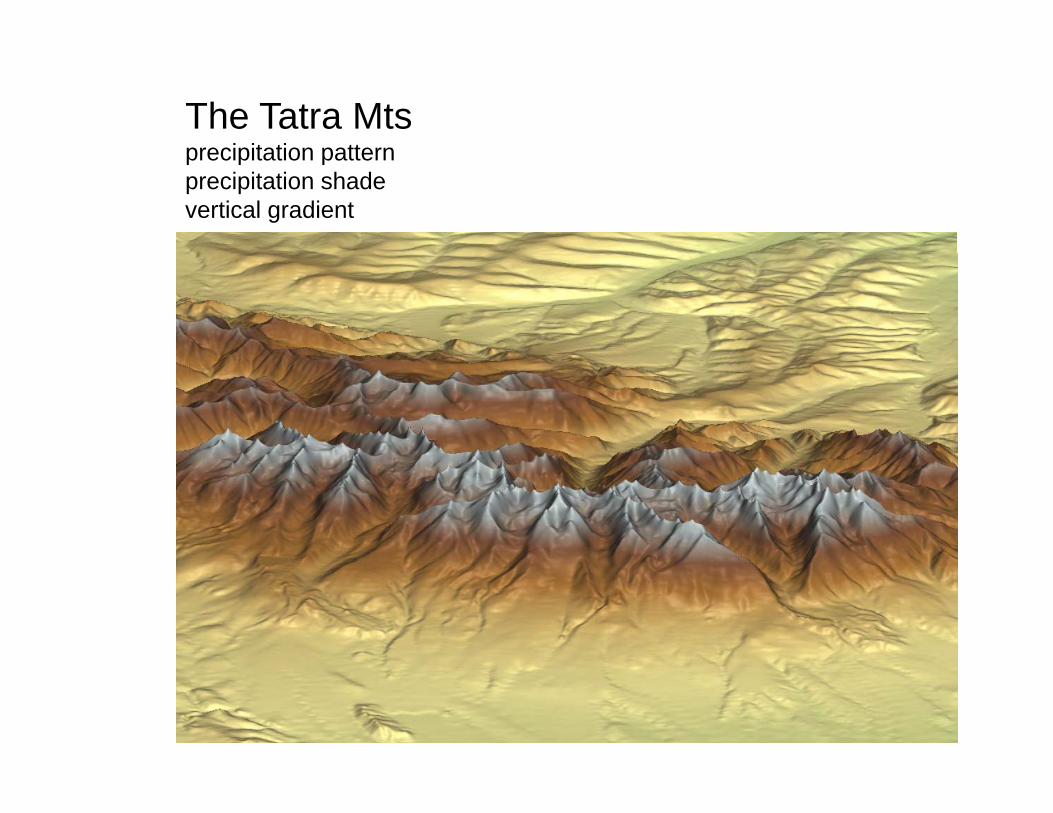
The Tatra Mts precipitation patternprecipitation pattern precipitation shadevertical gradient

• sharp peaksp p
• narrow ridges
• glacial troggs
• U shape valleys
• glacial lakes
Glacial terrain3D model of Mlynica and a Mengusovska valleys Glacial terraina Mengusovska valleys

Soil sampling prior and after 2004 p g p
NEX
REF EXT FIR
soil sampling prior 2004

Categorized Plot for Variable: VAR2 Soil properties (before 2004) on
±Std. Dev.±Std. Err.Mean
VAR1
VAR
2
2
4
6
8
10
12
14
16
k l
Soil properties (before 2004) on current windfallT P d li bi l VAR1Type: Podzolic cambisol
Humic podzolOrganic humus layer 6-10 cm (p 0.05)Stones: A 33%
B 44%Particle size: loam (A, B)Humus cont. : A 16% (2-28)
B 7%B 7%C:N ratio: A 18 (10-22)
B 16pH (H2O) A 3.1 – 4.4 (med 3.7)
B 3.2 – 4.6 (med 4.0)
Confirmed by post-windstorm analysisNovak et al, Simonovicova et al., Gomoryova et al.,MPI Jena

Interception in closed Norway spruce forest
>50%>50%

Soil –hydric conditions as a part of Windfall reserachSoil hydric conditions as a part of Windfall reserach
multidisciplinary ecological research and monitoring on consequences caussed by windfall on forest ecosystems and their surrounding under different management
FE componentsatmospheresoilsoil watervegetationfauna
i imicroorganisms
H:humus mineralisation and reductionnutrient leaching, water quality, Nerosionextremal hydric regime, moist-wet, dry-very drytop soil overheatingtop soil overheatingdeeper and longer soil frost

Potential evapotranspiration
200 Rain
p p
100
150
200 Rain
PE
50
100
0
EX
T 5
EX
T 6
EX
T 7
EX
T 8
NE
X 5
NE
X 6
NE
X 7
NE
X 8
FIR
5FI
R 6
FIR
7FI
R 8
RE
F 5
RE
F 6
RE
F 7
RE
F 8
E E E E N N N N R R R R
based on 2009 (V-VIII) monthly avg AT and RH (Ivanov´s method)( ) y g ( )

S il t t d i tSoil temperature and moisture
each site equiped with:q p- thermometer (PT100, PT108)in 8 and 16 cm depth-theta Delta ML2x, impedance meth.
manual verification - precise laboratory thermometer-portable ML2x-gravimetry

Soil moisture (% V) in 2009, all localities50
NEX16 NEX8 REF8 REF16
FIR8 FIR16 EXT8 EXT16
Soil moisture (% V) in 2009, all localities
40
FIR8 FIR16 EXT8 EXT16
40
30
201 12 23 34 45 56 67 78 89 100 111 122 133 144 155 166 177 188 199 210 221 232 243 254 265

FIR 2009 SM %(V) vs G
50 50
FIR 2009 SM %(V) vs G FIR 2009 SM16FIR 2009 SM8
30
40
30
40
50
prior humus
10
20
119 141 156 169 188 214 236 266
SM8 G
SM8 e
10
20
119 141 156 169 188 214 236 266
SM16 G
SM16 econtent corr
40
50
40
50after humus content corr
10
20
30
SM8 G
SM8 e10
20
30
SM16 G
SM16 e
119 141 156 169 188 214 236 266 119 141 156 169 188 214 236 266

EXT 2009 SM8 SM16 d R iEXT 2009 SM8, SM16 and Rain50
45
50SM8 avgSM16 avg
4030
35
40SM16 avgR sum
30
10
15
20
25
20
120
127
134
141
148
155
162
169
176
183
190
197
204
211
218
225
232
239
246
253
260
0
5
10
dense gras vegetationA loamB lB loam

NEX 2009 SM %(V) and R
50
6050
30
4040
mm
SM
%V
0
10
20
20
30NEX8
NEX16
rain
0201 16 31 46 61 76 91 106 121 136 151 166 181 196 211 226 241 256
DOY
sparce vegetationsparce vegetationA – loamB1- sandy loamB2- sandy

1000Soil moisture verification
EXT
400
600
800
port
able
0
200
400
0 200 400 600 800 1000
p
0 200 400 600 800 1000fixed
1000 1000NEX REF
600
800
1000
tabl
e 600
800
1000
rtabl
e
NEX REF
0
200
400port
0
200
400pror
00 200 400 600 800 1000
fixed
00 200 400 600 800 1000
fixed

1 2 3 Av sd
2 0b 68 8 9270b 51 68 58 59 7
270c 74 53 75 67 10
270d 57 70 69 65 6Tower
Aquater300(capacitance)Saturation %
270e 66 91 86 81 11
270f 55 47 67 56 8
270h 58 64 58 60 3
Tower
8 16 32
32 39 39
REF 24 08 2009270h 58 64 58 60 3
330b 78 55 57 63 10
330c 83 62 58 68 11
330d 85 70 88 81 8tow 32 39 39
por 39 34 35
34 34 34
330d 85 70 88 81 8
330e 76 77 66 73 5
330f 72 50 52 58 10Delta theta(impedance)
41 35 31
35 37 40
avg 37 36 35
90b 69 64 69 67 3
90c 60 63 59 61 2
150c 66 85 66 72 9
(impedance)ML2X
avg 37 36 35
Grav 39 35 30
150c 66 85 66 72 9
210b 49 82 69 66 14

100
Soil saturation
60
80
AVG
SD
Soil saturation
REF site
40
60
B C B C B C B C D E F G B C D E F B C D E F G
30 90 150 210 270 330
100
80
AVG
SDmoisture heterogeneitya key for natural succession
40
60
B C C B C D E F G B C D E F G B C D E F
90 150 210 270 330

Regeneration – an indicator of statusRegeneration an indicator of status improvement

FIR 2005-2008 vegetation succesionFIR 2005 2008 vegetation succesion
20
30
20
‐10
0
10
118
536
955
373
792
111
0512
8914
7316
5718
4120
2522
0923
9325
7727
6129
4531
2933
1334
97
HF…
‐20

Mi li ti d N t i t l hi
Field with Crop W
Mineralisation and Nutrient leaching
Field with Crop
SIA fill d i h
Water+
Target Chemical
SIA filled with aMixture of specific Adsorbents and inert mineral Materials
SIA Target Chemicals are adsorbedand accumulated during aMeasurement Period
Soil Profile
pure Water
23 Terraquat, Koln

Studeny p. creek 2007 ions conc.S
Stream water chemistry
4567
l
ST 7in
ST 7out
y
01234
mg/
ion concentration measured bi-weekly showed i d NO3 NH4 SO2 K Na Ca Mg
Studeny p creek index out/in
increased values when passing windfall in 2007index of enrichement
2007 and 2008
56
ST 2007
index of enrichement 1.5 – 5.5.
In 2008 notable decline, i d 1 1 2 3
1234
inde
x ST 2008index 1.1-2.3
0NO3 NH4 SO2 K Na Ca Mg

Urgent problemsUrgent problems

1 6
Precipitation and air temperature lindex 1899-2007
1,4
1,6
1
1,2
0,6
0,8
0,4
1899
1904
1909
1914
1919
1924
1929
1934
1939
1944
1949
1954
1959
1964
1969
1974
1979
1984
1989
1994
1999
2004

Growing season temperature trend, T. Lomnica 830 m a.s.l
y = 0,0051x + 13,077R2 = 0,035814,5
15,0
15,5
13 0
13,5
14,0
,
12,0
12,5
13,0
11,0
11,5
97 02 07 12 17 22 27 32 37 42 47 52 57 62 67 72 77 82 87 92 97 02
189
190
190
191
191
192
192
193
193
194
194
195
195
196
196
197
197
198
198
199
199
200