soil hydrologic conditions after the windstorm 2004 … · soil –hydrologic conditions after the...
TRANSCRIPT

Soil – hydrologic conditions
after the windstorm 2004 in the Tatra Mts
Peter Fleischer
Research station and Museum of TANAP
Tatranska Lomnica

The Tatra Mts – huge mountain barrier
specific climate
- downslope winds
- precipitation regime

Windstorm November 19, 2004
windfall 12 000 ha
volume 2,3 mil m3
wind gusts 230 km/h

History of large-scale windfalls since 1915
1915
1941
1981
2004

20 km
The Tatra Mts as an anemo-orographic system
-regional scale: spruce –larch forest
- succesional stage
- blocked forest development cycle
-no climax
-microsite scale:
-pit and mound formation

The Tatra Mts precipitation pattern
precipitation shade
vertical gradient

Glacial terrain
• sharp peaks
• narrow ridges
• glacial troggs
• U shape valleys
• glacial lakes
3D model of Mlynica and
a Mengusovska valleys

soil sampling prior 2004
REF EXT FIR
NEX
Soil sampling prior and after 2004

±Std. Dev .
±Std. Err.
Mean
Categorized Plot f or Variable: VAR2
VAR1
VA
R2
2
4
6
8
10
12
14
16
k l
Soil properties (before 2004) on
current windfall
Type: Podzolic cambisol
Humic podzol
Organic humus layer 6-10 cm (p 0.05)
Stones: A 33%
B 44%
Particle size: loam (A, B)
Humus cont. : A 16% (2-28)
B 7%
C:N ratio: A 18 (10-22)
B 16
pH (H2O) A 3.1 – 4.4 (med 3.7)
B 3.2 – 4.6 (med 4.0)
Confirmed by post-windstorm analysis
Novak et al, Simonovicova et al., Gomoryova et al.,
MPI Jena

Interception in closed Norway spruce forest
>50%
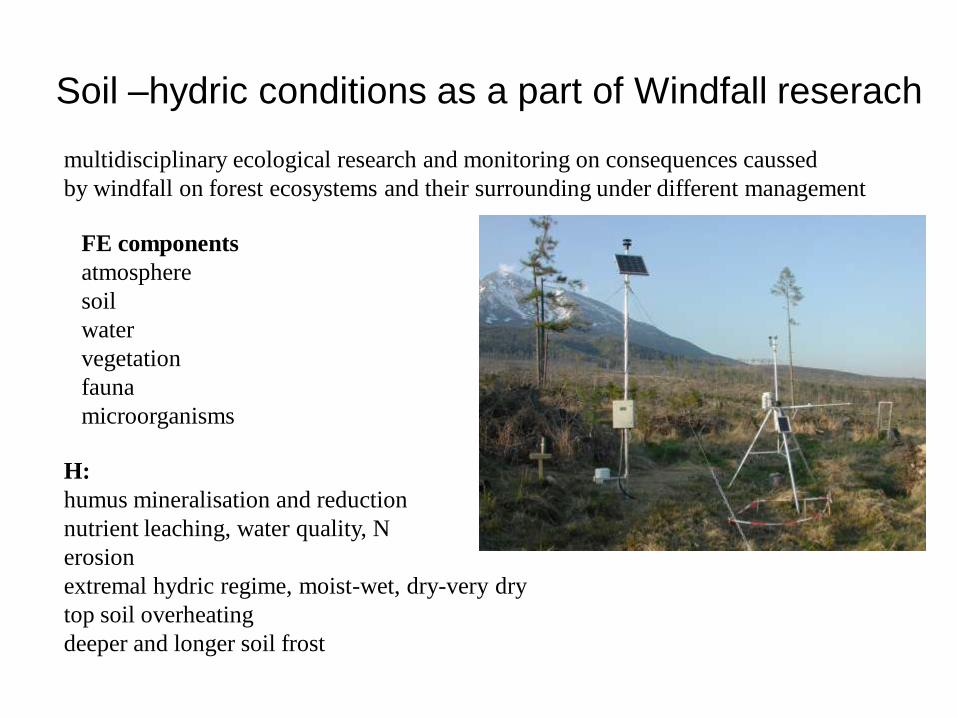
Soil –hydric conditions as a part of Windfall reserach
multidisciplinary ecological research and monitoring on consequences caussed
by windfall on forest ecosystems and their surrounding under different management
FE components
atmosphere
soil
water
vegetation
fauna
microorganisms
H:
humus mineralisation and reduction
nutrient leaching, water quality, N
erosion
extremal hydric regime, moist-wet, dry-very dry
top soil overheating
deeper and longer soil frost

0
50
100
150
200E
XT
5
EX
T 6
EX
T 7
EX
T 8
NE
X 5
NE
X 6
NE
X 7
NE
X 8
FIR
5
FIR
6
FIR
7
FIR
8
RE
F 5
RE
F 6
RE
F 7
RE
F 8
Rain
PE
based on 2009 (V-VIII) monthly avg AT and RH (Ivanov´s method)
Potential evapotranspiration

Soil temperature and moisture
each site equiped with:
- thermometer (PT100, PT108)
in 8 and 16 cm depth
-theta Delta ML2x, impedance meth.
manual verification
- precise laboratory thermometer
-portable ML2x
-gravimetry

20
30
40
50
1 12 23 34 45 56 67 78 89 100 111 122 133 144 155 166 177 188 199 210 221 232 243 254 265
NEX16 NEX8 REF8 REF16
FIR8 FIR16 EXT8 EXT16
Soil moisture (% V) in 2009, all localities

10
20
30
40
50
119 141 156 169 188 214 236 266
SM8 G
SM8 e
10
20
30
40
50
119 141 156 169 188 214 236 266
SM16 G
SM16 e
10
20
30
40
50
119 141 156 169 188 214 236 266
SM8 G
SM8 e10
20
30
40
50
119 141 156 169 188 214 236 266
SM16 G
SM16 e
FIR 2009 SM %(V) vs G FIR 2009 SM16FIR 2009 SM8
prior humus
content corr
after humus
content corr

EXT 2009 SM8, SM16 and Rain
dense gras vegetation
A loam
B loam
20
30
40
501
20
12
7
13
4
14
1
14
8
15
5
16
2
16
9
17
6
18
3
19
0
19
7
20
4
21
1
21
8
22
5
23
2
23
9
24
6
25
3
26
0
0
5
10
15
20
25
30
35
40
45
50SM8 avg
SM16 avg
R sum

0
10
20
30
40
50
60
20
30
40
50
1 16 31 46 61 76 91 106 121 136 151 166 181 196 211 226 241 256
mm
SM
%V
DOY
NEX8
NEX16
rain
NEX 2009 SM %(V) and R
sparce vegetation
A – loam
B1- sandy loam
B2- sandy

0
200
400
600
800
1000
0 200 400 600 800 1000
fixed
po
rtab
le
0
200
400
600
800
1000
0 200 400 600 800 1000
fixed
port
ab
le
0
200
400
600
800
1000
0 200 400 600 800 1000
fixed
pro
rtab
le
Soil moisture verificationEXT
NEX REF
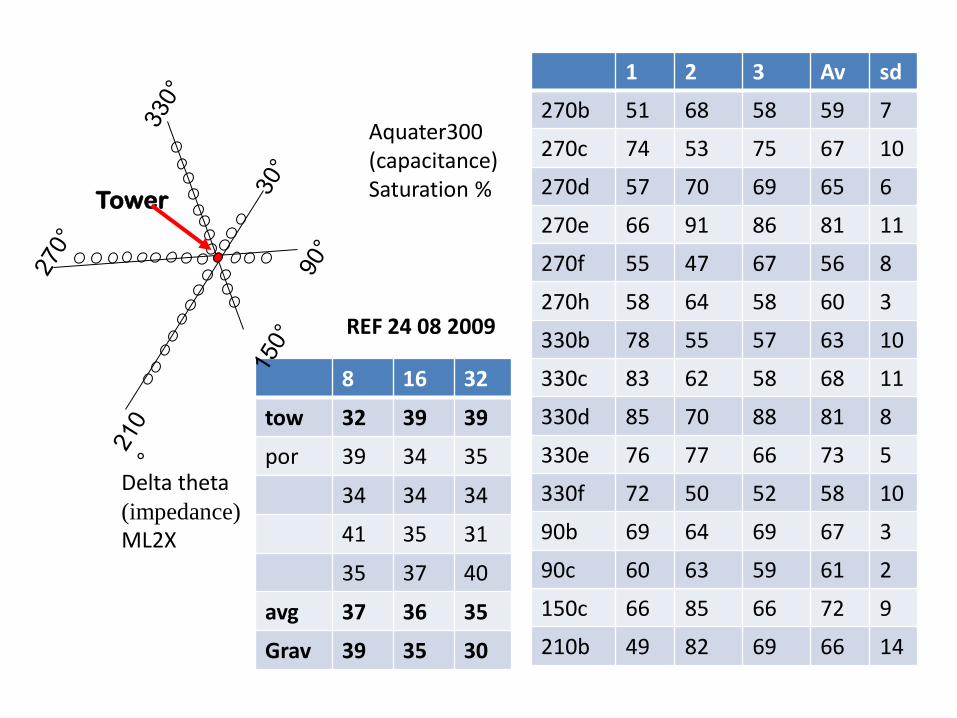
8 16 32
tow 32 39 39
por 39 34 35
34 34 34
41 35 31
35 37 40
avg 37 36 35
Grav 39 35 30
REF 24 08 2009
1 2 3 Av sd
270b 51 68 58 59 7
270c 74 53 75 67 10
270d 57 70 69 65 6
270e 66 91 86 81 11
270f 55 47 67 56 8
270h 58 64 58 60 3
330b 78 55 57 63 10
330c 83 62 58 68 11
330d 85 70 88 81 8
330e 76 77 66 73 5
330f 72 50 52 58 10
90b 69 64 69 67 3
90c 60 63 59 61 2
150c 66 85 66 72 9
210b 49 82 69 66 14
Tower
Aquater300(capacitance)Saturation %
Delta theta(impedance)
ML2X

40
60
80
100
B C B C B C B C D E F G B C D E F B C D E F G
30 90 150 210 270 330
AVG
SD
40
60
80
100
B C C B C D E F G B C D E F G B C D E F
90 150 210 270 330
AVG
SD
Soil saturation
REF site
moisture heterogeneity
a key for natural succession

Regeneration – an indicator of status
improvement

FIR 2005-2008 vegetation succesion
-20
-10
0
10
20
30
118
536
955
373
792
111
0512
8914
7316
5718
4120
2522
0923
9325
7727
6129
4531
2933
1334
97
HF…

23
Field with Crop
SIA
Soil Profile
SIA filled with a
Mixture of specific
Adsorbents and inert
mineral Materials
Water
+
Target Chemical
pure Water
Target Chemicals are adsorbed
and accumulated during a
Measurement Period
Mineralisation and Nutrient leaching
Terraquat, Koln

Studeny p. creek 2007 ions conc.
0
1
2
3
4
5
6
7
NO3 NH4 SO2 K Na Ca Mg
mg
/l
ST 7in
ST 7out
Stream water chemistry
Studeny p creek index out/in
2007 and 2008
0
1
2
3
4
5
6
NO3 NH4 SO2 K Na Ca Mg
ind
ex
ST 2007
ST 2008
ion concentration
measured
bi-weekly showed
increased
values when passing
windfall in 2007
index of enrichement
1.5 – 5.5.
In 2008 notable decline,
index 1.1-2.3

Urgent problems

0,4
0,6
0,8
1
1,2
1,4
1,6
18
99
19
04
19
09
19
14
19
19
19
24
19
29
19
34
19
39
19
44
19
49
19
54
19
59
19
64
19
69
19
74
19
79
19
84
19
89
19
94
19
99
20
04
Precipitation and air temperature lindex 1899-2007
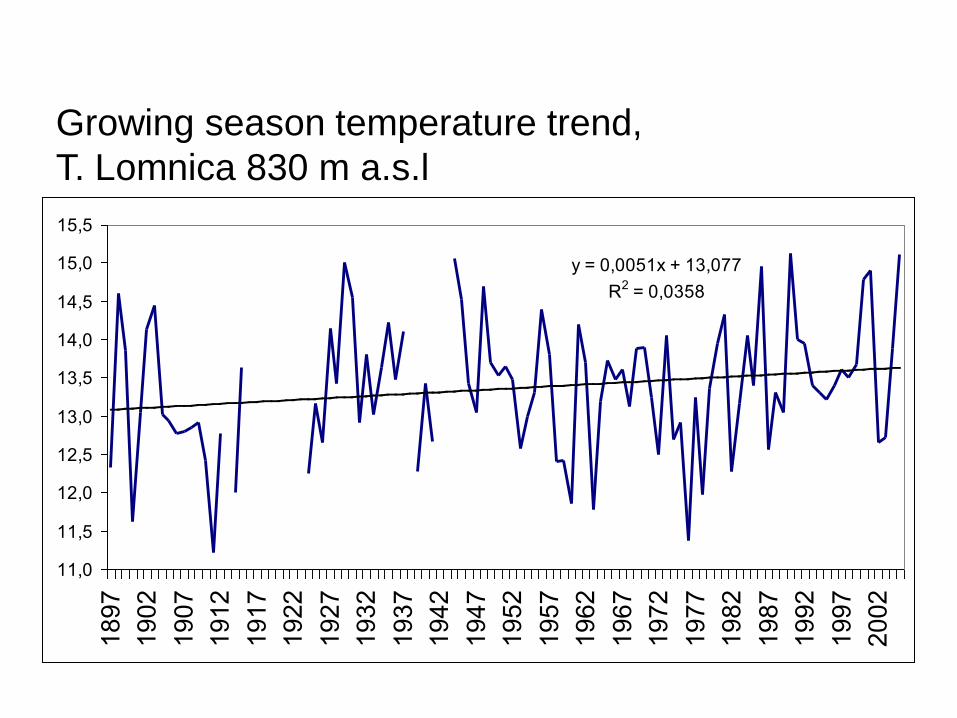
y = 0,0051x + 13,077
R2 = 0,0358
11,0
11,5
12,0
12,5
13,0
13,5
14,0
14,5
15,0
15,5
1897
1902
1907
1912
1917
1922
1927
1932
1937
1942
1947
1952
1957
1962
1967
1972
1977
1982
1987
1992
1997
2002
Growing season temperature trend,
T. Lomnica 830 m a.s.l