integration of soil moisture remote sensing and hydrologic...
TRANSCRIPT

Integration of soil moisture remote sensing and hydrologicmodeling using data assimilation
Paul R. Houser,1,2 W. James Shuttleworth,1 James S. Famiglietti,3
Hoshin V. Gupta,1 Kamran H. Syed,4 and David C. Goodrich4
Abstract. The feasibility of synthesizing distributed fields of soil moisture by the novelapplication of four-dimensional data assimilation (4DDA) applied in a hydrological modelis explored. Six 160-km2 push broom microwave radiometer (PBMR) images gatheredover the Walnut Gulch experimental watershed in southeast Arizona were assimilated intothe Topmodel-based Land-Atmosphere Transfer Scheme (TOPLATS) using severalalternative assimilation procedures. Modification of traditional assimilation methods wasrequired to use these high-density PBMR observations. The images were found to containhorizontal correlations that imply length scales of several tens of kilometers, thus allowinginformation to be advected beyond the area of the image. Information on surface soilmoisture also was assimilated into the subsurface using knowledge of the surface-subsurface correlation. Newtonian nudging assimilation procedures are preferable to othertechniques because they nearly preserve the observed patterns within the sampled regionbut also yield plausible patterns in unmeasured regions and allow information to beadvected in time.
1. Introduction
Soil moisture is most often described as the water in the rootzone that can interact with the atmosphere through evapo-transpiration and precipitation. Because soil moisture links thehydrologic cycle and the energy budget of land surfaces byregulating latent heat fluxes, accurate assessment of the spatialand temporal variation of soil moisture is important for thestudy, understanding, and management of surface biogeophysi-cal processes. Given the crucial role of soil moisture in landsurface processes, it should be monitored with the same accu-racy and frequency as other important environmental vari-ables. However, because in situ soil moisture measurementsare generally expensive and often problematic, no large-areasoil moisture networks exist to measure soil moisture at thehigh frequency, multiple depths, and fine spatial resolutionthat is required for various applications.
Remote sensing of soil moisture is limited by errors intro-duced by soil type, landscape roughness, vegetation cover, andinadequate coverage in both space and time. Alternatively,many reliable hydrologic models are available for calculatingsoil moisture, but these are prone to error in both structureand parameterization. It has been suggested [Wei, 1995] thatthe best, operational soil moisture estimates might be obtainedthrough a synthesis between remote-sensing data and hydro-logic modeling. Remote-sensing data, when combined withnumerical simulation and other data, should provide estimatesof soil moisture with higher spatial and temporal resolution
and less error than either remotely sensed data or model sim-ulations separately.
The focus of this research is a prototype system that usesfour-dimensional data assimilation (4DDA) methods appliedin a macroscale land hydrology model to generate soil moisturefields on regular space and time intervals. The resulting modelis a first step toward a new generation of meteorological mod-els that have the capability to assimilate both atmospheric andhydrologic observations for an improved understanding of theinteraction between weather and hydrological processes.
2. Methods2.1. TOPLATS
The Topmodel [Beven and Kirby, 1979]–based Land Atmo-sphere Transfer Scheme (TOPLATS) [Famiglietti and Wood,1994] was used in this study. However, any high-quality spa-tially distributed soil-vegetation-atmosphere transfer scheme(SVATS) could have been used. The TOPLATS incorporatessimple representations of atmospheric forcing, vertical soilmoisture transport, plant-controlled transpiration, intercep-tion, evaporation, infiltration, surface runoff, and sensible andground heat fluxes. The subsurface soil column was originallypartitioned into root and transmission zone layers in theTOPLATS. However, passive microwave remote sensing issensitive to moisture only near the soil surface [Jackson, 1993],so a third surface soil layer was added for this study (J. S.Famiglietti et al., manuscript in preparation, 1998).
2.2. Data Assimilation Methods
The TOPLATS was modified to allow the assimilation of soilmoisture and other state variables. For ease of explanation, thefollowing description assumes assimilation of observed surfacesoil moisture uo. However, with modifications specific to thestate variable, the following description can be used to assim-ilate other variables, such as surface temperature.
After each TOPLATS time step, coincidental observations
1Department of Hydrology and Water Resources, University of Ar-izona, Tucson.
2Now at NASA Goddard Space Flight Center, Greenbelt, Maryland.3Department of Geological Sciences, University of Texas at Austin.4Agricultural Research Service, U.S. Department of Agriculture,
Tucson, Arizona.
Copyright 1998 by the American Geophysical Union.
Paper number 1998WR900001.0043-1397/98/1998WR900001$09.00
WATER RESOURCES RESEARCH, VOL. 34, NO. 12, PAGES 3405–3420, DECEMBER 1998
3405
or observations within a predefined temporal window of thecurrent model time step are sought. It was found that whenthere is a precipitation event between the time of an observa-tion and the model time, assimilation of that observation isundesirable because of the very different surface conditionscaused by the precipitation event.
If the observations fall outside the TOPLATS soil moisturerange, defined by the saturated soil moisture us and the resid-ual soil moisture ur they are reassigned as follows:
uo 5 u r 1 0.1% uo # u r (1)
uo 5 u s 2 0.1% uo $ u s (2)
It was found that this applied to less than 5% of the PBMRobservations. If a large number of observations fall outside themodels’ allowed range, it is most probably an indication thatthe models’ allowed soil moisture range is incorrect or thatthere is an observational error.
A control and a direct insertion simulation are used as thebasis for evaluating the data assimilation runs. A control sim-ulation (i.e., the simulation without data assimilation) can beconsidered an extreme case, in which it is assumed that theobservations contain no information. The other extreme isdirect insertion, where it is assumed that the model contains noinformation. In this case, the model prediction of surface soilmoisture, usz, is replaced with a soil moisture observation uo
whenever an observation is available, i.e.,
u sz 5 uo if uo observed (3)
With direct insertion, no data are assimilated outside the re-gion where observations are available; therefore any advectionof information is accomplished only via the model physics insubsequent model integrations.
2.3. Statistical Correction Assimilation Method
In the “statistical correction” data assimilation technique,the modeled surface soil moisture mean and standard devia-tion are adjusted to match the observed mean and standarddeviation. The method assumes that the statistics of the obser-vations are perfect, which is arguably more reasonable thanassuming that each observation is perfect, as in direct insertion.It also assumes that the patterns predicted by the model arecorrect but that the predicted surface soil moisture statisticscontain bias. As with direct insertion, advection of informationinto deeper soil layers is accomplished solely through themodel physics.
The statistical correction method was implemented as fol-lows. The mean u# o and standard deviation su
o of the soil mois-ture observations and model predictions were determined, andthe model’s standard deviation su was adjusted to the obser-vation standard deviation as follows:
u i 5su
o
su
u i for all i (4)
where u i was the field of model soil moisture. The mean of themodel-adjusted field of soil moisture states was redeterminedfollowing the adjustment of the standard deviation, and themean of the model field, u# , was adjusted to match the obser-vation field mean; thus
u i 5 u i 2 ~u 2 uo! for all i (5)
2.4. Newtonian Nudging Assimilation Method
Newtonian nudging relaxes the model state toward the ob-served state in a manner that resembles the process of New-tonian cooling. This relaxation is performed by adding a termto the prognostic equation that is proportional to the differ-ence between the two states. These small forcing terms grad-ually correct the model fields, which are assumed to remain inapproximate equilibrium at each time step [Stauffer and Sea-man, 1990]. In this way the model can be nudged towardregularly spaced observations, or toward randomly spaced ob-servations during a period of time and space.
2.5. Nudging Towards a Gridded Analysis
A gridded analysis is an interpolation of observation data tothe model grid. When this is available, the “nudging to theanalysis” method described by Stauffer and Seaman [1990] isused:
u
t 5 F~u , x , t! 1 GuWu~ x , t!«u~ x!~u9o 2 u ! (6)
The model’s forcing terms are represented by F , u9o is theobservation at the model grid, and t is time. Gu is the nudgingfactor that determines the magnitude of the nudging termrelative to all other model processes, while the four-dimensional weighting function Wu specifies its spatial andtemporal variation. The analysis quality factor « varies between0 and 1 and is based on the quality and distribution of theobservations. Equation (6) is implemented for all threeTOPLATS soil layers, with the weighting factor decreasingwith depth and time using the four-dimensional weightingfunction described later. The horizontal weighting function isalways unity, because the only observation considered was thatlying directly on the model grid that is being nudged.
2.6. Nudging to Individual Observations
When observations are randomly spaced, the technique of“nudging to individual observations,” as described by Staufferand Seaman [1990], is used. In this method the differencebetween the simulated and observed state is determined at thelocation of the observation then interpolated back onto themodel grid. The model’s predictive equation is therefore
u
t 5 F~u , x , t! 1 Gu
F Oi51
N
Wi2~ x , t!g i~uo 2 u9! iGOi51
N
Wi~ x , t!
(7)
where the subscript i denotes the ith observation of N that lieswithin a preset radius, uo is the locally observed value of u, andu9 is the model’s prognostic variable interpolated in three di-mensions to the location of the observation. The observationalquality factor g varies from 0 to 1 and accounts for character-istic errors in measurement systems and representativeness.The four-dimensional weighting function (described below)accounts for the separation distance, both spatially and tem-porally, of the ith observation from a given grid point at a giventime. Again, this nudging technique was applied vertically to allmodel soil layers.
2.7. Temporal and Spatial Weighting Functions
The Newtonian nudging weighting function W at time t andlocation x for each observation I is a combination of the hor-
HOUSER ET AL.: USE OF DATA ASSIMILATION IN SOIL MOISTURE MODEL3406
izontal weighting function wxy, the vertical weighting functionwz, and the temporal weighting function wt; thus
W~ x , t! ; wxywzwt (8)
For the analysis-nudging technique, where observations areavailable for each grid in the remotely sensed area, the hori-zontal weighting function wxy is unity. In the case of the ob-servation-nudging technique, the horizontal weighting functioncan be defined by a Cressman-type horizontal weighting func-tion as
wxy 5R2 2 D2
R2 1 D2 , 0 # D # R (9)
wxy 5 0, D . R (10)
where R is the radius of influence, and D is the distance fromthe ith observation to the grid point. The vertical weightingfunction, wz, is also a distance weighting function, followingSeaman [1990]; thus
wz 5 1 2uzobs 2 z u
Rz, uzobs 2 z u # Rz (11)
wz 5 0, uzobs 2 z u . Rz (12)
where Rz is the vertical radius of influence, and zobs is thevertical position of the ith observation. The temporal weight-ing function is defined as
wt 5 1, ut 2 tou ,t
4 (13)
wt 5~t 2 ut 2 tou!
t /4 ,t
4 # ut 2 tou # t (14)
wt 5 0, ut 2 tou . t (15)
where t is the model-relative time, t0 is the model-relative timeof the ith observation, and t is the half period of a predeter-mined observation-influencing time window.
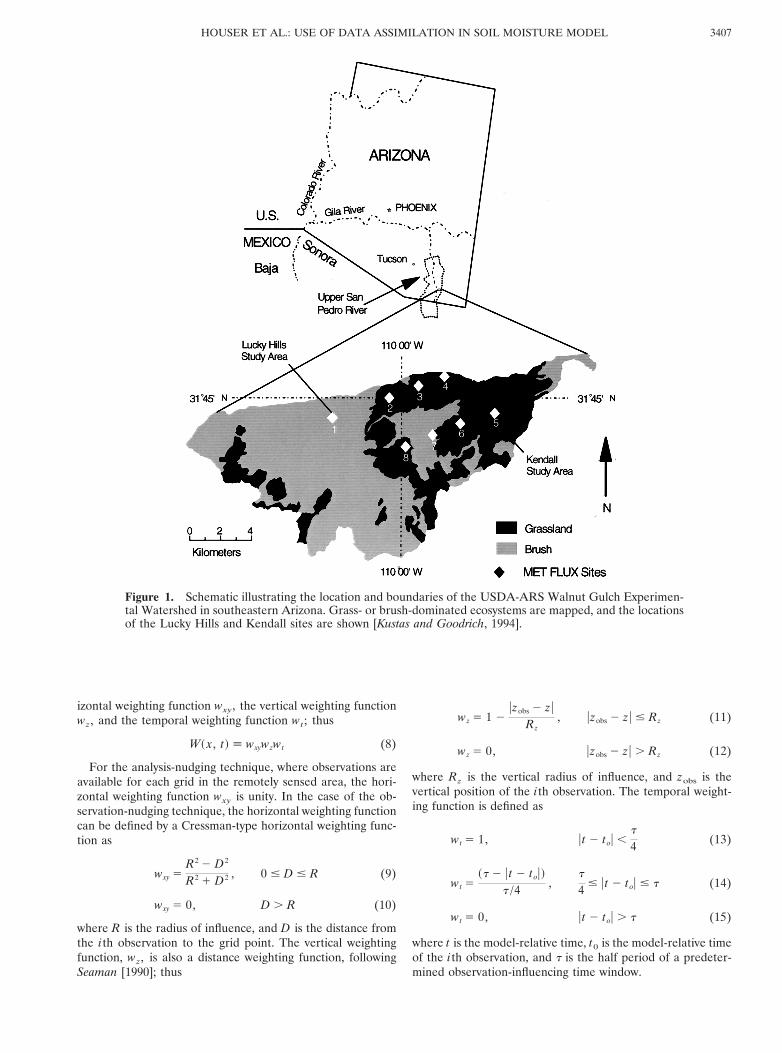
Figure 1. Schematic illustrating the location and boundaries of the USDA-ARS Walnut Gulch Experimen-tal Watershed in southeastern Arizona. Grass- or brush-dominated ecosystems are mapped, and the locationsof the Lucky Hills and Kendall sites are shown [Kustas and Goodrich, 1994].
3407HOUSER ET AL.: USE OF DATA ASSIMILATION IN SOIL MOISTURE MODEL
These horizontal weighting functions are well behaved inareas of low observation density, but they degrade when ap-plied in regions of high observation density typical of remote-sensing observations. By adding more information in the formof observations at a distance, this weighting function decreasesthe total magnitude of the nudging. As information is addedwith increasing numbers of observations, the weight shouldincrease. The simple solution adopted here was to prevent thetotal nudging weight in (7) from falling below the largest indi-vidual observation weighting function, W( x , t). Informationfrom more distant observations is still used based on its indi-vidual weight, but the total weight is set to correspond to thatat the closest observation. The modified predictive equation is
u
t 5 F~u , x , t! 1 GuW~ x , t!max
F Oi51
N
Wi~ x , t!g i~uo 2 u9! iGOi51
N
Wi~ x , t!
(16)
where W( x , t)max is the maximum weight calculated for anysingle observation in the set of observations.
2.8. Statistical Interpolation Assimilation Method
Statistical interpolation is a minimum variance method thatis closely related to kriging. The technique can be traced backto Kolmogorov [1941] and has been in use by most majorwestern meteorological services since the mid-1970s.
Statistical interpolation is implemented in all threeTOPLATS soil layers as follows [Daley, 1991]:
ua~r i! 5 ub~r i! 1 Ok51
K
Wik@uo~rk! 2 ub~rk!# (17)
where K is the number of observation points, Wik is the weightfunction, u (r) is the soil moisture analysis variable, r is thethree-dimensional spatial coordinates, ua(ri) is the analyzedvalue of u at the analysis grid point r , ub(ri) is the backgroundor first-guess value of u at ri, and uo(rk) and ub(rK) are theobserved and background values, respectively, at the observa-tion station rk. Again, in this study no interpolation is requiredto obtain the above fields because of the correspondence be-tween the model and observation grids.
The weight function Wik is determined by least squaresminimization of (17), with the assumptions that ub(rk), ub(ri),and uo(rk) are unbiased; that there is no correlation between
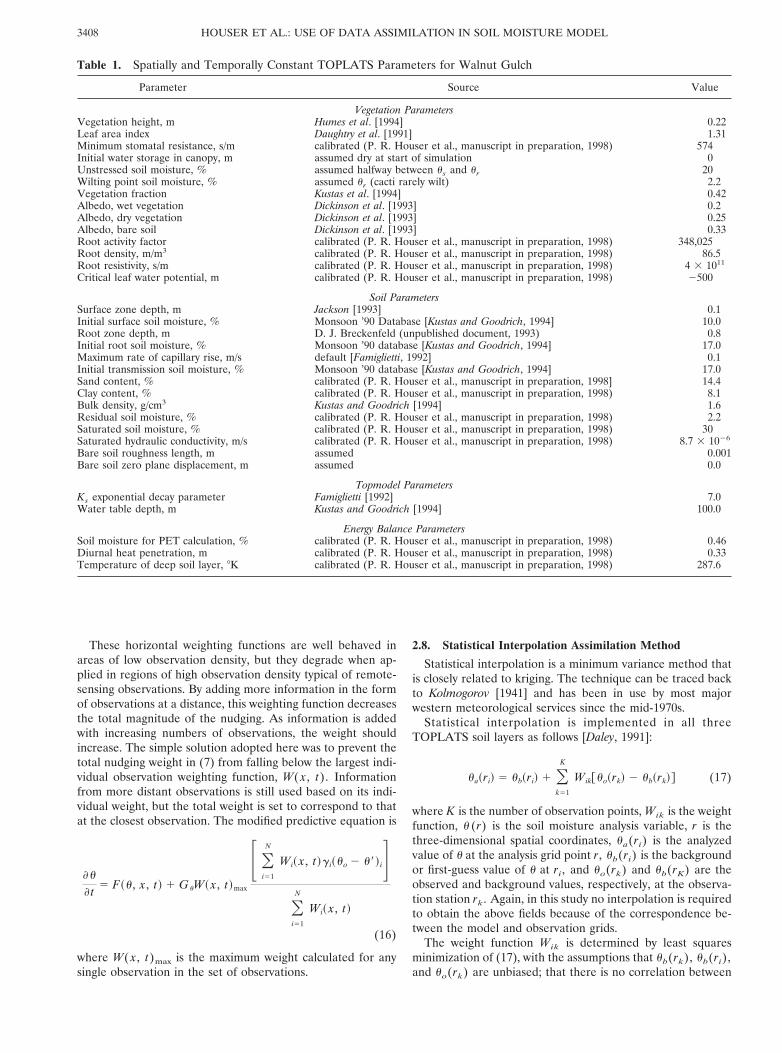
Table 1. Spatially and Temporally Constant TOPLATS Parameters for Walnut Gulch
Parameter Source Value
Vegetation ParametersVegetation height, m Humes et al. [1994] 0.22Leaf area index Daughtry et al. [1991] 1.31Minimum stomatal resistance, s/m calibrated (P. R. Houser et al., manuscript in preparation, 1998) 574Initial water storage in canopy, m assumed dry at start of simulation 0Unstressed soil moisture, % assumed halfway between us and ur 20Wilting point soil moisture, % assumed ur (cacti rarely wilt) 2.2Vegetation fraction Kustas et al. [1994] 0.42Albedo, wet vegetation Dickinson et al. [1993] 0.2Albedo, dry vegetation Dickinson et al. [1993] 0.25Albedo, bare soil Dickinson et al. [1993] 0.33Root activity factor calibrated (P. R. Houser et al., manuscript in preparation, 1998) 348,025Root density, m/m3 calibrated (P. R. Houser et al., manuscript in preparation, 1998) 86.5Root resistivity, s/m calibrated (P. R. Houser et al., manuscript in preparation, 1998) 4 3 1011
Critical leaf water potential, m calibrated (P. R. Houser et al., manuscript in preparation, 1998) 2500
Soil ParametersSurface zone depth, m Jackson [1993] 0.1Initial surface soil moisture, % Monsoon ’90 Database [Kustas and Goodrich, 1994] 10.0Root zone depth, m D. J. Breckenfeld (unpublished document, 1993) 0.8Initial root soil moisture, % Monsoon ’90 database [Kustas and Goodrich, 1994] 17.0Maximum rate of capillary rise, m/s default [Famiglietti, 1992] 0.1Initial transmission soil moisture, % Monsoon ’90 database [Kustas and Goodrich, 1994] 17.0Sand content, % calibrated (P. R. Houser et al., manuscript in preparation, 1998] 14.4Clay content, % calibrated (P. R. Houser et al., manuscript in preparation, 1998) 8.1Bulk density, g/cm3 Kustas and Goodrich [1994] 1.6Residual soil moisture, % calibrated (P. R. Houser et al., manuscript in preparation, 1998) 2.2Saturated soil moisture, % calibrated (P. R. Houser et al., manuscript in preparation, 1998) 30Saturated hydraulic conductivity, m/s calibrated (P. R. Houser et al., manuscript in preparation, 1998) 8.7 3 1026
Bare soil roughness length, m assumed 0.001Bare soil zero plane displacement, m assumed 0.0
Topmodel ParametersKs exponential decay parameter Famiglietti [1992] 7.0Water table depth, m Kustas and Goodrich [1994] 100.0
Energy Balance ParametersSoil moisture for PET calculation, % calibrated (P. R. Houser et al., manuscript in preparation, 1998) 0.46Diurnal heat penetration, m calibrated (P. R. Houser et al., manuscript in preparation, 1998) 0.33Temperature of deep soil layer, 8K calibrated (P. R. Houser et al., manuscript in preparation, 1998) 287.6
HOUSER ET AL.: USE OF DATA ASSIMILATION IN SOIL MOISTURE MODEL3408

the model and observation error; that the error correlationsare homogeneous, isotropic, and time invariant; and that thebackground error correlation rb is horizontally and verticallyseparable (i.e., rb 5 rbxyrbz) [Daley, 1991]. Thus
Ol51
K
Wil@rbxy~r l 2 rk! 1 «o2ro~r l 2 rk!# 5 rbxy~r i 2 rk!rbz~ zi 2 zk!
(18)
where ro is the observation error correlation matrix, rbxy is thebackground horizontal error correlation matrix, and rbz is thevertical error correlation matrix. The most satisfactory way ofestimating ro and rb is to use observations from a densehomogenous observation network and corresponding modelpredictions [Schlatter, 1975]. Calculations of background errorcorrelation matrices are much more efficient if correlations arespecified using symmetric, positive definite correlation models[Buell, 1972]. The system of linear equations given in (18) issolved using a simple and efficient Cholesky decomposition.Each PBMR image contains over 35,000 observations, whichrequires solving a system of 35,000 linear equations for eachmodel grid point, each time an observation was available.Clearly, the computational resources needed for this task areunreasonable; hence a simplified method is required.
Two alternative methods for simplifying this problemthrough reduction of observations were explored. In the first, asubset of observations is randomly selected. The closest obser-
vation which is the observation with the highest informationcontent is always included in this subset, thus approximatingthe analysis made with all available observations. The secondmethod uses “superobservations,” these being average valuesof observation groups. The model domain is divided into sec-tions, and all observations found in those sections are averagedto define the superobservation. In this study, either 100 ran-dom samples or 100 superobservations are used when applyingthe statistical interpolation method.
2.9. Walnut Gulch–Monsoon ’90 Observations
The Walnut Gulch Experimental Watershed (318439N,1108419W) near Tombstone, Arizona, is operated by theSouthwest Watershed Research Center (SWRC), AgricultureResearch Service (ARS), U.S. Department of Agriculture(USDA). The catchment is an instrumented area comprisingthe upper 148 km2 of the Walnut Gulch drainage basin in analluvial fan portion of the San Pedro watershed in southeasternArizona (Figure 1). Eighty-five recording rain gauges, 11 pri-mary watershed runoff-measuring flumes, and micrometeoro-logical observations make the Walnut Gulch ExperimentalWatershed a valuable research location. During Monsoon ’90(July 23 through August 10, 1990), eight micrometeorological–energy flux (Metflux) instruments provided continuous mea-surement of local meteorological conditions and the surfaceenergy balance, and extensive remote-sensing observationswere made; see Kustas and Goodrich [1994] for details.
Figure 2. Multiquadric interpolated precipitation for the Walnut Gulch Experimental Watershed for the6-hour storm of day 213, 1990.
3409HOUSER ET AL.: USE OF DATA ASSIMILATION IN SOIL MOISTURE MODEL

2.10. TOPLATS Model Domain
The entire Walnut Gulch Experimental Watershed wasmodeled in a spatially distributed manner at a 40-m resolution.Predictions were made hourly from July 22 to August 15 (dayof year 204–228), 1990. The model was driven with spatiallyvariable topography and precipitation because these have asignificant impact on soil moisture. All other soil and vegeta-tion characteristics were spatially constant.
2.11. TOPLATS Parameters
The TOPLATS parameterization was based largely on ob-servations made during Monsoon ’90 [Daughtry et al., 1991;Kustas et al., 1994; Humes et al., 1994; Kustas and Goodrich,1994; D. J. Breckenfeld, unpublished document, 1993]. How-ever, many model parameters were not observed and had to beestimated or specified by model calibration (P. R. Houser et al.,manuscript in preparation, 1998). A summary of the TOPLATSparameter values used in this study is given in Table 1.
2.12. Temporal Forcing
Precipitation is the most important spatial forcing variable insemi-arid regions owing to its highly variable, convective na-
ture; thus much effort was devoted to deriving spatially dis-tributed precipitation data sets for the Monsoon ’90 experi-ment. A multiquadric-biharmonic interpolation algorithm[Syed, 1994] was used to produce spatially distributed precip-itation values for the entire model domain from the availablerain gauge data. An example of this interpolated precipitationis shown in Figure 2. The multiquadric-biharmonic interpola-tion method was selected because it proved superior to othercommon interpolation algorithms [Syed, 1994]. All other me-teorological forcing (Figure 3) was assumed to be spatiallyconstant and derived from averaging observations at the eightMetflux stations in place during the experiment [Kustas andGoodrich, 1994].
2.13. Soil Moisture State Observations for Assimilation
The National Aeronautics and Space Administration(NASA) L band push broom microwave radiometer (PBMR),which operates at a frequency of 1.42 Ghz (21-cm wavelength),was flown on a NASA C-130 aircraft at an altitude of 600 mabove the ground. The PBMR has four horizontally polarizedbeams pointing at 688 and 6248 from nadir. Each beam has afull width at half maximum power of ;168, which yields a
Figure 3. Watershed average Monsoon ’90 meteorological observations used as forcing for the TOPLATSmodel.
HOUSER ET AL.: USE OF DATA ASSIMILATION IN SOIL MOISTURE MODEL3410


measurements were also made at daily intervals and at multi-ple depths down to 0.5 m at two of the Metflux sites [Kustasand Goodrich, 1994].
3. Results3.1. Correlation Structure Analysis
The ability of data assimilation methodologies to advectinformation from data-rich regions to data-poor regions de-pends on the assumption that there is some natural spatialstructure or correlation in the data. The correlation of PBMRbrightness temperature and soil moisture time series versusdistance is shown in Figure 4. This figure shows that the inver-sion from brightness temperature to soil moisture has littleimpact on this correlation, and that longer time series im-proves the definition of the spatial structure. Figure 4 alsoshows that the PBMR time series are highly spatially corre-lated. In fact, it seems that the correlation structure present inthese remotely sensed data extends well past the 15-km-long
measurement area and can be projected to extend to ;60 km,assuming linear correlation structures. Similar linear spatialcorrelation structures were observed for the time series ofsensible, latent, and soil heat flux. This supports the validity offorcing the TOPLATS model with watershed average meteo-rological forcing data and of calibrating the TOPLATS modelwith watershed average flux observations.
A geostatistical analysis of the PBMR-derived soil moisturedata showed that their correlation structure varies with time.The first PBMR observations taken during a dry day show adisorganized spatial pattern in the variogram. After the largeday 213 precipitation event, the variogram becomes organized;then this organization degrades with soil dry down over thenext few days (Figure 5). The variograms shown in Figure 5 arebased on instantaneous observations, which are a fundamen-tally different measure of spatial structure than the time seriescorrelation distances shown in Figure 4. Data assimilationmethodologies generally assume that correlation structures aretemporally invariant; hence further investigation of the chang-
Figure 4. Correlation between time series of PBMR data collected at different locations, plotted versus thedistance separating the time series locations. Correlation distances for (a) PBMR soil moisture six-point timeseries; (b) PBMR soil moisture five- and six-point time series; (c) PBMR brightness temperature six-point timeseries; and (d) PBMR brightness temperature five- and six-point time series. Data presented are a randomselection of 0.01% selection of the total.
HOUSER ET AL.: USE OF DATA ASSIMILATION IN SOIL MOISTURE MODEL3412

ing soil moisture correlation structure is warranted when ap-propriate longer-term soil moisture observations become avail-able.
Implementation of statistical interpolation requires thespecification of the background and observation error correla-tion. The observation error correlation is the horizontal cor-relation between various observed time series with correlatederror, minus observations without correlated error. Usually,for observations taken with separate, stationary instruments,observation errors are uncorrelated [Daley, 1991]. For re-motely sensed observations measured by the same instrument,however, the observation errors are correlated and cannot beignored. The time series of in situ gravimetric observations Gwere used to assess the error correlation in the PBMR soilmoisture observations P and the TOPLATS soil moisture con-trol run predictions TC. An analysis of the correlation of the(G-P) and (G-TC) time series showed no error correlation inthe PBMR data or TOPLATS predictions.
The background error correlation (i.e., the distance corre-lation of the (P-TS) time series) shown in Figure 6 is theprimary mechanism for advecting observational informationinto data-sparse regions in the statistical interpolation method.It is clear from this figure that one additional measurement inthe time series has a large positive impact on the ability toidentify the correlation structure; hence a longer time serieswould produce a more identifiable structure. Because of thedense nature of remote-sensing observations, the total numberof pairs can exceed 600 million for the PBMR-TOPLATS dataset; thus a 0.01% random subsample was used in Figure 6.
A standard background error correlation function [Thie-baux, 1976]:
rb~r! 5 F cos ~cr! 1sin ~cr!
Lc G exp S2rLD (19)
was fit to the 6-period background horizontal error correlationusing a simplex technique to derive the constants c and L . This
Figure 5. Variograms for a 1% selection of PBMR brightness temperatures.
3413HOUSER ET AL.: USE OF DATA ASSIMILATION IN SOIL MOISTURE MODEL

fitted curve is shown in Figure 6, and its parameters are givenin Table 2.
Statistical interpolation allows for vertical assimilation ofdata, but to do so requires specification of a vertical, back-ground error correlation function. Because explicit definitionof this function was not possible from PBMR observations, insitu profile TDR observations were used as a surrogate toformulate this function for the root zone (Table 3).
Following Stauffer and Seaman [1990], most of the Newto-nian nudging parameters, such as the analysis and observationquality factors, were set to unity. The parameters that deter-mine the spatial radius of influence were set to the valuesdetermined for the statistical interpolation technique (Table4). The nudging factor is usually less than 1/Dt , where Dt is themodel’s time step length [Stauffer and Seaman, 1990]; 10% ofthis value worked well in this study.
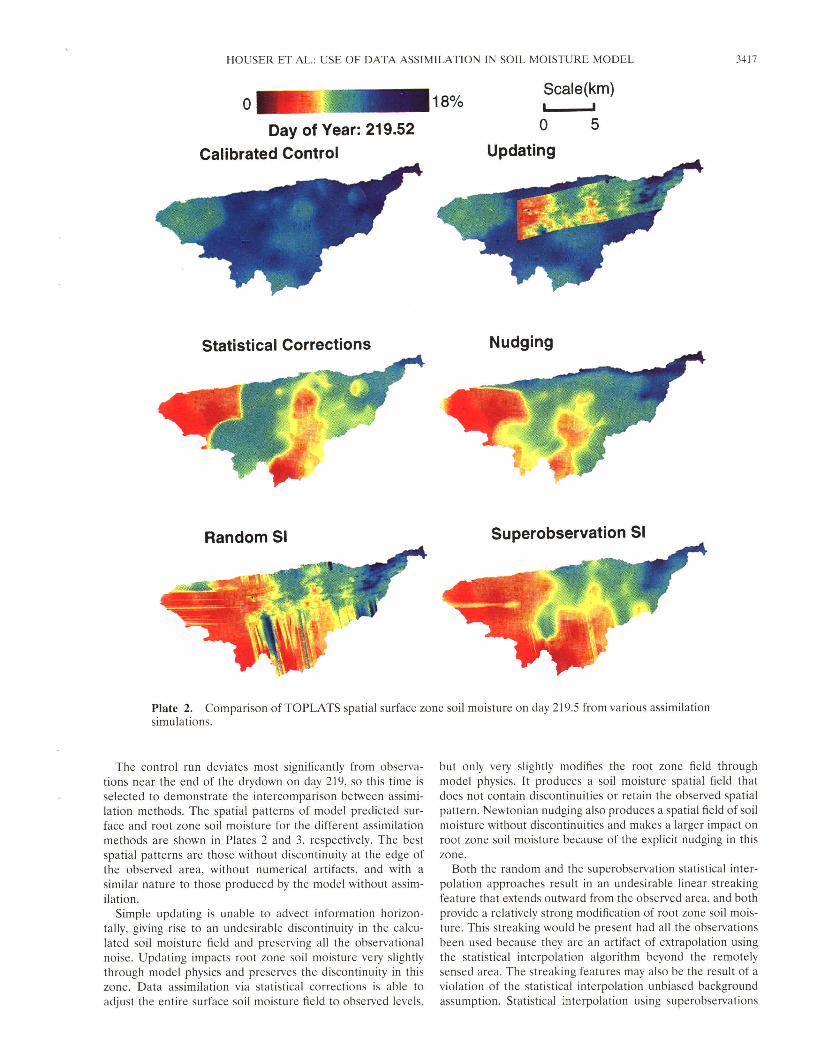
3.2. Assimilation Results
Watershed average time series of surface and root zone soilmoisture derived using the various assimilation strategies areshown in Figure 7. The transmission zone soil moisture is notshown because it varies less than 1% in practice. Nudging tothe gridded PBMR observations inside the observed areayields an undesirable discontinuity at this boundary; thereforenudging to randomly spaced observations was performed bothinside and outside the observed area. Without calibration theTOPLATS was unable to simulate surface soil moisture dy-namics, and even after a comprehensive multiobjective param-eter calibration, the model overestimated surface zone soilmoisture and was unable to achieve observed poststorm dry-down. All of the data assimilation methods significantly andsimilarly improved the simulation of surface zone soil mois-
Figure 6. Surface soil moisture background error correlation versus distance for (a) six-point time series,and (b) five-point time series. Plots represent a 0.01% selection of the total data.
Table 2. Optimized Background Horizontal ErrorCorrelation Function Parameter Values
Parameter
c L
Random observation reanalysis 1.1 3 1027 3277.1Superobservation reanalysis 8.9 3 1028 12715.4
Table 3. Vertical Background Error Correlation
Metflux Site Original
Reanalysis
100 RandomObservations
100 Super-observations
Lucky Hills (site 1) 0.4 0.26 0.27Kendall (site 5) 0.62 0.43 0.40
Surface minus root zone, z 5 0.7 m.
HOUSER ET AL.: USE OF DATA ASSIMILATION IN SOIL MOISTURE MODEL3414

Figure 7. (a) Comparison of TOPLATS watershed average surface zone soil moisture time series fromvarious assimilation simulations. (b) Comparison of TOPLATS watershed average root zone soil moisturetime series from various assimilation simulations. (Identical model trajectories often result in one line thatrepresents multiple simulations.)
Table 4. Parameters for Soil Moisture Newtonian Nudging in TOPLATS
Parameter Value Source
Average depth of observation 0.05 m Schmugge et al. [1994]Average depth of surface zone can be variable TOPLATS parametersAverage depth of root zone can be variable TOPLATS parametersAverage depth of transmission zone can be variable TOPLATS parametersTemporal radius of influence 12 hours subjective optimizationHorizontal radius of influence 10,000 m SI correlation analysisVertical radius of influence 0.5 m SI correlation analysisSurface zone nudging constant 0.2 subjective optimizationRoot zone nudging constant 0.1 subjective optimizationTransmission zone nudging constant 0.0 subjective optimizationAnalysis quality factors 1.0 Stauffer and Seaman [1990]Observation quality control factors 1.0 Stauffer and Seaman [1990]
3415HOUSER ET AL.: USE OF DATA ASSIMILATION IN SOIL MOISTURE MODEL

ture, with the exception of direct insertion, which is unable toimpose an entire watershed correction and was therefore un-able to adjust the model trajectory sufficiently. Nudging hadthe clear advantage of providing smoother temporal adjust-ments; however, this characteristic also inhibits the applicationof this method in real time. All simulations produced identicalsurface zone soil moisture simulations after the storm on day224 because this storm saturated the surface zone, causing allpast surface zone forcing to be forgotten; however, this processdoes not occur in the models’ root zone, where memory of pastassimilation is preserved. This sequence of events is not unre-alistic; rather, it suggests a time interval at which soil moistureobservations are needed for data assimilation, this intervalbeing less than or equal to the time between storm events.
In the root zone the modeled time series fell into two distinctgroups corresponding to methods with and without the capa-bility for vertical assimilation of information. Among the lattergroup, nudging assimilation performs a more conservative cor-rection compared with statistical interpolation. None of themethods produced time series that match the root zone obser-vations. However, it is important to bear in mind that with onlytwo root zone observations, the root zone spatial variability isnot adequately sampled.
Figure 8. Sensitivity of assimilation information on watershed average surface soil moisture prediction usingstatistical corrections assimilation.
Table 5. Watershed Average Water Balance Informationfor the TOPLATS Data Assimilation Simulations
Variable
Simulation
Control UpdatingStat.Corr. Nudging
SuperObsSI
Precipitation 93.44 93.44 93.44 93.44 93.44Capillary Rise 0.00 0.00 0.00 0.00 0.00ET 41.86 39.97 36.76 37.32 36.19Runoff 6.21 5.68 5.15 5.08 5.11Recharge 0.00 0.00 0.00 0.00 0.00Surface DS 5.69 5.69 5.69 5.69 5.69Root DS 33.51 32.31 29.85 22.60 0.40Trans DS 6.14 5.75 5.09 3.49 1.91Leaf DS 0.03 0.03 0.03 0.03 0.03In-out 45.37 47.79 51.53 51.03 52.14Total DS 45.37 43.78 40.66 31.81 8.03Error 0.00 4.01 10.87 19.22 44.11
Capillary rise refers to the upward flux of water from the saturatedsurface, ET is evapotranspiration, recharge is the drainage to thesaturated zone, surface DS is the sum of the changes in storage in thesurface zone, leaf DS is the sum of the changes in storage in theinterception store, in-out is the total input less the total output, totalDS is the total change in storage, and error is in-out less total DS. Allvalues are in millimeters.
HOUSER ET AL.: USE OF DATA ASSIMILATION IN SOIL MOISTURE MODEL3416


these correlations, it might be surmised that this concept holdsfor a distance of less than 60 km. The correlation structuresvary in time, depending on the soil’s state of drying, but its timeseries do have strong horizontal and vertical correlation struc-tures.
There is a clear trade-off between using a complex dataassimilation technique and the ability to use all the availabledata due to the large computational burdens of performingdata assimilation at fine resolutions using dense data sets. Onthe basis of this study, it was found that, as the complexity ofthe data assimilation model increases, the size of the assimi-lated data set needs to decrease in order to maintain compu-tational feasibility. Complex methods have the ability to extractmore useful information from assimilated data, but simplermethods use more of the data to extract similar information.This trade-off allows simpler assimilation techniques to per-form almost as well as complex techniques. In general, thisargument suggests the use of assimilation methods that are ofmoderate complexity, are sound and computationally efficient,but use as much data as possible. If the information in the datacan be efficiently compressed or filtered before its use in dataassimilation, it may be more reasonable to use larger data setsin complex data assimilation strategies. Because hydrologicdata assimilation requires hydrologic modeling predictions, itis limited by a similar trade-off between fine resolution andlarge area implementation. A statistically based assimilationmay be a viable approach for use in large areas, but ultimatelythe trade-off between resolution and area will be determinedby the application.
Several supplementary observations are essential for imple-mentation of soil moisture data assimilation, the most impor-tant being meteorological forcing. Forcing averaged over largeareas may be adequate, but detailed spatial patterns of precip-itation are essential. Clearly, regular, remotely sensed soilmoisture observations are required, but these must be supple-mented by in situ surface and root zone observations across theoperational domain to specify error correlations, to calibrateparameters, and to validate the model-calculated fields. Ob-servations of soil and vegetation characteristics are likelyneeded for optimal model performance, while observations ofsurface water and energy fluxes are valuable for validatingsimulation results.
Acknowledgments. This work was supported, fostered, and carriedout to completion at the University of Arizona, Department of Hy-drology, with financial support provided through NASA grantsNAGW-4165, NAGW-4087, and NAG5-3492#1 and through theaward of a NASA Global Change Fellowship. C. White facilitatedprocessing and checking of Walnut Gulch data sets, while C. White, J.Garatuza, A. Mohammed Arzin, R. Scott, T. Keefer, and C. Harlowassisted in field validation of this work. J. Broermann and D. Braith-waite provided patient and consistent computational assistance. Thestudy would not have been possible without the data provided by theUSDA–Southwest Watershed Research Center and without their as-sistance in interpreting these data from the Walnut Gulch Experimen-tal Watershed. The authors would also like to thank T. Schmugge, T.Keefer, J. Toth, and an anonymous reviewer for their helpful com-ments on the manuscript.
ReferencesAmer, S. A., T. O. Keefer, M. A. Weltz, D. C. Goodrich, and L. B.
Bach., Soil moisture sensors for continuous monitoring, Water Re-sour. Bull., 30(1), 69–83, 1994.
Beven, K., and M. J. Kirby, A physically based, variable contributingarea model of basin hydrology, Hydrol. Sci. Bull., 24(1), 43–69, 1979.
Buell, C., Correlation functions for wind and geopotential on isobaricsurfaces, J. Appl. Meteorol., 11, 51–59, 1972.
Daley, R., Atmospheric Data Analysis, 457 pp., Cambridge Univ. Press,New York, 1991.
Daughtry, C. S. T., M. A. Weltz, E. M. Perry, and W. P. Dulaney,Direct and indirect estimates of leaf area index, paper presented atTenth Conference on Biometeorology and Aerobiology; SpecialSession on Hydrometeorology, Am. Meteorol. Soc., Salt Lake City,Utah, 1991.
Dickinson, R. E., A. Henderson-Sellers, and P. J. Kennedy, Biosphere-Atmosphere Transfer Scheme (BATS) version 1e as coupled to theNCAR Community Climate Model, Tech. Note NCAR/TN-3871STR, Natl. Cent. for Atmos. Res., Boulder, Colo., 1993.
Famiglietti, J. S., Aggregation and scaling of spatially-variable hydro-logical processes: Local, catchment-scale, and macroscale models ofwater and energy balance, dissertation, Dep. of Civ. Eng. and Oper.Res., Princeton Univ., Princeton, N. J., 1992.
Famiglietti, J. S., and E. F. Wood, Application of multiscale water andenergy balance models on a tallgrass prairie, Water Resour. Res.,30(11), 3061–3078, 1994.
Humes, K. S., W. P. Kustas, and M. S. Moran, Use of remote sensingand reference site measurements to estimate instantaneous surfaceenergy balance components over a semiarid rangeland watershed,Water Resour. Res., 30(5), 1363–1373, 1994.
Jackson, T. J., Measuring surface soil moisture using passive micro-wave remote sensing, Hydrol. Processes, 7, 139–152, 1993.
Kolmogorov, A., Interpolated and extrapolated stationary random se-quences (in Russian), Izv. Akad. Nauk SSSR, Ser. Mat., 5(2), 85–95,1941.
Kustas, W. P., and D. C. Goodrich, Preface to the special section onMonsoon 90, Water Resour. Res., 30(5), 1211–1225, 1994.
Kustas, W. P., J. H. Blanford, D. I. Stannard, C. S. T. Daughtry, W. D.Nichols, and M. A. Weltz, Local energy flux estimates for unstableconditions using variance data in semiarid rangelands, Water Resour.Res., 30(5), 1351–1361, 1994.
Schlatter, T., Some experiments with a multivariate statistical objectiveanalysis scheme, Mon. Weather Rev., 103, 246–257, 1975.
Schmugge, T., T. J. Jackson, W. P. Kustas, R. Roberts, R. Parry, D. C.Goodrich, S. A. Amer, and M. A. Weltz, Push broom microwaveradiometer observations of surface soil moisture in Monsoon ’90.Water Resour. Res., 30(5), 1321–1328, 1994.
Seaman, N. L., Newtonian nudging: A four-dimensional approach todata assimilation, paper presented at Mesoscale Data Assimilation,1990 Summer Colloquium, Natl. Cent. for Atmos. Res., Boulder,Colo., June 6–July 3, 1990.
Stauffer, D. R., and N. L. Seaman, Use of four-dimensional dataassimilation in a limited area mesoscale model, I, Experiments withsynoptic-scale data, Mon. Weather Rev., 118, 1250–1277, 1990.
Syed, K. H., Spatial storm characteristics and basin response, M. S.thesis, 261 pp., Dep. of Hydrol. and Water Resour., Univ. of Ariz.,Tucson, 1994.
Thiebaux, H. J., Anisotropic correlation functions for objective anal-ysis, Mon. Weather Rev., 104, 994–1002, 1976.
Wei, M. Y., Soil moisture: Report of a workshop held in Tiburon,California, 25–27 January 1994, NASA Conf. Publ., CP-3319, 1995.
J. S. Famiglietti, Department of Geological Sciences, University ofTexas at Austin, Austin, TX 78712.
D. C. Goodrich and K. H. Syed, Southwest Watershed ResearchCenter, Agricultural Research Service, U.S. Department of Agricul-ture, Tucson, AZ 85719.
H. V. Gupta and W. J. Shuttleworth, Department of Hydrology andWater Resources, Building 11, Room 122, University of Arizona, P. O.Box 210011, Tucson, AZ 85721-0011. ([email protected])
P. R. Houser, Hydrological Sciences Branch and Data AssimilationOffice, Code 974, NASA Goddard Space Flight Center, Greenbelt,MD 20771. ([email protected])
(Received May 14, 1997; revised August 23, 1998;accepted August 28, 1998.)
HOUSER ET AL.: USE OF DATA ASSIMILATION IN SOIL MOISTURE MODEL3420