social preferences, self-interest, and the demand for ... · 1 forthcoming, journal of public...
TRANSCRIPT

1
Forthcoming, Journal of Public Economics
Social Preferences, Self-Interest, and the Demand for Redistribution
Christina Fong*
July 27, 2000
Abstract
Preferences for redistribution may be influenced by values and beliefs about distributivejustice as well as by self-interest. People may prefer more redistribution to the poor ifthey believe that poverty is caused by circumstances beyond individual control.Therefore, beliefs about the causes of income may affect demand for redistribution.Alternatively, the effect of these beliefs on redistributive preferences may be spurious ifthey are correlated with income, and self-interest is not properly controlled for. Theymay also measure incentive cost concerns. Using social survey data, I find that self-interest cannot explain the effect of these beliefs on redistributive preferences.
Keywords: Equity, Fairness, Interdependent Preferences, Redistribution, DistributiveJusticeJEL Classifications: D63, H50
* Send correspondence to Christina Fong, Department of Economics, Thompson Hall, University ofMassachusetts, Amherst, MA 01003. Tel: (314) 633-1163. Email: [email protected] .
2
1. Introduction
The reasons why citizens of democratic countries support or opposeredistribution to strangers remain poorly understood, despite much research on the publicsector and welfare states. Paul Romer (1994) has observed that social security in the U.S.was designed and implemented as a program of entitlements to those who havecontributed their earnings rather than as a program that would provide broader coverageand hence redistribution to those who had not contributed. According to Romer thedesigners and subsequent defenders of social security understood that a program ofentitlements would inspire more vigorous public support than the alternative.
Why might voters defend entitlement programs more vigorously than other kindsof programs? One possible explanation is that social security is a social insuranceprogram that appeals primarily to self-interested desires on the part of a broad range ofcitizens. A self-interested demand for social insurance can arise where private provision isprevented by market failures that result from asymmetric information (Sinn, 1995; Barr,1992). Tying entitlements to contributions may simply be a method of controllingpotential costs due to moral hazard. Voters might desire social insurance, but only ifcertain measures are in place to prevent people from working less after they becomeinsured.
On the other hand, the appeal of a program of entitlements may have to do withpreferences that are other-regarding and not necessarily outcome oriented. These areoften referred to as social preferences. Romer (1994) argues that if people feel entitled toa benefit, they may feel angry if they do not receive it. Such anger might be expected ifpeople care deeply that their opinions about what they deserve are realized, but afinancially self-interested rational actor should not recognize the difference between anentitlement and a handout. Following many others, I will argue that individuals may alsocare deeply that other people get what they deserve. Many scholars have argued thatpeople may hold the principle of justice known as equity, according to which the rewardsor incomes that people receive should be in proportion to the contributions they make(Walster, Walster and Berscheid, 1978; Deutsch, 1985).
Reciprocity may produce related concerns. (Bowles and Gintis, 2000) Wealthypeople may desire a society in which members who are well-off support those in need,provided that others would do the same for them if necessary. Such reciprocity mightrequire that those in need are predisposed to work hard: a willing tax payer might wellwithdraw his or her support for redistribution if recipients are thought to be voluntarilycapitalizing on tax payer generosity.1 Other motivations such as altruism, either to kin or
1 There is a large body of literature citing evidence that reciprocity is a strong human motive that governsthe allocation of resources according to how recipients have behaved or intended to behave in the past.Most of this literature concerns reciprocity in bargaining or strategic interactions among small numbers ofpeople, but Bowles and Gintis (2000) argue that a generalized form of reciprocity applies to large scaleredistribution.
3
non-kin, may explain support for redistribution.2 A third possibility is that respondentsmay support redistribution to prevent crime or other forms of social unrest.
There is strong evidence that financial self-interest is an insufficient explanationfor redistributive attitudes. First, means-tested programs which benefit a relatively smallrange of people have proven politically viable, albeit at lower levels of political and fiscalsupport. Second, social survey data suggest high levels of support for certainredistributive programs, even among the rich. Surveying a variety of American publicopinion data sources, Martin Gilens (1999) reports that roughly fifty and sixty per centof respondents express support for increases in government spending on Medicaid andchild care for poor children respectively. In contrast, less than 10% of respondentsexpress support for decreases in government spending on these programs. Furtherevidence - from the 1998 Gallup Poll Social Audit - is that there is substantial support forredistribution among those who are unlikely to benefit from it. Among respondents whohave annual household incomes of at least $150,000 and expect to be upwardly mobile inthe next five years, a sizeable fraction respond in favor of reducing inequality or helpingthe poor. In this group, 24% respond that the government should “redistribute wealth byheavy taxes on the rich,” and 67% respond that the “government in Washington DCshould make every possible effort to improve the social and economic position of thepoor.” (See Appendix) Equally striking is the fact that among those with annual familyincomes of less than $10,000, 35% report that the government should not redistributivewealth by heavy taxes on the rich, and 21% say that the poor should help themselvesrather than having the government “make every possible effort to improve the … positionof the poor.”
A number of authors have argued, both theoretically and empirically, thatredistributive preferences may be determined by beliefs about the extent to whichindividuals do or do not have voluntary control over their earnings, and beliefs about theprevalence of opportunity to get ahead.3 (Kluegel and Smith, 1986; Piketty, 1995; Gilens,1999) These beliefs about the causes of poverty and wealth are usually arranged accordingto beliefs about self- versus exogenous-determination of outcomes. Those who believe inself-determination believe that outcomes are determined by factors that are withinindividual control, such as a willingness to work hard. Those who believe in exogenous-determination place more importance on factors beyond individual control, such as luck orlack of opportunity.
Many authors across the social sciences have interpreted the effect of self- andexogenous determination beliefs on redistributive attitudes as reflecting reciprocity 2 There is a long tradition of modeling public redistribution with altruistic preferences. For a recentapplication, see Moffitt (1998, 1999).3 Standard median voter models of both altruistic and purely self-interested demand for publicredistribution are easily extended to accommodate this finding. See, for instance, Luttmer (1998). Asecond argument for extending models of simple altruism, from the literature on charitable giving, is thatthey fail empirical tests of Ricardian equivalence. That is, if altruism is simply an argument in the donor’sutility function for the incomes of the recipients or the total contribution to a public good, thengovernment transfers should completely crowd out private giving to the poor. Sugden (1988) providesevidence that this is not the case. Andreoni (1989) provides a model of warm-glow altruism in whichindividuals also care about the size of their contribution to recipients or a public good.
4
(Bowles and Gintis, 2000) or the principle of equity (Kluegel and Smith, 1986).4 In bothcases, the interpretation is that people are willing to support the poor conditional onthem having industrious traits or intentions.5 However, it is possible that the effect ofself- and exogenous-determination beliefs is consistent with financial self-interest. Peoplewho believe in exogenous-determination may be those who have low-mean, high-varianceincomes. Such individuals may have higher expectations of needing government assistancein the future, and therefore demand more redistribution. For similar reasons, those whobelieve in self-determination may simply be people who have higher-mean, lower-varianceincomes and therefore less self-interest in redistribution.6
This paper tests various long-standing hypotheses about why people support oroppose redistribution, but the primary focus is on the role of beliefs about self- andexogenous-determination on reported redistributive policy preferences. If the beliefsabout self- and exogenous-determination operate through self-interest, then they shouldhave no effect among people who do not expect to gain financially from redistribution. Iwill first test whether this is the case using a sub-sample of individuals with high incomeswho expect to be upwardly mobile in the next five years. In this sub-sample, a large setof self-interest measures is jointly insignificant, according to a likelihood ratio test. I testwhether or not beliefs about self- and exogenous-determination are significant in this sub-sample. I then conduct an analogous test on the sub-sample of people with annual familyincomes of less than $10,000. The self-interest variables are jointly insignificant in thissub-sample. I test whether or not beliefs about self- and exogenous determination arejointly significant at the one percent level.
I also test whether beliefs about the prevalence of poverty affect attitudes aboutredistribution. If self-interest fully explains demand for redistribution, then those whohave no self-interest in redistribution should be opposed to it regardless of their beliefsabout the prevalence of poverty. If these beliefs do have a significant effect in a high-income, upwardly mobile sub-sample, then an alternative explanation is necessary.
In my fourth test of self-interest, I use questions on the importance of variousfactors – including a person’s race and gender - to getting ahead in life. If people thinkthat a person’s race and gender are important to getting ahead in life, then effects of thesebeliefs on self-interested demand for redistribution should operate in opposite directionsfor those who expect to benefit and those who expect to lose from racial or genderdiscrimination.7
2. Data
4 See Miller (1985) for a survey of empirical research on distributive justice.5 There is evidence from experimental bargaining games that people may care directly about intentions (see,for instance, Blount 1995), but the role of beliefs about intentions in redistributive politics is unknown.6 Another way in which beliefs about self- and exogenous-determination might operate through self-interestis if they represent concerns about incentive costs of taxation and redistribution. I find evidence againstthis argument using the U.S. General Social Survey. I discuss the argument and the evidence against it inthe conclusion.7 I assume that people agree on which group benefits and which loses when they believe that a person’srace or gender is important to getting ahead.

5
I use the 1998 Gallup Poll Social Audit Survey, “Haves and Have-Nots:Perceptions of Fairness and Opportunity,” a randomly selected national sample of 5001respondents. There are 3626 individuals who report being in the labor force. In each test,I use the set of all individuals in the labor force who responded to all of the questionsused in the regression, unless noted otherwise.8 Several tests employ a sample of 2738 orhigh-income subsets of this sample.
The Gallup Poll Social Audit has a large sample size for a large number ofquestions on inequality and distribution relative to other commonly used surveys. Thesample size permits running regressions with full controls on narrow segments of thesample, namely, high income and low income sub-samples. There is a large number ofself-interest measures that include not only the usual objective socioeconomic variables,but also subjective measures of economic well-being which may widen the net intended tocapture self-interest.
The wording of selected questions used in this study is provided in the appendix.The dependent variable is a summative scale of five questions on whether or notinequality should be reduced, either by the government, by heavy taxation of the rich, orin general. Questions about the fairness of the distribution of income and wealth that donot specifically ask about reducing inequality or helping the poor are available but notused in order to reduce the chances of measuring unrelated concepts.
Two sets of measures of beliefs about self- and exogenous-determination ofincomes are used in this study. The first contains two questions concerning theimportance of effort and luck in causing wealth and poverty, and one question on whetheror not there is plenty of opportunity to work hard and get ahead in America today. Thesecond set is a series of questions about the importance of various factors – including raceand gender - for getting ahead in life (see Appendix).
Self-interest is measured with the standard objective socioeconomic controls: race,gender, income, education, marital status, age, employment status, union status,occupation, and household size.9 In addition to these, I use subjective measures ofeconomic well-being, namely the frequency with which respondents worry about meetingfamily expenses, and a measure of future mobility.10 All of these variables may affectredistributive preferences through expected future government receipts.
To measure the respondents’ beliefs about the prevalence of poverty, I use aquestion about whether or not the respondent thinks that America is a society of “haves”
8 I drop non-responses and “don’t know” responses. Another option would be to include “don’t know” asa valid response. However, how and why people develop well-defined preferences and beliefs is beyond thescope of this paper. I focus on why people oppose or support income redistribution given that their beliefsand preferences are well defined.9 Some of these variables, especially union membership, are not direct measures of financial self-interest,but correlate with income, and are intended as proxies for self-interest.10 There are several additional questions that might capture self-interest that I exclude from the model. Itest formally for their joint significance. Using a likelihood ratio test, I fail to reject the hypothesis thatthe coefficients of these variables are all zero (at the 10% significance level) in an ordered probit regressionlike that presented in Table 2 below. This test may be interpreted as a test for missing variables. Afterdropping these variables from the analysis, the sample size increases by over 400 observations, allowingme to increase the income cutoff for the high-income sample.

6
and “have-nots.” Strictly speaking, this is a measure of beliefs about the prevalence ofinequality as well as poverty, but it is the best measure in data set.
3. Empirical Approach
I begin with an ordered probit estimate of a basic equation predicting support forredistribution with beliefs about self- and exogenous-determination and the self-interestmeasures. I use the full sample of 2738 individuals who responded to all of the questionsincluded in the model.
Let R* = XBβB + XSβS + _ be the latent regression where R* is an unmeasuredlevel of support for redistribution, XB is a matrix of variables on beliefs about self- andexogenous determination, XS is a matrix of self-interest measures, and βB and βS arevectors of coefficients. The actual measure of support for redistribution has six orderedcategories, i = 1 to 6. The probabilities of each response category are:
Pr(R = 1) = Pr(XBβB + XSβS ≤ k1)Pr(R = i) = Pr(ki- 1< XBβB + XSβS ≤ ki) for R = 2,…,5 (1)Pr(R = 6) = Pr(ki-1 < XBβB + XSβS)
where k1, k2, … k5 are the cutpoints and _ ∼N(0,1) is the error term.I use the likelihood ratio test to test for the joint significance of each subset of
coefficients. That is, I test:
H0: R* = XBβB +_ (H1)HA: R* = XBβB+XSβS +_
H0: R* = XSβS +_ (H2)HA: R* = XBβB+XSβS +_
I present the marginal effects of selected variables from the model.11 The marginaleffect on category i of R for a dummy variable D is Pr[R = i] evaluated at D = 1 and themean of the remaining regressors minus Pr[R = i] evaluated at D = 0 and the mean of theremaining regressors.12
Next, using the same specification, I use sub-samples of individuals who are sowell-off and secure about their futures that self-interest measures are jointly insignificant, 11 Note that in ordered probit, the effect of coefficients is to shift the probability distribution of R* and R.The sign of the coefficient will be the same as the effect on the highest categories of the dependent variableand opposite of the effect on the lowest category. The direction of the marginal effects on the remainingvalues of the dependent variable cannot be inferred from the coefficient alone.12 The predicted probabilities of the categories of R are calculated as follows:Prob(R = 1) = Φ (k1 - XB)Prob(R = i) = Φ (ki - XB) -Φ (ki - 1 - XB), for i = 2,…,5Prob(R = 6) = 1 - Φ (k5 - XB),where Φ is the cumulative standard normal.
7
according to the likelihood ratio test of (H1). The results I present are from a sub-sampleof 333 individuals who have annual family incomes of $75,000 or more, expect to theirlives to improve in the next five years, and worry about their bills less often than “all ofthe time.”13 I then conduct (H2) using the likelihood ratio test. If we reject the nullhypothesis in (H2), but do not reject the null hypothesis in (H1), then some explanationother than financial self-interest is needed.
I repeat these tests on the low-income sample. The only difference is that Iinclude individuals who are not in the labor force in order to have a sufficiently largesample. In order to do this, I drop occupation from the equation, because the non-response rate among people who are not in the labor force is high for this question. Thesample contains 176 individuals with incomes under $10,000 per year who worry aboutbills more often than “almost never.”
I test whether or not beliefs about the extent of poverty have a significant effecton support for redistribution in the high-income sample described above. If self-interestexplains demand for redistribution, then individuals who cannot plausibly expect tobenefit from redistribution should be opposed to it regardless of their beliefs about theextent of poverty. Another reason for using the high income sub-sample is that beliefsabout whether or not the U.S. is a society of haves and have-nots are correlated with theself-interest measures. A measure of perceptions of poverty may simply serve as aproxy for self-interest if it is highly correlated with the individual’s own expected incomeand the expected financial benefits of social insurance.
In a different specification, I conduct a test of the self-interest hypotheses usingmeasures of the importance of a person’s race and gender to getting ahead in life. Thesebeliefs may have two effects among purely financially self-interested people. First, ifpeople think men benefit when gender is important to getting ahead, then men who holdthis belief should have lower expectations of benefiting from redistribution, and womenwho hold this belief should have higher expectations of benefiting. This effect shouldincrease support for redistribution in women who think that gender is important togetting ahead, and decrease support in self-interested men who think gender is importantto getting ahead. This reasoning also applies to race and beliefs that a person’s race isimportant to getting ahead. That is, the interaction term between the belief that gender isimportant to getting ahead in life and a dummy variable for male should be significant andnegative if people are purely self-interested, and analogously for race and beliefs about theeffect of race on getting ahead.
3. Results
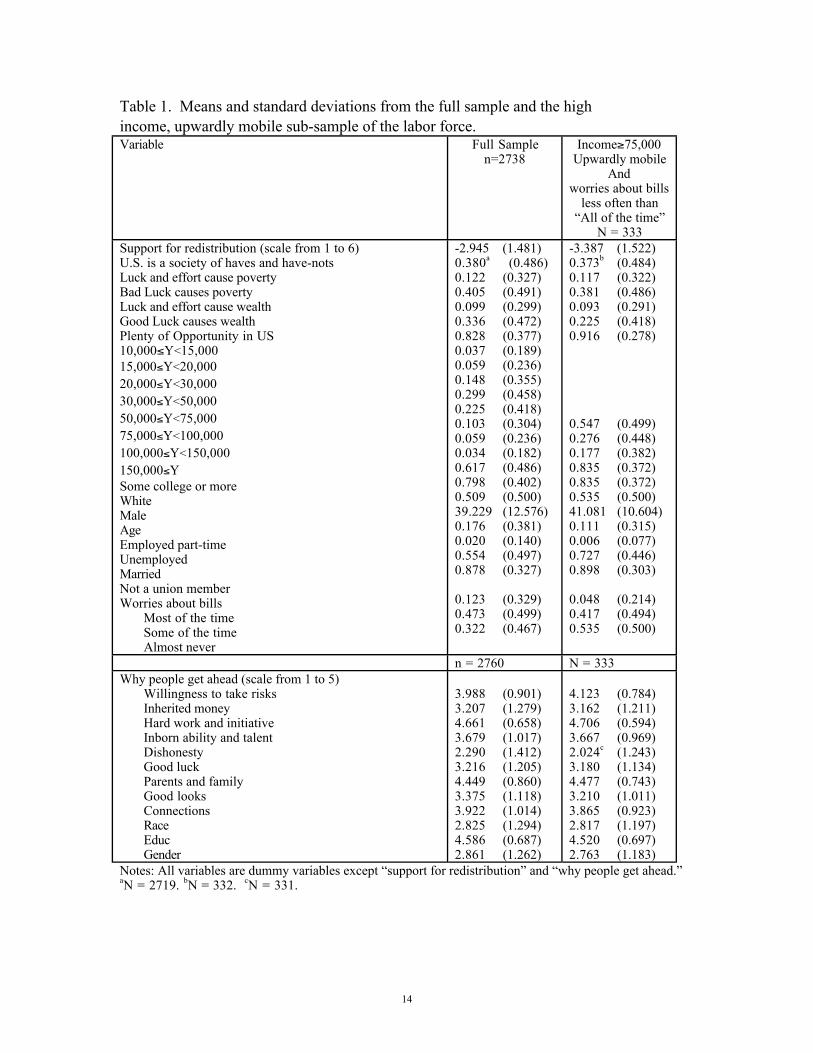
Selected summary statistics for the full sample of 2738 individuals are presentedin Table 1. A large majority (83%) of the respondents believe that there is plenty ofopportunity to work hard and get ahead in America today. Forty seven percent of the 13 The results are not sensitive to the sample choice. The beliefs variables are jointly significant in everyhigh-income sample that I tried, including one of individuals who reported annual family incomes of$100,000 or more and expected their lives to improve in the next five years.
8
respondents report that lack of effort is to blame for poverty, while 57% believe thateffort is responsible if a person is rich. (See Table A2 for question wording.) A majorityof the respondents report support for redistribution on four of the five questions used toconstruct the dependent variable. (See Appendix) Thirty-eight percent of therespondents respond that America is a society of haves and have-nots. Compared to thefull sample, the high-income, upwardly mobile sub-sample has stronger average beliefs inself-determination, and has a higher percentage of people who are white, male, collegeeducated, non-union, and married. Fewer people in this group worry about bills all of thetime, and more of them have a full-time job.
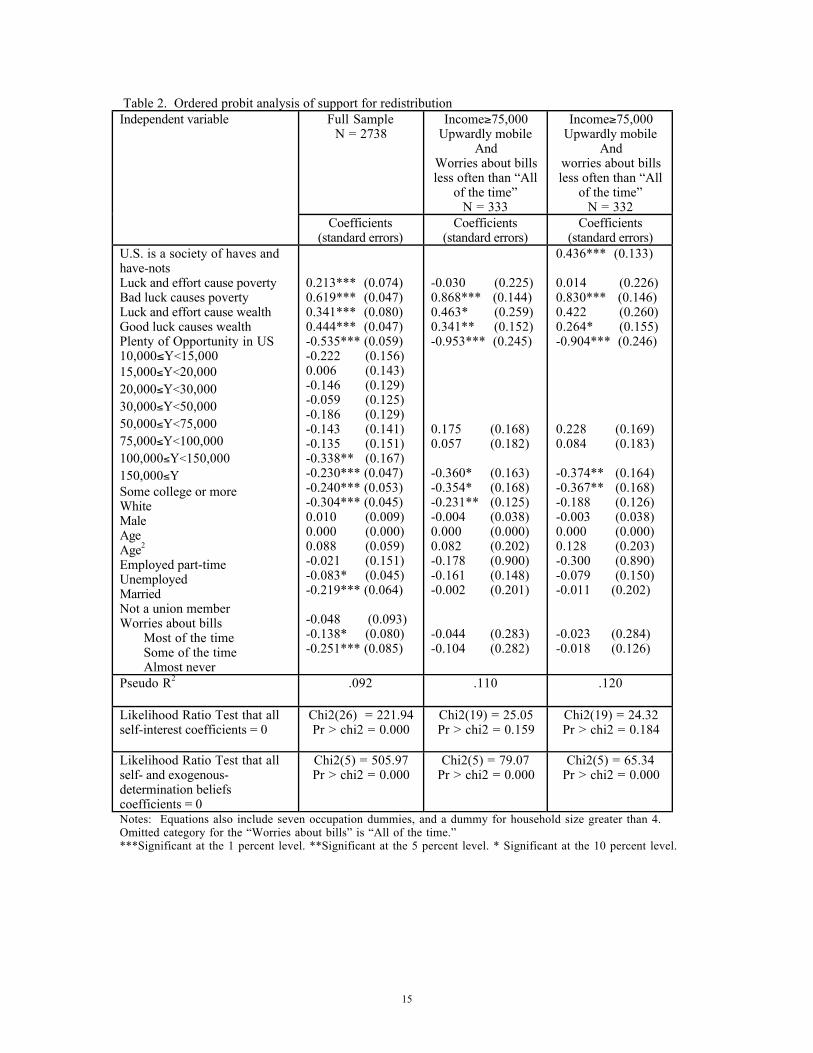
In column 1 of Table 2 I present results from the basic ordered probit regressionof support for redistribution on beliefs about self- and exogenous-determination and themeasures of self-interest. The coefficients on beliefs about self- and exogenous-determination all have the expected signs. Those who believe that wealth and poverty arecaused by external circumstances and those who believe that both external circumstancesand effort level are important show more support for redistribution than those whobelieve that effort level alone determines whether a person is rich or poor. The five beliefsdummy variables are both jointly and individually significant at the one percent level.
All of the significant self-interest variables have effects in the expected direction.Those with annual family incomes of $150,000 or more are significantly less supportiveof redistribution than those with incomes under $10,000. Whites, men, those with somecollege education or more, married people, non-union members, are all significantly lesssupportive of redistribution than their counterparts. Those who worry about bills someof the time and those who almost never worry about bills are significantly less supportiveof redistribution than those who worry all of the time. The self-interest variables arejointly significant at the one percent level.
In order to offer some interpretation of the basic regression (Column 1) in Table 2,I present selected marginal effects in Table 3. If we ignore the bold face type for amoment, then the columns of Table 3 contain the estimated probabilities that differenttypes of people will respond with a particular value of support for redistribution. Thereare six categories of the dependent variable, labeled 1 for the lowest level of support forredistribution to 6 for the highest. Someone who believes that bad luck causes povertyhas an almost zero probability of reporting the lowest level of support for redistribution,and a probability of .25 of reporting the highest level of support. The marginal effects arepresented in the rows labeled “change” in bold face type. These are the differencesbetween two types of people in the estimated response probabilities.
From this table, the magnitudes of the beliefs variables are apparent. In everycolumn, the marginal effects of reporting that bad luck as opposed to lack of effort causespoverty are roughly 2 times or more in magnitude than the marginal effects of being whiteinstead of black, male instead of female, and having some college education or more asopposed to having no college education. The marginal effects of having an income of$150,000 or more rather than an income of less than $10,000 are also smaller than themarginal effects of the self- and exogenous determination beliefs.
9
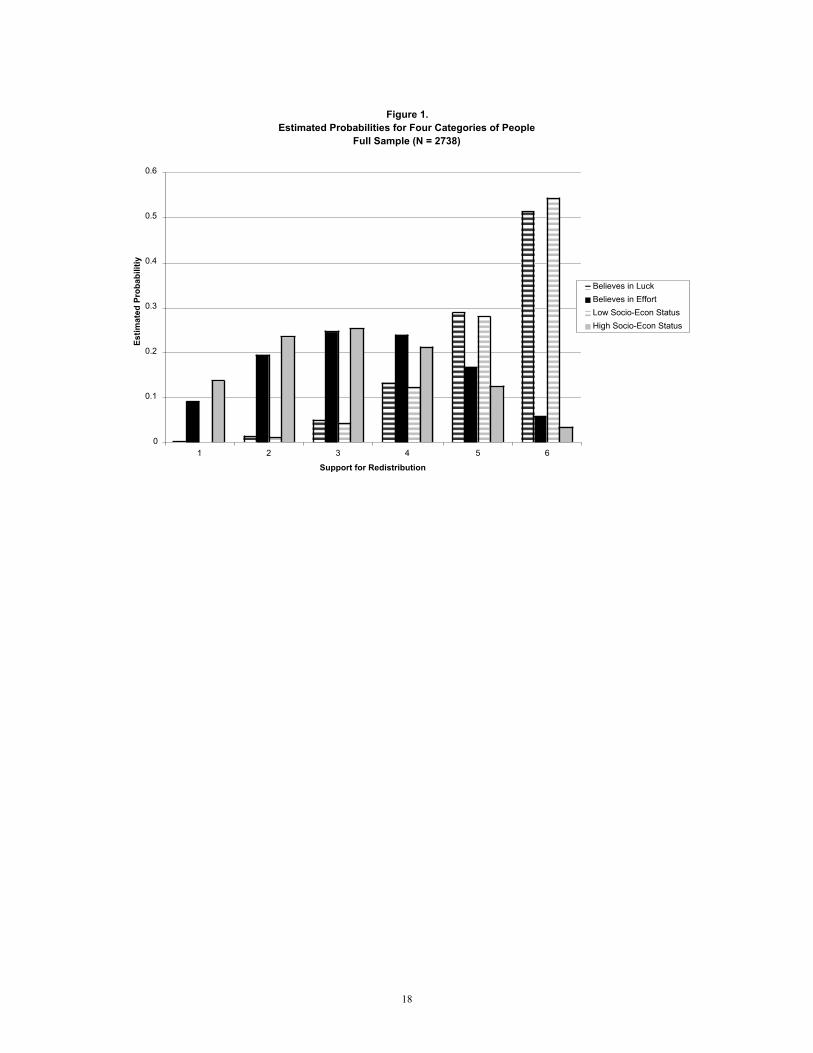
In Figure 1 I present predicted probabilities of responding in each category ofsupport for redistribution for four extreme types of people. In this illustration, I choosethe different types of people to maximize the differences in the estimated probabilitiesbetween them,14 subject to either the beliefs variables or the self-interest variables beingheld at the sample mean. The first bar in each of the six categories is the predictedprobability for someone with the strongest beliefs in exogenous-determination who hasaverage values for all of the self-interest measures. This is someone who believes that badluck causes poverty, good luck causes wealth, and that the US is not a land ofopportunity, and on all of the other variables has the sample mean. The second bar ineach category of support for redistribution is someone who believes that lack of effortcauses poverty, strong effort causes wealth, that the U.S. is a land of opportunity, andwho has the sample average on all of the other variables. The difference in the height ofthese two bars is the marginal effect of being one of these types instead of the other.
The third bar in each category of support for redistribution is someone withaverage beliefs about self- and exogenous-determination, but who is in the lowest socio-economic category. This person is non-white, female, single, a union member, and a part-time worker.15 She has no college education, has an annual family income of less than$10,000, has a household size that is greater than four, and reports that she almost alwaysworries about bills. Her occupation is calculated according to the distribution of non-management or non-finance occupations in the sample. The fourth bar in each category ofthe dependent variable is again someone with average beliefs about external constraintsand self-determination, but who is in the highest socio-economic category. This person iswhite, male, married, non-union, a full-time worker in management or finance, has ahousehold size of less than four, and almost never worries about bills. He has somecollege education or more, and has an annual family income of $150,000 or more. WhatFigure 1 suggests is that the effect of self- and exogenous-determination beliefs is almostas large as the effect of being extremely privileged compared to being extremelyunderprivileged.
In column 2 of Table 2, I present ordered probit coefficients from the basicequation for a high-income, upwardly mobile sub-sample. The sub-sample in column 2has an annual family income of $75,000 or more, expects life to improve, and worriesabout bills less frequently than “all of the time.” I present results from the likelihoodratio tests of (H1) and (H2). The self-interest variables are jointly insignificant while theself- and exogenous-determination beliefs are jointly significant at the 1 percent level. Thekey point of this test is that in samples that are so well-off that there is no plausible orstatistical effect of self-interest on support for redistribution, beliefs about the causes ofincome still have a large and highly significant effect.
I find similar results (not reported) from the likelihood ratio tests of (H1) and(H2) on the sub-sample of respondents who have annual family incomes of less than$10,000 and who worry about bills more often than “almost never.” The self-interest 14 The single exception is that I use the sample mean of age and age squared for all four types of people.15 The category “unemployed” did not have a significantly different effect from full-time employees, so thecomparison that shows the largest self-interest effect is between full-time and part-time workers.
10
measures are jointly insignificant at the 10% level.16 The beliefs in self- and exogenous-determination are jointly significant at the 1% level and have the expected signs.
In column 3 of Table 2 I add a dummy variable for whether or not America is asociety of haves and have-nots to the specification. This variable has a significantpositive effect on support for redistribution. To the extent that this variable measuresbeliefs about the prevalence of poverty, or indicates the respondent’s perception of thesize of the poverty problem in the United States, this result is inconsistent with self-interest. High-income, upwardly mobile individuals motivated purely by financial self-interest should not demand redistribution, and therefore the prevalence of poverty shouldbe irrelevant to them. One possible interpretation is that the effect of beliefs about theextent of inequality in the U.S. has something to do with the perceived need forredistribution: to maintain constant benefits, redistributive spending has to be higher if theperceived number of potential recipients is higher.
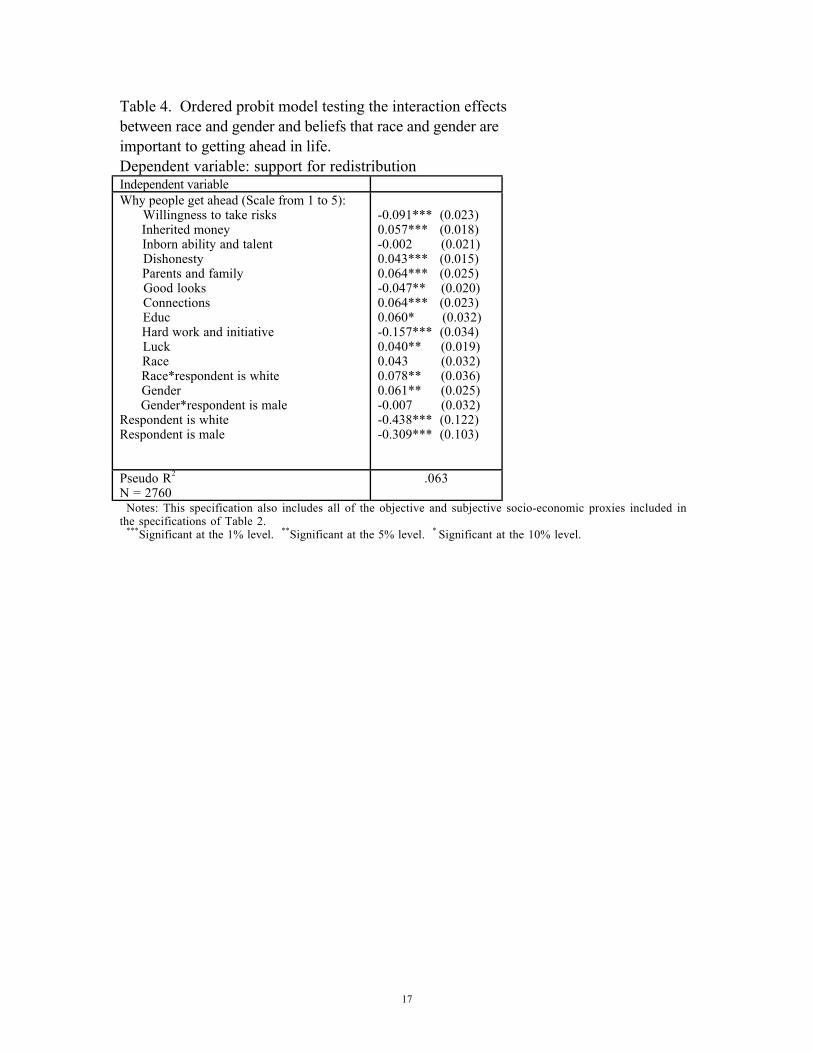
Table 5 presents a regression of support for redistribution on the importance ofvarious determinants of success, controlling for the full set of self-interest measures. Thebeliefs about the importance of the various factors to getting ahead in life are allsignificant, except for beliefs about the importance of talent. The significant effects are inthe expected directions. The negative finding on talent is consistent with previousresearch.
The results in Table 5 are difficult to explain by self-interest. If the effect of thesevariables on support for redistribution operates solely through self-interest, then beliefsthat race and gender determine success should result in a negative interaction term for menand whites because of their lower expected government receipts. Yet, the interactionterms show that there is no significant difference between the slope coefficients of menand women on beliefs that a person’s gender is important to getting ahead. The findingson race are even stronger. The effect of believing that race is important to getting ahead inlife is significantly more positive for men than for women. This interaction effect is in theopposite direction from that predicted by self-interest.17
4. Conclusion
Many scholars argue that self-interest is a sufficient assumption to make in thestudy of redistributive politics, and some still strongly defend this position. To others, itis equally obvious that social preferences play an important role. This paper attempts tooffer a few rigorous tests on the character of redistributive preferences.
16 The self-interest measures included in this equation are race, gender, age, age squared, the frequency withwhich the respondent worries about bills, a dummy for household size greater than four, a dummy for part-time workers, and a dummy for those who are not working. The not-working dummy includes theunemployed as well as people who are not in the labor force.17 The findings concerning the interactions of race and gender and beliefs about the importance of aperson’s race and gender to getting ahead are quite stable with respect to specification and sample sizechanges.
11
From the perspective of the self-interest model, income is a surprisingly poorpredictor of redistributive beliefs. The marginal effects of having an income of $150,000or more, compared to an income of under $10,000 are smaller than the marginal effects ofeach of the three measures of beliefs about the role of effort, luck, and opportunity in lifeoutcomes. In fact, even the combined effect of a wide set of possible self-interestmeasures is roughly equivalent to the combined effect of the three beliefs measures.Furthermore, there is variance in the redistributive attitudes of the richest and poorestpeople in the sample, and this needs to be explained. In the high and low income samples,self-interest measures are jointly insignificant. In contrast, beliefs about self- andexogenous determination are strong predictors of support for redistribution in the full,high-income, and low-income samples.
However, before we conclude that these results are evidence of reciprocity orequity, let us consider another mechanism through which self- and exogenous-determination beliefs may affect demand for redistribution: through the perceptions ofand concerns about the incentive effects of taxation. In theory, when earned income ismore sensitive to work effort, taxation could cause greater effort disincentives. That is, taxcosts may be increasing in the income elasticity with respect to effort. If so, then beliefsabout the roles of effort, luck, and opportunity in generating income may affect the levelof support for redistribution. (Piketty, 1995) This type of incentive concern need notapply only to self-interested demand for redistribution. Tax cost concerns can reducedemand for any tax-funded expenditure, including redistribution that arises out of self-interest, altruism, the equity principle, reciprocity, or unrelated expenditures such asnational defense. (Atkinson, 1999)
I use the 1990 General Social Survey to produce some evidence on this matter. Iestimate ordered probit regressions predicting support for spending on welfare, nationaldefense, halting the rising crime rate, and dealing with drug addiction, respectively.18 (SeeAppendix) The independent variables are beliefs that the poor are poor because of lack ofeffort, and five demographic variables (income, education, race, gender, and age). Twoself-determination belief dummies - lack of effort is very important and lack of effort issomewhat important in causing poverty – have negative effects on support forredistribution (significant at the 1% level) relative to believing that lack of effort is notimportant. However, beliefs in self-determination have no effect on support for spendingon crime or drug addiction, and they have a significant positive effect on support forspending on defense.19 If the self-determination beliefs simply measure tax cost concerns,then their effect on support for all of these expenditure items should have been negative. 18 The sample size in these regressions ranges from 584 to 594.19 There is a second type of potential incentive cost that I will call transfer incentive costs. This is thepossibility that transfer payments might affect the labor market decisions of recipients. (Atkinson, 1999)It is unclear why transfer incentive costs would depend on the income elasticity with respect to effort.However, it is possible to construct theoretical examples where it does, so I offer some suggestive evidencefrom the 1990 General Social Survey. Suppose we accept the evidence above against tax cost concerns andtest whether or not self- and exogenous-determination beliefs capture the effect of transfer costs only. I useordered probit to estimate a model that predicts support for spending on welfare, foreign aid, on“improving the conditions of blacks,” controlling for beliefs about self- and exogenous-determination andfive demographic variables (education, income, race, gender, and age). Those who think poverty is caused
12
The finding that self-determination beliefs have no effect on support for spendingon crime or drugs relates to the question of whether or not prudential concerns aboutcontrolling social unrest explain redistributive attitudes. The GSS evidence suggests thatthe effect of self-determination beliefs on support for redistribution cannot be explainedby tax cost concerns combined with prudential motives. However, we can test for thedirect effect of prudential concerns. I estimated an ordered probit model predictingsupport for welfare spending. The independent variables are beliefs in self-determination,support for spending on crime, and five demographic variables (education, income, race,gender, and age).20 I also estimated an equation that is identical except that it includedsupport for spending on drug addiction instead of support for spending on crime.21
Support for spending on both crime and drugs has a significant positive effect on supportfor spending on welfare. These effects are slightly smaller and less significant than theeffect of self-determination beliefs. This can be interpreted as evidence that prudentialconcerns for controlling crime affect support for redistribution, along with self- andexogenous-determination beliefs, and financial self-interest. Unfortunately, the samplesizes are too small to check for robustness of this result with respect to the kinds ofspecification and sample changes that are presented for the Gallup data.
The effect of beliefs about the prevalence of poverty on support for redistributionmay be interpreted in several ways. First, the belief about the prevalence of poverty maybe a perception of the number of potential recipients. To hold benefits constant,spending must increase if there are more recipients. Given this, any explanation thatcould explain support for redistribution in the high-income sample would be consistentwith this finding. In unreported regressions, I found that the belief about the prevalenceof poverty is usually significant whether or not we control for self- and exogenous-determination beliefs, but it is not as robust to sample size and specification changes asthe self- and exogenous-determination beliefs. Therefore, whether the findings areinterpreted as consistent with altruism or equity, the strongest result in this paper is theeffect of self- and exogenous-determination beliefs.
In short, in two data sets, and in every specification and sub-sample, self- andexogenous-determination beliefs have large and significant effects on support forredistribution. Tax cost concerns appear not to explain this effect. A more likelyinterpretation is that people are reciprocal or hold strong principles of equity. A strongtaste for equity or reciprocity is consistent with the basic concept of insuring industriouspeople against bad luck, but not providing unconditional assistance to the poor if theircondition is due to idleness. Nonetheless, altruism may play a role as well, because
by lack of effort are significantly less supportive of all three types of spending. Given the “improving theconditions” wording of the race question, the concern that spending will reduce effort and increase thecaseload seems misplaced. It seems particularly unlikely that foreign aid would cause individual transferdisincentives. On the other hand, if people are simply unwilling to support the undeserving poor but willsupport the deserving poor, then self- and exogenous-determination beliefs could have an effect on all threeof these questions.20 N = 567.21 N = 568
13
simply perceiving that there is more poverty increases support for it in high-incomesamples.
The importance if social preferences suggests a broader search for plausibleresolutions to outstanding puzzles in the political economy of the welfare states andtaxation. For example, according to models based on the standard self-interestassumption (Meltzer and Richard (1981), Sinn (1995)) demand for redistribution shouldincrease as the ratio of the median income to the mean income in the economy decreases.However, whether or not this is the case empirically has been a matter of some debate.Extending our understanding about what motivates support for and opposition toredistribution may guide research on this question. The effects of inequality on demandfor redistribution differ from those of the standard model when social preferences areimportant. For instance, one possibility might be that inequality increases social distancebetween the rich and the poor, making the rich less sympathetic, or causing them to holdthe poor more responsible for their low incomes. Another possibility is that the effectsof income inequality on demand for redistribution are less important than other factorssuch as actual and perceived racial composition of welfare recipients (Luttmer (1998)), ordesign features of the redistributive programs themselves that make them more or lesslikely to insure poverty caused by exogenous circumstances.
14
Table 1. Means and standard deviations from the full sample and the highincome, upwardly mobile sub-sample of the labor force.Variable Full Sample
n=2738Income≥75,000
Upwardly mobileAnd
worries about billsless often than
“All of the time”N = 333
Support for redistribution (scale from 1 to 6)U.S. is a society of haves and have-notsLuck and effort cause povertyBad Luck causes povertyLuck and effort cause wealthGood Luck causes wealthPlenty of Opportunity in US10,000≤Y<15,00015,000≤Y<20,00020,000≤Y<30,00030,000≤Y<50,00050,000≤Y<75,00075,000≤Y<100,000100,000≤Y<150,000150,000≤YSome college or moreWhiteMaleAgeEmployed part-timeUnemployedMarriedNot a union memberWorries about bills
Most of the timeSome of the timeAlmost never
-2.945 (1.481)0.380a (0.486)0.122 (0.327)0.405 (0.491)0.099 (0.299)0.336 (0.472)0.828 (0.377)0.037 (0.189)0.059 (0.236)0.148 (0.355)0.299 (0.458)0.225 (0.418)0.103 (0.304)0.059 (0.236)0.034 (0.182)0.617 (0.486)0.798 (0.402)0.509 (0.500)39.229 (12.576)0.176 (0.381)0.020 (0.140)0.554 (0.497)0.878 (0.327)
0.123 (0.329)0.473 (0.499)0.322 (0.467)
-3.387 (1.522)0.373b (0.484)0.117 (0.322)0.381 (0.486)0.093 (0.291)0.225 (0.418)0.916 (0.278)
0.547 (0.499)0.276 (0.448)0.177 (0.382)0.835 (0.372)0.835 (0.372)0.535 (0.500)41.081 (10.604)0.111 (0.315)0.006 (0.077)0.727 (0.446)0.898 (0.303)
0.048 (0.214)0.417 (0.494)0.535 (0.500)
n = 2760 N = 333Why people get ahead (scale from 1 to 5)
Willingness to take risksInherited moneyHard work and initiativeInborn ability and talentDishonestyGood luckParents and familyGood looksConnectionsRaceEducGender
3.988 (0.901)3.207 (1.279)4.661 (0.658)3.679 (1.017)2.290 (1.412)3.216 (1.205)4.449 (0.860)3.375 (1.118)3.922 (1.014)2.825 (1.294)4.586 (0.687)2.861 (1.262)
4.123 (0.784)3.162 (1.211)4.706 (0.594)3.667 (0.969)2.024c (1.243)3.180 (1.134)4.477 (0.743)3.210 (1.011)3.865 (0.923)2.817 (1.197)4.520 (0.697)2.763 (1.183)
Notes: All variables are dummy variables except “support for redistribution” and “why people get ahead.”aN = 2719. bN = 332. cN = 331.
15
Table 2. Ordered probit analysis of support for redistributionFull Sample
N = 2738Income≥75,000
Upwardly mobileAnd
Worries about billsless often than “All
of the time”N = 333
Income≥75,000Upwardly mobile
Andworries about billsless often than “All
of the time”N = 332
Independent variable
Coefficients(standard errors)
Coefficients(standard errors)
Coefficients(standard errors)
U.S. is a society of haves andhave-notsLuck and effort cause povertyBad luck causes povertyLuck and effort cause wealthGood luck causes wealthPlenty of Opportunity in US10,000≤Y<15,00015,000≤Y<20,00020,000≤Y<30,00030,000≤Y<50,00050,000≤Y<75,00075,000≤Y<100,000100,000≤Y<150,000150,000≤YSome college or moreWhiteMaleAgeAge2
Employed part-timeUnemployedMarriedNot a union memberWorries about bills
Most of the timeSome of the timeAlmost never
0.213*** (0.074)0.619*** (0.047)0.341*** (0.080)0.444*** (0.047)-0.535*** (0.059)-0.222 (0.156)0.006 (0.143)-0.146 (0.129)-0.059 (0.125)-0.186 (0.129)-0.143 (0.141)-0.135 (0.151)-0.338** (0.167)-0.230*** (0.047)-0.240*** (0.053)-0.304*** (0.045)0.010 (0.009)0.000 (0.000)0.088 (0.059)-0.021 (0.151)-0.083* (0.045)-0.219*** (0.064)
-0.048 (0.093)-0.138* (0.080)-0.251*** (0.085)
-0.030 (0.225)0.868*** (0.144)0.463* (0.259)0.341** (0.152)-0.953*** (0.245)
0.175 (0.168)0.057 (0.182)
-0.360* (0.163)-0.354* (0.168)-0.231** (0.125)-0.004 (0.038)0.000 (0.000)0.082 (0.202)-0.178 (0.900)-0.161 (0.148)-0.002 (0.201)
-0.044 (0.283)-0.104 (0.282)
0.436*** (0.133)
0.014 (0.226)0.830*** (0.146)0.422 (0.260)0.264* (0.155)-0.904*** (0.246)
0.228 (0.169)0.084 (0.183)
-0.374** (0.164)-0.367** (0.168)-0.188 (0.126)-0.003 (0.038)0.000 (0.000)0.128 (0.203)-0.300 (0.890)-0.079 (0.150)-0.011 (0.202)
-0.023 (0.284)-0.018 (0.126)
Pseudo R2 .092 .110 .120
Likelihood Ratio Test that allself-interest coefficients = 0
Chi2(26) = 221.94Pr > chi2 = 0.000
Chi2(19) = 25.05Pr > chi2 = 0.159
Chi2(19) = 24.32Pr > chi2 = 0.184
Likelihood Ratio Test that allself- and exogenous-determination beliefscoefficients = 0
Chi2(5) = 505.97Pr > chi2 = 0.000
Chi2(5) = 79.07Pr > chi2 = 0.000
Chi2(5) = 65.34Pr > chi2 = 0.000
Notes: Equations also include seven occupation dummies, and a dummy for household size greater than 4. Omitted category for the “Worries about bills” is “All of the time.”***Significant at the 1 percent level. **Significant at the 5 percent level. * Significant at the 10 percent level.

16
Table 3. Selected Marginal Effects of Regressors in Table 2, Column 1.P[support=1] P[support=2] P[support=3] P[support=4] P[support=5] P[support=6]
Lack of effort causespoverty
0.054 0.146 0.223 0.258 0.219 0.099
Bad luck causespoverty
0.013 0.059 0.136 0.233 0.306 0.252
Change -0.041 -0.087 -0.087 -0.025 0.087 0.153Strong effort causeswealth
0.045 0.131 0.212 0.26 0.236 0.116
Good luck causeswealth
0.016 0.068 0.148 0.242 0.299 0.227
Change -0.029 -0.063 -0.064 -0.018 0.063 0.111Not muchopportunity in U.S.
0.010 0.05 0.121 0.222 0.313 0.285
Plenty ofopportunity in U.S.
0.037 0.116 0.2 0.26 0.252 0.135
Change 0.027 0.066 0.079 0.038 -0.061 -0.150Non-white 0.019 0.076 0.159 0.248 0.292 0.206White 0.033 0.109 0.194 0.26 0.259 0.149Change 0.014 0.033 0.035 0.012 -0.033 -0.057Female 0.021 0.081 0.164 0.25 0.288 0.196Male 0.042 0.125 0.208 0.261 0.242 0.123Change 0.021 0.044 0.044 0.011 -0.046 -0.073No college 0.022 0.083 0.166 0.251 0.286 0.192Some college ormore
0.036 0.116 0.199 0.26 0.252 0.136
Change 0.014 0.033 0.033 0.009 -0.034 -0.056Income<10,000 0.023 0.085 0.169 0.252 0.284 0.187Income≥150,000 0.048 0.136 0.216 0.26 0.23 0.110Change 0.025 0.051 0.047 0.008 -0.054 -0.077Marginal effects are in bold type in the rows labeled “Change.” The marginal effects shown are thedifferences between two types of respondent (e.g., those who reported that bad luck causes povertyrelative to those who reported that lack of effort causes poverty) in the probabilities of having aparticular value of the dependent variable support for redistribution.
17
Table 4. Ordered probit model testing the interaction effectsbetween race and gender and beliefs that race and gender areimportant to getting ahead in life.Dependent variable: support for redistributionIndependent variableWhy people get ahead (Scale from 1 to 5): Willingness to take risks Inherited money Inborn ability and talent Dishonesty Parents and family Good looks Connections Educ Hard work and initiative Luck Race Race*respondent is white Gender Gender*respondent is maleRespondent is whiteRespondent is male
-0.091*** (0.023)0.057*** (0.018)-0.002 (0.021)0.043*** (0.015)0.064*** (0.025)-0.047** (0.020)0.064*** (0.023)0.060* (0.032)-0.157*** (0.034)0.040** (0.019)0.043 (0.032)0.078** (0.036)0.061** (0.025)-0.007 (0.032)-0.438*** (0.122)-0.309*** (0.103)
Pseudo R2
N = 2760.063
Notes: This specification also includes all of the objective and subjective socio-economic proxies included inthe specifications of Table 2.
***Significant at the 1% level. **Significant at the 5% level. * Significant at the 10% level.
18
Figure 1.Estimated Probabilities for Four Categories of People
Full Sample (N = 2738)
0
0.1
0.2
0.3
0.4
0.5
0.6
1 2 3 4 5 6
Support for Redistribution
Est
imat
ed P
rob
abili
tiy
Believes in Luck
Believes in Effort
Low Socio-Econ Status
High Socio-Econ Status
19
I am especially indebted to Samuel Bowles for his guidance in this research, and amgrateful to two anonymous referees for comments and George Loewenstein for helpfuldiscussion. Financial support was provided by the MacArthur Foundation Network onInequality, Washington University, and the MacArthur Foundation Preferences Network.
ReferencesAndreoni, J., 1989. Giving with Impure Altruism: Applications to Charity and Ricardian
Equivalence. Journal of Political Economy 97(6), 1447-1458.Barr, N., 1992. Economic Theory and the Welfare State: A Survey and Interpretation.
Journal of Economic Literature. 30 (June), 741-803.Blount, S., 1995. When Social Outcomes Aren’t Fair: The Effect of Causal Attributions
on Preferences. Organizational Behavior and Human Decision Processes 63 (2), 131-144.
Bowles, S., Gintis, H., 2000. Reciprocity, Self-Interest and the Welfare State. TheNordic Journal of Political Economy. 26 (Jan.).
Deutsch, M., 1985. Distributive Justice. Yale University Press, New Haven.Gallup Organization, 1998. Haves and Have-Nots: Perceptions of Fairness and
Opportunity. Gallup Poll Social Audit Survey conducted by telephone with arandomly selected national sample of 5001 adults conducted between April 23 andMay 31, 1998.
Gilens, M. 1999. Why Americans Hate Welfare: Race, Media, and the Politics of Anti-Poverty Policy. Chicago University Press.
Greene, W.H., 1997. Econometric Analysis. MacMillan, New York.Kluegel, J., Smith, E., 1986. Beliefs About Inequality: Americans Views of What is and
What Ought to Be. Aldine de Gruyter, New York.Luttmer, E., 1998. Group Loyalty and the Taste for Redistribution. Mimeographed. The
Irving B. Harris School of Public Policy Studies, The University of Chicago.Meltzer, A., Richard, S, 1981. A Rational Theory of the Size of Government. Journal of
Political Economy 89 (5), 814-927.Miller, D., 1992. Distributive Justice: What the People Think. Ethics. 102 (April), 555-
593.Moffitt, R., 1998. The decline of Welfare Benefits in the U.S.: The Role of Wage
Inequality. Journal of Public Economics. 68 (3), 421-452.Moffitt, R., 1999. Explaining Welfare Reform: Public Choice and the Labor Market.
Mimeographed. Johns Hopkins University.Piketty, T., 1995. Social Mobility and Redistributive Politics. The Quarterly Journal of
Economics CX (3), 551-584.Piketty, T., 1999. Attitudes Toward Income Inequality in France: Do People Really
Disagree? Mimeographed, Cepremap, Paris.Rabin, M., 1993. Incorporating Fairness into Game Theory. American Economic Review
83 (5), 1281-1302.Romer, Paul 1994. Preferences, Promises, and the Politics of Entitlement. In:
20
Fuchs, V.R., 1994. Individual and Social Responsibility: Child Care, Education, MedicalCare, and Long-Term Care in America. The University of Chicago Press, Chicago andNew York, pp. 195-228.
Sinn, H.W., 1995. A Theory of the Welfare State. Scandinavian Journal of Economics, 97:495-526.
Sugden, R., 1982. On the Economics of Philanthropy. Economic Journal, 92 (June): 341-350.
Walster, E.G., Walster, W., Berscheid, E. 1978. Equity: Theory and Research. Allyn andBacon, Boston.

21
AppendixDependent Variables in Gallup Data
The measure of redistributive preferences is a summative scale of the questionsbelow. The measure is increasing in support for redistribution, so the signs of questions1, 2, 3, and 5 are reversed.Table A1. Questions used in the construction of the dependent variable measuring support for redistribution.Question Aggregate Response (N=2738)*1) People feel differently about how far agovernment should go. Here is a phrase whichsome people believe in and some don’t. Do youthink our government should or should notredistribute wealth by heavy taxes on the rich?
Should: 46.1%Should Not: 53.9%
2) Some people feel that the government inWashington, DC should make every possible effortto improve the social and economic position of thepoor. Others feel that the government should notmake any special effort to help the poor, becausethey should help themselves. How do you feelabout this?
Government should help the poor: 69.7%The poor should help themselves: 30.3%
3) Which one of the following groups do you thinkhas the greatest responsibility for helping the poor:churches, private charities, the government, thefamilies and relatives of poor people, the poorthemselves, or someone else?
Groups other than the poor: 69.8%The poor themselves: 30.2%
4) Do you feel that the distribution of money andwealth in this country today is fair, or do you feelthat the money and wealth in this country should bemore evenly distributed among a larger percentageof the people?
Distribution is fair: 33.4%Should be more evenly distributed: 66.6%
5) Do you think that the fact that some people inthe United States are rich and others are poor 1)represents a problem that needs to be fixed or 2) Isan acceptable part of our economic system?
Problem: 53.3%Acceptable: 46.8%
Note: Of respondents with incomes of at least $150,000 and who also expected upward mobility in thenext five years, the percentage responding in favor of redistribution is 24%, 67%, 63%, 48%, and 45% forquestions 1 through 5, respectively. In this sub-sample, there are 84 observations for all but the secondquestion, which has 81 observations.
22
Independent Variables in Gallup Data
Plenty of Opportunity in the US: Some people say that there’s not much opportunity inAmerica today – that the average person doesn’t have much chance to really get ahead.Others say there’s plenty of opportunity and anyone who works hard can go as far asthey want. Which one comes closer to the way you feel about this? 1) Not muchopportunity 2) Plenty of opportunity
Causes of poverty: Just in your opinion, which is more often to blame if a person is poor– lack of effort on his or her part, or circumstances beyond his or her control? 1) Lack ofeffort 2) Both 3) Luck or circumstances beyond his/her control.
Causes of wealth: Just in your opinion, which is more often to blame if a person is rich –strong effort on his or her part, or circumstances beyond his or her control? 1) Strongeffort 2) Both 3) Luck or circumstances beyond his/her control.
Determinants of Success: I am going to read several reasons why some people get aheadand succeed in life and others do not. Using a one-to-five scale, where “1” means not atall important and “5” means extremely important, please tell me how important it is as areason for a person’s success. You can choose any number from one to five. First,
A: How important is willingness to take risksB: How important is money inherited from familiesC: How important is hard work and initiativeD: How important is ability or talent that a person is born withE: How important is dishonesty and willingness to take what they can getF: How important is good luck, being in the right place at the right timeG: How important is parents and the family environment they grow up inH: How important is physical appearance and good looksI: How important is [sic] connections and knowing the right peopleJ: How important is being a member of a particular race or ethnic groupK: How important is getting the right education or trainingL: How important is a person’s gender, that is whether they are male or female
America is society of haves and have-nots: Some people think of American society asdivided into two groups – the “haves” and “have-nots”, while others think it’s incorrectto think of America that way. Do you, yourself, think of America as divided into havesand have-nots, or don’t you think of America that way? 1) Yes, think that way 2) No,don’t think that way.
Mobility: Mobility measures are constructed from the following three questions:
1. “Think of a picture of a ladder. Suppose we say that the top of the ladderrepresents the best possible life for you, and the bottom represents the worst
23
possible life for you. If the top step is “10” and the bottom step is “0”, onwhich step of the ladder do you feel you personally stand at the present time?
2. “On which step would you say you stood five years ago?”3. “Just your best guess, on which step do you think you will stand in the
future, say about five years from now?”
Past mobility is the current ladder position minus the past ladder position. Futuremobility is the future ladder position minus the current ladder position.
Variables in General Social Survey Data
“We are faced with many problems in our country, none of which can be solved easily ofinexpensively. I’m going to name some of these problems, and for each one I’d like youto tell me whether you think we’re spending too much money on it, too little money, orabout the right amount. First (READ ITEM A) … are we spending too much, too little,or about the right amount on (ITEM)”
Items Used:
Halting the rising crime rate: 1) too little 2) about right 3) too muchDealing with drug addiction: 1) too little 2) about right 3) too muchImproving the conditions of blacks: 1) too little 2) about right 3) too muchThe military, armaments and defense: 1) too little 2) about right 3) too muchForeign aid: 1) too little 2) about right 3) too muchWelfare: 1) too little 2) about right 3) too much
Note: “Don’t know” is coded as missing. I reverse the order of the responses sothat they increase in support for spending.
“Now I will [read] a list of reasons some people give to explain why there are poorpeople in this country. Please tell me whether you feel each of these is very important,somewhat important, or not important in explaining why there are poor people in thiscountry.”
Lack of effort by the poor themselves: 1) very important 2) somewhat important3) not important
Note: “Don’t know” is coded as missing. I reverse the order of the responses sothat the measure increases in beliefs in self-determination.