money demand and the equilibrium 11 interest rate · money demand and 11 the equilibrium interest...
TRANSCRIPT

1 of 25 © 2014 Pearson Education, Inc.
CHAPTER OUTLINE
11 Money Demand and the Equilibrium
Interest Rate
Interest Rates and Bond Prices
The Demand for Money The Transaction Motive The Speculation Motive The Total Demand for Money The Effect of Nominal Income on the Demand for Money
The Equilibrium Interest Rate Supply and Demand in the Money Market Changing the Money Supply to Affect the Interest Rate Increases in P • Y and Shifts in the Money Demand Curve Zero Interest Rate Bound
Looking Ahead: The Federal Reserve and Monetary Policy
Appendix A: The Various Interest Rates in the U.S. Economy
Appendix B: The Demand for Money: A Numerical Example

2 of 25 © 2014 Pearson Education, Inc.
Interest Rates and Bond Prices
interest The fee that borrowers pay to lenders for the use of their funds. Firms and governments borrow funds by issuing bonds, and they pay interest to the lenders that purchase the bonds. Bonds are issued with a face value, typically in denominations of $1,000. They come with a maturity date—or the date when the face value of the bond is paid out, and they offer a fixed yearly payment, known as a coupon. A key relationship that we will use in this chapter is that market-determined prices of existing bonds and interest rates are inversely related. Given a bond’s market-determined price, its face value, its maturity, and its coupon, the interest rate, or yield, on that bond can be calculated. Interest rates are thus indirectly determined by the bond market.

3 of 25 © 2014 Pearson Education, Inc.
transaction motive The main reason that people hold money—to buy things.
When we speak of the demand for money, we are concerned with how much of your financial assets you want to hold in the form of money, which does not earn interest, versus how much you want to hold in interest-bearing securities such as bonds.
The Demand for Money
The Transaction Motive
nonsynchronization of income and spending The mismatch between the timing of money inflow to the household and the timing of money outflow for household expenses.

4 of 25 © 2014 Pearson Education, Inc.
Income arrives only once a month, but spending takes place continuously.
� FIGURE 11.1 The Nonsynchronization of Income and Spending
The Transaction Motive

5 of 25 © 2014 Pearson Education, Inc.
Jim could decide to deposit his entire paycheck ($1,200) into his checking account at the start of the month and run his balance down to zero by the end of the month. In this case, his average balance would be $600.
� FIGURE 11.2 Jim’s Monthly Checking Account Balances: Strategy 1

6 of 25 © 2014 Pearson Education, Inc.
Jim could also choose to put half of his paycheck into his checking account and buy a bond with the other half of his income. At midmonth, Jim would sell the bond and deposit the $600 into his checking account to pay the second half of the month’s bills. Following this strategy, Jim’s average money holdings would be $300.
� FIGURE 11.3 Jim’s Monthly Checking Account Balances: Strategy 2
There is a level of average money balances that earns Jim the most profit, taking into account both the interest earned on bonds and the costs paid for switching from bonds to money. This level is his optimal balance.

7 of 25 © 2014 Pearson Education, Inc.
The quantity of money demanded (the amount of money households and firms want to hold) is a function of the interest rate. Because the interest rate is the opportunity cost of holding money balances, increases in the interest rate reduce the quantity of money that firms and households want to hold and decreases in the interest rate increase the quantity of money that firms and households want to hold.
� FIGURE 11.4 The Demand Curve for Money Balances

8 of 25 © 2014 Pearson Education, Inc.
speculation motive One reason for holding bonds instead of money: Because the market price of interest-bearing bonds is inversely related to the interest rate, investors may want to hold bonds when interest rates are high with the hope of selling them when interest rates fall.
The Speculation Motive

9 of 25 © 2014 Pearson Education, Inc.
The total quantity of money demanded in the economy is the sum of the demand for checking account balances and cash by both households and firms.
At any given moment, there is a demand for money—for cash and checking account balances. Although households and firms need to hold balances for everyday transactions, their demand has a limit. For both households and firms, the quantity of money demanded at any moment depends on the opportunity cost of holding money, a cost determined by the interest rate.
The Total Demand for Money

10 of 25 © 2014 Pearson Education, Inc.
� FIGURE 11.5 An Increase in Nominal Aggregate Output (Income) (P •Y) Shifts the Money Demand Curve to the Right
The Effect of Nominal Income on the Demand for Money

11 of 25 © 2014 Pearson Education, Inc.
TABLE 11.1 Determinants of Money Demand
1. The interest rate: r (The quantity of money demanded is a negative function of the interest rate.)
2. Aggregate nominal output (income) P • Y a. Real aggregate output (income): Y (An increase in Y shifts the
money demand curve to the right.)
b. The aggregate price level: P (An increase in P shifts the money demand curve to the right.)
The demand for money depends negatively on the interest rate, r, and positively on real income, Y, and the price level, P.

12 of 25 © 2014 Pearson Education, Inc.
We are now in a position to consider one of the key questions in macroeconomics: How is the interest rate determined in the economy?
The point at which the quantity of money demanded equals the quantity of money supplied determines the equilibrium interest rate in the economy.
The Equilibrium Interest Rate

13 of 25 © 2014 Pearson Education, Inc.
Equilibrium exists in the money market when the supply of money is equal to the demand for money and thus when the supply of bonds is equal to the demand for bonds. At r0 the price of bonds would be bid up (and thus the interest rate down). At r1 the price of bonds would be bid down (and thus the interest rate up).
� FIGURE 11.6 Adjustments in the Money Market
Supply and Demand in the Money Market

14 of 25 © 2014 Pearson Education, Inc.
� FIGURE 11.7 The Effect of an Increase in the Supply of Money on the Interest Rate
An increase in the supply of money from MS
0 to MS1 lowers the
rate of interest from 7 percent to 4 percent.
Changing the Money Supply to Affect the Interest Rate

15 of 25 © 2014 Pearson Education, Inc.
� FIGURE 11.8 The Effect of an Increase in Nominal Income (P • Y) on the Interest Rate
An increase in nominal income (P • Y) shifts the money demand curve from Md
0 to Md1, which raises the
equilibrium interest rate from 4 percent to 7 percent.
Increases in P • Y and Shifts in the Money Demand Curve

16 of 25 © 2014 Pearson Education, Inc.
Zero Interest Rate Bound
By the middle of 2008 the Fed had driven the short-term interest rate close to zero, and it remained at essentially zero through the time of this writing (March 2013). The Fed does this, of course, by increasing the money supply until the intersection of the money supply at the demand for money curve is at an interest rate of roughly zero. The Fed cannot drive the interest rate lower than zero, preventing it from stimulating the economy further.

17 of 25 © 2014 Pearson Education, Inc.
easy monetary policy
interest
nonsynchronization of income and spending
speculation motive
tight monetary policy
transaction motive
R E V I E W T E R M S A N D C O N C E P T S

18 of 25 © 2014 Pearson Education, Inc.
The term structure of interest rates is the relationship among the interest rates offered on securities of different maturities.
According to a theory called the expectations theory of the term structure of interest rates, the 2-year rate is equal to the average of the current 1-year rate and the 1-year rate expected a year from now.
Fed behavior may directly affect people’s expectations of the future short-term rates, which will then affect long-term rates.
CHAPTER 11 APPENDIX A The Various Interest Rates in the U.S. Economy
The Term Structure of Interest Rates
19 of 25 © 2014 Pearson Education, Inc.
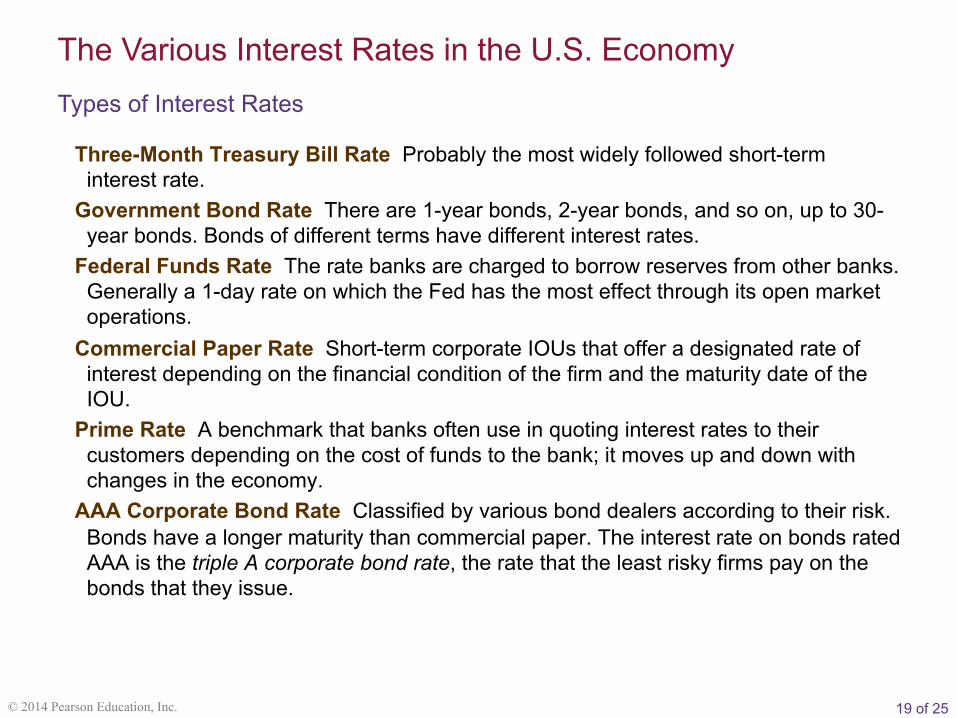
Three-Month Treasury Bill Rate Probably the most widely followed short-term interest rate.
Government Bond Rate There are 1-year bonds, 2-year bonds, and so on, up to 30-year bonds. Bonds of different terms have different interest rates.
Federal Funds Rate The rate banks are charged to borrow reserves from other banks. Generally a 1-day rate on which the Fed has the most effect through its open market operations.
Commercial Paper Rate Short-term corporate IOUs that offer a designated rate of interest depending on the financial condition of the firm and the maturity date of the IOU.
Prime Rate A benchmark that banks often use in quoting interest rates to their customers depending on the cost of funds to the bank; it moves up and down with changes in the economy.
AAA Corporate Bond Rate Classified by various bond dealers according to their risk. Bonds have a longer maturity than commercial paper. The interest rate on bonds rated AAA is the triple A corporate bond rate, the rate that the least risky firms pay on the bonds that they issue.
The Various Interest Rates in the U.S. Economy Types of Interest Rates
20 of 25 © 2014 Pearson Education, Inc.
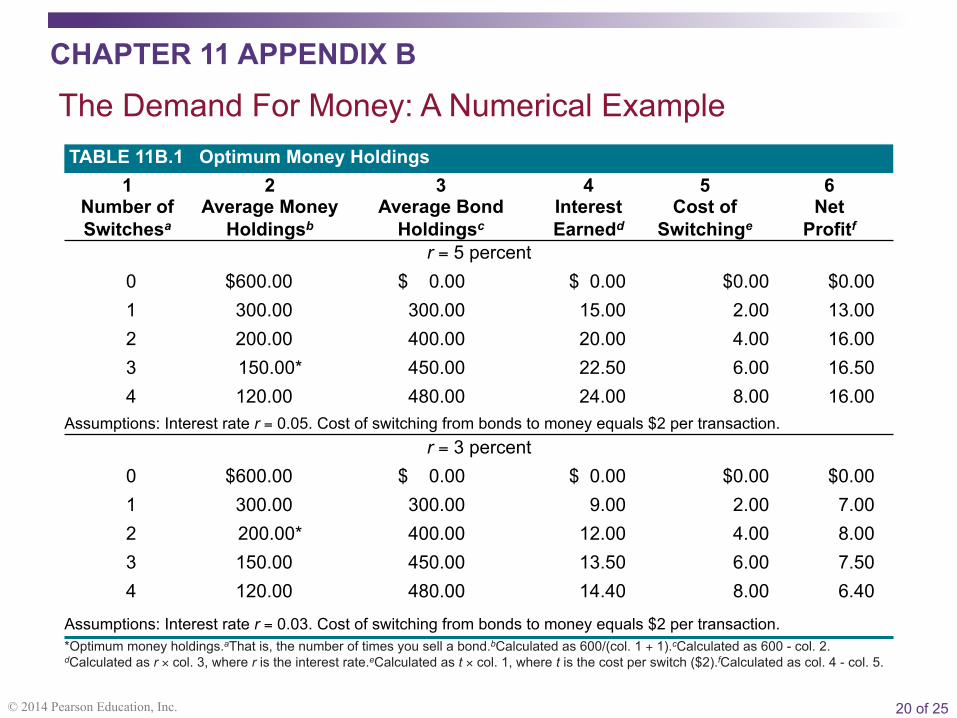
TABLE 11B.1 Optimum Money Holdings 1
Number of Switchesa
2 Average Money
Holdingsb
3 Average Bond
Holdingsc
4 Interest Earnedd
5 Cost of
Switchinge
6 Net
Profitf
r = 5 percent 0 $600.00 $ 0.00 $ 0.00 $0.00 $0.00 1 300.00 300.00 15.00 2.00 13.00 2 200.00 400.00 20.00 4.00 16.00 3 150.00* 450.00 22.50 6.00 16.50 4 120.00 480.00 24.00 8.00 16.00
Assumptions: Interest rate r = 0.05. Cost of switching from bonds to money equals $2 per transaction. r = 3 percent
0 $600.00 $ 0.00 $ 0.00 $0.00 $0.00 1 300.00 300.00 9.00 2.00 7.00 2 200.00* 400.00 12.00 4.00 8.00 3 150.00 450.00 13.50 6.00 7.50 4 120.00 480.00 14.40 8.00 6.40
Assumptions: Interest rate r = 0.03. Cost of switching from bonds to money equals $2 per transaction. *Optimum money holdings.aThat is, the number of times you sell a bond.bCalculated as 600/(col. 1 + 1).cCalculated as 600 - col. 2. dCalculated as r × col. 3, where r is the interest rate.eCalculated as t × col. 1, where t is the cost per switch ($2).fCalculated as col. 4 - col. 5.
The Demand For Money: A Numerical Example CHAPTER 11 APPENDIX B