smartsheets & asana - titan investment management
TRANSCRIPT
Synovus
SMARTSHEETS & ASANA Equity Report – Titan Investment Management LLC
TITAN INVESTMENTS I TITANINVESTMENTMGMT.COM [email protected]
March 23, 2021

March 23, 2021
TITAN INVESTMENTS I TITANINVESTMENTMGMT.COM
1
Asana (ASAN) and Smartsheets (SMAR):
ASAN is a work management platform that helps teams orchestrate work, from daily tasks to cross-functional
strategic initiatives. Over 89,000 paying customers use ASAN to manage everything from product launches to
marketing campaigns to organizational-wide goal setting. The platform adds structure to unstructured work,
creating clarity, transparency, and accountability to everyone within an organization-individuals, team leads,
and executives-so they understand exactly who is doing what, by when.
SMAR is the enterprise platform for dynamic work. SMAR empowers anyone to drive meaningful change. A
leading cloud-based platform enables teams and organizations to plan, capture, manage, automate, and
report on work at scale, resulting in more efficient processes and better business outcomes. Unstructured or
dynamic work is work that has historically been managed using a combination of email, spreadsheets,
whiteboards, phone calls, and in-person meetings to communicate with team members and complete
projects and processes.
The Work Management Market:
The description of the previous firms provides some guidance on what exactly a work management platform
is, but more meat needs to be added to the bone.
COVID has been discussed ad nauseam, but fortunately the worst seems to be past the world (knock on
wood). The focus should now shift to how this “new normal” will look for not only consumers, but
businesses. Historically, employees would gather at their respective place of work and work through
whatever, project, product, advertisement, etc. in a dynamic fashion. However, as more and more
employees shift to a remote setting, a centralized headquarters can no longer be counted on as a place of
gathering. Without any sort of alternative communication, workflow will be lost and inefficiencies increased.
This is where a work management platform comes into play. Whether communicating via email or updating
a shared spreadsheet, the resources and results of the venture are centralized and updated in real time for
employees. This includes:
• Project Management – Gantt, Calendar, Kanban, Tasks, and Reminders.
• Work Management – Custom Fields, Formulas, Functions, Conditional Formatting, and External
Web Content.
• Collaboration – Share with in/out of Network, Publications, Files, Notifications, and Updates.
Prior to COVID-19 only 3.6% of employees in the US worked from home. However, Global Workplace
Analytics found that 56% of the US labor force holds a job that is compatible with remote work. This is
expected to result in 25-30% of the US labor force working from home for multiple days by the end of 2021.
80% of the US labor force expressed a desire to work from home at least some of the time (33% even would
agree to a cut in pay to do so). However, employers have been somewhat resistant to this trend as the
means to track employee work and accountability becomes more difficult. This is where a work management
platform adds further value. Not only does it provide transparency and accountability in a centralized
manner for employees, but also provides the opportunity for employees to work from home.
March 23, 2021
TITAN INVESTMENTS I TITANINVESTMENTMGMT.COM
2
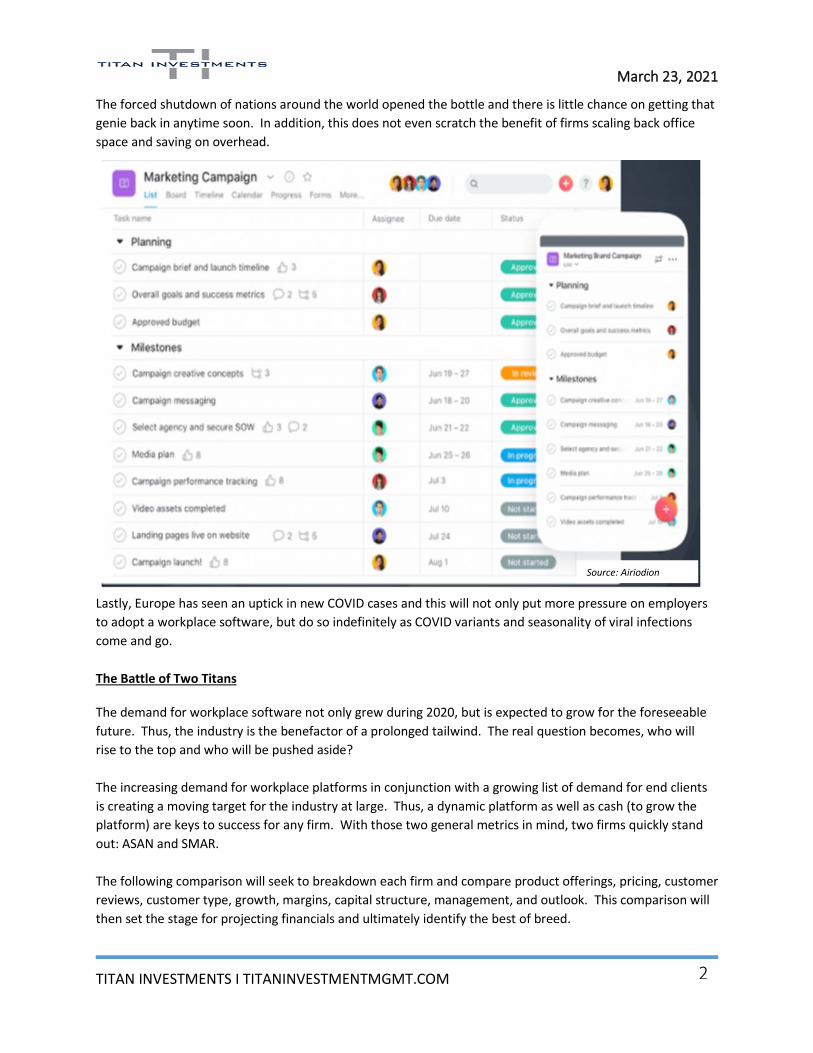
The forced shutdown of nations around the world opened the bottle and there is little chance on getting that
genie back in anytime soon. In addition, this does not even scratch the benefit of firms scaling back office
space and saving on overhead.
Lastly, Europe has seen an uptick in new COVID cases and this will not only put more pressure on employers
to adopt a workplace software, but do so indefinitely as COVID variants and seasonality of viral infections
come and go.
The Battle of Two Titans
The demand for workplace software not only grew during 2020, but is expected to grow for the foreseeable
future. Thus, the industry is the benefactor of a prolonged tailwind. The real question becomes, who will
rise to the top and who will be pushed aside?
The increasing demand for workplace platforms in conjunction with a growing list of demand for end clients
is creating a moving target for the industry at large. Thus, a dynamic platform as well as cash (to grow the
platform) are keys to success for any firm. With those two general metrics in mind, two firms quickly stand
out: ASAN and SMAR.
The following comparison will seek to breakdown each firm and compare product offerings, pricing, customer
reviews, customer type, growth, margins, capital structure, management, and outlook. This comparison will
then set the stage for projecting financials and ultimately identify the best of breed.
Source: Airiodion
March 23, 2021
TITAN INVESTMENTS I TITANINVESTMENTMGMT.COM
3
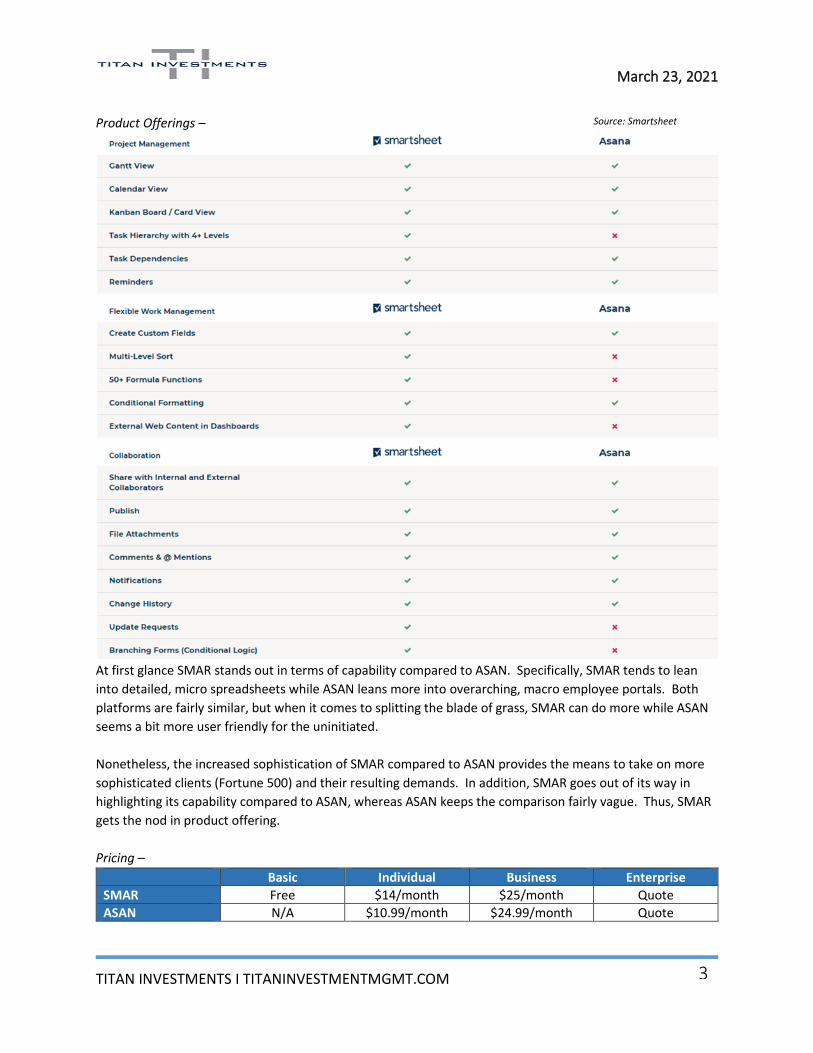
Product Offerings –
At first glance SMAR stands out in terms of capability compared to ASAN. Specifically, SMAR tends to lean
into detailed, micro spreadsheets while ASAN leans more into overarching, macro employee portals. Both
platforms are fairly similar, but when it comes to splitting the blade of grass, SMAR can do more while ASAN
seems a bit more user friendly for the uninitiated.
Nonetheless, the increased sophistication of SMAR compared to ASAN provides the means to take on more
sophisticated clients (Fortune 500) and their resulting demands. In addition, SMAR goes out of its way in
highlighting its capability compared to ASAN, whereas ASAN keeps the comparison fairly vague. Thus, SMAR
gets the nod in product offering.
Pricing –
Basic Individual Business Enterprise
SMAR Free $14/month $25/month Quote
ASAN N/A $10.99/month $24.99/month Quote
Source: Smartsheet
March 23, 2021
TITAN INVESTMENTS I TITANINVESTMENTMGMT.COM
4
Two main differences stand out in terms of pricing:
• ASAN offers a free package.
• ASAN offers a cheaper Individual platform.
The ability to execute in ASAN’s Basic package is limited, but does come with app integration. Thus, this
introductory price (or lack thereof) provides the catalyst to integrate the platform into a business and
increase the switching cost even as the business grows and becomes a paying client.
ASAN’s strategy seems to be get the client early in their business life. Even if SMAR offers more
sophistication (especially for larger clients), ASAN could ingrain itself so much into the business as it grows,
the cost of switching does not overcome the added sophistication of SMAR. Thus, ASAN gets the nod in
pricing.
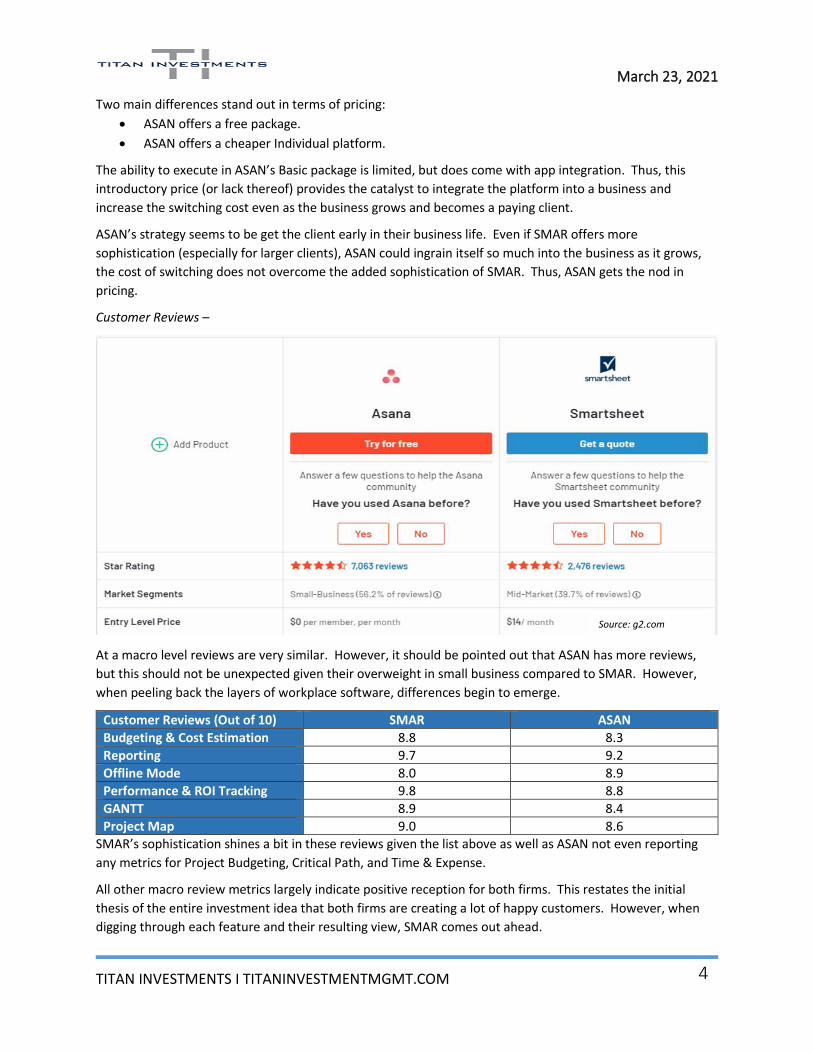
Customer Reviews –
At a macro level reviews are very similar. However, it should be pointed out that ASAN has more reviews,
but this should not be unexpected given their overweight in small business compared to SMAR. However,
when peeling back the layers of workplace software, differences begin to emerge.
Customer Reviews (Out of 10) SMAR ASAN
Budgeting & Cost Estimation 8.8 8.3
Reporting 9.7 9.2
Offline Mode 8.0 8.9
Performance & ROI Tracking 9.8 8.8
GANTT 8.9 8.4
Project Map 9.0 8.6
SMAR’s sophistication shines a bit in these reviews given the list above as well as ASAN not even reporting
any metrics for Project Budgeting, Critical Path, and Time & Expense.
All other macro review metrics largely indicate positive reception for both firms. This restates the initial
thesis of the entire investment idea that both firms are creating a lot of happy customers. However, when
digging through each feature and their resulting view, SMAR comes out ahead.
Source: g2.com
March 23, 2021
TITAN INVESTMENTS I TITANINVESTMENTMGMT.COM
5
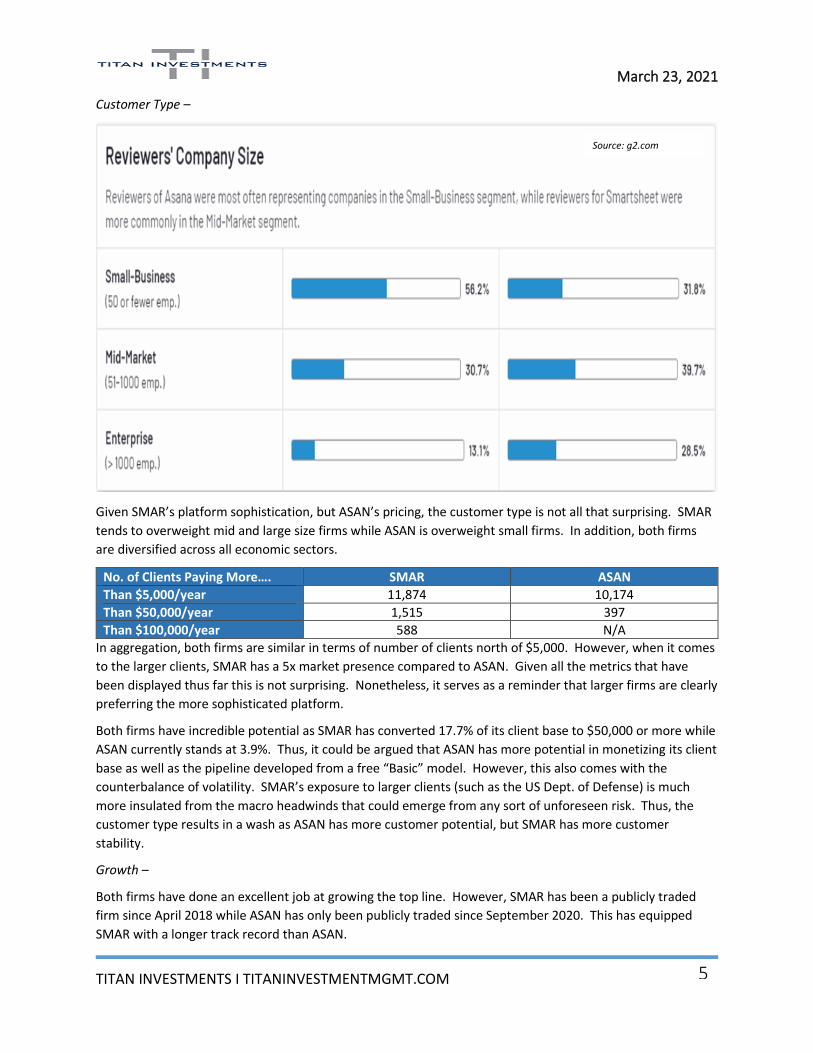
Customer Type –
Given SMAR’s platform sophistication, but ASAN’s pricing, the customer type is not all that surprising. SMAR
tends to overweight mid and large size firms while ASAN is overweight small firms. In addition, both firms
are diversified across all economic sectors.
No. of Clients Paying More…. SMAR ASAN
Than $5,000/year 11,874 10,174
Than $50,000/year 1,515 397
Than $100,000/year 588 N/A
In aggregation, both firms are similar in terms of number of clients north of $5,000. However, when it comes
to the larger clients, SMAR has a 5x market presence compared to ASAN. Given all the metrics that have
been displayed thus far this is not surprising. Nonetheless, it serves as a reminder that larger firms are clearly
preferring the more sophisticated platform.
Both firms have incredible potential as SMAR has converted 17.7% of its client base to $50,000 or more while
ASAN currently stands at 3.9%. Thus, it could be argued that ASAN has more potential in monetizing its client
base as well as the pipeline developed from a free “Basic” model. However, this also comes with the
counterbalance of volatility. SMAR’s exposure to larger clients (such as the US Dept. of Defense) is much
more insulated from the macro headwinds that could emerge from any sort of unforeseen risk. Thus, the
customer type results in a wash as ASAN has more customer potential, but SMAR has more customer
stability.
Growth –
Both firms have done an excellent job at growing the top line. However, SMAR has been a publicly traded
firm since April 2018 while ASAN has only been publicly traded since September 2020. This has equipped
SMAR with a longer track record than ASAN.
Source: g2.com
March 23, 2021
TITAN INVESTMENTS I TITANINVESTMENTMGMT.COM
6
ASAN
SMAR
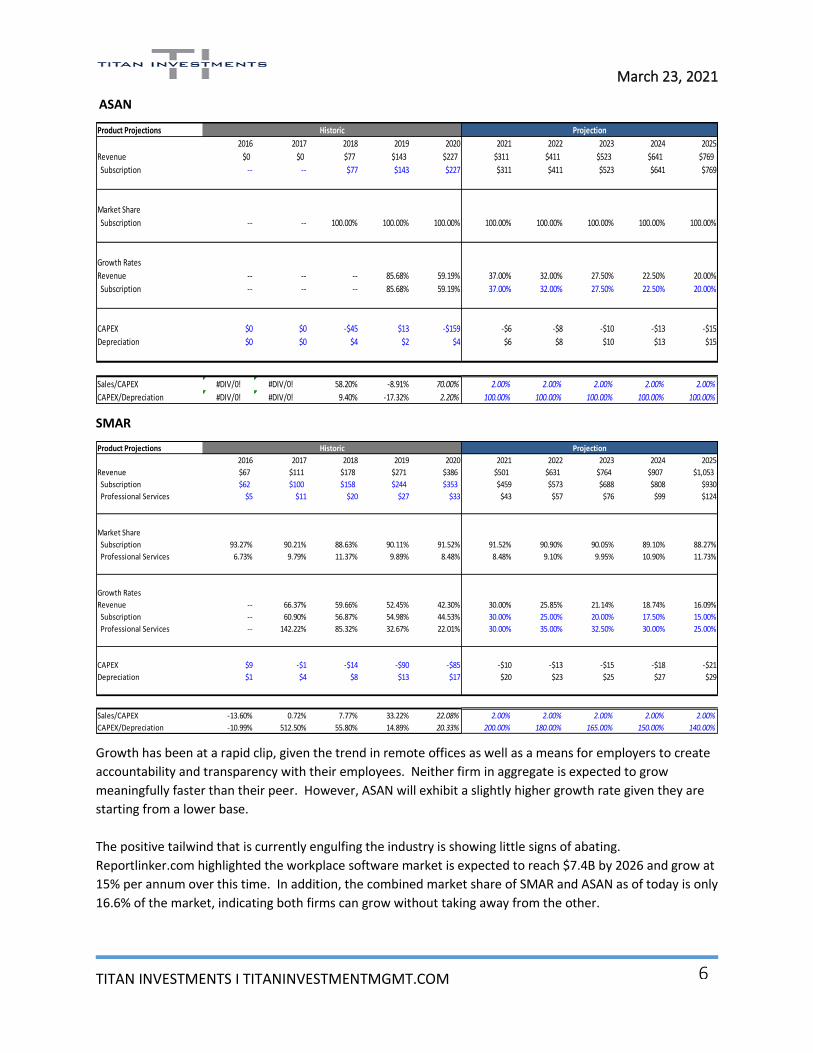
Growth has been at a rapid clip, given the trend in remote offices as well as a means for employers to create
accountability and transparency with their employees. Neither firm in aggregate is expected to grow
meaningfully faster than their peer. However, ASAN will exhibit a slightly higher growth rate given they are
starting from a lower base.
The positive tailwind that is currently engulfing the industry is showing little signs of abating.
Reportlinker.com highlighted the workplace software market is expected to reach $7.4B by 2026 and grow at
15% per annum over this time. In addition, the combined market share of SMAR and ASAN as of today is only
16.6% of the market, indicating both firms can grow without taking away from the other.
Product Projections
2016 2017 2018 2019 2020 2021 2022 2023 2024 2025
Revenue $0 $0 $77 $143 $227 $311 $411 $523 $641 $769
Subscription -- -- $77 $143 $227 $311 $411 $523 $641 $769
Market Share
Subscription -- -- 100.00% 100.00% 100.00% 100.00% 100.00% 100.00% 100.00% 100.00%
Growth Rates
Revenue -- -- -- 85.68% 59.19% 37.00% 32.00% 27.50% 22.50% 20.00%
Subscription -- -- -- 85.68% 59.19% 37.00% 32.00% 27.50% 22.50% 20.00%
CAPEX $0 $0 -$45 $13 -$159 -$6 -$8 -$10 -$13 -$15
Depreciation $0 $0 $4 $2 $4 $6 $8 $10 $13 $15
Sales/CAPEX #DIV/0! #DIV/0! 58.20% -8.91% 70.00% 2.00% 2.00% 2.00% 2.00% 2.00%
CAPEX/Depreciation #DIV/0! #DIV/0! 9.40% -17.32% 2.20% 100.00% 100.00% 100.00% 100.00% 100.00%
ProjectionHistoric
Product Projections
2016 2017 2018 2019 2020 2021 2022 2023 2024 2025
Revenue $67 $111 $178 $271 $386 $501 $631 $764 $907 $1,053
Subscription $62 $100 $158 $244 $353 $459 $573 $688 $808 $930
Professional Services $5 $11 $20 $27 $33 $43 $57 $76 $99 $124
Market Share
Subscription 93.27% 90.21% 88.63% 90.11% 91.52% 91.52% 90.90% 90.05% 89.10% 88.27%
Professional Services 6.73% 9.79% 11.37% 9.89% 8.48% 8.48% 9.10% 9.95% 10.90% 11.73%
Growth Rates
Revenue -- 66.37% 59.66% 52.45% 42.30% 30.00% 25.85% 21.14% 18.74% 16.09%
Subscription -- 60.90% 56.87% 54.98% 44.53% 30.00% 25.00% 20.00% 17.50% 15.00%
Professional Services -- 142.22% 85.32% 32.67% 22.01% 30.00% 35.00% 32.50% 30.00% 25.00%
CAPEX $9 -$1 -$14 -$90 -$85 -$10 -$13 -$15 -$18 -$21
Depreciation $1 $4 $8 $13 $17 $20 $23 $25 $27 $29
Sales/CAPEX -13.60% 0.72% 7.77% 33.22% 22.08% 2.00% 2.00% 2.00% 2.00% 2.00%
CAPEX/Depreciation -10.99% 512.50% 55.80% 14.89% 20.33% 200.00% 180.00% 165.00% 150.00% 140.00%
ProjectionHistoric

March 23, 2021
TITAN INVESTMENTS I TITANINVESTMENTMGMT.COM
7
Strong growth metrics, little CAPEX, and a tailwind benefitting the industry benefits both firms. Nonetheless,
SMAR has shown a higher client retention rate of 125% versus ASAN at 115%. A retention rate north of 100%
indicates that not only are clients sticking to the platform, but are trading up into higher priced tiers. Both
firms are growing at a healthy clip along with strong retention metrics, but SMAR gets the nod with a more
transparent track record as well as higher retention.
Margins –
ASAN
SMAR
Income Statement
2016 2017 2018 2019 2020 2021 2022 2023 2024 2025
Revenue $0 $0 $77 $143 $227 $311 $411 $523 $641 $769
Cost of Goods $0 $0 $14 $20 $29 $40 $52 $65 $79 $92
Net Interest Income $0 $0 $63 $123 $198 $271 $358 $458 $563 $677 Rental Margin -- -- 82.03% 86.04% 87.36% 87.00% 87.25% 87.50% 87.75% 88.00%
SG & A $0 $0 $68 $151 $231 $280 $318 $361 $398 $439
R & D $0 $0 $43 $90 $121 $146 $172 $194 $212 $227
Other Operating $0 $0 $0 ($2) $0 $0 $0 $0 $0 $0
EBITDA $0 $0 ($48) ($116) ($154) ($155) ($132) ($97) ($46) $12 EBITDA Margin -- -- -62.24% -81.07% -67.84% -50.00% -32.25% -18.50% -7.25% 1.50%
Depreciation & Amoritization $0 $0 $4 $2 $4 $6 $8 $10 $13 $15
EBIT $0 $0 -$52 -$118 -$158 -$162 -$141 -$107 -$59 -$4 EBIT Margin -- -- -67.71% -82.61% -69.38% -52.00% -34.25% -20.50% -9.25% -0.50%
Interest Expense $0 $0 -$1 -$2 $36 $16 $16 $16 $16 $16
Other Abnomral Losses $0 $0 $0 $2 $16 $0 $0 $0 $0 $0
EBT $0 $0 -$51 -$118 -$210 -$177 -$156 -$123 -$75 -$20
Tax Expense $0 $0 $0 $0 $2 $0 $0 $0 $0 $0
Net Income $0 $0 ($51) ($119) ($212) ($177) ($156) ($123) ($75) ($20)
SG & A Expense (% Sales) -- -- 88.80% 105.54% 101.85% 90.00% 77.50% 69.00% 62.00% 57.00%
R & D Expense (% Sales) -- -- 55.47% 62.90% 53.35% 47.00% 42.00% 37.00% 33.00% 29.50%
Effective Tax Rate (% EBT) -- -- 0.00% -0.17% -0.71% 0.00% 0.00% 0.00% 0.00% 0.00%
ProjectionHistoric
Income Statement
2016 2017 2018 2019 2020 2021 2022 2023 2024 2025
Revenue $67 $111 $178 $271 $386 $501 $631 $764 $907 $1,053
Cost of Goods $14 $22 $34 $53 $86 $105 $126 $145 $163 $179
Net Interest Income $53 $90 $144 $218 $300 $396 $505 $619 $744 $874 Rental Margin 78.92% 80.50% 80.98% 80.47% 77.82% 79.00% 80.00% 81.00% 82.00% 83.00%
SG & A $67 $134 $191 $308 $403 $476 $536 $592 $644 $700
R & D $0 $0 $0 $0 $0 $0 $0 $0 $0 $0
Other Operating $0 $0 $0 $0 $0 $0 $0 $0 $0 $0
EBITDA ($14) ($45) ($47) ($90) ($103) ($80) ($32) $27 $100 $174 EBITDA Margin -21.23% -40.25% -26.67% -33.37% -26.74% -16.00% -5.00% 3.50% 11.00% 16.50%
Depreciation & Amoritization $1 $4 $8 $13 $17 $20 $23 $25 $27 $29
EBIT -$15 -$49 -$55 -$104 -$120 -$100 -$54 $2 $73 $144 EBIT Margin -22.72% -43.94% -31.01% -38.32% -31.23% -20.00% -8.60% 0.20% 8.00% 13.70%
Interest Expense $0 $0 $0 $0 $0 $0 $0 $0 $0 $0
Other Abnomral Losses $0 $0 -$2 -$8 -$2 $0 $0 $0 $0 $0
EBT -$15 -$49 -$54 -$96 -$119 -$100 -$54 $2 $73 $144
Tax Expense $0 ($0) $0 $0 ($4) $0 $0 $0 $0 $0
Net Income ($15) ($49) ($54) ($96) ($115) ($100) ($54) $2 $73 $144
SG & A Expense (% Sales) -- 120.75% 107.65% 113.84% 104.57% 95.00% 85.00% 77.50% 71.00% 66.50%
R & D Expense (% Sales) -- 0.00% 0.00% 0.00% 0.00% 0.00% 0.00% 0.00% 0.00% 0.00%
Effective Tax Rate (% EBT) 0.00% 0.61% -0.56% -0.10% 3.20% 0.00% 0.00% 0.00% 0.00% 0.00%
ProjectionHistoric
March 23, 2021
TITAN INVESTMENTS I TITANINVESTMENTMGMT.COM
8
The margin story is where you begin to see the different clientele play out. Less sophistication comes with
less overhead and hence why ASAN exhibits a wider gross margin than SMAR. However, as SMAR is further
down the path of monetizing clients, ASAN will be forced to increase its sophistication and thus overhead.
This increase in overhead as well as it’s already elevated gross margin will limit the expansion of ASAN’s gross
margin relative to SMAR.
Because SMAR has already made the overhead investment for sophistication it is realizing scale at the
operating level faster than ASAN. This ultimately results in a strong EBITDA margin for SMAR, despite both
firms making progress in that metric. In addition, the cost of labor is not as accretive with 100 small clients
compared to 1 large client. Thus, ASAN’s exposure to small business comes with the ongoing cost of service
and labor cost. This could ultimately slow the growth of margin at the EBITDA level.
This ultimately leads to SMAR realizing a bottom line profit before ASAN. This in and of itself is not
necessarily a good or bad thing. However, it will provide SMAR the ability to self-finance their own ventures
whereas ASAN will be more reliant on debt and the burden that brings to the capital structure. Overall,
SMAR gets a slight edge in margin given their projected bottom line. Nonetheless, both firms are on a very
strong trajectory.
March 23, 2021
TITAN INVESTMENTS I TITANINVESTMENTMGMT.COM
9
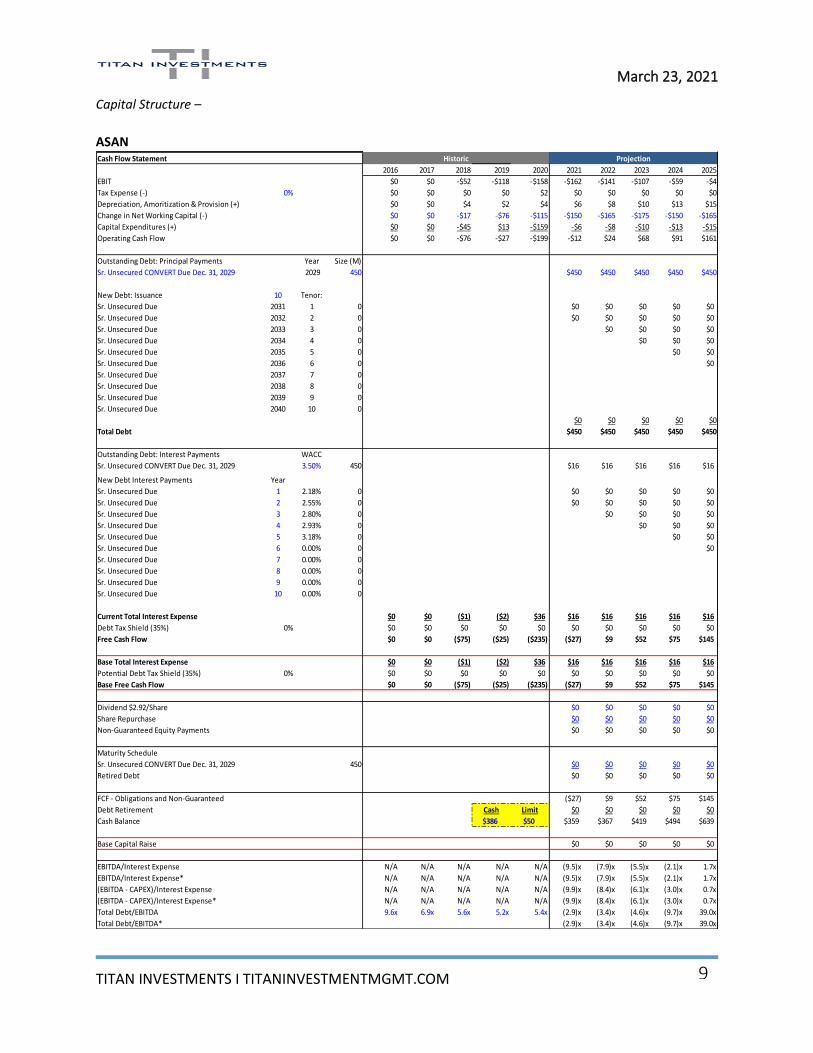
Capital Structure –
ASAN
Cash Flow Statement
2016 2017 2018 2019 2020 2021 2022 2023 2024 2025
EBIT $0 $0 -$52 -$118 -$158 -$162 -$141 -$107 -$59 -$4
Tax Expense (-) 0% $0 $0 $0 $0 $2 $0 $0 $0 $0 $0
Depreciation, Amoritization & Provision (+) $0 $0 $4 $2 $4 $6 $8 $10 $13 $15
Change in Net Working Capital (-) $0 $0 -$17 -$76 -$115 -$150 -$165 -$175 -$150 -$165
Capital Expenditures (+) $0 $0 -$45 $13 -$159 -$6 -$8 -$10 -$13 -$15
Operating Cash Flow $0 $0 -$76 -$27 -$199 -$12 $24 $68 $91 $161
Outstanding Debt: Principal Payments Year Size (M)
Sr. Unsecured CONVERT Due Dec. 31, 2029 2029 450 $450 $450 $450 $450 $450
New Debt: Issuance 10 Tenor:
Sr. Unsecured Due 2031 1 0 $0 $0 $0 $0 $0
Sr. Unsecured Due 2032 2 0 $0 $0 $0 $0 $0
Sr. Unsecured Due 2033 3 0 $0 $0 $0 $0
Sr. Unsecured Due 2034 4 0 $0 $0 $0
Sr. Unsecured Due 2035 5 0 $0 $0
Sr. Unsecured Due 2036 6 0 $0
Sr. Unsecured Due 2037 7 0
Sr. Unsecured Due 2038 8 0
Sr. Unsecured Due 2039 9 0
Sr. Unsecured Due 2040 10 0
$0 $0 $0 $0 $0
Total Debt $450 $450 $450 $450 $450
Outstanding Debt: Interest Payments WACC
Sr. Unsecured CONVERT Due Dec. 31, 2029 3.50% 450 $16 $16 $16 $16 $16
New Debt Interest Payments Year
Sr. Unsecured Due 1 2.18% 0 $0 $0 $0 $0 $0
Sr. Unsecured Due 2 2.55% 0 $0 $0 $0 $0 $0
Sr. Unsecured Due 3 2.80% 0 $0 $0 $0 $0
Sr. Unsecured Due 4 2.93% 0 $0 $0 $0
Sr. Unsecured Due 5 3.18% 0 $0 $0
Sr. Unsecured Due 6 0.00% 0 $0
Sr. Unsecured Due 7 0.00% 0
Sr. Unsecured Due 8 0.00% 0
Sr. Unsecured Due 9 0.00% 0
Sr. Unsecured Due 10 0.00% 0
Current Total Interest Expense $0 $0 ($1) ($2) $36 $16 $16 $16 $16 $16
Debt Tax Shield (35%) 0% $0 $0 $0 $0 $0 $0 $0 $0 $0 $0
Free Cash Flow $0 $0 ($75) ($25) ($235) ($27) $9 $52 $75 $145
Base Total Interest Expense $0 $0 ($1) ($2) $36 $16 $16 $16 $16 $16
Potential Debt Tax Shield (35%) 0% $0 $0 $0 $0 $0 $0 $0 $0 $0 $0
Base Free Cash Flow $0 $0 ($75) ($25) ($235) ($27) $9 $52 $75 $145
Dividend $2.92/Share $0 $0 $0 $0 $0
Share Repurchase $0 $0 $0 $0 $0
Non-Guaranteed Equity Payments $0 $0 $0 $0 $0
Maturity Schedule
Sr. Unsecured CONVERT Due Dec. 31, 2029 450 $0 $0 $0 $0 $0
Retired Debt $0 $0 $0 $0 $0
FCF - Obligations and Non-Guaranteed ($27) $9 $52 $75 $145
Debt Retirement Cash Limit $0 $0 $0 $0 $0
Cash Balance $386 $50 $359 $367 $419 $494 $639
Base Capital Raise $0 $0 $0 $0 $0
EBITDA/Interest Expense N/A N/A N/A N/A N/A (9.5)x (7.9)x (5.5)x (2.1)x 1.7x
EBITDA/Interest Expense* N/A N/A N/A N/A N/A (9.5)x (7.9)x (5.5)x (2.1)x 1.7x
(EBITDA - CAPEX)/Interest Expense N/A N/A N/A N/A N/A (9.9)x (8.4)x (6.1)x (3.0)x 0.7x
(EBITDA - CAPEX)/Interest Expense* N/A N/A N/A N/A N/A (9.9)x (8.4)x (6.1)x (3.0)x 0.7x
Total Debt/EBITDA 9.6x 6.9x 5.6x 5.2x 5.4x (2.9)x (3.4)x (4.6)x (9.7)x 39.0x
Total Debt/EBITDA* (2.9)x (3.4)x (4.6)x (9.7)x 39.0x
ProjectionHistoric
March 23, 2021
TITAN INVESTMENTS I TITANINVESTMENTMGMT.COM
10
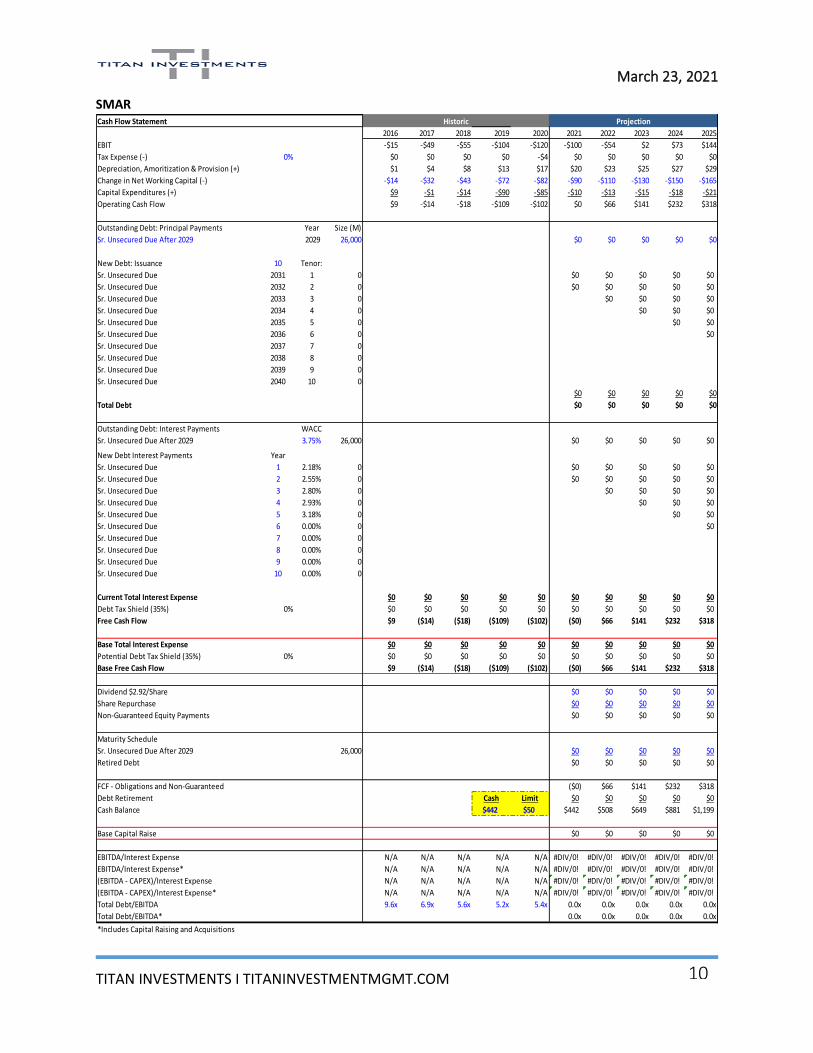
SMAR
Cash Flow Statement
2016 2017 2018 2019 2020 2021 2022 2023 2024 2025
EBIT -$15 -$49 -$55 -$104 -$120 -$100 -$54 $2 $73 $144
Tax Expense (-) 0% $0 $0 $0 $0 -$4 $0 $0 $0 $0 $0
Depreciation, Amoritization & Provision (+) $1 $4 $8 $13 $17 $20 $23 $25 $27 $29
Change in Net Working Capital (-) -$14 -$32 -$43 -$72 -$82 -$90 -$110 -$130 -$150 -$165
Capital Expenditures (+) $9 -$1 -$14 -$90 -$85 -$10 -$13 -$15 -$18 -$21
Operating Cash Flow $9 -$14 -$18 -$109 -$102 $0 $66 $141 $232 $318
Outstanding Debt: Principal Payments Year Size (M)
Sr. Unsecured Due After 2029 2029 26,000 $0 $0 $0 $0 $0
New Debt: Issuance 10 Tenor:
Sr. Unsecured Due 2031 1 0 $0 $0 $0 $0 $0
Sr. Unsecured Due 2032 2 0 $0 $0 $0 $0 $0
Sr. Unsecured Due 2033 3 0 $0 $0 $0 $0
Sr. Unsecured Due 2034 4 0 $0 $0 $0
Sr. Unsecured Due 2035 5 0 $0 $0
Sr. Unsecured Due 2036 6 0 $0
Sr. Unsecured Due 2037 7 0
Sr. Unsecured Due 2038 8 0
Sr. Unsecured Due 2039 9 0
Sr. Unsecured Due 2040 10 0
$0 $0 $0 $0 $0
Total Debt $0 $0 $0 $0 $0
Outstanding Debt: Interest Payments WACC
Sr. Unsecured Due After 2029 3.75% 26,000 $0 $0 $0 $0 $0
New Debt Interest Payments Year
Sr. Unsecured Due 1 2.18% 0 $0 $0 $0 $0 $0
Sr. Unsecured Due 2 2.55% 0 $0 $0 $0 $0 $0
Sr. Unsecured Due 3 2.80% 0 $0 $0 $0 $0
Sr. Unsecured Due 4 2.93% 0 $0 $0 $0
Sr. Unsecured Due 5 3.18% 0 $0 $0
Sr. Unsecured Due 6 0.00% 0 $0
Sr. Unsecured Due 7 0.00% 0
Sr. Unsecured Due 8 0.00% 0
Sr. Unsecured Due 9 0.00% 0
Sr. Unsecured Due 10 0.00% 0
Current Total Interest Expense $0 $0 $0 $0 $0 $0 $0 $0 $0 $0
Debt Tax Shield (35%) 0% $0 $0 $0 $0 $0 $0 $0 $0 $0 $0
Free Cash Flow $9 ($14) ($18) ($109) ($102) ($0) $66 $141 $232 $318
Base Total Interest Expense $0 $0 $0 $0 $0 $0 $0 $0 $0 $0
Potential Debt Tax Shield (35%) 0% $0 $0 $0 $0 $0 $0 $0 $0 $0 $0
Base Free Cash Flow $9 ($14) ($18) ($109) ($102) ($0) $66 $141 $232 $318
Dividend $2.92/Share $0 $0 $0 $0 $0
Share Repurchase $0 $0 $0 $0 $0
Non-Guaranteed Equity Payments $0 $0 $0 $0 $0
Maturity Schedule
Sr. Unsecured Due After 2029 26,000 $0 $0 $0 $0 $0
Retired Debt $0 $0 $0 $0 $0
FCF - Obligations and Non-Guaranteed ($0) $66 $141 $232 $318
Debt Retirement Cash Limit $0 $0 $0 $0 $0
Cash Balance $442 $50 $442 $508 $649 $881 $1,199
Base Capital Raise $0 $0 $0 $0 $0
EBITDA/Interest Expense N/A N/A N/A N/A N/A #DIV/0! #DIV/0! #DIV/0! #DIV/0! #DIV/0!
EBITDA/Interest Expense* N/A N/A N/A N/A N/A #DIV/0! #DIV/0! #DIV/0! #DIV/0! #DIV/0!
(EBITDA - CAPEX)/Interest Expense N/A N/A N/A N/A N/A #DIV/0! #DIV/0! #DIV/0! #DIV/0! #DIV/0!
(EBITDA - CAPEX)/Interest Expense* N/A N/A N/A N/A N/A #DIV/0! #DIV/0! #DIV/0! #DIV/0! #DIV/0!
Total Debt/EBITDA 9.6x 6.9x 5.6x 5.2x 5.4x 0.0x 0.0x 0.0x 0.0x 0.0x
Total Debt/EBITDA* 0.0x 0.0x 0.0x 0.0x 0.0x
*Includes Capital Raising and Acquisitions
ProjectionHistoric
March 23, 2021
TITAN INVESTMENTS I TITANINVESTMENTMGMT.COM
11
Both firms are expected to turn free cash flow positive in 2022. From there, both will enjoy a larger and
larger cash position to pursue any venture or shareholder friendly activity. Two differences do emerge:
• SMAR has a larger cash position $442M versus ASAN’s cash position of $368M.
• SMAR has no debt whereas ASAN issued $450M of convertible debt.
The cash position is not nearly as relevant as the difference in debt. ASAN will see that $450M worth of debt
mature in January and June of 2025 or see those obligations converted to shares. In addition, the specifics of
converting the debt into shares is fairly opaque outside of conversion prices listed at $31.58 and $31.09.
Shares are currently hovering around $30/share, but unlocks the possibility of these shares being converted
and diluting the value to existing stock holders. One final note on share dilution, ASAN also faces blackout
periods coming to an end. In one weeks’ time, 30M ASAN shares will be eligible to be traded (37.5% of all
shares) and could put downward pressure on shares.
Once again, it cannot be said enough that both firms are in strong financial shape. Free cash flow is set to
grow, both firms have strong cash positions, and neither has an overly burdensome capital structure. When
peeling back the layers of each firm’s financials, SMAR is in better position from a value perspective given no
current risk of equity dilution.
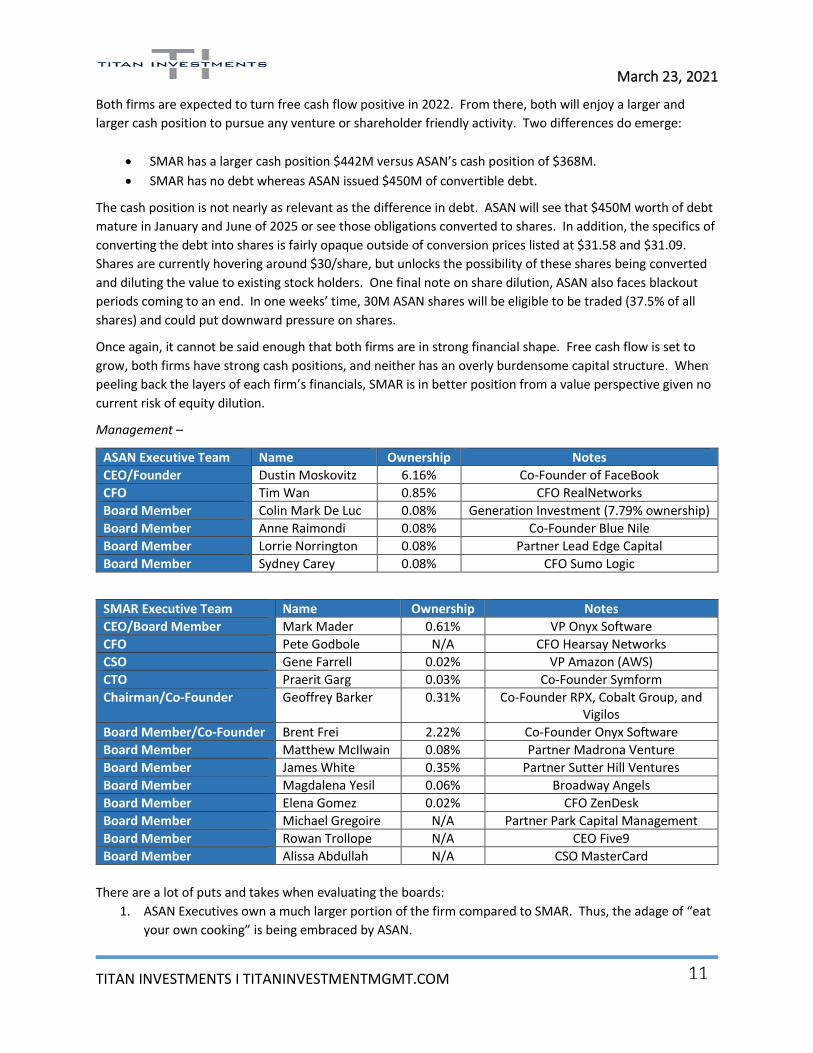
Management –
ASAN Executive Team Name Ownership Notes
CEO/Founder Dustin Moskovitz 6.16% Co-Founder of FaceBook
CFO Tim Wan 0.85% CFO RealNetworks
Board Member Colin Mark De Luc 0.08% Generation Investment (7.79% ownership)
Board Member Anne Raimondi 0.08% Co-Founder Blue Nile
Board Member Lorrie Norrington 0.08% Partner Lead Edge Capital
Board Member Sydney Carey 0.08% CFO Sumo Logic
SMAR Executive Team Name Ownership Notes
CEO/Board Member Mark Mader 0.61% VP Onyx Software
CFO Pete Godbole N/A CFO Hearsay Networks
CSO Gene Farrell 0.02% VP Amazon (AWS)
CTO Praerit Garg 0.03% Co-Founder Symform
Chairman/Co-Founder Geoffrey Barker 0.31% Co-Founder RPX, Cobalt Group, and Vigilos
Board Member/Co-Founder Brent Frei 2.22% Co-Founder Onyx Software
Board Member Matthew McIlwain 0.08% Partner Madrona Venture
Board Member James White 0.35% Partner Sutter Hill Ventures
Board Member Magdalena Yesil 0.06% Broadway Angels
Board Member Elena Gomez 0.02% CFO ZenDesk
Board Member Michael Gregoire N/A Partner Park Capital Management
Board Member Rowan Trollope N/A CEO Five9
Board Member Alissa Abdullah N/A CSO MasterCard
There are a lot of puts and takes when evaluating the boards:
1. ASAN Executives own a much larger portion of the firm compared to SMAR. Thus, the adage of “eat
your own cooking” is being embraced by ASAN.
March 23, 2021
TITAN INVESTMENTS I TITANINVESTMENTMGMT.COM
12
2. The respective founders of each firm are both impressive, but Mr. Moskovitz is a once in a
generation entrepreneur.
3. SMAR has a much deeper bench in terms of board members and experience that are composed from
both the financial and practical side.
4. SMAR is more “institutionally owned” than ASAN. This ties back to executive ownership, but SMAR is
concentrated in the hands of firms like Vanguard while ASAN is tied to hedge funds.
In summation, ASAN gets the green light on this comparison. SMAR has a more well-rounded and deep
executive team, but it is hard to overlook ownership exposure. Mr. Moskovitz’s wealth is increasingly tied to
the success of ASAN.
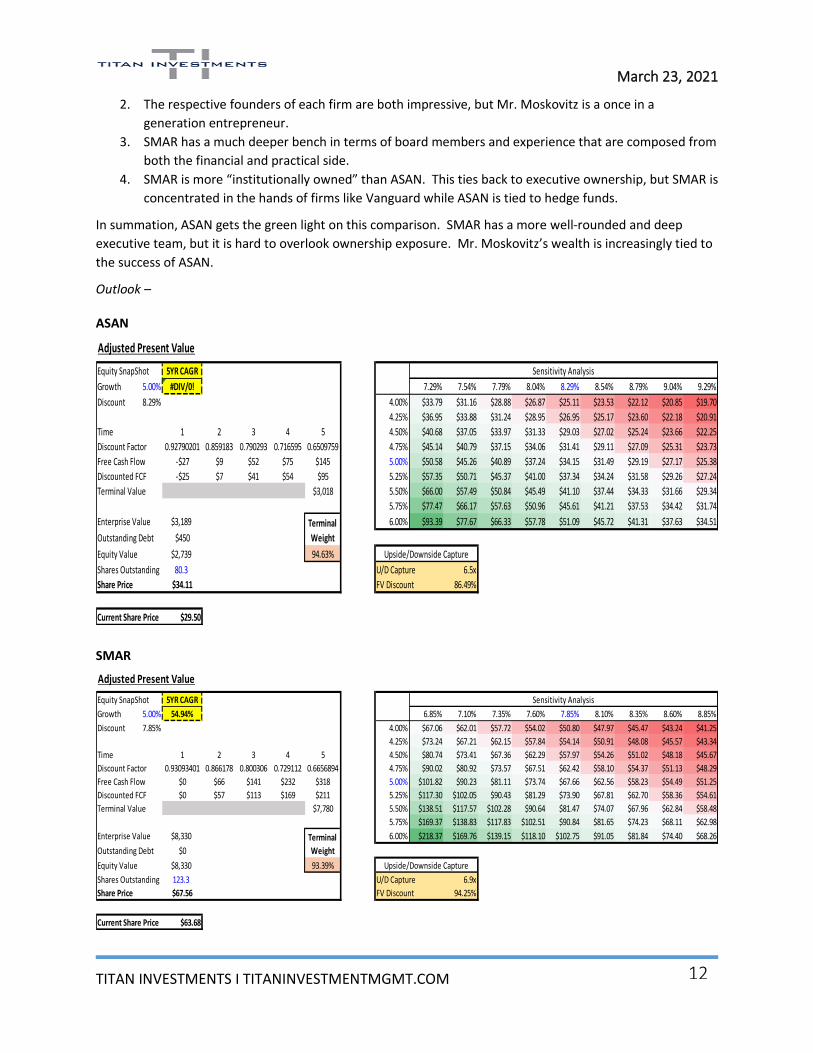
Outlook –
ASAN
SMAR
Adjusted Present Value
Equity SnapShot 5YR CAGR
Growth 5.00% #DIV/0! $34.11 7.29% 7.54% 7.79% 8.04% 8.29% 8.54% 8.79% 9.04% 9.29%
Discount 8.29% 4.00% $33.79 $31.16 $28.88 $26.87 $25.11 $23.53 $22.12 $20.85 $19.70
4.25% $36.95 $33.88 $31.24 $28.95 $26.95 $25.17 $23.60 $22.18 $20.91
Time 1 2 3 4 5 4.50% $40.68 $37.05 $33.97 $31.33 $29.03 $27.02 $25.24 $23.66 $22.25
Discount Factor 0.92790201 0.859183 0.790293 0.716595 0.6509759 4.75% $45.14 $40.79 $37.15 $34.06 $31.41 $29.11 $27.09 $25.31 $23.73
Free Cash Flow -$27 $9 $52 $75 $145 5.00% $50.58 $45.26 $40.89 $37.24 $34.15 $31.49 $29.19 $27.17 $25.38
Discounted FCF -$25 $7 $41 $54 $95 5.25% $57.35 $50.71 $45.37 $41.00 $37.34 $34.24 $31.58 $29.26 $27.24
Terminal Value $3,018 5.50% $66.00 $57.49 $50.84 $45.49 $41.10 $37.44 $34.33 $31.66 $29.34
5.75% $77.47 $66.17 $57.63 $50.96 $45.61 $41.21 $37.53 $34.42 $31.74
Enterprise Value $3,189 6.00% $93.39 $77.67 $66.33 $57.78 $51.09 $45.72 $41.31 $37.63 $34.51
Outstanding Debt $450
Equity Value $2,739 94.63%
Shares Outstanding 80.3 6.5x
Share Price $34.11 86.49%
Current Share Price $29.50
Sensitivity Analysis
Upside/Downside Capture
U/D Capture
FV Discount
Terminal
Weight
Adjusted Present Value
Equity SnapShot 5YR CAGR
Growth 5.00% 54.94% $67.56 6.85% 7.10% 7.35% 7.60% 7.85% 8.10% 8.35% 8.60% 8.85%
Discount 7.85% 4.00% $67.06 $62.01 $57.72 $54.02 $50.80 $47.97 $45.47 $43.24 $41.25
4.25% $73.24 $67.21 $62.15 $57.84 $54.14 $50.91 $48.08 $45.57 $43.34
Time 1 2 3 4 5 4.50% $80.74 $73.41 $67.36 $62.29 $57.97 $54.26 $51.02 $48.18 $45.67
Discount Factor 0.93093401 0.866178 0.800306 0.729112 0.6656894 4.75% $90.02 $80.92 $73.57 $67.51 $62.42 $58.10 $54.37 $51.13 $48.29
Free Cash Flow $0 $66 $141 $232 $318 5.00% $101.82 $90.23 $81.11 $73.74 $67.66 $62.56 $58.23 $54.49 $51.25
Discounted FCF $0 $57 $113 $169 $211 5.25% $117.30 $102.05 $90.43 $81.29 $73.90 $67.81 $62.70 $58.36 $54.61
Terminal Value $7,780 5.50% $138.51 $117.57 $102.28 $90.64 $81.47 $74.07 $67.96 $62.84 $58.48
5.75% $169.37 $138.83 $117.83 $102.51 $90.84 $81.65 $74.23 $68.11 $62.98
Enterprise Value $8,330 6.00% $218.37 $169.76 $139.15 $118.10 $102.75 $91.05 $81.84 $74.40 $68.26
Outstanding Debt $0
Equity Value $8,330 93.39%
Shares Outstanding 123.3 6.9x
Share Price $67.56 94.25%
Current Share Price $63.68
Sensitivity Analysis
Upside/Downside Capture
U/D Capture
FV Discount
Terminal
Weight
March 23, 2021
TITAN INVESTMENTS I TITANINVESTMENTMGMT.COM
13
Both firms trade at a discount to their projected value. However, ASAN trades a slightly greater discount
(86.5% versus 94.3%) than SMAR. The ambiguous nature of the share dilution that could take place from
convertible debt could quickly erase this perceived discount. Thus, the outlook for each firm is largely a wash
when taking into account the ramifications of corporate actions.
Summation of Titans:
SMAR ASAN
Product Offering
Pricing
Customer Review
Customer Type
Growth
Margins
Capital Structure
Management
Outlook
Workplace software is on the rise with an industry being defined by innovation and constant change. A firm’s
ability to be agile and proactive is paramount to success. SMAR comes out better positioned than ASAN to
take advantage of this environment. SMAR has a more robust product offering all the while boasting rock
solid financials. In addition, the deep bench at the executive level serves as a means to take advantage of any
shareholder friendly (takeout) event that emerges in the future.
ASAN is no slouch. They are simply a couple of steps behind SMAR in terms of product offering and the
resulting scale that comes with growth. However, the leadership of Dustin Moskovitz is incredibly hard to
overlook. In addition, ASAN could develop a fairly deep pipeline of clients who start at the Basic tier, but
ultimately end up at the Enterprise level.
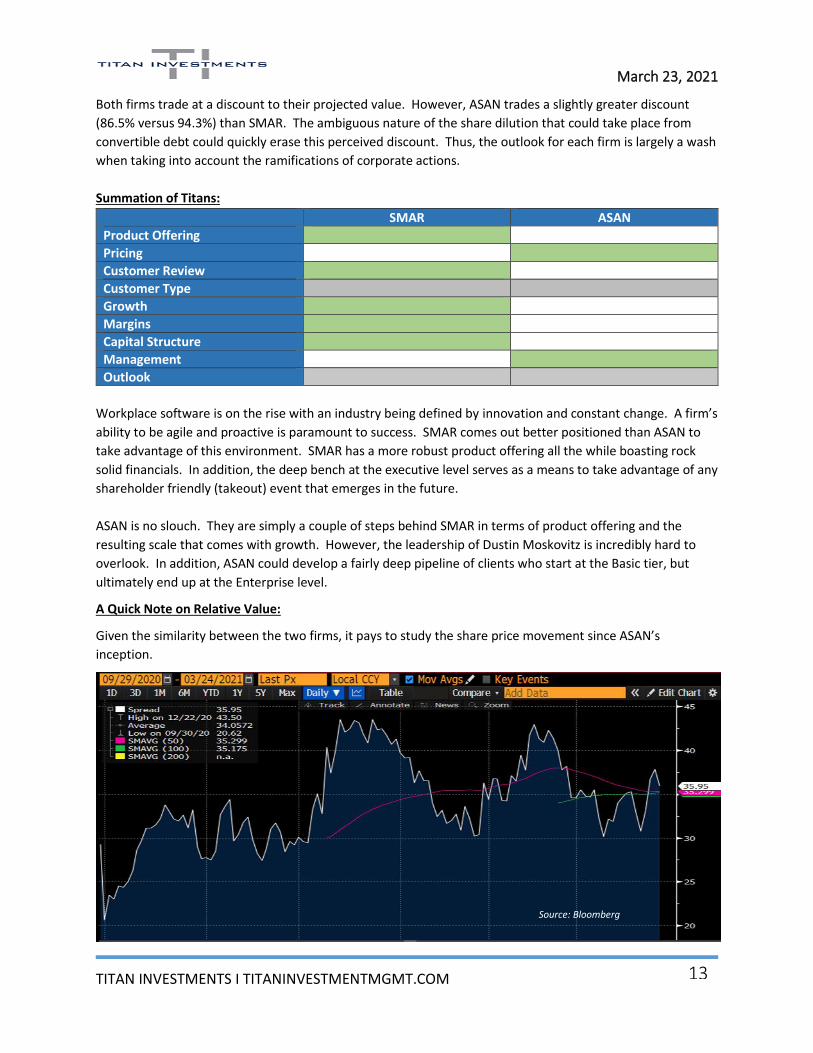
A Quick Note on Relative Value:
Given the similarity between the two firms, it pays to study the share price movement since ASAN’s
inception.
Source: Bloomberg
March 23, 2021
TITAN INVESTMENTS I TITANINVESTMENTMGMT.COM
14
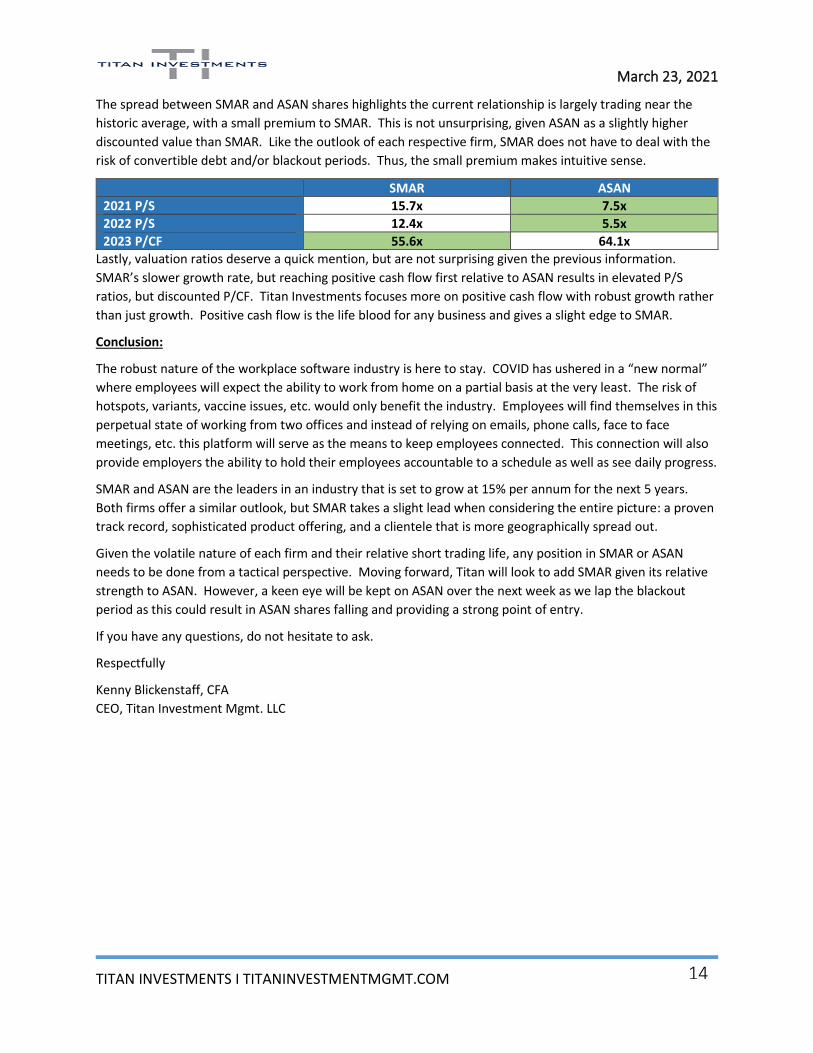
The spread between SMAR and ASAN shares highlights the current relationship is largely trading near the
historic average, with a small premium to SMAR. This is not unsurprising, given ASAN as a slightly higher
discounted value than SMAR. Like the outlook of each respective firm, SMAR does not have to deal with the
risk of convertible debt and/or blackout periods. Thus, the small premium makes intuitive sense.
SMAR ASAN
2021 P/S 15.7x 7.5x
2022 P/S 12.4x 5.5x
2023 P/CF 55.6x 64.1x
Lastly, valuation ratios deserve a quick mention, but are not surprising given the previous information.
SMAR’s slower growth rate, but reaching positive cash flow first relative to ASAN results in elevated P/S
ratios, but discounted P/CF. Titan Investments focuses more on positive cash flow with robust growth rather
than just growth. Positive cash flow is the life blood for any business and gives a slight edge to SMAR.
Conclusion:
The robust nature of the workplace software industry is here to stay. COVID has ushered in a “new normal”
where employees will expect the ability to work from home on a partial basis at the very least. The risk of
hotspots, variants, vaccine issues, etc. would only benefit the industry. Employees will find themselves in this
perpetual state of working from two offices and instead of relying on emails, phone calls, face to face
meetings, etc. this platform will serve as the means to keep employees connected. This connection will also
provide employers the ability to hold their employees accountable to a schedule as well as see daily progress.
SMAR and ASAN are the leaders in an industry that is set to grow at 15% per annum for the next 5 years.
Both firms offer a similar outlook, but SMAR takes a slight lead when considering the entire picture: a proven
track record, sophisticated product offering, and a clientele that is more geographically spread out.
Given the volatile nature of each firm and their relative short trading life, any position in SMAR or ASAN
needs to be done from a tactical perspective. Moving forward, Titan will look to add SMAR given its relative
strength to ASAN. However, a keen eye will be kept on ASAN over the next week as we lap the blackout
period as this could result in ASAN shares falling and providing a strong point of entry.
If you have any questions, do not hesitate to ask.
Respectfully
Kenny Blickenstaff, CFA
CEO, Titan Investment Mgmt. LLC
March 23, 2021
TITAN INVESTMENTS I TITANINVESTMENTMGMT.COM
15
Reference:
https://www.airiodion.com/asana-review/
https://globalworkplaceanalytics.com/work-at-home-after-covid-19-our-forecast
https://www.smartsheet.com/smartsheet-vs-asana
https://www.g2.com/compare/asana-vs-smartsheet
https://www.globenewswire.com/news-release/2021/02/10/2173014/0/en/Global-Integrated-Workplace-
Management-System-Market-By-Component-By-Deployment-Type-By-Enterprise-Size-By-End-User-By-
Region-Industry-Analysis-and-Forecast-2020-
2026.html#:~:text=The%20Global%20Integrated%20Workplace%20Management,IT%2C%20and%20real%20e
state%20professionals.
Bloomberg Anywhere

March 23, 2021
TITAN INVESTMENTS I TITANINVESTMENTMGMT.COM
16
Disclosures:
Titan Investment Management LLC is a registered investment adviser. Information presented is for educational purposes only and does not intend to make an offer or solicitation for the sale or purchase of any specific securities, investments, or investment strategies. Investments involve risk and unless otherwise stated, are not guaranteed. Be sure to first consult with a qualified financial adviser and/or tax professional before implementing any strategy discussed herein. Past performance is not indicative of future performance.
Backtested Performance Disclosure Statement Backtested performance is NOT an indicator of future actual results. There are limitations inherent in hypothetical results particularly that the performance results do not represent the results of actual trading using client assets, but were achieved by means of retroactive application of a backtested model that was designed with the benefit of hindsight. The results reflect performance of a strategy not historically offered to investors and do NOT represent returns that any investor actually attained. Backtested results are calculated by the retroactive application of a model constructed on the basis of historical data and based on assumptions integral to the model which may or may not be testable and are subject to losses.
Backtested performance is developed with the benefit of hindsight and has inherent limitations. Specifically, backtested results do not reflect actual trading, or the effect of material economic and market factors on the decision making process, or the skill of the adviser. Since trades have not actually been executed, results may have under- or over-compensated for the impact, if any, of certain market factors, such as lack of liquidity, and may not reflect the impact that certain economic or market factors may have had on the decision-making process. Further, backtesting allows the security selection methodology to be adjusted until past returns are maximized. Actual performance may differ significantly from backtested performance.
Model portfolio performance is not shown net of the model advisory fee of 1.00% the average fee charged by Titan Investment Management LLC, and gross of trading costs based on our Custodian TD Ameritrade. Performance does not reflect the deduction of other fees or expenses, including but not limited to brokerage fees, custodial fees and fees and expenses charged by mutual funds and other investment companies. Performance results shown include the reinvestment of dividends and interest on cash balances where applicable. The data used to calculate the model performance was obtained from sources deemed reliable and then organized and presented by Titan Investment Management LLC.