smarter tomorrow - sbm group
TRANSCRIPT
S B M B A N K ( M A U R I T I U S ) LT D
2018ANNUAL REPORT
FOR A
TOMORROWSMARTER

CORPORATEINFORMATION
DIRECTORS
Mr Nayen Koomar Ballah, G.O.S.K.
Mr Philip Ah-Chuen
Mr Rajakrishna Chellapermal
Mr Ishwar Anoopum Gaya
Mr Rishikesh Hurdoyal
Mr Michel Arnaud Moothoosamy
Mr Abdool Karrim Namdarkhan
Mr Venkateswara Rao Parvataneni
Mr Visvanaden Soondram
Mrs Veronique Lim Hoye Yee
SECRETARY
Ms Preshnee RamchurnSBM Tower,1 Queen Elizabeth II Avenue,Port LouisMauritius
REGISTERED OFFICE
SBM Bank (Mauritius) LtdSBM Tower,1 Queen Elizabeth II Avenue,Port LouisMauritius
AUDITORS
Ernst & Young9th Floor, Tower 1NeXTeracomCybercityEbene, Mauritius

TABLE OF CONTENTS
002 VISION
004 CHAIRMAN’S LETTER
005 CEO’S LETTER
008 BOARD OF DIRECTORS
016 STRATEGY
019 FINANCIAL REVIEW
029 CORPORATE GOVERNANCE REPORT• Principle One: Governance Structure• Principle Two: The Board & Committees• Principle Three: Directors’ Appointment Procedures• Principle Four: Directors’ Duties, Remuneration & Performance• Principle Five: Risk Governance & Internal Control• Principle Six: Reporting with Integrity• Principle Seven: Audit• Principle Eight: Stakeholder Relations
075 STATEMENT OF COMPLIANCE
077 RISK MANAGEMENT REPORT
121 INDEPENDENT AUDITORS’ REPORT
126 FINANCIAL STATEMENTS
228 ABBREVIATION
001ANNUAL REPORT 2018
SBM BANK (MAURITIUS) LTD

“Our vision is to be the leading and most trusted financial services provider in Mauritius and beyond.”
002 ANNUAL REPORT 2018
SBM BANK (MAURITIUS) LTD

ABOUT SBM
003ANNUAL REPORT 2018
SBM BANK (MAURITIUS) LTD

Valued Stakeholders
More than 10 years after the onset of the global financial crisis, the operating environment remains tough, with multiple challenges such as pressures on margins, increased regulatory scrutiny and higher compliance costs, among others. Keeping the objectives of our stakeholders in mind and in line with opportunities available in the market, we have enhanced our business model, with focus on expanding our market base and broadening our range of financial solutions offered to clients. Alongside the growth benefits, our strategic orientations have been subject to major risk factors, and we have had some setbacks which we are actively managing. We are responding to these through a reinforcement of our risk management framework that, I believe, will put us on a stronger footing to continue on our growth path.
We remain committed to transparency and best practices. I am glad to report that the Bank has applied all material aspects of the National Code of Corporate Governance for Mauritius (“the Code”).
As you go through this annual report, you will learn more about the drivers and challenges relating to our financial performance. We explain our governance pillars and how we adhere to them. Our risk philosophy and metrics are described in detail. We also set out our relationships with our different stakeholders as we thrive to help individuals and businesses prosper while making a difference to communities in which we operate. We continue to put emphasis on talent development and on building a team that will deliver effectively on our strategy.
2018 has been a challenging year. But I am confident that we have set the base to sustain strong performance over the coming years while balancing the needs of our different stakeholders.
I would like to thank my fellow Board members for the valuable support that they have provided during the year as well as the Chief Executive, management and all the employees for their dedication towards the success of the Bank. I am grateful to our customers and other stakeholders for their continued trust and patronage.
Sincerely,
Mr N.K Ballah, G.O.S.K Chairman
We are pleased to present the annual report of SBM Bank (Mauritius) Ltd (“SBM” or the “Bank”) for the financial year ended 31 December 2018.
CHAIRMAN’S LETTER
004 ANNUAL REPORT 2018
SBM BANK (MAURITIUS) LTD

At the same time, it has in various ways showcased the financial strength of the Bank – profitability remains in positive territory for the year; liquidity and capital levels are at very strong levels; and customer numbers continue to increase. We are more than ever dedicated in serving our clients in the best possible way to make their banking experience an enjoyable and memorable one.
These few events which have impacted our results negatively have made us think differently and react in a constructive way to resolve the weaknesses identified. We have therefore worked hard in tightening our controls and provided training to our staff on how to assess our potential clients in the international market. We have put in place an extensive remediation plan for our segment B business, which is now substantially complete, enabling us to resume growth in this segment.
In this letter, I will be sharing our financial performance, our strategies to operate in a better manner and our performance against strategy.
Performance
2018 has been a challenging year with a few events affecting profit before tax in a significant manner. However, we take comfort in the continued strength of the Bank’s fundamentals and its excellent growth prospects. Setting aside the three major impairments affecting our expected credit losses, the performance of the Bank improved in 2018 compared to the previous year. Operating income increased by 14.74 percent from MUR 6,871 million to MUR 7,883 million. The Bank was able to contain its non-interest expenses although it continued to strive to convert its staff from “Contracts of determinate duration” to “Contracts of indeterminate duration”. Profit before credit loss expense increased from MUR 4,025 million to MUR 5,149 million. This represents an increase of 27.91 percent compared to financial year 2017. The higher profits before credit loss expense were mainly driven by higher interest income derived from loans and advances and interest income on financial instruments designated at fair value. With the slow disbursements of loans in Segment B during the second half of the year, pending the substantial completion of the remediation plan, the Bank was only able to marginally increase its net fee and commission income. Profit before income tax stood at MUR 2,138 million as compared to MUR 3,797 million in 2017. The Bank’s profit before tax was reduced mainly by the credit loss expense booked on three major groups of clients.
Dear Customers and Valued PartnersIn spite of record high revenues, the financial year under review has been challenging in view of pressures on profitability arising from a rise in impairments, particularly in the cross-border business segment B.
CEO’S LETTER
005ANNUAL REPORT 2018
SBM BANK (MAURITIUS) LTD

For two of these groups, the Bank was able to secure additional collaterals after year end as well as restructure the loan to ensure maximization of the recoverability of the debt. As for the third client, the Bank has already started legal actions as well as done an insurance claim to ensure recovery of the amount.
The cost to income ratio stood at 34.69 percent for the year ended 31 December 2018 (2017: 41.42 percent).
The Bank, on 30 November 2018, declared a distribution in specie whereby it distributed its Indian Operations to its sole shareholder, SBM (Bank) Holdings Ltd. This was part of the strategy for the restructuring of the SBM Group following SBM India obtaining its full-fledged banking license under a wholly owned subsidiary structure.
SBM India Operations recorded a loss of MUR 221.37 million for the 11 months ended 30 November 2018. The India Operations were affected by two major factors namely a cyber-attack leading to a provisioning of MUR 92 million and an additional provisioning made in respect of one loan account for an amount of MUR 74 million.
Deposits from non-bank customers for the Mauritius Operations increased by 9.78 percent from MUR 134.39 billion as at 31 December 2017 to reach MUR 147.53 billion as at 31 December 2018. This increase was mostly from a mix of low cost current and savings accounts and foreign currency term deposits.
The Bank’s total assets for the Mauritius Operations grew by MUR 11,607 million or 6.73 percent, from MUR 172,379 million as at 31 December 2017 to MUR 183,986 million as at 31 December 2018 mainly
CEO’S LETTER (CONT’D)
on account of an increase in investment securities by MUR 13,540 million mitigated by a fall in loans and placements with banks of MUR 2,868 million.
The shareholder’s equity stood at MUR 17,467 million as at 31 December 2018 compared to MUR 18,357 million as at December 2017. Derecognition of the Indian Operations was the main factor leading to this fall as the Bank had to deduct MUR 2,535 million from its reserves.
The Bank maintained adequate capitalisation levels, as gauged by a capital adequacy ratio of 15.11 percent (2017: 12.83 percent), and Common Equity Tier 1 capital (CET1) of 13.49 percent (2017: 11.24 percent).
Operational achievements
The Bank operations have grown compared to prior years and I am proud of our continuous growth and achievements in daily operations. Our operations department work almost round the clock to serve our clients and ensure that our banking services are seamless. The figures below relate to transactions processed daily at our operations centre showing our dedication to providing efficient and fast banking services:
1. Over 13,000 cheques processed daily
2. Over 30,000 domestic bank transfers daily
3. Over 39,000 international bank transfers daily
4. Around 40,000 ATM transactions through our network of 119 ATMs
5. Over 52,330 POS transactions across our network of 4,000 POS and around 1.6 million monthly POS transactions
6. Over 75,000 standing orders/direct debits processed daily during average peak periods
7. Over 2.1 million debit cards transactions per day and over 117,000 transactions from our credit cards transactions.
Awards
We are proud to share our achievements which would not have been possible without your trust in our Bank. SBM was awarded Bank of the Year, Mauritius from The Banker, a publication of the Financial Times group. The Bank was also awarded the Best e-Commerce Bank Mauritius 2018 and the Best Retail Bank Mauritius 2018 by the Global Banking & Finance Review. We have also been awarded at the African Banker Awards for being the Best Regional Bank in Southern Africa.
Economic outlook
Economic activity is expected to be supported by ongoing large-scale infrastructure projects. However, private sector initiatives could be dampened by increased uncertainty in respect of the investment climate, particularly considering the spillover effects of risks to global growth. Credit expansion could thus be more subdued than previously anticipated on the domestic market. The focus in the domestic market will remain on enhancing service quality and increasing the share of transactions effected on digital channels for higher efficiency. On the cross-border front, notable progress has been achieved in the implementation of the remediation plan to reinforce the risk management framework and business volumes may be expected to resume growth in the period ahead.
006 ANNUAL REPORT 2018
SBM BANK (MAURITIUS) LTD

Regulatory framework
Financial year 2018 marks the implementation of IFRS 9 in our books. Our Risk Management Team has spent more than a year with our external consultants in developing the IFRS 9 modelling and ensuring the smooth implementation of the IFRS 9 tools. Training in IFRS 9 to all our front office staff is an ongoing task. Increased RBS reporting to the Bank of Mauritius will make our processes and operations more transparent to the regulators.
The Bank stronger than ever
There have been a few events which could have affected the Bank’s reputation and morale of our staff. However, boosted by the trust that our customers have in the Bank, our employees have renewed efforts to achieve better and better results day by day. We have a successful history and we are ready to create more successful stories in the future. I am proud to see the dedication of our staff to create value in their day to day work and to serve the client in the most simple yet ensuring that the latter enjoys a memorable experience in banking with us. Our remedial actions regarding our Segment B business will allow us to tighten our controls and ensure that we can continue to grow our Segment B business healthily.
Thanking you for your trust
I would like to thank our valued customers and all stakeholders for their continued support and trust in the Bank, even in times of adversity. I would also like to thank our shareholder and the Board of Directors for their valuable support throughout. And finally I would like to thank all staff at the Bank who have ensured the growth in our operations by seamlessly serving our clients. We strongly believe that 2019 will be the start of a strong upturn for SBM.
Parvataneni Venkateswara Rao
Acting Chief Executive
007ANNUAL REPORT 2018
SBM BANK (MAURITIUS) LTD

BOARD OF DIRECTORS
Mr Philip AH-CHUEN, FMIoD, FMIM
Mr Rajakrishna CHELLAPERMAL
Mr Ishwar Anoopum GAYA
Mr Rishikesh HURDOYAL
Mr Nayen Koomar BALLAH, G.O.S.K.
008 ANNUAL REPORT 2018
SBM BANK (MAURITIUS) LTD

Mr Michel Arnaud MOOTHOOSAMY
Mr Abdool Karrim NAMDARKHAN
Mr Visvanaden SOONDRAM
Mr Venkateswara Rao PARVATANENI (“PV Rao”)
Mrs Veronique LIM HOYE YEE
009ANNUAL REPORT 2018
SBM BANK (MAURITIUS) LTD

BOARD OF DIRECTORS
The Board of Directors
Board Focus Areas
The Board’s main focus areas during the Financial Year ended 31 December 2018 were:
Strategy • Reviewed the strategic plans and appraised the performance of the company against key performance indicators
• Facilitated the conversion of SBM’s Indian branch into a wholly owned subsidiary of SBM (Bank) Holdings Ltd
Finance • Reviewed and approved the operating budget of the Bank
• Reviewed the Audit Report and approved audited financial statements
• Approved the declaration of dividend
• Reviewed the reports from Internal Audit and Anti-Fraud
• Reviewed and approved SBM brand repositioning and renovation projects along with major maintenance contracts
Governance & Risk • Approved the revised Composition of the Board and its Sub-Committees
• Approved the reinforcement of the risk management framework
• Discussed the National Code of Corporate Governance for Mauritius and adoption of same in the Company
• Reviewed and approved the policies of the Bank
• Reviewed related party transactions on a quarterly basis
• Approved man power plan and revised employment conditions for employees along with the recruitment at Management level
Other recurrent items • Took note of reports from the Chairman of Committees
• Took note of the developments within the operating environment
• Undertook initiatives to celebrate the 50th Anniversary of the Independence of Mauritius
The Board of Directors comprises 8 Non-Executive Directors and 2 Executive Directors.
010 ANNUAL REPORT 2018
SBM BANK (MAURITIUS) LTD

Details of the Directors who served on the Board during the Financial Year 2018 are set out below:
Members Date of Appointment Category
Mr Nayen Koomar Ballah, G.O.S.K. June 2015 Non-Executive Director & Chairman
Mr Philip Ah-Chuen June 2015 Independent Director
Mr Mahmadally Burkutoola June 2015
Ceased to be director on 28.02.2019.
Independent Director
Mr Rajakrishna Chellapermal June 2015 Independent Director
Mr Raj Dussoye August 2016
Ceased to be director & Chief Executive on 16.08.2018
Executive Director & Chief Executive
Mr Ishwar Anoopum Gaya June 2016 Independent Director
Mr Rishikesh Hurdoyal June 2015 Independent Director
Mr Michel Arnaud Moothoosamy June 2017 Independent Director
Mr Abdool Karrim Namdarkhan October 2018 Independent Director
Mr Venkateswara Rao Parvataneni October 2018 Executive Director & Acting Chief Executive
Mr Visvanaden Soondram November 2018 Non-Executive Director
Mrs Veronique Lim Hoye Yee February 2018 Executive Director
011ANNUAL REPORT 2018
SBM BANK (MAURITIUS) LTD

PROFILES OF THE BOARD OF DIRECTORS OF SBM BANK (MAURITIUS) LTD
Mr Nayen Koomar Ballah is the Secretary to Cabinet and Head of the Civil Service - Prime Minister’s Office since September 2016. He has previously held many leadership positions spanning several ministries in government, namely, Permanent Secretary at the Prime Minister’s Office; Ministry of Arts and Culture; Ministry of Youth and Sports; Ministry of Public Infrastructure, National Development Unit, Land Transport & Shipping; Secretary for Home Affairs at the Prime Minister’s Office; Secretary Public & Disciplined Forces Service Commission. Mr Ballah is a holder of a Bachelor of Arts, Political Science and Economics from the University of Punjab India, a Bachelor of Arts-Honours (English) and a Diploma in Public Administration and Management from the University of Mauritius. He was awarded the title of Grand Officer of the Star and Key of the Indian Ocean (G.O.S.K) by the President of the Republic of Mauritius in March 2018.
Mr Ballah brings with him almost forty years of working experience and is known for his level headed thinking, trust worthiness and hard work ethics.
Besides his position of Chairman of the Bank, Mr Ballah is also a Chairperson and/or Director on the following boards:
• Mauritius Revenue Authority
• Air Mauritius Ltd
• Mauritius Telecom Ltd
• Mauritius Duty Free Paradise Ltd
• Multi Carrier (Mauritius) Ltd
• Metro Express Ltd
Mr Ballah is the Chairman of the Board of SBM Bank (Mauritius) Ltd and Chairman of the Remuneration & Nomination Committee and Strategy Committee.
Mr Nayen Koomar BALLAH, G.O.S.K., Chairman of the Board and Chairman of the Remuneration & Nomination Committee and Strategy Committee
012 ANNUAL REPORT 2018
SBM BANK (MAURITIUS) LTD

Mr Ah-Chuen holds a Master’s degree in Industrial Administration from Aston University, UK and is a Fellow of the Mauritius Institute of Directors (FMIoD) and Fellow of the Mauritius Institute of Management (FMIM). Besides his position as Director of the Bank, he is also an executive director of Allied Motors Co. Ltd and non-executive director of Chue Wing and Company Ltd. Mr Ah-Chuen has spent most of his professional career supporting and guiding education and upliftment initiatives in Mauritius and Rodrigues and is known for his strong ethics and his humility. He is also Commissioner of the Public Service Commission since November 2015 and was appointed Chairman of the Utility Regulatory Authority in May 2018.
Mr Ah-Chuen is an Independent Director on the Board of SBM Bank (Mauritius) Ltd and Chairman of the Corporate Governance and Conduct Review Committee.
Mr Chellapermal has a career that spans both the public and the private sector where he has occupied top executive posts. In the private sector, he has served as the Trade Promotion Officer at the Mauritius Chamber of Commerce and Industry and senior Marketing Manager at the Mauritius Freeport Development. In the public sector, he has served as Deputy Director General and Director General of the Mauritius Freeport Authority, a free trade zone and logistics platform, where he was instrumental in its creation. He was also Director at the Board of Investment, with responsibility for the Freeport and logistics sector.
Mr Chellapermal is a regular consultant of the International Finance Corporation (IFC) of the World Bank Group. His assignments embrace a whole range of investment climate projects in Africa namely the setting up of Investment Promotion Agencies as well as capacity building related to trade and investment promotions.
Mr Chellapermal is an Independent Director on the Board of SBM Bank (Mauritius) Ltd and was appointed as Chairman of Board Credit Committee in March 2019. He previously chaired the Risk Management Committee.
Mr Philip AH-CHUEN FMIoD, FMIM Independent Director and Chairman of the Corporate Governance and Conduct Review Committee
Mr Rajakrishna CHELLAPERMAL Independent Director and Chairman of Board Credit Committee
Mr Ishwar Anoopum GAYA Independent Director and Chairman of Audit Committee
Mr Ishwar Anoopum Gaya is an optometrist who has practiced both in Mauritius and the UK. He is the Managing Director of Gaya Opticians. He has also set up an online shopping platform for eyewear. Mr Gaya is a Member of the General Optical Council, UK and holds a BSc (Hons) in Economics and Finance from the University of East Anglia, UK and a BSc(Hons) in Optometry from the City University, UK . He has previously served as Board Member in various companies across different industries.
Mr Gaya is an Independent Director on the Board of SBM Bank (Mauritius) Ltd and Chairman of the Audit Committee.
013ANNUAL REPORT 2018
SBM BANK (MAURITIUS) LTD

PROFILES OF THE BOARD OF DIRECTORS OF SBM BANK (MAURITIUS) LTD (CONT’D)
Mr Rishikesh HURDOYAL Independent Director and Chairman of Procurement Committee
Mr Abdool Karrim NAMDARKHAN Independent Director and Chairman of Risk Management Committee
Mr Michel Arnaud MOOTHOOSAMY Independent Director and Chairman of Finance Committee
Mr Michel Arnaud Moothoosamy is an independent director with a strong background in the finance sector. He is a Fellow of the International Institute for Book Keepers. Besides his position as Director of the Bank, Mr Moothoosamy also serves as director on the Boards of Cyber Property Investment Limited and the Informatics Park limited and is the former President of the Small and Medium Enterprises Federation.
Mr Moothoosamy is an Independent Director on the Board of SBM Bank (Mauritius) Ltd and Chairman of the Finance Committee.
Mr Rishikesh Hurdoyal is a practising Barrister at Law and has been admitted to the Bar both in Mauritius and in the UK. He holds a B.A. (Hons) Law & Management from the University of Mauritius, an LLM in International Law with International Relations from the University of Kent UK, and a Postgraduate Diploma in Law from the London Metropolitan University, UK. Besides his position as Director of the Bank, Mr Hurdoyal is presently also acting as Legal adviser in various parastatal bodies and management companies.
Mr Hurdoyal is an Independent Director on the Board of SBM Bank (Mauritius) Ltd and Chairman of the Procurement Committee.
Mr Abdool Karrim Namdarkhan is a barrister by profession. He was called to the Bar of England and Wales in July 2012 at the Honourable Society of Gray’s Inn and was admitted to the Bar of Mauritius in September 2013. He is also a tenant at Basset Chambers and a Member of the Independent Review Panel. Mr Namdarkhan holds an LLB (Hons) in Laws from King’s College London and has successfully completed the Bar Professional Training course at the University of Law, London.
Mr Namdarkhan is an Independent Director on the Board of SBM Bank (Mauritius) Ltd and was appointed as Chairman of the Risk Management Committee in March 2019.
014 ANNUAL REPORT 2018
SBM BANK (MAURITIUS) LTD

Mr Venkateswara Rao PARVATANENI (“PV Rao”) Executive Director and Acting Chief Executive
Mr Visvanaden SOONDRAM Non-Executive Director
Mr Visvanaden Soondram is the Director of Economic and Finance at the Ministry of Finance & Economic Development. He has previously served as Accountant, Senior Financial & Management Analyst and Principal Financial & Management Analyst within the same Ministry. He is a Chartered Certified Accountant (FCCA) and holds a Master of Science in Finance.
Mr Soondram is a Non-Executive Director on the Board of SBM Bank (Mauritius) Ltd.
Mr PV Rao was appointed as Acting Chief Executive of the Bank in August 2018. Prior to taking up this post, he had occupied other key positions within SBM namely, as Head of the Financial Markets division of SBM Bank (Mauritius) Ltd and Head of Treasury of SBM Mumbai. He had previously worked for Syndicate Bank and IndusInd Bank in India and has over 30 years of experience in this field. Mr PV Rao holds a B Sc. (Agrl) from Andhra Pradesh Agricultural University and an MBA from the Indira Gandhi National Open University.
Mr PV Rao is an Executive Director on the Board of SBM Bank (Mauritius) Ltd since October 2018.
Mrs Veronique LIM HOYE YEE Executive Director
Mrs Veronique Lim Hoye Yee is currently the Head of Credit Underwriting Team at SBM Bank (Mauritius) Ltd and has held positions of increasing responsibilities over a span of 11 years since she joined the Bank in 2001. In August 2012, she took the position of Head of Credit Underwriting & Risk at another local bank before returning to SBM in September 2016 as Head of the Credit Underwriting Team. She is a CFA Charterholder from the CFA Institute, US and holds a BSc (Hons) in Economics and Accounting and an MSc in Economics and Finance, both from University of Bristol, UK .
Mrs Lim Hoye Yee is an Executive Director on the Board of SBM Bank (Mauritius) Ltd since February 2018.
015ANNUAL REPORT 2018
SBM BANK (MAURITIUS) LTD
STRATEGY REPORT
016 ANNUAL REPORT 2018
SBM BANK (MAURITIUS) LTD

In line with the Group strategic vision, the management of SBM Bank (Mauritius) Ltd, with the authority of the Board, continued its effort to implement initiatives to improve the customer experience and to consolidate and modernise its operations. In this regard, major milestones have been achieved in 2018 to deliver value to stakeholders, as follows:
A. Customer
• With the launch of ShopnCash customers can use their debit card to withdraw cash when making purchases, giving them the flexibility and convenience of avoiding queueing at ATMs.
• The Bank has deployed new ATMs which allow customers to make cash deposits without envelopes at 17 locations.
• The internet and mobile banking platforms have been revamped for enhanced security and customer experience.
• The Bank is encouraging customers to opt for e-statement which is a secured, convenient, and an environment friendly way to access their bank statements.
• SBM has partnered with AliPay, the world’s biggest online and mobile payment company run by Ant Financial Group, an affiliate company of the e-commerce giant, Alibaba Group. Local merchants can now allow Chinese buyers to make payments through this digital wallet. It is secured, quick and easy to use for the merchants and also provides the Chinese tourists a payment system with which they are much comfortable.
• The Bank went live on the Digital Private Wealth Platform MoneyWare, a cross asset front to back solution and have implemented client onboarding, risk profiling, model portfolios and investment limits, trade order management, settlements and fee management
• Another milestone is the launching of its Custody Client Portal. It is an online client portal which provides a clear and interactive interface of the customer’s custody account.
B. Employees
• One of the major talent retention achievements was to convert employment contracts to permanent. Another milestone was the introduction of a Group Health Policy with enhanced benefits and covers for staff members.
• To achieve excellence, it is of paramount importance for the Bank to invest in talent development. The SBM Academy was launched during the year to build capacity by preparing employees to live up to the challenges of this growth strategy.
C. Risk management
• In view of the headwinds in Segment B, the Bank took the commitment to deliver on the Remediation plan, a programme consisting of risk management, compliance and organisational measures. This enables us to resume growth in this business in a more targeted and productive manner.
• The Bank, taking stock of achievements, including the lessons learnt, is making further strides toward the achievement of its strategic plan and objectives.
STRATEGYREPORT
017ANNUAL REPORT 2018
SBM BANK (MAURITIUS) LTD

“Improvement of operating income on a strong platform”
018 ANNUAL REPORT 2018
SBM BANK (MAURITIUS) LTD

FINANCIAL REVIEW
019ANNUAL REPORT 2018
SBM BANK (MAURITIUS) LTD

Results
Profit before credit losses registered a growth of 27.91% from MUR 4.03 billion in financial year 2017 to MUR 5.15 billion in this financial year.
Profit after tax from continuing operations for the year under review amounted to MUR 1.46 billion, representing a decrease of 55.76 percent compared to 2017.
There have been some other exceptional events during the year which have led to a significant decrease in the profit for this financial year. However, the Bank is confident that in the coming year, it will be able to turnaround the situation and achieve the desired profits. The Bank will continue to pursue its strategy in the international market and has taken important remedial measures and strengthen the Bank’s control around its offshore business.
Credit loss expense on financial assets stood at MUR 3.01 billion for the year ended 31 December 2018 as compared to MUR 0.23 billion for the year ended 31 December 2017 on account of IFRS 9 implementation and three major groups of clients classified as impaired in the year 2018. In the first half of this financial year, the Bank accounted for an impairment of MUR 932 million for an offshore client (Segment B account) while in the last quarter, impairment of MUR 1.5 billion was booked for two related Segment B groups of clients.
On 30 November 2018, the Bank made a distribution in specie of the Indian Operations to the sole shareholder. The Bank therefore accounted for the eleven month results of Indian Operations under “Discontinued Operations”. The Bank also had to recycle the translation reserve of this foreign operations amounting to a loss of MUR 686 million.
The Bank thus ended the year with a total profit of MUR 554 million after taking into consideration the above mentioned losses.
Revenue growth
Operating income for 2018 registered a growth of 14.74 percent to reach MUR 7.88 billion compared to MUR 6.87 billion in 2017, representing an overall increase of MUR 1.01 billion. The main revenue streams are (i) Net Interest Income (Interest Income less Interest
Expense), (ii) Non-Interest Income or fee income comprising mainly fees and commission, income from card business and exchange income and (iii) trading income representing gain on sale of securities and gain on dealings in financial instruments and foreign currency dealings.
Net Interest Income
The economic conditions have continued to remain moderate during 2018. The excess liquidity in the domestic banking market made it very challenging to grow the loan book in 2018 and to further increase interest income thereon. The Bank has witnessed an increase in its interest income in this financial year mainly on account of the increase in the loan book in the second half of the financial year 2017.
The loan portfolio however did not follow the same trend as the deposit book during this financial year for the reason mentioned above. The Bank (Mauritius Operations) witnessed an increase in the deposit book (both from bank and non-bank customers) from MUR 135.10 billion to MUR 148.33 billion; an increase of 9.79 percent, while the gross loan portfolio increased from MUR 97.64 billion in 2017 to MUR 99.80 billion which represents an increase of 2.21 percent year on year.
The Bank has therefore been investing the surplus funds in low interest earning assets notably gilt-edged securities, foreign bonds and short-term placements with foreign banks that resulted in lower income for the Bank. The average yield on bonds increased from 3.62% in 2017 to reach 3.90% during this financial year.
The Bank has been able to properly manage its liabilities through lower cost Current and Savings Account deposits (CASA) which accounted for 83.22 percent of total deposits at 31 December 2018 (2017: 81.41 percent).
Interest income over average earning assets decreased from 4.55 percent in 2017 to 4.44 percent in 2018. The impact was due to the fall in the Bank’s PLR from 6.25 percent to 5.85 percent in November 2017 which affected interest income for the full financial year 2018 as compared to 2017. Interest expense increased by MUR 95.88 million from MUR 1.57 billion in 2017 to MUR 1.67 billion in 2018 mainly attributable to the growth in deposit book. The average cost of deposit fell from 1.20 percent in 2017 to 0.97 percent in 2018 on account of the low interest earning CASA deposits.
020 ANNUAL REPORT 2018
SBM BANK (MAURITIUS) LTD
FINANCIAL REVIEW (CONT’D)

Net interest margin increased to 3.08 percent for the year ended 31 December 2018 compared to 2.99 percent for the year ended 31 December 2017 on account of the increase in the loan book in the second half of the financial year 2017.
2,594
5,688
2,184
6,120
2,312
6,273
2,002
6,069
1,361
5,397
1,569
6,075
1,665
7,156
2018201720162015201420132012
3.24
3.863.63
3.443.21
2.993.08
Net Interest Margin
Interest income Interest expense NIM (%)
Non-Interest Income
Non-interest income witnessed a minimal increase from MUR 2.37 billion for the year ended 31 December 2017 to MUR 2.39 billion for the year ended 31 December 2018, or 1.14 percent.
021ANNUAL REPORT 2018
SBM BANK (MAURITIUS) LTD

The table below shows the main components of the Bank’s non-interest income.
Year Dec-18
Year Dec-17 Variance
MUR’ million MUR’ million MUR’ million %Foreign exchange gain 679.74 431.48 248.26 57.54 Net fee and commission income 688.13 667.80 20.33 3.04 Card income including e-commerce income 350.52 315.07 35.45 11.25 Gain on sale of investment securities 673.69 950.79 (277.10) (29.14)Total 2,392.08 2,365.14 26.94 1.14
The two key drivers in the growth of the non-interest income are (i) Gain from foreign currency dealings and (ii) increase in card income including e-commerce income. However, this growth was substantially mitigated by the fall in the gain on sale of investment securities. A shortfall in income from disposal of securities as compared to FY 2017 was due to increasing yields in both USD and MUR currencies.
Net fee and commission income increased by only MUR 20.33 million in line with the restrained disbursements of loans in Segment B as the Bank had been focusing on the strengthening of its control in this Segment.
The ratio of non-interest income to average assets stood at 1.34 percent for 2018 against 1.57 percent for 2017. Non-interest income as a percentage of gross revenue was 30.34 percent for 2018 against 34.42 percent for 2017.
Non-Interest Expense
Non-interest expense amounted to MUR 2.73 billion for the year 2018 compared to MUR 2.85 billion for 2017, a decrease of 3.90 percent. This decrease is mainly explained by the continued effort of the Bank to reduce its operational costs.
022 ANNUAL REPORT 2018
SBM BANK (MAURITIUS) LTD
FINANCIAL REVIEW (CONT’D)

The table below shows the components of operating expenses.
Year Dec-18
Year Dec-17 Variance
MUR million MUR million MUR million % changePersonnel costs 1,336.29 1,363.40 (27.10) (1.99)Property costs (including depreciation) 199.04 216.69 (17.66) (8.15)System costs (including depreciation and amortisation) 971.47 1,025.33 (53.85) (5.25)Other expenses 227.93 240.17 (12.25) (5.10)Total 2,734.73 2,845.59 (110.86) (3.90)
Non-Interest Expense
Cost to income ratio stood at 34.69 percent in 2018 compared to 41.42 percent in 2017. The significant increase in profit arising from dealing in foreign currencies and the continuous effort to decrease the other operating costs explains the improvement.
Credit loss expense on financial assets
Credit loss expense amounted to MUR 3,010 million for the year ended 31 December 2018 against MUR 228.02 million for the year 2017. Credit impairment was mainly on account of three major accounts being impaired during this year amounting to MUR 2,397 million and an increase in the stage 1 and 2 provisioning following adoption of IFRS 9 which became effective as from 01 January 2018. It should be highlighted that for the financial year 2017, recoveries of amount previously written off of MUR 116.58 million explains the low credit expense for that financial year.
Discontinued operations
SBM IOPS’s loss recorded for the 11 months ended 30 November 2018 amounted to MUR 221.37 million. Two major factors affected the Indian Operations during that period, namely the cyber-attack leading to a provisioning of MUR 92.25 million and an additional provisioning made in respect of one loan account for an amount of MUR 74.00 million.
Financial position
Figures disclosed for 2018, in the Statement of Financial Position relates to the Mauritius Operations only, while for 2016 and 2017, it is for both the Indian and Mauritius Operations.
However for the purpose of this financial review, we are providing the below financial position for 2016-2018 only for the Mauritius Operations.
023ANNUAL REPORT 2018
SBM BANK (MAURITIUS) LTD

STATEMENT OF FINANCIAL POSITIONAS AT 31 DECEMBER 2018
31 December 2018
31 December 2017
31 December 2016
MUR’ 000 MUR’ 000 MUR’ 000ASSETSCash and cash equivalents 11,211,712 14,475,784 8,680,232Mandatory balances with central banks 8,767,767 8,494,436 6,808,268Loans to and placements with banks 11,764,358 8,895,860 4,466,195Derivative financial instruments 762,855 1,299,099 160,984Loans and advances to non-bank customers 94,296,051 95,135,823 68,301,026Investment securities 50,934,309 37,394,434 34,127,015Equity investments 3,411 370 370Property and equipment 2,458,814 2,493,316 2,607,634Intangible assets 2,962,920 3,422,881 3,509,063Deferred tax assets - - 52,550Other assets 823,653 766,600 331,679
Total assets 183,985,850 172,378,603 129,045,016
LIABILITIES Deposits from banks 796,117 717,562 2,708,573Deposits from non-bank customers 147,530,840 134,385,431 103,114,780Other borrowed funds 11,773,938 12,514,710 4,685,024Derivative financial instruments 758,642 1,296,836 178,400Current tax liabilities 474,487 105,869 358,908Deferred tax liabilities 163,996 170,905 - Other liabilities 5,020,635 3,917,582 2,052,598
Total liabilities 166,518,655 153,108,895 113,098,283
SHAREHOLDER’S EQUITYStated capital 310,000 310,000 310,000Capital contribution 11,044,011 9,063,106 8,063,106Retained earnings 4,817,518 8,487,260 6,135,551Other reserves 1,295,666 1,409,342 1,438,076Total equity 17,467,195 19,269,707 15,946,733
Total equity and liabilities 183,985,850 172,378,603 129,045,016
024 ANNUAL REPORT 2018
SBM BANK (MAURITIUS) LTD
FINANCIAL REVIEW (CONT’D)

Loans and advances
Gross advances for the Mauritius Operations increased by MUR 2.16 billion or 2.21 percent to reach MUR 99.80 billion as at 31 December 2018. The Bank considerably increased its loan portfolio in the second half of financial year 2017. In financial year 2018, the Bank focused more on tightening its control in Segment B and restrained from increasing its loan book even though the market in this segment is still on a high demand for credit facilities.
A breakdown of the credit portfolio by economic sectors and level of provisions held has been disclosed in Note 9 of the Financial Statements.
Credit quality
Impaired advances net of cash collaterals stood at MUR 9.02 billion as at 31 December 2018, compared to MUR 2.40 billion as at 31 December 2017. Specific allowance for credit impairment has increased from MUR 1.33 billion as at 31 December 2017 to MUR 4.22 billion as at 31 December 2018, representing provision coverage ratio of 46.81 percent, against 55.42 percent at 31 December 2017. The uncovered portion is adequately covered by collaterals, suitably discounted to reflect prevailing market conditions and expected time of recovery.
The ratio of gross impaired advances net of cash collaterals to gross advances stood at 9.36 percent at 31 December 2018 compared to 3.20 percent as at 31 December 2017. The increase is mainly on account of the three major Segment B accounts mentioned earlier. It should be noted that there was an amelioration in the gross impaired advances to gross advances in 2017 mainly on account of write offs of few impaired loans accompanied by an increase in loans disbursed during the second half of the year.
Net impairment ratio (taking in consideration all cash collaterals) for Mauritius Operations also increased from 1.13 percent in 2017 to 5.28 percent in 2018.
9.36
2.11
5.05
6.53
3.20
5.28
1.16
2.65
1.85
0.95
Net impaired advances to net advances (%)
Gross impaired advances to gross advances (%)
20182017201620152014
%
Investment Securities and Placements
Given the excess market liquidity and lower credit take off in the domestic market, funds were invested in fixed income gilt-edged securities, foreign bank bonds, corporate bonds and short-term placements with banks. Investment securities increased by MUR 13.54 billion or 36.21 percent to reach MUR 50.93 billion as at 31 December 2018.
As at 31 December 2018, financial assets classified at fair value through other comprehensive income stood at MUR 27.42 billion (2017: MUR 8.95 billion). This represents mainly the investments in government and bank bonds as well as treasury bills and notes under the banking book.
The Bank continued to increase its investments in short term loans and placements with other banks. Gross loans and placements with banks amounted to MUR 11.76 billion as at 31 December 2018 compared to MUR 8.90 billion as at 31 December 2017.
025ANNUAL REPORT 2018
SBM BANK (MAURITIUS) LTD

Other Non-Interest Earning Assets
Other non-interest earning assets decreased by MUR 437 million mainly explained by a decrease in balances due in clearing.
Placements01
02
02
03
04
04
01
03
28%
6%
15%
51%
Other Assets
Investment Securities
Loans and advances
Assets Mix 2018
Placements01
02
02
03
04
04
01
03
21%
5%
18%
56%
Other Assets
Investment Securities
Loans and advances
Assets Mix 2017
Deposits and Borrowings
Total deposits from non-bank customers experienced a further increase during this year by 9.78 percent from MUR 134.39 billion as at 31 December 2017 to reach MUR 147.53 billion as at 31 December 2018. The growth was driven by an increase in CASA by MUR 13.37 billion and mitigated by a decrease in term deposits by MUR 230.52 million. CASA deposits accounted for 83.22 percent of total deposits as at 31 December 2018 (2017: 81.41 percent).
MU
R M
n
20182017201620152014
15,280
75,26385,008
91,848 110,622122,777
18,57016,455
31,07424,748
Term
CASA
Deposits
Other Borrowed Funds
Other borrowed funds decreased by MUR 740.77 million to reach MUR 11.77 billion as at 31 December 2018. The bulk of the borrowings were in USD and Euro from foreign financial/development institutions at competitive pricing. These borrowings are mainly used to finance certain specific loans disbursed by the Bank. The Bank did not enter into any new agreement with these institutions during the financial year 2018. However, the Bank has been actively dealing with such financial institutions and is in negotiation to enter into some new agreements during the financial year 2019.
026 ANNUAL REPORT 2018
SBM BANK (MAURITIUS) LTD
FINANCIAL REVIEW (CONT’D)

Shareholder’s Fund
Shareholder’s fund decreased by 9.35 percent from MUR 19.27 billion at 31 December 2017 to reach MUR 17.47 billion at 31 December 2018 mainly explained by a capital injection of MUR 1.98 billion made by the holding company during the financial year 2018 and a profit of MUR 554 million recorded during this year mitigated by cash dividend of MUR 1.1 billion and a distribution in specie leading to a derecognition of MUR 2.54 billion from reserves. Return on average shareholder’s equity stood at 7.97 percent at 31 December 2018 compared to 18.76 percent at 31 December 2017. The profit of the Bank was exceptionally low this year due to impairment of three segment B loan accounts and the recycling of the negative foreign currency translation reserve following derecognition of the Indian Operations with the distribution in specie made in the last quarter of financial year 2018. The Bank maintained adequate capitalisation levels, including capital adequacy ratio of 15.11 percent (2017: 12.83 percent), with Common Equity Tier 1 capital (CET1) making 13.49 percent (2017: 11.24 percent).
Refer to the Capital Management section for more details.
Shareholder’s Fund
201820172016201520142013
MU
R M
n
14,391 14,494 13,599
15,754
18,35717,467
Shareholder’s equity CAR (%)
18.75
14.88 14.85 13.75
15.11
18.49
027ANNUAL REPORT 2018
SBM BANK (MAURITIUS) LTD

“All organisations should be headed by an effective Board. Responsibilities and accountabilities within the organisation should be clearly identified.”
028 ANNUAL REPORT 2018
SBM BANK (MAURITIUS) LTD

CORPORATE GOVERNANCE REPORT
029ANNUAL REPORT 2018
SBM BANK (MAURITIUS) LTD

CORPORATE GOVERNANCE REPORT (CONT’D)
Dear Shareholders and Valued Partners,
I am delighted to present to you this report on Corporate Governance for financial year 2018.
As a public interest entity, the Board of Directors has made every effort to apply fully the standards found in the new National Code of Corporate Governance in its belief that good governance is not simply a matter of compliance but also a lever for growth and sustainability. The Board has followed the guidance notes to the Code closely and has paid careful attention to each principle found therein. The Board of SBM has sought to be as transparent and complete as possible in its disclosures and in its reporting.
The Board of SBM is a Board of skilled, knowledgeable and experienced professionals carefully selected to be effective in the governance of the Bank. It assumes full responsibility for leading and controlling the organisation and for meeting, to the best of its knowledge, all requirements laid down by law in the Republic of Mauritius.
I wish to thank the members of the Board, the Company Secretary and the staff for their work and commitment this year towards good governance.
On behalf of the Committee,
Philip Ah-Chuen Chairman Corporate Governance and Conduct Review Committee
PHILIP AH-CHUENCHAIRMAN CORPORATE GOVERNANCE AND CONDUCT REVIEW COMMITTEE
030 ANNUAL REPORT 2018
SBM BANK (MAURITIUS) LTD

This report is laid out in the same order of the eight principles of the Code for ease of reference:
Pages
Principle One – Governance Structure 32-40
Principle Two – The Structure of the Board and its Committees 41-49
Principle Three – Directors Appointment Procedures 50-51
Principle Four – Directors Duties, Remuneration and Performance 52-55
Principle Five – Risk Governance and Internal Control 56-57
Principle Six – Reporting with Integrity 58-64
Principle Seven – Audit 65-68
Principle Eight – Relations with Shareholders and Other Key Stakeholders 69-74
031ANNUAL REPORT 2018
SBM BANK (MAURITIUS) LTD

CORPORATE GOVERNANCE REPORT (CONT’D)
Principle One – Governance Structure
All organisations should be headed by an effective Board. Responsibilities and accountabilities within the organisation should be clearly identified.
The Board of Directors affirms that:
> the Bank is a public interest entity as defined by law.
> the Bank has applied all material aspects of the National Code of Corporate Governance for Mauritius
The Board treats its fiduciary responsibilities with the utmost diligence. Each director is appointed with the understanding of the amount of time that they will need to devote to the Board and to the organisation in order for it to prosper.
SBM Bank (Mauritius) Ltd is led by a unitary Board, which is collectively accountable and responsible for leading and controlling the Bank. The Board assumes its responsibility for meeting all legal and regulatory requirements of the Bank and see to it that the strategies are implemented by Management.
The following key governance documents are available on the company’s website:
> Code of Ethics
> Board Charter
> Organisation chart
These documents have been approved by the Board and are reviewed on an annual / regular basis.
032 ANNUAL REPORT 2018
SBM BANK (MAURITIUS) LTD
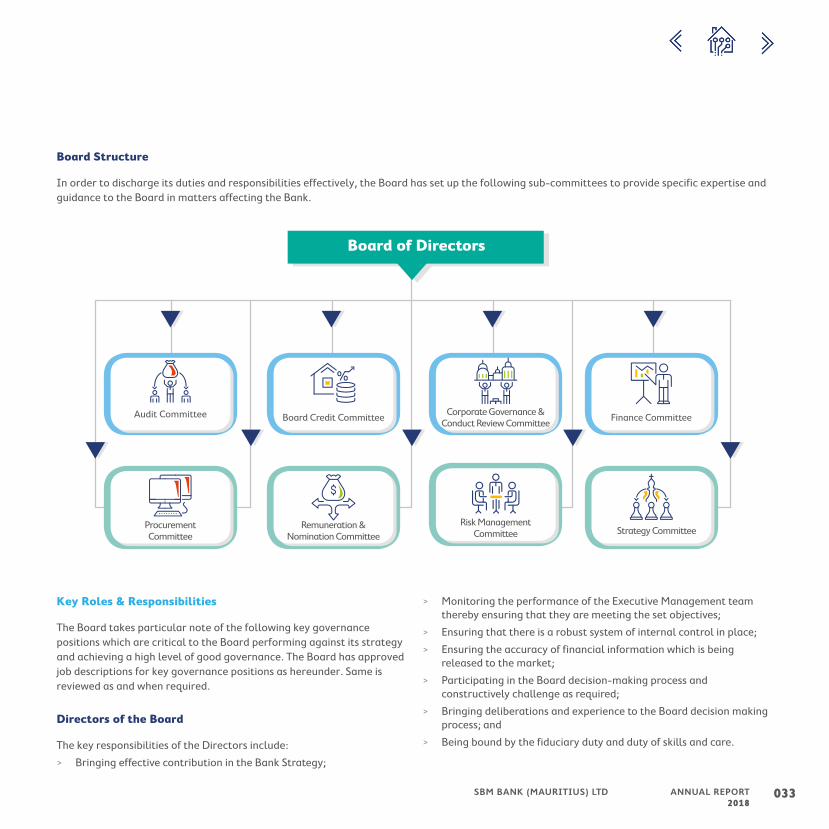
Board Structure
In order to discharge its duties and responsibilities effectively, the Board has set up the following sub-committees to provide specific expertise and guidance to the Board in matters affecting the Bank.
Audit Committee Corporate Governance & Conduct Review Committee
Board Credit Committee Finance Committee
Remuneration & Nomination Committee
Board of Directors
Risk Management Committee Strategy Committee
Procurement Committee
Key Roles & Responsibilities
The Board takes particular note of the following key governance positions which are critical to the Board performing against its strategy and achieving a high level of good governance. The Board has approved job descriptions for key governance positions as hereunder. Same is reviewed as and when required.
Directors of the Board
The key responsibilities of the Directors include:
> Bringing effective contribution in the Bank Strategy;
> Monitoring the performance of the Executive Management team thereby ensuring that they are meeting the set objectives;
> Ensuring that there is a robust system of internal control in place;
> Ensuring the accuracy of financial information which is being released to the market;
> Participating in the Board decision-making process and constructively challenge as required;
> Bringing deliberations and experience to the Board decision making process; and
> Being bound by the fiduciary duty and duty of skills and care.
033ANNUAL REPORT 2018
SBM BANK (MAURITIUS) LTD

CORPORATE GOVERNANCE REPORT (CONT’D)
Chairman of the Board
The position of the Chairman of the Board is to hold as key responsibilities the following:
> The Chairman as leader of the Board must ensure that it functions effectively;
> Set agenda in conjunction with Company Secretary and ensure that there is sufficient time to discuss all agenda items;
> Ensure that all Directors receive sufficient information to be able to make well informed decision;
> Review composition of Board Committees and ensuring that each committee functions effectively;
> Call special meetings, where required;
> Ensure that there is proper succession planning in order to avoid disruption to the smooth functioning of the Board ;
> Encourage teamwork and a culture of openness so as to promote constructive challenge among the Members;
> Chair annual and special meetings of shareholders;
> Ensure that an annual Board evaluation exercise and evaluation of individual Directors performance is carried out;
> Maintain a close working relationship with the Chief Executive Officer and any other key senior staff members; and
> Ensure there is effective communication with shareholders.
Chief Executive
The Chief Executive (CE) is responsible for leading the development and execution of the Bank’s strategic plans with a view to creating shareholder value. As per the Bank of Mauritius Guideline on Corporate Governance, the CE’s leadership role entails being ultimately responsible for all day-to-day management decisions and for implementing the Company’s strategic plans.
The position of the CE is to hold as key responsibilities the following:
> to manage the day to day operations of the Bank;
> to implement strategy as proposed by the Board of Directors;
> to work in conjunction with the Chairman on strategic issues;
> to provide leadership and guidance to Senior Management Team;
> to act as an intermediary between the Board and Management;
> to ensure that there is a robust system of internal control in place; and
> to communicate effectively with shareholders, employees, Government authorities, other stakeholders and the public.
Chairman of the Risk Management Committee
> The Chair of the Risk Management Committee works in close co-operation with, and provides support and advice to the Chairman of the Board. He has the following additional responsibilities:
> To provide risk expertise to the Risk Management Committee;
> To ensure compliance with the terms of the regulatory framework in Mauritius;
> To guide and advise the Board in the approval of an appropriate risk management framework;
> To ensure that an update report of each Risk Management Committee meeting is presented to the Board; and
> To ensure that appropriate risk management training for Directors and senior management is available and effective.
034 ANNUAL REPORT 2018
SBM BANK (MAURITIUS) LTD

Chairman of the Corporate Governance & Conduct Review Committee
The Chair of the Corporate Governance & Conduct Review Committee works in close collaboration with, and provides support and advice to, the Chairman of the Board. He has the following additional responsibilities:
> To provide expertise in the areas of corporate governance and ethical conduct;
> To ensure Board practices are aligned to global and national good governance standards;
> To ensure that the policies around conduct and ethical standards are regularly upheld and transparently adhered to by the Board and Senior Management;
> To ensure that key issues discussed at the Corporate Governance & Conduct Review Committee meeting are reported to the Board;
> To ensure that the Board receives regular and ongoing training and development;
> To oversee the production of the Bank’s annual report each year; and
> To ensure that an evaluation of the Board is carried out each year and that the recommendations from that evaluation are implemented.
Head of Legal & Corporate Affairs
The main accountabilities of the Head of Legal & Corporate Affairs include:
> Providing the various Boards with guidance on its duties, responsibilities and powers;
> Implementing best practice governance structures within the SBM Group;
> Ensuring Group regulatory disclosure requirements are met in a timely manner;
> Providing legal advice to business units and ensuring legal risk is effectively managed throughout the Group; and
> Reporting and managing group litigation and external law firm panels.
Company Secretary
The main responsibilities of the Company Secretary include:
> Providing the Board with guidance as to its duties, responsibilities and powers;
> Statutory filings;
> Ensuring that minutes of all meetings of shareholders and directors are properly recorded in accordance with paragraph 8 of the Fifth Schedule and paragraph 6 of the Eighth Schedule of the Companies Act 2001 (the “Act”) respectively as well as all statutory registers are properly maintained;
> Certifying in the annual financial statements of the Bank that the Bank has filed with the Registrar all such returns of the Bank as are required under the Act;
> Ensuring that a copy of the Bank’s annual financial statements and where applicable the annual report is sent in accordance with sections 219 and 220 to every person entitled to such statements or report in terms of the Act, and
> Playing a leading role in governance of the Bank by supporting the Chairman and helping the Board and its committees to function effectively
035ANNUAL REPORT 2018
SBM BANK (MAURITIUS) LTD
CORPORATE GOVERNANCE REPORT (CONT’D)
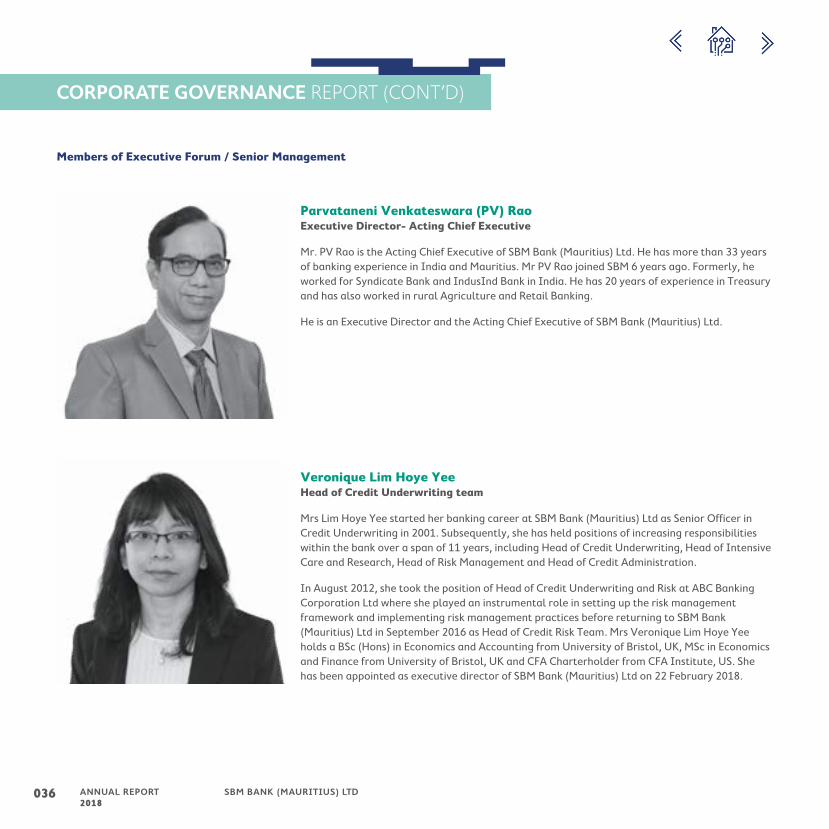
Parvataneni Venkateswara (PV) RaoExecutive Director- Acting Chief Executive
Mr. PV Rao is the Acting Chief Executive of SBM Bank (Mauritius) Ltd. He has more than 33 years of banking experience in India and Mauritius. Mr PV Rao joined SBM 6 years ago. Formerly, he worked for Syndicate Bank and IndusInd Bank in India. He has 20 years of experience in Treasury and has also worked in rural Agriculture and Retail Banking.
He is an Executive Director and the Acting Chief Executive of SBM Bank (Mauritius) Ltd.
Veronique Lim Hoye YeeHead of Credit Underwriting team
Mrs Lim Hoye Yee started her banking career at SBM Bank (Mauritius) Ltd as Senior Officer in Credit Underwriting in 2001. Subsequently, she has held positions of increasing responsibilities within the bank over a span of 11 years, including Head of Credit Underwriting, Head of Intensive Care and Research, Head of Risk Management and Head of Credit Administration.
In August 2012, she took the position of Head of Credit Underwriting and Risk at ABC Banking Corporation Ltd where she played an instrumental role in setting up the risk management framework and implementing risk management practices before returning to SBM Bank (Mauritius) Ltd in September 2016 as Head of Credit Risk Team. Mrs Veronique Lim Hoye Yee holds a BSc (Hons) in Economics and Accounting from University of Bristol, UK, MSc in Economics and Finance from University of Bristol, UK and CFA Charterholder from CFA Institute, US. She has been appointed as executive director of SBM Bank (Mauritius) Ltd on 22 February 2018.
Members of Executive Forum / Senior Management
036 ANNUAL REPORT 2018
SBM BANK (MAURITIUS) LTD

Sanjaiye RawoteeaDivision Leader of Private Banking & Wealth Management
Sanjaiye is a seasoned banker with more than 20 years of banking experience including 10 years in Private Banking & Wealth Management. He has been working for both local and international banks. Sanjaiye join SBM group in 2009 where he held numerous positions including Senior Relationship Manager in Private Banking & Head of Sales & Marketing in SBM Non-Banking Financial Cluster. In 2017 he set up the Private Wealth Division within the bank which offers Wealth Management Solution to Ultra High Net worth clients.
Sanjaiye holds an MBA in Investment Finance & Corporate Finance from Management College of Southern Africa and B.com Finance and Business Administration from University of Natal, Durban, South Africa.
Norman Fon SingHead of Corporate & Institutional Banking – Segment A
Norman is currently the Head of Corporate & Institutional Banking – Segment A and is responsible for overseeing and growing the overall Corporate and Institutional Banking Assets and Liabilities in Segment A. He holds a Bachelor of Science Honours in Actuarial Science and is a Chartered Financial Analyst (CFA). He has a rich professional experience of 11+ years in the Banking Sector during which he has held various strategic positions, from heading Business Development functions to Domestic Corporates and Customer Relationship Management.
037ANNUAL REPORT 2018
SBM BANK (MAURITIUS) LTD

CORPORATE GOVERNANCE REPORT (CONT’D)
Amrit GayanHead of Operations Management
Mr. Amrit Gayan is currently the Head of Operations Management at SBM Bank (Mauritius) Ltd. Prior to heading the Operations Management Team at the Bank, he held other important positions namely Head of Strategic Innovation and Head of the Program Management Office for the Banking Transformation Program. He has over 17 years of experience working for high-profile companies in the areas of Customer Service, IT and Informatics, Consultancy, Business Development & Quality Management at Senior level and has worked in various countries in the region (Mauritius, Reunion and Seychelles) as well as in the Middle East (Dubai, Qatar and Saudi Arabia). Prior to joining SBM Group, he was Project Manager for Banque des Mascareignes - Groupe BPCE. Mr. Gayan has a Postgraduate Diploma in Computers and Information Networks from the University of Essex, UK and a BEng in Telecommunications, Electronic Engineering from the same University.
Mr. Amrit Gayan is also a Director on the Board of SBM 3S Ltd.
Vimal TezooActing Head of Financial Markets
Vimal has more than 10 years’ experience in derivatives trading and structuring. He was formerly a Managing Director and the Global Head of Credit Derivatives Trading at Commerzbank. He has significant international exposure, having lived and worked in London, Dubai and Singapore for several years. He was a laureate on Science Side from Royal College Curepipe for the year 2001 and holds a BSc in Actuarial Science from City University (Cass Business School), London and is a CFA Charter holder.
Members of Executive Forum / Senior Management
038 ANNUAL REPORT 2018
SBM BANK (MAURITIUS) LTD

Other Key Members of Management
Mr. Shailendre BheekaActing Head of Risk Management
Mr. Jude Thierry CoretHead of Marketing and Communications
Mrs. Ragini GowrisunkurHead of Custody
Mrs. Rita Devi GujadhurHead of Performance Management
Mr. Ravi GunessOfficer In Charge, Recovery, Work Out and Collection Units
Mr. Ratan JankeeHead of SME
Mr. Balkrishna JhurryHead of Financial Institution
Mr. Dipesh Pockraj JhowryHead of Legal And Corporate Affairs
Ms Anita Deorani KhelawonTeam Leader Finance
Mr. Veeren ManikionHead of E-Business
Mr. Nandrajen MooneesawmyHead of Credit Administration
Mr. Vikash PeerunHead of Anti-Fraud
Mr Percy PhillipsActing Head of Retail Banking
Mr. Neelesh Sharma SawokyHead of Internal Audit
039ANNUAL REPORT 2018
SBM BANK (MAURITIUS) LTD
CORPORATE GOVERNANCE REPORT (CONT’D)
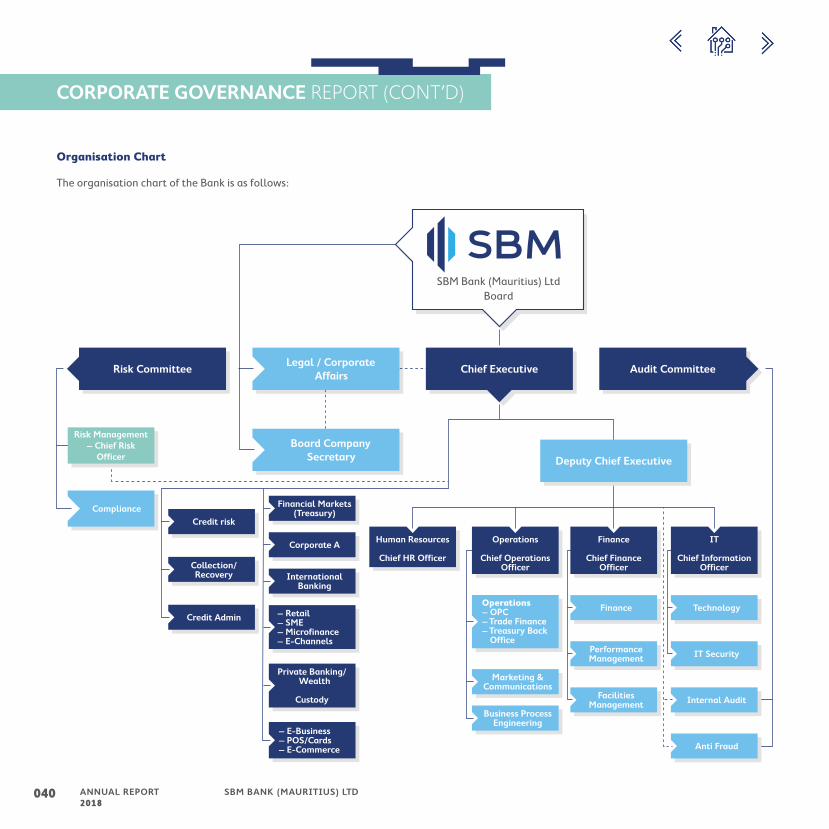
Organisation Chart
The organisation chart of the Bank is as follows:
Credit risk
Credit risk
Credit risk
Credit risk
Credit risk
Credit risk
Credit risk
Credit risk
Credit risk
Compliance
SBM Bank (Mauritius) Ltd Board
Credit risk
Financial Markets (Treasury)
Corporate A
International Banking
Credit riskMarketing &
Communications
Credit riskFinance Credit riskTechnology
Credit riskIT Security
Credit riskInternal Audit
Credit riskAnti Fraud
Credit riskPerformance Management
Credit riskFacilities
Management
Credit riskBusiness Process
Engineering
– Retail – SME – Microfinance
– E-Channels
– E-Business – POS/Cards
– E-Commerce
Private Banking/Wealth
Custody
Collection/ Recovery
Credit Admin
Compliance
Risk Management– Chief Risk
Officer
Risk CommitteeLegal / Corporate
Affairs
Deputy Chief Executive
Chief Executive Audit Committee
Board Company Secretary
Human Resources
Chief HR Officer
Operations
Chief Operations Officer
Finance
Chief Finance Officer
IT
Chief Information Officer
Operations– OPC– Trade Finance– Treasury Back Office
040 ANNUAL REPORT 2018
SBM BANK (MAURITIUS) LTD

Principle Two – The Structure of the Board and its Committees
The Board should contain independently minded directors. It should include an appropriate combination of executive directors, independent directors and non-independent non-executive directors to prevent one individual or a small group of individuals from dominating the Board’s decision taking. The Board should be of a size and level of diversity commensurate with the sophistication and scale of the organisation. Appropriate Board committees may be set up to assist the Board in the effective performance of its duties.
The Board comprises 10 members and has an appropriate mix of gender and experience and all directors wholly endorse the belief in diversity which is expressed in the Board Charter and in the Code of Ethics. The Board is a unitary board and is led by Mr. Nayen Koomar Ballah, G.O.S.K. Only Board members attend each Board meeting for the whole duration, with other officers of the Bank, advisors and other subject matter experts attending on invitation for specific board matters. All directors are resident in Mauritius and the use of alternate directors is discouraged.
The frequency of Board meetings is set in a way to ensure timely consideration of key issues while also allowing directors to attend and participate in person. This is made possible by the careful drafting of the annual board calendar that is set out each year by the Chairman of the Board with the assistance of the Company Secretary. In case physical presence of directors is not possible, they are allowed to participate in the deliberations via audio conference.
The Chairman of the Board and the Chairmen of the Board committees are all carefully selected for their relevant knowledge and experience.
As per the Bank's Constitution, the number of Directors shall not be less than 7 and not more than 11. The Board comprise 10 members out of which 6 are independent and 2 are non-executive directors, which is in accordance with Bank of Mauritius corporate governance guidelines. The role of the Chairperson is distinct and separate from that of the Chief Executive and there is a clear division of responsibilities with the
Chairperson leading the Board and the Chief Executive managing the Bank’s business on a day-to-day basis. The Board ensures that external obligations of non-executive directors do not hinder the discharge of their duties and responsibilities.
The Board assesses its Charter on an annual basis.
Gender balance on the board
Mrs Veronique Lim Hoye Yee was appointed as a Director in February 2018 which demonstrates the Bank’s commitment to bring gender balance on the Board.
Independence
Independent non-executive 6Executive 2Non-executive 2Total 10
The Profiles of the Board members are found on pages 12 to 15 of this annual report.
041ANNUAL REPORT 2018
SBM BANK (MAURITIUS) LTD

CORPORATE GOVERNANCE REPORT (CONT’D)
Company Secretary
The critical role that the Company Secretary plays in ensuring the success of the Board is wholly acknowledged. The Company Secretary is appointed by the Board in accordance with its Constitution.
Ms Preshnee Ramchurn has been appointed by the Board as Company Secretary for SBM Bank (Mauritius) Ltd. Mrs Manuela Permal, who was also the Bank’s Company Secretary, resigned in October 2018.
Profile of Company Secretary:
Ms Preshnee Ramchurn
Ms Preshnee Ramchurn is an Associate of the Institute of Chartered Secretaries and Administrators (UK) and was appointed as Company Secretary of SBM Bank (Mauritius) Ltd in March 2017. She has good experience in corporate governance and company secretarial practice and prior experience in risk management and compliance from her time in one of the Big 4 accounting firms.
042 ANNUAL REPORT 2018
SBM BANK (MAURITIUS) LTD

Attendance at Board Meetings and Committee Meetings
All directors are committed to attending Board meetings and Committee meetings on which they serve. Below is a record of all Board and Committee meetings held in 2018:
SBM Bank (Mauritius) Ltd Bo
ard
M
eeti
ng
s
Au
dit
C
om
mit
tee
Bo
ard
Cre
dit
C
om
mit
tee
Co
rpo
rate
G
ove
rna
nce
&
Co
nd
uct
Rev
iew
C
om
mit
tee
Fin
an
ce
Co
mm
itte
e
Pro
cure
men
t
Co
mm
itte
e
Rem
un
era
tio
n &
N
om
ina
tio
n
Co
mm
itte
e
Ris
k
Ma
na
gem
ent
C
om
mit
tee
Str
ate
gy
C
om
mit
tee
No. of Meetings held during year ended 31 Dec 2018
21 12 51 4 9 6 14 5 4
Directors
Non-ExecutiveNayen Koomar BALLAH (Chairman) 21 - - 3 - - 13 2 4Visvanaden SOONDRAM 1 - - - - - - - -
Independent
Philip AH-CHUEN 15 12 - 4 6 - 9 - 2Mahmadally BURKUTOOLA 19 - 51 3 9 6 13 3 4Rajakrishna CHELLAPERMAL 20 - 51 4 8 6 - 5 4Rishikesh HURDOYAL 20 - 51 4 9 6 - 5 -Anoopum Ishwar GAYA 19 12 - - 7 6 14 4 -Abdool Karrim NAMDARKHAN 6 - - - - - - - -Michel MOOTHOOSAMY 18 12 - - 9 - 13 - -
Executive Raj DUSSOYE 12 - - 3 5 4 9 4 3Veronique LIM HOYE YEE 16 - - - - - - - 3Venkateswara Rao PARVATANENI (PV RAO) 6 - - - - - - - -
In attendanceNayen Koomar BALLAH - - - - - - - - -Mahmadally BURKUTOOLA - 1 - - - - - - -Rajakrishna CHELLAPERMAL - 2 - - - - 6 - -Raj DUSSOYE - 8 31 - - - - - -Anoopum Ishwar GAYA - - - - - - - - 3Rishikesh HURDOYAL - 4 - - - - 4 - 1Michel MOOTHOOSAMY - - - - - - - - 3Veronique LIM HOYE YEE - 2 40 4 8 1 4 3 1Venkateswara Rao PARVATANENI (PV RAO) 3 2 8 1 2 1 4 1 1Abdool Karrim NAMDARKHAN - - - - 1 - 1 - 1
Note:1. Mr Raj Dussoye ceased to be a Member of the Board/Committees on 16.08.20182. Mrs Veronique Lim Hoye Yee was appointed as Board Member on 22.02.20183. Mr Venkateswara Rao Parvataneni was appointed as Board Member on 12.10.2018.4. Mr Abdool Karrim Namdarkhan was appointed as Board Member on 12.10.20185. Mr Visvanaden Soondram was appointed as Board Member on 19.11.20186. Mr Mahmadally Burkutoola ceased to be Member of Board/Committees on 28.02.2019.
043ANNUAL REPORT 2018
SBM BANK (MAURITIUS) LTD

CORPORATE GOVERNANCE REPORT (CONT’D)
During the year under review, Board meetings were held at least on a quarterly basis. In addition to regular Board and Committee meetings, the Board also took time to discuss the strategy of the Bank on areas including:
1. Key risks facing the Bank and mitigation factors;
2. Overarching strategy and objectives for the upcoming year;
3. Strategy of each division within the Bank;
4. New ventures for the upcoming year; and
5. Key Corporate Governance initiatives.
Board Committees
Board committees have been established in order to assist the Board in its mandate and to enhance its efficiency. The Board has established the following committees to assist it in the discharge of its responsibilities:
1. Audit Committee
2. Board Credit Committee
3. Corporate Governance and Conduct Review Committee
4. Finance Committee
5. Procurement Committee
6. Remuneration & Nomination Committee
7. Risk Management Committee
8. Strategy Committee
Each Board committee has its own terms of reference, approved by the Board and reviewed on an annual / regular basis.
044 ANNUAL REPORT 2018
SBM BANK (MAURITIUS) LTD

The Board Sub-Committees of SBM Bank (Mauritius) Ltd comprises the following Members:
AUDIT COMMITTEE
BOARD CREDIT COMMITTEE
CORPORATE GOVERNANCE & CONDUCT REVIEW COMMITTEE
FINANCE COMMITTEE
Mr Anoopum GAYA Chairman
Mr Rajakrishna CHELLAPERMAL Chairman
Mr Philip AH-CHUEN Chairman
Mr Michel MOOTHOOSAMY Chairman
Mr Philip AH-CHUEN Mr Rishikesh HURDOYAL Mr Nayen Koomar BALLAH
Mr Michel MOOTHOOSAMY Mr Abdool Karrim NAMDARKHAN Mr Rajakrishna CHELLAPERMAL Mr Philip AH-CHUEN
Mr Rishikesh HURDOYAL Mr Rajakrishna CHELLAPERMAL
Mr Visvanaden SOONDRAM Mr Anoopum GAYA
Mr PV RAO Mr Rishikesh HURDOYAL
Mr PV RAO
PROCUREMENT COMMITTEEREMUNERATION & NOMINATION COMMITTEE
RISK MANAGEMENT COMMITTEE STRATEGY COMMITTEE
Mr Rishikesh HURDOYAL Chairman
Mr Nayen Koomar BALLAH Chairman
Mr Abdool Karrim NAMDARKHAN Chairman
Mr Nayen Koomar BALLAH Chairman
Mr Anoopum GAYA Mr Philip AH-CHUEN Mr Nayen Koomar BALLAH Mr Philip AH-CHUEN
Mr Rajakrishna CHELLAPERMAL Mr Michel MOOTHOOSAMY Mr Anoopum GAYA Mr Rajakrishna CHELLAPERMAL
Mr Abdool Karrim NAMDARKHAN Mr Anoopum GAYA Mr Rishikesh HURDOYAL Mr Michel MOOTHOOSAMY
Mr PV RAO Mr PV RAO Mr Visvanaden SOONDRAM Mr Visvanaden SOONDRAM
Mr PV RAO Mrs Veronique LIM HOYE YEE
Mr PV RAO
045ANNUAL REPORT 2018
SBM BANK (MAURITIUS) LTD

CORPORATE GOVERNANCE REPORT (CONT’D)
Audit Committee
Members Category
Mr Anoopum Ishwar GAYA (Chairman)
Independent Non-Executive Director
Mr Philip AH-CHUEN Independent Non-Executive Director
Mr Michel Arnaud MOOTHOOSAMY
Independent Non-Executive Director
Role and Responsibilities
The Audit Committee consists of 3 independent non-executive directors. The main responsibilities of the Committee include the following:
> Critically review and examine the quality and integrity of quarterly results and audited financial statements of the Bank prior to submission and approval of the Board;
> Consider the appropriateness of the accounting policies applied and whether they are prudent and consistent with prior practice and comply with regulations and legal requirements;
> Review critical accounting issues and ensure capital adequacy and internal control;
> Review adequacy of provisions including provision for credit impairment losses;
> Discuss with the senior management and the external auditors the overall results of the audit, the quality of financial statements and any concerns raised by the external auditors;
> Make recommendations to the Board for the appointment, re-appointment and retention of external auditors;
> Review the objectives of the internal audit function and Anti-Fraud division along with their respective annual plan of action; and
> Review the systems of internal controls to ascertain its adequacy and effectiveness.
Board Credit Committee
Members Category
Mr Rajakrishna CHELLAPERMAL (Chairman)*
Independent Non-Executive Director
Mr Rishikesh HURDOYAL Independent Non-Executive Director
Mr Abdool Karrim NAMDARKHAN
Independent Non-Executive Director
* Mr Mahmadally Burkutoola chaired the Board Credit Committee till 27.02.2019.
Role and Responsibilities
The Board Credit Committee consists of 3 members. All members of the Committee are independent non-executive directors. The main responsibilities of the Committee include the following:
> Ensure that the Bank’s Credit Risk Policy & Procedures are implemented and applied consistently across all business units;
> Review and approve appropriate counterparty exposure limits across all lines of business;
> Review and approve all facilities exceeding the delegated authority of the Bank’s Management Credit Forums as set out in the Bank’s Credit Policy;
> Review and approve the restructure/rescheduling of credit facilities in accordance with the Bank’s Credit Policy;
> Review Non-Performing Accounts and ensure adequacy of provisioning as per Regulatory norms; and
> Ensure that concentrations of risks are within the risk tolerance of the Bank.
046 ANNUAL REPORT 2018
SBM BANK (MAURITIUS) LTD
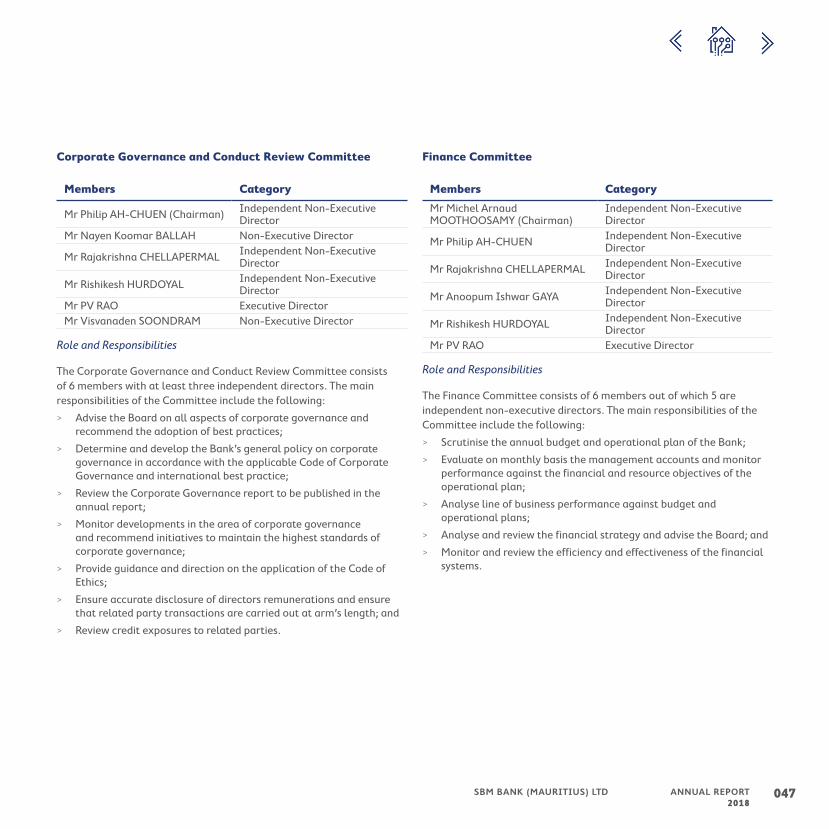
Corporate Governance and Conduct Review Committee
Members Category
Mr Philip AH-CHUEN (Chairman) Independent Non-Executive Director
Mr Nayen Koomar BALLAH Non-Executive Director
Mr Rajakrishna CHELLAPERMAL Independent Non-Executive Director
Mr Rishikesh HURDOYAL Independent Non-Executive Director
Mr PV RAO Executive DirectorMr Visvanaden SOONDRAM Non-Executive Director
Role and Responsibilities
The Corporate Governance and Conduct Review Committee consists of 6 members with at least three independent directors. The main responsibilities of the Committee include the following:
> Advise the Board on all aspects of corporate governance and recommend the adoption of best practices;
> Determine and develop the Bank’s general policy on corporate governance in accordance with the applicable Code of Corporate Governance and international best practice;
> Review the Corporate Governance report to be published in the annual report;
> Monitor developments in the area of corporate governance and recommend initiatives to maintain the highest standards of corporate governance;
> Provide guidance and direction on the application of the Code of Ethics;
> Ensure accurate disclosure of directors remunerations and ensure that related party transactions are carried out at arm’s length; and
> Review credit exposures to related parties.
Finance Committee
Members Category
Mr Michel Arnaud MOOTHOOSAMY (Chairman)
Independent Non-Executive Director
Mr Philip AH-CHUEN Independent Non-Executive Director
Mr Rajakrishna CHELLAPERMAL Independent Non-Executive Director
Mr Anoopum Ishwar GAYA Independent Non-Executive Director
Mr Rishikesh HURDOYAL Independent Non-Executive Director
Mr PV RAO Executive Director
Role and Responsibilities
The Finance Committee consists of 6 members out of which 5 are independent non-executive directors. The main responsibilities of the Committee include the following:
> Scrutinise the annual budget and operational plan of the Bank;
> Evaluate on monthly basis the management accounts and monitor performance against the financial and resource objectives of the operational plan;
> Analyse line of business performance against budget and operational plans;
> Analyse and review the financial strategy and advise the Board; and
> Monitor and review the efficiency and effectiveness of the financial systems.
047ANNUAL REPORT 2018
SBM BANK (MAURITIUS) LTD

CORPORATE GOVERNANCE REPORT (CONT’D)
Procurement Committee
Members Category
Mr Rishikesh HURDOYAL(Chairman)
Independent Non-Executive Director
Mr Rajakrishna CHELLAPERMAL Independent Non-Executive Director
Mr Anoopum Ishwar GAYA Independent Non-Executive Director
Mr Abdool Karrim NAMDARKHAN
Independent Non-Executive Director
Mr PV RAO Executive Director
Role and Responsibilities
The Procurement Committee consists of 5 members out of which 4 are independent non-executive directors. The main responsibilities of the Committee include the following:
> Ensure that the Bank’s expenditure is appropriate in the pursuit of the Bank’s operations;
> Review the Procurement Policy and procedures of the Bank;
> Approve revenue and capital expenditures under delegated authority;
> Review and make appropriate recommendations to the Board as regards major procurement contracts and expenditure exceeding its approving authority;
> Review the expenses approved by the management Executive Forum and Chief Executive of the Bank; and
> Evaluate and make recommendation to the Board on any acquisition or disposal and/or any undertaking or part of any undertaking of the Bank.
Remuneration & Nomination Committee
Members Category
Mr Nayen Koomar BALLAH (Chairman) Non-Executive Director
Mr Philip AH-CHUEN Independent Non-Executive Director
Mr Anoopum Ishwar GAYA Independent Non-Executive Director
Mr Michel Arnaud MOOTHOOSAMY
Independent Non-Executive Director
Mr PV RAO Executive Director
Role and Responsibilities
The Remuneration & Nomination Committee consists of 5 members out of which 4 are non-executive directors. The main responsibilities of the Committee include the following:
> Review on annual periodic basis the HR related policies of the Bank;
> Review and recommend performance based remuneration for staff members including senior management, against objectives and key performance indicators;
> Identify qualified candidates for Board membership and position of chairperson of the Board, its committees and their members;
> Recommend recruitment and/or promotion of senior officers and above, and recommend their remuneration, benefits and other terms and conditions of employment;
> Review and recommend salary revisions and service conditions of employees; and
> Determine the total remuneration package of executive directors of the Bank and level of Board fees for directors, for recommendation to Board and shareholders, where applicable.
048 ANNUAL REPORT 2018
SBM BANK (MAURITIUS) LTD

Risk Management Committee
Members Category
Mr Abdool KARRIM NAMDARKHAN (Chairman)
Independent Non-Executive Director
Mr Nayen Koomar BALLAH Non-Executive Director
Mr Anoopum Ishwar GAYA Independent Non-Executive Director
Mr Rishikesh HURDOYAL Independent Non-Executive Director
Mr PV RAO Executive DirectorMr Visvanaden SOONDRAM Non-Executive Director
Role and Responsibilities
The Risk Management Committee consists of 6 members with at least 3 independent non-executive directors. The Chief Executive is also a member of the Committee. The main responsibilities of the Committee include the following:
> Ensure that the Bank has a solid and effective risk management infrastructure in place;
> Adopt the risk appetite for the Bank, as recommended to and approved by the Board;
> Establish and review the adequacy of risk management control techniques and methodologies and monitor their effectiveness;
> Monitor the Bank’s risk profile – its on-going and potential exposure to risks of various types;
> Review the Bank’s risk profile particularly the risk trends, risk concentrations and key performance indicators;
> Review Bank policies for management of risks particularly in areas of credit, market, interest rate, liquidity, operational and technological risks; and
> Monitor material litigation involving the Bank.
Strategy Committee
Members Category
Mr Nayen Koomar BALLAH (Chairman) Non-Executive Director
Mr Philip AH-CHUEN Independent Non-Executive Director
Mr Rajakrishna CHELLAPERMAL Independent Non-Executive Director
Mr Michel Arnaud MOOTHOOSAMY
Independent Non-Executive Director
Mr Visvanaden SOONDRAM Non-Executive DirectorMrs Veronique LIM HOYE YEE Executive DirectorMr PV RAO Executive Director
Role and Responsibilities
The Strategy Committee consists of 7 members with a majority of non-executive directors. The main responsibilities of the Committee include the following:
> Review and recommend the strategic plans, business plans, annual or quarterly corporate objectives and budgets;
> Review effectiveness of the Bank’s strategies;
> Review performance against set KPIs and targets;
> Review issues of fundamental importance and proposals from management related to Bank’s long term objectives and goals; and
> Consider and review the type of organisational structures and functions necessary for implementing strategic plans.
The terms of reference for the above committees are available on the website www.sbmgroup.mu.
049ANNUAL REPORT 2018
SBM BANK (MAURITIUS) LTD

CORPORATE GOVERNANCE REPORT (CONT’D)
Principle Three – Directors Appointment Procedures
There should be a formal, rigorous and transparent process for the appointment, election, induction and re-election of directors. The search for Board candidates should be conducted, and appointments made, on merit, against objective criteria (to include skills, knowledge, experience, and independence and with due regard to the benefits of diversity on the Board, including gender). The Board should ensure that a formal, rigorous and transparent procedure be in place for planning the succession of all key officeholders.
Appointment
The Board has established a Remuneration & Nomination Committee which is responsible, amongst others, for reviewing the structure, size and composition of the Board along with identifying eligible candidates for directorship on the Board of the Bank. When considering an appointment to the board, the Remuneration & Nomination Committee shall satisfy itself that the candidate is able to commit sufficient time and effort to fulfil its responsibilities effectively.
As part of its mandate, the Board, besides the candidate’s experience, availability and satisfying the fit and proper person criteria set by the Bank’s regulators, also take into account the following factors when appointing directors:
> Skills, knowledge and expertise required on the Board;
> Directorship and commitment to the Bank to ensure that the directors will have sufficient time to discharge their responsibilities /obligation.
> Specific roles required on the Board such as chairing a committee;
> Balance required on the Board such as gender and age;
> Independence where required;
> Reputation of the candidate; and
> Conflicts of interests.
A transparent procedure is in place for appointment of directors. The Remuneration & Nomination Committee will assess and make recommendations to the Board. Director appointments are then considered as hereunder depending on the timing of the appointment:
i. Either the Board will agree on each appointment and will put forward the prospective director’s appointment to the shareholders at the Annual Meeting by way of ordinary resolution for approval.
ii. Or the Board may appoint a director out of the normal cycle in accordance with the Bank’s Constitution provided the total number of directors does not, at any time, exceed eleven. Any Director so appointed shall hold office only until the next following Annual Meeting, and shall be eligible for re-election.
Once a prospective non-executive director is appointed, he/she is provided with a letter of appointment which carefully outlines the following:
1. Term of office as per the requirements of the Banking Act;
2. Time commitment expected from each director;
3. Confidentiality;
4. Conflicts of Interests;
5. Directors liability insurance;
6. Right to independent advice;
7. Induction program;
8. Training and development program; and
9. Board policies & procedures.
As per the constitution of SBM Bank (Mauritius) Ltd, each non-executive director is elected/re-elected by a separate resolution at the Annual Meeting of Shareholders. The executive directors, including the Chief Executive hold their directorship as long as they hold their office as Executives of the Bank.
050 ANNUAL REPORT 2018
SBM BANK (MAURITIUS) LTD

Succession planning
The Board considers succession planning very carefully. The Remuneration & Nomination Committee proactively reviews the succession requirements for the Board and carries out the due diligence process to determine the suitability of every person who is considered for appointment or re-appointment as a Director of the Board based on his educational qualification, experience and track record. The proposed candidate is evaluated by Remuneration & Nomination Committee to determine the eligibility and fit and proper criteria and thereafter is recommended to the Board for its consideration and approval.
At time of resignation or retirement of directors, the Board ensures that a candidate with sufficient skills and experience is identified in a timely manner to ensure that the board’s and/or board sub-committee’s competence and balance are either maintained or enhanced, taking into account the Bank’s current and future needs.
Succession Plan for the senior management team is based on the input received from the Head of Human Resource and the CE. The Remuneration & Nomination Committee periodically reviews any vacancy or probable vacancy in the position of senior management team which may typically arise on account of retirement or resignation. The Board strives to fill such vacancy at the earliest and as a temporary measure, same could be done from within internal modes through elevation or lateral movement. In case no suitable candidate is available to fill the position, the vacant positions are advertised both internally and externally. The Remuneration & Nomination Committee evaluates the suitability of any such person for management positions
based on factors such as experience, age and leadership intelligence and recommends his appointment to the Board for approval.
The Board may also have recourse to the services of consultants where it is felt specific skills or experience is required. The prevailing HR standards for promotions and/or transfers are designed to ensure that the existing or proposed senior managerial personnel benefit from wide cross-function exposure thereby facilitating career progression and succession planning.
Induction
Upon being appointed, the Board ensures that all new directors attend a tailored induction programme to enable them to discharge their duties effectively and to be acquainted with the vision, business, strategy direction, financial matters, value, code of ethics and conduct, as well as best Corporate Governance practices and other key policies and practices of the Bank. The SBM Academy, in collaboration with the Company Secretary, maintains a training and development log for directors which can be built upon for further growth and training opportunities. The Board has delegated the responsibility to review the professional development and ongoing education of directors to the CE.
The Board ensures that proper guidance is provided to all directors in terms of their roles and responsibilities. All directors have access to the Company Secretary and to the Senior Management to discuss issues or to obtain information on specific areas or items to be considered at the Board meeting and/or Committees or any other areas they consider appropriate.
051ANNUAL REPORT 2018
SBM BANK (MAURITIUS) LTD

CORPORATE GOVERNANCE REPORT (CONT’D)
Principle Four – Directors Duties, Remuneration and Performance
Directors should be aware of their legal duties. Directors should observe and foster high ethical standards and a strong ethical culture in their organisation. Conflicts of interest should be disclosed and managed. The Board is responsible for the governance of the organisation’s information, information technology and information security. The Board, committees and individual directors should be supplied with information in a timely manner and in an appropriate form and quality in order to perform to required standards. The Board, committees and individual directors should have their performance evaluated and be held accountable to appropriate stakeholders. The Board should be transparent, fair and consistent in determining the remuneration policy for directors and senior executives.
Legal Duties
All Directors appointed on the Board are fully appraised of their fiduciary duties as laid out in the Companies Act both at the time of their induction and through ongoing director development training.
Code of Ethics
A Code of Ethics and Business Conduct, which has been drafted under the guidance of the Board and in consultation with staff members within different departments, is in place. Both directors and staff are required to execute a copy of this Code. They are made aware of this Code and the consequences of non-compliance during induction and/or through periodic training sessions.
The Code of Ethics and Business Conduct, approved by the Board, is available on the SBM Group’s website.
Continuous Development Programme
The Board recognizes the importance of and are committed to high standards of corporate governance.
Whilst the induction process is designed to assist new Board Members, a comprehensive training plan has also been devised in collaboration with
renowned International Institutes and the SBM Academy to ensure that Board members fulfil their key roles regarding strategic development. The plan has been defined with relevant topics for developing and updating the directors’ knowledge and capabilities with focus on Strategy, Risk, Credit and Governance.
In the process of continuous learning and professional development, the Company Secretary / Corporate Affairs Team attended regular trainings to provide guidance to Board Directors on Governance, Compliance and Fiduciary responsibilities.
During the financial year 2018, directors attended various training workshops. The following topics were covered during the workshops:
> Effective Board Committees
> The changing standards and benchmarks
> Challenges of the following committees (Audit Committee, Risk Committee, Nomination & Remuneration and Governance Committee)
> Compliance, Fraud & Whistleblowing
> Liability, Delegations and General powers of committees and their members
> The relationship with other committees across the organization
> Evaluation & succession Techniques & Issues
052 ANNUAL REPORT 2018
SBM BANK (MAURITIUS) LTD

> Records & reporting by committees
> Derivatives & Risk Associated with derivatives
> Project Risk: Operational & Financial Risks
> Primary Risks as well as mechanisms for structuring risks including hedging mechanisms and hedging instruments
> Sensitivity Analysis and Scenario Analysis
> Cross-border issues in Project financing
> Collateral / guarantee and enforceability
> Implications of Basel Accord
> Insight into the latest tools and techniques to measure, manage and monitor credit risk
> Classification, measurement and disclosure of financial instruments in terms of IFRS 9 and IFRS 7
Board Evaluation
The Directors recognise the need to evaluate the performance and effectiveness of the Board, its committees, individual directors and its policies and procedures. A self-evaluation questionnaire has been designed for the Bank to evaluate the performance of the Board, Board Committees and individual directors for financial year 2018. The findings of all evaluation exercises are presented at the Board and relevant Board Sub-Committee meetings and any recommendations / areas of improvement arising therefrom are duly considered and implemented.
It is worth mentioning that, in line with the requirements of the Code of Corporate Governance of Mauritius, an independent evaluator, namely Reverend K. Andersen, was appointed in early 2018 to carry out the Board Evaluation for financial year 2017.The main findings and recommendations were as hereunder:
> Succession planning of all key positions in the bank should be carefully monitored as a key risk;
> Retention of key staff should be a key focus area for the coming year;
> Attendance of all directors at all board meetings;
> Creating further synergies between the bank and the holding company; and
> Deepening and enhancing a positive risk culture.
The independent evaluation process was comprised of:
1. The Consultant reviewing all relevant board documentation;
2. Each Director completing a comprehensive questionnaire;
3. A one on one interview with each Board member and the Evaluator; and
4. A final report of findings plus recommendations.
The findings and recommendations of the independent evaluator are being addressed and implemented.
Conflicts of Interests and Related Party Transactions
SBM, as a Public Interest Entity, encourages all Directors to declare their interests and to report to the Chairman and the Company Secretary any related party transactions. A register of directors’ interests is kept at the Registered Office by the Company Secretary, which is updated on a regular basis and available to the shareholder of the Bank upon written request to the Company Secretary.
The Bank ensures that disclosure of actual and potential conflicts are made in accordance with the Conflict of Interests policy and Related Party Transactions policy thereby avoiding conflicts of interest where necessary. The Bank has in place a Conflict of Interests policy and Related Party Transactions policy which has been drafted in line with the guidelines of Bank of Mauritius and approved by the Board. Due to sensitive information therein, same has not been published on the SBM Group’s website.
Remuneration
The Bank ensures that both directors and senior management team are rewarded based on their performance and effort towards contributing to the development of the Bank’s strategy.
053ANNUAL REPORT 2018
SBM BANK (MAURITIUS) LTD
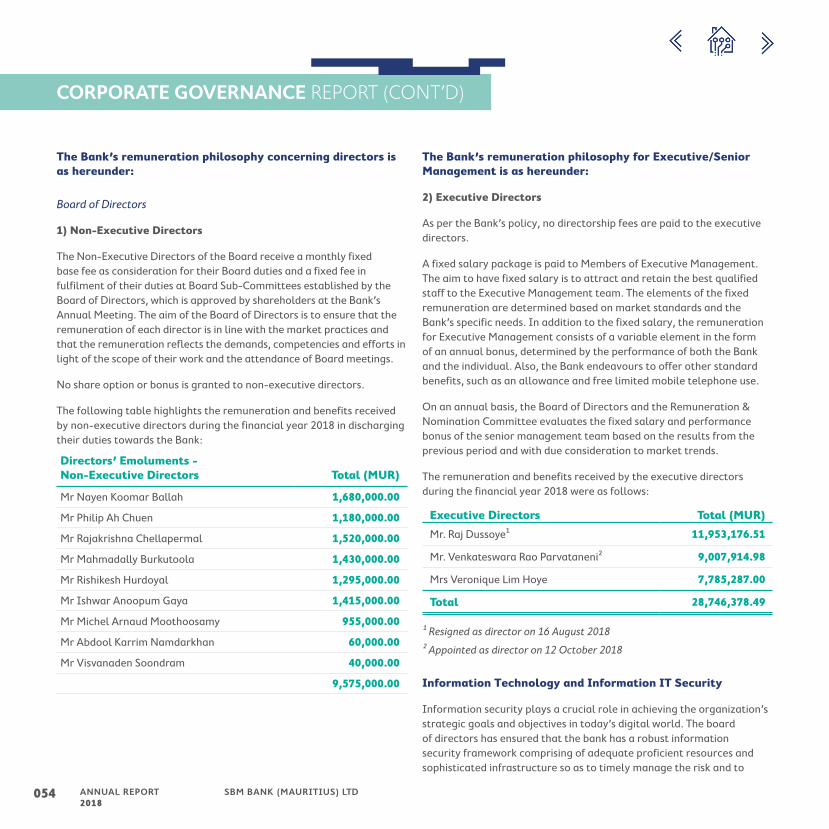
CORPORATE GOVERNANCE REPORT (CONT’D)
The Bank’s remuneration philosophy concerning directors is as hereunder:
Board of Directors
1) Non-Executive Directors
The Non-Executive Directors of the Board receive a monthly fixed base fee as consideration for their Board duties and a fixed fee in fulfilment of their duties at Board Sub-Committees established by the Board of Directors, which is approved by shareholders at the Bank’s Annual Meeting. The aim of the Board of Directors is to ensure that the remuneration of each director is in line with the market practices and that the remuneration reflects the demands, competencies and efforts in light of the scope of their work and the attendance of Board meetings.
No share option or bonus is granted to non-executive directors.
The following table highlights the remuneration and benefits received by non-executive directors during the financial year 2018 in discharging their duties towards the Bank:
Directors’ Emoluments - Non-Executive Directors Total (MUR)
Mr Nayen Koomar Ballah 1,680,000.00
Mr Philip Ah Chuen 1,180,000.00
Mr Rajakrishna Chellapermal 1,520,000.00
Mr Mahmadally Burkutoola 1,430,000.00
Mr Rishikesh Hurdoyal 1,295,000.00
Mr Ishwar Anoopum Gaya 1,415,000.00
Mr Michel Arnaud Moothoosamy 955,000.00
Mr Abdool Karrim Namdarkhan 60,000.00
Mr Visvanaden Soondram 40,000.00
9,575,000.00
The Bank’s remuneration philosophy for Executive/Senior Management is as hereunder:
2) Executive Directors
As per the Bank’s policy, no directorship fees are paid to the executive directors.
A fixed salary package is paid to Members of Executive Management. The aim to have fixed salary is to attract and retain the best qualified staff to the Executive Management team. The elements of the fixed remuneration are determined based on market standards and the Bank’s specific needs. In addition to the fixed salary, the remuneration for Executive Management consists of a variable element in the form of an annual bonus, determined by the performance of both the Bank and the individual. Also, the Bank endeavours to offer other standard benefits, such as an allowance and free limited mobile telephone use.
On an annual basis, the Board of Directors and the Remuneration & Nomination Committee evaluates the fixed salary and performance bonus of the senior management team based on the results from the previous period and with due consideration to market trends.
The remuneration and benefits received by the executive directors during the financial year 2018 were as follows:
Executive Directors Total (MUR)
Mr. Raj Dussoye¹ 11,953,176.51
Mr. Venkateswara Rao Parvataneni² 9,007,914.98
Mrs Veronique Lim Hoye 7,785,287.00
Total 28,746,378.49
¹ Resigned as director on 16 August 2018
² Appointed as director on 12 October 2018
Information Technology and Information IT Security
Information security plays a crucial role in achieving the organization’s strategic goals and objectives in today’s digital world. The board of directors has ensured that the bank has a robust information security framework comprising of adequate proficient resources and sophisticated infrastructure so as to timely manage the risk and to
054 ANNUAL REPORT 2018
SBM BANK (MAURITIUS) LTD

ensure business continuity. A risk register is also maintained by the risk management team to continuously identify, assess, monitor, mitigate and report a risk. The bank continuously maintains its security systems updated to remain at bay of malicious attacks. Moreover, the bank’s Information Security policy and Information Technology risk policy are reviewed annually by the board. The board ensures that the policies are updated to take account of new regulatory guidelines and best practices and assures that the bank users are always compliant with the policies.
The SBM Group has established an IT Committee, comprised of directors of SBM Holdings Ltd and of the Bank with primary responsibilities to identify IT project priorities, provide strategic planning, direction and to approve major IT projects of the operating entities within the group. The IT Committee regularly monitors and evaluates the Bank’s and Group’s significant expenditures on information technology, thereby ensuring that IT strategic plans are delivered within agreed budget and timeframe.
The evolving role of technology and automation in the banking/financial services sector has become increasingly complex as advances in technology are strategically used as leverage to offer innovative products, deliver fast and efficient service at affordable prices, and venture into new markets. Consequently, the Bank moved its Website to a secure Cloud and implemented RPA (Robotic Process Automation) in the Trade Finance function. As these technologies become an integral part of the business and operations, their usage and dependence, if not properly managed, may heighten associated risks.
With a vision to provide the appropriate governance and risk management principles to the Bank, IT Security policies are regularly reviewed and enhanced with respect to applicable international standards (COBIT, NIST, ISO 27000 series, PCI DSS). Processes to enforce these policies are also reviewed and implemented in Mauritius and Madagascar on an ongoing basis. One of the main focus areas was on access rights control and regular review to ensure staff and vendors have the minimum required access to data, commensurate with their job roles and data sensitivity. Access to information is governed by the data classification policy and several IT standards and guidelines – Logical Access Standard, Acceptable Usage Guidelines, Media Handling Standard, Remote Access & Dial-In Standard and others. These policies, standards and guidelines are enforced through processes and procedures.
To enhance information governance, processes have also been reviewed to allow customers to have access to their personal data for rectification and to provide or remove their consent to the use of their contact details for marketing purposes, as required by the Data Protection Act 2017 (DPA). To have a greater reach to SBM customers and foreigners, especially Europeans, our Website has been enhanced with additional content to inform visitors about their rights to have access to, and rectify, their data, among other things, required by DPA and GDPR (General Data Protection Regulation).
As a second line of defense, our IT Security function ensures independent testing of SBM’s IT systems to prevent hacking and resulting operational/reputational losses as well as publishing security awareness material to all staff of the Bank to guard against phishing, password sharing and social engineering.
Finally, our third line of defense is ensured by Internal IT Auditors reporting independently to the Audit Committee. Assurance, on whether IT processes are as per norms and being followed consistently, is provided by the Internal IT audit function.
IT innovation requires financial investment. IT expenditures are governed by budget planning and monitoring as well as well-defined procurement processes involving several thresholds of approval authorities, including a procurement committee, depending on amount. Additionally, the IT Team achieved cost saving through both traditional approaches, such as zero-based budgeting and outsourcing as well as leveraging on innovative technologies.
A copy of an information and security policy is available on the website.
055ANNUAL REPORT 2018
SBM BANK (MAURITIUS) LTD

CORPORATE GOVERNANCE REPORT (CONT’D)
Principle Five – Risk Governance and Internal Control
The Board should be responsible for risk governance and should ensure that the organisation develops and executes a comprehensive and robust system of risk management. The Board should ensure the maintenance of a sound internal control system.
Board
The Board remains ultimately responsible for ensuring that risks are adequately identified, measured, managed and monitored and that good governance is maintained. The board discharges its duty either directly or through its committees to ensure decision making is aligned with the board’s approved policies and frameworks.
Board sub-committees and Executive management
Executive management, together with a number of Board Sub-Committees, manages the business through a system of internal controls functioning throughout the Bank. This promotes an awareness of risk and good governance in every area of the business and instils a culture of compliance. In short, Executive Management is responsible for translating the overall guidance from the Board into operational aspects and then monitoring and reporting back periodically to the Board/Board Committees.
The Risk Management Committee has the responsibility to monitor and evaluate the spectrum of risks faced by the Bank. Further details on the management of risk are given in the Risk Management Report on pages 77-117.
Risk management
The risk management team provides day-to-day oversight on management of risk and promotes the risk culture across the Bank. It is responsible to create and maintain the risk practices across the Bank as defined by the Bank risk policy and to ensure that controls are in place for all risk categories.
The risk management team maintains its objectivity by being independent of operations. The Head of Risk Management has direct
access to the Board Chairman and the Risk Management Committee without impediment.
The risk function is subject to internal audits on an annual basis where it is assessed for each of the different types of risk. Internal audit provides an annual assessment on the adequacy and effectiveness of the Bank’s processes for controlling its activities, managing its risks and ensuring good governance. It reports and provides recommendations on significant issues related to the risk management, control and governance processes within the Bank.
Internal Control
The Risk Management Committee which approves the Bank’s policies, ensures that risks are maintained within approved limits and any deviation is reported timely and duly authorized. The Audit Committee, on the other hand, reviews both internal and external audit reports on systems and controls in place to manage those risks.
The Bank has an integrated and robust risk management framework which aligns strategy, policies, people, process, technology and business intelligence to identify, assess, manage and report risks in a reliable and consistent manner. This risk management framework is premised on the three lines of defence model which ensures that risk is managed in line with the Bank’s risk appetite, as defined by the Board.
The 1st line of defence, i.e., the Business units, is responsible for owning and managing risks through appropriate internal controls. The 2nd line of defence, i.e., Risk Management and Compliance, ensure that the controls are working effectively and limits are adhered to through regular checks. The 3rd line of defence, i.e., Internal Audit, provides independent assurance to Management and the Board on the systems of Internal Controls in place at the Bank.
056 ANNUAL REPORT 2018
SBM BANK (MAURITIUS) LTD

The audit plan for the Bank, which is reviewed by the Audit Committee, covers all key areas of activities, including IT. Through regular audits, the internal control system is evaluated with respect to the risk environment. Any deviation in policies and non-performance of internal control are duly reported and discussed at large at both Management and Audit Committee levels. Corrective actions are promptly taken & regular follow ups as well as reporting performed by Internal Audit until complete resolution.
Whistle-blowing
The Bank has embedded a whistle-blowing policy which sets out the procedures for whistle blowing. The Bank has in place a whistle blowing policy approved by the Board. Due to sensitive information therein, same has not been published on the SBM Group’s website.
057ANNUAL REPORT 2018
SBM BANK (MAURITIUS) LTD

CORPORATE GOVERNANCE REPORT (CONT’D)
Principle Six – Reporting with Integrity
The Board should present a fair, balanced and understandable assessment of the organisation’s financial, environmental, social and governance position, performance and outlook in its annual report.
Financial
The directors are responsible for the preparation of the financial statements in accordance with International Financial Reporting Standards, International Accounting Standards and Companies Act 2001. The Directors must ensure that the provisions of the Companies Act 2001, the Banking Act 2004 and Financial Reporting Act 2004 are complied with. They must also ensure that the financial statements are free from errors and material misstatements.
The financial review is set out on pages 19 to 27 of the Annual Report. The Annual Report is published in full on the Bank’s website.
Human Resources Report
We seek to be an Employer of Choice and to support the creation of an organization culture which promotes work ethics, equity, commitment, responsibility, personal growth and passion for excellence and high performance.
A robust HR strategy supported by a robust HR function, is therefore, critical to deliver this goal. A well-structured HR function with the solid foundation of mutual trust, teamwork, collaboration, professionalism,
responsibility for self and others coupled with passion to serve. A review of the existing HR model has started, the new structure will provide for expertise in core areas such as organizational development and change management, talent management, strategic remuneration management while also ensuring that we have sound basics in place when it comes to Industrial Relations, HR policies, processes and procedures and HR administration. We will source external expertise to complement our existing pool of dedicated HR team for whom we will explore opportunities for development and growth through proper training and coaching.
Our Talent Pool
In an attempt to position SBM as an “Employer of Choice”, the Bank provides a balanced approach to talent acquisition. It relies both on leveraging the skills and experience already available within the organization, and bringing in the necessary capabilities that will deliver the long term objectives.
Our aim going forward is to create a Leadership pipeline from both our existing talent pool and new talent acquisitions to fill critical gaps and to ensure a robust succession plan for key positions in the organisation.
058 ANNUAL REPORT 2018
SBM BANK (MAURITIUS) LTD

Diversity
As the Bank continues to expand, we on boarded 202 new recruits in 2018, bringing our total manpower, as at December 2018, to 1610.
Age distribution of our talent pool demonstrates that we have a balance between young and more experienced employees. The gender distribution shows that the highly male skewed distribution in the past has shifted with a skew towards the female gender. The female to male ratio stands at 59:41.
98
395
463
206
245
203Hea
dco
unt
Female
Male
Greater than 5030-50Less than 30
Demographics
HR Initiatives
Performance Management
A revised performance management framework with the balanced scorecard as basis has been rolled out. The aim is to support delivery of financial performance by leveraging processes and achieving improved Customer Experience and Learning &Growth. We are still at the initial stages of implementation. Continuous coaching and support is required to iron out issues so that we reach a maturity in implementation in the course of the year.
Our approach to performance management is to ensure that employees have a common understanding of the Group’s strategy and how it links to departmental strategy and individual goals.
Job Evaluation and Revised Grading Structure
Our current grading system does not reflect the present reality. The Job Evaluation exercise is therefore long overdue. This year, we remain dedicated to get it back on track. A proper grading structure aligned to an appropriate remuneration structure will go a long way in ensuring equity in remuneration management, clarity in career planning and development, clear promotion policy and retention of talent.
Staff Engagement
During the course of the year, one of the main initiatives of the Human Resources Division was to carry out of the Staff Engagement Survey across the Group. Same was supported by Korn Ferry. The Staff Engagement Survey yielded a response rate of 86% and bears an engagement index of 52% for the Bank.
The outcome of the Staff Engagement Survey has allowed the Management Team to know where they stand in terms of the engagement level of their respective departments and, most importantly, to address areas needing improvement. We are at the stage of putting up relevant action plans for the coming year to address concerns in an effort to improve the overall engagement level across the group.
Creating a safe working environment
In line with statutory requirements, SBM recognises that, as an employer, it has a moral and legal duty to ensure the safety and health of all its employees and any person legitimately conducting business within its premises. We are fully committed to comply with all the provisions of the Occupational Safety and Health Act 2005 (OSHA 05), Approved Codes of Practice and all other relevant statutory requirements. Guidelines, risk management plans and procedures have been developed for high risk areas and these are closely monitored. The Health and Safety Committee, comprising both management representatives and employee representatives, participates in the decision-making process. Appropriate communication, consultation and training are conducted to create awareness among all employees.
059ANNUAL REPORT 2018
SBM BANK (MAURITIUS) LTD

CORPORATE GOVERNANCE REPORT (CONT’D)
Health & Safety Report
The safety of our employees is one of our main priorities. We need to respond quickly and effectively to any cause of emergency. Thus, we have a plan to improve risk identification, warning dissemination and evacuation so as to save lives and prevent panic situations.
To support our aim of having an accident-free working environment, we:
> Perform regular drills to optimise evacuation response time of staff, visitors and customers;
> Perform regular inspection across all 40 branches as well as the Archives and Store rooms;
> Provide regular training to First aiders & Fire wardens.
Employee Wellness
The group is committed to promote good health and wellness of our employees. Wellness initiatives provided within the organization include:
> Sports, Leisure and wellness facilities at SBM Park for staff and their family members, supported by qualified coaches; yoga sessions; Staff Children Christmas Party; Staff End of Year Party; Staff Health Day and In-house doctor.
We are also looking at improving our canteen services for better service to our employees.
During the course of 2018, the following activities were organized:
June 2018: Seasonal Flu Immunization Programme
July 2018: Vaccination against Measles
August 2018: Housekeeping Appreciation Week
September 2018: Wellness Week
October 2018: Pink Friday
November 2018: Awareness Talk on Cancer
SBM Staff Children have been benefited from the staff children education fund and the following was disbursed as at December 2018:
Academic Year 2017/2018Disbursement
Estimate (MUR)
No. of Undergraduates 16 609,000
No. of Postgraduates 2 450,000
Total 18 1,059,000
Training and Development
SBM Academy has been launched in 2018 to provide relevant and customized learning programs in an evolving work environment. By promoting continuous learning and with our vision to grow regionally, it is crucial that we keep our employees abreast of the latest trends and techniques to maintain and enhance our competitive edge in the market. While developing new initiatives, current training programs are being enhanced to meet current and future needs.
Onboarding Programs Reviewed
Onboarding workshops ensure that new employees are trained and equipped with necessary know-how – both functional and behavioural skills required. The reviewed program provides an opportunity for new recruits to learn directly from management and experienced colleagues. Specific and tailored Onboarding Programs have also been designed for different levels across the organization
Anti-Money Laundering Training
All employees are trained to recognize and report suspicious activity. The training programs are regularly updated to address new regulations and policy development.
Leadership Development Program
SBM Bank (Mauritius) Ltd engages in leadership training. The training modules are designed to inspire an agile and innovative mindset.
Tracking Training Effectiveness
To ensure that the tailored training programs are aligned with the strategic initiative of the business units, evaluation survey, knowledge sharing by participants and post training implementation is closely followed by SBM Academy.
060 ANNUAL REPORT 2018
SBM BANK (MAURITIUS) LTD

Training Needs Analysis
Training plans are developed on analysis of training needs identified in consultation with heads of divisions. Thus more specific training programs are available for each business line and for specific functions and ensure that the training programs are designed in line with the strategic initiative of the business units.
Professional Membership Assistance
SBM Bank (Mauritius) Ltd is committed to excellence in people development and places great emphasis on employee training and development programs and recognizes employee learning as a key contributor towards organizational growth and service excellence. To support staff with a professional registration requirement to meet their Continuing Professional Development needs, SBM Bank (Mauritius) Ltd provides financial assistance for relevant professional memberships. Paid leaves are also available for employees to study approved courses.
New Outdoor Training
The aim of this experimental learning approach is to provide teams with a common platform to enhance teamwork, collaboration and trust. The training program is designed by expert facilitators, in partnership with line managers to take employees out of their comfort zone and enhance team spirit.
Focus FY 2018
> Certification Level Training has remained a key focus, mainly in CISI, Digital Masterclass & ACI Dealing.
> In addition, the Bank invested in various training on Credit Risk Management and Compliance. Through continuous training, from both internal and external experts, SBM Bank (Mauritius) Ltd ensures that a strong compliance and risk culture prevails.
> With the influx of new and emerging technologies, the Bank has invested hugely to build in-house competencies to ensure that teams are upskilled to embrace a digital future. Employees attended several workshops in Agile Leadership, IOT, Big Data Analytics, Artificial Intelligence, Blockchain, fintech, Robotics, Cryptocurrencies, Digital Banking.
> The Financial Markets team attended regular training during FY 2018, both locally and overseas. Moreover, various awareness workshops on treasury related training programmes were conducted by internal trainers.
> Middle Management has been equipped to drive and take responsibility for their team’s performance
> Capacity Building for SME’s Officers through a 5 days’ masterclass.
Way Forward
> Focus on Service Excellence, training of branch managers and employees to achieve a high degree of customer satisfaction
> Enhance a culture of continuous development
> Develop training programs that support future skills and capabilities requirements
> Credit Risk Management Customised Program
Fast Fact
Key Statistics
Training Cost: MRU 11,358,407.00
Training Hrs: 9,275.48
Total No of Training Courses: 84
061ANNUAL REPORT 2018
SBM BANK (MAURITIUS) LTD

CORPORATE GOVERNANCE REPORT (CONT’D)
Types of training
Online Training01
02
02
03
01
03
1%
94%
5%
Overseas Training
Local
Male01
0202
01
49%
51%Female
01
0%
2%2%
3%
7%
14%
5%
6%
09 61%
02
04
05
06
07
08
Rodrigues Branch01
06 Compliance Training
07 Certi�cation Level Training
05 Leadership Training
08 Emerging Technologies
02 Team Bonding
09 Technical skills
03 New Regulations
04 Soft Skills
03
Environmental Report
Environmental Stewardship
Contributing to a sustainable environment
At SBM, we are always seeking to positively impact the future, especially the environment. In line with our efforts to Go-Green, we have rolled out a series of initiatives over the course of 2018 and made progress in several areas. By so doing, we have continued to help shape a more sustainable future.
Our ecological approach in 2018
Energy efficiency and sustainable refurbishment
In line with our aim to make more efficient use of electricity, we have further upgraded our equipment to energy saving ones. By adopting eco-friendly materials, we are investing in both the short and long term interests of our business, while also championing environmental protection.
062 ANNUAL REPORT 2018
SBM BANK (MAURITIUS) LTD

One of the key steps we undertook in Mauritius was to replace our main centralised chillers at SBM Tower with the Trane AdaptiSpeed Technology and Adaptive Frequency Drive Technology, which was one of the most efficient and intelligent centralised system available on the market at the time of installation. Air conditioning usage at SBM Tower represents around 60% of the electrical consumption. Through this change, we have been able to significantly reduce our consumption at SBM Tower by 17.5% in 2018, compared to 2017, making monetary savings of around MUR 7.1 million. We have almost completed the replacement of air conditioning units by inverter type technologies at our service units. These new units use R410 gas as refrigerant and are ozone-friendly.
In our quest to make our buildings in Mauritius eco-friendly and sustainable, we have also appointed a panel of consultants for the renovation of both SBM Tower and our service units over the next 4 years. In line with this initiative, LED light fittings will replace the existing fluorescent and incandescent light fittings. The LED lights use 75% less electricity, emit more light and have an extended service life of 25 times more than conventional lights. As part of our refurbishment exercise, we are also looking into using certified recycled materials, like furniture, carpets and fabrics from recycled materials, from proven suppliers. Our new electrical appliances and equipment will also be chosen, based on the highest energy efficiency ratings.
Furthermore, as part of our asset replacement plan, we have already replaced several generators, at our premises in Mauritius and Rodrigues, with more fuel efficient ones, helping in reducing our carbon footprint.
Recycling and paperless approach
At SBM, we encourage the re-use and recycling of paper to avoid wastage and minimise discharge into the environment.
In Mauritius, to recycle paper, we have entered into an agreement with a recycling company that shreds, compacts and exports the shredded materials to be converted to usable paper. We participate in this environmental project by disposing of used/waste papers and obsolete documents in special recycling bins put at employees’ disposal on all floors at SBM Tower. Likewise, our service units also participate in this initiative. In 2018, 19,725 kg of papers were sent for recycling.
Key highlights of how we created a lighter footprint in 2018 in Mauritius
5,9276,637
7,6797933
2018201720162015
Ener
gy C
ons
umpt
ion
(MW
h)
Energy Consumption
A decrease by 10.7 % in 2018 compared to 2017
2018201720162015
CFC
Gas
Usa
ge (
kg)
CFC Gas Usage (R22)
559
2475 24752362.5
A decrease by 76 % in 2018 compared to 2017
063ANNUAL REPORT 2018
SBM BANK (MAURITIUS) LTD
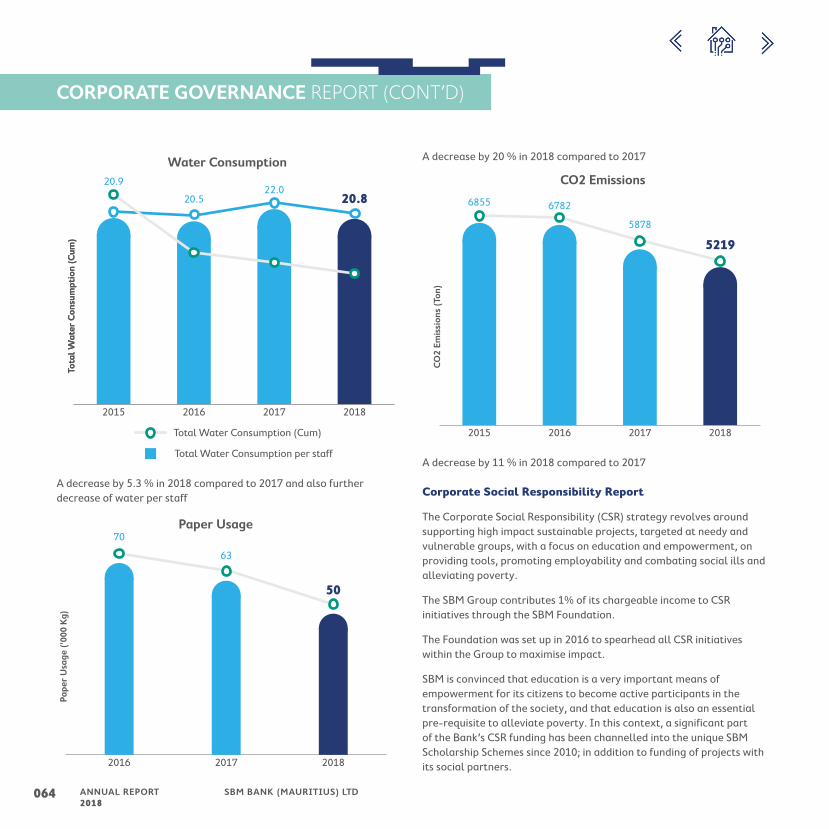
CORPORATE GOVERNANCE REPORT (CONT’D)
Tota
l W
ater
Co
nsum
ptio
n (C
um)
Water Consumption
20.820.9
20.522.0
2018201720162015
Tota
l W
ater
Co
nsum
ptio
n (C
um)
Total Water Consumption (Cum)
Total Water Consumption per staff
A decrease by 5.3 % in 2018 compared to 2017 and also further decrease of water per staff
201820172016
Pape
r U
sage
('0
00 K
g)
Paper Usage
50
70
63
A decrease by 20 % in 2018 compared to 2017
2018201720162015C
O2
Emis
sio
ns (
Ton)
CO2 Emissions
5219
6855 6782
5878
A decrease by 11 % in 2018 compared to 2017
Corporate Social Responsibility Report
The Corporate Social Responsibility (CSR) strategy revolves around supporting high impact sustainable projects, targeted at needy and vulnerable groups, with a focus on education and empowerment, on providing tools, promoting employability and combating social ills and alleviating poverty.
The SBM Group contributes 1% of its chargeable income to CSR initiatives through the SBM Foundation.
The Foundation was set up in 2016 to spearhead all CSR initiatives within the Group to maximise impact.
SBM is convinced that education is a very important means of empowerment for its citizens to become active participants in the transformation of the society, and that education is also an essential pre-requisite to alleviate poverty. In this context, a significant part of the Bank’s CSR funding has been channelled into the unique SBM Scholarship Schemes since 2010; in addition to funding of projects with its social partners.
064 ANNUAL REPORT 2018
SBM BANK (MAURITIUS) LTD

Principle Seven – Audit
Organisations should consider having an effective and independent internal audit function that has the respect, confidence and cooperation of both the Board and the management. The Board should establish formal and transparent arrangements to appoint and maintain an appropriate relationship with the organisation’s auditors.
Directors’ responsibilities
The directors are responsible for the preparation of the financial statements in accordance with International Financial Reporting Standards, International Accounting Standards and Companies Act 2001. The Directors must ensure that the provisions of the Companies Act 2001, the Banking Act 2004 and Financial Reporting Act 2004 are complied with. They must also ensure that the financial statements are free from errors and material misstatements.
Proof of proper process in appointing Auditors
In line with Section 39 Paragraph 4 of the Banking Act 2004, the SBM Group launched a tender exercise in 2015 for the appointment of external auditors. The tender was sent to the major audit firms in Mauritius.
Management and the board of directors went through an interview and selection process with each audit firm, following which, the current auditors were selected and recommended by management and the audit committee to the board for approval.
Each quarter, the external auditors meet the members of the Audit Committee. They discuss the financial statements of the Bank and the new accounting principles adopted.
Each year, the Audit Committee evaluates the external auditor in fulfilling their duty, to make an informed recommendation to the Board whether to retain the auditor. The evaluation encompasses an assessment of the qualifications and performance of the auditor; the quality and candour of the auditor’s communications with the Audit Committee and the Bank’s management; and the auditor’s independence, objectivity and professional discernment.
External Auditors
The current auditors, Ernst & Young, have been in office for the last 4 consecutive years for the audit of the financial statements for years 2015, 2016, 2017 and the current year. The Bank will comply with the requirements of the Banking Act with respect to the rotation of auditors after a period of 5 years.
065ANNUAL REPORT 2018
SBM BANK (MAURITIUS) LTD

CORPORATE GOVERNANCE REPORT (CONT’D)
Auditors’ fees and fees for other services
2018 2017
AuditOther
Services AuditOther
Services
MUR’000 MUR’000 MUR’000 MUR’000
Ernst & Young
SBM Bank (Mauritius) Ltd
Statutory Audits and quarterly reviews 6,500 5,750 7,133 -
SBM Bank (Mauritius) Ltd (Indian Operations)
S R Batliboi & Associates 1,477 1,533 -
Total 7,977 5,750 8,666 -
The report of Ernst & Young, external auditors is annexed to the Financial Statements of the Bank.
Whenever the external auditor provides non-auditor’s objectivity and independence are safeguarded as the non-audit services are carried out by different partners with different teams.
The role of the Internal Audit function at SBM Bank (Mauritius) Ltd is to provide independent and objective assurance to Management and to the Board of Directors through the Board Audit Committee. By following a systematic and disciplined approach, Internal Audit helps the bank to accomplish its objectives by evaluating and recommending improvements to operations, internal controls, risk management systems, and governance processes.
The Internal Audit department is governed by an Internal Audit charter / policy, approved by the Audit Committee. Internal Audit reports directly and functionally to the Audit Committee while it reports administratively to the Chief Executive of the Bank. The Head of Internal Audit has a direct reporting line to the Chairman of the Audit Committee. Moreover, the Head has regular meetings with the Chairman of the Audit Committee, in the absence of Management representatives, thereby further establishing Internal Audit’s independence. Also in order to maintain objectivity, Internal Audit is neither involved in nor responsible for any area of operations.
The Audit Committee reviews and approves Internal Audit’s plan and resources, and evaluates the effectiveness of the function. All areas of activity of the Bank fall under the scope of Internal Audit. Audits are conducted following a risk-based audit methodology which is in line with global best practices. The very basic principle is that high risk areas are audited on a more frequent basis. All key processes at the Bank are audited to identify key risks and to assess control adequacy and effectiveness. Audit procedures are designed in response to the risks identified. Audit findings are discussed and finalized with the respective Heads of Departments and Management. A summary of the audit reports is, thereafter, tabled at the Audit Committee on a quarterly basis. The findings, as well as the methodologies are reviewed and discussed with the Chairman and other members of the Audit Committee.
Departmental structure
In 2017, over and above the existing IT Audit cluster, 3 other clusters were set up within the Internal Audit function namely Credit, Operations and Others. The objective is to have Internal Auditors specializing in specific areas, thus enhancing the quality and depth of audits being performed. In February 2018, 3 experienced Audit Leads were appointed to supervise the new clusters. The Audit Leads who report to the Head of Internal Audit are responsible for supervising, reviewing and directing the audit field work of their respective clusters.
066 ANNUAL REPORT 2018
SBM BANK (MAURITIUS) LTD
Audit Resources
The Internal Audit team at SBM Bank (Mauritius) Ltd is composed of auditors with a mix of substantial banking and auditing experience gained mainly at large audit firms. The majority of the Audit function consists of fully qualified auditors/accountants, whilst other staff members are pursuing their professional studies. In addition, Internal Audit has certified information systems auditors to audit the information technology used by SBM.
Since 2016, Internal Audit has been equipped with an Audit Management Tool designed to manage and automate a wide range of audit operations. Currently a data analytics tools is being developed.
Standards of auditing
Internal Audit at the Bank is conducted in line with the Institute of Internal Auditor’s International Standards for the Professional Practice of Internal Auditing (Standards).
The Standards apply to individual internal auditors and the internal audit activity. Internal auditors must conform with the standards related to individual objectivity, proficiency, and due professional care and the standards relevant to the performance of their job responsibilities.
Achievements
During the year under review, Internal Audit completed 37 out of the 42 core audits planned, representing 88% completion. 100% completion could not be achieved due to the redeployment of certain resources to other assignments. Key risk areas such as Credit, Treasury, Finance, AML or Operations were fully covered. All the Service units (branches) have been covered at least once. Quarterly reviews on key risk areas, which were introduced in 2017, have been maintained and fine-tuned in 2018. The objective of the quarterly reviews is to highlight areas of potential concern and thereby raising early warning signals for timely corrective actions.
In 2018, the IT Audit team has completed 70% of its approved plan. The critical systems were covered. A higher completion rate could not be achieved due to staff resourcing. The IT Audit team was strengthened during the year with one resource having networking & IT infrastructure experience.
Internal Audit has also extended its capabilities and specialisation to non-audit services such as conducting analytics, validation of interest computation on specific accounts and investigations amongst other special assignments. In 2018, 15 investigations were completed by the team.
Initiatives undertaken in 2018
With the new departmental structure firmly in place in 2018, a more systematic approach has been adopted. The Head of Internal Audit has weekly meetings at the start of each week, individually with each Lead to discuss the planning and audit objectives for the week. At least, once a week, the Head, along with the Lead, will meet the respective team members to discuss and review in detail audit work being carried out. A monthly meeting is also held with the Leads to discuss and agree on initiatives for the department. Apart from those structured meetings, there are on-going discussions with team members on a daily basis.
In 2018, a comprehensive procedure manual for internal audit has been implemented. The team has also reviewed and re-organized the audit working papers.
In terms of KPIs, a mini performance appraisal of the audit officers is conducted after completion of each audit. This eventually forms the basis for the annual performance appraisal exercise.
067ANNUAL REPORT 2018
SBM BANK (MAURITIUS) LTD

CORPORATE GOVERNANCE REPORT (CONT’D)
Outlook for 2019 and beyond
In 2019, additional qualified Internal Audit Officers will be on boarded to complete the capacity building objectives. Another important initiative will be to strengthen the IT Audit team with qualified and experienced resources. Audit staff will be encouraged through incentives to pursue relevant professional certifications (e.g., CIA, CISA), in order to enhance their skills. In terms of training programs, the intention is to provide as much specialized training to the team on areas such as Global Business, Treasury, Trade Finance, Cyber threats.
In Q1 2019, implementation of the first phase of the data analytics tool will be completed. The function will then embark on phase II, which will focus on exception reporting, identification of anomalies and inconsistencies in data and other unusual patterns.
With the view to enhancing the quality of audits, peers reviews are being introduced in 2019.
An external quality assessment and improvement program (EQAIP) is also planned for 2019. This is a requirement as per the Institute of Internal Auditors.
Given the constantly evolving and increasing risks in banking and financial services, Internal Audit will be called to be an important player in supporting the Bank to achieve its strategic objectives.
068 ANNUAL REPORT 2018
SBM BANK (MAURITIUS) LTD

Principle Eight – Relations with Shareholders and Other Key Stakeholders
The Board should be responsible for ensuring that an appropriate dialogue takes place among the organisation, its shareholders and other key stakeholders. The Board should respect the interests of its shareholders and other key stakeholders within the context of its fundamental purpose.
The Board of Directors affirms that relevant stakeholders have been involved in a dialogue on the organisational position.
Shareholder
The Bank is wholly owned by SBM (Bank) Holdings Ltd and ultimately owned by SBM Holdings Ltd, a public company listed on the Stock Exchange of Mauritius as per the below:
SBM Holdings Ltd (Mauritius)
Listed on the Stock Exchange of Mauritius
SBM (Bank) Holdings Ltd (Mauritius)
SBM Bank (Mauritius) Ltd (Mauritius)
069ANNUAL REPORT 2018
SBM BANK (MAURITIUS) LTD

CORPORATE GOVERNANCE REPORT (CONT’D)
The table below depicts the Bank’s key stakeholders and explains the way we engage with them:
HOW DO WE ENGAGE WITH OUR STAKEHOLDER
THEIR CONTRIBUTION TO VALUE CREATION
WHAT OUR STAKEHOLDERS EXPECT FROM US AND KEY ISSUES RAISED
OUR RESPONSE TO STAKEHOLDER’S CONCERN
Shareholders, debt holders and investment analysts
• Send Notice of Annual General Meeting
• Integrated Annual reports
• Published interim results on a quarterly basis
• Regular presentation and roadshows
• Annual General Meeting
• Analyst briefings and regular investor presentation
• SBM Website
• External newsletters
• Electronic communication
• Reviews by rating agencies
• Investors, shareholders and debt holders are a key source of financial capital to support the business operations and sustain growth.
• Sustainable and attractive return on investment realised over time through dividends, interest and share price growth
• Strong leadership which provides strategic direction and execution
• Focus on exemplary corporate governance and ethics
• Managing risk, capital and liquidity within an appropriate risk appetite framework
• Management has clear financial targets which are communicated. These targets are being monitored by top management to increase profitability and improve key operational ratios via improvement in product offerings in the banking sector, well contained cost to income ratio, growth in advances and deposits amongst others.
• The Board and its various sub-committees have oversight responsibilities in relation to risk management, corporate governance, and adherence to internal policies. They also ensure that a proper strategy is in place and is being properly executed to ensure long term value creation.
• No major shareholder’s influence on operations.
070 ANNUAL REPORT 2018
SBM BANK (MAURITIUS) LTD
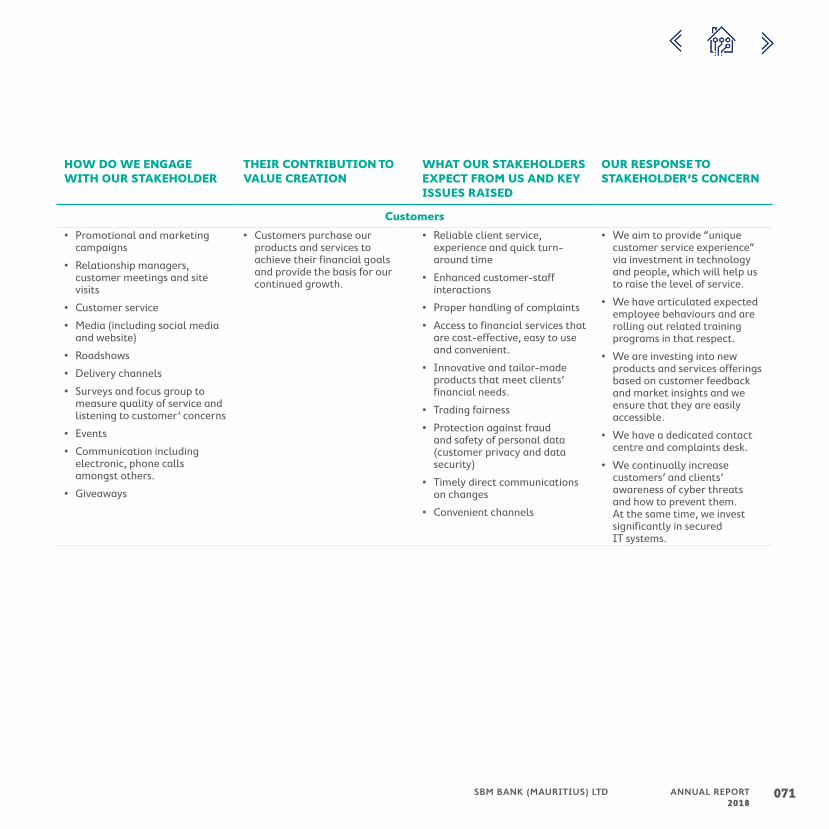
HOW DO WE ENGAGE WITH OUR STAKEHOLDER
THEIR CONTRIBUTION TO VALUE CREATION
WHAT OUR STAKEHOLDERS EXPECT FROM US AND KEY ISSUES RAISED
OUR RESPONSE TO STAKEHOLDER’S CONCERN
Customers
• Promotional and marketing campaigns
• Relationship managers, customer meetings and site visits
• Customer service
• Media (including social media and website)
• Roadshows
• Delivery channels
• Surveys and focus group to measure quality of service and listening to customer’ concerns
• Events
• Communication including electronic, phone calls amongst others.
• Giveaways
• Customers purchase our products and services to achieve their financial goals and provide the basis for our continued growth.
• Reliable client service, experience and quick turn-around time
• Enhanced customer-staff interactions
• Proper handling of complaints
• Access to financial services that are cost-effective, easy to use and convenient.
• Innovative and tailor-made products that meet clients’ financial needs.
• Trading fairness
• Protection against fraud and safety of personal data (customer privacy and data security)
• Timely direct communications on changes
• Convenient channels
• We aim to provide “unique customer service experience” via investment in technology and people, which will help us to raise the level of service.
• We have articulated expected employee behaviours and are rolling out related training programs in that respect.
• We are investing into new products and services offerings based on customer feedback and market insights and we ensure that they are easily accessible.
• We have a dedicated contact centre and complaints desk.
• We continually increase customers’ and clients’ awareness of cyber threats and how to prevent them. At the same time, we invest significantly in secured IT systems.
071ANNUAL REPORT 2018
SBM BANK (MAURITIUS) LTD

CORPORATE GOVERNANCE REPORT (CONT’D)
HOW DO WE ENGAGE WITH OUR STAKEHOLDER
THEIR CONTRIBUTION TO VALUE CREATION
WHAT OUR STAKEHOLDERS EXPECT FROM US AND KEY ISSUES RAISED
OUR RESPONSE TO STAKEHOLDER’S CONCERN
Employees, Management and Directors
• Integrated Annual Report
• Induction course
• Talent retention programme and scholarship schemes
• Conferences, team engagement sessions and performance management discussions
• On-going training and team building
• Regular internal meetings and workshops
• CEO and other executive members roadshows (Examples town-hall events)
• Events and facilities (e.g. SBM Park) to enhance employee welfare
• Electronic communication via SBM intranet sites, social media and emails
• Internal newsletter
• Cultural events
• Team members surveys and feedback
• Supporting communities
• Trade Union and Collective Bargaining Agreement
• Employees and management supply the necessary skills and expertise to deliver on our promises to stakeholders.
• A safe, stimulating and rewarding work environment with open communication with management
• Fair remuneration and benefits
• Opportunities for career and personal development
• Effective performance management and recognition
• Provide competitive remuneration and benefits packages to be the employer of choice
• Provide on-going training and education
• Open communication between employees and management
• Employee wellness programmes aligned to local and international best practice
• Integration of performance management into key development programmes for skills and personal development.
• Use the findings of our employee survey to create tailored action plans to address areas needing improvements.
• Collective bargaining agreement in place.
072 ANNUAL REPORT 2018
SBM BANK (MAURITIUS) LTD

HOW DO WE ENGAGE WITH OUR STAKEHOLDER
THEIR CONTRIBUTION TO VALUE CREATION
WHAT OUR STAKEHOLDERS EXPECT FROM US AND KEY ISSUES RAISED
OUR RESPONSE TO STAKEHOLDER’S CONCERN
Government and regulators
• Onsite visits and compliance inspections
• Written communications
• Filing of returns and reports with all regulators
• Regulatory Dialogue Programme which invites regulators to address our executive team views on emerging regulation.
• Participation in forums, conferences and workshops
• Regular meetings with regulators
• Government and regulators provide us with our licence and regulatory framework in which to operate.
• Compliance with relevant legislation and operating in a transparent manner.
• Engage constructively on new policies and regulations affecting Group operations
• Compliance with existing rules and regulations
• Transparency in disclosures of any relevant information
• Ensure on-time filing of reports and returns and payment of relevant fees and taxes.
• Proper composition and well-defined duties of the Board and Board Committees in place
• Fair business practices
Suppliers and Strategic Partners
• Expressions of interest
• Vendor assessments
• Tender process
• Contract management and renewal
• Ongoing supplier relationship management, supplier visits and one-to-one meetings.
• Fairs and exhibitions
• Incident handling and escalation
• Suppliers are critical for our business through the delivery of high quality and innovative products and services to sustain growth.
• Critical to support our systems and fixing issues
• New and enhanced services
• Fair and reasonable contract terms
• Timely payment and renewal of contract
• Trade fairness
• Participation in events
• Timely decisions
• Work in a spirit of partnership
• Understanding of business roadmap
• Good supplier relationship
• Fair payment practices
073ANNUAL REPORT 2018
SBM BANK (MAURITIUS) LTD

CORPORATE GOVERNANCE REPORT (CONT’D)
HOW DO WE ENGAGE WITH OUR STAKEHOLDER
THEIR CONTRIBUTION TO VALUE CREATION
WHAT OUR STAKEHOLDERS EXPECT FROM US AND KEY ISSUES RAISED
OUR RESPONSE TO STAKEHOLDER’S CONCERN
Communities
• CSR programmes
• Donations
• Media coverage and other social networks
• Sponsorships
• Staff engagement
• Being engaged actively in the community is an effective way to hear from the people that we serve and this will enable us to grow further and achieve our goals
• Communities act as a brand ambassador
• Helping to provide a sound environment through job creation and undertaking community development programmes in areas of need
• Helping the communities at large through:
− Economic empowerment of vulnerable groups
− Job creation
− Contribution to the development of the country
• Provision of tools and opportunities to vulnerable groups
• Investment in CSR projects
• Sponsorships
Directors’ service contract
Mr Venkateswara Rao Parvataneni, currently Acting Chief Executive, is on a service contract of five years starting 01 July 2018 while Mrs Veronique Lim Hoye Yee is on a service contract of five years starting 05 September 2016.
Significant Contract
No contract of significance, other than loans and credit facilities granted in the ordinary course of business, subsisted during the year under review between the Bank/Group and any director of the Bank either directly or indirectly.
Directors and Officers Liability Insurance
The Bank has subscribed to a Directors & Officers Liability Insurance policy in respect of legal action or liability that can arise against its directors and officers and the cover does not provide insurance against fraudulent, malicious or wilful acts or omissions.
074 ANNUAL REPORT 2018
SBM BANK (MAURITIUS) LTD

Statement of ComplianceName of Public Interest Entity: SBM Bank (Mauritius) Ltd
Reporting Period: 1 January 2018 to 31 December 2018
We, the directors of SBM Bank (Mauritius) Ltd, confirm that to the best of our knowledge, the Company has applied all material principles of the National Code of Corporate Governance (2016).
NAYEN KOOMAR BALLAH, G.O.S.K PHILIP AH-CHUEN
Chairman Chairman – Corporate Governance and Conduct Review Committee
31 March 2019
075ANNUAL REPORT 2018
SBM BANK (MAURITIUS) LTD

“Promoting a risk culture which requires all employees being responsible to ensure the Bank operates within agreed risk appetite and risk limits”
076 ANNUAL REPORT 2018
SBM BANK (MAURITIUS) LTD

RISK MANAGEMENT REPORT
077ANNUAL REPORT 2018
SBM BANK (MAURITIUS) LTD

RISK MANAGEMENT REPORT (CONT’D)RISK MANAGEMENT REPORT (CONT’D)
Risk Management – A Strategic Imperative
UNDERSTANDING AND MANAGING RISKS TO CREATE AND HARNESS OPPORTUNITIES
As a diversified financial institution, SBM Bank (Mauritius) Ltd embraces risk management as a core competency of its strategy to support business in delivering sustainable growth and help to reinforce its resilience, amidst an environment shaped by uncertainty.
Supported by a consistent risk-focused culture, risk management is overseen and managed on an enterprise-wide basis. The Bank operates an integrated risk management framework designed to maximise risk-adjusted returns while remaining within the Board-approved risk appetite and risk tolerance levels. This approach ultimately ensures the protection of the Bank’s reputation and is consistent with its objective of increasing shareholder value.
078 ANNUAL REPORT 2018
SBM BANK (MAURITIUS) LTD

SBM Bank (Mauritius) Ltd adopts an integrated approach to risk management supported by a well-defined Risk Management and Risk Appetite Framework, sustained by a robust Risk Management Governance Structure,
underpinned by three Lines of Defence
MANAGING RISK STRATEGICALLY
RISK CULTURE
STRATEGIC LAYER MANAGEMENT LAYER
THREE LINES OF DEFENCE
RISK APPETITE FRAMEWORK
The Bank has a well-established Risk Governance Structure, underpinned by three lines of defence, which facilitates identification and escalation whilst providing assurance to the Board. The governance structure is supported by an active and engaged Board of Directors and a risk
management function that is independent of the business units.
The Head of Risk Management has direct access to the Board Chairman and the Risk Management Committee without impediment.
The Bank maintains a comprehensive risk appetite framework, providing a structured approach to the identification, measurement, and control of risk. It encompasses a suite of policies, processes, controls and systems for assessing the appropriate level of risk appetite required to constrain its overall risk profile.
Risk Control Mechanism
Risk Strategy
Stress Testing
Risk Appetite
Risk Identification
Business units
Risk Management and Compliance
Internal Audit
Risk Management Team
Responsible to create and maintain the risk practices
across the Bank and to ensure that controls are in place for
all risk categories
Board of Directors
Responsible for ensuring that risks are adequately identified,
measured, managed and monitored and that good governance is maintained
Board Sub-Committees
Responsible to advise Board on the effectiveness of the
risk profile, risk culture, risk appetite, risk strategy and risk
management framework
Management Forums
Responsible for translating the high-level overall
guidance from the Board into operational aspects and then
monitoring and reporting them back periodically to the
Board/Board Committees
GOVERNANCE AND STRUCTURE
079ANNUAL REPORT 2018
SBM BANK (MAURITIUS) LTD

RISK MANAGEMENT REPORT (CONT’D)
Risk Oversight – Highlights 20182018 was a challenging and eventful year for the Bank, marked by unexpected hits and hurdles. Nonetheless, the Bank showed full commitment in the management of risk; and shortcomings in our policies were duly addressed, in line with our Risk Appetite Framework.
Of note, our Indian Operations have been deconsolidated from SBM Bank (Mauritius) Ltd during the end of 2018, thus making India business a wholly owned subsidiary of SBM Bank Holdings Ltd.
The table below highlights the Bank’s overall risk profile.
üBalance sheet remained resilient with assets funded primarily from stable deposits. Net Stable Funding Ratio (NSFR) is comfortable at 118.6%, which is above the minimum Basel threshold of 100%.
üBank’s core MUR deposits represented over 90% of the total funding, unchanged from previous year, which is adequate to mitigate the related liquidity and funding risk
üIncreased focus to diversify the Bank’s sources of funding with a strong commitment towards stable funding, particularly in FCY.
üContinuance of the Bank’s prudent approach towards funding risk, i.e. maintaining a conservative Loan to Deposit Ratio (LDR).
HIGHLIGHTS 2018 OUTLOOK FOR 2019Balance Sheet Management
63.9%
Loan to Deposit Ratio
(Dec 17: 71.2%)
118.6%
Net Stable funding ratio
(Dec 17: 111.7%)
üCapital remained adequate, taking into account risk appetite as well as growth and strategic targets with the key capital ratios above the minimum regulatory requirements, as highlighted below:
üCommon Equity Tier 1 (CET1) stood at 13.5%, above the minimum regulatory requirement of 8.875% (including buffers)
üTotal Capital Adequacy Ratio (CAR) reached 15.1%, within the minimum regulatory requirement of FY18: 12.375%, FY19: 13.375%
üThe Bank has a healthy liquidity position with the LCR significantly above 100%. The Bank proactively managed the ratio by ongoing monitoring of the stock of High Quality Liquid Assets (HQLA).
üEnhance capital efficiency while maintaining a strong risk oversight and further improve the quality of our funding base
üOptimising geographic portfolios by selectively reshaping sub-scale unprofitable markets and prioritising more profitable markets
üThe Stock of HQLA shall be monitored closely to be maintained at a comfortable level in order to meet liquidity and regulatory needs.
HIGHLIGHTS 2018 OUTLOOK FOR 2019Capital and Liquidity Management
13.5%
Tier 1
(Dec 17:11.2%)
15.1%
Capital Adequacy Ratio
(Dec 17: 12.8%)
140.2%
Liquidity Coverage ratio
(Dec 17: 127.5%)
080 ANNUAL REPORT 2018
SBM BANK (MAURITIUS) LTD

HIGHLIGHTS 2018 OUTLOOK FOR 2019
üContinued focus on prudent risk management and enhanced effectiveness of our recovery capability
üImplementation of IFRS 9 Financial Instruments where loan losses provisions are based on an expected loss model for credit losses.
üImplementation of an Early Warning Signal Framework to manage any area of weaknesses and deterioration in customer performance.
üSetting up of The Watchlist Review Forum to review of high risk customers placed under Watchlist and Special Mention
üContinued prudence in provisioning
HIGHLIGHTS 2018 OUTLOOK FOR 2019
üOperational loss incurred following recent cyber-attack pertaining to the Bank’s Indian Branch thus requiring investment in and reinforcement of the Bank’s cybersecurity to ensure effective resilience of its systems to such attacks
üContinuous monitoring of operational risks to ensure that operational losses (financial or reputational), including any related to conduct of business matters, do not cause material damage to the Bank
üRoll-out of new risk assessment process and controls throughout the organisation
üEnhance controls, systems and processes to adapt to the evolving financial crime landscape and new challenges associated with digitalisation
üAdopting an integrated compliance approach to address the demands of the changing regulatory environment
üEnhance the environmental and social risk appraisal system and broaden the remit of the environmental and social risk business unit to strengthen our capacity to identify, mitigate and manage associated impacts
Non-Financial Risk
Prudent Provisioning Coverage
5.1%
Net impaired Advances as a % of Net Advances (net of cash collateral)
(Dec 17: 1.5%)
44.2%
Specific Coverage Ratio
(Dec 17: 55.4%)
081ANNUAL REPORT 2018
SBM BANK (MAURITIUS) LTD

RISK MANAGEMENT REPORT (CONT’D)
Key Developments in 2018
(1) Remediation Plan for Cross-Border Activities
The Bank has established a comprehensive remediation programme regarding cross-border activities. This risk remediation plan has included:
> strengthening the country risk framework and aligning risk appetite to strategy, focusing on countries of presence (also reinforcing synergy and cross-selling) with a clear-cut list of countries where we are not interested to do business (allowing the Relationship Team to be more focused and efficient);
> reducing single exposures, geographic and sector concentrations; and exiting some customers considered to be high risk;
> reviewing the end-to-end credit process including monitoring and collateral management;
> revamping the risk organisation structure and;
> improving risk culture.
(2) Setting up of the Covenant Monitoring Team within the Risk Management Team
Covenants are conditions subsequent as per the specific loan agreement and approval conditions which are most often represented in terms of financial ratios that must be maintained, such as a maximum debt-to-equity ratio/other such ratios and non-financial covenants such as submission of financial covenants and negative pledge on assets, among others.
In the second half of 2018, the Covenant Monitoring Team was incorporated within the Risk Management Team to strengthen the second line of defence enabling the below objectives:
End Result of Covenant Monitoring
It acts as a facilitator for awareness on the financial conditions and operations of borrowers and guarantors on a regular and ongoing basis;
It allows a periodic ongoing communication with the borrowers to convey bank commitments to their banking needs; and
It provides early warning signs and allows prompt action. It also prevents detrimental situation when borrowers default on their
obligation and allows the Bank to initiate exit policy in some cases.
Objectives of Covenant Monitoring
To conduct independent verification of testing of covenants included in facility agreements;
To independently check whether breaches have been reported to appropriate authority promptly;
To classify non-compliant customers under watchlist and report to the Watchlist Review Forum.
082 ANNUAL REPORT 2018
SBM BANK (MAURITIUS) LTD

Enterprise Risk Management
Risk-Aware Culture
SBM Bank (Mauritius) Ltd operates an integrated risk management framework, centred around the embedding of a risk culture, which is designed to maximise returns while remaining within the Board-approved risk appetite and risk tolerance levels. Such a culture is built on adequate risk practices and appropriate risk behaviours implanted throughout the organisation.
Main Elements of the Risk Culture:
Focus on Principal and Emerging Risks
The Bank ensures that the key risks are properly identified,
assessed and monitored. Mitigating strategies
are put in place to manage such risks
and make front liners more accountable. This
facilitates more dynamic risk identification and enables the Bank to
establish a clear linkage between decision making
and risk management as well as identify and manage correlations
across risk types.
Tone from Top
Directors and employees are required to
consistently demonstrate professional and ethical conduct in accordance with the principles of
integrity, accountability and transparency, thus
promoting and maintaining trust throughout the
organisation.
Governance
Control definition & effectiveness
Stress & Scenario Analysis
Measurement, evaluation & transperancy
Risk/Business Strategy
Risk Identification
Risk Appetite
083ANNUAL REPORT 2018
SBM BANK (MAURITIUS) LTD

RISK MANAGEMENT REPORT (CONT’D)
Risk Governance Structure
Underpinned by three lines of defence, the Bank’s Risk Governance Structure facilitates identification and escalation whilst providing assurance to the Board. The governance structure is supported by an active and engaged Board of Directors and a risk management function that is independent of the business units.
The chart below illustrates the inter-relationship between the Board, Board Committees and Management Committees that have the majority of risk oversight responsibilities for the Bank and their corresponding roles.
STRATEGIC LAYER
Executive and Independent Directors
The Board remains ultimately responsible for ensuring that risks are adequately identified, measured, managed and monitored and that good governance is maintained. The Board discharges its duty either directly or through its committees to ensure decision making is aligned with the board’s approved policies and frameworks.
Mixture of independent, experts and executive directors whenever allowed
The Board sub-committees which include primarily Audit, Risk Management, Strategy, Corporate Governance and Conduct Review are responsible to advise Board on the effectiveness of the risk profile, risk culture, risk appetite, risk strategy and risk management framework.
Board Sub-CommitteesBoard of Directors
The Bank's philosophy is that responsibility for risk management resides at all levels within the organisation and therefore uses the three lines of defence model which promotes transparency, accountability and consistency through clear identification and segregation of risks
Business Units
Risk Management and Compliance
Internal Audit
Strategic Overview of control
Business Operations
Oversight Function (Risk Management and Compliance)
Independent Assurance (Internal Audit)
Confirmation of Control
Control of Risks
084 ANNUAL REPORT 2018
SBM BANK (MAURITIUS) LTD
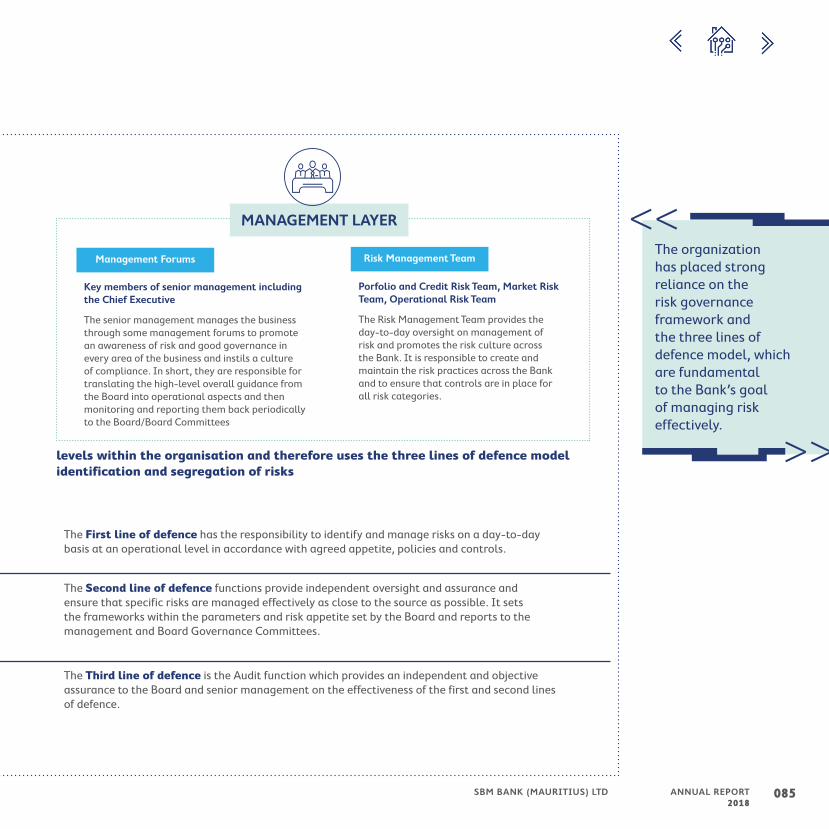
Key members of senior management including the Chief Executive
The senior management manages the business through some management forums to promote an awareness of risk and good governance in every area of the business and instils a culture of compliance. In short, they are responsible for translating the high-level overall guidance from the Board into operational aspects and then monitoring and reporting them back periodically to the Board/Board Committees
Porfolio and Credit Risk Team, Market Risk Team, Operational Risk Team
The Risk Management Team provides the day-to-day oversight on management of risk and promotes the risk culture across the Bank. It is responsible to create and maintain the risk practices across the Bank and to ensure that controls are in place for all risk categories.
Management Forums Risk Management Team
MANAGEMENT LAYER
The Bank's philosophy is that responsibility for risk management resides at all levels within the organisation and therefore uses the three lines of defence model which promotes transparency, accountability and consistency through clear identification and segregation of risks
The First line of defence has the responsibility to identify and manage risks on a day-to-day basis at an operational level in accordance with agreed appetite, policies and controls.
The Second line of defence functions provide independent oversight and assurance and ensure that specific risks are managed effectively as close to the source as possible. It sets the frameworks within the parameters and risk appetite set by the Board and reports to the management and Board Governance Committees.
The Third line of defence is the Audit function which provides an independent and objective assurance to the Board and senior management on the effectiveness of the first and second lines of defence.
The organization has placed strong reliance on the risk governance framework and the three lines of defence model, which are fundamental to the Bank’s goal of managing risk effectively.
085ANNUAL REPORT 2018
SBM BANK (MAURITIUS) LTD

RISK MANAGEMENT REPORT (CONT’D)
A Comprehensive Risk Appetite Framework
The Bank maintains a comprehensive risk appetite framework, providing a structured approach to the identification, measurement, and control of risk. It encompasses a suite of policies, processes, controls and systems for assessing the appropriate level of risk appetite required to constrain its overall risk profile.
The framework is guided by the following strategic risk objectives:
> Early identification and control of all types of possible risks.
> Maintaining adequate capital buffer under stressed conditions to absorb losses, if any.
> Promoting stability of earnings to avoid unexpected losses.
The Bank risk appetite is reviewed in conjunction with the overall strategy and capital planning process on an annual basis, based on Board-driven strategic risk objectives and risk appetite. Scenario stress-testing of financial and capital plans is an essential element in the risk appetite calibration process.
Risk appetite is communicated across the Bank through risk appetite statements that provide clarity on the scale and type of activities that can be undertaken in a manner that is easily conveyed to all stakeholders. Some of the approved risk appetite statements are as follows:
The Bank only takes risks for which it is appropriately compensated.
The Bank will only enter sectors where there is a clear financial advantage and manage its exposures following the principle of
diversification across products, geographies, client segments and industry sectors
The Bank will adhere to all policies and regulatory requirements and strives to demonstrate that we “Do The Right Thing” in the way business is conducted.
The Bank will seek to maintain an optimal balance of risk and return across all businesses.
The Bank aims to manage risks, with the objective of maximising risk-adjusted returns while
remaining within approved risk appetite which is regularly reviewed to adapt to the challenging
economic and regulatory requirements.
The Bank will not knowingly engage in financing activities with companies purposefully operating in material violation of applicable environmental and social laws.
The Bank will grow sustainably and ensure a sound capital management is in place and is
supported by long-run capital planning.
086 ANNUAL REPORT 2018
SBM BANK (MAURITIUS) LTD

The following chart provides an overview of the key components of the risk appetite framework comprising of the risk universe;
RIS
K U
NIV
ER
SE
RIS
K U
NIV
ER
SE
RISK CONTROL MECHANISM
It encompasses frameworks, guidelines including best practices and guiding principles, policies including contingency plans and limits based on the following components:
Credit Risk Management
Framework
Market Risk Management
Framework
Liquidity Risk Management
framework
Operational Risk Management
Framework
Reputational Risk Management
Framework
Other risk framework covering legal,
model risks
Risk Capital Strategy Components
Risk- bearing capacity
Risk bearing capacity represents the ability to bear risk in terms of available capital, and ability to raise additional capital. It also covers strength of operational processes and operating culture in the organisation
Risk Appetite Statement
Risk appetite is an articulation and allocation of the risk capacity or quantum of risk the Bank is willing to accept in pursuit of its strategy, duly set and monitored by the Board, and integrated into the Bank’s strategy, business, risk and capital plans
Risk Tolerance
Risk tolerance refers to the limits in operational terms such as concentration limits, stop loss limits, etc. to ensure that the risk is within the defined risk appetite. Any breach thereof would lead to a control and/or mitigation action
Risk Target Risk Target is the optimal level of risk that the Bank wants to take in pursuit of a specific goal. Setting the risk target should be based on the desired return, on the risks implicit in trying to achieve those returns and on SBM’s capability of managing those risks
Risk Limits Risk limit determines thresholds to monitor that actual risk exposure does not deviate too much from the desired optimum. Breaching risk limits will typically act as a trigger for corrective action at the process level
RISK APPETITE FRAMEWORK
Category Financial Risk Non-Financial Risk
Primary Risk Drivers
Credit Risk Market Risk Liquidity RiskOperational
RiskReputational
RiskBusiness &
Strategic RiskOther Risks
Secondary Risk Drivers
üBorrower
üCounterparty credit
üIndustry
üCountry
üSovereign
üTrading Book
üBanking Book
üCurrency
üLegal Entity
üProcess
üPeople
üIT
üCompliance
üMacroeconomic environment
üCompetitive environment
üRegulatory environment
üLegal
üModel
üEnvironmental and Social
087ANNUAL REPORT 2018
SBM BANK (MAURITIUS) LTD

RISK MANAGEMENT REPORT (CONT’D)
Risk Bearing Capacity and Stress Testing
As part of a strong risk management framework, the Bank emphasises the importance of paying attention to changes in economic or other circumstances that can lead to deterioration in the standing of a counterparty that would undermine the capital position of the Bank.
The Bank, through a proper stress testing approach, estimates the impact of potential shocks to evaluate whether it can withstand a crisis without breaching regulatory thresholds. Stress testing output facilitates business planning and budgeting and provides comfort on the overall health of the organisation reported in the Internal Capital Adequacy Assessment Process (ICAAP).
An overview of the stress testing process is illustrated below.
Develop the appropriate stress scenarios that are relevant to the nature of business of the Bank including significant movement in credit ratings,
interest rates, exchange rates, counterparty stage classification and recovery rates at different level of
severity (Mild, Moderate, Severe).
Translate these scenarios into loss levels on various types of risks such as Credit, Market and Liquidity risk. For Credit risk, ECL
computation involves classifying counterparty in 3 stages under IFRS 9 before stressing on different parameters.
Calculates the solvency needs, combined with buffer requirement and the capital adequacy under each
scenario and assess their impact on the Profit or Loss and capital level.
All the results and methodology are evaluated and documented including the contingency plans and
mitigating actions as appropriate.
The Board Risk Committee annually reviews the Bank’s risk appetite and then analyses the impacts
of stress scenarios on the Bank’s capital forecast in order to understand and manage the Bank’s
projected capital adequacy.
Determine Stress
Scenarios
Risk Profiling
Impact Assessment
Result Assessment including
Implications
Reporting and Agreeing
on Management Actions
Key Areas of Stress Testing Usage
Risk MitigationIdentifying contingency planning, recovery plan and management actions that can be taken, in the event of adverse changes to
the business or economic environment
Strategic Financial and Capital Planning
Assessing the impact of the sensitivities and scenarios on the
capital adequacy ratios
Risk IdentificationBetter understanding the risks that could potentially impact the Bank’s
financial strength and capital position
Risk AppetiteGaining a better understanding of
the drivers and the underlying risks associated
088 ANNUAL REPORT 2018
SBM BANK (MAURITIUS) LTD

Scenario Analysis and Stress Testing
The Group has conducted stress testing under various historical and stress test scenarios to assess the impact of unfavourable scenarios on its capital position. Sample stress tests conducted are provided in the following table. The scenarios are regularly reviewed and fine-tuned to ensure that they remain relevant to the Group’s risk profile, activities and prevailing and forecasted economic conditions.
Case Stress Testing Scenarios
1 Customers under Watch become impaired
2 Portfolio Risk : Building Contractors, Real Estate, Global Business Licence (GBL) Customers become impaired
3 Top Group/Single customers become impaired
4 Corporate Customers in Madagascar, UAE and Kenya become impaired
The Group conducts the stress testing at an enterprise-wide level that involves assessing the impact of the specified scenarios on the Group as a whole. The results of stress tests are reported and discussed at the Risk Management Committee and the Board prior to being submitted to the Bank of Mauritius. As at 31 December 2018, the capital adequacy of the Group does not fall below the regulatory requirements in any of the four scenarios above.
Results of the Stress Testing on Capital Adequacy of the Bank
21.722.323.9 23.923.8 23.4 23.7 24.3 24.4 24.023.8
CASE 4: Corporates in following countries are impaired
CASE 3: Top groups/Single Customers become impaired
CASE 2: Portfolio RiskCASE1: Watchlist customers are impaired
Seg A Seg B Total Seg A:Building
Contractors
Top 5 groupsin Seg B
Top 2 single
customers in Tourism
sector
Madagascar UAE KenyaSeg A: Real
Estate
Seg B: GBL
In the event of distress within the Bank, the holding company would act as a source of strength through the ability to re-deploy surplus capital.
089ANNUAL REPORT 2018
SBM BANK (MAURITIUS) LTD

RISK MANAGEMENT REPORT (CONT’D)
Key Risks Explained
In pursuing its goals and objectives, the Bank is confronted with various types of risks that cannot be addressed individually but which require a holistic approach to risk management. Those risks are grouped into six principal risks, each having different impacts and dependence on the six forms of capitals that are fundamental for value creation over the long term. These key risks are categorised as illustrated below.
DescriptionMeasurement, Monitoring and Management of Risk
Capital Impacted
Stakeholders Impacted
Credit Risk Credit risk is the risk that the Bank will suffer economic loss due to a Single/ Group borrower or counterparty failing to fulfil its financial or other contractual obligations
üMeasured as risk weighted exposures for performing and non-performing exposures.
üMonitored within regulatory and prudential limits by borrowers, portfolios, country and bank, approved by the Board within a framework of delegated authorities.
üManaged through a robust risk control framework which outlines clear and consistent policies, principles and guidance.
Market Risk Market risk losses arise from variations in the market value of trading and non-trading positions resulting from changes in interest rate risk, foreign exchange risk and price risk, and in their implied volatilities.
üMeasured in terms of value at risk, which is used to estimate potential losses on risk positions as a result of movements in market rates and prices over a specified time horizon and to a given level of confidence, augmented with stress testing to evaluate the potential impact on portfolio values of more extreme, though plausible, events or movements in a set of financial variables.
üMonitored using measures including the sensitivity of net interest income and the sensitivity of structural foreign exchange that are applied to the market risk positions within each risk type.
üManaged using risk limits approved by the Board.
Liquidity & Funding Risk
Liquidity and Funding Risk is the inability to meet contractual and contingent financial obligations, on and off balance sheet as and when they come due. Our primary liquidity objective is to provide adequate funding for our business throughout market cycles, including periods of financial stress.
üMeasured using internal metrics including cash flow projections, Liquidity Coverage Ratios and Net Stable Funding Ratio.
üMonitored against liquidity and funding risk framework and overseen by the Asset and Liability Management Committee (‘ALCO’) of the Bank and the Board Risk Management Committee.
üManaged independently at the source of the risk
090 ANNUAL REPORT 2018
SBM BANK (MAURITIUS) LTD

DescriptionMeasurement, Monitoring and Management of Risk
Capital Impacted
Stakeholders Impacted
Operational Risk
Operational loss is the risk of loss resulting from inadequate or failed internal processes, people and systems, or from external events.
Operational risk arises from human error, inappropriate conduct, failures in systems, processes and controls or natural and man-made disasters.
üMeasured using the risk and control assessment process which allows identification and evaluation of risks and effectiveness of controls.
üMonitored through regular risk assessment procedures, key risk indicators and internal loss database.
üManaged through a conducive control environment with robust operational risk policies, processes, systems as well as appropriate risk culture within the organisation.
Business and Strategic Risk
Business risk is the risk of loss resulting from incorrect assumptions about external or internal factors, inappropriate business plans, ineffective business strategy execution, or failure to respond in a timely manner to changes in the regulatory, macroeconomic or competitive environments.
Strategic risks are risks that affect or are created by an organisation’s business strategy and strategic objectives, which are critical to the growth and performance of the Bank.
üMeasured by using several key internal indicators and metrics as a yardstick which enable us to measure the progress against fulfilling the objective; and
üMonitored against our risk appetite set out by the Board whilst taking into consideration our internal capabilities and growth prospects; and
üManaged by the Board who sets the objectives for the Bank in terms of growth orientation in consultation with our strategy team.
Reputational Risk
Reputational risk arises from failure to meet stakeholder expectations as a result of any action, event or situation caused by the Bank or its employees that can adversely impact on the Bank’s reputation.
üMeasured by reference to our reputation as indicated by our dealings with all relevant stakeholders, including media, regulators, customers and employees.
üMonitored through analysis of root cause for justified complaints and reporting to appropriate forums/committees.
üManaged through a framework where all employees are responsible for identifying and managing reputational risk that may occur within their respective areas of business.
091ANNUAL REPORT 2018
SBM BANK (MAURITIUS) LTD

RISK MANAGEMENT REPORT (CONT’D)
Credit and Counterparty Risk Management
Credit Risk Governance
The objective of our credit risk management framework is to ensure all material credit risks to which the enterprise is exposed are identified, measured, managed, monitored, mitigated and reported on a consistent basis.
This requires careful consideration of proposed extensions of credit, the setting of specific limits, monitoring during the life of the exposure, active use of credit mitigation tools and a disciplined approach to recognizing credit impairment.
The Bank’s credit processes are designed with the aim of combining an appropriate level of authority in its credit approval processes with timely and responsible decision making and customer services. Within the powers to act granted by the Board of Directors, credits are approved by decision making authorities at different levels in the organisation depending on the risk categorization and the credit exposure of the customer. An overview of credit approval process and procedures is given below:
1 Credit OriginationSales Team:
• Initiate and manage sales of products
• Follow client on-boarding standards
• Receive and check applications
• Assist customers with information
• Execute account - monitoring tasks
• Input Risk Rating tools
• Analyse the risks and prepare the sales note for approval.
3 Credit ApprovalCredit Approval Authority
• Board Credit Committee
• Management Credit Committee
• Credit Underwriting Team
• Decision making tool for certain retail exposures
2 Credit AppraisalCredit Underwriting Team
• Screening of all applications forwarded by sales team
• Assessment of obligor
• Recommend to the appropriate authority for approval
4 Documentation & DisbursementCredit Service unit
• Credit Administration
• Credit Documentation
• Credit Disbursement
5 Review & MonitoringRisk Management
• Monitoring of both prudential and regulatory limit for all credit exposures
6 Recovery & Workout
Recovery & Workout
• Ongoing management of impaired loans
• Recovery of loans and advances due by impaired borrowers
092 ANNUAL REPORT 2018
SBM BANK (MAURITIUS) LTD

Credit Risk Profile as at 31 December 2018
SBM’s loan book is well-diversified by industry and geographic region with an average weighted risk rating of 5.3 (equivalent to an external rating of Baa1 – Baa3).
Total credit risk weighted exposures were USD 2.8 billion as at 31 Dec 2018 (2017: USD 3.1 billion), comprised of both funded and non-funded exposures.
7.31times toBank Tier 1(Dec 17: 7.48 )
Aggregation of Credit Risk Weighted Exposures
The following sections detail the sub-category of credit risk.
Country Risk
Country risk is a component of credit risk in all cross-border credit operations for circumstances different to the usual commercial risk. Its main elements are sovereign risk, the risk of transfer and other risks that could affect the ability of the counterparties to fulfil their obligations, resulting in a financial loss for the Bank. As at 31 December 2018, the total risk weighted exposures to cross-border lending accounted for 166% of Bank Tier 1 Capital (2017: 186%). 166%
(Dec 17: 186%)
RWE as a % Bank Tier 1
Breakdown of cross-border risk weighted exposures
Distribution by Rating (as a % of total cross border risk weighted exposures)
7.60.4
62.5
2.18.8
18.5
0.2
10.3
0.04.7
0.0
55.4
40.1
6.610.5
1.90.90.2
25.0
38.7
5.9
Dec 2018
Dec 2017
Dec 2016
UnratedCaa1-DB1-B3Ba1-Ba3Baa1-Baa3A1-A3Aaa-Aa3
Distribution by Region (as a % of total cross border risk weighted exposures)
4.89.80.22.1
68.9
14.2
0.60.11.4
14.56.18.1
0.2
10.6
29.9
66.0
52.7
9.9
Dec 2018
Dec 2017
Dec 2016
North AmericaMiddle EastOceaniaEuropeAsiaAfrica
093ANNUAL REPORT 2018
SBM BANK (MAURITIUS) LTD
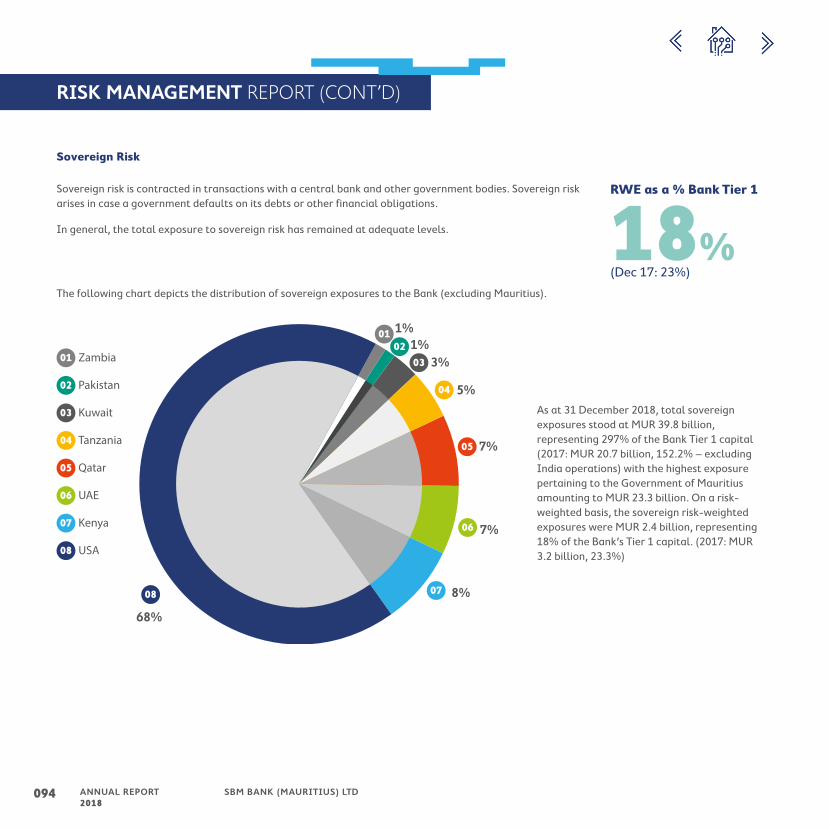
RISK MANAGEMENT REPORT (CONT’D)
Sovereign Risk
Sovereign risk is contracted in transactions with a central bank and other government bodies. Sovereign risk arises in case a government defaults on its debts or other financial obligations.
In general, the total exposure to sovereign risk has remained at adequate levels. 18%(Dec 17: 23%)
RWE as a % Bank Tier 1
The following chart depicts the distribution of sovereign exposures to the Bank (excluding Mauritius).
Zambia01
01
Pakistan02
02
Kuwait03
03
Tanzania04
04
Qatar05
05
UAE06
06Kenya07
07
USA08
08
1%1%
3%
5%
7%
7%
8%
68%
As at 31 December 2018, total sovereign exposures stood at MUR 39.8 billion, representing 297% of the Bank Tier 1 capital (2017: MUR 20.7 billion, 152.2% – excluding India operations) with the highest exposure pertaining to the Government of Mauritius amounting to MUR 23.3 billion. On a risk-weighted basis, the sovereign risk-weighted exposures were MUR 2.4 billion, representing 18% of the Bank’s Tier 1 capital. (2017: MUR 3.2 billion, 23.3%)
094 ANNUAL REPORT 2018
SBM BANK (MAURITIUS) LTD

Bank Counterparty Risk
Bank risk is the risk that a counterparty bank could default on its debt or other obligations.
As at 31 December 2018, total risk-weighted exposures to bank counterparty stood at USD 182 million, representing 0.46 times the Bank’s Tier 1 capital (2017: USD 252 million, 0.61 times). 47%
(Dec 17: 61%)
RWE as a % Bank Tier 1
Bank Risk-Weighted Exposures as at 31 December 2018
11.5
17.8
12.5
21.7
8.3
28.1
6.66.9
18.721.4
0.1
15.5
48.2
27.7
23.0
18.6
8.6
4.8Ris
k-W
eigh
ted
Expo
sure
s (R
WE)
%
Rating
Dec 2018
Dec 2017
Dec 2016
UnratedB1-B3Ba1-Ba3Baa1-Baa3A1-A3Aaa-Aa3
The Bank has concentration to banks with rating range Baa1-Ba3 primarily in countries where SBM has physical presence.
095ANNUAL REPORT 2018
SBM BANK (MAURITIUS) LTD

RISK MANAGEMENT REPORT (CONT’D)
Private Risk
Portfolio Concentration
The Bank maintains a well-diversified portfolio through internal portfolio limits set for each operations to ensure that the Bank is not impacted drastically due to significant concentration in a particular portfolio.
(Dec 17: 309%)285%
RWE of top 5 portfolios as a % of Bank Tier 1
Mauritius Operations – Top 5 portfolios by Risk-Weighted Exposure (%) + Segment B
Segment A loan portfolio remains well-diversified with reducing concentrations. Loans and advances to the tourism and mortgage sector represented 11.5% and 12.4% of total portfolio, respectively, as at December 2018. All other industry concentrations are at below 10%.
25.5
10.59.37.9
11.5 12.4
25.6
11.89.1
7.4
11.4
8.68.4 9.3
13.612.712.8
18.0
As
a %
of t
otal
RW
E
Segment BNon BankFinancial
Institution
Real EstateConsumerMortgageTourism
Dec 2018
Dec 2017
Dec 2016
In relation to the Bank’s cross-border activities, concentration in Segment B stood at 25.5% as at 31 December 2018 with customers mainly in the Africa region and in India, in line with the Bank’s strategy.
2018 was a challenging year. Nevertheless, the Bank showed resilience; and shortcomings in our cross-border lending policies and procedures as well as in our risk infrastructure have since then been addressed.
096 ANNUAL REPORT 2018
SBM BANK (MAURITIUS) LTD

Private Risk
Customer Concentration
The Bank monitors single large exposures, groups of closely related exposures and aggregate of large exposures above 10 percent of Tier 1 Capital against regulatory limits as per the guidelines issued by the regulator.
Regulatory limits were revised by the Bank of Mauritius in December 2017 where the concentration is henceforth based on Tier 1 Capital instead of Capital Base which is more prudent. This partly explains the increase in aggregate large exposure as compared to pre-2017 periods, as illustrated in the chart below. Nonetheless, with the measures put in place to reduce credit concentration, there was a significant drop in the ratio of net exposures to Tier 1 capital as at 31 December 2018. Indeed, all large exposures were well within the regulatory limits, as shown in the table below.
Regulatory Credit Concentration Limit – Mauritius Operations
As at 31 Dec 2018
Credit exposure to any single consumer shall not exceed 25% of the Bank’s Tier 1 Capital
Highest single customer:
15.6%
Credit exposure to any group of closely-related customers shall not exceed 40% of the Bank’s Tier 1 Capital
Highest Group of closely-
related customer:
28.7%Aggregate large credit exposures to all customers and group of closely related customers above 10% of Bank’s Tier 1 Capital shall not exceed 800% of Bank’s Tier 1 Capital
269.2%
Net
Exp
osur
e as
a %
of C
apit
al
Dec 2018Dec 2017Dec 2016
Based on Tier 1 capital following change
in regulatory guideline
Based on capital base
Services
Real Estate
Financial Institutions
Commerce - Wholesale
Agriculture
Tourism
269.2
232.7
119.6
41.8%
58.3%39.9% 50.8%
20.7%
35.4%
23.5%65.2%
35.2%
39.6%
24.4%10.0%
69.6%
34.2%
17.6%
55.4%
097ANNUAL REPORT 2018
SBM BANK (MAURITIUS) LTD

RISK MANAGEMENT REPORT (CONT’D)
Private Risk
Related Party Transactions
All exposures to related parties are reported to the Corporate Governance and Conduct Review Committee as per the Bank of Mauritius Guideline on Related Party Transactions.As at 31 December 2018, the aggregate of non-exempted exposures to related parties represented 20.1% of the Bank’s Tier 1 capital, which is within the regulatory limit of 60% for category 1 and within the regulatory limit of 150% for category 1 & 2 (Dec 17: 10.5%).
513684762
1,429
2,400
3,0002.8%
0.7%0.6%
0.5%
2.3%
1.4%
RPT 6 (Non-Exempted)
RPT 5 (Exempted)*
RPT 4 (Non-Exempted)
RPT 3 (Non-Exempted)
RPT 2 (Exempted)*
RPT 1 (Exempted)*
Total Exposures (MUR’M)
Total Exposures as a % of Bank Tier 1 Capital
Note: (*) Exempted from Regulatory Limits as per the BOM Guideline on Related Party Transactions
098 ANNUAL REPORT 2018
SBM BANK (MAURITIUS) LTD

Credit Quality
Implementation of IFRS 9
Following the transition from IAS 39 to IFRS 9, the Bank, as from 01 January 2018, is now required to maintain expected credit losses on all financial assets compared to the previous requirement to keep specific provisioning only on defaulted accounts.
This change gives rise to the need for an Expected Credit Loss (“ECL”) model which can be broken down into three further models, namely Probability of default (“PD”), Exposure at Default (“EAD”) and Loss Given Default (“LGD”). The IFRS 9 standard requires SBM to utilise best estimates of Exposure At Default (EAD) for the computation of ECL. EAD is the sum of outstanding principal and interest payment due at the time of default.
The EAD framework has been developed by SBM’s Risk Management Department with due support and consultations with numerous experts, departments and business units to establish expert guidance, data inputs, data reconciliation and methodology suitable to meet the IFRS 9 requirements.
Impairment
The Bank adopts a framework for the timely monitoring of non-performing assets with an early-stage tracking of clients failing to meet contractual obligation.
Provision for Impaired loans, where instalment of principal and interest are due and remain unpaid for 90 days, is maintained in accordance with the Bank of Mauritius guideline on Provision for Credit Losses and Income Recognition. Moreover, an in-depth recovery strategic plan is adopted to maximize collection in case of impairment.
(Dec 17: 1.5%)5.1%
Net Impairment as a % Net Advances
099ANNUAL REPORT 2018
SBM BANK (MAURITIUS) LTD

RISK MANAGEMENT REPORT (CONT’D)
Impairment Trend
6,941
1,072
1,418
Dec'18Dec'17Dec'16
65.3% 55.4% 44.2%
2.5%
6.5%
2.7%
1.5%
5.1%
Gross NPL to Gross loans (%)
Net NPL to Net loans (%)
Net Impaired Advances
Specific Provision
9.0%
Net non-performing advances as a percentage of net advances hiked to 5.1% in December 2018 from 1.5% in December 2017 as the bank prudently provisioned for a large cross-border group having unsubstantiated timely repayment. The Bank, through its robust recovery mechanism, undertakes an ongoing tracking of impaired clients. Monitoring of Sectoral impairment remains a key index for fuelling the growth strategy.
Historical figures have been restated following operation of India Ops as a WOS.
100 ANNUAL REPORT 2018
SBM BANK (MAURITIUS) LTD

Rescheduled Advances
Rescheduling refers to changing the original terms of the loan contract, as formally agreed by both the client and SBM.
Rescheduling is used as an effective and pro-active mechanism to assist arrears. Moreover, it is an approach to assist customers who have changed their pay frequency or whose employer may be experiencing a temporary cash flow problem and who may require relief due to a more permanent change in their circumstances. (Dec 17: 3.7%)
7.7%
Total Rescheduled Loans as a % of Total Credit Portfolio
As at 31 December 2018, total rescheduled loans stood at 7.7% of the credit portfolio, compared to 3.7% in December 2017. Surge in rescheduled facilities is linked with cross border entities within the Commerce Wholesale Sector.
A breakdown of the rescheduled loan by portfolio is illustrated in the diagram below;
MU
R’M
TourismRealEstate
MortgageManufacturingNon-Textiles
ICTCommerceWholesale
CommerceRetail
AgricultureOthers
9.3%6.1%3.6%10.4%39.7%44.2%12.3%4.6%0.4%
2018
2017
101ANNUAL REPORT 2018
SBM BANK (MAURITIUS) LTD

RISK MANAGEMENT REPORT (CONT’D)
Market Risk Management
The Bank has a sound and well-designed strategy to manage market risk. The objective of market risk management is to control market risk exposures to optimise return while maintaining risk at acceptable levels.
Market risk arises from both trading and non-trading business activities. The classification of assets into trading book and banking book portfolios determines the approach for analysing the market risk exposure.
Market Risk Governance and Oversight
The Board approves the market risk appetite which is defined in terms of the splits between domestic and international markets, foreign currency and interest rate exposures, percentage exposure allocation for position-taking and percentage target splits in terms of maturities of exposure. It also approves new products after having gone through an independent assessment by the Risk Management Team to ensure that the products are within the policy and risk appetite, and that the processes are defined, systems are ready and the resources are adequately trained.
The Bank has an independent Market Risk Team to identify, control and monitor the market risk exposures against a set of prudential limits approved by the Board. The limits are sufficiently granular to conduct an effective control of various market risk factors on which an exposure is maintained. Product control procedures and analysis are made for changes in portfolios, in order to detect possible incidents for their immediate correction. Within Risk Management, there is a Treasury Middle Office function which acts as a safeguard for market risk.
Business units must at all times comply with the Board approved limits and the risks on derivatives are continually reviewed to ensure that complexities of the products are adequately monitored and controlled. In the event of a limit being exceeded, the business units have to explain the reasons for the excess and provide the action plan to correct the situation, which in general can consist of reducing the position until it reaches the prevailing limits or set out the strategy that justifies an increase in limits.
Market Risk Profile
Interest Rate Risk
Interest rate risk is the exposure of the Bank financial condition to the variability of interest rates due to re-pricing and/or agreed maturity mismatches, changes in underlying rates and other characteristics of assets and liabilities in the normal course of business. Interest rate risks mainly include repricing risk, yield curve risk, benchmark rate risk and option risk.
The Bank interest rate risk management is aimed at maximising the risk-adjusted net interest income within the tolerable level of interest rate risk and risk appetite.
The Net Interest Income (NII) is expected to rise in an increasing rate scenario and fall in a decreasing rate scenario for Mauritius Operations.
7.1%
Impact of 200 bps parallelRate change on Net Interest
Income (NII)Mauritius Operations
The interest rate risk in the Banking book is managed by controlling interest rate sensitivities, which measure the immediate effects of interest rate changes on the assets, liabilities and off-balance sheet items. With the composition of the balance sheet as at 31 December 2018, the Mauritius Operations expected the NII to rise in an increasing rate scenario and fall in a decreasing rate scenario. An increase of 200 bps in interest rate would result in an improvement of 7.1% in NII whereas a decrease of 200 bps in rate would result in a contraction of the same percentage in NII. However, some liabilities would not be fully impacted by the downward shock of 2% given that interest rates thereon are not expected to fall below zero percent.
(Interest Rate Gap figures are provided in Note 37 (d) to the Financial Statements at pages 202 to 203)
102 ANNUAL REPORT 2018
SBM BANK (MAURITIUS) LTD
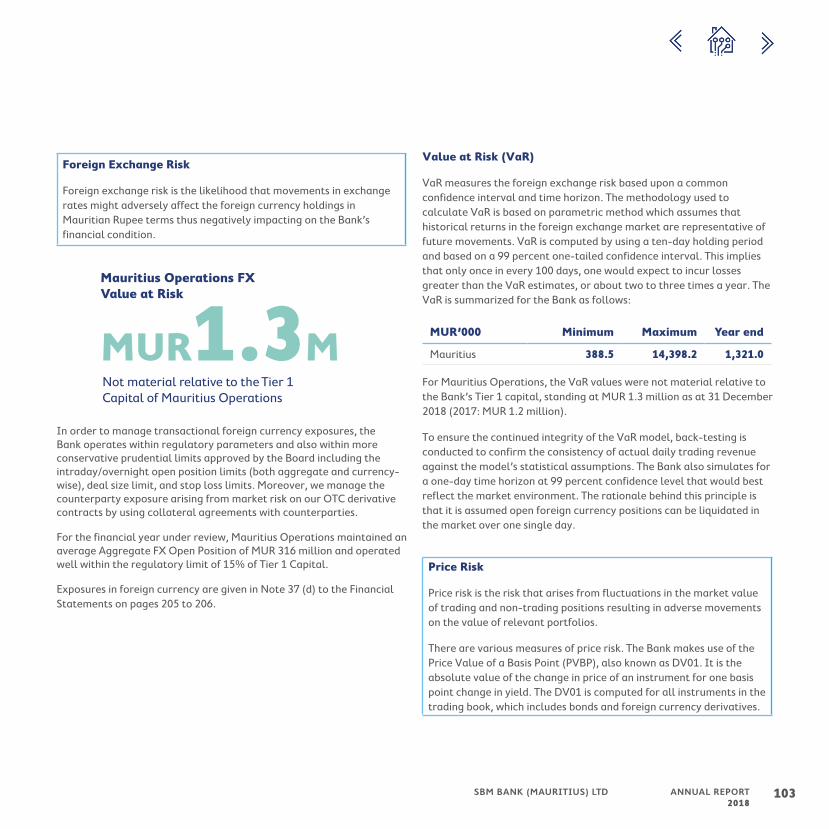
Foreign Exchange Risk
Foreign exchange risk is the likelihood that movements in exchange rates might adversely affect the foreign currency holdings in Mauritian Rupee terms thus negatively impacting on the Bank’s financial condition.
MUR1.3M
Mauritius Operations FX Value at Risk
Not material relative to the Tier 1 Capital of Mauritius Operations
In order to manage transactional foreign currency exposures, the Bank operates within regulatory parameters and also within more conservative prudential limits approved by the Board including the intraday/overnight open position limits (both aggregate and currency-wise), deal size limit, and stop loss limits. Moreover, we manage the counterparty exposure arising from market risk on our OTC derivative contracts by using collateral agreements with counterparties.
For the financial year under review, Mauritius Operations maintained an average Aggregate FX Open Position of MUR 316 million and operated well within the regulatory limit of 15% of Tier 1 Capital.
Exposures in foreign currency are given in Note 37 (d) to the Financial Statements on pages 205 to 206.
Value at Risk (VaR)
VaR measures the foreign exchange risk based upon a common confidence interval and time horizon. The methodology used to calculate VaR is based on parametric method which assumes that historical returns in the foreign exchange market are representative of future movements. VaR is computed by using a ten-day holding period and based on a 99 percent one-tailed confidence interval. This implies that only once in every 100 days, one would expect to incur losses greater than the VaR estimates, or about two to three times a year. The VaR is summarized for the Bank as follows:
MUR’000 Minimum Maximum Year end
Mauritius 388.5 14,398.2 1,321.0
For Mauritius Operations, the VaR values were not material relative to the Bank’s Tier 1 capital, standing at MUR 1.3 million as at 31 December 2018 (2017: MUR 1.2 million).
To ensure the continued integrity of the VaR model, back-testing is conducted to confirm the consistency of actual daily trading revenue against the model’s statistical assumptions. The Bank also simulates for a one-day time horizon at 99 percent confidence level that would best reflect the market environment. The rationale behind this principle is that it is assumed open foreign currency positions can be liquidated in the market over one single day.
Price Risk
Price risk is the risk that arises from fluctuations in the market value of trading and non-trading positions resulting in adverse movements on the value of relevant portfolios.
There are various measures of price risk. The Bank makes use of the Price Value of a Basis Point (PVBP), also known as DV01. It is the absolute value of the change in price of an instrument for one basis point change in yield. The DV01 is computed for all instruments in the trading book, which includes bonds and foreign currency derivatives.
103ANNUAL REPORT 2018
SBM BANK (MAURITIUS) LTD

RISK MANAGEMENT REPORT (CONT’D)
The Bank is exposed to risks in respect of both locally and internationally quoted securities, which are controlled by Board-approved policies and limits. The portfolio is managed by the Financial Markets Division under the strategic direction of the ALCO and the Investment Forum. Besides the local Gilt-edged securities and other HQLA Bonds denominated in USD, the Bank maintains a well-diversified portfolio comprising primarily of investment grade securities. The Bank had recourse to Interest Rate Swaps to hedge the risk linked to USD interest rates. The Bank does not have exposure to commodity price risk. All commodity products are done back-to-back, where the price risk is perfectly hedged.
Mauritius Operation’s trading book has grown considerably during the last two years. The bond trading book consists primarily of HQLA Bonds and foreign currency derivatives products. New limits and additional monitoring has been set up to ensure that the transactions are within the risk appetite of the Bank.
The Bank’s non-banking segment has exposure to price risk due to its holdings in equity as part of its strategy. These are independently valued and monitored.
Liquidity and Funding Risk
Liquidity Management is a basic element in the Bank’s business strategy and a fundamental pillar, together with Capital, in supporting its balance sheet strength.
The Bank ensures that its funding sources are well diversified and that the funding source concentrations are regularly monitored and analysed. It has its principal sources of funding from capital, core deposits from retail, corporate and high net worth clients, both local and international clients.
140.2%
Consolidated LCR
Above the Bank of Mauritius minimum requirement of 100%
118.6%
Mauritius Operations NSFR
Above the Basel III minimum requirement of 100%
Liquidity profile
The Bank has a strong liquidity position. The Bank’s liquid assets echo a sound liquidity standing, adequate to counterbalance the impact of a stressed funding environment. It is capable of utilising its own resources extensively and to invest in higher yielding assets. The primary tools that the Bank uses to monitor and manage liquidity risk are: the Basel Liquidity Ratios namely Liquidity Coverage Ratio (LCR), the Net Stable Funding Ratio (NSFR) and the Gap analysis. Liquidity risk is managed at source by the independent Financial Market functions of each banking entity.
(Liquidity Gap figures are provided in Note 37 (c) to the Financial Statements at pages 200 to 201)
Basel III Liquidity Ratios
As per the BOM Guideline on Liquidity Management, the LCR is maintained in significant currencies (i.e. MUR and USD) and on a consolidated basis. The Mauritius Operations has always been above the regulatory requirements since the introduction of LCR by BOM in November 2017.
Proactively, the Bank is already implementing NSFR in the liquidity risk framework in some jurisdictions
The LCR and LDR are shown in the following table:
LCR LDR
Mauritius 140.2% 63.9%
104 ANNUAL REPORT 2018
SBM BANK (MAURITIUS) LTD

The average LCR was 136.3% which is significantly above the Basel requirement of 100%. The average stock of High Quality Liquid Assets amounts to MUR 35.8 billion. The Bank’s portfolio of HQLA is mostly comprised of highly A-rated sovereign and Multilateral Development Banks (MDBs) bonds.
Funding
The Bank maintains deposit concentration limits to ensure that it does not place undue reliance on a single entity as a funding source. Funding ratios are monitored.
The Loan to Deposit ratios are conservative. During 2018, the Mauritius Operations’ core MUR deposits represented over 90% of the total funding, unchanged from the previous year, which is adequate to mitigate the related liquidity and funding risk given a high degree of
stickiness. With the introduction of LCR, a significant portion of the funding was used to hold HQLA bonds.
Scenario Analysis and Stress Testing
An array of liquidity scenarios, covering a series of explicit events, are developed, analysed, and reported to the ALCO and the Board Risk Management Committee. In the case of a potential or actual crisis, the Bank has a formal contingency plan in place that clearly sets out the processes, responsibilities and strategies for addressing liquidity shortfalls in unexpected situations.
Based on the results of the stress testing, the Bank is strong enough in terms of liquidity to face mild shocks. The growth in the stock of HQLA assets has improved the liquidity position.
105ANNUAL REPORT 2018
SBM BANK (MAURITIUS) LTD

RISK MANAGEMENT REPORT (CONT’D)
Operational Risk ManagementOver the years, the trend of the risks in the operational area has been evolving. To keep pace with the growing risks, our Operational Risk Management Team has constantly enhanced on its techniques and as a result, the Bank has, today, widely accepted risk management systems, processes and methodologies for operational risk.
The Bank also has a sound operational risk management framework enhanced by the three lines of defence in line with good governance practices.
To contain operational risks within acceptable limits and meet regulatory requirements – whilst protecting the entities within the Bank against financial losses as well as physical and reputational damages and ensuring continued service delivery and value creation – the following principles are abided by:
1Data protection in compliance with internal policies and laws
3Definition of the risk appetite statement
5Formulation and approval of policies by the Board
7Performance of scenario analysis forecasting worst case scenarios
2Segregation of the roles and responsibilities of the three lines of defence
4Reporting of key risk metrics to Senior Management and the Board
6Monitoring of the business environment and geo-political configuration
8Strong risk culture driven by the Board and Senior Management
In order to apply the principles, the following tools help in the identification and monitoring of operational risk:
The capture and analysis of
loss data
The maintenance of a risk register
The definition and monitoring
of Key Risk Indicators (KRI)
The review of process through
performance of control
attestation
The conduct of Risk and Control Self-
Assessment (RCSA)
The risk assessment for
all new products, services and
systems
The alignment of the different entities to the Bank risk management
philosophy through the regular interaction
with the Bank Risk Management function
106 ANNUAL REPORT 2018
SBM BANK (MAURITIUS) LTD

Operational Loss
As illustrated in the bar chart below, in 2018, an increase in the absolute loss amount figure was observed which pertains mainly to external frauds. The Bank has witnessed external fraud cases in Segment B business and another external fraud was due to a cyber-attack that hit our SBM India operations allowing fraudulent SWIFT payments. Controls pertaining to internal processes and network securities have since been enhanced.
% Total Loss
10 16
1111
60
0000000000 0
98
63
40
0
20
40
60
80
100
Execution,Delivery &
Process Management
Business Disruptionand System Failures
Damage toPhysical Assets
Clients, Products& BusinessPractices
Employment Practicesand Workplace
Safety
ExternalFraud
InternalFraud
FY 2018
FY 2017
FY 2016
% Total Count
44
3
16
43
31
2
52
21
002
004
000 1
38
19
28
0
20
40
60
80
Execution,Delivery &
Process Management
Business Disruptionand System Failures
Damage toPhysical Assets
Clients, Products& BusinessPractices
Employment Practicesand Workplace
Safety
ExternalFraud
InternalFraud
FY 2018
FY 2017
FY 2016
107ANNUAL REPORT 2018
SBM BANK (MAURITIUS) LTD

RISK MANAGEMENT REPORT (CONT’D)
IT Risk
The Bank’s operations are technology intensive. Our technology platforms are currently hosted and managed by our IT strategic partner offshore. We are conscious of the risks associated with this kind of outsourcing arrangements with regards to data protection, system performance, service delivery and time to market for new products.
To enable the Bank to regain control over its systems, customer data and reduce its dependency on third parties, initiatives are currently underway to repatriate all our systems in Mauritius.
During the year, we have undergone a number of unfortunate and longer than expected system downtimes, which has negatively impacted on customer service, one of our key strategic levers for growth. Even though the Bank has a robust information security framework in place, SBM Bank (India) was hit by a cyber-attack where an amount of MUR 630 million was involved. An amount of MUR 93 million was recognised as operational loss related to the cyber-attack for the year ending 31 December 2018.
Following the cyber-attack, our Information Security strategies have been further strengthened to ensure that the Bank remains protected from any malicious attacks. Business continuity procedures were also amended to ensure business continuity in case there is any cyber-attack at the Bank.
The existing Information Technology Risk Management framework is supported by IT policies and standards, control processes and the following risk mitigation strategies:
> Security awareness for staff and customers
> Security tools to detect and prevent cyber-attacks from outside
> Strong access control
> Regular vulnerability testing
> Backup systems to ensure business continuity
Business Continuity Management
In recent years, there have been numerous threats including cyber-attacks which have become increasingly common and natural disasters such as flooding. These threats have highlighted the importance of having an effective Business Continuity Management framework in order to save lives, mitigate damage and ensure a base level of continuity for essential activities.
In this context, the Bank pursues its efforts in upgrading and enforcing standards to protect employees, customers and other assets, by ensuring constant monitoring, reviewing, and improving of its Continuity Framework.
The main building blocks of the business continuity functions are:
Establish an appropriate internal and external communications protocol
Be specific regarding the immediate steps that are to be taken during a disruption
Be flexible to respond to unanticipated threat and changing internal and external conditions
Focus on the impact of events that could potentially disrupt operations
Be developed-based on stated assumptions and an analysis of interdependencies and
Be effective in minimising consequences through implementation of appropriate mitigation strategies
1
2
3
4
5
6
Due emphasis is laid on regular training for diligent adherence to established policies and procedures. Drills are also performed on a regular basis to identify gaps and areas for improvement as well as to determine the effectiveness of response and recovery strategies of the Bank.
Compliance Risk
The Bank continuously monitors development in the legal and regulatory environment and accommodates relevant changes in its governance and way of doing business. The Bank has an independent Regulatory Compliance Team which assesses compliance risk and also manages the risk of breaches and sanctions relating to Anti-Money Laundering (AML) and Combatting the Financing of Terrorism (CFT). The Bank Regulatory Compliance Team acts as a contact point with the different entities and jurisdictions, and delivers timely advice in relation to compliance queries.
108 ANNUAL REPORT 2018
SBM BANK (MAURITIUS) LTD

As a proactive measure, the method of doing compliance review was revisited gradually in 2017. A risk-based approach was adopted whereby compliance check was being carried out prior to the on-boarding of customers, especially for local corporate, Global Businesses, SMEs and foreign customers – both individuals and companies. During 2018, an on-boarding team comprised of Senior Officers was set up to review, assess and approve the onboarding of specific clients. This system mitigates the regulatory and reputational risks the Bank could have faced .
The Bank’s Policy on AML/CFT has been amended and aligned with the revised Guidance Notes on AML/CFT issued by the Bank of Mauritius and as required by local authorities in our countries of operations. This alignment ensures that there is no gap in the Bank’s policy which avoids the Bank facing regulatory actions from the local regulator or legal actions from other legal authorities. The AML Compliance function is also equipped with specialised transaction monitoring and screening software in order to identify suspicious transactions and protect the Bank against potential money laundering or terrorist financing risks.
Regular trainings especially on AML/CFT are dispensed to staff members to strengthen skills, knowledge and increase the awareness level of employees in respect of their roles and obligations. Staff members then have to undergo a written test. This process ensures that our staffs are up to date with the regulatory requirements and that they operate in line with the requirements of the Regulator.
The Complaints cell reports to the Compliance function since June 2017. Risk and Compliance Governance has been reviewed to incorporate the Complaints cell of the Bank. This change ensures the independence of the Complaints function and that non-compliance issues are promptly identified and addressed. All the complaints received are reported to the Corporate Governance & Conduct Review Committee.
The Compliance function is equipped with specialised software which allows enhanced monitoring of transactions to combat money laundering and financing of terrorism.
Fraud Risk
All employees and directors within the Bank are expected to act with integrity at all times to safeguard the Bank’s reputation and protect customers and company resources.
The Bank has a Board-approved Fraud Management Policy which is comprised of four major pillars – Deterrence, Detection, Mitigation and Response to fraud.
The Bank operates within the following key guiding principles:
> Zero tolerance towards fraud
> Stringent control procedures
> Timely disclosure of fraudulent activities
> Training and awareness programme
> Whistleblowing, and
> Human resource policy including code of ethics and business conduct, and conflict of interest.
In addition, the Mauritius Operations have a Proactive Risk Management Team involved in the card issuing and acquiring business, which monitors card transactions on a 24/7 basis.
Reputational Risk
Reputational risk is the risk that the Bank’s reputation is damaged by one or more reputation events, as reflected, among others, in negative publicity about business practices, conducts or financial conditions of its various entities. Such negative publicity, whether true or not, may impair public and investor confidence in the Bank, resulting in costly litigation, or lead to a decline in its customer base, business, revenue or market value. The Bank closely and continuously assesses and monitors reputational risk and reports to the Risk Management Committee on a quarterly basis.
Dedicated complaints handling teams within each entity remain alert and sensitive to customer complaints, and ensure that all complaints are treated with sincerity, confidentiality and fairness. Furthermore, each banking entity has a Complaints Committee – comprised of Senior Executives – that meets on a regularly basis to ensure appropriate actions are taken to address the complaints. A report on the complaints is submitted on a quarterly basis to the Corporate Governance and Conduct Review Committee.
109ANNUAL REPORT 2018
SBM BANK (MAURITIUS) LTD
RISK MANAGEMENT REPORT (CONT’D)
Capital Management SBM Bank maintains an actively managed capital base to:
> ensure that the Bank keeps, at any time, even in stress scenario, a capital adequacy ratio in conformity with the limits set under the regulatory framework
> Uphold creditor, investor and market confidence; and
> Sustain the future development of the business
The Bank uses, among other measures, the rules and ratios established by the Basel Committee on Banking Supervision as adopted by the Bank of Mauritius to monitor its capital and like all previous years, SBM Bank has duly complied with all its externally imposed capital requirements for the financial year 2018.
There is a close monitoring of capital and leverage ratios to ensure that the Bank meets current and future regulatory requirements. SBM also uses the Internal Capital Adequacy Assessment Process (ICAAP) framework as per the Guideline on Supervisory Review Process issued by the Bank of Mauritius in April 2010 to work out comprehensive stress testing analysis to gauge whether the Bank has sufficient level of capital under various adverse scenarios.
Regulatory Capital Requirement
SBM Bank (Mauritius) Ltd is subject to capital adequacy rules issued by the Bank of Mauritius. These standards and rules are largely consistent with international standards set by the Basel Committee on Banking Supervision (BCBS). Regulators require banks to hold a minimum level of qualifying capital under Pillar 1 of the Basel III framework.
To determine the capital requirement, SBM adheres to the BOM Guideline on Scope of Application of Basel III and Eligible Capital, which came into effect as from July 2014. To manage its credit and market risk exposures, it uses the Basel II Standardised Approach while the Alternative Standardised Approach is used for Operational Risk.
SBM has to abide to additional capital requirement prescribed by BOM in respect of:
> Capital Conservation Buffer (CCB) which is being implemented in a phased manner since 1st January 2017 in line with the Basel III framework and which will contribute towards strengthening banks’ capital against shocks. CCB increases by 0.625% per year until it reaches 2.5% of risk weighted assets on January 01, 2020.
> Domestic Systemically Important Bank (D-SIB) - SBM remains qualified as a D-SIB, which imposes on it an additional buffer of 1.125% over and above the benchmark of 11.25% for non D-SIB banks. This capital surcharge is subject to change based on BOM yearly assessment of June figures. D-SIBs are banks whose failure could have an impact on the domestic economy. SBM complies with the BOM guideline for Dealing with Domestic-Systemically Important Banks.
Minimum regulatory ratios applicable to SBM Jan 2018 Jan 2019 Jan 2020
Minimum CET 1 CAR 6.500% 6.500% 6.500%
Minimum Tier 1 CAR 8.000% 8.000% 8.000%
Capital Conservation Buffer (CCB) 1.250% 1.875% 2.500%
DSIB Buffer - Minimum additional loss absorbency 1.125% 1.500% 1.500%
Minimum CET 1 CAR plus CCB + D-SIB 8.875% 9.875% 10.500%
Minimum Tier 1 CAR plus CCB + D-SIB 10.375% 11.375% 12.000%
Minimum Total CAR (Tier 1 + Tier 2) + CCB + D-SIB 12.375% 13.375% 14.000%
110 ANNUAL REPORT 2018
SBM BANK (MAURITIUS) LTD
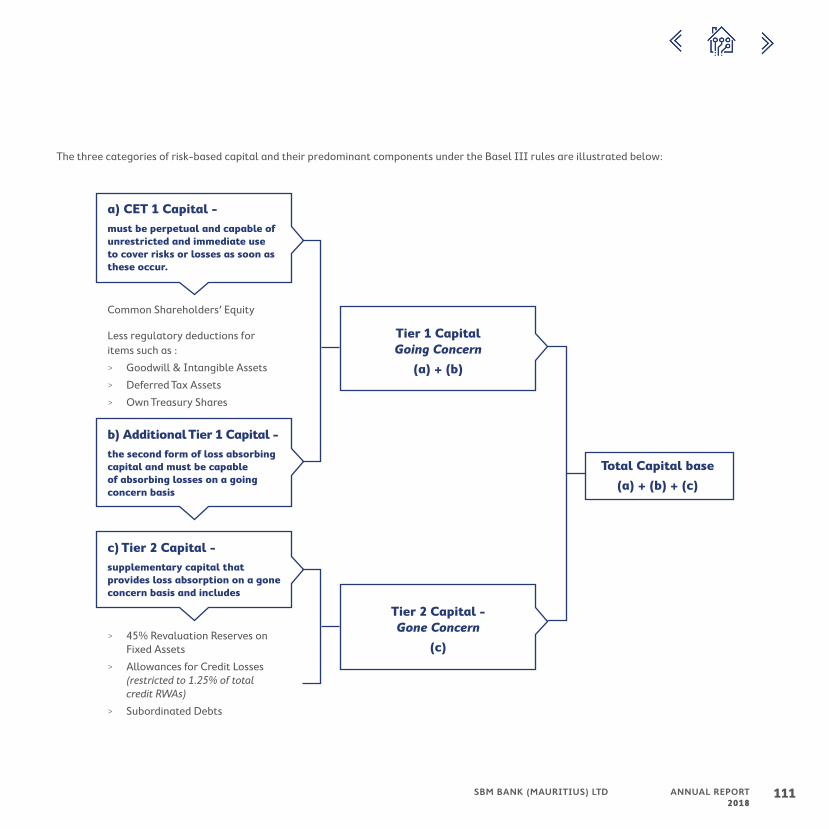
The three categories of risk-based capital and their predominant components under the Basel III rules are illustrated below:
Common Shareholders’ Equity
Less regulatory deductions for items such as :
> Goodwill & Intangible Assets
> Deferred Tax Assets
> Own Treasury Shares
a) CET 1 Capital -
b) Additional Tier 1 Capital -
c) Tier 2 Capital -
must be perpetual and capable of unrestricted and immediate use to cover risks or losses as soon as these occur.
the second form of loss absorbing capital and must be capable of absorbing losses on a going concern basis
supplementary capital that provides loss absorption on a gone concern basis and includes
Tier 1 Capital Going Concern
(a) + (b)
> 45% Revaluation Reserves on Fixed Assets
> Allowances for Credit Losses (restricted to 1.25% of total credit RWAs)
> Subordinated Debts
Tier 2 Capital - Gone Concern
(c)
Total Capital base
(a) + (b) + (c)
111ANNUAL REPORT 2018
SBM BANK (MAURITIUS) LTD

RISK MANAGEMENT REPORT (CONT’D)
Performance of SBM Bank (Mauritius) Ltd
In the last quarter of 2018, SBMBI (ex foreign branch) was deconsolidated from SBM Bank (Mauritius) Ltd and became a Wholly Owned Subsidiary (WOS) of SBM Holdings Ltd. Prior SBMBI becoming a WOS, its capital was being deducted from SBMBM in the computation of Capital Base for previous years as per BOM Guideline on Scope of Application and Eligible Capital satisfying criteria significant investment in the capital of banking entity.
As at December 2018, SBMBM’s Tier 1 capital position increased to MUR13,421 million from MUR 11,793 million as at December 2017. Tier 1 Capital Adequacy Ratio (Tier 1 CAR) improved from 11.24% as at December 2017 to 13.49% as at December 2018. Capital Adequacy ratio stood at 15.11% as at December 2018.
The table below details the composition of the regulatory capital of the Bank along with a summary of the capital requirement for credit, market and operational risk as at 31 December 2016, 2017 and 2018.
Note : Following deconsolidation of Indian Operations (ex foreign branch) from SBMBM in 2018, the 3 years figures stated below are for Mauritius Operations only.
112 ANNUAL REPORT 2018
SBM BANK (MAURITIUS) LTD

Year ended 31 December 2018 2017 2016
Figures in MUR million
Capital Base
Common Equity Tier 1 Capital (CET 1)
Share Capital 310 310 310
Capital Contribution 11,044 9,063 8,063
Statutory Reserves 310 310 310
Retained Earnings 4,815 8,487 6,136
Accumulated other Comprehensive Income and other disclosed Reserves (95) (19) (25)
CET 1: Regulatory Adjustments
Other Intangible Assets (2,963) (3,423) (3,509)
Deferred Tax - (53)
Deducting Investment in Indian Ops (2,936) (2,936)
Common Equity Tier 1 Capital (CET 1) 13,421 11,793 8,296
Additional Tier 1 (AT 1) - - -
Tier 1 capital (T1 = CET1 + AT1) 13,421 11,793 8,296
Tier 2 Capital
Other Reserves (45% of surplus arising from Revaluation of land & Buildings) 486 503 519
Portfolio Provision 1,129 1,170 948
Tier 2 Capital 1,615 1,673 1,467
Total Capital Base 15,036 13,466 9,763
RISK WEIGHTED ASSETS (RWAs)
Credit risk 90,308 97,151 69,955
On-balance sheet assets 82,765 88,434 66,755
Off-balance sheet exposures 7,543 8,718 3,199
Market risk 777 768 217
Operational risk 8,434 7,014 5,916
TOTAL RWAs 99,518 104,933 76,088
CAPITAL ADEQUACY RATIO (%) 15.11 12.83 12.83
of which Tier 1 Ratio 13.49 11.24 10.90
113ANNUAL REPORT 2018
SBM BANK (MAURITIUS) LTD

RISK MANAGEMENT REPORT (CONT’D)
Risk Weighted Assets
Risk Weighted Assets are the Bank’s total assets and off-balance sheet exposures, weighted according to risk and they are used to determine the minimum amount of regulatory capital that must be held by banks to maintain their solvency. For SBM, the RWAs are computed based on the BOM Guideline on Standardised Approach to Credit Risk, Guideline on Measurement and Management of Market Risk and Guideline on Alternative Standardised Approach for Operational Risk.
Capital Adequacy Ratio of the Bank stood at 15.1% as at end of December 18 with Capital Base growing by MUR 1.57 billion and risk weighted assets decreasing by Rs5.41 billion following SBM investing relatively more in high quality liquid assets with lower risk weight than previous year. Tier I Capital of the Bank has increased by 13.8% from MUR 11,793 million to MUR 13,421 million as at December 2018. The increase is primarily from capital contribution of MUR 1.9 billion from the Holding company coupled with retained profit after tax earned during the financial year less dividend payment. Both CET 1 ratio and Tier 1 ratio stood at 13.5% well above the minimum regulatory requirement of 8.875 % and 10.375% respectively.
Total Risk Weighted Assets as at 31 December 2018 was MUR 99.5 billion versus capital base of MUR 15.0 billion. Analysis by risk type:
OperationalRisk
Credit Risk
Market Risk
02
02
01
01
03
03
8.5%1.7%
89.8%
OperationalRisk
Credit Risk
Market Risk
02
02
01
01
03
03
6.7%2.5%
90.8%
20182017
114 ANNUAL REPORT 2018
SBM BANK (MAURITIUS) LTD

a) Credit Risk
The calculation of regulatory capital for credit risk for both on-balance sheet and off-balance sheet exposures is based on risk weighting and the net counterparty exposures after recognising a limited set of qualifying collateral. The risk weighting as prescribed by BOM in their Guideline on Standardised Approach to Credit Risk, is based on the exposure characteristics. Moreover, banks are authorized by the Central Bank to use the below External Credit Assessment Institutions (ECAIs) for risk weighting exposures related to advances, placements and investments:
> Standard and Poor’s Ratings Services
> Moody’s Investors Service
> Fitch Ratings
> Credit Analysis and Research Limited (CARE)
The following tables provide Risk Weighted Assets for the Bank after credit risk mitigation (CRM) for both on-balance sheet and off-balance sheet assets:
Risk-Weighted on-balance sheet assets
Year ended 31 December 2018 2017 2016
Figures in MUR million Amount Weight %Weighted
AssetsWeighted
AssetsWeighted
Assets
Cash Items 2,679 0-20 0.6 0.2 0.7
Claims on Sovereigns 40,986 0-100 2,520 3,055 1,030
Claims on Central banks 25,995 0-50 482 772 365
Claims on Banks 19,764 20-150 7,784 12,323 9,092
Claims on Non-Central Government Public Sector Entities 139 50-100 86 143 375
Claims on Corporates 40,365 0-100 39,922 46,341 33,848
Claims included in the Regulatory Retail Portfolio 7,968 0-75 5,976 5,116 6,153
Claims secured by Residential Property 22,035 35-125 8,688 8,054 5,925
Claims secured by Commercial Real Estate 4,572 100-125 4,641 2,988 3,456
Past due claims 4,876 50-150 5,747 1,199 1,635
Other Assets 6,918 100 6,918 8,443 4,877Total On Balance Sheet RWAs 176,299 82,765 88,434 66,755
Risk Weighted Non Market related Off-Balance Sheet AssetsYear ended 31 December 2018 2017 2016
Figures in MUR millionNominal Amount
Credit Conversion
Factor
Credit Equivalent
AmountWeight
(%)Weighted
AssetsWeighted
AssetsWeighted
Assets
Direct Credit Substitutes 4,519 100 4,519 0-100 4,448 3,174 1,070
Transaction-Related Contingent items 3,230 50 1,615 0-100 1,442 1,923 1,524
Trade-Related Contingencies 458 20-100 195 0-100 190 405 151
Other Commitments 9,071 0-50 585 35-100 504 1,371 358Total Off Balance Sheet RWAs 17,278 6,914 6,584 6,874 3,104
115ANNUAL REPORT 2018
SBM BANK (MAURITIUS) LTD

RISK MANAGEMENT REPORT (CONT’D)
b) Market Related Risk
Market risk is the risk of loss from changes in market conditions including interest rates, equity prices, foreign exchange rates and commodity prices, the correlations between them and their levels of volatility.
SBM adheres to the Standardised Approach as outlined by BOM in its Guideline on Measurement and Management of Market Risk for computation of capital on market risk. As per this methodology, which is closely aligned with Basel II Standardised Measurement Method, a banking institution is required to hold additional capital whenever its overall position in trading book activities exceeds 5% or more of its total assets. A banking institution is encouraged to hold a capital buffer that adequately covers the interest rate risk exposures arising from non-trading activities. During the year under review, SBM substantially grew its derivatives book on behalf of its customers and positions were partly hedged within internal Board approved limits.
Table below provides figures for the RWAs market related off-balance sheet assets:
Market related Off-balance Sheet RWAs
Year ended 31 December 2018 2017 2016
Figures in MUR million
Notional principal
amount
Credit conversion factor (%)
Potential future
exposure Current
exposure
Credit equivalent
amountWeighted
Assets Weighted
AssetsWeighted
Assets
Interest Rate contracts 14,152 0 - 1.5 97 19 116 56 22 47
Foreign Exchange contracts 32,442 1 - 5 580 124 703 445 1,722 48
Equity contracts 49 8 4 0 4 2
Other commodity contracts 3,781 10 - 12 433 56 489 311
Credit derivative contracts 1,177 10 - 20 235 0 235 144 100
Total Market RWAs 51,601 1,350 199 1,548 959 1,844 96
The total market-related off balance sheet RWA decreased from MUR 1.8 billion as at December 2017 to MUR 959 million as at December 2018 primarily due to lower foreign exposures.
The following table provides the comparative figures for the aggregate net open foreign exchange position for the Bank:
Year ended 31 December 2018 2017 2016
Figures in MUR millionAggregate net open foreign exchange position 370 326 217
116 ANNUAL REPORT 2018
SBM BANK (MAURITIUS) LTD
c) Operational Risk Capital
Operational risk is the risk of loss, whether direct or indirect, to which the Bank is exposed due to external events, human error, or the inadequacy or failure of processes, procedures, systems or controls. SBM has adopted the Alternative Standardised Approach for calculating operational risk capital as per the BOM Guideline on Operational Risk.
In line with increasing business volumes, capital charge for Operational Risk is increasing year on year.
The table below sets out, at the date indicated, the operational risk capital charge for SBM Bank:
Year ended 31 December 2018 2017 2016
Figures in MUR millionCapital charge for Operational Risk 843 701 592
Leverage Ratio
The leverage ratio represents a non-risk-adjusted capital requirement to function as a further “backstop” measure for risk-based capital. The non-risk-based leverage measure is designed to complement the Basel III risk-based capital framework.
As at 31 December 2018, the leverage ratio for the Bank stood at 7.07% that is, largely above the Basel Committee on Banking Supervision recommended minimum of 3%. As at date, there is no regulatory requirement to compute the leverage ratio.
Looking Ahead
SBM is fully committed to maintain sound capitalization levels. It continuously monitors and adjusts its overall capital demand and supply in an effort to achieve an appropriate balance of economic and regulatory considerations at all times and from all perspectives.
117ANNUAL REPORT 2018
SBM BANK (MAURITIUS) LTD

Statement of Directors’ ResponsibilityFOR THE YEAR ENDED 31 DECEMBER 2018
The Board of Directors of SBM Bank (Mauritius) Ltd is appointed to act on behalf of its sole shareholder, SBM (Bank) Holdings Ltd. A professional management team is appointed to run the business of SBM Bank (Mauritius) Ltd (the ‘Bank’) under the oversight of the Board of Directors. The Board is directly accountable to the shareholder and each year the Bank holds an Annual Meeting at which the non-executive directors submit themselves for election / re-election as laid out in the Constitution and the National Code of Corporate Governance for Mauritius.
The Board of Directors’ key purpose is to ensure the Bank’s prosperity by collectively directing its affairs via delegated authority, whilst meeting the appropriate interests of its stakeholders. In addition to business and financial issues, the Board of Directors is also called upon to deal with the challenges and issues relating to corporate governance, corporate social responsibility and corporate ethics. The Board must ensure that appropriate internal controls and risk management processes are set in place for the proper running of the business.
Company law requires the directors to prepare Financial Statements for each financial year, which give a true and fair view of the state of affairs of the Bank. The external auditors are responsible for reporting on whether the Financial Statements are fairly presented. The Bank’s external auditors, Ernst & Young, have full and free access to the Board of Directors and its committees to discuss the audit matters arising therefrom, such as their observations on the fairness of financial reporting and the adequacy of internal controls.
The Risk Management Committee has the responsibility to set the risk strategy, advise the Board on risk issues and monitor the risk management processes. Amongst others, it sets and reviews policies for the management of risks particularly in the areas of credit, market, interest, liquidity, operational and technological risks including legal, reputational and strategic risks, ensuring that adequate procedures and limits as well as appropriate methodologies and systems are in place.
The Risk Management section contained in the Annual Report provides further details on the processes for risk management and internal controls.
The Audit Committee critically reviews the financial and interim reports, prospectus and other financial circulars/ documents and is responsible, amongst others, for reviewing the systems of internal controls to ascertain their adequacy and effectiveness. It reviews and discusses any material weaknesses identified in controls and deficiencies in system, and if necessary, recommends additional procedures to enhance the system of internal controls.
An internal audit function, whose Head also reports directly to the Audit Committee, is in place to ensure that the Bank’s operations are conducted according to the established practices by providing an independent and objective assurance, and by advising on best practices. The Audit Committee reviews reports from internal and external auditors and monitors relevant actions taken by management.
The directors confirm, to the best of their knowledge and belief, that:
(i) an effective system of internal controls and robust risk management practices, including compliance, has been put in place to safeguard the assets and for the prevention and detection of fraud and other irregularities;
(ii) the entity has neither the intention nor the need to liquidate or curtail materially the scale of its operations in the foreseeable future;
(iii) the Financial Statements give a true and fair view of the state of affairs of the Bank for the year ended 31 December 2018 and have been prepared in accordance with the International Financial Reporting Standards and the requirements of the Banking Act 2004, Companies Act 2001 and the Financial Reporting Act 2004 and applicable Bank of Mauritius (BOM) guidelines and appropriate accounting policies. These were supported by reasonable and prudent judgments, and estimates have been used consistently;
(iv) they continuously review the implications of corporate governance best practices and are of the opinion that the Bank complies with the requirement of the National Code of Corporate Governance for Mauritius in all material aspects; and
(v) proper accounting records have been kept, in accordance with the requirements of the Companies Act 2001 and are free from misstatements.
The external auditors, Ernst & Young have independently given their opinion in their audit report as set out on pages 121 to 125.
Parvataneni Venkateswara Rao Ishwar Anoopum Gaya Nayen Koomar Ballah
Acting Chief Executive Chairman, Audit Committee Chairman, G.O.S.K.
31 March 2019
SBM BANK (MAURITIUS) LTD118 ANNUAL REPORT 2018

Statement of Management’s Responsibility for Financial ReportingFOR THE YEAR ENDED 31 DECEMBER 2018
The financial statements of the Bank have been prepared by management, which is responsible for their integrity, consistency, objectivity and reliability. International Financial Reporting Standards, as well as the requirements of the Banking Act 2004 and the guidelines issued thereunder, have been applied and management has exercised its judgement and made best estimates where deemed necessary.
The Bank has designed and maintained its accounting systems, related internal controls and supporting procedures, to provide reasonable assurance that financial records are complete and accurate and that assets are safeguarded against loss from unauthorised use or disposal. These supporting procedures include careful selection and training of qualified staff, the implementation of organisation and governance structures providing a well-defined division of responsibilities, authorisation levels and accountability for performance, and the communication of the Bank’s policies, procedures manuals and guidelines of the Bank of Mauritius throughout the Bank.
The Bank’s Board of Directors, acting in part through the Audit Committee, Corporate Governance and Conduct Review Committee and Risk Management Committee, which are comprised mostly of independent directors, oversees management’s responsibility for financial reporting, internal controls, assessment and control of major risk areas, and assessment of significant and related party transactions.
The Bank’s internal auditor, who has full and free access to the Audit Committee, conducts a well-designed program of internal audits. In addition, the Bank’s compliance function maintains policies, procedures and programs directed at ensuring compliance with regulatory requirements.
Pursuant to the provisions of the Banking Act 2004, the Bank of Mauritius makes such examination and inquiry into the operations and affairs of the Bank as it deems necessary.
The Bank’s external auditors, Ernst & Young, have full and free access to the Board of Directors and its committees to discuss the audit and matters arising therefrom, such as their observations on the fairness of financial reporting and the adequacy of internal controls.
Parvataneni Venkateswara Rao Ishwar Anoopum Gaya Nayen Koomar Ballah
Acting Chief Executive Chairman, Audit Committee Chairman, G.O.S.K.
31 March 2019
119ANNUAL REPORT 2018
SBM BANK (MAURITIUS) LTD

We certify to the best of our knowledge and belief that the Bank has filed with the Registrar of Companies all such returns as are required of the Bank under the Companies Act 2001 in terms of Section 166 (d).
Preshnee Ramchurn
Company Secretary
31 March 2019
Report from the Company SecretaryFOR THE YEAR ENDED 31 DECEMBER 2018
SBM BANK (MAURITIUS) LTD120 ANNUAL REPORT 2018
Independent Auditor’s ReportTO THE MEMBERS OF SBM BANK (MAURITIUS) LTD
REPORT ON THE AUDIT OF THE FINANCIAL STATEMENTS
Opinion
We have audited the financial statements of SBM Bank (Mauritius) Ltd (the “Bank”) set out on pages 126 to 221 which comprise the statement of financial position as at 31 December 2018, and the statement of profit or loss and other comprehensive income, statement of changes in equity and statement of cash flows for the year then ended, and notes to the financial statements, including significant accounting policies.
In our opinion, the financial statements give a true and fair view of, the financial position of the SBM Bank (Mauritius) Ltd as at 31 December 2018, and of its financial performance and its cash flows for the year then ended in accordance with International Financial Reporting Standards and comply with the Companies Act 2001, Banking Act 2004 and Financial Reporting Act 2004.
Basis for Opinion
We conducted our audit in accordance with International Standards on Auditing (ISAs). Our responsibilities under those standards are further described in the Auditor’s Responsibilities for the Audit of the Financial Statements section of our report. We are independent of the Bank in accordance with the International Ethics Standards Board for Accountants’ Code of Ethics for Professional Accountants (IESBA Code), and we have fulfilled our other ethical responsibilities in accordance with the IESBA Code. We believe that the audit evidence we have obtained is sufficient and appropriate to provide a basis for our opinion.
Key Audit Matters
Key audit matters are those matters that, in our professional judgement, were of most significance in our audit of the financial statements of the current period. These matters were addressed in the context of our audit of the financial statements as a whole, and in forming our opinion thereon, and we do not provide a separate opinion on these matters. For each matter below, our description of how our audit addressed the matter is provided in that context.
We have fulfilled the responsibilities described in the Auditor’s responsibilities for the audit of the financial statements section of our report, including in relation to these matters. Accordingly, our audit included the performance of procedures designed to respond to our assessment of the risks of material misstatement of the financial statements. The results of our audit procedures, including the procedures performed to address the matters below, provide the basis for our audit opinion on the accompanying financial statements.
121ANNUAL REPORT 2018
SBM BANK (MAURITIUS) LTD
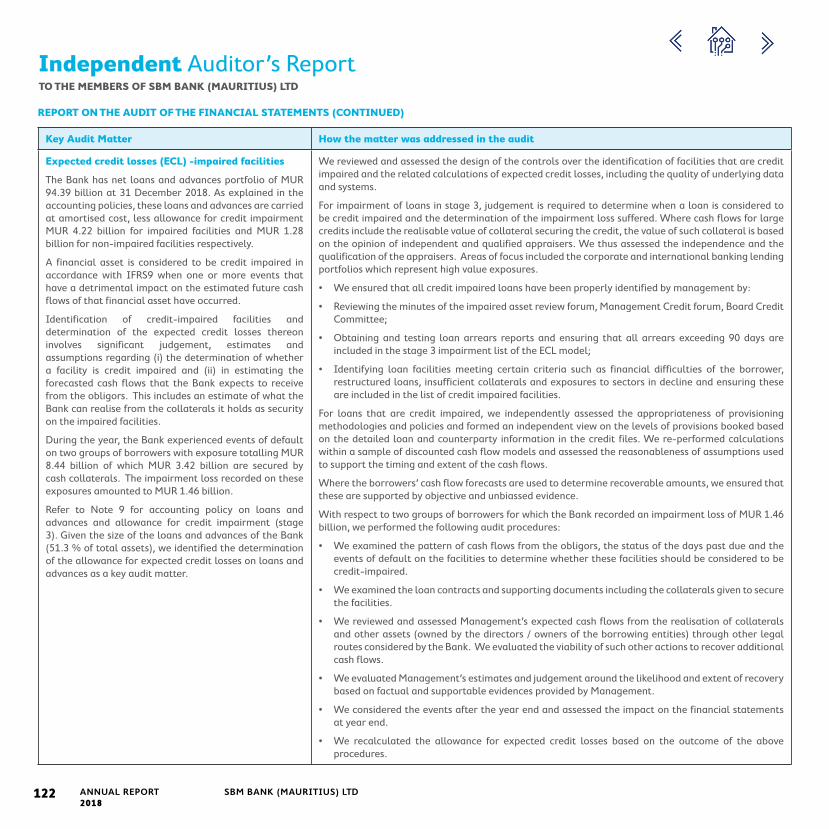
Independent Auditor’s ReportTO THE MEMBERS OF SBM BANK (MAURITIUS) LTD
REPORT ON THE AUDIT OF THE FINANCIAL STATEMENTS (CONTINUED)
Key Audit Matter How the matter was addressed in the audit
Expected credit losses (ECL) -impaired facilities
The Bank has net loans and advances portfolio of MUR 94.39 billion at 31 December 2018. As explained in the accounting policies, these loans and advances are carried at amortised cost, less allowance for credit impairment MUR 4.22 billion for impaired facilities and MUR 1.28 billion for non-impaired facilities respectively.
A financial asset is considered to be credit impaired in accordance with IFRS9 when one or more events that have a detrimental impact on the estimated future cash flows of that financial asset have occurred.
Identification of credit-impaired facilities and determination of the expected credit losses thereon involves significant judgement, estimates and assumptions regarding (i) the determination of whether a facility is credit impaired and (ii) in estimating the forecasted cash flows that the Bank expects to receive from the obligors. This includes an estimate of what the Bank can realise from the collaterals it holds as security on the impaired facilities.
During the year, the Bank experienced events of default on two groups of borrowers with exposure totalling MUR 8.44 billion of which MUR 3.42 billion are secured by cash collaterals. The impairment loss recorded on these exposures amounted to MUR 1.46 billion.
Refer to Note 9 for accounting policy on loans and advances and allowance for credit impairment (stage 3). Given the size of the loans and advances of the Bank (51.3 % of total assets), we identified the determination of the allowance for expected credit losses on loans and advances as a key audit matter.
We reviewed and assessed the design of the controls over the identification of facilities that are credit impaired and the related calculations of expected credit losses, including the quality of underlying data and systems.
For impairment of loans in stage 3, judgement is required to determine when a loan is considered to be credit impaired and the determination of the impairment loss suffered. Where cash flows for large credits include the realisable value of collateral securing the credit, the value of such collateral is based on the opinion of independent and qualified appraisers. We thus assessed the independence and the qualification of the appraisers. Areas of focus included the corporate and international banking lending portfolios which represent high value exposures.
• We ensured that all credit impaired loans have been properly identified by management by:
• Reviewing the minutes of the impaired asset review forum, Management Credit forum, Board Credit Committee;
• Obtaining and testing loan arrears reports and ensuring that all arrears exceeding 90 days are included in the stage 3 impairment list of the ECL model;
• Identifying loan facilities meeting certain criteria such as financial difficulties of the borrower, restructured loans, insufficient collaterals and exposures to sectors in decline and ensuring these are included in the list of credit impaired facilities.
For loans that are credit impaired, we independently assessed the appropriateness of provisioning methodologies and policies and formed an independent view on the levels of provisions booked based on the detailed loan and counterparty information in the credit files. We re-performed calculations within a sample of discounted cash flow models and assessed the reasonableness of assumptions used to support the timing and extent of the cash flows.
Where the borrowers’ cash flow forecasts are used to determine recoverable amounts, we ensured that these are supported by objective and unbiassed evidence.
With respect to two groups of borrowers for which the Bank recorded an impairment loss of MUR 1.46 billion, we performed the following audit procedures:
• We examined the pattern of cash flows from the obligors, the status of the days past due and the events of default on the facilities to determine whether these facilities should be considered to be credit-impaired.
• We examined the loan contracts and supporting documents including the collaterals given to secure the facilities.
• We reviewed and assessed Management’s expected cash flows from the realisation of collaterals and other assets (owned by the directors / owners of the borrowing entities) through other legal routes considered by the Bank. We evaluated the viability of such other actions to recover additional cash flows.
• We evaluated Management’s estimates and judgement around the likelihood and extent of recovery based on factual and supportable evidences provided by Management.
• We considered the events after the year end and assessed the impact on the financial statements at year end.
• We recalculated the allowance for expected credit losses based on the outcome of the above procedures.
SBM BANK (MAURITIUS) LTD122 ANNUAL REPORT 2018

Independent Auditor’s ReportTO THE MEMBERS OF SBM BANK (MAURITIUS) LTD
REPORT ON THE AUDIT OF THE FINANCIAL STATEMENTS (CONTINUED)
Key Audit Matter How the matter was addressed in the audit
Expected credit losses (ECL) – facilities which are not credit impaired
The determination of ECL on loans and advances which are not credit impaired involves the highest level of management judgement, thus requiring greater audit attention. Specific areas of judgement and estimation uncertainty include:
• Identification of significant increase in credit risk (SICR), and in particular the selection of criteria to identify a SICR. These criteria are highly judgemental and can materially impact the ECL recognised for certain portfolios where the life of the facilities is greater than 12 months;
• Complexity of the ECL model involving a number of critical assumptions in the determination of probabilities of default (PD), loss given default (LGD) and Exposure at default (EAD).
• Use of forward looking information to determine the likelihood of future losses being incurred.
• Qualitative adjustments made to model driven ECL results raised to address model limitations, emerging risks and trends in underlying portfolios which are inherently judgemental.
• Accuracy and adequacy of the financial statement disclosures
IFRS 9 was implemented by the Bank on 1 January 2018. This new standard requires the Bank to recognise expected credit losses (ECL) on financial instruments which involves significant judgement and estimates to be made by the Bank.
The carrying value of financial instruments within the scope of IFRS 9 may be materially misstated if judgements or estimates made by the Bank are inappropriate.
For stage 1 and stage 2 loans, we assessed the appropriateness of the model used including the inputs and assumptions by performing the following procedures:
• Reviewing the methodology adopted by the Bank for calculation of ECL and in particular the segmentation of loans in appropriate portfolios reflecting different risk factors. Our review also includes an assessment of the design of the models used for determination of PD, LGD and EAD for different types of loans including inter-alia terms loans, overdraft facilities, credit cards, guarantees and other off-balance sheet exposures;
• Checking the adequacy and quality of the data used for the calculation of PD, LGD and EAD;
• Assessing the key assumptions used in PD, LGD and EAD models and ensure such assumptions reflect the actual behaviours of the credit facilities;
• Reviewing the criteria for staging of credit exposures and ensure these are in line with the requirements of IFRS 9 including any backstops used in the methodology;
• Reviewing the minutes of Watchlist Review Committee and ensure proper classification to stage 2 is made for all clients on watchlist;
• Checking the accuracy of critical data elements input into the system used for credit grading and the approval of credit facilities;
• Review of the PD and LGD calculations including the incorporation of forecast macro-economic information by our data modelling specialists;
• Tested the accuracy and completeness of the ECL model by reperformance and focussing on exception reports.
• We assessed the adequacy and appropriateness of disclosures for compliance with the accounting standards including disclosure of transition from IAS 39.
Responsibilities of the Directors for the Financial Statements
The directors are responsible for the preparation and fair presentation of the financial statements in accordance with International Financial Reporting Standards and the requirements of the Companies Act 2001, Banking Act 2004 and Financial Reporting Act 2004 and for such internal control as the directors determine is necessary to enable the preparation of financial statements that are free from material misstatement, whether due to fraud or error.
In preparing the financial statements, the directors are responsible for assessing the Bank’s ability to continue as a going concern, disclosing, as applicable, matters related to going concern and using the going concern basis of accounting unless the directors either intends to liquidate the Bank or to cease operations, or have no realistic alternative but to do so.
123ANNUAL REPORT 2018
SBM BANK (MAURITIUS) LTD
Independent Auditor’s ReportTO THE MEMBERS OF SBM BANK (MAURITIUS) LTD
REPORT ON THE AUDIT OF THE FINANCIAL STATEMENTS (CONTINUED)
Other Information
The directors are responsible for the other information. The other information comprises the Statement of Directors’ responsibility, Report from the Company Secretary as required by the Companies Act 2001, Statement of Management’s responsibility for financial reporting, Management Discussion and Analysis, Supplementary information as required by Bank of Mauritius and Corporate Governance Report but does not include the financial statements and our auditor’s report thereon.
Our opinion on the financial statements does not cover the other information and we do not express any form of assurance conclusion thereon.
In connection with our audit of the financial statements, our responsibility is to read the other information identified above (other than the Corporate Governance Report) when it becomes available and, in doing so, consider whether the other information is materially inconsistent with the financial statements or our knowledge obtained in the audit, or otherwise appears to be materially misstated.
Corporate Governance reportThe Directors are responsible for preparing the Corporate Governance Report. Our responsibility under the Financial Reporting Act is to report on the compliance with the Code of Corporate Governance (‘’the Code’’) disclosed in the annual report and assess the explanations given for non-compliance with any requirement of the Code. From our assessment of the disclosures made on corporate governance in the annual report, the Bank has, pursuant to section 75 of the Financial Reporting Act, complied with the requirements of the Code.
Auditor’s Responsibilities for the Audit of the Financial Statements
Our objectives are to obtain reasonable assurance about whether the financial statements as a whole are free from material misstatement, whether due to fraud or error, and to issue an auditor’s report that includes our opinion. Reasonable assurance is a high level of assurance, but is not a guarantee that an audit conducted in accordance with ISAs will always detect a material misstatement when it exists. Misstatements can arise from fraud or error and are considered material if, individually or in the aggregate, they could reasonably be expected to influence the economic decisions of users taken on the basis of these financial statements.
As part of an audit in accordance with ISAs, we exercise professional judgement and maintain professional scepticism throughout the audit. We also:
Identify and assess the risks of material misstatement of the financial statements, whether due to fraud or error, design and perform audit procedures responsive to those risks, and obtain audit evidence that is sufficient and appropriate to provide a basis for our opinion. The risk of not detecting a material misstatement resulting from fraud is higher than for one resulting from error, as fraud may involve collusion, forgery, intentional omissions, misrepresentations, or the override of internal control.
Obtain an understanding of internal control relevant to the audit in order to design audit procedures that are appropriate in the circumstances, but not for the purpose of expressing an opinion on the effectiveness of the Bank’s internal control.
Evaluate the appropriateness of accounting policies used and the reasonableness of accounting estimates and related disclosures made by the directors.
Conclude on the appropriateness of the director’s use of the going concern basis of accounting and based on the audit evidence obtained, whether a material uncertainty exists related to events or conditions that may cast significant doubt on the Bank’s ability to continue as a going concern. If we conclude that a material uncertainty exists, we are required to draw attention in our auditor’s report to the related disclosures in the financial statements or, if such disclosures are inadequate, to modify our opinion. Our conclusions are based on the audit evidence obtained up to the date of our auditor’s report. However, future events or conditions may cause the Bank to cease to continue as a going concern.
Evaluate the overall presentation, structure and content of the financial statements, including the disclosures, and whether the financial statements represent the underlying transactions and events in a manner that achieves fair presentation.
We communicate with the directors regarding, among other matters, the planned scope and timing of the audit and significant audit findings, including any significant deficiencies in internal control that we identify during our audit.
Use of our report
This report is made solely to the Bank's member in accordance with Section 205 of the Companies Act 2001. Our audit work has been undertaken so that we might state to the Bank’s member those matters we are required to state to them in an auditor’s report and for no other purpose. To the fullest extent permitted by law, we do not accept or assume responsibility to anyone other than the Bank and the Bank's member, for our audit work, for this report, or for the opinions we have formed.
SBM BANK (MAURITIUS) LTD124 ANNUAL REPORT 2018

Independent Auditor’s ReportTO THE MEMBERS OF SBM BANK (MAURITIUS) LTD
REPORT ON OTHER LEGAL AND REGULATORY REQUIREMENTS
Companies Act 2001
We have no relationship with or interests in the Bank other than in our capacity as auditors, tax advisors and dealings in the ordinary course of business.
We have obtained all the information and explanations we have required.
In our opinion, proper accounting records have been kept by the Bank as far as it appears from our examination of those records.
Banking Act 2004
In our opinion, the financial statements have been prepared on a consistent basis and are complete, fair and properly drawn up and comply with the Banking Act 2004 and the regulations and guidelines of the Bank of Mauritius.
The explanations or information called for or given to us by the officers or agents of the Bank were satisfactory.
ERNST & YOUNG PATRICK NG TSEUNG, A.C.A.
Ebène, Mauritius Licensed by FRC
Date: 31 March 2019
125ANNUAL REPORT 2018
SBM BANK (MAURITIUS) LTD

Statement of Financial PositionAS AT 31 DECEMBER 2018
31 December 31 December 31 DecemberNotes 2018 2017 2016
MUR’ 000 MUR’ 000 MUR’ 000ASSETSCash and cash equivalents 6 11,211,712 15,620,778 9,423,941Mandatory balances with central banks 8,767,767 8,712,062 6,945,570Loans to and placements with banks 7 11,764,358 8,895,860 4,645,911Derivative financial instruments 8 762,855 1,356,774 165,997Loans and advances to non-bank customers 9 94,296,051 100,839,231 71,158,114Investment securities 10 50,934,309 37,150,731 34,410,974Equity investments 10 3,411 370 4,058Property and equipment 11 2,458,814 2,631,782 2,750,051Intangible assets 12 2,962,920 3,457,061 3,769,919Deferred tax assets - 95,461 215,320Other assets 13 823,653 923,892 600,752
Total assets 183,985,850 179,684,002 134,090,607
LIABILITIES Deposits from banks 15 796,117 739,926 2,711,364Deposits from non-bank customers 16 147,530,840 141,695,769 108,302,387Other borrowed funds 17 11,773,938 13,116,593 4,540,509Derivative financial instruments 8 758,642 1,334,584 182,406Current tax liabilities 474,487 105,869 358,908Deferred tax liabilities 18b 163,996 170,905 - Other liabilities 19 5,020,635 4,163,207 2,240,596
Total liabilities 166,518,655 161,326,853 118,336,170
SHAREHOLDER’S EQUITYStated capital 20 310,000 310,000 310,000Capital contribution 20 11,044,011 9,063,106 8,063,106Retained earnings 4,817,518 7,855,520 6,193,747Other reserves 38 1,295,666 1,128,523 1,187,584Total equity 17,467,195 18,357,149 15,754,437
Total equity and liabilities 183,985,850 179,684,002 134,090,607
Approved by the Board of Directors and authorised for issue on 31 March 2019.
Parvataneni Venkateswara Rao Ishwar Anoopum Gaya Nayen Koomar Ballah, G.O.S.K.Acting Chief Executive Chairman, Audit Committee Chairman
The notes on pages 131 to 221 form an integral part of these financial statements.
SBM BANK (MAURITIUS) LTD126 ANNUAL REPORT 2018

Statement of Profit or Loss FOR THE YEAR ENDED 31 DECEMBER 2018
Restated Restated31 December 31 December 31 December
Notes 2018 2017 2016MUR’ 000 MUR’ 000 MUR’ 000
Interest income 7,156,372 6,074,890 5,396,550Interest expense (1,665,006) (1,569,129) (1,361,267)
Net interest income 26 5,491,366 4,505,761 4,035,283
Fee and commission income 1,061,666 1,005,274 976,780Fee and commission expense (23,015) (22,396) (20,725)
Net fee and commission income 27 1,038,651 982,878 956,055
Other income
Profit arising from dealing in foreign currencies 679,738 431,483 489,976Net gain/(loss) from financial instruments 28 500,133 519,821 (24,831)Net gain on sale of securities 29 173,554 430,897 423,849Other operating income - 61 4,204
1,353,425 1,382,262 893,198Non-interest income 2,392,076 2,365,140 1,849,253
Operating income 7,883,442 6,870,901 5,884,536
Personnel expenses 30 (1,336,294) (1,363,396) (1,275,812)Depreciation of property and equipment (145,188) (149,163) (148,237)Amortisation of intangible assets (549,948) (493,091) (191,254)Other expenses 31 (703,303) (839,940) (829,031)
Non-interest expense (2,734,733) (2,845,590) (2,444,334)
Profit before credit loss expense 5,148,709 4,025,311 3,440,202
Credit loss expense on financial assets 32 (3,010,356) (228,024) (414,878)
Profit before income tax 2,138,353 3,797,287 3,025,324Tax expense 18a (676,988) (494,135) (632,160)
Profit for the year from continuing operations 1,461,365 3,303,152 2,393,164
Discontinued operationsLoss after tax for the period/year from discontinued operations 39 (221,374) (691,859) (184,552)Loss on distribution of dividend in specie 39 (685,838) - -
(907,212) (691,859) (184,552)Profit for the year 554,153 2,611,293 2,208,612
Comparatives have been restated in view of discontinued operations. Further disclosures are available in Note 39.
The notes on pages 131 to 221 form an integral part of these financial statements.
127ANNUAL REPORT 2018
SBM BANK (MAURITIUS) LTD

Statement of other Comprehensive IncomeFOR THE YEAR ENDED 31 DECEMBER 2018
Restated Restated31 December 31 December 31 December
2018 2017 2016MUR’ 000 MUR’ 000 MUR’ 000
Profit for the year 554,153 2,611,293 2,208,612
Other comprehensive income :
Items that will not be reclassified subsequently to profit or loss (net of deferred tax):Increase in revaluation of property - - 1,480Adjustment to revaluation reserve on disposal of property - - (190)Underprovision of deferred tax assets on revaluation of property in prior years - - (24,817)Remeasurement of defined benefit pension plan 14 & 18b (27,802) (32,881) 1,599
(27,802) (32,881) (21,928)
Items that may be reclassified subsequently to profit or loss:
Exchange differences on translation of foreign operations* 564,044 (28,403) (76,609)Available-for-sale investmentsMovement in fair value of available-for-sale investments - 182,180 233,005Fair value re-cycled on disposal of available-for-sale investments - (175,477) (187,436)Investment securities measured at FVTOCI (Debt instruments)Movement in fair value during the year (138,912) - - Fair value re-cycled on disposal 1,491 - - Loss allowance relating to debt instruments held at FVTOCI 26,415 - -
453,038 (21,700) (31,040)
Total other comprehensive income/(loss) 425,236 (54,581) (52,968)
Total comprehensive income for the year 979,389 2,556,712 2,155,644
* Out of this balance, MUR’000 124,096 arose as exchange differences on translation of the Indian Operations for the period ended 30 November 2018 and cummulative translation reserve arising on the discontinued Indian Operations have been recycled to the Statement of Profit or Loss (Refer to Note 39).
The notes on pages 131 to 221 form an integral part of these financial statements.
SBM BANK (MAURITIUS) LTD128 ANNUAL REPORT 2018

Statement of Changes in EquityFOR THE YEAR ENDED 31 DECEMBER 2018
NotesStated capital
Capital contribution
Retained earnings
Statutory reserve
Fair value reserve on financial
instruments recognised
in OCI
Property revaluation
reserve
Foreign currency
translation reserve
Total equity
MUR’ 000 MUR’ 000 MUR’ 000 MUR’ 000 MUR’ 000 MUR’ 000 MUR’ 000 MUR’ 000
At 01 January 2016 310,000 8,063,106 3,940,391 530,390 (70,984) 1,284,922 (459,032) 13,598,793Profit for the year - - 2,208,612 - - - - 2,208,612Other comprehensive income/(loss) for the year - - 1,599 - 45,569 (23,527) (76,609) (52,968)
Total comprehensive income/(loss) for the year - - 2,210,211 - 45,569 (23,527) (76,609) 2,155,644Transfer to retained earnings - - 43,145 - - (43,145) - - At 31 December 2016 310,000 8,063,106 6,193,747 530,390 (25,415) 1,218,250 (535,641) 15,754,437At 01 January 2017 310,000 8,063,106 6,193,747 530,390 (25,415) 1,218,250 (535,641) 15,754,437Profit for the year - - 2,611,293 - - - - 2,611,293Other comprehensive (loss)/income for the year - - (32,881) - 6,703 - (28,403) (54,581)
Total comprehensive income/(loss) for the year - - 2,578,412 - 6,703 - (28,403) 2,556,712Capital contribution received during the year 20 - 1,000,000 - - - - - 1,000,000Transfer to retained earnings - - 37,361 - - (37,361) - - Dividend 21 - - (954,000) - - - - (954,000)At 31 December 2017 310,000 9,063,106 7,855,520 530,390 (18,712) 1,180,889 (564,044) 18,357,149At 01 January 2018 310,000 9,063,106 7,855,520 530,390 (18,712) 1,180,889 (564,044) 18,357,149Impact of adopting IFRS 9 4 - - (250,070) - 34,993 - - (215,077)Restated opening balance under IFRS 9 310,000 9,063,106 7,605,450 530,390 16,281 1,180,889 (564,044) 18,142,072Profit for the year - - 554,153 - - - - 554,153Loss allowance relating to debt instruments held at FVTOCI - - - - 26,415 - - 26,415Other comprehensive (loss)/income for the year - - (27,802) - (137,421) - 564,044 398,821
Total comprehensive income/(loss) for the year - - 526,351 - (111,006) - 564,044 979,389Capital contribution received during the year 20 - 1,980,905 - - - - - 1,980,905Transfer to retained earnings - - 37,690 - - (37,690) - - Cash dividend 21 - - (1,100,500) - - - - (1,100,500)Distribution in specie leading to derecognition of foreign operations 39 (2,251,473) (220,390) - (62,808) - (2,534,671)At 31 December 2018 310,000 11,044,011 4,817,518 310,000 (94,725) 1,080,391 - 17,467,195
The notes on pages 131 to 221 form an integral part of these financial statements.
129ANNUAL REPORT 2018
SBM BANK (MAURITIUS) LTD
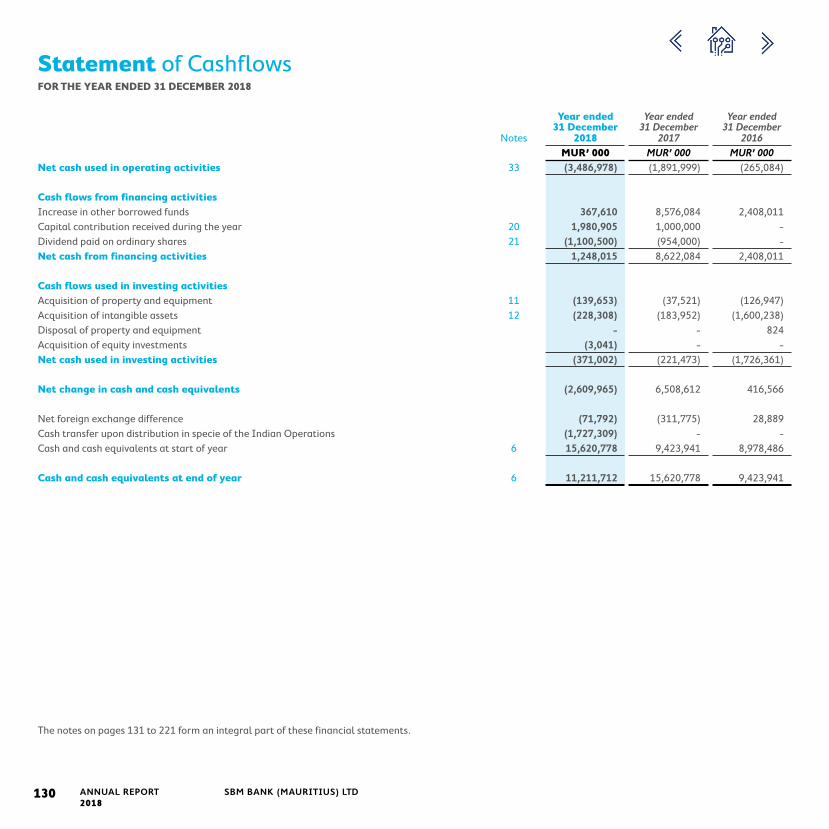
Statement of CashflowsFOR THE YEAR ENDED 31 DECEMBER 2018
Year ended 31 December
Year ended 31 December
Year ended 31 December
Notes 2018 2017 2016 MUR’ 000 MUR’ 000 MUR’ 000
Net cash used in operating activities 33 (3,486,978) (1,891,999) (265,084)
Cash flows from financing activitiesIncrease in other borrowed funds 367,610 8,576,084 2,408,011Capital contribution received during the year 20 1,980,905 1,000,000 - Dividend paid on ordinary shares 21 (1,100,500) (954,000) - Net cash from financing activities 1,248,015 8,622,084 2,408,011
Cash flows used in investing activitiesAcquisition of property and equipment 11 (139,653) (37,521) (126,947)Acquisition of intangible assets 12 (228,308) (183,952) (1,600,238)Disposal of property and equipment - - 824Acquisition of equity investments (3,041) - - Net cash used in investing activities (371,002) (221,473) (1,726,361)
Net change in cash and cash equivalents (2,609,965) 6,508,612 416,566
Net foreign exchange difference (71,792) (311,775) 28,889Cash transfer upon distribution in specie of the Indian Operations (1,727,309) - - Cash and cash equivalents at start of year 6 15,620,778 9,423,941 8,978,486
Cash and cash equivalents at end of year 6 11,211,712 15,620,778 9,423,941
The notes on pages 131 to 221 form an integral part of these financial statements.
SBM BANK (MAURITIUS) LTD130 ANNUAL REPORT 2018

Notes to the Financial StatementsFOR THE YEAR ENDED 31 DECEMBER 2018
1 GENERAL INFORMATIONSBM Bank (Mauritius) Ltd (formerly known as State Bank of Mauritius Ltd) (“the Bank”) is a public company incorporated and domiciled in Mauritius. The address of its registered office is SBM Tower, 1 Queen Elizabeth II Avenue, Port Louis, Mauritius. The Bank operates in the financial services sector, principally commercial banking.
2 APPLICATION OF NEW AND REVISED STANDARD AND INTERPRETATION (IFRS)
New and amended standards and interpretations
In the current year, the Bank has applied all of the new and revised Standards and Interpretations issued by the International Accounting Standards Board (“IASB”) and the International Financial Reporting Interpretations Committee (“IFRIC”) of the IASB that are relevant to its operations and effective for accounting periods beginning on 01 January 2018.
The nature and the impact of each new standard or amendment are described below:
Effective for accounting period beginning on or after
IFRS 9 Financial Instruments 01-January-2018
IFRS 15 Revenue from Contracts with Customers 01-January-2018
IFRS 7 Financial Instruments (Revised) 01-January-2018
IFRIC 22 Foreign currency transactions and advance consideration 01-January-2018
The Bank applied IFRS 9, IFRS 7 (Revised) and IFRS 15 for the first time. The nature and effect of the changes as a result of adoption of these new accounting standards are described below.
IFRS 9 Financial instruments
SBM Bank (Mauritius) Ltd has retrospectively adopted IFRS 9 Financial Instruments issued in July 2014 with a date of initial application of 01 January 2018. The requirements of IFRS 9 represent a significant change from IAS 39 Financial Instruments; Recognition and Measurement. The new standard brings about fundamental changes to the accounting and measurement for financial assets, certain aspects of accounting for financial liabilities and changes in the method of impairment loss calculation for financial assets. As permitted by IFRS 9, the Bank has elected to continue applying IAS 39 for hedge accounting requirements.
The Bank has not restated comparative information for the financial years 2017 and 2016 for financial instruments in the scope of IFRS 9. Therefore, the comparative information are reported under IAS 39 and is not comparable to the information presented for the financial year 2018. Differences arising from the adoption of IFRS 9 have been recognised directly in retained earnings as of 01 January 2018 and are disclosed in Note 4.
The key changes to the accounting policies of the Bank on account of introduction of IFRS 9 have been summarised below:
Changes to classification and measurement
To determine the classification and measurement category, IFRS 9 requires all financial assets, except equity instruments and derivatives, to be assessed based on a combination of the Bank’s business model for managing the assets and the instruments’ contractual cash flow characteristics.
The IAS 39 measurement categories of financial assets (fair value through profit or loss (FVTPL), available-for-sale (AFS), held-to-maturity (at amortised cost) and loans and receivables have been replaced by:
• Debt instruments at amortised cost;
• Debt instruments at fair value through other comprehensive income (FVTOCI), with gains or losses recycled to profit or loss on derecognition;
• Equity instruments at FVTOCI, with no recycling of gains or losses to profit or loss on derecognition; and
• Financial assets at FVTPL.
Under IFRS 9, embedded derivatives are no longer separated from a host financial asset. Instead, financial assets are classified based on business model and their contractual terms. The accounting for derivatives embedded in financial liabilities and in non-financial host contracts has not changed. The Bank’s accounting policies for embedded derivatives are set out in Note 8.
131ANNUAL REPORT 2018
SBM BANK (MAURITIUS) LTD

Notes to the Financial StatementsFOR THE YEAR ENDED 31 DECEMBER 2018
2 APPLICATION OF NEW AND REVISED STANDARD AND INTERPRETATION (CONT’D)
IFRS 9 Financial instruments (cont’d)
Changes to classification and measurement (cont’d)
The Bank’s classification of its financial assets and liabilities is explained in Note 4. The quantitative impact of applying IFRS 9 as at 01 January 2018 is disclosed in Note 4.
Changes to the impairment calculation
The adoption of IFRS 9 has fundamentally changed the Bank’s accounting for loan loss impairments by replacing IAS 39’s incurred loss approach with a forward-looking expected credit loss (ECL) approach. IFRS 9 requires the Bank to record an allowance for ECLs for all loans and other debt financial assets not held at FVTPL, together with loan commitments and financial guarantee contracts. The allowance is based on the ECLs associated with the probability of default in the next twelve months unless there has been a significant increase in credit risk since origination. If the financial asset meets the definition of purchased or originated credit impaired (POCI), the allowance is based on the change in the ECLs over the life of the asset.
Details of the Bank’s impairment method are disclosed in Note 9 c. The quantitative impact of applying IFRS 9 as at 01 January 2018 is disclosed in Note 4.
IFRS 15 Revenue from Contracts with Customers
IFRS 15 supersedes IAS 11 Construction Contracts, IAS 18 Revenue and related interpretations and it applies with limited exceptions, to all revenue arising from contracts with its customers. IFRS 15 establishes a five-step model to account for revenue arising from contracts with customers and requires that revenue be recognised at an amount that reflects the consideration to which an entity expects to be entitled in exchange for transferring goods or services to a customer.
IFRS 15 requires entities to exercise judgement, taking into consideration all of the relevant facts and circumstances when applying each step of the model to contracts with their customers. The standard also specifies the accounting for the incremental costs of obtaining a contract and the costs directly related to fulfilling a contract.
There has been no significant effect on the financial statements of the Bank upon adoption of this new IFRS.
IFRS 7 Financial Instruments (Revised)
To reflect the differences between IFRS 9 and IAS 39, IFRS 7 Financial Instruments: Disclosures was updated and the Bank has adopted it, together with IFRS 9, for the year beginning 01 January 2018. Changes include transition disclosures as shown in Note 4, detailed qualitative and quantitative information about the ECL calculations such as the assumptions and inputs used are set out in Note 9 and Note 32.
Reconciliations from opening to closing ECL allowances are presented in Notes 7, 9, 10 and 22. IFRS 7R also requires additional and more detailed disclosures for hedge accounting even for entities opting to continue to apply the hedge accounting requirements of IAS 39.
IFRIC 22 Foreign currency transactions and advance consideration
The Interpretation clarifies that, in determining the spot exchange rate to use on initial recognition of the related asset, expense or income (or part of it) on the derecognition of a non-monetary asset or non-monetary liability relating to advance consideration, the date of the transaction is the date on which an entity initially recognises the non-monetary asset or non-monetary liability arising from the advance consideration. If there are multiple payments or receipts in advance, then the Bank must determine the date of the transactions for each payment or receipt of advance consideration. This Interpretation does not have any impact on the Bank’s financial statements.
Standards issued but not yet effective applicable to the Bank
Effective for accounting period beginning on or after
IFRS 16 Leases 01-January-2019
IFRIC 23 Uncertainty over Income Tax Treatments 01-January-2019
Plan Amendment, Curtailment or Settlement (Amendments to IAS 19) 01-January-2019
Amendments to References to the Conceptual Framework in IFRS Standards 01-January-2020
Definition of Material (Amendments to IAS 1 and IAS 8) 01-January-2020
132 ANNUAL REPORT 2018
SBM BANK (MAURITIUS) LTD

Notes to the Financial StatementsFOR THE YEAR ENDED 31 DECEMBER 2018
2 APPLICATION OF NEW AND REVISED STANDARD AND INTERPRETATION (CONT’D)
New and amended standards and interpretations (cont’d)
Standards issued but not yet effective applicable to the Bank (cont’d)
IFRS 16 Leases
IFRS 16 was issued in January 2016 and it replaces IAS 17 Leases, IFRS 4 Determining whether an arrangement contains a lease, SIC-15 Operating Leases-Incentives and SIC-27 Evaluating the Substance of Transactions Involving the Legal Form of a Lease.
IFRS 16 sets out the principles for the recognition measurement, presentation and disclosure of leases and requires lessees to account for all leases under a single on-balance sheet model similar to accounting for finance leases under IAS 17. The standard includes two recognition exemptions for lessees: leases of ‘low-value’ assets and short term leases (i.e. leases with lease term of 12 months or less). At the commencement date of a lease, a lessee will recognise a liability to make lease payments (i.e. the right-of-use of the asset). Lessees will be required to separately recognise the interest expense on the lease liability and the depreciation expense on the right-of-use of the asset.
Lessees will also be required to remeasure the lease liability upon the occurrence of certain events (i.e. a change in the lease term, a change in future lease payments resulting from a change in an index or rate used to determine those payments). The lessee will generally recognise the amount of the remeasurement of the lease liability as an adjustment to the right-of-use of the asset.
Lessor accounting under IFRS 16 is substantially unchanged from today’s accounting under IAS 17. Lessors will continue to classify all leases under the same classification principle as in IAS 17 and distinguish between two types of leases: operating and finance leases.
IFRS 16 also requires lessees and lessors to make more extensive disclosure than under IAS 17.
Transition to IFRS 16
IFRS 16 is effective for annual periods beginning on or after 01 January 2019. Early application is permitted, but not before an entity applies IFRS 15. A lessee can choose to apply the standard either a full retrospective or a modified retrospective approach. The standard’s transition provision permits certain reliefs.
The Bank plans to adopt IFRS 16 using the modified retrospective approach, which means it will apply the standard from 01 January 2019, the cumulative impact of adoption will be recognised as at 01 January 2019 and comparatives will not be restated.
The Bank will elect to use the exemptions proposed by the standard on lease contracts for which the underlying assets is of low-value. The Bank has leases of certain office equipments that are considered as low-value. No practical expedient will be used.
In 2018, the Bank continued to progress its detailed impact assessment and implementation of IFRS 16. Much of the early part of 2018 was spent focusing on reviewing contracts, aggregating data to support the evaluation of the accounting impacts and identifying where key policy decisions were required.
The Bank for the moment is not expecting to invest on software given the low volume of assets under lease.
Impact on the statement of financial position as at 01 January 2019:
MUR '000 Assets
Property, plant and equipment (right-of-use) 316,012
Liabilities
Lease liabilities 316,012
Net impact on equity
Work completed by the Bank to date indicates the new leases standard is expected to have a material effect on the Bank’s financial statements as it will significantly increase the Bank’s assets and liabilities (as described above). In addition, compared with the existing accounting for operating leases, the classification and timing of expenses will be impacted which may lead to some improvement in the Bank’s operating profit, while its interest expense and depreciation of these assets will increase. This is due to the change in accounting for expenses of leases that were classified as operating leases under IAS 17. In addition, the classification between cash flow from operating activities and cash flow from financing activities will also change. Many commonly used financial ratios and performance metrics for the Bank, using existing definitions, will also be impacted including net debt, EBITDA, operating cash flows.
The impact on deferred tax is still being assessed by the Bank.
133ANNUAL REPORT 2018
SBM BANK (MAURITIUS) LTD

Notes to the Financial StatementsFOR THE YEAR ENDED 31 DECEMBER 2018
2 APPLICATION OF NEW AND REVISED STANDARD AND INTERPRETATION (CONT’D)
Standards issued but not yet effective applicable to the Bank (cont’d)
IFRIC 23 Uncertainty over Income Tax Treatments
The interpretation addresses the determination of taxable profit (tax loss), tax bases, unused tax losses, unused tax credits and tax rates, when there is uncertainty over income tax treatments under IAS 12.
It specifically considers:
• Whether tax treatments should be considered collectively;
• Assumptions for taxation authorities’ examinations;
• The determination of taxable profit (tax loss), tax bases, unused tax losses, unused tax credits and tax rates; and
• The effect of changes in facts and circumstances.
Plan Amendment, Curtailment or Settlement (Amendments to IAS 19)
The amendments in Plan Amendment, Curtailment or Settlement (Amendments to IAS 19) are:
• If a plan amendment, curtailment or settlement occurs, it is now mandatory that the current service cost and the net interest for the period after the remeasurement are determined using the assumptions used for the remeasurement.
• In addition, amendments have been included to clarify the effect of a plan amendment, curtailment or settlement on the requirements regarding the asset ceiling.
Amendments to References to the Conceptual Framework in IFRS Standards
Together with the revised Conceptual Framework published in March 2018, the IASB also issued Amendments to References to the Conceptual Framework in IFRS Standards. The document contains amendments to IFRS 2, IFRS 3, IFRS 6, IFRS 14, IAS 1, IAS 8, IAS 34, IAS 37, IAS 38, IFRIC 12, IFRIC 19, IFRIC 20, IFRIC 22, and SIC-32. Not all amendments, however update those pronouncements with regard to references to and quotes from the framework so that they refer to the revised Conceptual Framework. Some pronouncements are only updated to indicate which version of the framework they are referencing to (the IASC framework adopted by the IASB in 2001, the IASB framework of 2010, or the new revised framework of 2018) or to indicate that definitions in the standard have not been updated with the new definitions developed in the revised Conceptual Framework.
Definition of Material (Amendments to IAS 1 and IAS 8)
The amendments in Definition of Material (Amendments to IAS 1 and IAS 8) clarify the definition of ‘material’ and align the definition used in the Conceptual Framework and the standards.
The Bank is still assessing the impact of these new standards and interpretations on its financial statements.
134 ANNUAL REPORT 2018
SBM BANK (MAURITIUS) LTD

Notes to the Financial StatementsFOR THE YEAR ENDED 31 DECEMBER 2018
• The Bank’s internal credit grading model, which assigns PDs to the individual grades;
• The Bank’s criteria for assessing if there has been a significant increase in credit risk and so allowances for financial assets should be measured on a long term ECL basis and the qualitative assessment;
• The segmentation of financial assets when their ECL is assessed on a collective basis;
• Development of ECL models, including the various formulas and the choice of inputs;
• Determination of associations between macroeconomic scenarios and, economic inputs, such as unemployment levels and collateral values, and the effect on PDs, EADs and LGDs; and
• Selection of forward-looking macroeconomic scenarios and their probability weightings, to derive the economic inputs into the ECL models.
It has been the Bank’s policy to regularly review its models in the context of actual loss experience and adjust when necessary.
The estimations and assumptions that have a significant risk of causing a material adjustment to the carrying amounts of assets and liabilities within the next financial year include:
(i) Assessment of useful lives - Note 12
(ii) Pension benefits - Note 14
(iii) Fair value of equity investments - Note 10
(iv) Fair value of other financial assets and liabilities - Note 37 (a)
3 SIGNIFICANT ACCOUNTING ESTIMATES AND JUDGEMENTSThe preparation of the Bank’s financial statements requires management to make judgements, estimates and assumptions that affect the reported amount of revenues, expenses, assets and liabilities, and the accompanying disclosures, as well as the disclosure of contingent liabilities. Uncertainty about these assumptions and estimates could result in outcomes that require a material adjustment to the carrying amount of assets or liabilities affected in future periods. In the process of applying the Bank’s accounting policies, management has made the following judgements and assumptions concerning the future and other key sources of estimation uncertainty at the reporting date, that have a significant risk of causing a material adjustment to the carrying amounts of assets and liabilities within the next financial year. Existing circumstances and assumptions about future developments may change due to circumstances beyond the Bank’s control and are reflected in the assumptions if and when they occur. Items with the most significant effect on the amounts recognised in the financial statements with substantial management judgement and/or estimates are collated below with respect to judgements/estimates involved.
3.1 Expected credit losses on financial assets
The measurement of impairment losses under IFRS 9 across all categories of financial assets requires judgement, in particular, the estimation of the amount and timing of future cash flows and collateral values when determining credit losses and the assessment of a significant increase in credit risk. These estimates are driven by a number of factors, changes in which can result in different levels of allowances.
The Bank’s ECL calculations are outputs of complex models with a number of underlying assumptions regarding the choice of variable inputs and their interdependencies. Elements of the ECL models that are considered accounting judgements and estimates include:
135ANNUAL REPORT 2018
SBM BANK (MAURITIUS) LTD

Notes to the Financial StatementsFOR THE YEAR ENDED 31 DECEMBER 2018
4 TRANSITION DISCLOSURES
The table below sets out the impact of adopting IFRS 9 on the statement of financial position, and retained earnings including the effect of replacing IAS 39’s incurred credit loss calculations with IFRS 9’s ECLs.Summary of impact on classification and measurement of financial assets and liabilities as on 01 January 2018.
As on 01 January 2018
ParticularsIAS 39 measurement category
New measurement category under IFRS 9
Original carrying
amount under IAS 39
(MUR’ 000)
New carrying amount under
IFRS 9 (MUR’ 000)
Movement booked in Retained earnings
(MUR’ 000)Cash and cash equivalents Loans and receivables Amortised cost 15,620,778 15,604,580 16,198 Mandatory balances with central banks Loans and receivables Amortised cost 8,712,062 8,712,062 - Loans to and placements with banks Loans and receivables Amortised cost 8,895,860 8,879,803 16,057 Derivative financial instruments Fair value through P&L Fair value through P&L 1,356,774 1,356,774 - Loans and advances to non-bank customers Loans and receivables Amortised cost 100,839,231 100,820,640 18,591 Investments - AFS (Equity and/or Debt Instruments)* Available for sale Fair value through OCI 11,268,400 11,268,400 34,993 Investments - HFT Fair value through P&L Fair value through P&L 6,676,489 6,676,489 - Investments - HTM Held to maturity Amortised cost 19,206,212 19,189,864 16,348 Deposits from banks Amortised cost Amortised cost 739,926 739,926 - Deposits from non-bank customers Amortised cost Amortised cost 141,695,769 141,695,769 - Derivative financial instruments Fair value through P&L Fair value through P&L 1,334,584 1,334,584 - Other liabilities Amortised cost Amortised cost 4,163,207 4,163,207 - Other borrowed funds Amortised cost Amortised cost 13,116,593 13,116,593 - Off balance sheet items Off balance sheet Off balance sheet 12,291,283 12,175,322 115,961 Other credit commitments Off balance sheet Off balance sheet 14,238,833 14,181,930 56,903 Total adjustments made to retained earnings 275,051
(a) Debt instruments that were previously classified at available-for-sale were assessed to have a business model whose objective is achieved both by collecting contractual cash flows and selling the financial assets, and are accordingly classified at FVTOCI under IFRS 9.Reconciliation of carrying amount of financial instruments in the statement of financial position from IAS 39 to IFRS 9 as on 01 January 2018 is shown under note 4 below:
Reconciliation of impairment allowance balance between IAS 39 and IFRS 9: This table reconciles the prior period’s closing impairment allowance measured in accordance with IAS 39 incurred loss model to the new credit loss allowance measured in accordance with the IFRS 9 expected credit loss model as on 01 January 2018.
Measurement category
Credit loss allowance under IAS 39 (MUR’ 000)
Re-classification (MUR’ 000)
Re-measurement (MUR’ 000)
Credit loss allowance
under IFRS 9 (MUR’ 000)
Loans and receivables (IAS39) / Financial assets at amortised cost (IFRS 9)(i) Cash and cash equivalents - - 16,198 16,198 (ii) Loans and advances to banks - - 16,057 16,057 (iii) Loans and advances to non-bank customers 3,420,848 - 18,591 3,439,439 (iv) Investment securities - - 54,341 54,341 (v) Memorandum Items** - - 172,864 172,864 Total 3,420,848 - 275,051 3,695,899
* ECL allowance on debt instruments at FVTOCI are debited to profit and loss and credited to fair value reserve on financial instruments recognised in other comprehensive income.** Memorandum items include acceptances, contingent liabilities, financial guarantee contracts and other credit commitments. Further details are disclosed in Note 22.
136 ANNUAL REPORT 2018
SBM BANK (MAURITIUS) LTD

Notes to the Financial StatementsFOR THE YEAR ENDED 31 DECEMBER 2018
4 TRANSITION DISCLOSURES (CONT’D)
The impact of transition to IFRS 9 on reserves and retained earnings is, as follows:
Retained earnings
MUR’ 000Retained earningsClosing balance under IAS 39 (31 December 2017) 7,855,520 Reclassification adjustments in relation to adopting IFRS 9:Re-measurement impact of reclassifying financial assets held at amortised cost to FVTPL - Re-measurement impact of the reclassification of financial liabilities at FVTPL reclassified to amortised cost - Investment securities (debt and equity) from available-for-sale to FVTPL - Recognition of IFRS 9 ECLs including those measured at FVTOCI (269,791)EIR adjustments made in foreign operations* (5,260)Deferred tax in relation to the above 24,981 Opening balance under IFRS 9 (01 January 2018) 7,605,450 Total change in equity due to adopting IFRS 9 250,070
Fair value instruments
recognised in OCI
MUR’ 000Fair value reserveClosing balance under IAS 39 (31 December 2017) (18,712)Recognition of IFRS 9 ECLs including those debt instruments measured at FVTOCI 34,993Opening balance under IFRS 9 (01 January 2018) 16,281
Total change in fair value due to adopting IFRS 9 34,993
The following table reconciles the aggregate opening credit loss provision allowances under IAS 39 and provisions for loan commitments and financial guarantee contracts in accordance with IAS 37 Provisions Contingent Liabilities and Contingent Assets to the ECL allowances under IFRS 9. Further details are disclosed in Note 22.
Loan loss provision under
IAS 39/37 at 31 December 2017 Re-measurement
ECLs under IFRS 9 at
01 January 2018MUR’ 000 MUR’ 000 MUR’ 000
Impairment allowance for:Loans and receivables per IAS 39 / financial assets at amortised cost under IFRS 9 3,420,848 18,591 3,439,439
3,420,848 18,591 3,439,439Financial guarantees - 48,898 48,898Letter of credit for customers - 8,575 8,575Bills - 58,487 58,487Other commitments** - 56,904 56,904
- 172,864 172,8643,420,848 191,455 3,612,303
* The Indian Operations while adopting IFRS9, made adjustments to their opening balances following application of the EIR model to calculate outstanding loan balances.** Other commitments relate to undrawn credit facilities provided to customers.
137ANNUAL REPORT 2018
SBM BANK (MAURITIUS) LTD

Notes to the Financial StatementsFOR THE YEAR ENDED 31 DECEMBER 2018
4 TRANSITION DISCLOSURES (CONT’D)
A reconciliation between the carrying amounts under IAS 39 to the balances reported under IFRS 9 as of 01 January 2018 is, as follows:
MUR’ 000 IAS 39 MeasurementRe-
Classification Re-measurement IFRS 9Financial Assets Category Amount Amount ECL Other Amount Category
Cash and balances with central banksLoans and receivables 24,332,840 - 16,198 - 24,316,642
Amortised cost
Loans and advances to banksLoans and receivables 8,895,860 - 16,057 - 8,879,803
Amortised cost
Loans and advances to customersLoans and receivables 100,839,231 - 18,591 - 100,820,640
Amortised cost
Financial investments - HTM HTM19,206,212 - 16,348 - 19,189,864
Amortised cost
153,274,143 - 67,194 - 153,206,949
Financial investments - AFS AFS 11,268,400 - 34,993 - 11,268,400 FVTOCIFinancial investments - HFT HFT 6,676,489 - - - 6,676,489 FVTPLDerivative financial instrument FVTPL 1,356,774 - - - 1,356,774 FVTPL
Non Financial AssetsDeferred tax assets 95,461 - - - 95,461 Total assets 172,671,267 - 102,187 - 172,604,073
MUR’ 000 IAS 39 MeasurementRe-
Classification Re-measurement IFRS 9Financial Liabilities Category Amount Amount ECL Other Amount Category
Deposits from banks Amortised cost 739,926 - - - 739,926Amortised cost
Deposits from customers Amortised cost 141,695,769 - - - 141,695,769Amortised cost
Other borrowed funds Amortised cost 13,116,593 - - - 13,116,593Amortised cost
Other liabilities Amortised cost 4,163,207 - - - 4,163,207Amortised cost
Amortised cost 159,715,495 - - - 159,715,495Amortised cost
Derivative financial instruments FVTPL 1,334,584 - - - 1,334,584 FVTPL
Non Financial liabilities
Deferred tax liabilities FVTPL 172,471 - - - 172,471 FVTPL
Total Liabilities 161,222,550 - - - 161,222,550
SBM BANK (MAURITIUS) LTD138 ANNUAL REPORT 2018

Notes to the Financial StatementsFOR THE YEAR ENDED 31 DECEMBER 2018
5 SUMMARY OF SIGNIFICANT ACCOUNTING POLICIES
a Basis of preparation
The financial statements have been prepared on the historical cost basis, except for certain property and equipment and financial instruments that are measured at revalued amounts or fair value as explained in the accounting policies. The financial statements are presented in Mauritian Rupee, which is the Bank’s functional and presentation currency. All values are rounded to the nearest thousand (MUR’000), except where otherwise indicated.
Historical cost is generally based on the fair value of the consideration given in exchange for goods and services.
Fair value is the price that would be received to sell an asset or paid to transfer a liability in an orderly transaction between market participants at the measurement date, regardless of whether that price is directly observable or estimated using valuation technique. In estimating the fair value of an asset or liability the Bank takes into account the characteristics of the asset or liability if market participants would take into account those characteristics when pricing the asset or liability at the measurement date. Fair value for measurement and/or disclosure purposes in these financial statements is determined on such a basis, except for share-based payment transactions that are within the scope of IFRS 2, leasing transactions that are within the scope of IAS 17, and measurements that have some similarities to fair value but are not fair value, such as net realisable value in IAS 2 or value in use in IAS 36.
b Statement of compliance
The financial statements have been prepared on the basis of preparation as explained above and in accordance with the recognition and measurement principles of International Financial Reporting Standards (IFRSs), as issued by the International Accounting Standards Board (IASB) and in compliance with the Companies Act 2001.
c Financial instruments - initial recognition
Date of recognition
Financial assets and liabilities, with the exception of loans and advances to customers and balances due to customers, are initially recognised on the trade date, that is, the date that the Bank becomes a party to the contractual provisions of the instrument. This includes regular way trades: purchases or sales of financial assets that require delivery of assets within the time frame generally established by regulation or convention in the market place. Loans and advances to customers are recognised when funds are transferred to the customers’ accounts. The Bank recognises balances due to customers when funds are transferred to the Bank.
Initial measurement of financial instruments
The classification of financial instruments at initial recognition depends on their contractual terms and the business model for managing the instruments, as described in Notes 8, 9 and 10. Financial instruments are initially measured at their fair value, except in the case of financial assets and financial liabilities recorded at FVTPL, transaction costs are added to, or subtracted from, this amount. Trade receivables are measured at the transaction price. When the fair value of financial instruments at initial recognition differs from the transaction price, the Bank accounts for the Day 1 profit or loss, as described below.
Day 1 profit or loss
When the transaction price of the instrument differs from the fair value at origination and the fair value is based on a valuation technique using only inputs observable in market transactions, the Bank recognises the difference between the transaction price and fair value in net trading income. In those cases where fair value is based on models for which some of the inputs are not observable, the difference between the transaction price and the fair value is deferred and is only recognised in profit or loss when the inputs become observable, or when the instrument is derecognised.
Measurement categories of financial assets and liabilities
As from 01 January 2018, the Bank classifies all of its financial assets based on the business model for managing the assets and the asset’s contractual terms, measured at either:
• Amortised cost, as explained in Notes 9 and 10;
• FVTOCI, as explained in Note 10; and
• FVTPL, as explained in Notes 8 and 10.
139ANNUAL REPORT 2018
SBM BANK (MAURITIUS) LTD

Notes to the Financial StatementsFOR THE YEAR ENDED 31 DECEMBER 2018
5 SUMMARY OF SIGNIFICANT ACCOUNTING POLICIES (CONT’D)
c Financial instruments - initial recognition (cont’d)
Measurement categories of financial assets and liabilities (cont’d)
The Bank classifies and measures its derivative and trading portfolio at FVTPL as explained in Notes 8 and 10. The Bank may designate financial instruments at FVTPL, if so doing eliminates or significantly reduces measurement or recognition inconsistencies, as explained in Note 10.
Before 01 January 2018, the Bank classified its financial assets as loans and receivables (amortised cost), FVTPL, available-for-sale or held-to-maturity (amortised cost), as explained in Note 10.
Financial liabilities, other than loan commitments and financial guarantees, are measured at amortised cost or at FVTPL when they are held for trading and derivative instruments or the fair value designation is applied, as explained in Note 8.
Business model assessment
The Bank determines its business model at the level that best reflects how it manages groups of financial assets to achieve its business objective.
The Bank’s business model is not assessed on an instrument-by-instrument basis, but at a higher level of aggregated portfolios and is based on observable factors such as:
• How the performance of the business model and the financial assets held within that business model are evaluated and reported to the entity’s key management personnel;
• The risks that affect the performance of the business model (and the financial assets held within that business model) and, in particular, the way those risks are managed;
• How managers of the business are compensated (for example, whether the compensation is based on the fair value of the assets managed or on the contractual cash flows collected); and
• The expected frequency, value and timing of sales are also important aspects of the Bank’s assessment.
The business model assessment is based on reasonably expected scenarios without taking ‘worst case’ or ‘stress case’ scenarios into account. If cash flows after initial recognition are realised in a way that is different from the Bank’s original expectations, the Bank does not change the classification of the remaining financial assets held in that business model, but incorporates such information when assessing newly originated or newly purchased financial assets going forward.
The solely payments of principal and interest (SPPI) test
As a second step of its classification process the Bank assesses the contractual terms of financial assets to identify whether they meet the SPPI test.
‘Principal’ for the purpose of this test is defined as the fair value of the financial asset at initial recognition and may change over the life of the financial asset (for example, if there are repayments of principal or amortisation of the premium/discount).
The most significant elements of interest within a lending arrangement are typically the consideration for the time value of money and credit risk. To make the SPPI assessment, the Bank applies judgement and considers relevant factors such as the currency in which the financial asset is denominated, and the period for which the interest rate is set.
In contrast, contractual terms that introduce a more than de minimis exposure to risks or volatility in the contractual cash flows that are unrelated to a basic lending arrangement do not give rise to contractual cash flows that are solely payments of principal and interest on the amount outstanding. In such cases, the financial asset is required to be measured at FVTPL.
SBM BANK (MAURITIUS) LTD140 ANNUAL REPORT 2018

Notes to the Financial StatementsFOR THE YEAR ENDED 31 DECEMBER 2018
5 SUMMARY OF SIGNIFICANT ACCOUNTING POLICIES (CONT’D)
d Foreign currency translation
Assets, liabilities, income and expense items denominated in other currencies are translated into Mauritian Rupees, the currency of the primary economic environment in which the entity operates (‘functional currency’) in accordance with IAS 21.
(i) Transactions denominated in foreign currency are converted at the rate prevailing at the date of the transactions.
(ii) Monetary assets and liabilities denominated in foreign currency at the reporting date are translated into Mauritian Rupees at the rates of exchange ruling at that date.
(iii) Non-monetary assets and liabilities denominated in foreign currency are reported using the exchange rates at the date of the transactions, if carried at cost, or the exchange rates that existed when the fair values were determined, if carried at fair value.
(iv) Exchange differences arising on the settlement of monetary items, and on the translation of monetary items, are included in the statement of profit or loss and other comprehensive income (‘OCI’) for the period. When a gain or loss on a non-monetary item is recognised in equity, any exchange component of that gain or loss shall be recognised in equity. Conversely, when a gain or loss on a non-monetary item is recognised in the statement of profit or loss and other comprehensive income, any exchange component of that gain or loss shall be recognised in the statement of profit or loss and other comprehensive income.
(v) Goodwill and fair value adjustments arising on the acquisition of a foreign operation are treated as assets and liabilities of the foreign operation and translated at closing rate. Exchange differences arising are recognised in other comprehensive income.
(vi) The assets and liabilities of the overseas branches denominated in foreign currencies are translated into Mauritian Rupees at the rates of exchange ruling at the reporting date, as follows:
31 December 30 November 31 December 31 December2018 2018 2017 2016
USD/MUR 34.266 34.275 33.413 35.902INR/MUR 0.491 0.492 0.523 0.529
The average rates for the following years are:
31 December 30 November 31 December 31 December2018 2018 2017 2016
USD/MUR 33.98 34.275 34.46 36.43INR/MUR 0.497 0.492 0.529 0.545
The statement of profit or loss is translated into Mauritian Rupees at weighted average rates. Any differences arising on retranslation of the foreign operation are recognised in other comprehensive income and accumulated in equity. On disposal/derecognition of a foreign entity, such translation differences are recognised in the statement of profit or loss in the period in which the foreign entity is disposed of/derecognised.
e Borrowing costs
All borrowing costs are charged to the statement of profit or loss in the period in which they are incurred.
f Provisions
Provisions are recognised when the Bank has a present obligation as a result of a past event which it is probable will result in an outflow of economic benefits that can be reasonably estimated.
g Comparative figures
Where necessary, comparative figures are restated or reclassified to conform to the current year’s presentation and to the changes in accounting policies.
h Offsetting financial instruments
Financial assets and liabilities are offset and the net amount reported in the statement of financial position when there is a legally enforceable right to offset the recognised amounts and there is an intention to settle on a net basis, or realise the asset and settle the liability simultaneously.
The accounting policies of each relevant line item is included in the respective notes.
141ANNUAL REPORT 2018
SBM BANK (MAURITIUS) LTD

Notes to the Financial Statements FOR THE YEAR ENDED 31 DECEMBER 2018
6. Cash and Cash Equivalents
Accounting policy
Cash and cash equivalents include highly liquid investments that are readily convertible to known amounts of cash and which are subject to an insignificant risk of change in value. Such investments are normally those with less than three months maturity from the date of acquisition.
For the purposes of the statement of cash flows, cash and cash equivalents comprise cash, balances with banks and central banks excluding mandatory balances. Cash and cash equivalents are measured at amortised cost. Accounting policy for calculating allowance for impaired losses is outlined under note 9(c).
31 December 31 December 31 December2018 2017 2016
MUR’ 000 MUR’ 000 MUR’ 000Cash in hand 2,398,191 1,804,128 1,706,637Foreign currency notes and coins 277,740 294,863 287,812Unrestricted balances with central banks 1 1,527,560 1,286,638 - Loans and placements with banks2 1,162,364 5,895,943 3,453,523Balances with banks 5,887,615 6,339,206 3,975,969
11,253,470 15,620,778 9,423,941Less: allowance for impairment losses (41,758) - -
11,211,712 15,620,778 9,423,941
1 Unrestricted balances with central banks represent amounts above the minimum cash reserve requirement.
2 The balance above relates to loans and placements with banks having an original maturity of up to three months. As such only stage 1 allowance for credit losses have been recorded for cash and cash equivalents.
SBM BANK (MAURITIUS) LTD142 ANNUAL REPORT 2018

Notes to the Financial Statements FOR THE YEAR ENDED 31 DECEMBER 2018
7 LOANS TO AND PLACEMENTS WITH BANKS
Accounting policy
Prior to 01 January 2018
Loans to and placements with banks are non-derivative financial assets with fixed or determinable payments that are not quoted in an active market. They are measured at amortised cost using the effective interest method, less any impairment.
From 01 January 2018
From 01 January 2018, the Bank only measures loans to and placements with banks at amortised cost if both of the following conditions are met:
• The financial asset is held within a business model with the objective to hold financial assets in order to collect contractual cash flows; and
• The contractual terms of the financial asset give rise on specified dates to cash flows that are solely payments of principal and interest (SPPI) on the principal amount outstanding. The details of these conditions are outlined in Note 5(c).
Accounting policy for calculating allowance for impaired losses is outlined under Note 9(c).
31 December 31 December 31 December2018 2017 2016
Loans to and placements with banks: MUR’ 000 MUR’ 000 MUR’ 000 - in Mauritius 5,588,012 1,104,288 451,829 - outside Mauritius 6,210,627 7,791,572 4,194,082
11,798,639 8,895,860 4,645,911Less: allowance for credit losses (34,281) - -
11,764,358 8,895,860 4,645,911Remaining term to maturityUp to 3 months 3,810,474 1,438,472 179,715Over 3 months and up to 6 months 3,340,456 403,974 1,903,777Over 6 months and up to 12 months 1,834,098 1,910,982 71,457Over 1 year and up to 2 years 1,914,018 3,150,402 1,078,904Over 2 years and up to 5 years 865,312 1,992,030 1,052,470Over 5 years - - 359,588
11,764,358 8,895,860 4,645,911
Credit loss allowance for loans to and placements with banks
The table below shows the credit quality and the maximum exposure to credit risk based on the Bank’s internal credit rating system and year-end stage classification. The amounts presented are gross of credit loss allowances. Details of the Bank’s internal grading system are explained in Note 37(b)(i) and policies on whether ECL allowances are calculated on an individual or collective basis are set out in Note 9.
31 December 201831 December
2017Internal rating grade Stage 1 Stage 2 Stage 3 Total TotalPerforming MUR’ 000 MUR’ 000 MUR’ 000 MUR’ 000 MUR’ 000High gradeStandard grade 797,769 - - 797,769 685,427Sub-standard grade 9,376,414 - - 9,376,414 6,189,261Past due but not impaired 1,624,456 - - 1,624,456 2,021,172Non-performing - - - - - Individually impairedTotal - - - - -
11,798,639 - - 11,798,639 8,895,860
143ANNUAL REPORT 2018
SBM BANK (MAURITIUS) LTD

Notes to the Financial Statements FOR THE YEAR ENDED 31 DECEMBER 2018
7. LOANS TO AND PLACEMENTS WITH BANKS (CONT’D)
Credit loss allowance for loans to and placements with banks (cont’d)
An analysis of changes in the gross carrying amount and the corresponding ECL allowances is, as follows:
Stage 1 Stage 2 Stage 3 TotalIndividual Individual
MUR’000 MUR’000 MUR’000 MUR’000Gross carrying amount as at 1 January 2018 8,895,860 - - 8,895,860New assets originated or purchased 5,338,207 - - 5,338,207Assets derecognised or repaid (excluding write offs) (2,435,428) - - (2,435,428)Transfers to Stage 1 - - - - Transfers to Stage 2 - - - - Transfers to Stage 3 - - - - Changes to contractual cash flows due to modifications not resulting in derecognition - - - - Amounts written off - - - - Foreign exchange adjustments - - - - At 31 December 2018 11,798,639 - - 11,798,639
Stage 1 Stage 2 Stage 3 TotalIndividual Individual
MUR’000 MUR’000 MUR’000 MUR’000ECL allowance as at 1 January 2018 16,057 - - 16,057New assets originated or purchased 21,132 - - 21,132Assets derecognised or repaid (excluding write offs) (2,908) - - (2,908)Transfers to Stage 1 - - - - Transfers to Stage 2 - - - - Transfers to Stage 3 - - - - Impact on year end ECL of exposures transferred between stages during the year - - - - Changes to contractual cash flows due to modifications not resulting in derecognition - - - - Changes to models and inputs used for ECL calculations - - - - Recoveries - - - - Amounts written off - - - - Foreign exchange adjustments - - - - At 31 December 2018 34,281 - - 34,281
Movements in the loss allowances arising from Due from banks balances under IAS 39 over 2017 included MUR’000 21,132 new placements made during the financial year and MUR’000 2,908 derecognised due to loans matured.
SBM BANK (MAURITIUS) LTD144 ANNUAL REPORT 2018

Notes to the Financial Statements FOR THE YEAR ENDED 31 DECEMBER 2018
8. DERIVATIVE FINANCIAL INSTRUMENTS
Accounting policy
A derivative is a financial instrument or other contract with all three of the following characteristics:
• Its value changes in response to the change in a specified interest rate, financial instrument price, commodity price, foreign exchange rate, index of prices or rates, credit rating or credit index, or other variable, provided that, in the case of a non-financial variable, it is not specific to a party to the contract.• It requires no initial net investment or an initial net investment that is smaller than would be required for other types of contracts expected to have a similar response to changes in market factors.• It is settled at a future date.
The Bank enters into derivative transactions with various counterparties. These include interest rate swaps, futures, credit default swaps, cross-currency swaps, forward foreign exchange contracts and options on interest rates, foreign currencies and equities. Derivatives are recorded at fair value and carried as assets when their fair value is positive and as liabilities when their fair value is negative. The notional amount and fair value of such derivatives are disclosed below.
Derivative financial instruments and hedge accounting
Initial recognition and subsequent measurement
The Bank uses interest rate swaps, to hedge its interest rate risks and commodity price risks, respectively. Such derivative financial instruments are initially recognised at fair value on the date on which a derivative contract is entered into and are subsequently remeasured at fair value. Derivatives are carried as financial assets when the fair value is positive and as financial liabilities when the fair value is negative.
For the purpose of hedge accounting, hedges are classified as:• Fair value hedges when hedging the exposure to changes in the fair value of a recognised asset or liability or an unrecognised firm commitment.
At the inception of a hedge relationship, the Bank formally designates and documents the hedge relationship to which it wishes to apply hedge accounting and the risk management objective and strategy for undertaking the hedge.
Before 1 January 2018, the documentation includes identification of the hedging instrument, the hedged item or transaction, the nature of the risk being hedged and how the Bank will assess the effectiveness of changes in the hedging instrument’s fair value in offsetting the exposure to changes in the hedged item’s fair value or cash flows attributable to the hedged risk. Such hedges are expected to be highly effective in achieving offsetting changes in fair value and are assessed on an ongoing basis to determine that they actually have been highly effective throughout the financial reporting periods for which they were designated.
Fair value hedges
In accordance with its wider risk management, as set out in Note 37(d)(i), it is the Bank’s strategy to apply fair value hedge accounting to keep interest rate sensitivities within its established limits. Applying fair value hedge accounting enables the Bank to reduce fair value fluctuations of fixed rate financial assets and liabilities as if they were floating rate instruments linked to the attributable benchmark rates. From a hedge accounting point of view, the bank designates the hedged risk as the exposure to changes in the fair value of a recognised financial asset or liability or an unrecognised firm commitment, or an identified portion of such financial assets, liabilities or firm commitments that is attributable to a particular risk and could affect profit or loss. The Bank only hedges changes due to interest rates such as benchmark rates (e.g. LIBOR), which are typically the most significant component of the overall fair value change. The Bank assesses hedge effectiveness by comparing fair value movements of the hedging instruments and the hedged items attributable to changes in these benchmark rates using the hypothetical derivative method as set out above.
In accordance with its hedging strategy, the Bank matches the principal of the hedging instruments to the principal of the hedged items, including prepayment expectations. The Bank uses pay fixed/receive floating interest rate swaps to hedge its fixed rate debt instruments and pay floating/receive fixed interest rate swaps to hedge its fixed rate liabilities. The bank applies only a micro fair value hedging strategy as set out under the relevant subheadings below.
Hedge ineffectiveness can arise from: • Differences in timing of cash flows of hedged items and hedging instruments.• Different interest rate curves applied to discount the hedged items and hedging instruments.• Derivatives used as hedging instruments having a non-nil fair value at the time of designation.• The effect of changes in counterparties’ credit risk on the fair values of hedging instruments or hedged item.
For designated and qualifying fair value hedges, the cumulative change in the fair value of a hedging derivative is recognised in the statement of profit or loss in Net gain/loss from financial instruments. In addition, the cumulative change in the fair value of the hedged item attributable to the hedged risk is recognised in the statement of profit or loss in Net gain/loss from financial instruments, and also recorded as part of the carrying value of the hedged item in the statement of financial position.
145ANNUAL REPORT 2018
SBM BANK (MAURITIUS) LTD

Notes to the Financial Statements FOR THE YEAR ENDED 31 DECEMBER 2018
8. DERIVATIVE FINANCIAL INSTRUMENTS (CONT’D)
Accounting policy (cont’d)
Micro fair value hedges
A fair value hedge relationship is a ‘Micro fair value hedge’ when the hedged item (or group of items) is a distinctively identifiable asset or liability hedged by one or a few hedging instruments. The financial instruments hedged for interest rate risk in a fair value hedge relationship include fixed rate corporate and small business loans. These hedge relationships are assessed for prospective hedge effectiveness on a monthly basis.
If the hedging instrument expires or is sold, terminated or exercised, or when the hedge no longer meets the criteria for hedge accounting, or the Bank decides to voluntarily discontinue the hedging relationship, the hedge relationship is discontinued prospectively. If the relationship does not meet the hedge effectiveness criteria, the Bank discontinues hedge accounting from the last date on which compliance with hedge effectiveness was demonstrated. If the hedge accounting relationship is terminated for an item recorded at amortised cost, the accumulated fair value hedge adjustment to the carrying amount of the hedged item is amortised over the remaining term of the original hedge by recalculating the EIR. If the hedged item is derecognised, the unamortised fair value adjustment is recognised immediately in the statement of profit or loss.
For fair value hedge relationships where the hedged item is not measured at amortised cost, such as debt instruments at FVTOCI, changes in fair value that were recorded in the statement of profit or loss whilst hedge accounting was in place are amortised in a similar way to amortised cost instruments using the EIR method. However, as these instruments are measured at their fair values in the statement of financial position, the fair value hedge adjustments are transferred from the statement of profit or loss to OCI. There were no such instances in either the current year or in the comparative year.
31 December 31 December 31 December2018 2017 2016
MUR’ 000 MUR’ 000 MUR’ 000AssetsDerivative assets 762,855 1,356,774 165,997
LiabilitiesDerivative liabilities 758,642 1,334,584 182,406
SBM BANK (MAURITIUS) LTD146 ANNUAL REPORT 2018

Notes to the Financial Statements FOR THE YEAR ENDED 31 DECEMBER 2018
8. DERIVATIVE FINANCIAL INSTRUMENTS (CONT’D)
The fair values of derivative instruments are further analysed as follows:
Notional Principal Amount
-------------Fair Values-------------Assets Liabilities Net
MUR’ 000 MUR’ 000 MUR’ 000 MUR’ 00031 December 2018Derivatives held for tradingForeign exchange contracts* 25,636,819 256,947 (126,964) 129,983Cross currency swaps 1,159,362 378,697 (371,679) 7,018Other derivative contracts 23,896,447 112,966 (111,123) 1,843Derivatives used as Micro fair value hedgesInterest rate swap contracts 14,395,001 14,245 (148,876) (134,631)
65,087,629 762,855 (758,642) 4,21331 December 2017Derivatives held for tradingForeign exchange contracts* 33,999,244 268,858 (249,698) 19,160Cross currency swaps 1,747,584 1,220 (1,220) - Other derivative contracts 67,643,651 1,081,130 (1,078,240) 2,890Derivatives used as Micro fair value hedgesInterest rate swap contracts 8,348,656 5,566 (5,426) 140
111,739,135 1,356,774 (1,334,584) 22,19031 December 2016Foreign exchange contracts* 15,578,685 98,281 (85,388) 12,893Cross currency swaps 729,218 33,163 (44,218) (11,055)Other derivative contracts 1,906,937 27,093 (25,058) 2,035Derivatives used as Micro fair value hedgesInterest rate swap contracts 2,184,507 7,460 (27,742) (20,282)
20,399,347 165,997 (182,406) (16,409)
* Foreign exchange contracts include forward and spot contracts.
147ANNUAL REPORT 2018
SBM BANK (MAURITIUS) LTD

Notes to the Financial Statements FOR THE YEAR ENDED 31 DECEMBER 2018
9. LOANS AND ADVANCES TO NON-BANK CUSTOMERS
Accounting policy
Prior to 01 January 2018
Loans and receivables are non-derivative financial assets with fixed or determinable payments that are not quoted in an active market. Loans and receivables are measured at amortised cost using the effective interest method, less any impairment. Interest income is recognised by applying the effective interest rate.
Loans and advances to non-bank customers are classified under loans and receivables and are measured at amortised cost, less allowance for credit impairment. In cases where, as part of the Bank’s asset and liability management activity, fair value hedge accounting is applied to loans and advances measured at amortised cost, their carrying amount is adjusted for changes in fair value related to the hedged exposure – refer to Note 8 (Derivative financial instruments) for further details on hedge accounting. Allowance for credit impairment consists of specific and portfolio allowances.
From 01 January 2018
From 01 January 2018, the Bank only measures loans and advances to non-bank customers at amortised cost if both of the following conditions are met:
• The financial asset is held within a business model with the objective to hold financial assets in order to collect contractual cash flows; and
• The contractual terms of the financial asset give rise on specified dates to cash flows that are solely payments of principal and interest (SPPI) on the principal amount outstanding.
The details of these conditions are outlined in Note 5(c).
31 December 31 December 31 December2018 2017 2016
MUR’ 000 MUR’ 000 MUR’ 0001. Governments 9,315 2,458,655 - 2. Retail customers 32,121,253 31,990,963 28,099,055 2.1. Credit cards 606,447 559,351 539,910 2.2. Mortgages 22,478,894 19,834,763 17,315,922 2.3. Other retail loans 9,035,912 11,596,849 10,243,2233. Corporate customers 44,758,253 38,364,068 37,012,4994. Entities outside Mauritius 22,909,421 31,446,393 10,098,489
99,798,242 104,260,079 75,210,043Less credit loss allowance (5,502,191) (3,420,848) (4,051,929)
94,296,051 100,839,231 71,158,114a Remaining term to maturity
Up to 3 months 11,726,983 13,716,387 11,753,409Over 3 months and up to 6 months 3,256,357 5,618,303 3,640,541Over 6 months and up to 12 months 8,875,377 11,677,239 5,085,778Over 1 year and up to 2 years 8,529,760 6,525,561 5,082,157Over 2 years and up to 5 years 17,565,447 22,653,075 13,825,322Over 5 years 49,844,318 44,069,514 35,822,836
99,798,242 104,260,079 75,210,043
Out of the MUR 94.3 billion, there is an amount of MUR 4.67 billion (2017: MUR 2.28 billion, 2016: MUR 137 million) relating to loans where fair value hedge accounting has been applied. Refer to Note 37(d)(ii) for more details.
SBM BANK (MAURITIUS) LTD148 ANNUAL REPORT 2018

Notes to the Financial Statements FOR THE YEAR ENDED 31 DECEMBER 2018
9. LOANS AND ADVANCES TO NON-BANK CUSTOMERS (CONT’D)
b Net investment in finance leases
Accounting policy
Amounts due from lessees under finance leases are recorded as loans and advances at the amount of the Bank’s net investment in the leases. Finance lease income is allocated to accounting periods so as to reflect a constant periodic rate of return on the net investment outstanding in respect of the leases.
The amount of net investment in finance leases included in loans and advances to non-bank customers and the associated allowance for credit impairment are as follows:
Up to 1 year
After 1 year and up to 5
yearsAfter
5 years TotalMUR’ 000 MUR’ 000 MUR’ 000 MUR’ 000
31 December 2018Gross investment in finance leases 432,719 948,760 100,295 1,481,774Less: Unearned finance income (72,313) (114,792) (4,769) (191,874)Present value of minimum lease payments 360,406 833,968 95,526 1,289,900Credit loss expense (45,055)Net investment in finance lease 1,244,84531 December 2017Gross investment in finance leases 419,939 822,981 78,637 1,321,557Less: Unearned finance income (63,613) (91,106) (4,083) (158,802)Present value of minimum lease payments 356,326 731,875 74,554 1,162,755Credit loss expense (38,373)Net investment in finance lease 1,124,38231 December 2016Gross investment in finance leases 451,572 684,966 31,023 1,167,561Less: Unearned finance income (62,419) (72,437) (1,503) (136,359)Present value of minimum lease payments 389,153 612,529 29,520 1,031,202Credit loss expense (70,490)Net investment in finance lease 960,712
Finance lease contracts give the lessees the option to purchase the assets for a residual value at the termination of the lease arrangements. The term of lease contracts generally ranges from five to seven years. Finance leases are secured mainly by charges on the leased assets and corporate or personal guarantees.
149ANNUAL REPORT 2018
SBM BANK (MAURITIUS) LTD

Notes to the Financial Statements FOR THE YEAR ENDED 31 DECEMBER 2018
9. LOANS AND ADVANCES TO NON-BANK CUSTOMERS (CONT’D)
c Credit loss allowance on loans and advances to non-bank customers
Accounting policy
Prior to 01 January 2018
Specific allowances are made on impaired advances and are calculated as the shortfall between the carrying amounts of the advances and their recoverable amounts. The recoverable amount is the present value of expected future cash flows discounted at the original effective interest rate of the advance.
From 01 January 2018
As described in Note 4, the adoption of IFRS 9 has fundamentally changed the Bank’s loan loss impairment method by replacing IAS 39’s incurred loss approach with a forward-looking ECL approach. From 01 January 2018, the Bank has been recording allowance for expected credit losses for all loans and other debt financial assets not held at FVTPL, together with loan commitments and financial guarantee contracts, in this section all referred to as ‘financial instruments’. Equity instruments are not subject to impairment under IFRS 9.
The ECL allowance is based on the credit losses expected to arise over the life of the asset (the lifetime expected credit loss or LTECL), unless there has been no significant increase in credit risk since origination, in which case, the allowance is based on the 12 months’ expected credit loss (12mECL). The Bank’s policies for determining if there has been a significant increase in credit risk are set out in Note 37. The 12mECL is the portion of LTECLs that represent the ECLs that result from default events on a financial instrument that are possible within the 12 months after the reporting date.
Both LTECLs and 12mECLs are calculated on either an individual basis or a collective basis, depending on the nature of the underlying portfolio of financial instruments.
The Bank has established a policy to perform an assessment, at the end of each reporting period, of whether a financial instrument’s credit risk has increased significantly since initial recognition, by considering the change in the risk of default occurring over the remaining life of the financial instrument.
For financial assets for which the Bank has no reasonable expectations of recovering either the entire outstanding amount, or a proportion thereof, the gross carrying amount of the financial asset is reduced. This is considered a (partial) derecognition of the financial asset.
The calculation of ECLs
The Bank calculates ECLs based on one scenario to measure the expected cash shortfalls, discounted at an approximation to the EIR. A cash shortfall is the difference between the cash flows that are due to an entity in accordance with the contract and the cash flows that the entity expects to receive.
The mechanics of the ECL calculations are outlined below and the key elements are, as follows:
• PD - The Probability of Default is an estimate of the likelihood of default over a given time horizon. A default may only happen at a certain time over the assessed period, if the facility has not been previously derecognised and is still in the portfolio. The concept of PDs is further explained in Note 37.
• EAD - The Exposure at Default is an estimate of the exposure at a future default date, taking into account expected changes in the exposure after the reporting date, including repayments of principal and interest, whether scheduled by contract or otherwise, expected drawdowns on committed facilities, and accrued interest from missed payments. The EAD is further explained in Note 37.
• LGD - The Loss Given Default is an estimate of the loss arising in the case where a default occurs at a given time. It is based on the difference between the contractual cash flows due and those that the lender would expect to receive, including from the realisation of any collateral. It is usually expressed as a percentage of the EAD. The LGD is further explained in Note 37.
SBM BANK (MAURITIUS) LTD150 ANNUAL REPORT 2018

Notes to the Financial Statements FOR THE YEAR ENDED 31 DECEMBER 2018
9. LOANS AND ADVANCES TO NON-BANK CUSTOMERS (CONT’D)
c Credit loss allowance on loans and advances to non-bank customers (cont’d)
Accounting policy (cont’d)
The calculation of ECLs (cont’d)
When estimating the macro-economic variables used in ECL calculation, the Bank considers four scenarios (a base case, an upside, a mild downside (‘downside 1’) and a more extreme downside (‘downside 2’)). Each of these is associated with different PDs, EADs and LGDs, as set out in Note 37. When relevant, the assessment of multiple scenarios also incorporates how defaulted loans are expected to be recovered, including the probability that the loans will cure and the value of collateral or the amount that might be received for selling the asset.
With the exception of credit cards and other revolving facilities, for which the treatment is separately set out below, the maximum period for which the credit losses are determined is the contractual life of a financial instrument unless the Bank has the legal right to call it earlier.
Credit loss allowances and releases are accounted for and disclosed separately from modification losses or gains that are accounted for as an adjustment of the financial asset’s gross carrying value. Provisions for ECLs for undrawn loan commitments are assessed as set out in Note 22. The calculation of ECLs (including the ECLs related to the undrawn element) of revolving facilities such as credit cards is explained in Note 22.
The mechanics of the ECL method are summarised below:
Stage 1: The 12mECL is calculated as the portion of LTECLs that represent the ECLs that result from default events on a financial instrument that are possible within the 12 months after the reporting date. The Bank calculates the 12mECL allowance based on the expectation of a default occurring in the 12 months following the reporting date. These expected 12-month default probabilities are applied to a forecast EAD and multiplied by the expected LGD and discounted by an approximation to the original EIR.
Stage 2: When a loan has shown a significant increase in credit risk since origination, the Bank records an allowance for the LTECLs. The mechanics are similar to those explained above, including the use of multiple scenarios, but PDs and LGDs are estimated over the lifetime of the instrument. The expected cash shortfalls are discounted by an approximation to the original EIR.
Stage 3: For loans considered credit-impaired, the Bank recognises the lifetime expected credit losses for these loans. The method is similar to that for stage 2 assets, with the PD set at 100%.
Loan commitments and letters of credit:
When estimating LTECLs for undrawn loan commitments, the Bank estimates the expected portion of the loan commitment that will be drawn down over its expected life. The ECL is then based on the present value of the expected shortfalls in cashflows if the loan is drawn down. The expected cash shortfalls are discounted at an approximation to the expected EIR on the loan. For credit cards and revolving facilities that include both a loan and an undrawn commitment, ECLs are calculated and presented together with the loan. For loan commitments and letters of credit, the ECL is recognised within other liabilities.
Financial guarantee contracts:
The Bank’s liability under each guarantee is measured at the higher of the amount initially recognised less cumulative amortisation recognised in the statement of profit or loss, and the ECL provision. For this purpose, the Bank estimates ECLs based on the present value of the expected payments to reimburse the holder for a credit loss that it incurs. The shortfalls are discounted by the risk-adjusted interest rate relevant to the exposure. The ECLs related to financial guarantee contracts are recognised within other liabilities.
Debt instruments measured at fair value through OCI
The ECLs for debt instruments measured at FVTOCI do not reduce the carrying amount of these financial assets in the statement of financial position, which remains at fair value. Instead, an amount equal to the allowance that would arise if the assets were measured at amortised cost is recognised in OCI as an accumulated impairment amount, with a corresponding charge to profit or loss. The accumulated loss recognised in OCI is recycled to the profit and loss upon derecognition of the assets.
151ANNUAL REPORT 2018
SBM BANK (MAURITIUS) LTD

Notes to the Financial Statements FOR THE YEAR ENDED 31 DECEMBER 2018
9. LOANS AND ADVANCES TO NON-BANK CUSTOMERS (CONT’D)
c Credit loss allowance on loans and advances to non-bank customers (cont’d)
Accounting policy (cont’d)
Purchased or originated credit impaired financial assets (POCI)
For POCI financial assets, the Bank only recognises the cumulative changes in LTECL since initial recognition in the loss allowance.
Credit cards and other revolving facilities
The Bank’s product offering includes a variety of corporate and retail overdraft and credit cards facilities, in which the Bank has the right to cancel and/or reduce the facilities with one day’s notice. The Bank does not limit its exposure to credit losses to the contractual notice period but instead calculates ECL over a period that reflects the Bank’s expectations of the customer behaviour, its likelihood of default and the Bank’s future risk mitigation procedures, which could include reducing or cancelling the facilities. Based on past experience and the Bank’s expectations, the period over which the Bank calculates ECLs for these products, is one year for corporate and retail products.
The ongoing assessment of whether a significant increase in credit risk has occurred for revolving facilities is similar to other lending products. This is based on shifts in the customer’s internal credit grade, but greater emphasis is also given to qualitative factors such as changes in usage.
The interest rate used to discount the ECLs for credit cards is based on the average effective interest rate that is expected to be charged over the expected period of exposure to the facilities. This estimation takes into account that many facilities are repaid in full each month and are consequently charged no interest.
The calculation of ECLs, including the estimation of the expected period of exposure and discount rate is made on an individual basis for corporate and on a collective basis for retail products. The collective assessments are made separately for portfolios of facilities with similar credit risk characteristics.
Forward looking information
In its ECL models, the Bank relies on a broad range of forward looking information as economic inputs, such as:
• GDP growth;
• Unemployment rates;
• Central Bank base rates; and
• Consumer price indices.
The inputs and models used for calculating ECLs may not always capture all characteristics of the market at the date of the financial statements. To reflect this, qualitative adjustments or overlays are occasionally made as temporary adjustments when such differences are significantly material.
Collateral valuation
To mitigate its credit risks on financial assets, the Bank seeks to use collateral, where possible. The collateral comes in various forms, such as cash, securities, letters of credit/guarantees, real estate, receivables, inventories, other non-financial assets and credit enhancements such as netting agreements. The Bank’s accounting policy for collateral assigned to it through its lending arrangements under IFRS 9 is the same as it was under IAS 39. Collateral, unless repossessed, is not recorded on the Bank’s statement of financial position. However, the fair value of collateral affects the calculation of ECLs. It is generally assessed, at a minimum, at inception and re-assessed on a quarterly basis. However, some collateral, for example, cash or securities relating to margining requirements, is valued daily.
To the extent possible, the Bank uses active market data for valuing financial assets held as collateral. Other financial assets which do not have readily determinable market values are valued using models. Non-financial collateral, such as real estate, is valued based on data provided by third parties such as mortgage brokers, or based on housing price indices.
SBM BANK (MAURITIUS) LTD152 ANNUAL REPORT 2018
Notes to the Financial Statements FOR THE YEAR ENDED 31 DECEMBER 2018
9. LOANS AND ADVANCES TO NON-BANK CUSTOMERS (CONT’D)
c Credit loss allowance on loans and advances to non-bank customers (cont’d)
Accounting policy (cont’d)
Collateral repossessed
The Bank’s accounting policy under IFRS 9 remains the same as it was under IAS 39. The Bank’s policy is to determine whether a repossessed asset can be best used for its internal operations or should be sold. Assets determined to be useful for the internal operations are transferred to their relevant asset category at the lower of their repossessed value or the carrying value of the original secured asset. Assets for which selling is determined to be a better option are transferred to assets held for sale at their fair value (if financial assets) and fair value less cost to sell for non-financial assets at the repossession date inline with the Bank’s policy.
In its normal course of business, the Bank does not physically repossess properties or other assets in its retail portfolio, but engages external agents to recover funds, generally at auction, to settle outstanding debt. Any surplus funds are returned to the customers/obligors. As a result of this practice, the residential properties under legal repossession processes are not recorded on the statement of financial position.
Write-offs
The Bank’s accounting policy under IFRS 9 remains the same as it was under IAS 39. Financial assets are written off either partially or in their entirety only when the Bank has stopped pursuing the recovery. If the amount to be written off is greater than the accumulated loss allowance, the difference is first treated as an addition to the allowance that is then applied against the gross carrying amount. Any subsequent recoveries are credited to credit loss expense.
Forborne and modified loans
The Bank sometimes makes concessions or modifications to the original terms of loans as a response to the borrower’s financial difficulties, rather than taking possession or to otherwise enforce collection of collateral. The Bank considers a loan forborne when such concessions or modifications are provided as a result of the borrower’s present or expected financial difficulties and the Bank would not have agreed to them if the borrower had been financially healthy. Indicators of financial difficulties include defaults on covenants, or significant concerns raised by the Credit Risk Department. Forbearance may involve extending the payment arrangements and the agreement of new loan conditions. Once the terms have been renegotiated, any impairment is measured using the original EIR as calculated before the modification of terms. It is the Bank’s policy to monitor forborne loans to help ensure that future payments continue to be likely to occur.
Derecognition decisions and classification between stage 2 and stage 3 are determined on a case-by-case basis. If these procedures identify a loss in relation to a loan, it is disclosed and managed as an impaired stage 3 forborne asset until it is collected or written off.
From 01 January 2018, when the loan has been renegotiated or modified but not derecognised, the Bank also reassesses whether there has been a significant increase in credit risk.The Bank also considers whether the assets should be classified as stage 3. Once an asset has been classified as forborne, it will remain forborne for a minimum 24-month probation period. In order for the loan to be reclassified out of the forborne category, the customer has to meet all of the following criteria:
• All of its facilities has to be considered performing;
• The probation period of two years has passed from the date the forborne contract was considered performing;
• Regular payments of more than an insignificant amount of principal or interest have been made during at least half of the probation period; and
• The customer does not have any contract that is more than 30 days past due.
If modifications are substantial, the loan is derecognised, and a new loan is recognised.
153ANNUAL REPORT 2018
SBM BANK (MAURITIUS) LTD

Notes to the Financial Statements FOR THE YEAR ENDED 31 DECEMBER 2018
9. LOANS AND ADVANCES TO NON-BANK CUSTOMERS (CONT’D)
c Credit loss allowance on loans and advances to non-bank customers (cont’d)
Accounting policy (cont’d)
Statutory portfolio allowance
A portfolio allowance for credit losses is maintained in accordance with the guidelines of the Bank of Mauritius. These guidelines require that the Bank maintains a provision for credit impairment on all unimpaired loans and advances of not less than 1%. In addition, the Bank of Mauritius also imposes additional macro-prudential provisioning of up to 1% on exposures to certain sectors of the economy.
Allowance for credit impairment in respect of on-balance sheet items is deducted from the applicable asset whereas the allowance for credit impairment in respect of off-balance sheet items is included in Other liabilities in the statement of financial position. Changes in the carrying amount of the allowance accounts are recognised in the statement of profit or loss. When an advance is uncollectible, it is written off against the specific allowance. Subsequent recoveries of amounts previously written off are credited to “Credit loss expense” in the statement of profit or loss.
Where possible, the Bank seeks to restructure loans rather than to take possession of collateral. This may involve extending the payment arrangements and the agreement of new loan conditions. Once the terms have been renegotiated, any impairment is measured using the original effective interest rate (EIR) as calculated before the modification of terms and the loan is no longer considered past due. Management continuously reviews renegotiated loans to ensure that all criteria are met and that future payments are likely to occur. The loans continue to be subject to an individual or collective impairment assessment, calculated using the loan’s original effective interest rate.
Significant accounting estimates and judgements
Prior to 01 January 2018
The calculation of specific allowance for credit impairment required significant management judgement to estimate the recoverable amount of each impaired asset, which is the estimated future cash flows discounted at the original effective interest rate of the advance. Where cash flows for large credits include the realisable value of collateral securing the credit, the value of such collateral is based on the opinion of independent and qualified appraisers.
From 01 January 2018
The measurement of impairment losses both under IFRS 9 and IAS 39 across all categories of financial assets requires judgement, in particular, the estimation of the amount and timing of future cash flows and collateral values when determining impairment losses and the assessment of a significant increase in credit risk. These estimates are driven by a number of factors, changes in which can result in different levels of allowances.
The Bank’s ECL calculations are outputs of complex models with a number of underlying assumptions regarding the choice of variable inputs and their interdependencies. Elements of the ECL models that are considered accounting judgements and estimates include:
• The Bank’s internal credit grading model, which assigns PDs to the individual grades;
• The Bank’s criteria for assessing if there has been a significant increase in credit risk and so allowances for financial assets should be measured on a LTECL basis and the qualitative assessment;
• The segmentation of financial assets when their ECL is assessed on a collective basis;
• Development of ECL models, including the various formulas and the choice of inputs;
• Determination of associations between macroeconomic scenarios and economic inputs, such as unemployment levels and collateral values, and the effect on PDs, EADs and LGDs;
• Selection of forward-looking macroeconomic scenarios and their probability weightings, to derive the economic inputs into the ECL models.
SBM BANK (MAURITIUS) LTD154 ANNUAL REPORT 2018

Notes to the Financial Statements FOR THE YEAR ENDED 31 DECEMBER 2018
9. LOANS AND ADVANCES TO NON-BANK CUSTOMERS (CONT’D)
c Credit loss allowance on loans and advances to non-bank customers (cont’d)
Significant accounting estimates and judgements (cont’d)
In relation to credit impaired facilities, the Bank determines expected credit losses by estimating the shortfall between the present value of expected cash flows and the present value of contractual cash flows. The estimation of expected cash flows is inherently judgemental and involves an estimation of proceeds from liquidation of the borrowers, proceeds from realisation of collaterals and the timing and extent of repayments on forborne facilities.
During the year, a group of connected debtors with an outstanding gross exposure of MUR 9.8 billion (MUR 4.4 billion net of cash and liquid assets held as collaterals) became credit impaired. In estimating the resulting expected credit losses on these facilities, Management estimated future cash flows expected to be realised by the Bank by considering the collaterals it held as well as other assets it could reasonably expect to obtain from the borrowers through a number of legal actions available as at the reporting date, including the exercising of personal guarantees provided by the shareholders directors of the borrowing companies. Among such assets are shares in a sugar company owned by the shareholders together with loans extended by the shareholders to that company. The expected credit losses were hence determined as the difference between the carrying value of the exposures and the present value of cash flows expected from the realisation of the Bank’s collaterals and the other assets it would obtain from the shareholders. The recoverable amounts of properties held as collaterals were estimated based on independent valuers’ reports discounted to reflect valuation risks and time value of money. The recoverable value of shares in the sugar company was determined based on book values of the entity discounted to reflect valuation risks and time value of money.
Subsequent to the year end, the Bank restructured these facilities by extending the repayment period and including the shares in the sugar companies as additional collaterals securing the restructured loans.
The credit loss allowance booked on this group of related debtors is disclosed in Note 37(c) to this financial statements.
155ANNUAL REPORT 2018
SBM BANK (MAURITIUS) LTD
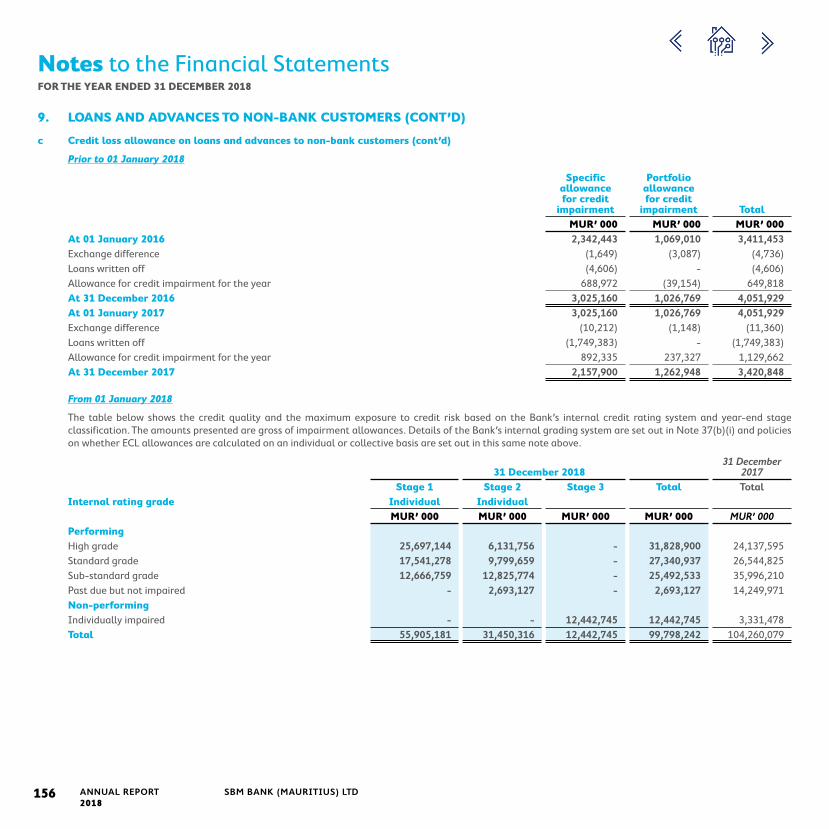
Notes to the Financial Statements FOR THE YEAR ENDED 31 DECEMBER 2018
9. LOANS AND ADVANCES TO NON-BANK CUSTOMERS (CONT’D)
c Credit loss allowance on loans and advances to non-bank customers (cont’d)
Prior to 01 January 2018
Specific allowance for credit
impairment
Portfolio allowance for credit
impairment TotalMUR’ 000 MUR’ 000 MUR’ 000
At 01 January 2016 2,342,443 1,069,010 3,411,453Exchange difference (1,649) (3,087) (4,736)Loans written off (4,606) - (4,606)Allowance for credit impairment for the year 688,972 (39,154) 649,818At 31 December 2016 3,025,160 1,026,769 4,051,929At 01 January 2017 3,025,160 1,026,769 4,051,929Exchange difference (10,212) (1,148) (11,360)Loans written off (1,749,383) - (1,749,383)Allowance for credit impairment for the year 892,335 237,327 1,129,662At 31 December 2017 2,157,900 1,262,948 3,420,848
From 01 January 2018
The table below shows the credit quality and the maximum exposure to credit risk based on the Bank’s internal credit rating system and year-end stage classification. The amounts presented are gross of impairment allowances. Details of the Bank’s internal grading system are set out in Note 37(b)(i) and policies on whether ECL allowances are calculated on an individual or collective basis are set out in this same note above.
31 December 201831 December
2017Stage 1 Stage 2 Stage 3 Total Total
Internal rating grade Individual IndividualMUR’ 000 MUR’ 000 MUR’ 000 MUR’ 000 MUR’ 000
PerformingHigh grade 25,697,144 6,131,756 - 31,828,900 24,137,595Standard grade 17,541,278 9,799,659 - 27,340,937 26,544,825Sub-standard grade 12,666,759 12,825,774 - 25,492,533 35,996,210Past due but not impaired - 2,693,127 - 2,693,127 14,249,971Non-performing Individually impaired - - 12,442,745 12,442,745 3,331,478Total 55,905,181 31,450,316 12,442,745 99,798,242 104,260,079
SBM BANK (MAURITIUS) LTD156 ANNUAL REPORT 2018

Notes to the Financial Statements FOR THE YEAR ENDED 31 DECEMBER 2018
9. LOANS AND ADVANCES TO NON-BANK CUSTOMERS (CONT’D)
c Credit loss allowance on loans and advances to non-bank customers (cont’d)
An analysis of changes in the gross carrying amount and the corresponding ECL allowances is, as follows:
Stage 1 Stage 2 Stage 3 TotalIndividual Individual
MUR’000 MUR’000 MUR’000 MUR’000Gross carrying amount as at 1 January 2018 74,987,399 25,941,203 3,331,478 104,260,080New assets originated or purchased 7,795,757 24,866,568 2,548,243 35,210,568Assets derecognised or repaid (excluding write offs) (18,136,288) (13,040,332) (938,151) (32,114,771)Transfers to Stage 1 14,406,970 (14,406,970) - - Transfers to Stage 2 (8,089,847) 8,089,847 - - Transfers to Stage 3 (8,436,495) - 8,436,495 - Changes to contractual cash flows due to modifications not resulting in derecognition - - - - Amounts written off - - (7,855) (7,855)Derecognition of Indian Operations following distribution in specie (6,622,315) - (927,465) (7,549,780)At 31 December 2018 55,905,181 31,450,316 12,442,745 99,798,242
Stage 1 Stage 2 Stage 3 TotalIndividual Individual
MUR’000 MUR’000 MUR’000 MUR’000ECL allowance as at 1 January 2018 794,155 487,384 2,157,900 3,439,439 New assets originated or purchased (9,921) 463,680 2,779,664 3,233,423 Assets derecognised or repaid (excluding write offs) (19,516) (132,020) - (151,536)Transfers to Stage 1 11,317 (11,317) - - Transfers to Stage 2 (54,029) 54,029 - - Transfers to Stage 3 (117,878) - 117,878 - Impact on year end ECL of exposures transferred between stages during the year - - - - Changes to contractual cash flows due to modifications not resulting in derecognition - - - - Derecognition of Indian Operations following distribution in specie (175,706) (4,137) (825,562) (1,005,405)Recoveries - - - - Amounts written off - - (7,756) (7,756)Foreign exchange adjustments (5,974) - - (5,974)At 31 December 2018 422,448 857,619 4,222,124 5,502,191
Movements in the loss allowances arising from loans and advances to non-bank customers under IAS 39 over 2017 included MUR’000 3,233,423 new loans made during the financial year and MUR’000 151,536 derecognised due to loans matured.
157ANNUAL REPORT 2018
SBM BANK (MAURITIUS) LTD

Notes to the Financial Statements FOR THE YEAR ENDED 31 DECEMBER 2018
9. LOANS AND ADVANCES TO NON-BANK CUSTOMERS (CONT’D)
d Credit loss allowances on loans and advances by industry sectors
31 December 31 December 31 December2018 2017 2016
Gross amount of
loansImpaired
loans
Specific allowance for credit
impairment
Portfolio allowance for credit
impairment
Total allowances for credit
impairment
Total allowances for credit
impairment
Total allowances for credit
impairmentMUR’ 000 MUR’ 000 MUR’ 000 MUR’ 000 MUR’ 000 MUR’ 000 MUR’ 000
Agriculture and fishing 5,614,345 275 62 147,846 147,908 42,141 100,355Manufacturing 3,538,361 703,002 465,595 49,368 514,963 1,151,596 386,369 of which EPZ 1,185,948 38,136 3,628 13,490 17,118 43,543 38,542Tourism 10,799,224 11,427 9,662 174,757 184,419 215,422 202,253Transport 3,007,926 13,660 12,762 131,095 143,857 22,121 497,186Construction 7,574,624 240,034 166,121 198,537 364,658 227,777 235,842Financial and business services 11,435,321 521,304 129,200 56,009 185,209 122,453 534,665Traders 15,601,502 9,883,774 2,640,552 74,962 2,715,514 255,285 230,261Personal 31,493,159 858,399 641,581 249,992 891,573 1,096,093 1,174,362 of which credit cards 616,509 90,078 90,078 3,405 93,483 94,278 93,622Professional 204,322 108,849 98,896 4,363 103,259 105,957 2,086Global Business Licence holders 4,115,179 15,593 15,593 89,975 105,568 15,918 5,354Others 6,414,279 86,428 42,101 103,162 145,263 166,085 683,196
99,798,242 12,442,745 4,222,125 1,280,066 5,502,191 3,420,848 4,051,929
Total impaired loans for 2017 for the Bank were MUR 3,331 million (2016: MUR 4,911 million).
SBM BANK (MAURITIUS) LTD158 ANNUAL REPORT 2018

Notes to the Financial Statements FOR THE YEAR ENDED 31 DECEMBER 2018
10. INVESTMENT SECURITIES
Accounting policy
Financial assets are recognised when an entity becomes a party to the contractual provisions of the instruments.
Prior to 01 January 2018
Financial assets are initially measured at fair value. Transaction costs that are directly attributable to the acquisition or issue of financial assets (other than financial assets at fair value through profit or loss) are added to or deducted from the fair value of the financial assets, as appropriate, on initial recognition. Transaction costs directly attributable to the acquisition of financial assets at fair value through profit or loss are recognised immediately in the statement of profit or loss.
Financial assets are classified into the following specified categories: financial assets at fair-value-through-profit-or-loss (“FVTPL”), loans-and-receivables, held-to-maturity investments and available-for-sale financial assets. The classification depends on the nature and purpose of the financial assets and is determined at the time of initial recognition. All regular way purchases or sales of financial assets are recognised and derecognised on a trade date basis.
(i) Financial assets at FVTPL
Financial assets are classified in the FVTPL category when they are either held for trading or are designated as at FVTPL. Financial assets at FVTPL are stated at fair value, with any gains or losses arising on re-measurement recognised in the statement of profit or loss. Interest earned on the financial asset is included in Interest income line.
The fair values of the investment securities at FVTPL are determined based on quoted market prices in active markets.
(ii) Loans and receivables
Refer to note 9 for accounting policy on loans and receivables.
(iii) Held-to-maturity (HTM) investments
HTM investments are non-derivative financial assets with fixed or determinable payments and fixed maturity dates that the Bank has the positive intent and ability to hold to maturity. Subsequent to initial recognition, HTM investments are measured at amortised cost using the effective interest method less any impairment. Interest income is recognised by applying the effective interest rate.
If the Bank sells or reclassifies more than an insignificant amount of HTM investments before maturity (other than in certain specific circumstances), the entire category will be tainted and will be reclassified as available-for-sale investments. Furthermore, the Bank will not classify any financial asset as held-to-maturity during the following two years.
(iv) Available-for-sale (AFS) investments
AFS financial assets are non-derivatives financial assets that are either designated as AFS or are not classified as (a) loans and receivables, (b) held-to-maturity investments or (c) financial assets at fair value through profit or loss.
The fair values of the AFS investment securities are subsequently remeasured based on quoted market prices in active markets or estimated using dividend growth, discounted cash flows or net assets value. Changes in the carrying amount of AFS monetary financial assets relating to changes in foreign currency rates are recognised in the statement of profit or loss. Other changes in the carrying amount of AFS investment securities are recognised in other comprehensive income and accumulated under the heading of fair value reserve.
When the investment is disposed of or is determined to be impaired, the cumulative gain or loss previously accumulated in the fair value reserve is reclassified to the statement of profit or loss.
Dividends on AFS equity instruments are recognised in the statement of profit or loss when the Bank’s right to receive the dividends is established.
AFS equity investments that do not have a quoted market price in an active market and whose fair value cannot be reliably measured and derivatives that are linked to and must be settled by delivery of such unquoted equity investments are measured at cost less any identified impairment losses at the end of each reporting period.
159ANNUAL REPORT 2018
SBM BANK (MAURITIUS) LTD

Notes to the Financial Statements FOR THE YEAR ENDED 31 DECEMBER 2018
10. INVESTMENT SECURITIES (CONT’D)
Accounting policy (cont’d)
From 01 January 2018
The investment securities included in the statement of financial position include:
- Debt investments measured at amortised cost: these instruments are initially measured at their fair value plus incremental transaction cost, and subsequently at their amortised cost using the effective interest method;
- Debt instruments mandatorily measured at FVTPL or designated at FVTPL; these are measured at fair value with changes recognised immediately in statement of profit or loss;
- Debt securities measured at FVTOCI; and
- Equity investments designated as FVTOCI.
‘For debt securities measured at FVTOCI, gains and losses are recognised in OCI except for the following which are recognised in statement of profit or loss in the same manner as for financial assets measured at amortised cost:
- Interest revenue using the effective interest method;
- ECL and reversals; and
- Foreign exchange gains and lossses.
When a debt security measured at FVTOCI is derecognised, the cumulative gain or loss previously recognised in OCI is reclassified from equity to statement of profit or loss.
Significant accounting estimates and judgements
The fair value of equity investments that are quoted on active markets are based on the quoted prices for these instruments. Valuation techniques used to estimate the fair value of unquoted equity investments include the dividend growth, discounted cash flows and net assets value. Management has made certain assumptions for inputs in the models, such as risk free rate, risk premium, dividend growth rate, future cash flows, weighted average cost of capital, and earnings before interest depreciation and tax based on information available at the reporting date, which may be different from actual.
SBM BANK (MAURITIUS) LTD160 ANNUAL REPORT 2018

Notes to the Financial Statements FOR THE YEAR ENDED 31 DECEMBER 2018
10.INVESTMENT SECURITIES (CONT’D)
The table below shows net balances under IFRS 9 as at 31 December 2018:
Remaining term to maturity
31 December 201831
December 2017
31 December
2016Up to
3 months3-6
months6-9
months9-12
months1-2
years2-5
yearsOver
5 years
No specific
maturity TotalMUR’ 000 MUR’ 000 MUR’ 000 MUR’ 000 MUR’ 000 MUR’ 000 MUR’ 000 MUR’ 000 MUR’ 000 MUR’ 000 MUR’ 000
(a) Investment securities measured at amortised cost Government bonds and treasury notes 91,369 747,861 - 777,648 1,605,600 4,766,609 3,741,584 - 11,730,671 8,664,906 14,218,481Treasury bills - 148,100 - - - - - - 148,100 4,432,043 3,242,761Bank of Mauritius bills / notes - 149,032 118,992 - 762,191 201,683 - - 1,231,898 3,544,186 5,342,047Bank bonds - - - - - 695,818 - - 695,818 - - Corporate bonds - - - - - - - - - 2,565,077 1,394,551
91,369 1,044,993 118,992 777,648 2,367,791 5,664,110 3,741,584 - 13,806,487 19,206,212 24,197,840(b) Investment
securities mandatorily measured at FVTPLGovernment bonds and treasury notes - - - 1,358 - 223,934 539,826 - 765,118 970,594 - Treasury bills 597,828 2,288,062 1,902,344 354,022 - - - - 5,142,256 943,822 - Bank of Mauritius bills / bonds 1,253,365 1,110,374 1,129 742,318 - - - - 3,107,186 1,947,439 - Bank bonds - - 33,889 - 663,334 - - - 697,223 1,650,227 - Corporate bonds - - - - - - - - - 1,164,407 -
1,851,193 3,398,436 1,937,362 1,097,698 663,334 223,934 539,826 - 9,711,783 6,676,489 - (c) Investment
securities measured at FVTOCI (both equity and debt instruments)Government bonds 46,567 19,904 - 581,826 919,904 3,355,051 2,385,724 - 7,308,976 3,439,029 970,159Treasury bills / notes 7,353,679 1,923,173 - 388 - - - - 9,277,240 1,590,498 178,414Bank of Mauritius bills / bonds 322,627 - - - 1,241,916 576,906 - - 2,141,449 1,025,409 - Equity shares of companies: - Equity investments - - - - - - - 3,411 3,411 370 4,058Bank bonds - - - - 3,218,566 2,262,234 294,797 - 5,775,597 533,427 6,808,465Corporate paper and preference shares - - - - - 1,395,858 1,345,585 - 2,741,443 451,160 2,071,193Corporate bonds - - - - - - - - - 4,228,507 184,903Other - - - - - - 171,333 - 171,333 - -
7,722,873 1,943,077 - 582,214 5,380,386 7,590,049 4,197,439 3,411 27,419,450 11,268,400 10,217,192Total investment securities 9,665,435 6,386,506 2,056,354 2,457,560 8,411,511 13,478,093 8,478,849 3,411 50,937,720 37,151,101 34,415,032
161ANNUAL REPORT 2018
SBM BANK (MAURITIUS) LTD

Notes to the Financial Statements FOR THE YEAR ENDED 31 DECEMBER 2018
10. INVESTMENT SECURITIES (CONT’D)
Analysed as follows: 31 December 31 December 31 December2018 2017 2016
MUR’ 000 MUR’ 000 MUR’ 000 - Investment securities 50,934,309 37,150,731 34,410,974 - Equity investments 3,411 370 4,058
50,937,720 37,151,101 34,415,032
31 December 201831 December
2017
Debt investment securities at amortised costStage 1
12-month ECLStage 2
Lifetime ECLStage 3
Lifetime ECL
Total
TotalMUR’000 MUR’000 MUR’000 MUR’000 MUR’000
High grade 695,990 - - 695,990 1,494,314Standard grade 13,119,535 - - 13,119,535 3,724,530Sub-standard grade - - - - 13,987,368Impaired - - - - - Total gross carrying amount 13,815,525 - - 13,815,525 19,206,212Credit loss allowance (9,038) - - (9,038) - Carrying amount as at 31 December 2018 13,806,487 - - 13,806,487 19,206,212
Stage 1 Stage 2 Stage 3 TotalIndividual Individual
MUR’000 MUR’000 MUR’000 MUR’000ECL allowance as at 1 January 2018 16,347 - - 16,347New assets originated or purchased 4,631 - - 4,631Assets derecognised or repaid (excluding write offs) (11,940) - - (11,940)At 31 December 2018 9,038 - - 9,038
31 December 201831 December
2017
Debt investment securities at FVTOCIStage 1
12-month ECLStage 2
Lifetime ECLStage 3
Lifetime ECL
Total
TotalMUR’000 MUR’000 MUR’000 MUR’000 MUR’000
High grade 11,653,048 - - 11,653,048 4,917,417Standard grade 14,152,531 - - 14,152,531 1,969,963Sub-standard grade 1,610,460 - - 1,610,460 4,380,650Impaired - - - - - Carrying amount as at 31 December 2018 27,416,039 - - 27,416,039 11,268,030
No loss allowance is recognised in the statement of financial position for debt instruments measured at FVTPL as the carrying amount is at fair value.
The above investment grades is to conclude that there has been no significant increase in credit risk and hence only a 12 months ECL is recognised.
SBM BANK (MAURITIUS) LTD162 ANNUAL REPORT 2018

Notes to the Financial Statements FOR THE YEAR ENDED 31 DECEMBER 2018
11. PROPERTY AND EQUIPMENT Accounting policy Property and equipment are stated at cost (except for freehold and leasehold land and buildings) less accumulated depreciation and any cumulative impairment loss. Land is stated at revalued amounts and buildings are stated at revalued amounts less accumulated depreciation and any impairment loss.
It is the Bank’s policy to revalue its freehold land and buildings and leasehold buildings at least every five years by independent valuers. Any revaluation surplus is credited to the Property revaluation reserve. Any revaluation decrease is first charged directly against any property revaluation reserve held in respect of the respective asset, and then to the statement of profit or loss.
Work in progress is carried at cost, less any recognised impairment loss. Depreciation of these assets, on the same basis as other tangible fixed assets, commences when the assets are ready for their intended use.
Depreciation is calculated to write off the cost or revalued amounts of tangible fixed assets over their estimated useful lives on a straight-line basis. Depreciation is calculated from the month the asset is capitalised. No depreciation is provided on freehold land.
The estimated useful lives of property and equipment are as follows:
Buildings 50 yearsPlant, machinery, furniture, fittings and computer equipment 3 to 10 yearsMotor vehicles 5 yearsThe gain or loss arising on the disposal or retirement of an item of property and equipment is determined as the difference between the sales proceeds and the carrying amount of the asset. These are included within other operating income in the statement of profit or loss.
Each year, the difference, net of the impact of deferred tax, between the depreciation based on the revalued carrying amount of the asset (the depreciation charged to the statement of profit or loss) and the depreciation based on the asset’s original cost is transferred from the property revaluation reserve to Retained earnings.
Assets held under finance leases are recognised as assets at their fair value at the date of acquisition or, if lower, at the present value of the minimum lease payments and are depreciated over their estimated useful lives. The corresponding liability to the lessor is included in other borrowed funds on the statement of financial position. Lease finance charges are charged to the statement of profit or loss over the term of the leases so as to produce a constant periodic rate of interest on the outstanding obligations under finance leases.
Impairment of non-financial assets
The carrying amounts of assets are assessed at each reporting date to determine whether there is any indication of impairment. If such indication exists, the recoverable amount of the asset is estimated, being the higher of the asset’s net selling price and its value in use, to determine the extent of the impairment loss, if any, and the carrying amount of the asset is reduced to its recoverable amount. The impairment loss is recognised as an expense immediately, unless the asset is carried at revalued amount, in which case the impairment loss is treated as a revaluation decrease.
Freehold land and buildings
Buildings on leasehold
landOther tangible
fixed assetsMotor
vehicles TotalCost or Valuation MUR’ 000 MUR’ 000 MUR’ 000 MUR’ 000 MUR’ 000At 01 January 2016 955,924 1,571,647 1,780,270 5,974 4,313,815 Translation adjustment (4,383) - (887) (33) (5,303)Transfer - - (3,282) - (3,282)Additions 853 1,235 140,797 5,132 148,017 Disposals (300) - - - (300)Write off - - (202,200) - (202,200)At 31 December 2016 952,094 1,572,882 1,714,698 11,073 4,250,747 Translation adjustment (1,892) - (385) (14) (2,291)Additions - - 44,312 901 45,213 Write off - - (58,748) - (58,748)At 31 December 2017 950,202 1,572,882 1,699,877 11,960 4,234,921 Translation adjustment (9,712) - (1,973) (74) (11,759)Transfer - - - - - Additions 553 870 138,230 - 139,653 Disposals - - (35,817) - (35,817)Derecognition of Indian Operations following distribution in specie (155,235) - (54,280) (1,183) (210,698)At 31 December 2018 785,808 1,573,752 1,746,037 10,703 4,116,300
163ANNUAL REPORT 2018
SBM BANK (MAURITIUS) LTD

Notes to the Financial Statements FOR THE YEAR ENDED 31 DECEMBER 2018
11. PROPERTY AND EQUIPMENT (CONT’D) Freehold land and buildings
Buildings on leasehold
landOther tangible
fixed assetsMotor
vehicles TotalAccumulated Depreciation MUR’ 000 MUR’ 000 MUR’ 000 MUR’ 000 MUR’ 000At 01 January 2016 43,042 69,270 1,480,156 4,108 1,596,576 Translation adjustment (778) - (949) (29) (1,756)Transfer - - (3,259) - (3,259)Revaluation (1,480) - - - (1,480)Write off - - (201,687) - (201,687)Charge for the year 13,699 51,976 86,780 1,302 153,757 At 31 December 2016 54,483 121,246 1,361,041 5,381 1,542,151 Translation adjustment (370) - (408) (22) (800)Write off - - (58,687) - (58,687)Charge for the year 14,314 51,996 86,082 1,846 154,238 At 31 December 2017 68,427 173,242 1,388,028 7,205 1,636,902 Translation adjustment (1,899) - (1,634) (73) (3,606)Disposal - - (29,754) - (29,754)Charge for the year 13,792 51,998 86,492 1,455 153,737Derecognition of Indian Operations following distribution in specie (33,403) - (31,613) (1,176) (66,192)At 31 December 2018 46,917 225,240 1,411,519 7,411 1,691,087 Net book valueAt 31 December 2018 738,891 1,348,512 334,518 3,292 2,425,213 Progress payments on tangible fixed assets 33,601
2,458,814 At 31 December 2017 881,775 1,399,640 311,849 4,755 2,598,019 Progress payments on tangible fixed assets 33,763
2,631,782 At 31 December 2016 897,611 1,451,636 353,657 5,692 2,708,596 Progress payments on tangible fixed assets 41,455
2,750,051
Other tangible fixed assets, included within property and equipment, consist of plant, machinery, furniture, fittings and computer equipment.
Details of the Bank’s land and buildings and information about the fair value hierarchy are as follows:
31 December 31 December 31 December2018 2017 2016
Level 2 fair value MUR’ 000 MUR’ 000 MUR’ 000Freehold land and buildings 785,808 950,202 952,094 Buildings on leasehold land 1,573,752 1,572,882 1,572,882
2,359,560 2,523,084 2,524,976
The carrying amounts of land and buildings, that would have been included in the financial statements had the assets been carried at cost, are as follows:
31 December 31 December 31 December2018 2017 2016
MUR’ 000 MUR’ 000 MUR’ 000Freehold land and buildings 447,343 508,905 515,142 Buildings on leasehold land 360,873 374,232 387,557
808,216 883,137 902,699
The freehold land and buildings are periodically valued based on market value by independent valuation surveyor. Buildings on leasehold land in Mauritius were revalued in September 2014 by an independent Chartered Valuation Surveyor, on an open market value basis.
SBM BANK (MAURITIUS) LTD164 ANNUAL REPORT 2018

Notes to the Financial Statements FOR THE YEAR ENDED 31 DECEMBER 2018
12. INTANGIBLE ASSETS
Accounting policy
Intangible assets with finite useful lives, that are acquired separately, are carried at cost less accumulated amortisation and accumulated impairment losses. Intangible assets are amortised on a straight line basis over their estimated useful lives of 3 to 10 years. Costs directly associated with the production of identifiable and software products controlled, that will probably generate economic benefits exceeding costs beyond one year, are recognised as intangible assets.
Significant accounting estimates and judgements
Assessment of useful livesDetermining the carrying amount of intangible assets requires an estimation of the useful lives of these assets which carry a degree of uncertainty. Management has used historical information relating to the Bank and the industry in which it operates in order to best determine the useful lives of intangible assets.
(a) Assets under construction
The Bank had embarked on a business aligned technology transformation programme since 2012. All costs incurred in respect of this project; namely the “Flamingo Project” were capitalised under “asset under construction”. In September 2016, all the assets under construction were transferred to “Software” as the project went live and are now being amortised over their useful lives.
(b) Intellectual property rights
The Bank entered into an agreement in respect of Business Process Engineering and Business Transformation Initiatives to align both its strategies and processes with the Technology Transformation Initiative namely Flamingo Project and also high performance banks. The costs incurred in respect of these initiatives were capitalised as intellectual property rights and are being amortised following the project going live in September 2016.
(c) WIP Software
The Bank is developing few softwares. These costs will be transferred under “Software” as soon as they will be in use at the Bank.
Software
WIP Software (Note c)
Intellectual Property (Note b)
Assets under construction
(Note a) Total MUR’ 000 MUR’ 000 MUR’ 000 MUR’ 000 MUR’ 000
CostAt 01 January 2016 904,771 5,098 525,724 1,820,230 3,255,823 Translation adjustment (478) - (5,197) (37) (5,712)Additions 16,609 2,450 62,609 1,518,570 1,600,238 Write off (129,829) - - - (129,829)Transfers 3,341,410 257,712 (260,359) (3,338,763) - At 31 December 2016 4,132,483 265,260 322,777 - 4,720,520 Translation adjustment (217) (2,954) - - (3,171)Additions 50,532 133,420 - - 183,952 Transfers 312,963 (312,963) - - - At 31 December 2017 4,495,761 82,763 322,777 - 4,901,301Translation adjustment (1,169) (1,925) - - (3,094)Additions 180,595 47,713 - - 228,308Transfers 23,464 (23,464) - - - Disposal (610,148) - - - (610,148)Write off - (1,726) (37,860) - (39,586)Derecognition of Indian operations following distribution in specie (114,374) (33,919) - - (148,293)At 31 December 2018 3,974,129 69,442 284,917 - 4,328,488
165ANNUAL REPORT 2018
SBM BANK (MAURITIUS) LTD

Notes to the Financial Statements FOR THE YEAR ENDED 31 DECEMBER 2018
12. INTANGIBLE ASSETS (CONT’D)
Software WIP
Software Intellectual
PropertyAssets under construction Total
MUR’ 000 MUR’ 000 MUR’ 000 MUR’ 000 MUR’ 000Accumulated amortisationAt 01 January 2016 885,432 - - - 885,432 Translation adjustment (343) - - - (343)Write off (129,830) - - - (129,830)Transfers 3,259 - - - 3,259 Charge for the year 135,100 - 56,983 - 192,083 At 31 December 2016 893,618 - 56,983 - 950,601 Translation adjustment (148) - - - (148)Charge for the year 436,804 - 56,983 - 493,787 At 31 December 2017 1,330,274 - 113,966 - 1,444,240 Translation adjustment (1,081) - - - (1,081)Disposal (610,148) - - - (610,148)Charge for the year 511,676 - 56,983 - 568,659Derecognition of Indian operations following distribution in specie (36,102) - - - (36,102)At 31 December 2018 1,194,619 - 170,949 - 1,365,568 Net book valueAt 31 December 2018 2,779,510 69,442 113,968 - 2,962,920 At 31 December 2017 3,165,487 82,763 208,811 - 3,457,061 At 31 December 2016 3,238,865 265,260 265,794 - 3,769,919
13. OTHER ASSETS
Accounting policy
Prior to 01 January 2018
Other assets and other receivables that have fixed or determinable payments and that are not quoted in an active market are classified as loans and receivables. They are measured at amortised cost, adjusted for any impairment loss. Interest income is recognised by applying the effective interest rate, except for short term receivables where the recognition of interest would be immaterial.
From 01 January 2018
Other assets and other receivables that have fixed or determinable payments and that are not quoted in an active market are classified at amortised costs less any impairment loss. Interest income is recognised by applying the effective interest rate, except for short term receivables where the recognition of interest would be immaterial.
31 December 31 December 31 December2018 2017 2016
MUR’ 000 MUR’ 000 MUR’ 000Accounts receivable1 684,985 547,003 214,873 Balances due in clearing 2,860 56,083 38,166 Tax paid in advance2 - 75,708 106,085 Others3 135,808 245,098 241,628
823,653 923,892 600,752
1 Credit risk is managed for each category and is subject to the Bank’s established policy, procedures and control relating to customers credit risk management. The accounts receivable are mainly transition accounts that will be cleared the following day and therefore is not subject to impairment.2 The tax paid in advance relates to the Indian Operations. The amount is shown net of current tax payable.3 Repossessed assets have been included under ‘Others’. The Bank’s policy is to dispose of such assets as soon as the market permits.
SBM BANK (MAURITIUS) LTD166 ANNUAL REPORT 2018
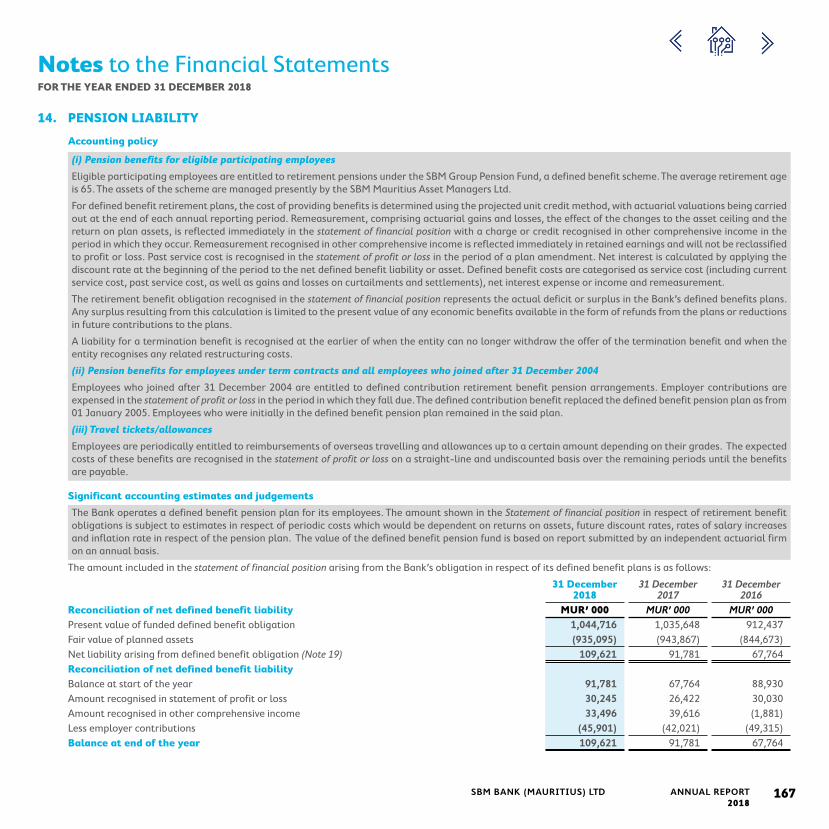
Notes to the Financial Statements FOR THE YEAR ENDED 31 DECEMBER 2018
14. PENSION LIABILITY
Accounting policy
(i) Pension benefits for eligible participating employees
Eligible participating employees are entitled to retirement pensions under the SBM Group Pension Fund, a defined benefit scheme. The average retirement age is 65. The assets of the scheme are managed presently by the SBM Mauritius Asset Managers Ltd.
For defined benefit retirement plans, the cost of providing benefits is determined using the projected unit credit method, with actuarial valuations being carried out at the end of each annual reporting period. Remeasurement, comprising actuarial gains and losses, the effect of the changes to the asset ceiling and the return on plan assets, is reflected immediately in the statement of financial position with a charge or credit recognised in other comprehensive income in the period in which they occur. Remeasurement recognised in other comprehensive income is reflected immediately in retained earnings and will not be reclassified to profit or loss. Past service cost is recognised in the statement of profit or loss in the period of a plan amendment. Net interest is calculated by applying the discount rate at the beginning of the period to the net defined benefit liability or asset. Defined benefit costs are categorised as service cost (including current service cost, past service cost, as well as gains and losses on curtailments and settlements), net interest expense or income and remeasurement.
The retirement benefit obligation recognised in the statement of financial position represents the actual deficit or surplus in the Bank’s defined benefits plans. Any surplus resulting from this calculation is limited to the present value of any economic benefits available in the form of refunds from the plans or reductions in future contributions to the plans.
A liability for a termination benefit is recognised at the earlier of when the entity can no longer withdraw the offer of the termination benefit and when the entity recognises any related restructuring costs.
(ii) Pension benefits for employees under term contracts and all employees who joined after 31 December 2004
Employees who joined after 31 December 2004 are entitled to defined contribution retirement benefit pension arrangements. Employer contributions are expensed in the statement of profit or loss in the period in which they fall due. The defined contribution benefit replaced the defined benefit pension plan as from 01 January 2005. Employees who were initially in the defined benefit pension plan remained in the said plan.
(iii) Travel tickets/allowances
Employees are periodically entitled to reimbursements of overseas travelling and allowances up to a certain amount depending on their grades. The expected costs of these benefits are recognised in the statement of profit or loss on a straight-line and undiscounted basis over the remaining periods until the benefits are payable.
Significant accounting estimates and judgements
The Bank operates a defined benefit pension plan for its employees. The amount shown in the Statement of financial position in respect of retirement benefit obligations is subject to estimates in respect of periodic costs which would be dependent on returns on assets, future discount rates, rates of salary increases and inflation rate in respect of the pension plan. The value of the defined benefit pension fund is based on report submitted by an independent actuarial firm on an annual basis.
The amount included in the statement of financial position arising from the Bank’s obligation in respect of its defined benefit plans is as follows:
31 December 31 December 31 December 2018 2017 2016
Reconciliation of net defined benefit liability MUR’ 000 MUR’ 000 MUR’ 000Present value of funded defined benefit obligation 1,044,716 1,035,648 912,437 Fair value of planned assets (935,095) (943,867) (844,673)Net liability arising from defined benefit obligation (Note 19) 109,621 91,781 67,764 Reconciliation of net defined benefit liabilityBalance at start of the year 91,781 67,764 88,930 Amount recognised in statement of profit or loss 30,245 26,422 30,030 Amount recognised in other comprehensive income 33,496 39,616 (1,881)Less employer contributions (45,901) (42,021) (49,315)Balance at end of the year 109,621 91,781 67,764
167ANNUAL REPORT 2018
SBM BANK (MAURITIUS) LTD

Notes to the Financial Statements FOR THE YEAR ENDED 31 DECEMBER 2018
14. PENSION LIABILITY (CONT’D)
31 December 31 December 31 December 2018 2017 2016
Reconciliation of fair value of planned assets MUR’ 000 MUR’ 000 MUR’ 000Balance at start of the year 943,867 844,673 782,827 Interest income 52,493 54,941 55,581 Employer contributions 45,901 42,021 49,315 Benefits paid (28,872) (40,867) (26,551)Exchange differences 2,143 - - Return on planned assets excluding interest income (80,437) 43,099 (16,499)Balance at end of the year 935,095 943,867 844,673 Reconciliation of present value of defined benefit obligation Balance at start of the year 1,035,648 912,437 871,757 Current service cost 26,473 23,362 25,502 Interest expense 56,294 58,001 60,109 Past service cost (29) - - Other benefits paid (28,872) (40,867) (26,551)Transfer from another entity 2,143 - - Liability experience loss - - 84,856 Liability gain due to change in demographic assumptions - - (103,306)Liability (gain) / loss due to change in financial assumptions (46,941) 82,715 70 Balance at end of the year 1,044,716 1,035,648 912,437 Components of amount recognised in statement of profit or loss Service cost 26,444 23,362 25,502 Net interest on net defined benefit liability 3,801 3,060 4,528 Total expense as above (Note 30) 30,245 26,422 30,030 Components of amount recognised in other comprehensive income Return on planned assets below interest income 80,437 (43,099) 16,499Liability experience loss - - 84,856Liability experience gain due to change in demographic assumptions - - (103,306)Liability (gain) / loss due to change in financial assumptions (46,941) 82,715 70Total 33,496 39,616 (1,881)
SBM BANK (MAURITIUS) LTD168 ANNUAL REPORT 2018

Notes to the Financial Statements FOR THE YEAR ENDED 31 DECEMBER 2018
14. PENSION LIABILITY (CONT’D)
31 December 31 December 31 December 2018 2017 2016
Allocation of planned assets at end of year % % %Equity - Overseas quoted 18 30 30 Equity - Overseas unquoted 10 - - Equity - Local quoted 28 30 32 Equity - Local unquoted 7 7 - Debt - Overseas quoted 1 - 3 Debt - Overseas unquoted 6 6 - Debt - Local quoted 4 2 - Debt - Local unquoted 23 21 23 Property - Local - - 1 Cash and other 3 4 11 Total 100 100 100 Reporting entity’s own transferable financial instruments 4.0% 6.0% 6.0%Principal assumptions used at end of yearDiscount rate 6.1% 5.5% 6.5%Rate of salary increases 4.0% 4.0% 4.5%Rate of pension increases 1.6% 1.0% 1.5%Average retirement age (ARA)Average life expentancy for: 65 65 65 - Male at ARA 15.9 years 15.9 years 15.9 years - Female at ARA 20 years 20 years 20 years Sensitivity Analysis on defined benefit obligation at end of yearIncrease due to 1% decrease in discount rate 184,915 187,452 158,457 Decrease due to 1% increase in discount rate 148,350 150,169 127,506
169ANNUAL REPORT 2018
SBM BANK (MAURITIUS) LTD

Notes to the Financial Statements FOR THE YEAR ENDED 31 DECEMBER 2018
14. PENSION LIABILITY (CONT’D)
The above sensitivity analysis has been carried out by recalculating the present value of obligation at end of period after increasing or decreasing the discount rate while leaving all other assumptions unchanged. Any similar variation in the other assumptions would have shown smaller variations in the defined benefit obligation.
Future cashflows
The funding policy is to pay contributions to an external legal entity at the rate recommended by the entity’s actuary.
The Bank expects to make a contribution of around MUR 98.53 million to the SBM Group Pension Fund for the next financial year and the weighted average duration of the defined benefit obligation is 16 years.
Pension amounts and disclosures have been based on the report dated 27 February 2018 submitted by an independent firm of Actuaries and Consultants.
The Bank sponsors a final salary defined benefit pension plan for a category of its employees. The Bank has recognised a net defined benefit liability of MUR 109.62 million as at 31 December 2018 for the plan (2017: MUR 91.78 million and 2016: MUR 67.76 million).
The plan exposes the Bank to normal risks associated with defined benefit pension plans such as investment, interest, longevity and salary rise risks.
Investment risk
The plan liability is calculated using a discount rate determined by reference to government bond yields; if the return on plan assets is below this rate, it will create a plan deficit and if it is higher, it will create a plan surplus.
Interest risk
A decrease in the bond interest rate will increase the plan liability; however, this may be partially offset by an increase in the return on the plan’s debt investments and a decrease in inflationary pressures on salary and pension increases.
Longevity risk
The plan liability is calculated by reference to the best estimate of the mortality of plan participants both during and after their employment. An increase in the life expectancy of the plan participants will increase the plan liability.
Salary risk
The plan liability is calculated by reference to the future projected salaries of plan participants. As such, an increase in the salary of the plan participants above the assumed rate will increase the plan liability whereas an increase below the assumed rate will decrease the liability.
There has been no plan amendment, curtailment or settlement during the year.
SBM BANK (MAURITIUS) LTD170 ANNUAL REPORT 2018

Notes to the Financial Statements FOR THE YEAR ENDED 31 DECEMBER 2018
15. DEPOSITS FROM BANKS
Accounting policy
Deposits from banks are initially measured at fair value, net of transaction costs, and are subsequently measured at amortised cost using the effective interest rate method. Financial liabilities are derecognised when the Bank’s obligations are discharged, cancelled or they expire.
31 December 31 December 31 December2018 2017 2016
MUR’ 000 MUR’ 000 MUR’ 000Demand deposits 796,117 739,926 2,711,364
16. DEPOSITS FROM NON-BANK CUSTOMERS
Accounting policy
Deposits from non-bank customers are initially measured at fair value, net of transaction costs, and are subsequently measured at amortised cost using the effective interest rate method. Financial liabilities are derecognised when the Bank’s obligations are discharged, cancelled or they expire.
31 December 31 December 31 December2018 2017 2016
MUR’ 000 MUR’ 000 MUR’ 000(i) Retail customers
Current accounts 14,574,635 16,416,802 10,452,176 Savings accounts 51,247,818 50,728,520 42,858,273 Time deposits with remaining term to maturity: Up to 3 months 1,565,609 1,667,654 1,339,913 Over 3 months and up to 6 months 2,211,505 2,285,051 770,196 Over 6 months and up to 12 months 3,769,381 6,037,766 2,452,510 Over 1 year and up to 5 years 2,227,733 3,223,918 4,416,910 Over 5 years - 2,826 4,528 Total time deposits 9,774,228 13,217,215 8,984,057 Total deposits from retail customers 75,596,681 80,362,537 62,294,506
(ii) Corporate customers Current accounts 43,860,789 33,252,693 28,071,601 Savings accounts 3,479,325 4,287,772 6,492,061 Time deposits with remaining term to maturity: Up to 3 months 9,516,405 12,053,734 2,410,070 Over 3 months and up to 6 months 1,788,154 1,993,033 2,041,533 Over 6 months and up to 12 months 958,036 1,527,776 1,935,567 Over 1 year and up to 5 years 396,499 889,135 1,081,791 Over 5 years - - 359 Total time deposits 12,659,094 16,463,678 7,469,320 Total deposits from corporate customers 59,999,208 54,004,143 42,032,982
(iii) Government Current accounts 6,098,267 3,027,269 1,895,307 Savings accounts 3,521,548 2,908,506 2,078,167 Time deposits with remaining term to maturity: Up to 3 months 1,620,343 22,397 - Over 3 months and up to 6 months 619,611 1,357,224 400 Over 6 months and up to 12 months 69,396 12,961 925 Over 1 year and up to 5 years 5,786 732 100 Total time deposits 2,315,136 1,393,314 1,425 Total deposits from government 11,934,951 7,329,089 3,974,899 Total deposits from non-bank customers 147,530,840 141,695,769 108,302,387
171ANNUAL REPORT 2018
SBM BANK (MAURITIUS) LTD

Notes to the Financial Statements FOR THE YEAR ENDED 31 DECEMBER 2018
17. OTHER BORROWED FUNDS
Loans and borrowings are recognised initially at fair value, net of directly attributable transaction costs.
After initial recognition, interest-bearing loans and borrowings are subsequently measured at amortised cost using the Effective Interest Rate (EIR) method. Gains and losses are recognised in the statement of profit or loss when the liabilities are derecognised as well as through the EIR amortisation process.
31 December 31 December 31 December2018 2017 2016
MUR’ 000 MUR’ 000 MUR’ 000Borrowings from central banks - For refinancing 50,998 104,190 147,921 Other financial institutions - For refinancing 3,869,634 4,546,840 687,074 Borrowings from banks - In Mauritius 2,450,659 4,198,169 1,537,781 - Abroad 5,402,647 4,267,394 2,167,733
11,773,938 13,116,593 4,540,509 Remaining term to maturityUp to 3 months 4,523,419 5,537,753 2,273,183 Over 3 months and up to 6 months 4,432,455 2,515,486 - Over 6 months and up to 12 months 1,505,926 389,290 211,169 Over 1 year and up to 5 years 583,341 3,979,498 585,067 Over 5 years 728,797 694,566 1,471,090
11,773,938 13,116,593 4,540,509
SBM BANK (MAURITIUS) LTD172 ANNUAL REPORT 2018
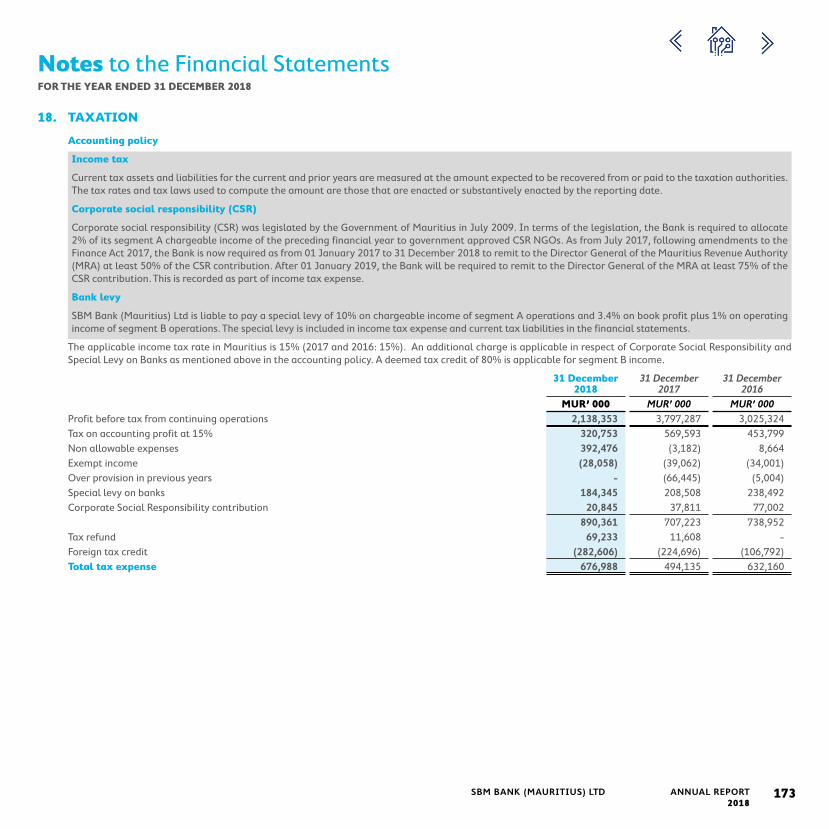
Notes to the Financial Statements FOR THE YEAR ENDED 31 DECEMBER 2018
18. TAXATION
Accounting policy
Income tax
Current tax assets and liabilities for the current and prior years are measured at the amount expected to be recovered from or paid to the taxation authorities. The tax rates and tax laws used to compute the amount are those that are enacted or substantively enacted by the reporting date.
Corporate social responsibility (CSR)
Corporate social responsibility (CSR) was legislated by the Government of Mauritius in July 2009. In terms of the legislation, the Bank is required to allocate 2% of its segment A chargeable income of the preceding financial year to government approved CSR NGOs. As from July 2017, following amendments to the Finance Act 2017, the Bank is now required as from 01 January 2017 to 31 December 2018 to remit to the Director General of the Mauritius Revenue Authority (MRA) at least 50% of the CSR contribution. After 01 January 2019, the Bank will be required to remit to the Director General of the MRA at least 75% of the CSR contribution. This is recorded as part of income tax expense.
Bank levy
SBM Bank (Mauritius) Ltd is liable to pay a special levy of 10% on chargeable income of segment A operations and 3.4% on book profit plus 1% on operating income of segment B operations. The special levy is included in income tax expense and current tax liabilities in the financial statements.
The applicable income tax rate in Mauritius is 15% (2017 and 2016: 15%). An additional charge is applicable in respect of Corporate Social Responsibility and Special Levy on Banks as mentioned above in the accounting policy. A deemed tax credit of 80% is applicable for segment B income.
31 December 31 December 31 December2018 2017 2016
MUR’ 000 MUR’ 000 MUR’ 000Profit before tax from continuing operations 2,138,353 3,797,287 3,025,324 Tax on accounting profit at 15% 320,753 569,593 453,799 Non allowable expenses 392,476 (3,182) 8,664 Exempt income (28,058) (39,062) (34,001)Over provision in previous years - (66,445) (5,004)Special levy on banks 184,345 208,508 238,492 Corporate Social Responsibility contribution 20,845 37,811 77,002
890,361 707,223 738,952 Tax refund 69,233 11,608 - Foreign tax credit (282,606) (224,696) (106,792)Total tax expense 676,988 494,135 632,160
173ANNUAL REPORT 2018
SBM BANK (MAURITIUS) LTD

Notes to the Financial Statements FOR THE YEAR ENDED 31 DECEMBER 2018
18a. TAX EXPENSE (CONT’D)
31 December 31 December 31 December2018 2017 2016
MUR’ 000 MUR’ 000 MUR’ 000The total tax expense can also be analysed as follows:Income tax expense 632,378 226,134 544,629 Deferred tax charge (Note 18b) 23,765 230,190 10,529 Corporate Social Responsibility contribution 20,845 37,811 77,002 Total tax expense 676,988 494,135 632,160
18b. DEFERRED TAX (ASSETS)/LIABILITIES
Accounting policy
Deferred tax is provided on temporary differences at the reporting date between the tax bases of assets and liabilities and their carrying amounts for financial reporting purposes. Deferred tax liabilities are recognised for all taxable temporary differences, except:
> Where the deferred tax liability arises from the initial recognition of goodwill or of an asset or liability in a transaction that is not a business combination and, at the time of the transaction, affects neither the accounting profit nor taxable profit or loss; and
> In respect of taxable temporary differences associated with investments in subsidiaries and associates, where the timing of the reversal of the temporary differences can be controlled and it is probable that the temporary differences will not reverse in the foreseeable future.
Deferred tax assets are recognised for all deductible temporary differences, carry forward of unused tax credits and unused tax losses, to the extent that it is probable that taxable profit will be available against which the deductible temporary differences, and the carry forward of unused tax credits and unused tax losses can be utilised except:
> Where the deferred tax asset relating to the deductible temporary difference arises from the initial recognition of an asset or liability in a transaction that is not a business combination and, at the time of the transaction, affects neither the accounting profit nor taxable profit or loss; and
> In respect of deductible temporary differences associated with investments in subsidiaries and associates, deferred tax assets are recognised only to the extent that it is probable that the temporary differences will reverse in the foreseeable future and taxable profit will be available against which the temporary differences can be utilised.
The carrying amount of deferred tax assets is reviewed at each reporting date and reduced to the extent that it is no longer probable that sufficient taxable profit will be available to allow all or part of the deferred tax asset to be utilised.
Unrecognised deferred tax assets are reassessed at each reporting date and are recognised to the extent that it has become probable that future taxable profit will allow the deferred tax asset to be recovered.
Deferred tax assets and liabilities are measured at the tax rates that are expected to apply in the year when the asset is realised or the liability is settled, based on tax rates (and tax laws) that have been enacted or substantively enacted at the reporting date.
Current tax and deferred tax relating to items recognised outside profit or loss are recognised outside profit or loss. Deferred tax items are recognised in correlation to the underlying transaction either in other comprehensive income or directly in equity.
Deferred tax assets and deferred tax liabilities are offset if a legally enforceable right exists to set off current tax assets against current tax liabilities and the deferred taxes relate to the same taxable entity and the same taxation authority.
SBM BANK (MAURITIUS) LTD174 ANNUAL REPORT 2018

Notes to the Financial Statements FOR THE YEAR ENDED 31 DECEMBER 2018
18. TAXATION (CONT’D)
18b. DEFERRED TAX (ASSETS)/LIABILITIES (CONT’D)
MUR’ 000At 01 January 2016 (276,767)Exchange difference 5,030Deferred tax charge on Mauritius operation (Note 18a) 10,529Deferred tax charge Overseas operations (Note 18a) 20,789Deferred tax on retirement benefit obligations accounted in OCI 282Underprovision of deferred tax liability in prior years 24,817At 31 December 2016 (215,320)At 01 January 2017 (215,320)Exchange difference 864Deferred tax charge on Mauritius operation (Note 18a) 230,190Deferred tax charge Overseas operations (Note 18a) 66,445Deferred tax on retirement benefit obligations accounted in OCI (6,735)At 31 December 2017 75,444At 01 January 2018 75,444Exchange difference - Deferred tax charge (Note 18a) 23,765Deferred tax on retirement benefit obligations accounted in OCI (5,694)Underprovision of deferred tax liability in prior years 70,481At 31 December 2018 163,996
31 December 31 December 31 December2018 2017 2016
MUR’ 000 MUR’ 000 MUR’ 000Deferred tax assets - (95,461) (215,320)Deferred tax liabilities 163,996 170,905 -
163,996 75,444 (215,320)Analysed as follows:Mauritius Operations 163,996 170,905 (52,550)Indian Operations - (95,461) (162,770)
163,996 75,444 (215,320)Analysed as resulting from: Accelerated capital allowances 484,897 420,080 134,439 Allowances for credit impairment (503,857) (438,390) (433,455) Carried forward losses - (137,810) (139,391) Revaluation of property 198,880 253,118 241,813 Other provisions (15,924) (21,554) (18,726)
163,996 75,444 (215,320)
175ANNUAL REPORT 2018
SBM BANK (MAURITIUS) LTD

Notes to the Financial Statements FOR THE YEAR ENDED 31 DECEMBER 2018
18. TAXATION (CONT’D)
18b. DEFERRED TAX (ASSETS)/LIABILITIES (CONT’D)
Current tax liabilities can be analysed as follows:
31 December 31 December 31 DecemberStatement of financial position 2018 2017 2016
MUR’ 000 MUR’ 000 MUR’ 000 At 01 January 105,869 358,908 371,242Income tax expenses 560,692 330,390 587,035Corporate Social Responsibility contribution - - 39,600Underprovision / (overprovision) in prior years 68,178 (66,445) (5,004)Paid during the year (260,252) (516,984) (633,965)
474,487 15,869 358,908
19. OTHER LIABILITIES
Accounting policy
Provisions are recognised when it is probable that an outflow of economic benefits will be required to settle a present legal or constructive obligation, which has arisen as a result of past events and for which a reliable estimate can be made.
A liability is a present obligation of the entity arising from past events, the settlement of which is expected to result in an outflow from the entity of resources embodying economic benefits. Deferred income relates to loan processing fees which is amortised over the life of the loan.
31 December 31 December 31 December2018 2017 2016
MUR’ 000 MUR’ 000 MUR’ 000Balance due in clearing 2,908,532 2,046,251 585,185 Bills payable 214,487 171,969 130,464 Accruals for expenses 94,110 352,180 331,740 Accounts payable 459,617 728,973 837,925 Deferred income 291,242 322,876 268,120 Balances in transit 772,867 413,460 52 Pension liability (Note 14) 109,621 91,781 67,764 Others 59,753 35,717 19,346 ECL on memorandum items (Note 22) 110,406 - -
5,020,635 4,163,207 2,240,596
SBM BANK (MAURITIUS) LTD176 ANNUAL REPORT 2018

Notes to the Financial Statements FOR THE YEAR ENDED 31 DECEMBER 2018
20. STATED CAPITAL
Accounting policy
(i) Share issue costs
Incremental costs directly attributable to the issue of new shares are shown in equity as a deduction from the proceeds.
Authorised, issued and paid up share capital Number MUR’ 000At 31 December 2016, 2017 and 2018 31,000,000,000 310,000
31 December 31 December 31 DecemberCapital Contribution 2018 2017 2016
MUR’ 000 MUR’ 000 MUR’ 000At 01 January 9,063,106 8,063,106 8,063,106 Capital contribution received during the year 1,980,905 1,000,000 - At 31 December 11,044,011 9,063,106 8,063,106
Fully paid ordinary shares carry one vote per share and the right to dividend.
The capital contribution refers to additional capital over and above the actual stated capital. It is fully paid up, unsecured, interest free and is perpetual with no maturity date. The shareholder shall not demand, sue for or receive payment of the whole or any part of the capital contribution or claim any set-off which would result in the principal amount of the capital contribution outstanding to be reduced. The Bank reserves the right to issue ordinary shares against the amount of capital contribution at any time at prevailing market rates.
21. DIVIDEND
Accounting policy
Dividends on ordinary shares are recognised in equity in the period in which they are authorised by the directors. Dividends that are declared after the reporting date are dealt with in the notes to the financial statements.
--------Dividend payable-------31 December 31 December 31 December
2018 2017 2016MUR’ 000 MUR’ 000 MUR’ 000
Cash dividend declared during the year:2018: 3.55 cents and 2017: 3.08 cents per share 1,100,500 954,000 - Less dividend paid: 2018: 3.55 cents and 2017: 3.08 cents per share (1,100,500) (954,000) - Dividend payable - - - Dividend declared after the reporting date:2018: Nil, 2017: 1.13 cents & 2016: 0.65 cents per share - 350,300 201,500
177ANNUAL REPORT 2018
SBM BANK (MAURITIUS) LTD

Notes to the Financial Statements FOR THE YEAR ENDED 31 DECEMBER 2018
21. DIVIDEND (CONT’D)
Loss on distribution of dividend in specie
Non-current assets held for sale and discontinued operations
The Bank classifies non-current assets and disposal groups as held for sale if their carrying amounts will be recovered principally through a sale transaction rather than through continuing use. Non-current assets and disposal groups classified as held for sale are measured at the lower of their carrying amount and fair value less costs to sell. Costs to sell are the incremental costs directly attributable to the disposal of an asset (disposal group), excluding finance costs and income tax expense.
The criteria for held for sale classification is regarded as met only when the sale is highly probable and the asset or disposal group is available for immediate sale in its present condition. Actions required to complete the sale should indicate that it is unlikely that significant changes to the sale will be made or that the decision to sell will be withdrawn. Management must be committed to the plan to sell the asset and the sale expected to be completed within one year from the date of the classification.
Property, plant and equipment and intangible assets are not depreciated or amortised once classified as held for sale. Assets and liabilities classified as held for sale are presented separately as current items in the statement of financial position.
A disposal group qualifies as discontinued operation if it is a component of an entity that either has been disposed of, or is classified as held for sale, and:
• Represents a separate major line of business or geographical area of operations;
• Is part of a single co-ordinated plan to dispose of a separate major line of business or geographical area of operations; or
• Is a subsidiary acquired exclusively with a view to resale.
Discontinued operations are excluded from the results of continuing operations and are presented as a single amount as profit or loss after tax from discontinued operations in the statement of profit or loss.
Additional disclosures are provided in Note 39. All other Notes to the financial statements include amounts for continuing operations, unless indicated otherwise.
Dividend in specie
During the financial year, the Bank has made a distribution in specie to its sole shareholder SBM (Bank) Holdings Ltd. The distribution in specie consisted of the Bank transferring the entire of its Indian Operations to its shareholder. The distribution was made at an amount which was the equivalent of the fair value of the assets and liabilities of the Indian Operations.
As such, on 30 November 2018, following approval from the Bank of Mauritius, the Indian Operations were fully transferred to SBM (Bank) Holdings Ltd. The statement of financial position as of that date was as follows:
Statement of financial position as at 30 November 2018 INR’000 MUR’ 000Assets 16,455,231 8,100,910 Liabilities 11,306,557 5,566,218 Capital and reserves 5,148,674 2,534,692
16,455,231 8,100,910
The distribution in specie of the Indian operations led to the recognition of a loss in the statement of profit or loss of the Bank. This loss mainly represents the derecognition of the translation reserve of this foreign operation.
For further information on this distribution in specie, refer to Note 39 on Discontinued Operations.
SBM BANK (MAURITIUS) LTD178 ANNUAL REPORT 2018

Notes to the Financial Statements FOR THE YEAR ENDED 31 DECEMBER 2018
22. MEMORANDUM ITEMS
Accounting policy
Acceptances
Acceptances are obligations to pay on due date the bills of exchange drawn on customers. It is expected most of these acceptances will be honoured by the customers on due dates. Acceptances are accounted for as off-balance sheet items and are disclosed under memorandum items.
Contingent liabilities
Contingent liabilities which include certain guarantees and letters of credit pledged are possible obligations that arise from past events whose existence will be confirmed by the occurrence, or non-occurrence, of one or more uncertain future events not wholly within the control of the Bank; or are present obligations that have arisen from past events but are not recognised because it is not probable that settlement will require the outflow of economic benefits, or because the amount of the obligations cannot be reliably measured. Contingent liabilities are not recognised in the financial statements but are disclosed unless the probability of settlement is remote.
Financial guarantee contracts
Liabilities under financial guarantee contracts which are not classified as insurance contracts are recorded initially at fair value, which is generally the fee received or present value of the fee receivable. Subsequently, financial guarantee liabilities are measured at the higher of the initial fair value, less cumulative amortisation and the best estimate of the expenditure required to settle the obligations.
179ANNUAL REPORT 2018
SBM BANK (MAURITIUS) LTD

Notes to the Financial Statements FOR THE YEAR ENDED 31 DECEMBER 2018
22. MEMORANDUM ITEMS (CONT’D)
a Acceptances, guarantees, letters of credit, endorsements and other obligations on account of customers
31 December 31 December 31 December2018 2017 2016
MUR’ 000 MUR’ 000 MUR’ 000Acceptances on account of customers 199,670 768,827 138,697 Guarantees on account of customers 7,594,442 7,443,126 4,598,267 Letters of credit and other obligations on account of customers 513,356 1,975,267 1,195,338
8,307,468 10,187,220 5,932,302 b Commitments
Undrawn credit facilities 9,071,296 14,238,833 6,787,125 c Other
Inward bills held for collection 248,962 183,979 174,811 Outward bills sent for collection 39,943 1,920,084 2,075,466
288,905 2,104,063 2,250,277 Total 17,667,669 26,530,116 14,969,704
The table below shows the credit quality and the maximum exposure to credit risk based on the Bank’s internal credit rating system and year-end stage classification.
31 December 201831 December
2017Stage 1 Stage 2 Stage 3 Total Total
Individual IndividualInternal rating grade MUR’ 000 MUR’ 000 MUR’ 000 MUR’ 000 MUR’ 000PerformingHigh grade 3,852,695 70,095 - 3,922,790 8,861,175Standard grade 5,699,476 5,412,812 - 11,112,288 4,255,665Sub-standard grade 2,627,610 1,483 - 2,629,093 13,025,352Past due but not impaired - - - - - Non-performing Individually impaired - - 3,498 3,498 387,924Total 12,179,781 5,484,390 3,498 17,667,669 26,530,116
Details of the Bank’s internal grading system are set out in note 37(b)(i).
SBM BANK (MAURITIUS) LTD180 ANNUAL REPORT 2018

Notes to the Financial Statements FOR THE YEAR ENDED 31 DECEMBER 2018
22. MEMORANDUM ITEMS (CONT’D)
An analysis of changes in the gross carrying amount and the corresponding ECL allowances is, as follows:
Stage 1 Stage 2 Stage 3 TotalIndividual Individual
MUR’000 MUR’000 MUR’000 MUR’000Gross carrying amount as at 1 January 2018 26,530,116 - - 26,530,116New assets originated or purchased 9,324,074 637,436 3,498 9,965,008Assets derecognised or repaid (excluding write offs) (15,404,311) (816,137) - (16,220,448)Transfers to Stage 1 - - - - Transfers to Stage 2 (5,663,091) 5,663,091 - - Transfers to Stage 3 - - - - Changes to contractual cash flows due to modifications not resulting in derecognition - - - - Derecognition of Indian Operations following distribution in specie (2,607,007) - - (2,607,007)Foreign exchange adjustments - - - - At 31 December 2018 12,179,781 5,484,390 3,498 17,667,669
Stage 1 Stage 2 Stage 3 TotalIndividual Individual
MUR’000 MUR’000 MUR’000 MUR’000ECL allowance as at 1 January 2018 172,864 - - 172,864New assets originated or purchased 35,015 23,544 4,590 63,149Assets derecognised or repaid (excluding write offs) (115,703) (9,906) - (125,609)Transfers to Stage 1 - - - - Transfers to Stage 2 (39,652) 39,652 - - Transfers to Stage 3 - - - - Impact on year end ECL of exposures transferred between stages during the year - - - - Changes to contractual cash flows due to modifications not resulting in derecognition - - - - At 31 December 2018 52,524 53,290 4,590 110,404
Movements in the loss allowances arising from loans and advances to non-bank customers under IAS 39 over 2017 included MUR’000 35,015 new loans made during the financial year and MUR’000 115,703 derecognised due to loans matured.
The Bank is subject to various legal claims from former employees and customers with claims totallying MUR 553.3 million (2017: MUR 455.4 million and 2016: MUR 327.3 million). The Bank has not made any provision for those claims on the basis that it is not probable that these actions will succeed.
181ANNUAL REPORT 2018
SBM BANK (MAURITIUS) LTD

Notes to the Financial Statements FOR THE YEAR ENDED 31 DECEMBER 2018
23. ASSETS PLEDGED
The aggregate carrying amount of assets that have been pledged to secure the credit facilities of the Bank with Central Banks and with Clearing Corporation of India Limited are as follows:
31 December 31 December 31 December2018 2017 2016
MUR’ 000 MUR’ 000 MUR’ 000Treasury bills / Government bonds 5,427,202 2,077,648 549,811 Other - 52,909 -
5,427,202 2,130,557 549,811 Analysed as:- In Mauritius 3,542,550 1,694,900 400,000 - Overseas 1,884,652 435,657 149,811
5,427,202 2,130,557 549,811
24. CAPITAL COMMITMENTS
Approved and contracted for 85,160 58,934 39,752 Approved and not contracted for 72,333 64,757 138
25. OPERATING LEASE
Accounting policy
Rentals payable under operating leases are charged to the statement of profit or loss on a straight-line basis over the term of the relevant lease. Benefits received and receivable as an incentive to enter into an operating lease are also spread on a straight-line basis over the lease term.
31 December 31 December 31 December2018 2017 2016
Leasing arrangements - The Bank as lessee MUR’ 000 MUR’ 000 MUR’ 000Operating lease expense 64,684 50,465 59,233
Operating lease payments represent rentals payable for property, equipment and motor vehicles for the entire contract period. Operating lease contracts contain renewal clauses in the event that the Bank exercises its option to renew the contracts. The Bank does not have an option to purchase the assets at the expiry of the lease period.
The future minimum lease payments under non-cancellable operating leases are as follows:
31 December 31 December 31 December2018 2017 2016
MUR’ 000 MUR’ 000 MUR’ 000Up to 1 year 46,064 36,867 35,576 After 1 year and before 5 years 89,193 49,481 55,909 After 5 years and up to 25 years 31,760 42,063 30,363
167,017 128,411 121,848
SBM BANK (MAURITIUS) LTD182 ANNUAL REPORT 2018

Notes to the Financial Statements FOR THE YEAR ENDED 31 DECEMBER 2018
26. NET INTEREST INCOME
Accounting policy
Revenue is recognised to the extent that it is probable that the economic benefits will flow to the Bank and the revenue can be reliably measured.
For all financial instruments measured at amortised cost and interest-earning financial instruments classified as investment securities measured at FVTOCI, interest income or expense is recorded at the effective interest rate, which is the rate that exactly discounts estimated future cash payments or receipts through the expected life of the financial instrument or a shorter period, where appropriate, to the net carrying amount of the financial asset or financial liability. The calculation takes into account all contractual terms of the financial instrument (for example, prepayment options) and includes any fees or incremental costs that are directly attributable to the instrument and are an integral part of the effective interest rate, but not future credit losses. The carrying amount of the financial asset or financial liability is adjusted if the Bank revise their estimates of payments or receipts. The adjusted carrying amount is calculated based on the original effective interest rate and the change in carrying amount is recorded as interest income or expense.
However, for a reclassified financial asset for which the Bank subsequently increases its estimates of future cash receipts as a result of increased recoverability of those cash receipts, the effect of that increase is recognised as an adjustment to the EIR from the date of the change in estimate.
Once the recorded value of a financial asset or a group of similar financial assets has been reduced due to an impairment loss, interest income continues to be recognised using the rate of interest used to discount the future cash flows for the purpose of measuring the impairment loss. The Bank calculates interest income by applying the EIR to the gross carrying amount of financial assets other than credit-impaired assets.
When a financial asset becomes credit-impaired and is, therefore, regarded as stage 3, the Bank calculates interest income by applying the effective interest rate to the outstanding amount of the financial asset. For all credit impaired assets, the interest income is reversed and charged against the outstanding amount of the financial asset. If the financial asset cures and is no longer credit-impaired, the Bank reverts to calculating interest income on a gross basis.
31 DecemberRestated
31 DecemberRestated
31 December2018 2017 2016
MUR’ 000 MUR’ 000 MUR’ 000Interest Income on financial instruments at amortised costCash and cash equivalents 156,248 93,299 57,932 Loans to and placements with banks 312,079 122,264 53,504 Loans and advances to non-bank customers 5,552,274 4,806,834 4,263,597 Investment securities 417,241 562,418 808,026
6,437,842 5,584,815 5,183,059 Interest Income on financial instruments at fair valueInvestment securities 840,367 496,688 222,567 Derivative financial instruments (121,837) (6,613) (9,083)Other - - 7
718,530 490,075 213,491 Total interest income 7,156,372 6,074,890 5,396,550 Interest expenseDeposits from customers (1,376,701) (1,444,025) (1,329,407)Other borrowed funds (265,485) (109,697) (30,475)Other (22,820) (15,407) (1,385)Total interest expense (1,665,006) (1,569,129) (1,361,267)Net interest income 5,491,366 4,505,761 4,035,283
183ANNUAL REPORT 2018
SBM BANK (MAURITIUS) LTD

Notes to the Financial Statements FOR THE YEAR ENDED 31 DECEMBER 2018
27. NET FEE AND COMMISSION INCOME
Accounting policy
Fees and commission income and expense are recognised on an accrual basis when the service has been provided. Commission and fees arising from negotiation of transactions with third parties, or participating in the negotiation of a transaction for a third party is recognised on completion of the underlying transaction. Fees and commission that are integral to the effective interest rate on a financial asset or liability are included in the measurement of the effective interest rate. Other fees and commission income including account servicing fees, investment management fees, sales commission, placement fees and syndication fees, are recognised as the related services are performed. Other fees and commission expense relate mainly to transaction and services fee, which are expensed as the services are received.
31 DecemberRestated
31 DecemberRestated
31 December2018 2017 2016
MUR’ 000 MUR’ 000 MUR’ 000Fee and commission incomeRetail banking customer fees 257,206 331,115 301,927 Corporate banking customer fees 453,942 359,084 243,178 Card income 350,518 315,075 431,675 Total fee and commission income 1,061,666 1,005,274 976,780 Fee and commission expenseInterbank transaction fees (14,409) (12,776) (15,918)Other (8,606) (9,620) (4,807)Total fee and commission expense (23,015) (22,396) (20,725)Net fee and commission income 1,038,651 982,878 956,055
28. NET GAIN/(LOSS) FROM FINANCIAL INSTRUMENTS
Accounting policy
Gain or loss on financial instruments comprises fair value movements on:- Trading derivatives;- Trading securities;- Assets, liabilities and derivatives designated in hedging relationships; and- Other financial assets and liabilities designated at fair value through profit or loss.In general, gains or losses on trading derivatives recognise the full change in fair value of the derivatives inclusive of interest income and expense. Gains or losses on trading securities recognise the change in the fair value of these instruments excluding interest income or interest expense which is recognised separately in net interest income.
Gains or losses on assets, liabilities and derivatives designated in hedge relationships recognises fair value movements (excluding interest) on both the hedged item and hedging derivative in a fair value hedge relationship, and hedge ineffectiveness from fair value hedge relationships.
Gains or losses on other financial assets designated at fair value through profit or loss recognises fair value movements (excluding interest) on those items designated as fair value through profit or loss.
31 DecemberRestated
31 DecemberRestated
31 December2018 2017 2016
MUR’ 000 MUR’ 000 MUR’ 000Net gain/(loss) from trading instruments 323,467 519,275 (24,849)Investment securities at fair value through profit or loss 59,472 919 - Other 117,194 (373) 18
500,133 519,821 (24,831)
SBM BANK (MAURITIUS) LTD184 ANNUAL REPORT 2018

Notes to the Financial Statements FOR THE YEAR ENDED 31 DECEMBER 2018
29. NET GAIN FROM SALE OF SECURITIES
31 DecemberRestated
31 DecemberRestated
31 December2018 2017 2016
MUR’ 000 MUR’ 000 MUR’ 000Net gain on derecognition of financial assets measured at fair value through other comprehensive income - 161,386 388,087 Net gain on derecognition of financial assets measured at amortised cost 4,727 262,721 35,762 Net gain on derecognition of financial assets at fair value through profit or loss 168,827 6,790 -
173,554 430,897 423,849
30. PERSONNEL EXPENSES
Accounting policy
Short-term employee benefits include items such as the following, if expected to be settled wholly before twelve months after the end of the annual reporting period in which the employees render the related services:
(a) wages, salaries and social security contributions;
(b) paid annual leave and paid sick leave;
(c) bonuses; and
(d) non-monetary benefits (such as medical care, housing, cars and free or subsidised goods or services) for current employees.
When an employee has rendered service to an entity during an accounting period, the entity shall recognise the undiscounted amount of short-term employee benefits expected to be paid in exchange for that service:
(a) as a liability (accrued expense), after deducting any amount already paid. If the amount already paid exceeds the undiscounted amount of the benefits, an entity shall recognise that excess as an asset (prepaid expense) to the extent that the prepayment will lead to, for example, a reduction in future payments or a cash refund.
(b) as an expense, unless another IFRS requires or permits the inclusion of the benefits in the cost of an asset.
The Bank operates a defined contribution pension plan. The contribution payable to a defined contribution plan is in proportion to the services rendered to the Bank by the employees and is recorded as an expense under personnel expenses. Unpaid contributions are recorded as a liability. Refer to Note 14 for accounting policy on defined benefit plans.
31 DecemberRestated
31 DecemberRestated
31 December2018 2017 2016
MUR’ 000 MUR’ 000 MUR’ 000Wages and salaries 1,001,238 1,043,991 953,392 Other social security obligations - 17,723 16,177 Contributions to defined contribution plans 144,277 91,180 73,116 Cash-settled share-based payments - - 580 Increase in liability for defined benefit plans (Note 14) 30,245 26,422 30,030 Staff welfare cost 20,038 16,748 13,570 Management and professional charges - 7,186 17,315 Other 140,496 160,146 171,632
1,336,294 1,363,396 1,275,812
185ANNUAL REPORT 2018
SBM BANK (MAURITIUS) LTD

Notes to the Financial Statements FOR THE YEAR ENDED 31 DECEMBER 2018
31. OTHER EXPENSES
31 DecemberRestated
31 DecemberRestated
31 December2018 2017 2016
MUR’ 000 MUR’ 000 MUR’ 000Software licensing and other information technology cost 365,493 469,304 484,190 Auditors’ remuneration (audit and other services): -Principal auditors 7,133 7,133 7,536 Utilities 45,522 52,916 49,913 Professional charges 65,578 29,733 34,049 Marketing costs 55,370 69,672 43,574 Rent, repairs and maintenance 67,590 78,746 87,997 Licence and other registration fees 20,905 22,109 17,631 Other* 75,712 110,327 104,141
703,303 839,940 829,031
* Includes mainly printing, stationery, subscription and other operational costs.
SBM BANK (MAURITIUS) LTD186 ANNUAL REPORT 2018

Notes to the Financial Statements FOR THE YEAR ENDED 31 DECEMBER 2018
32. CREDIT LOSS ALLOWANCE ON FINANCIAL ASSETS
Accounting policy
Prior to 01 January 2018
Financial assets, other than those at fair value through profit or loss (FVTPL), are assessed for indicators of impairment at the end of each reporting period. Financial assets are considered to be impaired when there is objective evidence that, as a result of one or more events that occurred after the initial recognition of the financial asset, the estimated future cash flows of the investment have been affected. For AFS equity investments, a significant or prolonged decline in the fair value of the security below its cost is considered to be objective evidence of impairment.
When an available for sale (AFS) financial asset is considered to be impaired, its carrying amount is reduced by the impairment loss directly for all financial assets with the exception of loans and advances to customers where the carrying amount is reduced through the use of an allowance account.
Cumulative gains or losses previously recognised in other comprehensive income are reclassified to the statement of profit or loss.
For financial assets measured at amortised cost, if, in a subsequent period, the amount of the impairment loss decreases and the decrease can be related objectively to an event occurring after the impairment was recognised, the previously recognised impairment loss is reversed through profit or loss to the extent that the carrying amount of the investment at the date the impairment is reversed does not exceed what the amortised cost would have been had the impairment not been recognised. In respect of AFS equity investments, any increase in fair value subsequent to an impairment loss is recognised in other comprehensive income and accumulated under the fair value reserve.
From 01 January 2018
The Bank recognises loss allowances for ECLs on the following financial instruments that are not measured at FVTPL:- Loans and advances to banks;- Loans and advances to customers;- Debt investment securities;- Loan commitments issued;- Financial guarantee contracts, bills and letters of credit.
With the exception of POCI assets, ECLs are required to be measured through a loss allowance at an amount equal to:- 12-month ECL, that is, lifetime ECL that result from those default events on the financial instrument that are possible within 12 months after the reporting date, (referred to as stage 1); or- full lifetime ECL, that is, lifetime ECL that result from all possible default events over the life of the financial instrument, (referred to as stage 2 and stage 3).
A loss allowance for full lifetime ECL is required for a financial instrument if the credit risk on that financial instrument has increased significantly since intial recognition. For all other financial instruments, ECLs are measured at an amount equal to the 12-month ECL.
The Bank considers a debt security to have low credit risk when their credit risk rating is equivalent to the globally understood ‘investment grade’.
ECL are a probability-weighted estimate of credit losses. They are measured as follows:
- financial assets that are not credit-impaired at the reporting date: as the present value of all cash shortfalls (i.e. the difference between the cash flows due to the entity in accordance with the contract and the cash flows that the Bank expects to receive);- financial assets that are credit impaired at the reporting date: as the difference between the gross carrying amount and the present value of estimated future cash flows.The Bank measures ECL on a collective basis for portfolios of loans that share similar economic risk characteristics. The measurement of the loss allowance is based on the present value of the asset’s expected cash flows using the asset’s original EIR, regardless of whether it is measured on an individual basis or a collective basis.
Credit-impaired financial asset
A financial asset is credit-impaired when one or more events that have a detrimental impact on the estimated future cash flows of that financial asset have occurred. Evidence that a financial asset is credit impaired include observable data about the following events:
(a) significant financial difficulty of the issuer or the borrower;(b) a breach of contract, such as a default or past due event;(c) the lender(s) of the borrower, for economic or contractual reasons relating to the borrower’s financial difficulty, having granted to the borrower a concession(s) that the lender would not otherwise consider;
187ANNUAL REPORT 2018
SBM BANK (MAURITIUS) LTD

Notes to the Financial Statements FOR THE YEAR ENDED 31 DECEMBER 2018
32. CREDIT LOSS EXPENSE ON FINANCIAL ASSETS (CONT’D)
Accounting policy
Credit-impaired financial asset (cont’d)(d) it is becoming probable that the borrower will enter bankrupcy or other financial reorganisation;(e) the disappearance of an active market for the financial asset because of financial difficulties; or(f) the purchase or origination of a financial asset at a deep discount that reflects the incurred credit losses.A loan that has been renegotiatied due to a deterioration in the borrower’s condition is usually considered to be credit-impaired unless there is evidence that the risk of not receiving contractual cash flows has reduced significantly and there are no other indicators of impairment. In addition, a loan that is overdue for 90 days or more is considered impaired.It may not be possible to identify a single discrete event-instead, the combined effect of several events may have caused financial assets to become credit-impaired. The Bank assesses whether debt instruments that are financial assets measured at amortised cost or FVTOCI are credit-impaired at each reporting date. To assess if sovereign and corporate debt instruments are credit impaired, the Bank considers factors such as bond yields, credit ratings and the ability of the borrower to raise funding.A loan is considered credit-impaired when a concession is granted to the borrower due to a deterioration in the borrower’s financial condition, unless there is evidence that as a result of granting the concession the risk of not receiving the contractual cash flows has reduced significantly and there are no other indicators of impairment. For financial assets where concessions are contemplated but not granted, the asset is deemed credit impaired when there is observable evidence of credit impairment including meeting the definition of default. The definition of default includes unlikeliness to pay indicators and a backstop if amounts are overdue for 90 days or more.Definition of default and cure
Critical to the determination of ECL is the definition of default. The definition of default is used in measuring the amount of ECL and in the determination of whether the loss allowance is based on 12-month or lifetime ECL, as default is a component of the probability of default (PD) which affects both the measurement of ECLs and the identification of a significant increase in credit risk.The Bank considers the following as constituting an event of default:- the borrower is past due more than 90 days on any material credit obligation to the Bank; or- the borrower is unlikely to pay its credit obligations to the Bank in full.
The definition of default is appropriately tailored to reflect different characteristics of different type of assets. Overdrafts are considered as being past due once the customer has breached an advised limit or has been advised of a limit smaller than the current amount outstanding.When assessing if the borrower is unlikely to pay its credit obligation, the Bank takes into account both qualitative and quantitative indicators such as breach of covenants, overdue status, non-payment on another obligation of the same counterparty. The Bank uses a variety of sources of information to assess default which are either developed internally or obtained from external sources, for example, BOM guidelines on impairment.It is the Bank’s policy to consider a financial instrument as ‘cured’ and therefore re-classified out of stage 3 when none of the default criteria have been present for at least six consecutive months. The decision whether to classify an asset as stage 2 or stage 1 once cured depends on the updated credit grade, at the time of the cure and whether this indicates there has been a significant increase in credit risk compared to initial recognition.
The table below shows the impairment charges recorded in the statement of profit or loss under IFRS 9 during 2018:31 December 2018
Stage 1 Stage 2 Stage 3 Total MUR’ 000 MUR’ 000 MUR’ 000 MUR’ 000
Loans and advances to non-bank customers (261,425) 371,890 2,897,543 3,008,008Loans to and placements with banks* 43,782 - 43,782Debt instruments measured at amortised cost** 22,636 - 22,636Loan commitments (19,832) - (19,832)Off balance sheet items (Guarantees, Letters of credit, Acceptances) (42,626) - 4,590 (38,036)Total credit loss expense under IFRS 9 (257,465) 371,890 2,902,133 3,016,558Write off - - 120 120Bad debts recovered - - (6,322) (6,322)
(257,465) 371,890 2,895,931 3,010,356
*ECL movement for cash and cash equivalents are included under loans to and placements with banks**ECL movement for debt instruments measured at FVTOCI are included under debt instruments measured at amortised cost.
SBM BANK (MAURITIUS) LTD188 ANNUAL REPORT 2018

Notes to the Financial Statements FOR THE YEAR ENDED 31 DECEMBER 2018
32. CREDIT LOSS EXPENSE ON FINANCIAL ASSETS (CONT’D)
The table below shows the impairment charges recorded in the statement of profit or loss under IAS 39 during 2017 and 2016:Restated Restated
31 December 31 December2017 2016
MUR’ 000 MUR’ 000Portfolio and specific provisions: - On-balance sheet advances (Note 9c) 344,601 415,623 Bad debts written off for which no provisions were made - 1,259 Recoveries of advances written off (116,577) (2,068)Other - 64
228,024 414,878 Of which:Credit exposure 228,024 414,814 Other financial assets - 64
228,024 414,878
33. NET CASH USED IN OPERATING ACTIVITIES
31 December 31 December 31 December2018 2017 2016
Cash flows from operating activities MUR’ 000 MUR’ 000 MUR’ 000Profit for the year 554,153 2,611,293 2,208,612Adjustments to determine net cash flows:Depreciation of property and equipment 153,737 154,238 153,757Amortisation of intangible assets 568,659 493,787 192,083Impact of adopting IFRS9 45,910 - - Pension expense (Note 14) 30,245 26,422 30,030Credit loss expense on financial assets 3,010,356 987,262 716,742Exchange difference - 280,049 (89,703)Impairment of equity investments - 3,413 - Net (gain) / loss from dealings in trading securities - (30,726) 25,486Net gain on disposal of property and equipment 45,826 (79) (503)Tax expense 676,988 560,580 652,949Loss in distribution of dividend in specie 685,838 - - Operating profit before working capital changes 5,771,712 5,086,239 3,889,453Change in operating assets and liabilitiesDecrease / (increase) in derivative financial assets 541,042 (1,160,051) (47,365)Increase in loans to and placements with banks (3,261,473) (4,249,949) (3,436,966)Iincrease in loans and advances to non-bank customers (410,459) (30,658,733) (3,492,897)Increase in gilt-edged investment securities (13,185,216) (5,412,419) (5,373,200)(Increase) / decrease in other investment securities (2,543,882) 2,679,365 2,087,039Increase in mandatory balances with central banks (252,613) (1,766,492) (50,834)(Increase) / decrease in other assets (144,461) (365,691) 232,933Increase / (decrease) in deposits from banks 70,370 (1,971,438) 1,912,728Increase in deposits from non-bank customers 9,816,305 33,393,382 4,724,598(Decrease) / increase in derivative financial liabilities (521,348) 1,152,178 61,650Increase / (decrease) in other liabilities 948,310 1,898,594 (114,564)Income tax paid (315,265) (516,984) (657,659)Net cash used in operating activities (3,486,978) (1,891,999) (265,084)
189ANNUAL REPORT 2018
SBM BANK (MAURITIUS) LTD

Notes to the Financial Statements FOR THE YEAR ENDED 31 DECEMBER 2018
34. CAPITAL MANAGEMENT
The Bank manages its capital to ensure that it will be able to continue as a going concern and maximise returns to shareholders. It also ensures that adequate capital is maintained to support its growth strategies, its risk appetite and depositors’ confidence, while complying with statutory and regulatory requirements. The capital resources of the Bank are disclosed in the statement of changes in equity.
The Bank has met the respective minimum capital requirements set out by the relevant regulatory body and, where applicable, appropriate transfers have also been made to statutory reserves, ranging from 10% to 25% of annual profits.
The Bank has also met its respective minimum capital adequacy ratio requirements. Banks in Mauritius are required to maintain a ratio of eligible capital to risk weighted assets of at least 10%.
31 December 31 December 31 December2018 2017 2016
MUR’ 000 MUR’ 000 MUR’ 000Tier 1 capital 13,421,249 11,792,955 8,295,809 Eligible capital base 15,036,270 13,465,687 9,763,231 Risk weighted assets 99,517,948 104,933,398 76,087,625 Capital adequacy ratio (%) 15.11 12.83 12.83
For comparative purposes, the disclosure has been amended and do not include Indian Operations.
35. IMMEDIATE AND ULTIMATE HOLDING COMPANY
The directors regard SBM Holdings Ltd, a company incorporated in Mauritius as its ultimate holding company and SBM (Bank) Holdings Ltd, a company incorporated in Mauritius as its immediate holding company. SBM Holdings Ltd is a public company, domiciled in Mauritius and listed on the Stock Exchange of Mauritius. The address of the registered office of both SBM Holdings Ltd and SBM (Bank) Holdings Ltd is SBM Tower, 1 Queen Elizabeth II Avenue, Port Louis, Mauritius.
SBM BANK (MAURITIUS) LTD190 ANNUAL REPORT 2018
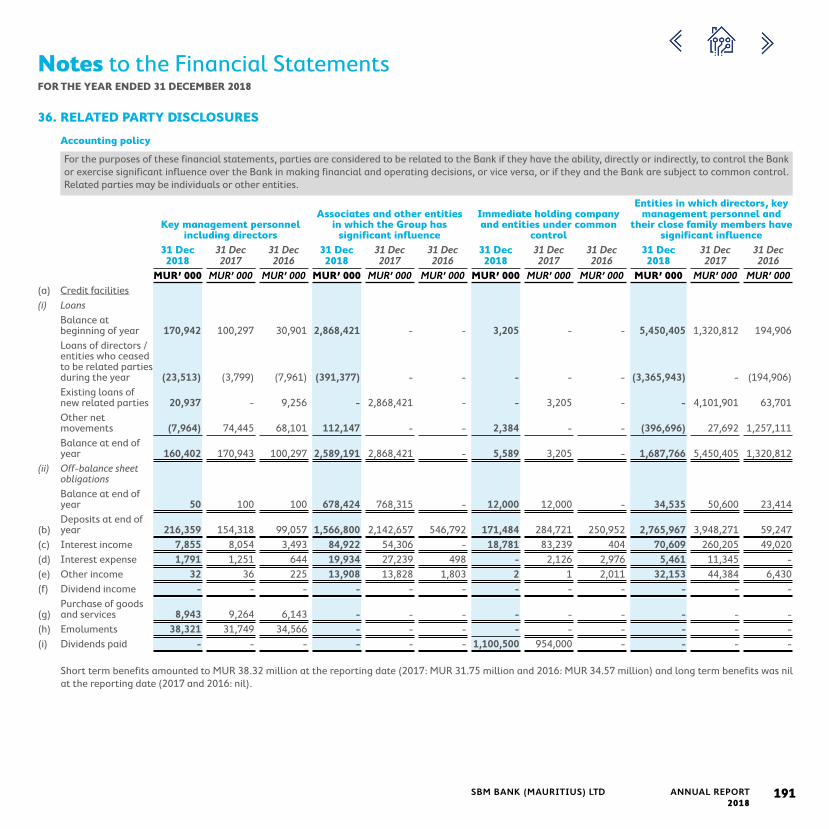
Notes to the Financial Statements FOR THE YEAR ENDED 31 DECEMBER 2018
36. RELATED PARTY DISCLOSURES
Accounting policy
For the purposes of these financial statements, parties are considered to be related to the Bank if they have the ability, directly or indirectly, to control the Bank or exercise significant influence over the Bank in making financial and operating decisions, or vice versa, or if they and the Bank are subject to common control. Related parties may be individuals or other entities.
Key management personnel including directors
Associates and other entities in which the Group has
significant influence
Immediate holding company and entities under common
control
Entities in which directors, key management personnel and
their close family members have significant influence
31 Dec 31 Dec 31 Dec 31 Dec 31 Dec 31 Dec 31 Dec 31 Dec 31 Dec 31 Dec 31 Dec 31 Dec2018 2017 2016 2018 2017 2016 2018 2017 2016 2018 2017 2016
MUR’ 000 MUR’ 000 MUR’ 000 MUR’ 000 MUR’ 000 MUR’ 000 MUR’ 000 MUR’ 000 MUR’ 000 MUR’ 000 MUR’ 000 MUR’ 000(a) Credit facilities(i) Loans
Balance at beginning of year 170,942 100,297 30,901 2,868,421 - - 3,205 - - 5,450,405 1,320,812 194,906 Loans of directors / entities who ceased to be related parties during the year (23,513) (3,799) (7,961) (391,377) - - - - - (3,365,943) - (194,906)Existing loans of new related parties 20,937 - 9,256 - 2,868,421 - - 3,205 - - 4,101,901 63,701 Other net movements (7,964) 74,445 68,101 112,147 - - 2,384 - - (396,696) 27,692 1,257,111Balance at end of year 160,402 170,943 100,297 2,589,191 2,868,421 - 5,589 3,205 - 1,687,766 5,450,405 1,320,812
(ii) Off-balance sheet obligations Balance at end of year 50 100 100 678,424 768,315 - 12,000 12,000 - 34,535 50,600 23,414
(b)Deposits at end of year 216,359 154,318 99,057 1,566,800 2,142,657 546,792 171,484 284,721 250,952 2,765,967 3,948,271 59,247
(c) Interest income 7,855 8,054 3,493 84,922 54,306 - 18,781 83,239 404 70,609 260,205 49,020 (d) Interest expense 1,791 1,251 644 19,934 27,239 498 - 2,126 2,976 5,461 11,345 - (e) Other income 32 36 225 13,908 13,828 1,803 2 1 2,011 32,153 44,384 6,430 (f) Dividend income - - - - - - - - - - - -
(g)Purchase of goods and services 8,943 9,264 6,143 - - - - - - - - -
(h) Emoluments 38,321 31,749 34,566 - - - - - - - - - (i) Dividends paid - - - - - - 1,100,500 954,000 - - - -
Short term benefits amounted to MUR 38.32 million at the reporting date (2017: MUR 31.75 million and 2016: MUR 34.57 million) and long term benefits was nil at the reporting date (2017 and 2016: nil).
191ANNUAL REPORT 2018
SBM BANK (MAURITIUS) LTD

Notes to the Financial Statements FOR THE YEAR ENDED 31 DECEMBER 2018
36. RELATED PARTY DISCLOSURES (CONT’D)
Related party transactions in relation to Post Employment Benefit plans are as follows:
31 December 31 December 31 December2018 2017 2016
MUR’ 000 MUR’ 000 MUR’ 000Deposits at end of year 97,051 63,809 148,576 Interest expense 32 - 250 Other income - - 213 Contributions paid 112,403 100,591 88,052
Transactions of the Bank with the ultimate holding company and the subsidiaries within the Group are disclosed below:
31 December 31 December 31 December2018 2017 2016
MUR’ 000 MUR’ 000 MUR’ 000Non-interest expense 225 900 900
Credit facilities to key management personnel and executive directors are as per their contract of employment. All other transactions with key management personnel and directors, whether credit facilities, deposits or purchase of goods and services, are at market terms and conditions and will be settled in cash. All credit facilities with entities considered as related parties disclosed above are at market terms and conditions and will be settled in cash. Credit facilities are secured except for credit card advances and some personal loans which are granted under an unsecured loan scheme in the normal course of business.
SBM BANK (MAURITIUS) LTD192 ANNUAL REPORT 2018

Notes to the Financial Statements FOR THE YEAR ENDED 31 DECEMBER 2018
37. RISK MANAGEMENT
The Board of Directors oversees the risk management framework and ensures decision making is aligned with the Board-driven strategic risk objectives and risk appetite. Board approve the risk policies and a set of prudential limits and risk tolerance limits, besides regulatory limits, within which the Bank operates. The Senior Management monitors risks totally on an ongoing basis at regular intervals as necessary and is accountable to ensure its operations are within approved policies, prudential limits besides regulatory limits and risk appetite approved framework. Any deviation and non-compliance are reported to Board Risk Committee. The principal risks arising from financial instruments to which the Bank is exposed include credit risk, liquidity risk, market risk, operational risk, strategic risk and reputational risk.
a (i) Classification of financial assets and financial liabilities
The following table shows the original measurement categories in accordance with IAS 39 and the new measurement categories under IFRS 9 for the Bank’s financial assets and financial liabilities:
Financial assets Original Classification
under IAS 39 New classifcation
under IFRS 9
Original Carrying amount under IAS 39 as at 31 December 2017
New Carrying amount under IFRS 9 as at 01 January 2018
Carrying amount under IFRS 9 as at 31 December 2018
MUR’ 000 MUR’ 000 MUR’ 000Cash and cash equivalents Loans and receivables Amortised Cost 15,620,778 15,604,580 11,211,712Mandatory balances with central banks Loans and receivables Amortised Cost 8,712,062 8,712,062 8,767,767Loans to and placements with banks Loans and receivables Amortised Cost 8,895,860 8,879,803 11,764,358Derivative financial instruments Fair value through P&L Fair value through P&L 1,356,774 1,356,774 762,855Loans and advances to non-bank customers Loans and receivables Amortised cost 100,839,231 100,820,640 94,296,051Investments - AFS (Equity and/or Debt Instruments) Available-for-sale Fair value through OCI 11,268,400 11,233,407 27,419,450Investments - HFT Fair value through P&L Fair value through P&L 6,676,489 6,676,489 9,711,783Investments - HTM Held-to-maturity Amortised cost 19,206,212 19,189,864 13,806,487Other assets Loans and receivables Amortised Cost 676,317 676,317 567,126Total financial assets 173,252,123 173,149,936 178,307,589Financial liabilitiesDeposits from banks Amortised Cost Amortised Cost 739,926 739,926 796,117Deposits from non-bank customers Amortised Cost Amortised Cost 141,695,769 141,695,769 147,530,840Derivative financial instruments Fair value through P&L Fair value through P&L 1,334,584 1,334,584 758,642Other borrowed funds Amortised Cost Amortised Cost 13,116,593 13,116,593 11,773,938Other liabilities Amortised Cost Amortised Cost 1,944,907 1,944,907 2,013,081Total financial liabilities 158,831,779 158,831,779 162,872,618
193ANNUAL REPORT 2018
SBM BANK (MAURITIUS) LTD

Notes to the Financial Statements FOR THE YEAR ENDED 31 DECEMBER 2018
37. RISK MANAGEMENT (CONT’D)
a (ii) Fair values
Set out below is a comparison of the carrying amounts and fair values of financial instruments held at the reporting date.
31 December 2018 31 December 2017 31 December 2016
Carrying ValueFair
Value Carrying ValueFair
Value Carrying ValueFair
ValueMUR’ 000 MUR’ 000 MUR’ 000 MUR’ 000 MUR’ 000 MUR’ 000
Financial assetsCash and cash equivalents 11,211,712 11,211,712 15,620,778 15,620,778 9,423,941 9,423,941Mandatory balances with central banks 8,767,767 8,767,767 8,712,062 8,712,062 6,945,570 6,945,570Loans to and placements with banks 11,764,358 11,764,358 8,895,860 8,895,860 4,645,911 4,645,911Derivative financial instruments 762,855 762,855 1,356,774 1,356,774 165,997 165,997Loans and advances to non-bank customers 94,296,051 95,941,685 100,839,231 100,768,119 71,158,114 71,605,501Investment securities 50,934,309 54,382,199 37,150,731 39,582,150 34,410,974 34,264,654Equity investments 3,411 3,411 370 370 4,058 4,058Other assets 567,126 567,126 676,317 676,317 380,057 380,057
178,307,589 183,401,113 173,252,123 175,612,430 127,134,622 127,435,689Financial liabilitiesDeposits from banks 796,117 796,117 739,926 739,926 2,711,364 2,711,364Deposits from non-bank customers 147,530,840 147,843,840 141,695,769 141,700,386 108,302,387 108,308,034Other borrowed funds 11,773,938 11,773,938 13,116,593 13,116,593 4,540,509 4,540,509Derivative financial instruments 758,642 758,642 1,334,584 1,334,584 182,406 182,406Other liabilities 2,013,081 2,013,081 1,944,907 1,944,907 2,134,740 2,134,740
162,872,618 163,185,618 158,831,779 158,836,396 117,871,406 117,877,053
For loans and advances to non-bank customers, all the fixed loans and advances maturing after one year have been fair valued based on the current prevailing lending rate.
For investment securities, all the government bonds and BOM bonds have been fair valued based on the latest weighted yield rate.
For deposits from non-bank customers, all the term deposits maturing after one year have been fair valued based on the current prevailing savings rate.
Except for the levels in which the financial assets and financial liabilities are shown in table 37 (a)(iii), the fair values of the other financial assets and financial liabilities are categorised in level 3.
SBM BANK (MAURITIUS) LTD194 ANNUAL REPORT 2018

Notes to the Financial Statements FOR THE YEAR ENDED 31 DECEMBER 2018
37. RISK MANAGEMENT (CONT’D)
a (iii) Fair value measurement hierarchy
Significant accounting estimates and judgements
The fair value of equity investments that are quoted on active markets are based on the quoted prices for these instruments. Valuation techniques used to estimate the fair value of unquoted equity investments include the dividend growth, discounted cash flows and net assets. Management has made certain assumptions for inputs in the models, such as risk free rate, risk premium, dividend growth rate, future cash flows, weighted average cost of capital, and earnings before interest depreciation and tax, which may be different from actual. Inputs are based on information available at the reporting date.
The determination of fair values, estimated by discounting future cash flows and by determining the relative interest rates, is subjective. The estimated fair value was calculated according to interest rates prevailing at the reporting date and does not consider interest rate fluctuations. Given other interest rate assumptions, fair value estimates may differ.
Fair value measurements of financial instruments can be grouped into level 1 to 3 based on the degree to which the fair value is observable, namely:
- Level 1 - Quoted (unadjusted) market prices in active markets for identical assets or liabilities.
- Level 2 - fair value measurements are those derived from inputs other than quoted prices included within level 1 that are observable for the asset or liability, either directly or indirectly.
- Level 3 - Valuation techniques for which the lowest level input that is significant to the fair value measurement is unobservable.
The table below analyses financial instruments measured at fair value at the reporting date, by the level in the fair value hierarchy into which the fair value measurement is categorised.
Quoted prices in active markets
Significant observable
inputs
Significant unobservable
inputsLevel 1 Level 2 Level 3 TotalMUR’ 000 MUR’ 000 MUR’ 000 MUR’ 000
31 December 2018Derivative financial assets - 762,855 - 762,855Investment securities mandatorily measured at FVTPL Debt securities 8,946,664 765,119 - 9,711,783Investments at FVTOCI (debt and equity instruments) Debt securities 20,107,062 7,308,977 - 27,416,039 Equity securities - - - - Loans and advances at FVTPL * - - 4,670,782 4,670,782Total assets 29,053,726 8,836,951 4,670,782 42,561,459Derivative financial liabilities - 758,642 - 758,642Total liabilities - 758,642 - 758,642
31 December 2017Derivative financial assets - 1,356,774 - 1,356,774Loans and advances at fair value - - 2,278,438 2,278,438Investment securities - available-for-sale 7,035,681 3,439,029 793,690 11,268,400Investment securities - held-for-trading 5,705,895 970,594 - 6,676,489
12,741,576 5,766,397 3,072,128 21,580,101Derivative financial liabilities - 1,334,584 - 1,334,584
* Relate to those loans where fair value hedge accounting is applied. Their carrying amount is adjusted for changed in fair value. The discounted cash flow method is used to value these loans.
Notes to the Financial Statements FOR THE YEAR ENDED 31 DECEMBER 2018
37. RISK MANAGEMENT (CONT’D)
a (ii) Fair values
Set out below is a comparison of the carrying amounts and fair values of financial instruments held at the reporting date.
31 December 2018 31 December 2017 31 December 2016
Carrying ValueFair
Value Carrying ValueFair
Value Carrying ValueFair
ValueMUR’ 000 MUR’ 000 MUR’ 000 MUR’ 000 MUR’ 000 MUR’ 000
Financial assetsCash and cash equivalents 11,211,712 11,211,712 15,620,778 15,620,778 9,423,941 9,423,941Mandatory balances with central banks 8,767,767 8,767,767 8,712,062 8,712,062 6,945,570 6,945,570Loans to and placements with banks 11,764,358 11,764,358 8,895,860 8,895,860 4,645,911 4,645,911Derivative financial instruments 762,855 762,855 1,356,774 1,356,774 165,997 165,997Loans and advances to non-bank customers 94,296,051 95,941,685 100,839,231 100,768,119 71,158,114 71,605,501Investment securities 50,934,309 54,382,199 37,150,731 39,582,150 34,410,974 34,264,654Equity investments 3,411 3,411 370 370 4,058 4,058Other assets 567,126 567,126 676,317 676,317 380,057 380,057
178,307,589 183,401,113 173,252,123 175,612,430 127,134,622 127,435,689Financial liabilitiesDeposits from banks 796,117 796,117 739,926 739,926 2,711,364 2,711,364Deposits from non-bank customers 147,530,840 147,843,840 141,695,769 141,700,386 108,302,387 108,308,034Other borrowed funds 11,773,938 11,773,938 13,116,593 13,116,593 4,540,509 4,540,509Derivative financial instruments 758,642 758,642 1,334,584 1,334,584 182,406 182,406Other liabilities 2,013,081 2,013,081 1,944,907 1,944,907 2,134,740 2,134,740
162,872,618 163,185,618 158,831,779 158,836,396 117,871,406 117,877,053
For loans and advances to non-bank customers, all the fixed loans and advances maturing after one year have been fair valued based on the current prevailing lending rate.
For investment securities, all the government bonds and BOM bonds have been fair valued based on the latest weighted yield rate.
For deposits from non-bank customers, all the term deposits maturing after one year have been fair valued based on the current prevailing savings rate.
Except for the levels in which the financial assets and financial liabilities are shown in table 37 (a)(iii), the fair values of the other financial assets and financial liabilities are categorised in level 3.
195ANNUAL REPORT 2018
SBM BANK (MAURITIUS) LTD

Notes to the Financial Statements FOR THE YEAR ENDED 31 DECEMBER 2018
37. RISK MANAGEMENT (CONT’D)
a (iii) Fair value measurement hierarchy (cont’d)
Quoted prices in active markets
Significant observable
inputs
Significant unobservable
inputsLevel 1 Level 2 Level 3 TotalMUR’ 000 MUR’ 000 MUR’ 000 MUR’ 000
31 December 2016Derivative financial assets - 165,997 - 165,997Loans and advances at fair value - - 137,026 137,026Investment securities - available-for-sale 8,141,942 - 2,075,251 10,217,193
8,141,942 165,997 2,212,277 10,520,216Derivative financial liabilities - 182,406 - 182,406
Loans and advances at fair value relate to the fair value of hedged assets (Note 37(d)(ii)).
31 December 31 December 31 December2018 2017 2016
MUR’ 000 MUR’ 000 MUR’ 000Balance at start of year 3,072,128 2,212,277 2,822,008Additions 3,009,178 2,259,917 3,688Disposals (1,181,885) (1,379,594) (389,849)Derecognition of Indian Operations following distribution in specie (185,452) - - Impairment - (3,688) - Movement in fair value (43,187) (16,784) (223,570)Balance at end of year 4,670,782 3,072,128 2,212,277
There was no transfer between levels during the year.
b Credit risk
The Bank is exposed to credit risk through its lending, trade finance, treasury, asset management and leasing activities. Credit risk is the risk of loss arising from the failure of a counterparty to fulfil its contractual or financial obligations to the Bank as and when they fall due. The Bank’s credit risk is managed through a portfolio approach with prudential limits set across country, bank, industry, group and individual exposures. The credit risk team, independent of the origination process, ensures the accumulation of assets within acceptable risk norms using internal and external rating systems for the standardisation of credit assessment. The Bank has a tiered credit sanctioning process depending on the credit quality, exposure type and amount. Credit exposures and risk profile are monitored by the Credit Risk Management unit and reported regularly to the Board Risk Management Committee. The Bank has also enhanced its credit risk policy to reinforce its controls on segment B lending.
SBM BANK (MAURITIUS) LTD196 ANNUAL REPORT 2018

Notes to the Financial Statements FOR THE YEAR ENDED 31 DECEMBER 2018
37. RISK MANAGEMENT (CONT’D)
b Credit risk (cont’d)
(i) Maximum credit exposure
The maximum exposure to credit risk at the reporting date without taking account of any collateral held and other credit enhancements is as disclosed below:
31 December 31 December 31 December2018 2017 2016
MUR’ 000 MUR’ 000 MUR’ 000Fund-based exposures:Cash and cash equivalents 8,577,539 13,521,787 7,429,492Mandatory balances with central banks 8,767,767 8,712,062 6,945,570Loans to and placements with banks 11,798,639 8,895,860 4,645,911Derivative financial instruments 762,855 1,356,774 165,997Loans and advances to non-bank customers 94,296,051 104,260,079 75,210,043Investment securities (including equity investments) 50,934,309 37,151,101 34,410,974Other assets 567,126 676,317 380,057
175,704,286 174,573,980 129,188,044Non-fund based exposures:Acceptances, guarantees, letters of credit, endorsements and other obligations on account of customers 8,596,373 12,291,283 8,182,579Credit commitments 9,071,296 14,238,833 6,787,125
17,667,669 26,530,116 14,969,704
An analysis of the Bank’s maximum exposure to credit risk per class of financial asset, internal rating and ‘stage’, at the reporting date, without taking account of any collateral held and other credit enhancements have been disclosed in Notes 7,8,9 and 10.
197ANNUAL REPORT 2018
SBM BANK (MAURITIUS) LTD

Notes to the Financial Statements FOR THE YEAR ENDED 31 DECEMBER 2018
37. RISK MANAGEMENT (CONT’D)
b Credit risk (cont’d)
(i) Maximum credit exposure (cont’d)
An analysis of credit exposures, including non-fund based facilities, for advances to non-bank customers that are neither past due nor impaired using the Bank’s credit grading system is given below:
31 December 31 December 31 December2018 2017 2016
MUR’ 000 MUR’ 000 MUR’ 000Grades:1 to 3 - High Grade 41,356,537 53,443,458 30,689,6044 to 6 - Standard 34,886,343 36,472,979 32,521,2147 to 10 (including unrated) - Sub standard 25,647,564 33,344,743 17,722,958
101,890,444 123,261,180 80,933,776
Grade 1 includes customers with low credit risk factors, strong financial conditions and excellent repayment capacities whereas grade 10 includes unrated customers which have been defaulted to 10 on a prudent basis.
All cash and cash equivalents, loans and placements with banks and loans and receivables – investment securities are held with financial institutions having grades 1 to 5.
Overview of modified loans
From a risk management point of view, once an asset if modified, the Bank continues to monitor the exposure until it is completely and ultimately derecognised.
The table below shows the gross carrying amount of modified financial assets for which loss allowance has changed during the year.
Gross carrying amount ECLMUR’ 000 MUR’ 000
Modified loans 7,634,975 92,172
Internal credit risk ratings
In order to minimise credit risk, the Bank has tasked its credit management committee to develop and maintain the Bank’s credit risk grading to categorise exposures according to their degree of risk of default. The Bank’s credit risk grading framework comprises different categories. The credit rating information is based on a range of data that is determined to be predictive of the risk of default and applying experienced credit judgement. The nature of the exposure and type of borrower are taken into account in the analysis. Credit risk grades are defined using qualitative and quantitative factors that are indicative of risk of default.
The credit risk grades are designed and calibrated to reflect the risk of default as credit risk deteriorates. As the credit risk increases the difference in risk of default between grades changes. Each exposure is allocated to a credit risk grade at initial recognition, based on the available information about the counterparty. All exposures are monitored and the credit risk grade updated to reflect current information. The monitoring procedures followed are both general and tailored to the type of exposure.
The following data are typically used to monitor the Bank’s exposures:
- Payment record and ageing analysis;
- Extent of utilisation of granted limit;
- Changes in business, financial and economic conditions;
- Credit rating information supplied by external rating agencies; and
- For retail exposures internally generated data of customer behaviour or other metrics.
SBM BANK (MAURITIUS) LTD198 ANNUAL REPORT 2018

Notes to the Financial Statements FOR THE YEAR ENDED 31 DECEMBER 2018
37. RISK MANAGEMENT (CONT’D)
b Credit risk (cont’d)
(i) Maximum credit exposure (cont’d)
Internal credit risk ratings
The Bank uses credit risk grades as a primary input into the determination of the term structure of the PD for exposures. The Bank collects performance and default information about its credit risk exposure analysed by type of products and borrower as well as by credit risk grading. The information used is both internal and external depending on the portfolio assessed. The table below provides a mapping of the Bank’s internal credit risk grades to external ratings.
Bank’s credit risk grades Moody’s rating Description
1 Aaa High Grade2 Aa1 High Grade3 Aa2 to Aa3 High Grade4 A1 to A3 Standard5 Baa1 to Ba1 Standard6 Ba1 Standard7 Ba2 to Ba3 Sub-standard8 B1 Sub-standard9 B2 to B3 Sub-standard
10 Caa1 to NR Sub-standard
The Bank analyses all data collected using statistical models and estimates the remaining lifetime PD of exposures and how these are expected to change over time and uses probability-weighted forecasts to adjust estimates of PDs.
Irrespective of the outcome of the above assessment, the Bank presumes that the credit risk on a financial asset has increased significantly since intial recognition when contractual payments are more than 30 days past due unless the Bank has reasonable and supportable information that demonstrate otherwise. The Bank has monitoring procedures in place to ensure that the criteria used to identify significant increases in credit are effective, meaning that significant increase in credit risk is identified before the exposure is defaulted or when the asset becomes 30 days past due. The Bank performs periodic back-testing of its ratings to consider whether the drivers of credit-risk that led to default were accurately reflected in the rating in a timely manner.
1. Inputs, assumptions and techniques used in estimating impairment : Refer to Note 9 (c) Credit Impairment
2. Significant increase in credit risk
The Bank monitors all financial assets that are subject to the impairment requirements to assess whether there has been a significant increase in credit risk since initial recognition. If there has been significant increase in credit risk, the Bank will measure the loss allowance based on lifetime rather than 12-month ECL. In assessing whether the credit risk on a financial instrument has increased significantly since initial recognition, the Bank compares the risk of a default occuring on the financial instrument at the reporting date based on the remaining maturity of the instrument with the risk of default that was anticipated for the remaining maturity at the current reporting date when the financial instrument was first recognised. In making this assessment, the Bank considers both quantitative and qualitative information that is reasonable and supportable, including historical experience and forward-looking information that is available without undue cost or effort, based on the Bank’s historical experience and expert credit assessment including forward-looking information.
Multiple economic scenarios form the basis of determining the probability of default at initial recognition and at subsequent reporting date. Different economic scenario will lead to a different probability of default. It is the weighting of these different scenarios that forms the basis of a weighted average probability of default that is used to determine whether credit risk has significantly increased.
199ANNUAL REPORT 2018
SBM BANK (MAURITIUS) LTD

Notes to the Financial Statements FOR THE YEAR ENDED 31 DECEMBER 2018
37. RISK MANAGEMENT (CONT’D)
b Credit risk (cont’d)
(i) Maximum credit exposure (cont’d)
Internal credit risk ratings (cont’d)
2. Significant increase in credit risk (cont’d)
For corporate lending, forward-looking information includes the future prospects of the industries in which the Bank’s counterparties operate, obtained from economic expert reports, financial analysts, governmental bodies, and other similar organisations, as well as consideration of various internal and external sources of actual and forecast economic information. For retail lending, forward-looking information includes the same economic forecasts as corporate lending with additional forecasts of local economic indicators, particularly to certain industries, as well as internally generated information of customer payment behaviour. The Bank allocated its counterparties to a relevant internal credit risk grade depending on their credit quality. The quantitative information is a primary indicator of significant increase in credit risk and is based on the change in lifetime PD by comparing:
- the remaining lifetime PD at the reporting date; with
- the remaining lifetime PD for the point in time that was estimated based on facts and circumstances at the time of initial recognition of the exposure.
The PDs used are forward looking and the Bank uses the same methodologies and data used to measure the loss allowance for ECL.
The qualitative factors that indicate a significant increase in credit risk are reflected in PD models on a timely basis. However, the Bank still considers separately some qualitative factors to assess if credit risk has increased significantly, such as, creditworthiness of counterparty which has deteriorated as unemployment, bankruptcy or death.
As a back-stop when an asset becomes 30 days past due (rebuttable presumption), the Bank considers that a significant increase in credit risk has occurred and the asset is in stage 2 of the impairment model, i.e. the loss allowance is measured as the lifetime ECL.
3. Modified financial asset
The contractual terms of a loan may be modified for a number of reasons, including changing market conditions, customer retention and other factors not related to a current or potential credit deterioration of the customer. An existing loan whose terms have been modified may be derecognised and the renegotiated loan recognised as a new loan at fair value.
When the terms of a financial asset are modified and the modifcation does not result in derecognition, the determination of whether the asset’s credit risk has increased significantly reflects comparison of:
- its remaining lifetime PD at the reporting date based on the modified terms; with
- the remaining lifetime PD estimated based on data at initial recognition and the original contractual terms.
The Bank renegotiates loans to customers in financial difficulties to maximise collection opportunities and minimise the risk of default. Under this policy, renegotiation is performed on a selective basis if the debtor is currently in default on its debt or if there is a high risk of default, there is evidence that the debtor made all reasonable efforts to pay under the original terms and the debtor is expected to be able to meet the revised terms.
The revised terms usually include extending the maturity, changing the timing of interest payments and amending the terms of loan covenants. Both retail and corporate loans are subject to renegotiation policy. For financial assets modified, the estimate of PD reflects whether the modification has improved or restored the Bank’s ability to collect interest and principal based on the Bank’s previous experience on similar renegotiation.
Generally modification of financial assets is a qualitative indicator of a significant increase in credit risk and may constitute evidence that the exposure is credit-impaired/ in default. A customer needs to demonstrate consistently good payment behaviour over a period of time, as prescribed by BOM guidelines on Credit Impairment Measurement and Income Recognition (see below) before the exposure is no longer considered to be credit-impaired/ in default or the PD is considered to have decreased such that the loss allowance reverts to being measured at an amount equal to 12-month ECL.
SBM BANK (MAURITIUS) LTD200 ANNUAL REPORT 2018
Notes to the Financial Statements FOR THE YEAR ENDED 31 DECEMBER 2018
37. RISK MANAGEMENT (CONT’D)
b Credit risk (cont’d)
(i) Maximum credit exposure (cont’d)
Internal credit risk ratings (cont’d)
3. Modified financial asset (cont’d)
Where the restructuring occurs prior to the classification of a loan as impaired, the restructured loan is classified as impaired when, in the aggregate, the period of time the loan is in arrears before and after restructuring is 90 days or more.
Where the restructuring occurs after a loan has been classified as impaired, the restructured loan is continued to be classified as impaired until repayments have been received by the Bank, in amount and in such stipulated time, for a continuous period of six months, strictly in accordance with the terms and conditions of the restructured loan.
Where the loan has been restructured more than once, the restructured loan shall continue to be classified as impaired until repayments have been received by the financial institutions in amount and in such stipulated time, for a continuous period of nine months, at a minimum, strictly in accordance with the terms and conditions of the restructured loan.
4. Incorporation of forward-looking information
The Bank incorporates forward looking information that is available without undue cost and effort into both its assessment of whether the credit risk of an instrument has increased significantly since its intial recognition and its measurement of ECL. Based on analysis from the Bank’s Risk Committee and economic experts and consideration of a variety of external actual and forecast information, the Bank formulates a ‘base case’ view of the future direction of relevant economic variables as well as a representative range of other possible forecast scenarios. This process involves developing two or more additional economic scenarios and considering the relative probabilities of each outcome.
The base case represents a most-likely outcome and is aligned with information used by the Bank for other purposes such as strategic planning and budgeting. The other scenarios represent more optimistic and more pessimistic outcomes. Periodically, the Bank carries out stress testing of more extreme shocks to calibrate its determination of these other representative scenarios.
The Bank has identified and documented key drivers of credit risk and credit losses for each portfolio of financial instruments and, using an analysis of historical data, has estimated relationships between macro-economic variables, credit risk and credit losses. The following key indicators were considered for the year ended 31 December 2018: GDP, interest rates.
Measurement of ECL : The key inputs into the measurement of ECL are the following:
(i) probability of default (PD);
(ii) loss given default (LGD);
(iii) exposure at default (EAD).
These parameters are derived from internally developed statistical models and other historical data. They are adjusted to reflect forward-looking information as described above.
201ANNUAL REPORT 2018
SBM BANK (MAURITIUS) LTD

Notes to the Financial Statements FOR THE YEAR ENDED 31 DECEMBER 2018
37. RISK MANAGEMENT (CONT’D)b Credit risk (cont’d)
(i) Maximum credit exposure (cont’d)
Internal credit risk ratings (cont’d)
5. Measurement of ECL
PD estimates are estimates at a certain date, which are calculated based on statistical rating models, and assessed using rating tools tailored to the various categories of counterparties and exposures. These statistical models are based on internally compiled data comprising both quantitative and qualitative factors. Where it is available, market data may also be used to derive the PD for large corporate counterparties. If a counterparty or exposure migrates between rating classes, then this will lead to a change in the estimate of the associated PD. PDs are estimated considering the contractual maturities of exposures and estimated prepayment rates.
LGD is the magnitude of the likely loss if there is a default. The Bank estimates LGD parameters based on the history of recovery rates of claims against defaulted counterparties. The LGD models consider the structure, collateral, seniority of the claim, counterparty industry and recovery costs of any collateral that is integral to the financial asset. For loans secured by retail property, loan-to-value (LTV) ratios are a key parameter in determining LGD. LGD estimates are recalibrated for different economic scenarios and, for real estate lending, to reflect possible changes in property prices. They are calculated on a discounted cash flow basis using the effective interest rate as the discounting factor.
EAD represents the expected exposure in the event of a default. The Bank derives the EAD from the current exposure to the counterparty and potential changes to the current amount allowed under the contract including amortisation. The EAD of a financial asset is its gross carrying amount. For lending commitments and financial guarantees, the EAD includes the amount drawn, as well as potential future amounts that may be drawn under the contract, which are estimated based on historical observations and forward-looking forecasts. For some financial assets, EAD is determined by modelling the range of possible exposure outcomes at various points in time using scenario and statistical techniques. As described above, and subject to using a maximum of a 12-month PD for financial assets for which credit risk has not significantly increased, the Bank measures ECL considering the risk of default over the maximum contractual period (including any borrower’s extension options) over which it is exposed to credit risk, even if, for risk management purposes, the Bank considers a longer period. The maximum contractual period extends to the date at which the Bank has the right to require repayment of an advance or terminate a loan commitment or guarantee.
However, for retail overdrafts and credit card facilities that include both a loan and an undrawn commitment component, the Bank measures ECL over a period longer than the maximum contractual period if the Bank’s contractual ability to demand repayment and cancel the undrawn commitment does not limit the Bank’s exposure to credit losses to the contractual notice period. These facilities do not have a fixed term or repayment structure and are managed on a collective basis. The Bank can cancel them with immediate effect but this contractual right is not enforced in the normal day-to-day management, but only when the Bank becomes aware of an increase in credit risk at the facility level. This longer period is estimated taking into account the credit risk management actions that the Bank expects to take and that serve to mitigate ECL. These include a reduction in limits, cancellation of the facility and/or turning the outstanding balance into a loan with fixed repayment terms.
SBM BANK (MAURITIUS) LTD202 ANNUAL REPORT 2018

Notes to the Financial Statements FOR THE YEAR ENDED 31 DECEMBER 2018
37. RISK MANAGEMENT (CONT’D)
b Credit risk (cont’d)
(iii) Collateral and other credit enhancements
The use of credit risk mitigants is an integral part of the credit risk management process and is documented in the Bank’s Credit Risk policy. The amount and type of collateral required depend on the counterparty’s credit quality and repayment capacity. The principal collateral types taken include:
- Fixed / floating charge on assets of borrowers;
- Pledge of deposits / securities / life insurance policy / shares;
- Government guarantee / bank guarantee / corporate guarantee / personal guarantee;
- Lien on vehicle; and
- Letter of comfort.
The Bank holds collateral and other credit enhancement against certain of its credit exposure. The following table sets out the principal types of collateral held against different types of financial assets.
Type of credit exposure Note31 December
201831 December
201731 December
2016
Principal Type of collateral
heldMUR’ 000 MUR’ 000 MUR’ 000
Fund-based exposures:Cash and cash equivalents (i) 8,577,539 13,521,787 7,429,492 UnsecuredMandatory balances with central banks (ii) 8,767,767 8,712,062 6,945,570 UnsecuredLoans to and placements with banks (iii) 11,798,639 8,895,860 4,645,911 UnsecuredDerivative financial instruments (iv) 762,855 1,356,774 165,997 Unsecured
Loans and advances to non-bank customers(v)
94,296,051 104,260,079 75,210,043Residential property
Investment securities (vi) 50,934,309 37,151,101 34,410,974 UnsecuredOther assets (vii) 567,126 676,317 380,057 UnsecuredNon-fund based exposures:Acceptances, guarantees, letters of credit, endorsements and other obligations on account of customers
(viii)8,596,373 12,291,283 8,182,579
Residential property
Credit commitments (ix) 9,071,296 14,238,833 6,787,125 Unsecured
In addition to the collateral included in the table above, the Bank holds other types of collateral and credit enhancements, such as second charges and floating charges for which specific values are not generally available.
203ANNUAL REPORT 2018
SBM BANK (MAURITIUS) LTD

Notes to the Financial Statements FOR THE YEAR ENDED 31 DECEMBER 2018
37. RISK MANAGEMENT (CONT’D)
b Credit risk (cont’d)
(iii) Collateral and other credit enhancements (cont’d)
The Bank did not hold any financial instrument for which no loss allowance is recognised because of collateral at 31 December 2018. There was no change in the Bank’s collateral policy during the year.
(iv) Ageing of receivables that are past due but not impaired:
31 December 31 December 31 December2018 2017 2016
MUR’ 000 MUR’ 000 MUR’ 000Up to 1 month 118,304 458,128 108,109Over 1 month and up to 3 months 364,136 96,517 121,561
482,440 554,645 229,670
Under the Bank’s monitoring procedures, a significant increase in credit risk is identified before the exposure has defaulted, and at the latest when the exposure becomes 30 days past due. The table below provides an analysis of the gross carrying amount of receivables by past due status:
31 December 2018Gross Carrying
Amount Loss AllowanceMUR’ 000 MUR’ 000
0-30 days (Stage 1) 55,905,181 422,44831-89 days (Stage 2) 31,450,316 857,618Total 87,355,497 1,280,066
(v) Impaired financial assets
Loans and advances are assessed for impairment when objective evidence, such as default or delinquency in interest or principal payments, significant financial difficulty of the counterparty or evidence that the borrower will enter bankruptcy or financial re-organisation, indicate that the account may be impaired.
The carrying amount of impaired financial assets and specific allowance held are shown below:
31 December 31 December 31 December2018 2017 2016
MUR’ 000 MUR’ 000 MUR’ 000Loans and advances (Note 9d) 12,442,745 3,331,478 4,911,294Specific allowance held in respect of impaired advances (Note 9d) 4,222,125 2,157,900 3,025,160Fair value of collaterals of impaired advances 7,092,474 3,137,676 1,715,886
SBM BANK (MAURITIUS) LTD204 ANNUAL REPORT 2018
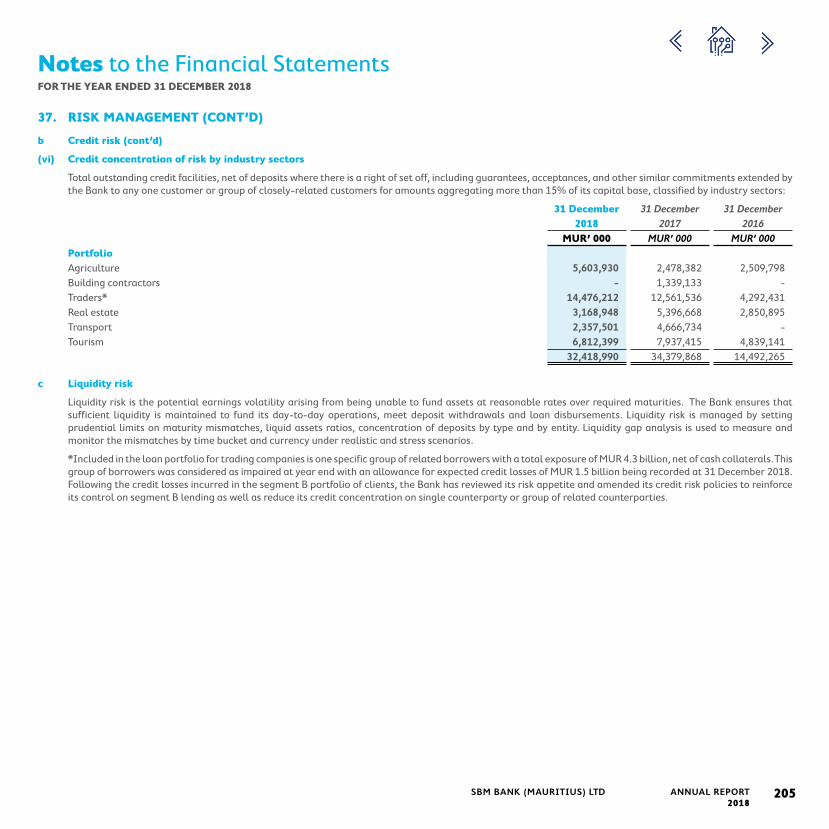
Notes to the Financial Statements FOR THE YEAR ENDED 31 DECEMBER 2018
37. RISK MANAGEMENT (CONT’D)
b Credit risk (cont’d)
(vi) Credit concentration of risk by industry sectors
Total outstanding credit facilities, net of deposits where there is a right of set off, including guarantees, acceptances, and other similar commitments extended by the Bank to any one customer or group of closely-related customers for amounts aggregating more than 15% of its capital base, classified by industry sectors:
31 December 31 December 31 December2018 2017 2016
MUR’ 000 MUR’ 000 MUR’ 000PortfolioAgriculture 5,603,930 2,478,382 2,509,798Building contractors - 1,339,133 - Traders* 14,476,212 12,561,536 4,292,431Real estate 3,168,948 5,396,668 2,850,895Transport 2,357,501 4,666,734 - Tourism 6,812,399 7,937,415 4,839,141
32,418,990 34,379,868 14,492,265
c Liquidity risk
Liquidity risk is the potential earnings volatility arising from being unable to fund assets at reasonable rates over required maturities. The Bank ensures that sufficient liquidity is maintained to fund its day-to-day operations, meet deposit withdrawals and loan disbursements. Liquidity risk is managed by setting prudential limits on maturity mismatches, liquid assets ratios, concentration of deposits by type and by entity. Liquidity gap analysis is used to measure and monitor the mismatches by time bucket and currency under realistic and stress scenarios.
*Included in the loan portfolio for trading companies is one specific group of related borrowers with a total exposure of MUR 4.3 billion, net of cash collaterals. This group of borrowers was considered as impaired at year end with an allowance for expected credit losses of MUR 1.5 billion being recorded at 31 December 2018. Following the credit losses incurred in the segment B portfolio of clients, the Bank has reviewed its risk appetite and amended its credit risk policies to reinforce its control on segment B lending as well as reduce its credit concentration on single counterparty or group of related counterparties.
205ANNUAL REPORT 2018
SBM BANK (MAURITIUS) LTD

Notes to the Financial Statements FOR THE YEAR ENDED 31 DECEMBER 2018
37. RISK MANAGEMENT (CONT’D)
c Liquidity risk (cont’d)
(i) The tables below show the expected timing of cash flows for financial assets and liabilities of the Bank, slotted as per the rules defined by the Bank of Mauritius.
Up to 1 1-3 3-6 6-12 1-3 Over 3Non-
Maturitymonth months months months years years Bucket Total
MUR’ 000 MUR’ 000 MUR’ 000 MUR’ 000 MUR’ 000 MUR’ 000 MUR’ 000 MUR’ 00031 December 2018Financial assetsCash and cash equivalents 11,253,470 - - - - - (41,758) 11,211,712Mandatory balances with central banks 2,957,068 199,808 90,675 164,748 128,288 5,227,180 - 8,767,767Loans to and placements with banks 1,106,416 156,693 5,890,689 1,839,650 2,805,191 - (34,281) 11,764,358Derivative financial instruments - - - - - - 762,855 762,855Loans and advances to non-bank customers 4,484,638 7,242,344 3,256,357 8,875,377 14,333,121 61,606,405 (5,502,191) 94,296,051Investment securities 22,391,525 1,619,324 1,881,135 3,204,656 10,315,022 11,360,354 162,293 50,934,309Equity investments - - - - - - 3,411 3,411Other assets - - - - - - 567,126 567,126
42,193,117 9,218,169 11,118,856 14,084,431 27,581,622 78,193,939 (4,082,545) 178,307,589Financial liabilitiesDeposits from banks 776,829 19,288 - - - - - 796,117Deposits from non-bank customers 19,863,883 7,325,802 4,362,012 5,602,022 2,182,859 108,194,262 - 147,530,840Other borrowed funds 4,145,402 378,017 4,432,455 1,454,929 129,729 1,233,406 - 11,773,938Derivative financial instruments - - - - - - 758,642 758,642Other liabilities - - - - - - 2,013,081 2,013,081Total financial liabilities 24,786,114 7,723,107 8,794,467 7,056,951 2,312,588 109,427,668 2,771,723 162,872,618Liquidity Gap 17,407,003 1,495,062 2,324,389 7,027,480 25,269,034 (31,233,729) (6,854,268) 15,434,97131 December 2017Financial assets 32,636,006 17,548,401 13,347,350 13,443,418 35,107,263 60,431,772 737,912 173,252,123Financial liabilities 15,510,215 13,074,826 8,476,757 8,048,753 7,644,496 104,742,148 1,334,584 158,831,779Liquidity Gap 17,125,791 4,473,575 4,870,593 5,394,665 27,462,767 (44,310,376) (596,672) 14,420,344
SBM BANK (MAURITIUS) LTD206 ANNUAL REPORT 2018

Notes to the Financial Statements FOR THE YEAR ENDED 31 DECEMBER 2018
37. RISK MANAGEMENT (CONT’D)
c Liquidity risk (cont’d)
Up to 1 1-3 3-6 6-12 1-3 Over 3Non-
Maturitymonth months months months years years Bucket Total
MUR’ 000 MUR’ 000 MUR’ 000 MUR’ 000 MUR’ 000 MUR’ 000 MUR’ 000 MUR’ 00031 December 2016Financial assets 15,776,190 8,756,059 11,211,736 12,496,159 32,905,099 45,815,710 173,669 127,134,622Financial liabilities 10,320,927 4,149,429 3,451,668 4,595,800 7,227,079 87,944,097 182,406 117,871,406Liquidity Gap 5,455,263 4,606,630 7,760,068 7,900,359 25,678,020 (42,128,387) (8,737) 9,263,216
(ii) The table below shows the remaining contractual maturities of financial liabilities:On 1-3 3-6 6-12 1-3 Over 3
Demand months months months years years TotalMUR’ 000 MUR’ 000 MUR’ 000 MUR’ 000 MUR’ 000 MUR’ 000 MUR’ 000
Financial liabilitiesDeposits 124,179,001 12,713,760 3,924,142 5,235,769 2,182,859 91,426 148,326,957Derivative financial instruments 758,642 - - - - - 758,642Other borrowed funds - 4,543,710 4,594,400 1,601,463 518,957 515,408 11,773,938Other liabilities 2,013,081 - - - - - 2,013,08131 December 2018 126,950,724 17,257,470 8,518,542 6,837,232 2,701,816 606,834 162,872,61831 December 2017 110,515,561 23,057,348 8,453,230 8,048,753 5,486,674 2,530,287 158,091,85131 December 2016 91,849,699 8,960,126 2,778,732 4,438,995 4,770,435 2,935,581 115,733,568
d Market risk
Market risk is the risk of loss resulting from adverse movement in market rates or prices such as interest rates, foreign exchange rates and equity prices. The Bank’s market risks are monitored by the Market Risk Team and reported to the Market Risk Forum and Board Risk Committee on a regular basis.
207ANNUAL REPORT 2018
SBM BANK (MAURITIUS) LTD

Notes to the Financial Statements FOR THE YEAR ENDED 31 DECEMBER 2018
37. RISK MANAGEMENT (CONT’D)
d Market risk (cont’d)
(i) Interest rate risk
The Bank’s interest rate risk arises mostly from mismatches in the repricing of its assets and liabilities. The Bank uses an interest rate gap analysis to measure and monitor the interest rate risk. Prudential limits for currency wise gaps, expressed as a percentage of assets, have been set for specific time buckets and earnings at risk is calculated based on different shock scenarios across major currencies.
The table below analyses the Bank’s interest rate risk exposure in terms of the remaining period to the next contractual repricing date or to the maturity date, whichever is the earlier. The ‘up to 3 months’ column includes the financial assets and liabilities which have floating rates of interest that do not reprice at set dates, but rather reprice whenever the underlying interest rate index changes.
Up to 3 3-6 6-12 1-2 2-5 Over 5 Non-interestmonths months months years years years sensitive Total
31 December 2018 MUR’ 000 MUR’ 000 MUR’ 000 MUR’ 000 MUR’ 000 MUR’ 000 MUR’ 000 MUR’ 000AssetsCash and cash equivalents 1,160,206 - - - - - 10,051,506 11,211,712Mandatory balances with central banks - - - - - - 8,767,767 8,767,767Loans to and placements with banks 6,534,408 3,634,285 1,496,667 - - - 98,998 11,764,358Derivative financial instruments - - - - - - 762,855 762,855Loans and advances to non-bank customers 79,956,573 3,550,888 1,354,255 4,625,816 3,837,623 2,850,164 (1,879,268) 94,296,051Investment securities 11,419,815 6,736,976 6,224,634 6,488,067 12,030,380 7,636,446 397,991 50,934,309Equity investments - - - - - - 3,411 3,411Other assets - - - - - - 567,126 567,126Total assets 99,071,002 13,922,149 9,075,556 11,113,883 15,868,003 10,486,610 18,770,386 178,307,589LiabilitiesDeposits from banks 48,217 - - - - - 747,900 796,117Deposits from non-bank customers 76,892,630 3,374,910 3,875,756 275,958 77,619 - 63,033,967 147,530,840Other borrowed funds 5,009,842 5,270,586 1,437,557 - - - 55,953 11,773,938Derivative financial instruments - - - - - - 758,642 758,642Other liabilities - - - - - - 2,013,081 2,013,081Total liabilities 81,950,689 8,645,496 5,313,313 275,958 77,619 - 66,609,543 162,872,618On balance sheet interest rate sensitivity gap 17,120,313 5,276,653 3,762,243 10,837,925 15,790,384 10,486,610 (47,839,157) 15,434,971Off balance sheet interest rate sensitivity gap 7,561,248 (2,309,965) (45,242) (1,298,380) (893,463) (2,900,292) - 113,906
24,681,561 2,966,688 3,717,001 9,539,545 14,896,921 7,586,318 (47,839,157) 15,548,877
SBM BANK (MAURITIUS) LTD208 ANNUAL REPORT 2018

Notes to the Financial Statements FOR THE YEAR ENDED 31 DECEMBER 2018
37. RISK MANAGEMENT (CONT’D)
d Market risk (cont’d)
(i) Interest rate risk (cont’d)
Up to 3 3-6 6-12 1-2 2-5 Over 5 Non-interestmonths months months years years years sensitive Total
MUR’ 000 MUR’ 000 MUR’ 000 MUR’ 000 MUR’ 000 MUR’ 000 MUR’ 000 MUR’ 00031 December 2017Total assets 83,860,541 22,658,143 10,600,109 9,025,824 20,319,990 5,958,543 20,828,973 173,252,123Total liabilities 85,464,547 6,789,872 4,457,802 3,593,917 901,366 6,971 57,617,304 158,831,779On balance sheet interest rate sensitivity gap (1,604,006) 15,868,271 6,142,307 5,431,907 19,418,624 5,951,572 (36,788,331) 14,420,344Off balance sheet interest rate sensitivity gap 2,908,933 (1,822,351) 299,689 (1,654,476) (1,008,871) (106,064) - (1,383,140)
1,304,927 14,045,920 6,441,996 3,777,431 18,409,753 5,845,508 (36,788,331) 13,037,20431 December 2016Total assets 62,719,959 13,423,198 6,867,932 10,036,612 17,385,764 2,490,872 14,210,285 127,134,622Total liabilities 19,624,879 3,450,951 2,838,013 190,071 2,805,861 51,272,240 37,689,391 117,871,406On balance sheet interest rate sensitivity gap 43,095,080 9,972,247 4,029,919 9,846,541 14,579,903 (48,781,368) (23,479,106) 9,263,216Off balance sheet interest rate sensitivity gap 691,753 19,644 47,392 (39,212) - - - 719,577
43,786,833 9,991,891 4,077,311 9,807,329 14,579,903 (48,781,368) (23,479,106) 9,982,793
209ANNUAL REPORT 2018
SBM BANK (MAURITIUS) LTD

Notes to the Financial Statements FOR THE YEAR ENDED 31 DECEMBER 2018
37. RISK MANAGEMENT (CONT’D)
d Market risk (cont’d)
(i) Interest rate risk (cont’d)
Various scenarios are used to measure the effect of the changing interest rates on net interest income including the standardised approach of 200bp parallel shock over a 12-month period assuming a static balance sheet, as shown below.
31 December 31 December 31 December2018 2017 2016
MUR’ 000 MUR’ 000 MUR’ 000Increase/(decrease) in profit 480,354 230,620 9,647
(ii) Fair value hedges
Carrying amount of hedged items
Accumulated amount of fair value adjustments on the
hedged itemsAssets Liabilities Assets LiabilitiesMUR’000 MUR’000 MUR’000 MUR’000
Fixed rate corporate loans 4,410,230 - 115,028 -
The corresponding statement of financial position line items, where the hedged item and the cumulative fair value changes are recorded, is under loans and advances to non-bank customers. Information about the hedging instruments included in the derivative financial instruments line items of the Bank’s statement of financial position is outlined in Note 8. The ineffectiveness recognised in the statement of profit or loss under net gain/loss from financial instruments amounting to MUR 44.5 million.
Up to 1 1-3 3-12 1-5 Over month months months years 5 years TOTALMUR’ 000 MUR’ 000 MUR’ 000 MUR’ 000 MUR’ 000 MUR’ 000
Fixed rate corporate loans Interest rate swap (Notional amount) - - - - 2,650,748 2,650,748
SBM BANK (MAURITIUS) LTD210 ANNUAL REPORT 2018

Notes to the Financial Statements FOR THE YEAR ENDED 31 DECEMBER 2018
37. RISK MANAGEMENT (CONT’D)
d Market risk (cont’d)
(iii) Currency risk (cont’d)
Foreign exchange risk arises from open and imperfectly offset or hedged positions. Imperfect correlations across currencies and international interest rate markets pose particular challenges to the effectiveness of foreign currency hedging strategies. The Bank exercises strict control over its foreign currency exposures. The Bank reports on foreign currency positions to the Central Bank and has set up conservative internal limits in order to mitigate foreign exchange risk. To manage their foreign currency exposures, dealers operate within prudential limits approved by the Board including intraday/overnight open exposures, stop loss and authorised currencies. These trading limits for Mauritius and Indian Operations are reviewed at least once annually by the Board / Board Risk Management Committee. The Middle Office closely monitors the Front Office and reports any excesses and deviations from approved limits to the Market Risk Forum and to the Board Risk Management Committee.
The tables below show the carrying amounts of the monetary assets and liabilities:
MUR USD GBP EURO INR OTHER TOTAL31 December 2018 MUR’ 000 MUR’ 000 MUR’ 000 MUR’ 000 MUR’ 000 MUR’ 000 MUR’ 000ASSETSCash and cash equivalents 4,435,692 4,961,455 466,570 754,645 - 593,350 11,211,712Mandatory balances with central banks 7,803,233 823,330 92,565 47,674 - 966 8,767,767Loans to and placements with banks 5,348,276 3,084,469 - 3,331,613 - - 11,764,358Derivative financial instruments 218,601 506,668 4,630 - 6,681 26,275 762,855Loans and advances to non-bank customers 59,380,439 24,050,589 828,678 9,974,100 - 62,244 94,296,051Investment securities 32,818,281 17,388,263 - 394,775 332,990 - 50,934,309Equity investments - - - 3,411 - - 3,411Other assets 446,821 63,155 469 37,048 - 19,633 567,126Total monetary financial assets 110,451,343 50,877,929 1,392,912 14,543,266 339,671 702,468 178,307,589LIABILITIES Deposits from banks 796,117 - - - - - 796,117Deposits from non-bank customers 89,188,504 46,167,611 2,841,997 8,859,140 - 473,588 147,530,840Other borrowed funds 159,531 9,627,668 284,044 1,662,160 - 40,536 11,773,938Derivative financial instruments 263,087 140,091 8 - 344,086 11,370 758,642Other liabilities 527,821 403,513 56,483 714,820 271,683 38,671 2,012,991Total monetary financial liabilities 90,935,059 56,338,883 3,182,531 11,236,120 615,770 564,165 162,872,528On balance sheet position 19,516,284 (5,460,954) (1,789,619) 3,307,146 (276,099) 138,303 15,435,061Off balance sheet position (2,542,005) 2,868,951 122,001 150,181 (56,201) (542,927) - Net currency position 16,974,279 (2,592,003) (1,667,618) 3,457,327 (332,300) (404,624) 15,435,061
211ANNUAL REPORT 2018
SBM BANK (MAURITIUS) LTD

Notes to the Financial Statements FOR THE YEAR ENDED 31 DECEMBER 2018
37. RISK MANAGEMENT (CONT’D)
d Market risk (cont’d)
(iii) Currency risk (cont’d)
The tables below show the carrying amounts of the monetary assets and liabilities:
MUR USD GBP EURO INR OTHER TOTALMUR’ 000 MUR’ 000 MUR’ 000 MUR’ 000 MUR’ 000 MUR’ 000 MUR’ 000
31 December 2017Total monetary financial assets 91,500,312 51,313,750 1,765,369 18,104,239 9,684,066 884,387 173,252,123Total monetary financial liabilities 85,571,002 49,542,814 1,780,814 14,812,282 6,426,716 698,151 158,831,779On balance sheet position 5,929,310 1,770,936 (15,445) 3,291,957 3,257,350 186,236 14,420,344Off balance sheet position 669,316 3,600,673 11,227 (439,675) (3,746,111) (95,430) - Net currency position 6,598,626 5,371,609 (4,218) 2,852,282 (488,761) 90,806 14,420,34431 December 2016Total monetary financial assets 79,841,919 27,766,865 2,253,967 9,705,293 6,852,780 713,798 127,134,622Total monetary financial liabilities 78,377,602 27,886,890 2,157,035 8,818,556 72,261 559,062 117,871,406On balance sheet position 1,464,317 (120,025) 96,932 886,737 6,780,519 154,736 9,263,216Off balance sheet position 685,112 3,247 134,314 (334,535) (404,233) (83,905) - Net currency position 2,149,429 (116,778) 231,246 552,202 6,376,286 70,831 9,263,216
Value-at-Risk Analysis
The Bank uses Value-at-Risk (VAR) to estimate the potential foreign exchange loss arising from adverse movements in an ordinary market environment. To calculate VAR, the Bank uses the historical method which assumes that historical changes in market values are representative of future changes. The VAR is based on the previous 12 months data. The Bank calculates VAR using 10 days holding period and an expected tail-loss methodology, which approximates a 99% confidence level. This would mean that only once in every 100 trading days, the Bank would expect to incur losses greater than the VAR estimates, or about two to three times a year. The use of 10 days holding period and a one-year historical observation period are in line with the Basel II recommendation.
The Bank’s VAR amounted to:
31 December 31 December 31 December2018 2017 2016
MUR’ 000 MUR’ 000 MUR’ 000Minimum for the year 389 630 168Maximum for the year 14,398 7,331 4,993Year end 1,321 1,231 730
SBM BANK (MAURITIUS) LTD212 ANNUAL REPORT 2018

Notes to the Financial Statements FOR THE YEAR ENDED 31 DECEMBER 2018
37. RISK MANAGEMENT (CONT’D)
d Market risk (cont’d)
(iv) Equity price sentivity analysis
The Bank is exposed to equity price risks arising from equity investments. Equity investments are held for strategic rather than for trading purposes and the Bank does not actively trade in these investments. Changes in prices / valuation of these investments are reflected in the statement of comprehensive income, except for impairment losses which are reported in the statement of profit or loss. Changes in prices of held-for-trading investments are reflected in the statement of profit or loss.
A 5% increase in the price of equities held at the reporting date would have resulted in an unrealised gain to the statement of comprehensive income or statement of profit or loss as reflected below. A 5% decrease would have resulted in an equivalent loss being booked.
31 December 31 December 31 December2018 2017 2016
MUR’ 000 MUR’ 000 MUR’ 000Statement of comprehensive income 171 18 182Statement of profit or loss - - -
171 18 182
e Accounting policies
Details of the accounting policies and methods adopted, including the criteria for recognition, the basis of measurement and the basis on which income and expenses are recognised, in respect of each class of financial asset and financial liability and equity instruments are disclosed in Note 5 to the financial statements (accounting policies).
38. OTHER RESERVES
Fair value through other comprehensive income reserve
This reserve comprises fair value movements recognised on fair value through other comprehensive income financial assets.
Foreign currency translation reserve
The net translation reserve is used to record exchange differences arising from the translation of financial statements of foreign operations.
Statutory reserve
This reserve represents transfers from retained earnings in accordance with the Banking Act 2004. A sum equal to not less than 15% of the profit for the year is transferred each year until the balance is equal to the amount paid as stated capital.
Property revaluation reserve
The net property revaluation reserve is used to record increases in the fair value of land and buildings (net of deferred tax on the revalued asset) and decreases to the extent that such decreases relates to an increase on the same asset previously recognised in equity.
213ANNUAL REPORT 2018
SBM BANK (MAURITIUS) LTD

Notes to the Financial StatementsFOR THE YEAR ENDED 31 DECEMBER 2018
39. DISCONTINUED OPERATIONS
On 30 November 2018, the Bank declared a distribution in specie and its foreign operations consisting of four branches in India were transferred to SBM (Bank) Holdings Ltd, its sole shareholder. At 31 December 2018, the results of the foreign operations for the period 01 January 2018 to 30 November 2018 were reported as a one line item under “Discontinued Operations” in the statement of profit or loss. The results of the foreign operations for the period ended 30 November 2018 are presented below:
30 November 31 December 31 December2018 2017 2016
MUR’ 000 MUR’ 000 MUR’ 000Interest income 520,717 576,440 541,452 Interest expense (353,938) (361,996) (322,632)Net interest income 166,779 214,444 218,820 Fee and commission income 5,540 17,787 19,339 Fee and commission expense (3,277) (2,225) (2,643)Net fee and commission income 2,263 15,562 16,696 Other operating income 10,328 41,821 26,421 Operating income 179,370 271,827 261,937 Non-interest expense (247,596) (138,003) (123,836)Profit before credit loss expense on financial assets and tax (68,226) 133,824 138,101 Credit loss expense on financial assets (153,148) (759,238) (301,864)Profit before tax (221,374) (625,414) (163,763)Tax expense - (66,445) (20,789)Loss for the period/year from discontinued operations (221,374) (691,859) (184,552)
The statement of financial position as at 30 November 2018 is presented below:
MUR’000Assets 8,100,910 Liabilities 5,566,218 Net assets disposed of 2,534,692
Movement in Other ‘Comprehensive income’Recycling of translation reserve following derecognition of Indian Operations 685,838
The net cash flows incurred by the Indian Operations are as follows:
30 November 31 December2018 2017
MUR’000 MUR’000Operating 180,204 (71,732)Investing (121,507) 234,197 Financing 885,600 -
944,297 162,465
SBM BANK (MAURITIUS) LTD214 ANNUAL REPORT 2018

Notes to the Financial StatementsFOR THE YEAR ENDED 31 DECEMBER 2018
40.SUPPLEMENTARY INFORMATION AS REQUIRED BY BANK OF MAURITIUS
The Bank of Mauritius requires the Bank to disclose its assets and liabilities, income and expenditure classified into Segment A and B. Segment B activity which includes Indian operations is essentially directed to the provision of international financial services that give rise to ‘foreign source income’. Segment A activity and relates to all banking business other than Segment B activity. Expenditure incurred by the Bank but which is not directly attributable to its income derived from Mauritius or its foreign source income is apportioned in a fair and reasonable manner. Segmental reporting is based on the internal reports regularly reviewed by the chief operating decision maker in order to allocate resources to the segment and to assess their performance. The Bank is the only reportable segment.
a. Statement of financial position
Segment A Segment B Bank Segment A Segment B Bank Segment A Segment B Bank31-Dec 31-Dec 31-Dec 31-Dec 31-Dec 31-Dec 31-Dec 31-Dec 31-Dec
2018 2018 2018 2017 2017 2017 2016 2016 2016Notes MUR’ 000 MUR’ 000 MUR’ 000 MUR’ 000 MUR’ 000 MUR’ 000 MUR’ 000 MUR’ 000 MUR’ 000
ASSETSCash and cash equivalents 40l 5,228,135 5,983,577 11,211,712 5,283,090 10,337,688 15,620,778 2,110,776 7,313,165 9,423,941Mandatory balances with Central Banks 8,767,767 - 8,767,767 8,494,436 217,626 8,712,062 6,808,269 137,301 6,945,570Loans to and placements with banks 40m 5,587,990 6,176,368 11,764,358 1,104,288 7,791,572 8,895,860 451,829 4,194,082 4,645,911Derivative financial instruments 40n 182,900 579,955 762,855 1,244,946 111,828 1,356,774 100,808 65,189 165,997Loans and advances to non-bank customers 40o 69,394,195 24,901,856 94,296,051 66,810,412 34,028,819 100,839,231 58,173,886 12,984,228 71,158,114Investment securities 40p 44,291,560 6,642,749 50,934,309 27,224,221 9,926,510 37,150,731 24,197,840 10,213,134 34,410,974Equity investment - 3,411 3,411 - 370 370 - 4,058 4,058Property and equipment 40q 2,458,814 - 2,458,814 2,493,316 138,466 2,631,782 2,607,635 142,416 2,750,051Intangible assets 40r 2,962,920 - 2,962,920 3,422,881 34,180 3,457,061 3,509,064 260,855 3,769,919Deferred tax assets - - - - 95,461 95,461 21,817 193,503 215,320Other assets 40s 742,103 81,550 823,653 656,951 266,941 923,892 296,970 303,782 600,752Total assets 139,616,384 44,369,466 183,985,850 116,734,541 62,949,461 179,684,002 98,278,894 35,811,713 134,090,607LIABILITIES Deposits from banks 40t 342,285 453,832 796,117 372,709 367,217 739,926 1,948,906 762,458 2,711,364Deposits from non-bank customers 40u 100,797,742 46,733,098 147,530,840 98,447,966 43,247,803 141,695,769 81,396,999 26,905,388 108,302,387Other borrowed funds 40v 2,501,657 9,272,281 11,773,938 4,461,913 8,654,680 13,116,593 1,685,702 2,854,807 4,540,509Derivative financial instruments 40n 222,243 536,399 758,642 1,174,527 160,057 1,334,584 121,665 60,741 182,406Current tax liabilities 403,807 70,680 474,487 60,106 45,763 105,869 358,908 - 358,908Deferred tax liabilities 263,751 (99,755) 163,996 184,679 (13,774) 170,905 - - - Other liabilities 40w 1,937,094 3,083,541 5,020,635 1,705,657 2,457,550 4,163,207 1,442,112 798,484 2,240,596Total liabilities 106,468,579 60,050,076 166,518,655 106,407,557 54,919,296 161,326,853 86,954,292 31,381,878 118,336,170SHAREHOLDER’S EQUITYStated capital 310,000 310,000 310,000Capital contribution 11,044,011 9,063,106 8,063,106Retained earnings 4,817,518 7,855,520 6,193,747Other reserves 1,295,666 1,128,523 1,187,584Total equity 17,467,195 18,357,149 15,754,437Total equity and liabilities 183,985,850 179,684,002 134,090,607
215ANNUAL REPORT 2018
SBM BANK (MAURITIUS) LTD

Notes to the Financial StatementsFOR THE YEAR ENDED 31 DECEMBER 2018
40. SUPPLEMENTARY INFORMATION AS REQUIRED BY BANK OF MAURITIUS (CONT’D)
b. Statement of profit or loss
Segment A Segment B Bank Segment A Segment B Bank Segment A Segment B Bank31-Dec 31-Dec 31-Dec 31-Dec 31-Dec 31-Dec 31-Dec 31-Dec 31-Dec
2018 2018 2018 2017 2017 2017 2016 2016 2016Notes MUR’ 000 MUR’ 000 MUR’ 000 MUR’ 000 MUR’ 000 MUR’ 000 MUR’ 000 MUR’ 000 MUR’ 000
Interest income 5,204,461 1,951,911 7,156,372 4,710,904 1,363,986 6,074,890 4,766,114 630,436 5,396,550Interest expense (1,273,492) (391,514) (1,665,006) (1,318,156) (250,973) (1,569,129) (1,236,578) (124,689) (1,361,267)Net interest income 40c 3,930,969 1,560,397 5,491,366 3,392,748 1,113,013 4,505,761 3,529,536 505,747 4,035,283Fee and commission income 777,842 283,824 1,061,666 707,878 297,396 1,005,274 560,445 416,335 976,780Fee and commission expense (1,954) (21,061) (23,015) (4,472) (17,924) (22,396) (2,919) (17,806) (20,725)Net fee and commission income 40d 775,888 262,763 1,038,651 703,406 279,472 982,878 557,526 398,529 956,055Other incomeProfit arising from dealing in foreign currencies 381,540 298,198 679,738 309,245 122,238 431,483 414,955 75,021 489,976Net gain/(loss) from financial instruments 40e 16,401 483,732 500,133 15,066 504,755 519,821 (39,359) 14,528 (24,831)Net gain/(loss) on sale of securities 40f 209,042 (35,488) 173,554 379,225 51,672 430,897 254,293 169,556 423,849Other operating income 40g - - - 61 - 61 4,204 - 4,204
606,983 746,442 1,353,425 703,597 678,665 1,382,262 634,093 259,105 893,198Non interest income 1,382,871 1,009,205 2,392,076 1,407,002 958,138 2,365,140 1,191,619 657,634 1,849,253Operating income 5,313,840 2,569,602 7,883,442 4,799,750 2,071,151 6,870,901 4,721,155 1,163,381 5,884,536Personnel expenses 40h (1,162,499) (173,795) (1,336,294) (1,192,959) (170,437) (1,363,396) (1,135,736) (140,076) (1,275,812)Depreciation and amortisation (639,600) (55,536) (695,136) (591,261) (50,993) (642,254) (315,835) (23,656) (339,491)Other expenses 40i (629,152) (74,151) (703,303) (756,795) (83,145) (839,940) (756,642) (72,389) (829,031)Non-interest expense (2,431,251) (303,482) (2,734,733) (2,541,015) (304,575) (2,845,590) (2,208,213) (236,121) (2,444,334)Profit before credit loss expense 2,882,589 2,266,120 5,148,709 2,258,735 1,766,576 4,025,311 2,512,942 927,260 3,440,202Credit loss expense on financial assets 40j (278,203) (2,732,153) (3,010,356) 8,073 (236,097) (228,024) (117,929) (296,949) (414,878)Profit before income tax 2,604,386 (466,033) 2,138,353 2,266,808 1,530,479 3,797,287 2,395,013 630,311 3,025,324Tax expense 40k (606,337) (70,651) (676,988) (423,786) (70,349) (494,135) (612,690) (19,470) (632,160)Profit/(loss) for the year from continuing operations 1,998,049 (536,684) 1,461,365 1,843,022 1,460,130 3,303,152 1,782,323 610,841 2,393,164Discontinued operationsLoss after tax for the period/year from discontinued operations - (221,374) (221,374) - (691,859) (691,859) - (184,552) (184,552)Loss on distribution of dividend in specie - (685,838) (685,838) - - - - - - Profit/(loss) for the year 1,998,049 (1,443,896) 554,153 1,843,022 768,271 2,611,293 1,782,323 426,289 2,208,612
SBM BANK (MAURITIUS) LTD216 ANNUAL REPORT 2018

Notes to the Financial StatementsFOR THE YEAR ENDED 31 DECEMBER 2018
40. SUPPLEMENTARY INFORMATION AS REQUIRED BY BANK OF MAURITIUS (CONT’D)
c. Net interest income Segment A Segment B Bank Segment A Segment B Bank Segment A Segment B Bank31-Dec 31-Dec 31-Dec 31-Dec 31-Dec 31-Dec 31-Dec 31-Dec 31-Dec
2018 2018 2018 2017 2017 2017 2016 2016 2016MUR’ 000 MUR’ 000 MUR’ 000 MUR’ 000 MUR’ 000 MUR’ 000 MUR’ 000 MUR’ 000 MUR’ 000
Interest income on financial instruments at amortised cost Cash and cash equivalents 32,125 124,123 156,248 9,529 83,770 93,299 5,363 52,569 57,932Loans to and placements with banks 124,823 187,256 312,079 18,271 103,993 122,264 3,488 50,016 53,504Loans and advances to non-bank customers 3,992,536 1,559,738 5,552,274 3,780,100 1,026,734 4,806,834 3,945,939 317,658 4,263,597Investment securities 417,241 - 417,241 539,988 22,430 562,418 808,026 - 808,026
4,566,725 1,871,117 6,437,842 4,347,888 1,236,927 5,584,815 4,762,816 420,243 5,183,059Interest income on financial instruments at fair valueInvestment securities 608,187 232,180 840,367 335,995 160,693 496,688 3,291 219,276 222,567Trading assets 29,549 (151,386) (121,837) 27,021 (33,634) (6,613) - (9,083) (9,083)Other - - - - - - 7 - 7
637,736 80,794 718,530 363,016 127,059 490,075 3,298 210,193 213,491Total interest income 5,204,461 1,951,911 7,156,372 4,710,904 1,363,986 6,074,890 4,766,114 630,436 5,396,550
Interest expenseDeposits from customers (1,146,916) (229,785) (1,376,701) (1,271,078) (172,947) (1,444,025) (1,232,858) (96,549) (1,329,407)Other borrowed funds (126,576) (138,909) (265,485) (47,078) (62,619) (109,697) (3,720) (26,755) (30,475)Other - (22,820) (22,820) - (15,407) (15,407) - (1,385) (1,385)Total interest expense (1,273,492) (391,514) (1,665,006) (1,318,156) (250,973) (1,569,129) (1,236,578) (124,689) (1,361,267)Net interest income 3,930,969 1,560,397 5,491,366 3,392,748 1,113,013 4,505,761 3,529,536 505,747 4,035,283
d. Net fee and commission incomeFee and commission incomeRetail banking customer fees 232,783 24,423 257,206 307,788 23,327 331,115 287,420 14,507 301,927Corporate banking customer fees 270,067 183,875 453,942 168,412 190,672 359,084 164,384 78,794 243,178Card income 274,992 75,526 350,518 231,678 83,397 315,075 108,641 323,034 431,675Total fee and commission income 777,842 283,824 1,061,666 707,878 297,396 1,005,274 560,445 416,335 976,780Fee and commission expenseInterbank transaction fees - (14,409) (14,409) - (12,776) (12,776) (1) (15,917) (15,918)Other (1,954) (6,652) (8,606) (4,472) (5,148) (9,620) (2,918) (1,889) (4,807)Total fee and commission expense (1,954) (21,061) (23,015) (4,472) (17,924) (22,396) (2,919) (17,806) (20,725)Net fee and commission income 775,888 262,763 1,038,651 703,406 279,472 982,878 557,526 398,529 956,055
217ANNUAL REPORT 2018
SBM BANK (MAURITIUS) LTD

Notes to the Financial StatementsFOR THE YEAR ENDED 31 DECEMBER 2018
40. SUPPLEMENTARY INFORMATION AS REQUIRED BY BANK OF MAURITIUS (CONT’D)
Segment A Segment B Bank Segment A Segment B Bank Segment A Segment B Bank31-Dec 31-Dec 31-Dec 31-Dec 31-Dec 31-Dec 31-Dec 31-Dec 31-Dec
2018 2018 2018 2017 2017 2017 2016 2016 2016MUR’ 000 MUR’ 000 MUR’ 000 MUR’ 000 MUR’ 000 MUR’ 000 MUR’ 000 MUR’ 000 MUR’ 000
e. Net gain/(loss) from financial instrumentsNet (loss)/gain from derivatives financial instruments (5,223) 328,690 323,467 1,331 517,944 519,275 (39,377) 14,528 (24,849)Investment securities at fair value through profit or loss 40,331 19,141 59,472 13,723 (12,804) 919 - - - Other (18,707) 135,901 117,194 12 (385) (373) 18 - 18
16,401 483,732 500,133 15,066 504,755 519,821 (39,359) 14,528 (24,831)
f. Net gain/(loss) on sale of securitiesNet gain/(loss) on sale of securities 209,042 (35,488) 173,554 379,225 51,672 430,897 254,293 169,556 423,849
g. Other operating incomeOther - - - 61 - 61 4,204 - 4,204
h. Personnel expensesWages and salaries 860,679 140,559 1,001,238 904,212 139,779 1,043,991 837,697 115,695 953,392Other social security obligations - - - 15,580 2,143 17,723 14,440 1,737 16,177Contributions to defined contribution plans 121,908 22,369 144,277 78,349 12,831 91,180 64,007 9,109 73,116Cash-settled share-based payments - - - - - - - 580 580 Increase in liability for defined benefit plans 28,594 1,651 30,245 24,500 1,922 26,422 28,399 1,631 30,030Staff welfare cost 19,825 213 20,038 16,587 161 16,748 13,889 (319) 13,570Management and professional charges - - - 7,096 90 7,186 16,712 603 17,315Other 131,493 9,003 140,496 146,635 13,511 160,146 160,592 11,040 171,632
1,162,499 173,795 1,336,294 1,192,959 170,437 1,363,396 1,135,736 140,076 1,275,812
SBM BANK (MAURITIUS) LTD218 ANNUAL REPORT 2018

Notes to the Financial StatementsFOR THE YEAR ENDED 31 DECEMBER 2018
40. SUPPLEMENTARY INFORMATION AS REQUIRED BY BANK OF MAURITIUS (CONT’D)
i. Other expenses Segment A Segment B Bank Segment A Segment B Bank Segment A Segment B Bank31-Dec 31-Dec 31-Dec 31-Dec 31-Dec 31-Dec 31-Dec 31-Dec 31-Dec
2018 2018 2018 2017 2017 2017 2016 2016 2016MUR’ 000 MUR’ 000 MUR’ 000 MUR’ 000 MUR’ 000 MUR’ 000 MUR’ 000 MUR’ 000 MUR’ 000
Software licensing and other information technology cost 317,015 48,478 365,493 412,320 56,984 469,304 440,008 44,182 484,190Auditors’ remuneration (audit and other services): -Principal auditors 7,133 - 7,133 6,169 964 7,133 6,518 1,018 7,536 -Other auditors - - - - - - - - - Utilities 42,787 2,735 45,522 49,550 3,366 52,916 47,105 2,808 49,913Professional charges 54,845 10,733 65,578 14,943 14,790 29,733 20,325 13,724 34,049Marketing costs 55,369 1 55,370 69,671 1 69,672 43,541 33 43,574Rent, repairs and maintenance 64,928 2,662 67,590 75,460 3,286 78,746 83,761 4,236 87,997Licence and other registration fees 19,773 1,132 20,905 20,662 1,447 22,109 15,983 1,648 17,631Other 67,302 8,410 75,712 108,020 2,307 110,327 99,401 4,740 104,141
629,152 74,151 703,303 756,795 83,145 839,940 756,642 72,389 829,031j. Net impairment loss on financial
assetsPortfolio and specific provisions: - On-balance sheet advances 265,476 2,791,023 3,056,499 108,504 236,097 344,601 118,674 296,949 415,623Bad debts written off for which no provisions were made - - - - - - 1,259 - 1,259Recoveries of advances written off (6,322) - (6,322) (116,577) - (116,577) (2,068) - (2,068)Other 19,049 (58,870) (39,821) - - - 64 - 64
278,203 2,732,153 3,010,356 (8,073) 236,097 228,024 117,929 296,949 414,878Of which:Credit exposure 259,154 2,791,023 3,050,177 (8,073) 236,097 228,024 117,865 296,949 414,814Other financial assets 19,049 (58,870) (39,821) - - - 64 - 64
278,203 2,732,153 3,010,356 (8,073) 236,097 228,024 117,929 296,949 414,878k. Tax expense
Income tax expense 582,572 70,651 653,223 210,556 53,389 263,945 593,252 28,378 621,630Deferred tax charge/(income) 23,765 - 23,765 213,230 16,960 230,190 19,438 (8,908) 10,530
606,337 70,651 676,988 423,786 70,349 494,135 612,690 19,470 632,160
219ANNUAL REPORT 2018
SBM BANK (MAURITIUS) LTD

Notes to the Financial StatementsFOR THE YEAR ENDED 31 DECEMBER 2018
40. SUPPLEMENTARY INFORMATION AS REQUIRED BY BANK OF MAURITIUS (CONT’D)
l. Cash and cash equivalents Segment A Segment B Bank Segment A Segment B Bank Segment A Segment B Bank31-Dec 31-Dec 31-Dec 31-Dec 31-Dec 31-Dec 31-Dec 31-Dec 31-Dec
2018 2018 2018 2017 2017 2017 2016 2016 2016MUR’ 000 MUR’ 000 MUR’ 000 MUR’ 000 MUR’ 000 MUR’ 000 MUR’ 000 MUR’ 000 MUR’ 000
Cash in hand 2,398,191 - 2,398,191 1,804,128 - 1,804,128 1,706,637 - 1,706,637Foreign currency notes and coins 277,740 - 277,740 293,161 1,702 294,863 - 287,812 287,812Unrestricted balances with central banks ¹ 1,527,560 - 1,527,560 1,279,680 6,958 1,286,638 - - - Loans and placements with banks ² 1,066,119 96,245 1,162,364 1,906,121 3,989,822 5,895,943 404,153 3,049,370 3,453,523Balances with banks - 5,887,615 5,887,615 - 6,339,206 6,339,206 (15) 3,975,984 3,975,969
5,269,610 5,983,860 11,253,470 5,283,090 10,337,688 15,620,778 2,110,775 7,313,166 9,423,941Less: allowance for impairment losses (41,475) (283) (41,758) - - - - - -
5,228,135 5,983,577 11,211,712 5,283,090 10,337,688 15,620,778 2,110,775 7,313,166 9,423,941
1 Unrestricted balances with central banks represent amounts above the minimum cash reserve requirement.
2 The balances above relate to loans and placements with banks having an original maturity of up to three months. Allowance for impairment losses relates only to stage 1.
m. Loans to and placements with banks
Segment A Segment B Bank Segment A Segment B Bank Segment A Segment B Bank31-Dec 31-Dec 31-Dec 31-Dec 31-Dec 31-Dec 31-Dec 31-Dec 31-Dec
2018 2018 2018 2017 2017 2017 2016 2016 2016MUR’ 000 MUR’ 000 MUR’ 000 MUR’ 000 MUR’ 000 MUR’ 000 MUR’ 000 MUR’ 000 MUR’ 000
Loans to and placements with banks - in Mauritius 5,587,990 - 5,587,990 1,104,288 - 1,104,288 451,829 - 451,829 - outside Mauritius - 6,176,368 6,176,368 - 7,791,572 7,791,572 - 4,194,082 4,194,082
5,587,990 6,176,368 11,764,358 1,104,288 7,791,572 8,895,860 451,829 4,194,082 4,645,911Remaining term to maturityUp to 3 months 3,052,827 757,647 3,810,474 393,748 1,044,724 1,438,472 - 179,715 179,715Over 3 months and up to 6 months 2,060,256 1,280,200 3,340,456 336,387 67,587 403,974 380,372 1,523,405 1,903,777Over 6 months and up to 12 months 474,907 1,359,191 1,834,098 221,363 1,689,619 1,910,982 71,457 - 71,457Over 1 year and up to 2 years - 1,914,018 1,914,018 152,790 2,997,612 3,150,402 - 1,078,904 1,078,904Over 2 years and up to 5 years - 865,312 865,312 - 1,992,030 1,992,030 - 1,052,470 1,052,470Over 5 years - - - - - - - 359,588 359,588
5,587,990 6,176,368 11,764,358 1,104,288 7,791,572 8,895,860 451,829 4,194,082 4,645,911n. Derivative financial instruments
Derivative assets 182,900 579,955 762,855 1,244,946 111,828 1,356,774 100,808 65,189 165,997182,900 579,955 762,855 1,244,946 111,828 1,356,774 100,808 65,189 165,997
Derivative liabilities 222,243 536,399 758,642 1,174,527 160,057 1,334,584 121,665 60,741 182,406
SBM BANK (MAURITIUS) LTD220 ANNUAL REPORT 2018

Notes to the Financial StatementsFOR THE YEAR ENDED 31 DECEMBER 2018
40. SUPPLEMENTARY INFORMATION AS REQUIRED BY BANK OF MAURITIUS (CONT’D)
o. Loans and advances to non-bank customers
Segment A Segment B Bank Segment A Segment B Bank Segment A Segment B Bank31-Dec 31-Dec 31-Dec 31-Dec 31-Dec 31-Dec 31-Dec 31-Dec 31-Dec
2018 2018 2018 2017 2017 2017 2016 2016 2016MUR’ 000 MUR’ 000 MUR’ 000 MUR’ 000 MUR’ 000 MUR’ 000 MUR’ 000 MUR’ 000 MUR’ 000
Governments 9,315 - 9,315 2,458,655 - 2,458,655 - - - Retail customers 31,012,551 1,108,702 32,121,253 30,468,689 1,522,274 31,990,963 27,079,943 1,019,112 28,099,055 Credit cards 605,881 566 606,447 555,413 3,938 559,351 533,788 6,122 539,910 Mortgages 22,067,042 411,852 22,478,894 19,500,247 334,516 19,834,763 17,051,622 264,300 17,315,922 Other retail loans 8,339,628 696,284 9,035,912 10,413,029 1,183,820 11,596,849 9,494,533 748,690 10,243,223Corporate customers 40,637,082 4,121,171 44,758,253 35,925,905 2,438,163 38,364,068 33,681,272 3,331,227 37,012,499Entities outside Mauritius - 22,909,421 22,909,421 - 31,446,393 31,446,393 - 10,098,489 10,098,489
71,658,948 28,139,294 99,798,242 68,853,249 35,406,830 104,260,079 60,761,215 14,448,828 75,210,043Less allowance for credit impairment (2,264,753) (3,237,438) (5,502,191) (2,042,837) (1,378,011) (3,420,848) (2,587,329) (1,464,600) (4,051,929)
69,394,195 24,901,856 94,296,051 66,810,412 34,028,819 100,839,231 58,173,886 12,984,228 71,158,114Remaining term to maturity:Up to 3 months 8,627,231 3,099,752 11,726,983 10,159,091 3,557,296 13,716,387 8,230,905 3,522,504 11,753,409Over 3 months and up to 6 months 1,388,553 1,867,804 3,256,357 1,311,550 4,306,753 5,618,303 3,046,522 594,019 3,640,541Over 6 months and up to 12 months 7,474,055 1,401,322 8,875,377 3,843,591 7,833,648 11,677,239 3,746,182 1,339,596 5,085,778Over 1 year and up to 2 years 6,429,091 2,100,669 8,529,760 3,360,098 3,165,463 6,525,561 3,002,591 2,079,566 5,082,157Over 2 years and up to 5 years 10,887,308 6,678,139 17,565,447 14,533,348 8,119,727 22,653,075 10,332,575 3,492,747 13,825,322Over 5 years 36,852,710 12,991,608 49,844,318 35,645,571 8,423,943 44,069,514 32,402,440 3,420,396 35,822,836
71,658,948 28,139,294 99,798,242 68,853,249 35,406,830 104,260,079 60,761,215 14,448,828 75,210,043
221ANNUAL REPORT 2018
SBM BANK (MAURITIUS) LTD
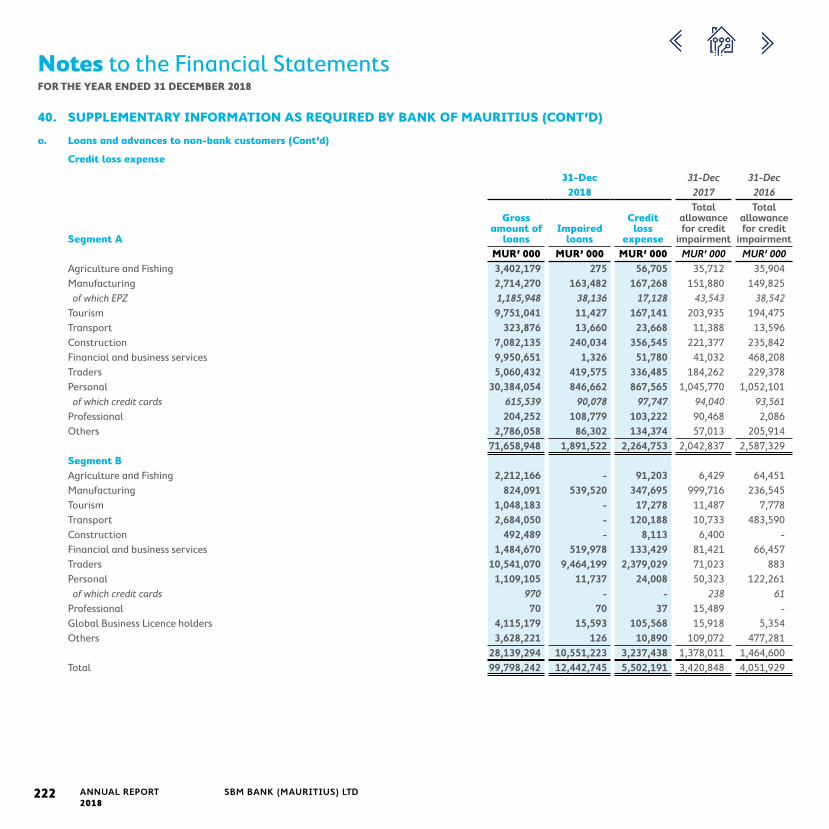
Notes to the Financial StatementsFOR THE YEAR ENDED 31 DECEMBER 2018
40. SUPPLEMENTARY INFORMATION AS REQUIRED BY BANK OF MAURITIUS (CONT’D)
o. Loans and advances to non-bank customers (Cont’d)
Credit loss expense
31-Dec 31-Dec 31-Dec2018 2017 2016
Segment A
Gross amount of
loansImpaired
loans
Credit loss
expense
Total allowance for credit
impairment
Total allowance for credit
impairmentMUR’ 000 MUR’ 000 MUR’ 000 MUR’ 000 MUR’ 000
Agriculture and Fishing 3,402,179 275 56,705 35,712 35,904Manufacturing 2,714,270 163,482 167,268 151,880 149,825 of which EPZ 1,185,948 38,136 17,128 43,543 38,542Tourism 9,751,041 11,427 167,141 203,935 194,475Transport 323,876 13,660 23,668 11,388 13,596Construction 7,082,135 240,034 356,545 221,377 235,842Financial and business services 9,950,651 1,326 51,780 41,032 468,208Traders 5,060,432 419,575 336,485 184,262 229,378Personal 30,384,054 846,662 867,565 1,045,770 1,052,101 of which credit cards 615,539 90,078 97,747 94,040 93,561Professional 204,252 108,779 103,222 90,468 2,086Others 2,786,058 86,302 134,374 57,013 205,914
71,658,948 1,891,522 2,264,753 2,042,837 2,587,329Segment BAgriculture and Fishing 2,212,166 - 91,203 6,429 64,451Manufacturing 824,091 539,520 347,695 999,716 236,545Tourism 1,048,183 - 17,278 11,487 7,778Transport 2,684,050 - 120,188 10,733 483,590Construction 492,489 - 8,113 6,400 - Financial and business services 1,484,670 519,978 133,429 81,421 66,457Traders 10,541,070 9,464,199 2,379,029 71,023 883Personal 1,109,105 11,737 24,008 50,323 122,261 of which credit cards 970 - - 238 61Professional 70 70 37 15,489 - Global Business Licence holders 4,115,179 15,593 105,568 15,918 5,354Others 3,628,221 126 10,890 109,072 477,281
28,139,294 10,551,223 3,237,438 1,378,011 1,464,600Total 99,798,242 12,442,745 5,502,191 3,420,848 4,051,929
SBM BANK (MAURITIUS) LTD222 ANNUAL REPORT 2018

Notes to the Financial StatementsFOR THE YEAR ENDED 31 DECEMBER 2018
40.SUPPLEMENTARY INFORMATION AS REQUIRED BY BANK OF MAURITIUS (CONT’D)
p. Investment securities
Remaining term to maturity
31-Dec-2018
Segment AUp to
3 months3-6
months6-9
months9-12
months1-2
years2-5
yearsOver
5 years
No specific
maturity Total31-Dec
201731-Dec
2016MUR’ 000 MUR’ 000 MUR’ 000 MUR’ 000 MUR’ 000 MUR’ 000 MUR’ 000 MUR’ 000 MUR’ 000 MUR’ 000 MUR’ 000
(a)Investment securities at amortised costGovernment bonds and treasury notes 91,369 747,861 - 777,648 1,605,600 4,766,609 3,741,584 - 11,730,671 8,292,082 14,218,481Treasury bills - 148,100 - - - - - - 148,100 4,432,043 3,242,761Bank of Mauritius bills / Bonds - 149,032 118,992 - 762,191 201,683 - - 1,231,898 3,544,186 5,342,047Corporate bonds - - - - - - - - - 2,565,077 1,394,551
91,369 1,044,993 118,992 777,648 2,367,791 4,968,292 3,741,584 - 13,110,669 18,833,388 24,197,840(b)Investment
securities mandatorily measured at FVTPLGovernment bonds - - - 1,358 - 223,934 539,826 - 765,118 970,594 - Treasury bills / notes 597,828 2,288,062 1,902,344 354,022 - - - - 5,142,256 943,822 - Bank of Mauritius bills / Bonds 1,253,365 1,110,374 35,018 742,318 663,334 - - - 3,804,409 1,947,439 -
1,851,193 3,398,436 1,937,362 1,097,698 663,334 223,934 539,826 - 9,711,783 3,861,855 - (c) Investment
securities measured at FVTOCIGovernment bonds 46,567 19,904 - 581,826 919,904 3,355,051 2,385,724 - 7,308,976 3,110,233 - Treasury bills / notes 7,353,679 1,923,173 - 388 - - - - 9,277,240 393,334 - Bank of Mauritius bills / Bonds 322,627 - - - 1,241,916 576,906 - - 2,141,449 1,025,409 - Corporate bonds - - - - - 1,395,858 1,345,585 - 2,741,443 - -
7,722,873 1,943,077 - 582,214 2,161,820 5,327,815 3,731,309 - 21,469,108 4,528,976 - Total Segment A 9,665,435 6,386,506 2,056,354 2,457,560 5,192,945 10,520,041 8,012,719 - 44,291,560 27,224,219 24,197,840
223ANNUAL REPORT 2018
SBM BANK (MAURITIUS) LTD

Notes to the Financial StatementsFOR THE YEAR ENDED 31 DECEMBER 2018
40.SUPPLEMENTARY INFORMATION AS REQUIRED BY BANK OF MAURITIUS (CONT’D)
p. Investment securities (cont’d)
Remaining term to maturity (cont’d)
31-Dec-2018
Segment BUp to
3 months3-6
months6-9
months9-12
months1-2
years2-5
yearsOver
5 years
No specific
maturity Total31-Dec
201731-Dec
2016MUR’ 000 MUR’ 000 MUR’ 000 MUR’ 000 MUR’ 000 MUR’ 000 MUR’ 000 MUR’ 000 MUR’ 000 MUR’ 000 MUR’ 000
(a)Investment securities at amortised costBank Bonds - - - - - 695,818 - - 695,818 - - Corporate bonds - - - - - - - - - 372,824 -
- - - - - 695,818 - - 695,818 372,824 - (b)Investment
securities mandatorily measured at FVTPLGovernment bonds and treasury notes - - - - - - - - - 1,650,227 - Corporate bonds - - - - - - - - - 1,164,407 -
- - - - - - - - - 2,814,634 - (c) Investment
securities measured at FVTOCIGovernment bonds - - - - - - - - - 328,796 970,159Treasury bills / notes - - - - - - - - - 1,197,164 178,414Equity shares of companies:- Other equity investments - - - - - - - 3,411 3,411 370 4,058Bank bonds - - - - 3,218,567 2,262,234 294,797 - 5,775,598 533,427 6,808,465Corporate Bonds - - - - - - - - - 4,228,507 2,071,193Corporate paper and preference shares - - - - - - - - - 451,160 184,903Other investment securities - - - - - - 171,333 - 171,333 - -
- - - - 3,218,567 2,262,234 466,130 3,411 5,950,342 6,739,424 10,217,192Total Segment B - - - - 3,218,567 2,958,052 466,130 3,411 6,646,160 9,926,882 10,217,192Total investment securities 9,665,435 6,386,506 2,056,354 2,457,560 8,411,512 13,478,093 8,478,849 3,411 50,937,720 37,151,101 34,415,032
Analysed into:31-Dec
201831-Dec
201731-Dec
2016Investment securities: MUR’ 000 MUR’ 000 MUR’ 000- Segment A 44,291,560 27,224,219 24,197,840- Segment B 6,642,749 9,926,512 10,213,134
50,934,309 37,150,731 34,410,974Equity investments:- Segment B 3,411 370 4,058Total 50,937,720 37,151,101 34,415,032
SBM BANK (MAURITIUS) LTD224 ANNUAL REPORT 2018
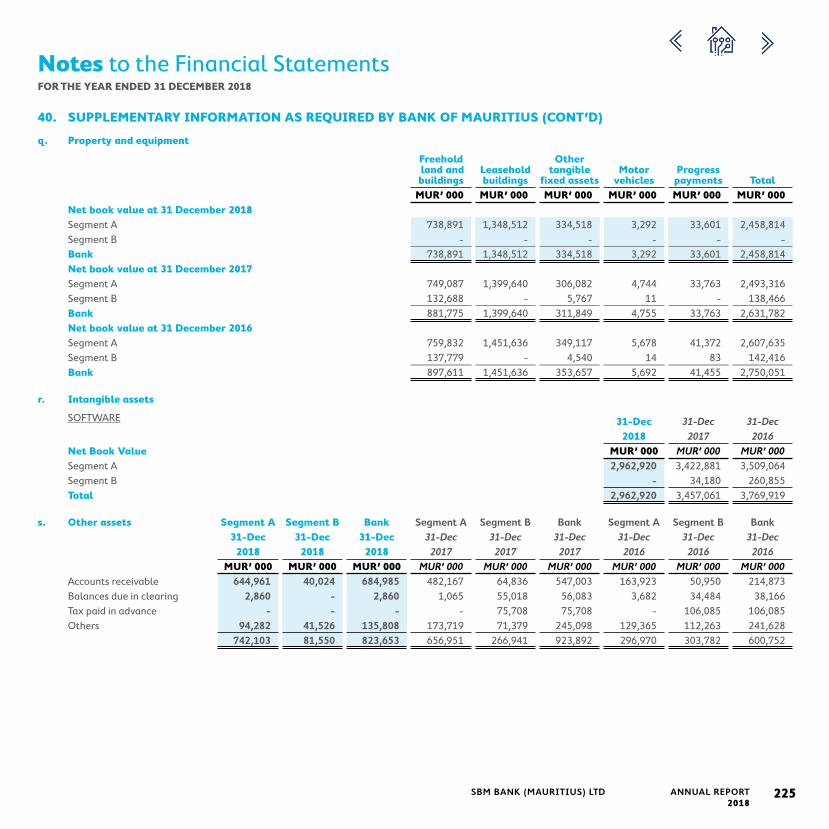
Notes to the Financial StatementsFOR THE YEAR ENDED 31 DECEMBER 2018
40. SUPPLEMENTARY INFORMATION AS REQUIRED BY BANK OF MAURITIUS (CONT’D)
q. Property and equipment
Freehold land and buildings
Leasehold buildings
Other tangible
fixed assetsMotor
vehiclesProgress payments Total
MUR’ 000 MUR’ 000 MUR’ 000 MUR’ 000 MUR’ 000 MUR’ 000Net book value at 31 December 2018Segment A 738,891 1,348,512 334,518 3,292 33,601 2,458,814Segment B - - - - - - Bank 738,891 1,348,512 334,518 3,292 33,601 2,458,814Net book value at 31 December 2017Segment A 749,087 1,399,640 306,082 4,744 33,763 2,493,316Segment B 132,688 - 5,767 11 - 138,466Bank 881,775 1,399,640 311,849 4,755 33,763 2,631,782Net book value at 31 December 2016Segment A 759,832 1,451,636 349,117 5,678 41,372 2,607,635Segment B 137,779 - 4,540 14 83 142,416Bank 897,611 1,451,636 353,657 5,692 41,455 2,750,051
r. Intangible assets
SOFTWARE 31-Dec 31-Dec 31-Dec2018 2017 2016
Net Book Value MUR’ 000 MUR’ 000 MUR’ 000Segment A 2,962,920 3,422,881 3,509,064Segment B - 34,180 260,855Total 2,962,920 3,457,061 3,769,919
s. Other assets Segment A Segment B Bank Segment A Segment B Bank Segment A Segment B Bank31-Dec 31-Dec 31-Dec 31-Dec 31-Dec 31-Dec 31-Dec 31-Dec 31-Dec
2018 2018 2018 2017 2017 2017 2016 2016 2016MUR’ 000 MUR’ 000 MUR’ 000 MUR’ 000 MUR’ 000 MUR’ 000 MUR’ 000 MUR’ 000 MUR’ 000
Accounts receivable 644,961 40,024 684,985 482,167 64,836 547,003 163,923 50,950 214,873Balances due in clearing 2,860 - 2,860 1,065 55,018 56,083 3,682 34,484 38,166Tax paid in advance - - - - 75,708 75,708 - 106,085 106,085Others 94,282 41,526 135,808 173,719 71,379 245,098 129,365 112,263 241,628
742,103 81,550 823,653 656,951 266,941 923,892 296,970 303,782 600,752
225ANNUAL REPORT 2018
SBM BANK (MAURITIUS) LTD

Notes to the Financial StatementsFOR THE YEAR ENDED 31 DECEMBER 2018
40.SUPPLEMENTARY INFORMATION AS REQUIRED BY BANK OF MAURITIUS (CONT’D)
t. Deposits from banks Segment A Segment B Bank Segment A Segment B Bank Segment A Segment B Bank31-Dec 31-Dec 31-Dec 31-Dec 31-Dec 31-Dec 31-Dec 31-Dec 31-Dec
2018 2018 2018 2017 2017 2017 2016 2016 2016MUR’ 000 MUR’ 000 MUR’ 000 MUR’ 000 MUR’ 000 MUR’ 000 MUR’ 000 MUR’ 000 MUR’ 000
Demand deposits 342,285 453,832 796,117 372,709 367,217 739,926 1,948,906 762,458 2,711,364
u. Deposits from non-bank customers(i) Retail customers
Current accounts 11,620,760 2,953,875 14,574,635 13,038,356 3,378,446 16,416,802 9,357,769 1,094,407 10,452,176 Savings accounts 49,851,784 1,396,034 51,247,818 49,133,607 1,594,913 50,728,520 41,407,303 1,450,970 42,858,273 Time deposits with remaining term to maturity: Up to 3 months 1,079,541 486,068 1,565,609 977,521 690,133 1,667,654 887,190 452,723 1,339,913 Over 3 months and up to 6 months 751,554 1,459,951 2,211,505 779,619 1,505,432 2,285,051 623,638 146,558 770,196 Over 6 months and up to 12 months 1,425,996 2,343,385 3,769,381 1,441,907 4,595,859 6,037,766 1,261,826 1,190,684 2,452,510 Over 1 year and up to 5 years 1,934,447 293,286 2,227,733 2,720,835 503,083 3,223,918 2,465,706 1,951,204 4,416,910 Over 5 years - - - 2,752 74 2,826 3,100 1,428 4,528 Total time deposits 5,191,538 4,582,690 9,774,228 5,922,634 7,294,581 13,217,215 5,241,460 3,742,597 8,984,057
66,664,082 8,932,599 75,596,681 68,094,597 12,267,940 80,362,537 56,006,532 6,287,974 62,294,506(ii) Corporate customers
Current accounts 14,597,888 29,262,901 43,860,789 13,802,626 19,450,067 33,252,693 11,845,761 16,225,840 28,071,601 Savings accounts 3,479,182 143 3,479,325 4,276,387 11,385 4,287,772 6,204,319 287,742 6,492,061 Time deposits with remaining term to maturity: Up to 3 months 2,373,111 7,143,294 9,516,405 3,396,254 8,657,480 12,053,734 1,134,215 1,275,855 2,410,070 Over 3 months and up to 6 months 936,447 851,707 1,788,154 563,132 1,429,901 1,993,033 1,195,373 846,160 2,041,533 Over 6 months and up to 12 months 551,344 406,692 958,036 663,607 864,169 1,527,776 353,922 1,581,645 1,935,567 Over 1 year and up to 5 years 260,737 135,762 396,499 322,274 566,861 889,135 681,619 400,172 1,081,791 Over 5 years - - - - - - 359 - 359 Total time deposits 4,121,639 8,537,455 12,659,094 4,945,267 11,518,411 16,463,678 3,365,488 4,103,832 7,469,320
22,198,709 37,800,499 59,999,208 23,024,280 30,979,863 54,004,143 21,415,568 20,617,414 42,032,982(iii) Government
Current accounts 6,098,267 - 6,098,267 3,027,269 - 3,027,269 1,895,307 - 1,895,307 Savings accounts 3,521,548 - 3,521,548 2,908,506 - 2,908,506 2,078,167 - 2,078,167 Time deposits with remaining term to maturity: Up to 3 months 1,620,343 - 1,620,343 22,397 - 22,397 - - - Over 3 months and up to 6 months 619,611 - 619,611 1,357,224 - 1,357,224 400 - 400 Over 6 months and up to 12 months 69,396 - 69,396 12,961 - 12,961 925 - 925 Over 1 year and up to 5 years 5,786 - 5,786 732 - 732 100 - 100 Total time deposits 2,315,136 - 2,315,136 1,393,314 - 1,393,314 1,425 - 1,425
11,934,951 - 11,934,951 7,329,089 - 7,329,089 3,974,899 - 3,974,899100,797,742 46,733,098 147,530,840 98,447,966 43,247,803 141,695,769 81,396,999 26,905,388 108,302,387
SBM BANK (MAURITIUS) LTD226 ANNUAL REPORT 2018

Notes to the Financial StatementsFOR THE YEAR ENDED 31 DECEMBER 2018
40. SUPPLEMENTARY INFORMATION AS REQUIRED BY BANK OF MAURITIUS (CONT’D)
v. Other borrowed funds Segment A Segment B Bank Segment A Segment B Bank Segment A Segment B Bank31-Dec 31-Dec 31-Dec 31-Dec 31-Dec 31-Dec 31-Dec 31-Dec 31-Dec
2018 2018 2018 2017 2017 2017 2016 2016 2016MUR’ 000 MUR’ 000 MUR’ 000 MUR’ 000 MUR’ 000 MUR’ 000 MUR’ 000 MUR’ 000 MUR’ 000
Borrowings from central banks - for refinancing 50,998 - 50,998 104,190 - 104,190 147,921 - 147,921Other financial institutions for refinancing - 3,869,634 3,869,634 159,554 4,387,286 4,546,840 - 687,074 687,074Borrowings from banks in Mauritius 2,450,659 - 2,450,659 4,198,169 - 4,198,169 1,537,781 - 1,537,781 abroad - 5,402,647 5,402,647 - 4,267,394 4,267,394 - 2,167,733 2,167,733
2,501,657 9,272,281 11,773,938 4,461,913 8,654,680 13,116,593 1,685,702 2,854,807 4,540,509w. Other liabilities
Balance due in clearing 3 2,908,529 2,908,532 2,110 2,044,141 2,046,251 1,587 583,598 585,185Bills payable 173,640 40,847 214,487 153,727 18,242 171,969 107,916 22,548 130,464Accruals for expenses 94,110 - 94,110 333,015 19,165 352,180 321,264 10,476 331,740Accounts payable 458,144 1,473 459,617 496,527 232,446 728,973 658,896 179,029 837,925Deferred income 200,520 90,722 291,242 205,816 117,060 322,876 193,587 74,533 268,120Balances in transit 772,867 - 772,867 413,460 - 413,460 25 27 52Pension liability 109,621 - 109,621 91,781 - 91,781 67,764 - 67,764Others 17,783 41,970 59,753 35,717 - 35,717 19,346 - 19,346Expected credit loss expense on memorandum items 110,406 - 110,406 - - - - - -
1,937,094 3,083,541 5,020,635 1,732,153 2,431,054 4,163,207 1,370,385 870,211 2,240,596x. Memorandum items a Acceptances, guarantees, letters
of credit, endorsements and other obligations on account of customersAcceptances on account of customers - 199,670 199,670 184,494 584,333 768,827 138,697 - 138,697Guarantees on account of customers 6,768,366 826,076 7,594,442 6,421,528 1,021,598 7,443,126 3,794,867 803,400 4,598,267Letters of credit and other obligations on account of customers 496,473 16,883 513,356 846,547 1,128,720 1,975,267 471,096 724,242 1,195,338Other contingent items - - - - - - - - -
7,264,839 1,042,629 8,307,468 7,452,569 2,734,651 10,187,220 4,404,660 1,527,642 5,932,302b Commitments
Undrawn credit facilities 8,516,608 554,688 9,071,296 8,171,121 6,067,712 14,238,833 6,354,415 432,710 6,787,1258,516,608 554,688 9,071,296 8,171,121 6,067,712 14,238,833 6,354,415 432,710 6,787,125
227ANNUAL REPORT 2018
SBM BANK (MAURITIUS) LTD

ABBREVIATIONS
AFS - Available-For-Sale
ALCO - Asset and Liability Management Committee
AML - Anti Money Laundering
ARA -Average Retirement Age
ATM - Automatic Teller Machine
AUM - Assets Under Management
BOM - Bank of Mauritius
CAR - Capital Adequacy Ratio
CCB - Capital Conservation Buffer
CCR - Counterparty Credit Risk
CDS - Credit Default Swap
CEO - Chief Executive Officer
CET1 - Common Equity Tier 1
CI - Cost to Income
CSR - Corporate Social Responsibility
CASA - Current Account and Savings Account
DRs - Depositary Receipts
ECL - Expected Credit Losses
EIR - Effective Interest Rate
EY - Ernst & Young
FCY - Foreign Currency
FVTPL - Fair-value-through-profit-or-loss
FY - Financial Year
GBP - Great British Pound
HQLA - High Quality Liquid Asset
HRD - Human Resource Division
HTM - Held To Maturity
IAS - International Accounting Standards
IASB - International Accounting Standards Board
IFRIC - International Financial Reporting Interpretations Committee
IFRS - International Financial Reporting Standards
INR - Indian Rupee
IRS - Interest Rate Swap
IT - Information Technology
LCR - Liquidity Coverage Ratio
MUR - Mauritian Rupee
NII - Net Interest Income
OCI - Other Comprehensive Income
PAT - Profit After Tax
RAROC - Risk Adjusted Return on Capital
RFP - Request for Proposal
ROA - Return on Average Assets
RWA - Risk Weighted Assets
RWE - Risk Weighted Exposure
SBMBM - SBM Bank (Mauritius) Ltd
SPPI - Sole Payment of Principal and Interest
SPV - Special Purpose Vehicle
USD - United States Dollar
VAR - Value-at-Risk
VIU - Value-In-Use
WACC - Weighted Average Cost of Capital
WIP - Work In Progress
WOS - Wholly Owned Subsidiary
XBRL - eXtensible Business Reporting Language
228 ANNUAL REPORT 2018
SBM BANK (MAURITIUS) LTD

SBM Bank (Mauritius) Ltd SBM Tower, 1, Queen Elizabeth II Avenue, Port Louis, Republic of Mauritius
T : (230) 202 1111F : (230) 202 1234E : [email protected]
www.sbmgroup.mu