smart survey final report east pokot sub county …
TRANSCRIPT

SMART SURVEY FINAL REPORT
EAST POKOT SUB COUNTY
BARINGO COUNTY
JULY, 2016

ACKNOWLEDGEMENT
This survey has been carried out with the participation of many partners at different levels who are
highly acknowledged in particular, WV Hong Kong and UNICEF for funding the survey.
Special thanks to officers from Department of Health, Baringo County Government, National Drought
Management Authority (NDMA), UNICEF – Kenya and World Vision Kenya for their implementation
role, for the active participation and the supervision roles they played during the survey.
At the community level, special gratitude is due to the households which participated in the survey. The
local administrators are also acknowledged for their role in mobilizing the community and acting as
guides to the enumerators during the exercise.
The survey teams are also appreciated for the good work of collecting high quality data.
Contents ACKNOWLEDGEMENT ................................................................................................................................... 2
Contents ........................................................................................................................................................ 3
List of Figures ................................................................................................................................................ 5
List of Tables ................................................................................................................................................. 5
ACCROYNM AND ABBREVIATIONS ................................................................................................................ 6
EXECUTIVE SUMMARY .................................................................................................................................. 7
CHAPTER ONE ............................................................................................................................................. 10
1.0 INTRODUCTION ..................................................................................................................................... 10
1.1 BACKGROUND INFORMATION .......................................................................................................... 10
1.1.1 Justification ................................................................................................................................................. 11 1.2 Survey Objectives .............................................................................................................................. 11
1.2.1 General Objective ....................................................................................................................................... 11 1.2.2 The specific objectives: .............................................................................................................................. 11
1.3 Timing of the Survey ......................................................................................................................... 12
CHAPTER TWO ............................................................................................................................................ 13
2.0 SURVEY METHODOLOGY ....................................................................................................................... 13
2.1 Geographic Target Area and Population Group ............................................................................... 13
2.2 Survey Design .................................................................................................................................... 13
2.3 Study Population ............................................................................................................................... 13
2.4 Anthropometric Sample Size ............................................................................................................ 13
2.5 Cluster and Household Selection ...................................................................................................... 14
2.6 Variables Collected............................................................................................................................ 14
2.7 Organization of the Survey ............................................................................................................... 15
2.8 Case Definition .................................................................................................................................. 16
2.81 Malnutrition by Z-Score: WHO (2006) Standard. ....................................................................................... 16 2.8.2Malnutrition by MUAC ............................................................................................................................... 16
2.9. Questionnaire .................................................................................................................................. 16
2.10 Data uploading, Analysis and Report Writing ................................................................................. 16
CHAPTER THREE .......................................................................................................................................... 17
3.0 SURVEY RESULTS AND DISCUSSION ...................................................................................................... 17
3.1 House hold demographics ................................................................................................................ 17
3.2 Residency and marital Status of the Respondents: .......................................................................... 17
3.3 Education Level of the respondents ................................................................................................. 17
3.4 Nutritional Status of Under-Five Children ........................................................................................ 17
3.4.1 Age distribution and anthropometric data quality check ............................................................................ 17

3.4.2 Prevalence of acute malnutrition (weight-for-height z-score –WHO Standards 2006) .............................. 18 3.4.3 Prevalence of Acute malnutrition by sex .................................................................................................... 19 3.4.4 Prevalence of acute malnutrition by age ..................................................................................................... 19 3.4.5 Distribution of acute malnutrition and oedema based on weight-for-height z-scores ................................. 20 3.4.6 Prevalence of acute malnutrition based on MUAC cut off's (and/or oedema) and by sex. ......................... 20 3.4.7 Prevalence of acute malnutrition by age, based on MUAC cut off's and/or oedema .................................. 21 3.4.8 Prevalence of underweight based on weight-for-age z-scores by sex ......................................................... 21 3.4.9 Prevalence of underweight by age, based on weight-for-age z-scores........................................................ 22 3.4.10 Prevalence of stunting based on height-for-age z-scores and by sex ........................................................ 22 3.4.11 Prevalence of stunting by age based on height-for-age z-scores .............................................................. 23 3.4.12 Prevalence of overweight based on weight for height cut offs and by sex (no oedema) .......................... 23
3.5 MATERNAL NUTRITION STATUS ........................................................................................................ 24
3.6 ACCESS AND UTILIZATION OF HEALTH AND NUTRITION SERVICES .................................................. 25
3.6.1 Immunization Coverage .............................................................................................................................. 25 3.6.2 Vitamin A, Zinc supplementation and Deworming. ................................................................................... 25 3.6.3 Child Morbidity and Health Seeking Behavior........................................................................................... 26 3.6.4 Health seeking behaviors ............................................................................................................................ 27
3.7 Household Water Access, Hygiene and Sanitation ........................................................................... 27
3.7.1 Main source of drinking water for the residents ......................................................................................... 27 3.7.2 Methods of Treating and Storing Drinking Water ...................................................................................... 28 3.7.3 Distance To/ from Water Source ................................................................................................................ 28 3.7.4 Hygiene and Sanitation ............................................................................................................................... 29
3.8 Household Dietary Diversity and Food Consumption Score ............................................................. 30
3.8.1 Household Dietary Diversity ...................................................................................................................... 30 3.8.2 Household Dietary Diversity Score based on 24 hours recall ..................................................................... 30 3.8.3 Women Minimum Dietary Diversity .......................................................................................................... 31 3.8.4 Women Minimum Dietary Diversity .......................................................................................................... 31 3.8.5 FCS- Nutrition ............................................................................................................................................ 31 3.8.6 Food Consumption Score and Coping Strategy Index. ............................................................................... 32
CHAPTER FOUR ........................................................................................................................................... 34
CONCLUSION AND RECOMMENDATIONS ................................................................................................... 34

List of Figures Figure 1: Map of East Pokot Sub County with Livelihood zones ............................................................... 11
Figure 2: Shows the trend of Malnutrition from 2014 to 2016 .................................................................. 19
Figure 3: Physiological status of the mother .............................................................................................. 24
Figure 4: Immunization coverage ............................................................................................................... 25
Figure 5: Vitamin A supplementation coverage ......................................................................................... 26
Figure 6: Health seeking behaviors ............................................................................................................. 27
Figure 7: Main water sources...................................................................................................................... 28
Figure 8: Trekking distance to water sources ............................................................................................. 28
Figure 9: Food groups consumed by households ....................................................................................... 30
Figure 10: Food groups by women ............................................................................................................. 31
Figure 11: FCS-Nutrition .............................................................................................................................. 31
List of Tables Table 1: Summary of Survey Findings ........................................................................................................... 8
Table 2: Anthropometric Sample Size calculation and rational for the East Pokot County survey ............ 13
Table 3: Education levels of the respondents ............................................................................................. 17
Table 4: Distribution of sex and age of sample ........................................................................................... 17
Table 5: Overall prevalence of GAM compared to previous year’s survey findings. .................................. 18
Table 6: Prevalence of acute malnutrition based on weight-for-height z-scores (and/or oedema) and by
sex ............................................................................................................................................................... 19
Table 7: Prevalence of acute malnutrition by age, based on weight-for-height z-scores and/or oedema 20
Table 8: Distribution of acute malnutrition and oedema based on weight-for-height z-scores ................ 20
Table 9: Prevalence of acute malnutrition based on MUAC cut off's (and/or oedema) and by sex .......... 21
Table 10: Prevalence of acute malnutrition by age, based on MUAC cut off's and/or oedema ................ 21
Table 11: Prevalence of underweight based on weight-for-age z-scores by sex ........................................ 22
Table 12: Prevalence of underweight by age, based on weight-for-age z-scores ...................................... 22
Table 13: Prevalence of stunting based on height-for-age z-scores and by sex ......................................... 23
Table 14: Prevalence of stunting by age based on height-for-age z-scores ............................................... 23
Table 15: Prevalence of Malnutrition of mothers by MUAC ...................................................................... 24
Table 16: Iron Folate intake by pregnant mothers ..................................................................................... 24
Table 17: Child Morbidity rates................................................................................................................... 26
Table 18: Hand washing practices .............................................................................................................. 29
Table 19: Household Dietary Diversity Score based on 24 hours recall ..................................................... 30
Table 20: Food Consumption Score and Coping Strategy Index. ................................................................ 32
Table 21: Coping strategy Index .................................................................................................................. 33
Table 22: Recommendations from Aug. 2015 survey and progress of implementation ............................ 34
Table 23: July 2016 Smart Survey Recommendation And Implementation Timeline ................................ 35

ACCROYNM AND ABBREVIATIONS
BPHS: Basic Package of Health Services
CI: Confidence Interval
CNO: County Nutrition Officer
CSI: Coping Strategy Index
DEFF: Design Effect
ENA: Emergency Nutrition Assessment
FGD: Focus Group Discussion
GAM: Global Acute Malnutrition
HAZ: Weight-for-Age Z score
HH: Household
HiNi: High Impact Nutrition Intervention
KII: Key Informant Interview
MAM: Moderate Acute Malnutrition
MoH: Ministry of Health
MUAC: Mid Upper Arm Circumference
NDMA: National Draught Management Authority
NGO: Non-Governmental Organization
NSO: Nutrition Support Officer
PPS: Probability Proportional to Population Size
SAM: Severe Acute Malnutrition
SCHMT: Sub-County Health Management Team
SMART: Standardized Monitoring and Assessment in Relief and Transition
UN: United Nations
UNICEF: United Nation Children Fund
WHO: World Health Organization
WAZ: Weight-for-Age Z score
WASH: Water, Sanitation and Hygiene
WFA: Weight-for-Age
WHZ: Weight-for-Height Z score

EXECUTIVE SUMMARY
East Pokot is one of the six Sub-Counties (Baringo South (Marigat), Mogotio, Koibatek, Baringo
North and Baringo Central) in Baringo County. It borders Turkana East to the North,
Marakwet to the West, Laikipia and Samburu Districts to the East, and Marigat to the South.
It has an average area of 4524.8 square kilometres with estimated population of 159,404 people
and about 28,693 children under five years (projection from 2009 population census).
The area has two livelihood zones, Pastoral (Kolowa, Tangulbei, Akoret, Mondi, Ngoron,
Nginyang divisions) and Agro-Pastoral (Churo division)
Over the years, East Pokot experiences poor health and nutrition outcomes which are mainly
related to house hold food insecurity as a result of recurrent drought. This survey was done as
part of surveillance in order to establish the current nutrition status in East Pokot. The results
were also meant to feed in to the Long Rain Assessment report conducted by Kenya Food
Security Steering Group.
The general objective of the survey was to determine the prevalence of malnutrition among the
children aged 6- 59 months old, pregnant and lactating mothers in East Pokot Sub County with
the following specific objectives:
To estimate the current prevalence of acute malnutrition in children aged 6 – 59 months
To compare the overall nutritional changes with the previous GAM and SAM
To determine the morbidity rates amongst children aged 0‐59 months over a two week
recall period
To estimate the coverage of Measles, BCG vaccination and deworming for children 9-59
months, 6-59 months and 12-59 months respectively
To determine the coverage for zinc supplementation and vitamin A supplementation
among the children 6-59 months
To estimate the nutritional status of female caregivers aged 15-49 years using MUAC
measurements
To assess household food security and livelihoods
To assess water sanitation and hygiene practices
The survey applied a two stage stratified cluster sampling using the SMART methodology with
the clusters being selected using the probability proportional to population size (PPS). Stage one
sampling involved the sampling of the clusters which were included in the survey while the
second stage sampling involved the selection of the households from the sampled clusters. The
total sample size was 491 children aged between 6 and 59 months from 521 households. Data
was collected by 10 Teams. The data collection team was given a four days training in Marigat
Town and facilitated by Ministry of Health, World Vision and UNICEF as part of County
Nutrition Information Working Group. The training included the review of the survey tools,
survey methodology and using anthropometric measurements. In addition, a standardization

test was done on the third day of the training while also a pilot survey was conducted on the
fourth day of the survey. As the data was being collected using Open Data Kit (ODK) platform,
a module on use of mobile phone in data collection was included in the training agenda. The
data collected during the survey included: anthropometry, morbidity, vaccination and de-
worming status, Vitamin A supplementation, hygiene and sanitation practices, other indicators
assessed were household food security and livelihood. The standard data collection tool
recommended by the National Nutrition Information Working Group was used.
All 35 sampled clusters were visited. In total 516 households were visited out of which 664
children aged 6 to 59 months and 319 women of reproductive age were reached.
Anthropometric data was analyzed using the ENA for SMART 2011 software version July, 9th
2015 while other indicators were analyzed using Microsoft excel and SPSS Version 20.0
Table 1: Summary of Survey Findings
Indicators Coverage
HHs covered 516
Children assessed 664
Global Acute Malnutrition (<-2 Z-score) (149) 23.0 % (18.6 - 28.0 95% C.I.)
Severe Acute malnutrition (<-3 Z-score) (23) 3.5 % (2.2 - 5.7 95% C.I.)
Prevalence of Global Underweight (<-2 Z-score) (254) 38.8 % (33.9 - 43.9 95% C.I.)
Prevalence of Global Stunting (<-2 Z-score) (228) 36.5 % (32.0 - 41.2 95% C.I.)
Measles Coverage at 9 Months 71.4%
Measles Coverage at 18 Months 32.1%
BCG by scar 89.9%
OPV 1 91.1%
OPV 3 80.8%
Zinc Supplementation 11%
Vitamin A (6 – 11 months- once) 22.6%
Vitamin A (12 – 59 months) –more than twice 30.7%
Vitamin A (12 – 59 months- once) 13.3%
Deworming (12-59 months) 14.9%
Sickness two weeks prior to survey 59%
Acute Respiratory Infection 73.0%
Fever 53.6%
Watery diarrhoea 40.8%
Bloody diarrhoea 35.5%
Seek assistance 42.8%
Maternal MUAC <21cm 9.7%
Maternal MUAC <21cm for PLW 9.4%
Iron Folate Supplementation < 90 days 50.2%
Iron Folate Supplementation 90 days and above 8.3%
Food Consumption Score (FCS)

Poor FCS 2.71%
Border FCS 9.88%
Good FCS 87.4%
House hold consuming >4 food groups 63.2%
Minimum Women’s Dietary Diversity 22.5%
CSI 27.59%
Water sources
Protected source(safe sources) 5.4%
Unprotected source(unsafe sources) 94.6%
Water treatment 2.9%
Hand washing at 4 critical times 2%
Hand washing at 3 critical times 8%
Methods of relieving
Open defecation 96%
Own latrine 3%
The survey results show that the nutrition situation in East Pokot has deteriorated though not
significantly compared to 2015 SMART survey results. The probable causes of malnutrition
include; poor infant and young child care practices, poor household dietary diversity, and
morbidity as well as poor water sanitation and hygiene practices including open defecation.
From the survey results a number of recommendations were done which include: Carrying out
mass screening and scaling up of IMAM and outreach services, Implement surge model in every
health facilities, Integrate Vitamin A supplementation and Deworming to ECDs, Train CHVs on
nutrition technical module and implement the existing SBCC Strategy.

CHAPTER ONE
1.0 INTRODUCTION
1.1 BACKGROUND INFORMATION
East Pokot is one of the 6 sub counties of Baringo County and it borders Turkana East to the
North, Marakwet and Baringo North to the West, Laikipia and Samburu county to the East, and
Marigat to the South. It has an average area of 4524.8Km and is sub-divided into seven (7)
administrative divisions with an official estimated population of around 159,404 people which is
a projection from 2009 population census. The area has two livelihood zones, Pastoral
(Kolowa, Tangulbei, Akoret, Mondi, Ngoron, Nginyang divisions) and Agro-Pastoral (Churo
division).
The sub county experiences poor health and nutrition outcomes which are mainly attributed to
poor access to critical health services. Additionally, other major factors contributing to high
malnutrition rates include chronic and acute food insecurity due to poor rainfall, low purchasing
power due to eroded capacity as a result of seasons of successive droughts, suboptimal child
care and feeding practices and poor hygiene and sanitation practices and retrogressive cultural
beliefs.
To try to improve the health and nutrition status in the county, various partners have been
working with the Ministry of Health in the implementation and up scaling the High Impact
Nutrition Intervention (HiNi) in the County. For instance World Vision has been supporting
the Ministry of Health (MoH) in the implementation of the HiNi services in Baringo County.
Other partners supporting other nutrition interventions include Maternal and Child Survival
Project (MCSP) and Kenya Red Cross during response. World Vision is also supporting Food
for asset (FFA) projects in the area.

Figure 1: Map of East Pokot Sub County with Livelihood zones
1.1.1 Justification
The results of 2015 showed a critical GAM level of 18.8 %( 15.3 to 22.9% 95% CI).There has
been several aggravating factors like conflict and floods in the sub county. The sub county has
been ranked as the second poorest in rains performance in the last two rains assessments by
KFSSG.
1.2 Survey Objectives
1.2.1 General Objective
The overall objective: To determine the prevalence of malnutrition among the children aged
6- 59 months old, pregnant and lactating mothers.
1.2.2 The specific objectives:
To determine the prevalence of acute malnutrition among children aged 6-59 months.
Estimate prevalence of maternal malnutrition using MUAC measurements
To determine the immunization coverage for measles, BCG, Oral Polio Vaccines (OPV 1
and 3) and vitamin A supplementation in children aged 6-59 months
To determine de-worming coverage for children aged 12 to 59 months

To estimate the use of zinc in diarrheal treatment in children;
To determine the morbidity rates amongst children U5 years over a two week recall
period.
To collect information on possible underlying causes of malnutrition such as household
food security, water, sanitation, and hygiene practices.
1.3 Timing of the Survey The survey was undertaken during a dry spell as from 4th to 13th July 2016. Training and piloting
of the survey materials and standardization test was conducted from 4th to 8th July 2016 and
thereafter data collection for five days from 9th to 13th 2016.

CHAPTER TWO
2.0 SURVEY METHODOLOGY
2.1 Geographic Target Area and Population Group The survey was conducted in Baringo County, East Pokot Sub County. The primary respondent
for the survey was the mother/care taker of the child for both household and child
questionnaire.
Data was collected on the following variables; anthropometry, morbidity, vaccination and de-
worming status, Vitamin A supplementation, hygiene, sanitation practices, household food
security and livelihood. In addition, the nutritional status of children aged 6 – 59 months and
women aged 15 – 49 years were also determined.
2.2 Survey Design The survey applied a two stage cluster sampling with the clusters were selected using the
probability proportional to population size (PPS).The villages constituted the sampling frame.
2.3 Study Population The target population for the survey was children aged 6 – 59 months for the anthropometric
measurements and women of reproductive age between 15 – 49 years for the maternal health
component.
2.4 Anthropometric Sample Size The anthropometric survey sample size was calculated using the SMART survey calculator. The
parameters of interest were captured in the ENA July 9th 2015 software and the respective
number of children and households required for the survey computed. The sampling frame for
this survey was the updated list of villages (with current projected population) from the survey
area.
Table 2: Anthropometric Sample Size calculation and rational for the East Pokot County survey
Data entered on ENA
software
Anthropometric
Survey
Rationale
Estimated prevalence of
GAM
15.3% Due to improving situation based on NDMA
monthly bulletins (May 2016).
SMART survey 2015 GAM: 18.8 % (15.3 – 22.9
95% C.I.)
±Desired precision 4% Based on nutrition survey guidelines
Design effect 1.45 Based on the previous 2015 survey to cater for
heterogeneity.
Average household size 6 2015 SMART survey
Percent of <5 18% 2015 SMART survey
Percent of non- 3% Due to the frequent movements in most parts

respondent of the county hence non-response anticipated
Households to be
included
521 As calculated using the ENA for SMART
software
Children to be
included
491 As calculated using the ENA for SMART
software
2.5 Cluster and Household Selection All accessible villages were included in the initial sample selection with each village considered a
cluster which was sampled with probability proportional to size. At stage two each team used
the simple random sampling method in household selection. Within the selected households all
children 6-59 months fitting the inclusion criteria were measured.
A household was defined as a group of people who lived together and shared a common
cooking pot. In polygamous families with several structures within the same compound but with
different wives having their own cooking pots, the structures were considered as separate
households and assessed separately.
In cases where there was no eligible child, a household was still considered part of the sample.
If a respondent was absent during the time of household visit, the teams left a message and re-
visited later to collect data for the missing person, with no substitution of households allowed.
2.6 Variables Collected Age: the age of the child was recorded based on a combination of child health cards, the
mothers’/caretakers’ knowledge of the birth date and use of a calendar of events for the district
developed in collaboration with the survey team.
Sex: it was recorded whether a child was male or female.
Bilateral Oedema: normal thumb pressure was applied on the top part of both feet for 3
seconds. If pitting occurred on both feet upon release of the fingers, nutritional oedema was
indicated.
Weight: the weights of children were taken with minimal or light clothing on, using Bathroom
scale (SECA digital model with a threshold of 150kgs and recorded to the nearest 0.1kg.
Length/Height: children were measured bareheaded and barefooted using wooden UNICEF
height boards with a precision of 0.1cm. Children under the age of two years were measured
while lying down (length) and those over two years while standing upright (height). If child age
could not be accurately determined, proxy heights were used to determine cases where height
would be taken in a supine position (<87cm) or in an upright position (≥87cm).
Mid Upper Arm Circumference (MUAC): the MUAC of children were taken at the
midpoint of the upper left arm using a MUAC tape and recorded to the nearest 0.1cm.
Retrospective Morbidity of Children: A 2-week morbidity recall was conducted for all
children (6-59 months) to assess the prevalence of common diseases (e.g. malaria, diarrhoea).
Vaccination Status and Coverage:

For all children 6-59 months, information on BCG, Oral polio Vaccine (OPV) 1, OPV 3 and
measles vaccination was collected using health cards and recall from caregivers. The vaccination
coverage was calculated as the proportion of children immunized based on card and recall.
Vitamin A Supplementation Status: For all children 6-59 months of age, information on
Vitamin A supplementation was collected using the child welfare cards and recall from
caregivers. Information on whether the child had received supplementation in the last 6 months
was collected. Vitamin A capsules were also shown to the mothers to aid in recall.
De-worming Status: Information was solicited from the care takers as to whether their
child/children 6-59 months had been de-wormed in the last 6 months.
Household Food Diversity: Dietary diversity is a qualitative measure of food consumption
that reflects household access to a wide variety of foods, and is also a proxy of the nutrient
intake adequacy of the diet for individuals. Dietary diversity scores were created by summing
the number of food groups consumed over a 7- days period to aid in understanding if and how
the diets are diversified. Household dietary diversity score (HDDS) is meant to reflect, in a
snap shot the economic ability of a household to consume a variety of foods. A score of 1 was
allocated to each food group that was consumed by the household per day and a score of 0 for
each of the food groups not consumed by the household, and thus the highest possible score
per day was 16.
Household Water Consumption and Utilization: The indicators used were main source
of drinking and household water, time taken to water source and back, cost of water per 20-
litre jerry-can and treatment given to drinking water.
Sanitation: Information on household accessibility to a toilet/latrine, disposal of children’s
faeces and occasions when the respondents wash their hands was obtained.
2.7 Organization of the Survey Coordination/Collaboration: before the survey was conducted meetings were held
with the respective county authorities and key stakeholders briefed them about the
purpose, objectives and methods for the survey. The survey details were discussed with
the County Steering Group, County Nutrition Technical Forum, County Information
Working Group and conducted in collaboration with the County and Sub-Counties
Health Offices and UNICEF. The authorities were requested to officially inform the
communities (villages) that were involved in the assessment.
Recruiting the Survey Team: recruitment was done in collaboration with the
Ministry of Health office at the sub-county level in order to give ownership and
participation in the assessment.
Training of the Survey Team: the teams were given 4-days training prior to field
work, including a standardization test to ensure standardization of measurement and
recording
Quality assurance
• Daily Plausibility check for data quality

• Giving daily feedback and updates to teams based on quality checks
• Teams supervision/ follow up while in the field
• Use of ODK and recording of Geo points
2.8 Case Definition The Global Acute Malnutrition (GAM) is the index which is used to measure the level of
wasting in any given population. In this survey, GAM was defined as the proportion of children
with a z-score of less than -2 z-scores weight-for-height and/or presence of bilateral oedema.
Severe Acute Malnutrition (SAM) was defined as the proportion of children with a z-score of
less than -3 z-score and/or presence of oedema. Further, using the mid-upper arm
circumference (MUAC), GAM was defined as the proportion of children with a MUAC of less
than 125 mm and/or presence of oedema while SAM was defined as the proportion of children
with a MUAC of less than 115 mm and/or presence of oedema.
2.81 Malnutrition by Z-Score: WHO (2006) Standard.
• Severe acute malnutrition is defined by WFH < -3 SD and/or existing bilateral oedema
on the lower limbs.
• Moderate acute malnutrition is defined by WFH < -2 SD and >-3 SD and no oedema
• Global acute malnutrition is defined by WFH < -2 SD and/or existing bilateral oedema
2.8.2Malnutrition by MUAC
• Severe malnutrition is defined by MUAC<115 mm and/or presence of bilateral oedema
• Moderate malnutrition is defined by MUAC < 125 mm and ≥115 mm and no oedema
• Global acute malnutrition is defined by MUAC <125 mm and/or existing bilateral
oedema.
2.9. Questionnaire The survey adopted the data collection tools recommended in the Nutrition Information
Working Group but converted to Open Data Kit (ODK) format to enable data collection using
android smart phones.
2.10 Data uploading, Analysis and Report Writing Data was uploaded on daily basis, downloaded on excel format and analyzed using Excel,
ENA for SMART and SPSS version 20 Statistical software. Results were presented using
the new WHO reference levels.
Preliminary Results and Final Report: Preliminary findings were submitted to County
Nutrition Technical Forum (CNTF) and County Steering Group (CSG) at the County and
(NIWG) at the National levels after completion of the survey fieldwork. The information
shared in the preliminary report included the prevalence of global acute malnutrition as
well as the prevalence of moderate and severe acute malnutrition, vaccination and other
relevant information. The survey results were validated by both the County and National
NITWG level.
CHAPTER THREE
3.0 SURVEY RESULTS AND DISCUSSION
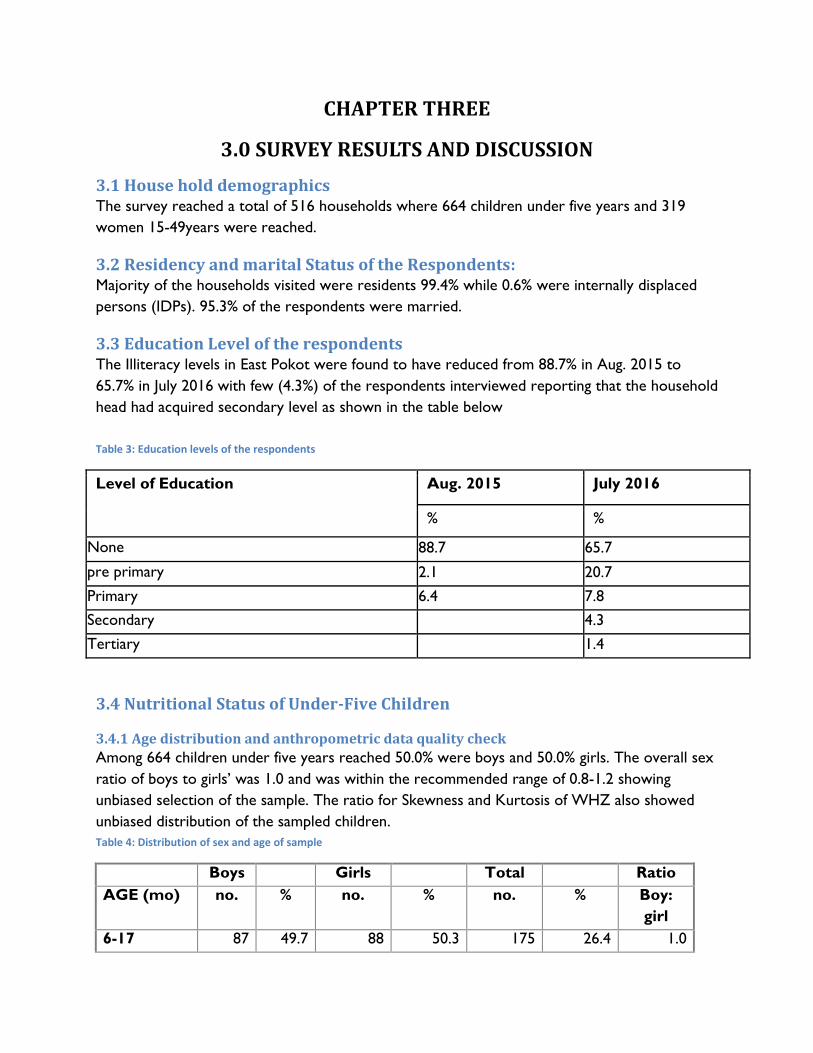
3.1 House hold demographics The survey reached a total of 516 households where 664 children under five years and 319
women 15-49years were reached.
3.2 Residency and marital Status of the Respondents: Majority of the households visited were residents 99.4% while 0.6% were internally displaced
persons (IDPs). 95.3% of the respondents were married.
3.3 Education Level of the respondents The Illiteracy levels in East Pokot were found to have reduced from 88.7% in Aug. 2015 to
65.7% in July 2016 with few (4.3%) of the respondents interviewed reporting that the household
head had acquired secondary level as shown in the table below
Table 3: Education levels of the respondents
Level of Education Aug. 2015 July 2016
% %
None 88.7 65.7
pre primary 2.1 20.7
Primary 6.4 7.8
Secondary
4.3
Tertiary
1.4
3.4 Nutritional Status of Under-Five Children
3.4.1 Age distribution and anthropometric data quality check
Among 664 children under five years reached 50.0% were boys and 50.0% girls. The overall sex
ratio of boys to girls’ was 1.0 and was within the recommended range of 0.8-1.2 showing
unbiased selection of the sample. The ratio for Skewness and Kurtosis of WHZ also showed
unbiased distribution of the sampled children.
Table 4: Distribution of sex and age of sample
Boys Girls Total Ratio
AGE (mo) no. % no. % no. % Boy:
girl
6-17 87 49.7 88 50.3 175 26.4 1.0

18-29 86 49.7 87 50.3 173 26.1 1.0
30-41 78 51.3 74 48.7 152 22.9 1.1
42-53 70 55.1 57 44.9 127 19.1 1.2
54-59 11 29.7 26 70.3 37 5.6 0.4
Total 332 50.0 332 50.0 664 100.0 1.0
3.4.2 Prevalence of acute malnutrition (weight-for-height z-score –WHO Standards 2006)
The weight for height index measures body mass in relation to height or length and describes
the current nutritional status. Children below standard deviations of below the mean indicate
wasting and represent failure to receive adequate nutrition in a period immediately preceding
the survey.
The information presented here is based on the analyzable sample of eligible children whose
plausible anthropometric data were collected, excluding those that were SMART flagged.
The Global acute malnutrition (GAM) levels increased from 18.4% (Aug. 2015) to 23.0% (July
2016) with no significant change (P= 0.111). This was above the emergency GAM thresholds
(15.0%) indicating a critical situation.
Table 5: Overall prevalence of GAM compared to previous year’s survey findings.
July 2016
n = 649
June 2015
n = 321
Prevalence of global malnutrition
(<-2 z-score and/or oedema)
(149) 23.0 %
(18.6 - 28.0 95%
C.I.)
(125) 18.4 %
(15.3 - 22.9 95%
C.I.)
Prevalence of moderate malnutrition
(<-2 z-score and >=-3 z-score, no oedema)
(126) 19.4 %
(16.0 - 23.4 95%
C.I.)
(100) 15.0 %
(12.0 - 18.6 95%
C.I.)
Prevalence of severe malnutrition
(<-3 z-score and/or oedema)
(23) 3.5 %
(2.2 - 5.7 95% C.I.)
(25) 3.8 %
(2.4 - 5.9 95% C.I.)

Figure 2: Shows the trend of Malnutrition from 2014 to 2016
3.4.3 Prevalence of Acute malnutrition by sex
The table below shows that almost equal numbers of boys to girls were malnourished.
However, the number of girls reported to be malnourished was slightly more than boys as
shown in table 5 below
Table 6: Prevalence of acute malnutrition based on weight-for-height z-scores (and/or oedema) and by sex
All
n = 649
Boys
n = 321
Girls
n = 328
Prevalence of global malnutrition
(<-2 z-score and/or oedema)
(149) 23.0 %
(18.6 - 28.0
95% C.I.)
(73) 22.7 %
(18.4 - 27.7
95% C.I.)
(76) 23.2 %
(17.9 - 29.4
95% C.I.)
Prevalence of moderate
malnutrition (<-2 z-score and >=-3
z-score, no oedema)
(126) 19.4 %
(16.0 - 23.4
95% C.I.)
(62) 19.3 %
(15.4 - 23.9
95% C.I.)
(64) 19.5 %
(14.8 - 25.2
95% C.I.)
Prevalence of severe malnutrition
(<-3 z-score and/or oedema)
(23) 3.5 %
(2.2 - 5.7 95%
C.I.)
(11) 3.4 %
(1.8 - 6.4 95%
C.I.)
(12) 3.7 %
(2.1 - 6.4 95%
C.I.)
3.4.4 Prevalence of acute malnutrition by age
Table 6 shows that all age groups were affected by both severe and moderate acute
malnutrition. However, age groups 6-17 and 18-29 months seem to be more affected by severe
malnutrition. This can be attributed to untimely complementary feeding practices in the
21.1%
18.4%
23.0%
3.0% 3.0% 3.5%
0%
5%
10%
15%
20%
25%
June 2014 Aug 2015 July 2016
Per
cen
tage
Year
Malnutrition Trends (2014 - 2016)
GAM
SAM

community while age groups 6-17 and 42-53 seem to be more affected by moderate acute
malnutrition. There was no oedema recorded in this survey
Table 7: Prevalence of acute malnutrition by age, based on weight-for-height z-scores and/or oedema
Severe wasting
(<-3 z-score)
Moderate
wasting
(>= -3 and <-2
z-score )
Normal
(> = -2 z score)
Oedema
Age
(mo)
Total
no.
No. % No. % No. % No. %
6-17 168 8 4.8 29 17.3 131 78.0 0 0.0
18-29 171 8 4.7 22 12.9 141 82.5 0 0.0
30-41 148 0 0.0 26 17.6 122 82.4 0 0.0
42-53 125 4 3.2 35 28.0 86 68.8 0 0.0
54-59 37 3 8.1 14 37.8 20 54.1 0 0.0
Total 649 23 3.5 126 19.4 500 77.0 0 0.0
3.4.5 Distribution of acute malnutrition and oedema based on weight-for-height z-scores
There was no oedema cases observed. However, twenty six children (3.9%) were severely
wasted (Marasmic) while 96.1% were reported not to be severely malnourished. Those
severely malnourished were referred to the nearest health facilities.
Table 8: Distribution of acute malnutrition and oedema based on weight-for-height z-scores
<-3 z-score >=-3 z-score
Oedema present Marasmic kwashiorkor
No. 0
(0.0 %)
Kwashiorkor
No. 0
(0.0 %)
Oedema absent Marasmic
No. 26
(3.9 %)
Not severely malnourished
No. 638
(96.1 %)
3.4.6 Prevalence of acute malnutrition based on MUAC cut off's (and/or oedema) and by sex.
Table 8 below shows the prevalence of global malnutrition based on MUAC at 9.0% compared
to 4.8% reported in Aug. 2015 SMART Survey. The prevalence of moderate acute malnutrition
based on MUAC was 8.35% and severe acute malnutrition prevalence was 0.6%.
From the GAM prevalence by MUAC, girls seemed to be more malnourished than boys; this
trend is in harmony with what was reported in the GAM prevalence by W/H.

Table 9: Prevalence of acute malnutrition based on MUAC cut off's (and/or oedema) and by sex
All
n = 664
Boys
n = 332
Girls
n = 332
Prevalence of global malnutrition
(< 125 mm and/or oedema)
(60) 9.0 %
(6.8 - 12.0 95%
C.I.)
(21) 6.3 %
(4.4 - 9.0 95%
C.I.)
(39) 11.7 %
(8.4 - 16.3 95%
C.I.)
Prevalence of moderate
malnutrition
(< 125 mm and >= 115 mm, no
oedema)
(55) 8.3 %
(6.0 - 11.3 95%
C.I.)
(19) 5.7 %
(3.9 - 8.4 95%
C.I.)
(36) 10.8 %
(7.5 - 15.4 95%
C.I.)
Prevalence of severe malnutrition
(< 115 mm and/or oedema)
(5) 0.8 %
(0.3 - 1.8 95%
C.I.)
(2) 0.6 %
(0.1 - 2.5 95%
C.I.)
(3) 0.9 %
(0.3 - 2.8 95%
C.I.)
3.4.7 Prevalence of acute malnutrition by age, based on MUAC cut off's and/or oedema
Severe wasting by MUAC was found to be more prevalent among children of age group 6-17
months. There were no cases of severe wasting by MUAC from all other age groups while
the prevalence of moderate malnutrition was more among children aged 6-17 followed by18-
29 months. There were no cases of oedema.
Table 10: Prevalence of acute malnutrition by age, based on MUAC cut off's and/or oedema
Severe wasting
(< 115 mm)
Moderate
wasting
(>= 115 mm
and < 125 mm)
Normal
(> = 125 mm )
Oedema
Age
(mo)
Total
no.
No. % No. % No. % No. %
6-17 175 5 2.9 32 18.3 138 78.9 0 0.0
18-29 173 0 0.0 12 6.9 161 93.1 0 0.0
30-41 152 0 0.0 5 3.3 147 96.7 0 0.0
42-53 127 0 0.0 5 3.9 122 96.1 0 0.0
54-59 37 0 0.0 1 2.7 36 97.3 0 0.0
Total 664 5 0.8 55 8.3 604 91.0 0 0.0
3.4.8 Prevalence of underweight based on weight-for-age z-scores by sex
Table 10 below show the global underweight rates for East Pokot Sub County is at 38.8%
which is an increase from 32.2% reported in Aug. 2015. This is significantly higher (P= 0.040)
Girls seem to be more underweight than boys and this is a turnaround from other surveys
conducted in East Pokot that showed that more boys than girls were underweight

Table 11: Prevalence of underweight based on weight-for-age z-scores by sex
All
n = 655
Boys
n = 328
Girls
n = 327
2015
Prevalence of
underweight
(<-2 z-score)
(254) 38.8 %
(33.9 - 43.9 95%
C.I.)
(126) 38.4 %
(31.9 - 45.3
95% C.I.)
(128) 39.1 %
(33.4 - 45.2
95% C.I.)
(215) 32.2 %
(28.3 - 36.5
95%
C.I.)
Prevalence of moderate
underweight
(<-2 z-score and >=-3 z-
score)
(172) 26.3 %
(22.6 - 30.3 95%
C.I.)
(83) 25.3 %
(20.9 - 30.3
95% C.I.)
(89) 27.2 %
(22.4 - 32.7
95% C.I.)
(148) 22.2 %
(19.0 - 25.8
95%
C.I.)
Prevalence of severe
underweight
(<-3 z-score)
(82) 12.5 %
(10.0 - 15.5 95%
C.I.)
(43) 13.1 %
(10.1 - 16.8
95% C.I.)
(39) 11.9 %
(8.5 - 16.5
95% C.I.)
(67) 10.0 %
(7.3 - 13.6
95%
C.I.)
3.4.9 Prevalence of underweight by age, based on weight-for-age z-scores
The prevalence of severe and moderate underweight is higher in children of age groups 6-17
and 18-29 months. Children of age group 54-59 are the least affected by severe underweight.
Table 12: Prevalence of underweight by age, based on weight-for-age z-scores
Severe
underweight
(<-3 z-score)
Moderate
underweight
(>= -3 and <-2
z-score )
Normal
(> = -2 z score)
Oedema
Age
(mo)
Total
no.
No. % No. % No. % No. %
6-17 172 22 12.8 42 24.4 108 62.8 0 0.0
18-29 168 22 13.1 49 29.2 97 57.7 0 0.0
30-41 152 14 9.2 38 25.0 100 65.8 0 0.0
42-53 126 15 11.9 34 27.0 77 61.1 0 0.0
54-59 37 9 24.3 9 24.3 19 51.4 0 0.0
Total 655 82 12.5 172 26.3 401 61.2 0 0.0
3.4.10 Prevalence of stunting based on height-for-age z-scores and by sex
Stunting is measured by the index of height for age and reflects failure to receive adequate
micro and macro nutrients over a long period of time and is also affected by recurrent and
chronic illness. Stunting levels in East Pokot Sub County increased from 34% (Aug. 2015) to
36.5% but with no significant change. This is higher than the national levels of 26% and the
Baringo county levels of 29% (KDHS 2014). Further the results showed that boys were more

stunted 39.6% as compared to girls at 33.3% and this trend was similar from the previous
nutrition surveys.
Table 13: Prevalence of stunting based on height-for-age z-scores and by sex
All
n = 625
Boys
n = 313
Girls
n = 312
Prevalence of stunting
(<-2 z-score)
(228) 36.5 %
(32.0 - 41.2
95% C.I.)
(124) 39.6 %
(33.1 - 46.5
95% C.I.)
(104) 33.3 %
(27.7 - 39.5
95% C.I.)
Prevalence of moderate stunting
(<-2 z-score and >=-3 z-score)
(137) 21.9 %
(18.8 - 25.4
95% C.I.)
(73) 23.3 %
(19.0 - 28.3
95% C.I.)
(64) 20.5 %
(17.1 - 24.4
95% C.I.)
Prevalence of severe stunting
(<-3 z-score)
(91) 14.6 %
(11.6 - 18.1
95% C.I.)
(51) 16.3 %
(12.3 - 21.3
95% C.I.)
(40) 12.8 %
(9.0 - 18.0 95%
C.I.)
3.4.11 Prevalence of stunting by age based on height-for-age z-scores
Table 13 below shows that the prevalence of severe stunting is higher in children aged 18-29
and 30-41 months respectively. Children of age 54-59 months seem to be least affected by
stunting. The prevalence of moderate stunting seems to be evenly distributed among all age
groups.
Table 14: Prevalence of stunting by age based on height-for-age z-scores
Severe stunting
(<-3 z-score)
Moderate stunting
(>= -3 and <-2 z-
score )
Normal
(> = -2 z score)
Age
(mo)
Total
no.
No. % No. % No. %
6-17 167 23 13.8 30 18.0 114 68.3
18-29 159 32 20.1 43 27.0 84 52.8
30-41 141 25 17.7 28 19.9 88 62.4
42-53 123 9 7.3 27 22.0 87 70.7
54-59 35 2 5.7 9 25.7 24 68.6
Total 625 91 14.6 137 21.9 397 63.5
3.4.12 Prevalence of overweight based on weight for height cut offs and by sex (no oedema)
The overall prevalence of overweight is 0.0%.

3.5 MATERNAL NUTRITION STATUS MUAC was used to determine the level of under nutrition among pregnant and lactating
women using a cutoff point of < 21cm. The maternal malnutrition was defined as women whose
MUAC measurements were < 21.0cm while women whose MUAC measurements were
between 21.0 <23.0cm were classified as at risk of malnutrition.
The survey reached a total of 318 women of reproductive age (15-49years). Among the
mothers sampled 67.0% of them were lactating, 16.4% were pregnant and 1.3% were both
pregnant and lactating. Out of these, 31 (9.7%) were undernourished as shown in table 17
below
Figure 3: Physiological status of the mother
Table 15: Prevalence of Malnutrition of mothers by MUAC
Indicator N %
MUAC <21.0 cm for all women 31 9.7%
MUAC <21.0 cm for PLW 30 9.4%
Iron folate supplementation was poor among pregnant mothers in East Pokot. No mother was
found to have taken IFAs for more than 180 days. Only 18 mothers (8.3%) had received the
supplement for 90 days and above. Generally the average number of day’s mothers was
supplemented with IFAS was 50 days.
Table 16: Iron Folate intake by pregnant mothers
16.4%
67.0%
1.3% 15.4%
Women Physiological Status
Pregnant
Lactating
Pregnant and Lactating
None of the above

Categories of IFA
Consumption (In Days)
No of women Proportion
(%)
< 90 Days 109 50.2%
90≥180 Days 18 8.3%
> 180 Days 0 0%
3.6 ACCESS AND UTILIZATION OF HEALTH AND NUTRITION SERVICES
3.6.1 Immunization Coverage
The survey used three antigens as a proxy for immunization coverage. These were; BCG, Oral
Polio vaccination (1 and 3) and measles vaccine (1 and 2). The second measles vaccine given at
18 months was recently introduced by the Ministry of Health in the country.
Immunization was confirmed either by card (mother-child booklet) or by recall. BCG was
confirmed by observing the scar at the child’s arm. BCG, OPV 1 and OPV 3 immunization
coverage were at 89.9%, 91.1% and 80.8% respectively which was above the national target of
80%. However Measles at 9 months and 18 months was at 71.4% and 32.1% respectively.
Figure 4: Immunization coverage
3.6.2 Vitamin A, Zinc supplementation and Deworming.
The survey findings showed low coverage of Vitamin A. Children aged 6-11 months who had
received Vitamin A was 22.6% a drop from last year that was at 31.5% and children 12-59
33.3%
28.8%
22.8%
9.2%
57.8%
52.0%
48.6%
22.9%
0% 20% 40% 60% 80% 100%
OPV 1
OPV 3
Measles at 9 months
Measles at 18 months
% of children 6-59 months
Vaccin
e
Immunization coverage
By card By recall

months who had received Vitamin A twice or more was at 13.3% a slight increase from last
year’s coverage of 11.3% which is far much below the national target recommendation of 80%.
Zinc supplementation during diarrheal episodes is highly recommended to reduce severity of
the disease and reduce child mortality related to diarrheal diseases. Zinc coverage was found to
be 42.9% of the 42 children that had reported to have diarrhoea in the last two weeks prior to
survey date.
The survey showed that only 14.9% received dewormers in the last one year. Though slightly
improved from last year’s coverage of 13.3% it is still low from the national target of 80%.
Figure 5: Vitamin A supplementation coverage
3.6.3 Child Morbidity and Health Seeking Behavior
The survey results showed that 59% of children were reported to be ill within the last two
weeks before the survey. This was an increase from 28.4% reported in Aug. 2015 survey. Most
cases reported to have suffered from Acute Respiratory Infection (ARI) 73.0% followed with
fever at 53.6%. Bloody diarrhea was at 35.5% an increase from 0.5% last year as shown in the
below
Table 17: Child Morbidity rates
Disease Prevalence (%)
Aug. 2015 July 2016
% N %
Total Illness 28.4% 392 59%
Fever with chills 26.3% 210 53.6%
31.5%
11.3%
29.5%
22.6%
30.7%
13.3%
0%
5%
10%
15%
20%
25%
30%
35%
6-11 Once 12-59 Once 12-59 more than Once
Vitamin A supplementation coverage
2015 2016

ARI 50% 286 73.0%
Watery diarrhoea 22.1% 160 40.8%
Bloody Diarrhoea 0.5% 139 35.5%
Others (pneumonia, Skin infection,
Eyes and ear infections) 5.4% 32 8.2%
The high diarrhoea rates could be as a result of poor hygiene and sanitation practices where by
the latrine coverage is at 3% and only 2% of the respondents washed hands at the 4 critical
times. Over 90% of households in East Pokot did not treat their drinking water thus exposing
themselves to risk of getting water waterborne diseases. The high prevalence for acute
respiratory infections could be attributed to the cold season which accompanies the long rains
and hence most of the children under five years are prone to these diseases.
3.6.4 Health seeking behaviors
Most of the caregivers (81.7%) reported to seek medical attention from public and private
clinics hence this show that most care givers are aware of the formal treatment regime apart
from few who used local herbs (4.9%).
Figure 6: Health seeking behaviors
3.7 Household Water Access, Hygiene and Sanitation
3.7.1 Main source of drinking water for the residents
Majority of the residents of East Pokot Sub County (94.7%) obtain their drinking water from
unsafe sources mainly unprotected shallow well, unprotected dug wells, lakes, rivers and water
0.7%
1.1%
3.5%
4.9%
5.3%
11.6%
72.9%
0.0% 20.0% 40.0% 60.0% 80.0%
Traditional healer
Community health worker
Mobile clinic
Local herbs
Private clinic/ pharmacy
Shop/kiosk
Public clinics
% of caregivers
So
urc
e o
f h
ealt
hcare
Health seeking behaviours

pans. Only 5.4% of the residents are able to access safe drinking water from protected shallow
wells, protected springs and taps as indicated in the graph below.
Figure 7: Main water sources
3.7.2 Methods of Treating and Storing Drinking Water
98.1% did not treat water before drinking and 51% stored their drinking water in closed
containers. Despite many households fetching water from unprotected sources, water
treatment before drinking was rarely done. Only 2.9 % of the households treated water while
one percent used filtering pots and less than one percent used chemicals.
3.7.3 Distance To/ from Water Source
SPHERE standards for WASH recommends that the maximum distance from any household to
the nearest water point should be 500 meters. Half of the respondents (50%) reported to trek
for more than 500meters and less than 2 kilometres to get water while 35% reported to trek
for less than 500meters and 15% reported to trek for more than 2 kilometres.
Figure 8: Trekking distance to water sources
5.4
5.6
22.9
38.8
25.8
1.6
0 10 20 30 40 50
Piped water system/…
Unprotected shallow well
Unprotected dug well/ laga
River/spring
Earth pan/dam
Lake
Proportion of HH (%)
Main Source of water

3.7.4 Hygiene and Sanitation
Most of the respondents (91%) washed their hands before eating and 58% washed their hands
before cooking. Only 11% washed hands after visiting toilet/latrine, while 7% washed hands
after taking children to the toilet/latrine. However, those who practiced hand washing at the
four critical times were only 2%.
Those who owned toilets or latrines were only 3% and 96% of the respondents practiced open
defecation.
Table 18: Hand washing practices
HYGIENE N %
HH Aware of hygiene practices 467
After toilet 53 11%
Before cooking 272 58%
Before eating 424 91%
After taking children to the toilet 31 7%
Before Milking 71 15%
Hand washing in all 4 critical times 9 2%
Hand washing >3 times 38 8%
Hand washing by soap and water 84 18%
SANITATION
Open defecation(bushes) 497 96%
Own traditional/improved latrine 16 3%
35%
50%
15%
Trekking Distance to water sources
Less than 500m (Less than 15
minutes)
More than 500m to less than
2km (15 to 1 hour)
More than 2 km (1-2 hours)

3.8 Household Dietary Diversity and Food Consumption Score
3.8.1 Household Dietary Diversity
In assessing the nutritional quality and quantity of the food consumed by the respondents, a
week retrospective household dietary diversity questionnaire was administered. Only one main
food groups (cereals) was consistently consumed within 7 days by more than 80% of the
sampled households. Milk products and sweets were also highly consumed at over 70%.Fruits
and other proteins other than milk were consumed by less than 50% of the respondents.
Figure 9: Food groups consumed by households
3.8.2 Household Dietary Diversity Score based on 24 hours recall
63.2 % of the respondents were able to take more than 4 food groups per day, this has declined
from the last year’s survey where 77.7% were able to consume 4 food groups per day. This
could be attributed to lack of food varieties available to households due to high prices in the
market and inaccessibility of markets due to poor road networks.
Table 19: Household Dietary Diversity Score based on 24 hours recall
Indicator Aug. 2015 July 2016
Households Consuming <4 Food Groups 22.3% 36.8%
82.8% 78.9%
74.9%
45.8% 43.7% 37.6%
26.5%
15.4% 10.7% 9.9%
5.3% 4.3% 4.1% 3.7% 2.9% 0.4% 0%
10%
20%
30%
40%
50%
60%
70%
80%
90%
Pe
rce
nta
ge o
f H
H
Food Groups
Food groups consumed by households

Households Consuming >4 Food Groups 77.7% 63.2%
3.8.3 Women Minimum Dietary Diversity
In assessing the nutritional quality and quantity of the food consumed by the surveyed women
of reproductive age, a 24 hour recall period household dietary diversity questionnaire was
administered. The consumption of 10 food groups is as sown in the graph below
Figure 10: Food groups by women
3.8.4 Women Minimum Dietary Diversity
Women Minimum Dietary Diversity indicator tells whether or not women 15-49 years of age
have consumed at least five out of ten defined food groups the previous day or night.
In East Pokot 22.5% of the women surveyed had consumed more than 5 food groups.
3.8.5 FCS- Nutrition
The purpose of FCS - Nutrition is to assess nutrient inadequacy by looking at the frequencies of
consumption of food groups rich in the nutrients of interest like Vitamin A and Iron.
Deficiencies in micronutrients, such as vitamin A and iron, over a long period of time, lead to
chronic undernutrition. Iron deficiency leads to anaemia and Vitamin A deficiency leads to
blindness and interferes with the normal functioning of the immune system, growth and
development as well as reproduction.
In East Pokot the HHs classified as food insecure (both poor and borderline) as well as those
considered with adequate food consumption are at important risk of deficiency of Heme iron as
shown in the graph below
Figure 11: FCS-Nutrition
88.6% 86.6%
58.3%
40.1%
20.9% 18.2% 13.2% 9.1% 7.4% 1.7% 0%
20%
40%
60%
80%
100%
Per
cen
tage
of
HH
Food Groups
Food Groups consumed by women

3.8.6 Food Consumption Score and Coping Strategy Index.
The food consumption score is an acceptable proxy indicator to measure caloric intake and
diet quality at household level, giving an indication of food security status of the household. It’s
a composite score based on dietary diversity, food frequency and relative nutritional
importance of different food groups. 87.4% of the sampled households had acceptable FCS,
9.88% were in the borderline and only 2.71%% had poor score.
Table 20: Food Consumption Score and Coping Strategy Index.
Main
Threshold
Nomenclature Proportion of Households
Aug. 2015 July 2016
0-21 Poor food consumption…manly cereal and
sugar 3.3% 2.71%
21.5-35 Borderline food consumption
Cereal, legumes, milk, oil, sugar 6.2% 9.88%
>35.5 Good food consumption
Cereal, legumes, milk, condiment, flesh meat,
vegetable, oil, sugar
90.5% 87.4%
The Coping strategy index (CSI) is considered an outcome of household food insecurity. The
collection is per the number of days a household had to rely on the various coping strategies in
the past seven days. The average CSI for East Pokot was 27.59% higher from last year’s index
which was 14.66% meaning the sampled population is engaging more in different survival tactics
due to inadequate food availability at household level.
18.5% 0.0% 6.2% 0.2%
86.2%
61.0%
66.2%
10.0%
43.1%
4.7%
13.8%
31.7%
15.4%
90.0%
50.8%
95.1%
0.0% 7.3%
0%10%20%30%40%50%60%70%80%90%
100%
Po
or/
Bo
rder
line
Acc
epta
ble
Po
or/
Bo
rder
line
Acc
epta
ble
Po
or/
Bo
rder
line
Acc
epta
ble
Protein Rich Vit A Rich Heme Rich
% o
f H
H
FCS-Nutrition
7 Days
1-6 Days
0 Days

Table 21: Coping strategy Index
Coping strategy Proportion of
HHs (N= )
Frequency
score (0-7)
Severity
score (1-3)
Weighted
score=Frej8q*weight
Aug. 2015 July 2016
Rely on less preferred & less
expensive food
60.5 (n= 312)
3.17 1
3.17
Borrow food 62.2%
(n= 321) 2.93 2
5.86
Limit portion sizes 66.1%
(n= 321) 3.71 1
3.71
Restrict consumption of food by
adults for young children to eat
67.6%
(n= 349) 3.64 3
10.92
Reduced number of meals 65.3% (337) 3.93 1
3.93
Total weighted Coping
Strategy Score
14.66 27.59

CHAPTER FOUR
CONCLUSION AND RECOMMENDATIONS The survey team took time to look at the recommendations that were done in the 2015
SMART and their progress of implementation so far. This is as shown in the table below
Table 22: Recommendations from Aug. 2015 survey and progress of implementation
Recommendations from 2015
SMART Survey
Progress on Implementation
Review of nutrition response plan for East
Pokot.
Was done and the Maternal and Child Health
Program is now being implemented in East Pokot.
Integrated outreach services 6 integrated outreaches done bi monthly
Quarterly mass screening It’s done quarterly in East Pokot
Train health workers on MIYCN and
IMAM
79 health workers trained on MIYCN and IMAM
Train MTMSG on detection of
malnutrition and referrals , and MIYCN
Two MTMSGs have been capacity build on MIYN
Train health workers on nutrition supply
chain system and management.
30 Members of County health management team
trained.
Train CHVs in the 8 CUs on community
strategy nutrition technical module.
Seven community Units trained and strengthened.
Enhance linkage of nutrition specific with
nutrition sensitive interventions in other
sectors, livestock, agriculture, education,
WASH)
Involving other sectors in planning nutrition
activities and implementing them in ECDs
Train MTMSG and CHVs on proper
WASH practices.
Two mother support groups trained on WASH
practices
Triggering community led total sanitation. 4 community units trained on CLTS in East Pokot.
Conduct health education on WASH in
schools
Not done in East Pokot

Training ECD teachers on VAS, de-
worming, growth monitoring and linkage
to health facilities.
Planned to be done Before August
Training health workers on micronutrient
supplementation.
43 health workers trained
Support preposition of nutrition
therapeutic supplies.
30 members of the CHMT and SCHMT have been
trained on supply chain.
Equip the Chemolingot Sub County,
Kollowa and Tangulbei stabilization
centers and train health workers on SC
management
Ongoing at procurement stage
Table 23: July 2016 Smart Survey Recommendation And Implementation Timeline
FINDINGS RECOMMENDATION ACTOR
(BY
WHO?)
IMPLEMENTATION
TIME LINE
GAM -
23.0%
SAM- 3.5%
PLWs -9.4%
Carryout mass screening in East Pokot
Sub County.
Reactivate stabilization centres.
Scale up IMAM to all East Pokot Health
facilities.
Implement surge model in every health
facilities.
Scale up Outreaches.
MOH,
WVK
KRCS
UNICEF
October 2016.
Sept 2016.
Dec 2016
Dec 2016
Sept 2016
Low
coverage of
Vit A and
Deworming.
Poor
hygiene
Practices.
Integrate Vit A supplementation and
Deworming to ECDs.
Train CHVs on nutrition technical
module.
Implement the existing SBCC Strategy.
Implement the complementary feeding
action plan.
Reactivate the SCNTF
Conduct health education on WASH in
schools.
MoH,
WVK
KRCS
UNICEF
On-going
On-going
Sept 2016
Sept 2016
Aug 2016
Dec 2016