factors affecting the nutrition status of the pokot and
TRANSCRIPT

FACTORS AFFECTING TH E NUTRITIO N STATUS OF THE POKOT
AND TH E TUGEN ELDERLY IN THE DROUGHT PRONE AREAS OF
BARINGO D ISTR IC T
BYPAULINE ODUNGA
THESIS SUBMITTED IN PARTIAL FULFILMENT OF THE REQUIREMENTS FOR THE
DEGREE OF MASTER OF SCIENCE IN APPLIED HUMAN NUTRITION IN THE
DEPARTMENT OF FOOD TECHNOLOGY AND NUTRITION, FACULTY OF
AGRICULTURE, UNIVERSITY OF NAIROBI - KENYA
August, 2004
University ot NAIROBI Library
^ ' 225*

DECLARATION
I, PAULINE ODUNGA hereby declare that this thesis is my original work and has not been
presented for a degree in any other university.
(
PAULINE ODUNGA
Date:
The thesis has been submitted for examination with our approval as University supervisors.
Professor Nelson M. Muroki
Associated Professor,
Unit of Applied Human Nutrition,
Department of Food Technology and
Nutrition
Dr. Jaswant Sehmi
Senior lecturer
Unit o f Applied Human Nutrition,
Department of Food Technology and
Nutrition.
Date: Date: -
DEDICATION
This thesis is dedicated to my husband Geoffrey, son Alex, daughter Cheryl, my father
Gaetano and mother Emma.
u

ACKNOWLEDGEMENTS
I am grateful to my supervisors, Dr. Sehmi Jaswant and Prof. Nelson Muroki for their
continuous guidance during all the phases of preparing this thesis. I would like to extend my
appreciation to all the staff of the Applied Nutrition Programme and to the Chairman of the
Department of Food Technology and Nutrition, Prof. E. G. Karuri for their concern and
encouragement.
I wish to express my sincere gratitude to all the staff working for World Vision Kenya in
Baringo District for different types of assistance they gave me during data collection.
I extend my thanks to the teams of field assistants for their excellent work in data collection
and all the people in Baringo district for accepting to participate in the study.
iii

TABLE OF CONTENTS
DEDICATION..............................................................
ACKNOWLEDGEMENTS.......................................
TABLE OF CONTENTS............................................
LIST OF TABLES......................................................
LIST OF FIGURES...................................................
OPERATIONAL DEFINITIONS.............................
ABSTRACT.................................................................
CHAPTER ONE: INTRODUCTION......................
1.1. Background.....................................................
1. 2 Statement o f the problem .............................
1. 3 Justification of the study..............................
1.4 O bjectives.......................................................
1.5. Hypothesis.......................................................
1.7 Expected benefit of the study........................
CHAPTER TWO: LITERATURE REVIEW.......
2.1 Definition o f the elderly.....................................
2.2 Overview o f the ageing process........................
2.2.1 The physiology and pathology o f ageing.....
2. 3 Nutritional requirements of older people..
2.4 Assessment of nutritional status of the elderly
2.4.1 Anthropometric measurements....................
2. 4. 2 Food intake.................................................
DECLARATION..............................................................l
.... li
... iii
....iv
,.. vii
... ix
.....x
... xii
..... 1
......1
...... 3
...... 4
...... 5
...... 5
......6....... 7
....... 7
........8
........8
......10
...... 15
...... 15
...... 17
IV

2. 5 Factors affecting the nutritional status of elderly........................................................ 17
2. 6. Changes in the external and social environment in emergency situation................. 21
2. 7 Food processing and preparation................................................................................... 22
2. 8 Access to food through coping mechanisms................................................................... 22
CHAPTER THREE: METHODOLOGY.................................................................................23
3. 1 STUDY SETTING............................................................................................................. 23
3.1.2 Population composition................................................................................................ 24
3. 1. 3 Infrastructure and social services facilities..................................................................25
3. 2 RESEARCH METHODOLOGY.................................................................................25
3. 2. 1 Study design.....................................................................................................................25
3.2. 2 Method o f sampling........................................................................................................25
3.2.2.2 Sampling procedure........................................................................................................26
3. 2. 3 Research instruments......................................................................................................28
3. 2. 4 Implementation of research activities...................................................................... 29
3. 2. 4. 1 Training of field assistants and pre-testing of questionnaires............................... 29
3. 2. 4. 2 Data collection.............................................................................................................30
3. 2. 5 Data quality control....................................................................................................... 31
3. 2. 6 Data processing and analysis........................................................................................ 31
CHAPTER FOUR: RESULTS.................................................................................................... 32
4. 1 Socio-demographic characteristics of the study population........................................... 32
4. 2 Socio-economic characteristics o f the study population.............................................. 36
4. 3 Food consumption.............................................................................................................39
4. 4 Nutritional status of elderly population in Baringo...................................................... 42
4. 5 Dental status......................................................................................................................44

4. 6 Support system s.........................................................................................................
4. 7 Factors affecting nutritional status of the elderly in Baringo district....................
4. 7. 1 Social and economic factors...................................................................................
4 .7 .2 Association between social support and nutritional status..................................
4. 7. 3 Dental status and nutritional status.......................................................................
4. 7. 4 Food intake and nutritional status.........................................................................
CHAPTER FIVE: DISCUSSION......................................................................................
5. 1 Characteristics of elderly study population.............................................................
5. 2 Factors affecting nutritional status of elderly population in Baringo district.....
5.2. 1. Loneliness and mal-distribution of food.............................................................
5. 2. 2 Socio-economy of the household......................................................................
5. 2. 3 Social support.......................................................................................................
5. 2. 4 Food intake...........................................................................................................
CHAPTER SIX: CONCLUSION AND RECOMMENDATIONS...............................
REFERENCES.....................................................................................................................
APPENDIX 1. QUESTIONNAIRE....................................................................................
APPENDIX 2. FACTORS DIFFERENCIATING THE TUGEN AND THE POKOT ELDERS ....................................................................................................
46
47
.47
.49
.50
.51
.53
.53
..54
..54
..55
..56
..56
..59
..62
..69
66
VI

LIST OF TABLES
Table 1: Divisions o f Baringo district with their respective approximate areas, populations
and Rank on drought.....................................................................................................24
Table 2 Distribution of the elderly population by general socio-demographic characteristics
.........................................................................................................................................32
Table 3: Distribution of the elderly population by age and household size and by division.33
Table 5: Distribution of the elderly households by age category and by sex......................... 35
Table 6 Education levels of elderly Pokots and Tugens...........................................................36
Table 7: Occupation and source of income of the elderly Pokot and Tugen population..... 37
Table 8: Distribution of households o f elderly by ownership of animals and number of
animals, which died for last 12 months.......................................................................38
Table 9: Distribution of households of elderly by ownership and loss of livestock a........... 38
Table 10: Distribution of households o f elderly by meals taken and food preference........ 40
Table 12. Average nutrient intakes of the elderly Pokots and Tugens in Baringo district. ..41
Table 13: Distribution of Underweight (BMI <18.5) among different age group of the
elderly by division........................................................................................................ 42
Table 14: Average body mass index (BMI) and mid-upper arm circumference (MUAC) by
age category of the elderly in Baringo District.......................................................... 43
Table 15 Distribution of population by dental status and by problems of the elderly..........45
Table 16 Distribution of elders by type of dental problems they experience and by ethnic
group.............................................................................................................................. 45
Table 17 Source of support of the elderly among Pokot and Tugen.......................................46
Table 18: Distribution of households by priority given for food during time o f shortage. ...47

Table 19 association between social, economic factors and nutritional status......................
Table 20: Association between source o f income, animal ownership and nutritional status of
.............48Pokot and Tugen elders......................................................................
Table 21 Distribution o f households by nutritional status and by support systems...............5C
. . , 51Table 22: Dental status and nutritional status........................................................
i *• 5'Table 23: Food intakes and nutritional status of elderly population.....................................
Vlll

LIST OF FIGURES
Figure 1. Risk factors for nutritional vulnerability in older population .............................
.........................28Figure 2: Sampling procedure...................................................................
Figure 3: Distribution of the population in elderly households by age categories............. 34
Figure 4: Change in mid upper arm circumference with age and sex................................. 43
Figure 5: Classification of MUAC by age category of the elderly.......................................44
, • 4CFigure 6: MUAC classification and animal ownership............................................................
IX

OPERATIONAL DEFINITIONS
Arm-span: anthropometric measurement of the distance from tip of the middle finger of the
left arm to the tip o f the middle finger o f the right arm with the arms stretched out.
Body M ass Index: (weight /height2) is a measure of chronic energy deficiency in adults.
Carer: individual identified in the community to take specific responsibilities in assisting
an isolated older person with daily activities.
Coping strategy: means of diversifying strategies to access food.
Demi-span or half span: measurement taken as the distance from the tip o f the middle
finger o f the out-stretched left arm to the top of the sternum (or chest).
Elderly: Age defined in terms of number of years. WHO defines Older people as those
being 60 years or older. Some older people will not necessarily remember their exact year of
birth but will recall their age in terms o f being born around the time of a significant event.
For example, when a war occurred, severe food shortage or significant political event.
Definition of “elderly” reflects average life expectancy of the region concerned: They range
from the age of 46 in Ethiopia to 71 years in Mauritius (HelpAge International, 1999) In this
study the retirement age of 55 years in Kenya was considered as the working definition.
Mid-Upper Arm Circumference (MUAC): is a measurement of “the circumference of the
left arm taken at the mid-point between the elbow and the shoulder.” It is usually used for
screening purposes.
Recommended Dietary Allowance (RDA): An RDA is designed explicitly to be applicable
to population rather than to individuals i.e. accounts for variability in need among subject.
RDAs are intended to prevent nutritional deficiency and are usually defined as “safe
Intakes” RDA, is the intake that reduces the prevalence of nutrient deficiency to some
desired proportion of the population while avoiding excess intake.

for elderly members that includesSocial support: Support systems in place that care
family, community, self-reliance NGOs, etc.

ABSTRACT
A cross-sectional study was conducted between January and March 2001 to assess the risk
factors to nutritional vulnerability of elderly people. I n this context, the “elders” are defined
as people with 55 years and over. Since few Tugen and Pokot elderly knew their age, most
related the dates of their births to family, local or national events. The research was carried
out among Tugens and Pokot tribes living in the drought prone areas of Baringo district.
Socio-demographic, socio-economic, anthropometric and dietary data were collected in 250
households of elderly population (90 Tugens and 180 Pokots). Most people (87.2%)
depended on food relief provided by World Food Programme.
The results of the study revealed that the overall nutritional status was poor. The majority of
the elderly (82.4%) had a Body Mass Index of less than 18.5 (about 78.8% and 88.9%
respectively for Pokots and Tugens). Food intakes were poor in quality and in quantity.
Slightly less than a quarter of the population (24.5%) took at least 2 meals per day. Most
nutrient intakes were below 50% of requirements except for iron (75.2%) and vitamin A
(65.6%) whose source was cereals and vegetables.
Dental problems were common for most of the elders (in 88.4%), which affects their
chewing ability.
There was an association (p <0.05) between malnutrition and marital status, animal
ownership, taking care of young children, size of the household and taking lunch.
XII

Moreover it was found that when the population grows old, it tends to skip some meals
therefore decreasing the number of meals eaten. Body muscle loss increased significantly as
the population grew old.
Social factors such as taking care o f young children or living in large households were
associated with high prevalence of malnutrition. Loneliness was a risk factor only for the
elderly who lost their partners. The number of cows owned and the capacity to care after
oneself, showed a positive impact on current BMI status.
Compared to the Pokots, Tugen elders reported higher proportion of malnutrition, about 2
times more likely to be malnourished (OR: 2.2; 95% Cl: 1.1-4.6). The findings of the study
showed that the difference in nutritional vulnerability among the two communities may be
due to the gap in socio-economic factors such as marital status, household size, access to
food and source of income; and in their eating habits.
In conclusion, the study revealed associations between poverty, psychosocial/emotional,
family life, and food intake factors with nutritional status among elderly living in Baringo
district. Compared to the Pokots Tugen elders are at high level of nutritional vulnerability.
The findings suggest that more nutrition education and feeding programmes targeting old
people need to be designed and implemented in Baringo District.
xiii

CHAPTER ONE: INTRODUCTION
1. 1. Background
The world population aged over 60 years has been estimated to increase from 590 million
(of the end of 2000) to 1.2 billion by the year 2025 (ACC/SCN, 1999). Since last century,
80 % o f this increase has been taking place in developing countries. Although the proportion
of the elderly in African population is much smaller than in Europe and North America
where there is a decline in fertility, the estimate increase will go up to 200% in the next 25
years in some developing countries (ACCN/SCN, 1999). The change in population structure
is explained by the effect of many factors such as multiple improvements in health
interventions - preventive, curative and promotional measures, which result in decline in
mortality and increase in life expectancy (Roe, 1987; Longhurst, 1989; Young et al, 1987).
In Kenya, the elderly constitute about 2 million of the total population and estimated to
increase to 4 million by 2005.
Aging process occurs to human beings with irreversible and progressive slowdown of body
activities involving the physical, social, mental and psychological effects and making the
person to be considered as vulnerable (Ismail, 1999; Bermudez & Dwyer, 1999). Chronic
diseases and malnutrition are commonly found especially during emergencies (disaster or
famine). The elderly are a vulnerable group in which early effects of under nutrition and
multiple deficiencies manifest themselves. According to Ethangatta (1988), 29% of the
elderly in Kenya are malnourished. The risk factors to nutritional vulnerability are poverty
which make it difficult to procure food and other basic needs, poor health, psychological
1

and emotional problems, poor functional ability or disability and family lifestyle such as
social support; which affect food intake and result in poor diet of the elderly population
(Ismail & Manandhar, 1999; Roland, 1984; Eschleman, 1984; Young et al., 1989).
Most of the elderly in developing countries do retire and continue to make a vital
contribution to the family income through the provision o f essential childcare or by helping
with household activities (Ismail, 1997). A number o f studies show that older people are
more likely to be givers rather than receivers of aid. In situations of deaths of younger adults
(from AIDS or other diseases) or as young people move to look for jobs in urban area or for
pasture for cattle the elderly remain behind taking care of young children (Peachey, 1999;
Pieterse, 1997; Ismail, 2000). Social support mechanisms to the elderly are eroded in case
of population displacement, social mobility and economic decline. The disruption of these
important social support systems is likely to have unfavourable impact on the ability of the
elderly to cope, as well as affecting their ability to meet their nutritional needs.
Unlike children and mother for whom many programmes are designed to tackle their
problems in order to control for their vulnerability, very little has been done for the elderly
population. Organisations working in emergency and conflict situations do not consider the
special food requirements of the elderly. Moreover information on this category of people is
scarce. This needs to be reassessed and updated.
2

1. 2 Statement of the problem
The elderly population in Kenya is projected to increase in the next twenty years. Yet most
programmes designed to assess nutrition situations are often targeting children and women.
The survey on the elderly population conducted in Nairobi in 1988 (Ethangatta, 1988)
showed that the prevalence o f malnutrition among males was 39% and 17% among females
and about 63.6% were anaemia cases.
Despite their poor nutrition and health status, the elderly are victims of social
discrimination. The traditional support that existed in Africa is being diminished because of
changing lifestyle and socio-economic crisis in developing countries. After retirement age at
55 years in Kenya, the elderly realize that their saving might not be enough to secure their
living. Matters are made worse because as in many sub-Saharan countries, Kenya is facing
drought and tribal clashes. In some areas, the population can totally depend on food aid.
Yet no nutritional assessment has been carried out in Baringo district for the age category of
the elderly and no nutritional intervention focuses on them.
When the young adults go to look for new pasture, or to urban center for employment, or
after death from clashes or AIDS, the old people are left behind taking care of younger
children.
Social disintegration, economic problems, natural calamities and man-made conflicts may
not only affect nutritional status but also the life expectancy of the elders. There is little
effort to develop/implement intervention programmes for the elderly.
3
Some institutions, churches have taken up tasks of improving support required to some
extent to the elderly population (e.g. Help Age International). Those charity organizations
mostly operate in urban centers and rely more on external funding.
In rural areas such as Baringo, there was no specific program designed for the elderly during
the drought period (of no rain for the last past three years). International organizations and
NGOs operating in the area do not have any targeted intervention including the elderly. The
elderly receive general ration as the younger adult. Given the severity of the drought, the
loss of animals, absence o f farming, tribal clashes make them more vulnerable to
malnutrition.
This study is devoted to assess the nutritional status and the risk factors to nutritional
vulnerability and hopefully will help to create awareness towards improving health and
welfare of the elderly in emergencies.
1.3 Justification of the study.
While older people are commonly accepted as being a vulnerable group, at present, very
little is done to meet their particular needs, or to recognize their unique capacities and
contribution. Interventions often ignore special needs o f the elderly. The interventions
discriminate against and on occasion, undermine their capacity to support themselves (Help
age International, 1999). Though agencies have spent significant resources in developing
and improving best practice protocols for emergency nutrition intervention for children, it is
4

widely recognized that significant gaps exist in knowledge skills and capacity of the
humanitarian agencies to respond to the nutritional needs o f older people.
Health services in Kenya have not been tailored to the needs of the elderly due to lack of
data on the needs demands and problems of the elderly.
1. 4 Objectives
The general objective was to determine the factors affecting the nutritional status of the
Tugen and the Pokot elderly in drought situation in Baringo district.
Specific objectives were:
1. To determine socio-demographic characteristic of families of the elderly.
2. To determine socio-economic characteristics of the household members including
the elderly person.
3. To determine types of support systems in the community
4. To assess the dietary intake of the elderly persons.
5. To assess the nutritional status of the elderly.
1. 5. Hypotheses
1. There is no association between household income and nutritional status o f the elderly
population.
2. Food intake patterns do not affect nutritional status of the elderly population in Baringo
district.5

1.7 Expected benefit of the study
The findings will hopefully, help improve the subject's welfare. It will also encourage the
humanitarian agencies and relevant institutions to respond more effectively to nutritional
needs o f older people affected by emergency situation and take up the tasks of providing
adequate food and other form of support that may be required by the elderly people who
have no one to take care of them in the community.
6

CHAPTER TWO: LITERATURE REVIEW
2.1 Definition of the elderly
There is no clear defined classification of those who belong in the elderly group. Some
authors stated that the elderly, the old, and the aged are relative terms without clear
definition while others refer to the retirement age for classification. According to Staveren
et al, (1994), the society and tradition have provided an arbitrary age of 65 years as a
demarcation between middle age and old age that has no basis in the study of human ageing
processes. Further, Staveren et al (1994) explains how this lower limit was set by Otto Von
Bismarck (who died at the age of 83) in 1898; decided that this was the age appropriate for
retirement. At that time life expectancy of a European aged 65 was seven years but
nowadays it is more than 14 years. The upper limit o f 75-80 years is often considered
because until recently the proportion of population aged more than 80 years was very small
and tends to get more handicaps, which make it difficult to participate in nutrition survey.
In some studies carried out in India, in Malawi and Tanzania refugee camps, and America
the age considered by different authors was from 50 years and over (Pieterse, 1997; Dichter,
1992). This is not far from the Kenyan lower limit of retirement age, which is 55 years.
7

2.2 Overview of the ageing process
Demographically, the elderly are not a homogenous group. They have different preferences
and practices given their respective lifetime experiences, food habit, physical and
psychological stress, and health status that have an effect on the nutritional status.
Major determinants of life setting for the elderly are as followed: Age, motivation,
education, job skills and availability, family support, presence or absence of physical
illnesses, dementia, antisocial tendencies, ability to carry out activities of daily living (Roe,
1987).
2.2.1 Physiology and pathology of ageing
The ageing process is inherent and determined by genetic makeup such that within species
and between species there is variability in time frame of the process. Physiological process
of ageing is accompanied by immunodeficiency and loss of chemical protector mechanisms.
Changes in immune function, somatic mutation, hormonal insufficiency, irreversible
changes in structural proteins, acquired metabolic error, and free radical lipid per oxidation
reactions all contribute to ageing. The rate of ageing process is influenced by physical and
chemical environment and varies between individuals, tissues and organs. Pathological
changes of ageing occur as a result of secondary diseases of the elderly.
Factors that affect the ageing process can also be categorised as a function o f the genetic
makeup and of the environment (Roland, 1984).
8

• Genetic components determine the life expectancy o f a specie e.g. man at 70 years,
mouse at 2 years
• Biological components o f ageing process involve immune function, hormones
responsiveness, and free radical lipid per oxidation, connective tissue and cellular
ageing.
o Immune function. With ageing, there is decrease in cellular immune function
rather than humoral immunity that decrease the ability to distinguish self (normal
cells) from non-self (foreign or abnormal cells) resulting from cellular self
destruction “auto-immune manifestations”,
o Change in hormone responsiveness by decreased receptor concentration
o Free radical lipid peroxidation reactions occur and damage mainly in the
membrane of the cell and in organelles.
• Ageing in connective tissue: collagen and elastin undergo quantitative and qualitative
changes.
The above determinant factors of ageing process have different physiological and
psychological effects on the elderly and influence food intake.
• Physiological factors are: sensory (taste, smell, sight, hearing and touch diminish),
gastro-intestinal (reduced secretion, dental problems), metabolic (glucose tolerance
deteriorates), cardiovascular and renal.
• Psychological factors are: sense of loss (depression), poverty, and social isolation.
9

2. 3 Nutritional requirements of older people
Elderly people have particular nutrient needs related to their process of ageing in specific
situation, just as a child has particular needs related to individual process of growth (Roland,
1984). Unfortunately, nutrient requirements for the elderly people have not yet been well
explored and need more investigations. Earlier and recent studies are controversial about it
(Eschleman, 1984). The reason is that, earlier guidelines have been developed by
extrapolating the requirements of the young adult to the process of ageing. Given their
heterogeneity, no general statement can be made about the elderly and each of them is an
individual person. For the sake of nutrition adequacy, the diet must be built around baby
food i.e. with high nutrient density and moisture content. Macronutrient intake does not
change except energy requirement due to decline of basal metabolic rate.
2.3.1 Energy
Energy needs vary with age, sex, body size, activity, and environmental factors. It is
supposed that energy requirements will be relatively lower for older people compared to
younger adults as a result of decreased physical activity and decreased basal metabolism due
to higher relatively less lean body mass (Debny, 1977). However the energy-producing
nutrients needs in the elderly remain poorly defined in quantitative terms (Young, 1985).
2.3.2 Proteins:
Different studies on the quantitative requirements of proteins have been made on the
elderly. Some found that the elderly need more proteins than the young adult set at a10
minimum of 0.7 g protein /kg (Kountz et al., 1997) while others found that the requirements
were similar to those of the young adult (Roberts et al., 1948). The recommended daily
allowance for proteins is estimated at lg per kg of body weight per day (Eschleman, 1984).
2.3.3 Minerals and vitamins
The role of micronutrients in the ageing process is very important to sustain, maintain or
cope with different physiological and metabolic changes that often happen. Unlike energy,
micronutrient requirements are higher for the elderly person than it is for the young adult
(Rusell and Suter, 1993; Wood, 1995). Calcium and iron protect against osteoporosis and
osteomalacia, anaemia and periodontal disease.
Calcium: Despite evidence to show that calcium has a positive effect on maintenance of
bone health and prevention of osteopathic fractures, the data on effectiveness of calcium
supplements for older people remains unanswered (Prentice, 1998). It has been
demonstrated that calcium intervention is relatively more important during adolescence
rather than during inter stages of life (Murray, 1996) and that physical activity during later
years can also prevent to some extent the loss of bone mineral in older people. Moreover, it
has shown that there is an age related decrease in absorption of calcium (Wood, 1995).
Calcium supplements do have a positive effect in preventing mineral loss especially among
those with habitually low intakes o f calcium (Prentice, 1998; Murray, 1996) and that there is
no great risk associate with taking supplements (Blumberg, 1994).
11

Iron: Research on levels of iron requirement for older people remains uncertain. Older
women require lower iron in comparison to younger women. However, counter arguments
to a lower requirement of iron suggest that in older people the body tends to store excess
amounts of iron (Wood, 1995) and that high iron intakes may actually increase the levels of
free radicals. However, reduced gastric activity (associated with older people) may result in
less effective absorption of non-haeme iron (from vegetable source) and hence increased
iron intakes in older people may be required in some cases. A study carried out in India
showed that the prevalence o f anemia which increased with age, was high (about) 71%
among older women as compared with 38% among older men
Other trace minerals: Given the vital role in metabolic regulation and the action against the
gamut o f chronic diseases such as heart disease, osteoporosis, cancer, the trace elements
cannot be ignored in the elderly diet (Dichter, 1992). Selenium, magnesium, zinc, cobalt are
commonly needed (Tolonen, 1990).
Vitamins:
Studies on vitamin requirement have shown that the requirements for vitamins are higher
than those for the young adult. Several focus are made on antioxidant vitamins (A, C, E),
carotenoids, non-nutritive food constituents (flavonoids, indols) and other vitamins (Bl, B2,
B6, B9, B12). There are many factors causing an increase in requirements and in some
cases, micronutrient deficiencies among older people. These are: the decreased actual
energy intakes, the lower intakes of nutrient food, the reduced gastric acid activity absolute
increase, the lower secretion of intrinsic factor, the chronic disease and gastro-intestinal
bleeding (Russell, 1993; Wood, 1995).
12

Vitamin A: Requirements may be lower than the younger persons. This is due to decreased
absorption through the intestinal luminal epithelial tissue as well as a decreased liver uptake
characteristic in older people (Hopper, 1968; Ismail & Manandhar, 1999; Underwood, 1970;
Blumberg, 1994). With all age groups, older people with poor nutritional status will be
deficient in vitamin A. Anti-oxidant properties of vitamin A are important for older people
suffering from chronic diseases (Richard, 1999; Herbert. V, 1998). Therefore maintaining
similar intakes o f vitamin A (as for younger adults) may still be important.
Vitamin D: increased requirement RDAs for older people are due to the fact that::
1. A general lack of exposure to the sun for example, because older people are house
bound reduces the kidney capacity to convert vitamin D to its active form.
2. A reduced capacity of the skin to synthesize vitamin D
3. A reduced capacity of the kidney to convert it to its active form (Ganny, 1982; Russel
and Suter, 1993).
Comparative studies of older people carried out by (2q2Kane et al 1980) found that there is
a wide range o f physical capacity and functional ability independent o f culture in
industrialized society. In each of the several countries studied, it was found that 2.4% of
elderly are bed ridden; the number of those who are house bound varies from 12-24%.
Vitamin B group:
The requirements of vitamin B2 are the same as for the younger adult. It is tied to the
metabolism of energy expenditure. Deficiency has been associated with oesophageal cancer
of the elderly people.
13

Vitamin B6 requirements are higher with increasing age. Its deficiency in older people
results in decreased immune function and increased susceptibility to infections. Vitamin B6
is required for maintaining glucose tolerance and normal cognitive function. In older person
where glucose tolerance increases (Blumberg, 1994), there is possible increase in
requirement of vitamin B6 for older person. Vitamin B6 is also important in metabolism of
vitamin B12 and folate, which provide protection against elevation in homocystein, an
independent risk factor for cardio-vascular disease and depression (Garry, 1996; Blumberg,
1994 and Tucker, 1999). Due to a reduction of the secretion of hydrochloric acid and a
reduced activity o f intrinsic factor, there is a reduced capacity to absorb vitamin B12 in
older people; therefore the requirement for vitamin B12 may also need to be increased
(Blumberg, 1994; Allen and Casterline, 1994 and Herbert, 1998). The reduced actual form
of folate tetrahydrofolate (THF) is B12 dependent, and hence a deficiency in vitamin B12
can result in a secondary folate deficiency (Quinn and Basu, 1996; Tucker, 1999; Boisvert
etal., 1993 and Charlton, 1997) in older people.
2.3. 4 Fluid Intake
Water is a component of most body cell and cellular environments, essential to maintain
body functions. Water intake is provided by fluid intakes, semi-solid and solids foods
containing water and by metabolic processes, which produce water. At least 1.5 litres of
water is needed per day.
14
2.3.5 Dietary fibre
Dietary fibre is not a nutrient but a substance that helps digestion process and absorption of
nutrients. It prevents constipation and other diseases of the bowel. The major sources for
fiber are fruits, vegetables and whole -grain.
2.4 Assessment of nutritional status of the elderly
2.4.1 Anthropometric measurements
The assessment o f nutritional status through anthropometry can be made by measuring the
weight, the height, the arm span or half span (if height cannot be measured or will not be
accurate) and Mid-Upper arm Circumference (MUAC).
For individual assessment and monitoring or for monitoring and evaluation of interventions,
weight and height (or Arm span or Half span) are preferred measures. MU AC is used for
screening or in case it is not possible to measure other parameters (Ismail, 1999).
Then weight and height (Arm span or Half span) are converted into body mass index (BMI)
that is the nutritional index for adults. BMI is a measure of chronic energy deficiency in
adults. BMI>=18.5 are usually taken as an indication o f normal nutritional status. BMI
between 17.0 and 18.4 is taken as a measurement of mild chronic energy deficiency. BMI
between 16 and 16.9 is taken as a measurement of severe chronic energy deficiency. BMI
<16 is taken as a measurement of severe chronic energy deficiency. (Collins, 2000). In
general a BMI less than 16 kg/m2 is considered as severe malnutrition while a BMI less than
15
18.5kg/m is considered as global malnutrition (i.e. both moderate and severe malnutrition)
(Pieterse, 1997).
- Weight is measured using an electronic scale with digital display or an upright beam
balance scale or mechanical scale, with a precision of 100 grams.
- Height is measured using stadiometer or solid board (scaled in centimetres) with sliding
head piece or alternatively using a measurement tape in centimetres, fixed to a wall or
door post, ruler or wood as head piece.
- Arm span and Half span The anthropometric measurements of “the distance from tip
of the middle finger of the left arm to the tip of the middle finger of the right arm with
the arms stretched out”. Arm span can be a useful proxy for height, especially for older
people whose ability to stand straight is affected by spinal disease. This measurement is
converted to an estimate of height using correction factors specific to the population.
They are also measured when the person’s back is bent and he/she cannot stand straight;
or when the person cannot straighten his/her legs. Steel or fiberglass measuring tapes (in
cm) with metal tip for placing at ends of fingers are recommended or alternatively non
stretch fabric or plastic measuring tapes in centimetres can be used.
- MUAC. Often used for screening purposes in emergency situation where people are
assessed quickly and with few resources. The recommended equipment is a steel or
fiberglass measuring tape (in cm) with metal tip for placing it at ends of fingers or
alternatively a non-stretch fabric or plastic measuring tape in centimeters. In this study,
MUAC (Castaneda et al 1997) was used as the index for assessing a cute malnutrition in
older people based on the following reasons: The study population was drawn from parts
of Baringo district that was experiencing drought then. MUAC is quicker and easier than
BMI measurement, it requires less sophiscated equipment, it involves no calculation and
16

can be used on people with kypphosis (Pieterse 1998), However, given that there
continues to be considerable debate over the appropriateness of BMI versus MUAC and
a continuing lack of information on cut-off points for increased risk of mortality, it is
recommended that while MUAC (In conjunction with clinical criteria) be used for
purposes of admission, measurements of weight and height(or arm-span) are collected
for purposes o f operational research.
2. 4. 2 Food intake
Information on food intake can be collected through diet history, food frequency and
amount questionnaire or the 24-hour recall. The method to be used must consider that the
elderly usually have memory lapse to recall events passed a long time ago (Me Dowell,
1985). Food habits and food preferences that vary among the elderly lead to malnutrition. In
a comparative study of food sources of nutrients in diets of elderly in Italy and the US,
Friedman.P.(1991) found that both populations had white bread as their first source of
energy but with much preponderance of vegetable and less processed food in Italy than in
the US.
2. 5 Factors affecting the nutritional status of elderly
Studies have shown that older people have a set of characteristics that make them a
vulnerable group in terms of nutritional status. First, organ functions and metabolic
parameters decrease progressively with age, secondly a number of chronic degenerative
condition e.g. arteriosclerosis increase infrequently as age advances. Factors that determine17

food intake are first those found in the young adult. Secondly the appetite can be altered by
physiological or psychological problems, which may be associated with acute or chronic
disease, as the age increases, loss of sense of taste and smell, problem of dental status and
swallowing. Another important factor in the elderly nutrition is the effect o f drugs. The
elderly are known to be chief users o f drug and special diet. Drugs can interfere in the
absorption of nutrient or simply cause anorexia or nausea, which would reduce the quantity
of food eaten (Eschleman, 1984).
Risk factors to nutritional vulnerability are given in Figure 1. Under normal conditions,
older people are at increased risk of becoming malnourished in comparison to some other
population groups. Some of these risk factors are summarized in figure 1 below .At an
individual level, it is essential to understand why an older people/person or group ol older
people person is malnourished or is at risk of becoming malnourished i.e. the causes of
malnutrition (HelpAge International, 1999). Not all the risk factors will apply equally to all
older people/persons, different risk factors may be linked and will have a synergistic effect
and, the presence o f risk factors does not necessarily lead to malnutrition .In essence, risk
factors are often situation -and individual specific. For the purposes of intervention at a
population level in emergency situations in this case drought, it is necessary to examine risk
factors at household and community level. Some of these underlying causes (at household
and community level) and basic causes (at a population level), which may influence older
people’s vulnerability as discussed. In particular, it is the external changes that affect the
household and community, as “caring units” that should be the focus in considering the
likelihood of increased vulnerability for older persons. The figure below, illustrates some of
18

the potential causes of malnutrition in older people in emergencies .The extent to which
each factor contributes to an increased risk will differ in different emergency situations.

Figure 1.
Functional ability Family life• Needs help with feeding • Living alone• Poor strength • Looking after• Poor manual dexterity grandchildren• Poor coordination • Adult children far away
VDisability• Physical disability• Recent injury• Poor eyesight• Poor mobility• Housebound• Lack of exposure
to sunlight
Poverty• Poverty /low
income• Low budget for
food• No control over
household money• Not enough land to
grow food• Debt• Unemployment/
unable to work
C=>
FOOD INTAKEUnable to acquire /preparesufficient foodPoor nutrition knowledgeLack of fruits and vegetablesFood wastage/rejectionMissed meals, snacks, drinksGives food away to othersGiven less/worse food than othersPoor appetitePrefers other foodsOften eats aloneDental problems or problemschewing
v
<=>
• ; , ' p '
C
POOR DIET
Psychological/emotional
• Death of a loved one
• Witnessed traumatic events
• Depression• In unknown
/newcommunity
• Mental illness• Memory
loss/confusion• Loneliness
Health• No health care• Disease• Drug use• Alcoholism• Smoking
POOR NUTRITIONAL STATUS
Risk factors for nutritional vulnerability in older population: source Ismail&manadhar, 1996

2. 6. Changes in the external and social environment in
emergency situation
Changes that are likely to affect the elderly in emergency situations include stressful events
for example displacement, loss or livelihood or death of family members and many others
(Howe, 1981). Loneliness is a common phenomenon amongst the elderly in emergency
situation.
During crisis situation, older people in emergency situation are always in reduced financial
circumstances particularly the disabled ones (Briggs, 1984). There is also general
breakdown of normal support structures within the communities. The disruption or loss of
support structures as a result o f conflict, severe food shortages and loss of livelihoods will
have negative impact on the older people’s ability to access the food. Once these structures
are broken down, the community capacity to care for and prioritize its most vulnerable
members such as the elderly may no longer be adequate (WHO, 1988).
Family separation that occurs when the population flee or travel for large distances may
result in older people experiencing dramatic changes to their normal practice of food
production. Social responsibilities of older people may also change e. g. older people care
for younger children once the stronger population groups have left in search of food,
employment or pasture (WHO, 1988).
21

2. 7 Food processing and preparation
Not only are whole grain cereals and beans difficult to digest for older people but these
foods are relatively more difficult to prepare. Foods that are not precooked or are in whole
grain form will often require substantially longer time. A lack of access to fuel, water,
cooking material and medical facilities will aggravate the situation for many of the older
people, especially those living alone (Howe, 1981). In many emergency situations, resource
such as fuel and water are limited and older people may consequently be unable to prepare
their food.
2. 8 Access to food through coping mechanisms
Food is usually accessed through mechanism such as informal trade and labour, fishing,
labour activities in exchange for food and others. People often do not experience the same
opportunity as those of younger adults. Therefore, wrhile those households with active
members will attain adequate food for household, older people living alone will often
remain or become increasingly food insecure. For example in the recent drought 2000 in
Baringo, the older members living alone may be more vulnerable since they might be less
able to adopt to knew means of livelihood.

CHAPTER THREE: METHODOLOGY
3. 1 STUDY SETTING
3.1.1 AREA OF STUDY
Baringo district is one of the fourteen districts in Rift Valley province. It covers an area of
10.949 km and lies between 35°30 and 36°30 longitudes East and between 0°10 South and
1°40 north latitudes. It borders Turkana and Samburu districts in the north, Laikipia at the
East, Nakuru and Kericho in the south and Uasin Gishu, Elgeyo Marakwet and West Pokot
at the west. Topographically, the district can be divided into: river valleys and plains, the
Tugen hills, the floor of the rift valley and the northern plateau. The Tugen Hills mainly
consist o f volcanic rocks and have escarpments on the east and west. Their altitudes vary
from 300 to 100 metres above the sea level.
Baringo district is one of the arid and the semi-arid districts in the country (UNICEF-
KCO&UNDP, 1996). The rainfall, reliable at 50% varies from 1000 to 1500 mm in the high
lands to 600 mm in the northeastern part of the district.
The main staples during drought period are maize, beans, millet and cassava. Livestock
activities include herding (of cows, goats, sheep and camel) and poultry keeping.
23

3.1.2 POPULATION COMPOSITION
The district is divided into twelve divisions with a total population o f 347, 990
(172,847 males and 175.143 females). The population density is 32 persons per square
kilometre.
Baringo district is cosmopolitan with the Pokots, the Njemps and the Tugen ethnic groups.
Table below indicates divisions of Baringo district, approximate area size, population and
rank of severity of drought.
and Rank on drought.
Division Area (km 2 )Approximate
populationRank on drought*
Sacho 16,353 3
Nginyang 3,253 25,992 1
Tenges 373 14,960 3
Marigat 1,346 48,642 3
Kipsaraman 36,262 3
Tangulbei 995 18,251 1
Kabartonjo 1,868 47,748 4
Muchongoi 315 5,737 4
Kolowa 18,389 1
Kabamet 619 72,208 4
Barwesa 35,679 2
Source: Unicef-KCO and UNDP compiled by ANP(1996)
* Rank on drought: 1-4 = from the least to the most severely affected.
24

3. 1. 3 INFRASTRUCTURE AND SOCIAL SERVICES FACILITIES
A total of two hospitals, 11 health centres and 61 dispensaries were registered in the
Baringo district. Several non-governmental organizations and churches work with the
communities for different programs aimed at welfare improvement. Among them are the
Kenya Freedom from Hunger Council (KFFHC), World Vision International, and the
Catholic mission, Kipsaraman Integrated Development, Morop Christian Children’s Fund
and Christian Children’s Fund.
3. 2 RESEARCH METHODOLOGY
3. 2.1 STUDY DESIGN
The study was cross-sectional in nature. Its major aim was to assess nutritional status of the
elderly population. A pre-tested questionnaire with pre-coded and a few open-ended
questions, was used to collect the data from the two populations. Trained enumerators
administered the questionnaire. The elderly aged more than 55 was the targeted respondent.
3.2. 2 METHOD OF SAMPLING
3.2.2.1 Sample size determination
The sample size o f the study was computed using the formula for cross-sectional survey
(Fisher et al., 1986) for population more than 10000. To calculate the sample size, the
prevalence rate of malnutrition from the Turkana nutrition and socio-economic assessment25

(Busolo. D, 2001) o f the older people that indicated global malnutrition rates of 20.5% was
used.
Where:
n = the desired sample size in each o f the groups (each group with equal sample size)
z = Standard normal deviation, set at 1.96 which corresponds to 95% confidence,
p = Prevalence of malnutrition among the elderly population estimated to be 20%
q = l-p= that is the proportion of well nourished in the elderly population = 80%
d = Degree of desired accuracy set at 0.05 or maximum error (5%) for 95% confidence
interval.
Therefore; n = l .9 6 2 x 0.2 x 0 .8 /0 .0 5 2= 246
Sample size was estimated to be 250 elders.
3.2.2.2 Sampling Procedure
The sampling procedure used in selecting study samples is shown in Figure 2. The study
population from the two communities (ethnic groups) was purposively selected from two
divisions namely: Barwesa and Kollowa, where ten locations were selected.
Selection of household within location
The field assistants went to the center of the selected location. Direction was chosen
randomly by spinning a bottle on the ground noting the direction in which it points. The
direction of the bottle indicated the direction where the field assistant was supposed to go to
26

select the first household. Due to the big geographical area, it was difficult to mark the
center to the periphery o f the location by counting all households in the selected direction.
Rather a random number was chosen between one and five to select the first household
among the five households counted in the selected direction. For example if 2 was
selected, the study team went to the second household along the randomly chosen direction
and examined all the elderly belonging to the household.
After the first household had been surveyed the team went to the next nearest house, same
direction as was selected earlier. At the location boundary the team moved to the next house
on the left hand side within the boundary of the location following the nearest household
pattern until the required number had been interviewed.
When choosing nearest house within the location, we decided during the training to follow
left hand through out. There were no elements of deliberate choice or bias by the team in
selecting the sample houses. All elderly 55 years and over belonging to each selected
household were included in the study.
27

Figure 2:
DistrictBARINGO DISTRICT
Purpose Sampling \ - ~
DivisionBARWESA KOLLOWA
Random sam p lin g ----- 1-----
jc a tin n
n -
Barwesa Kanoo Kaptilomwo Barbelo Tilingwa Ngoron Angoriatiang
30 30 30 40 40 40 40
Flow chart showing the sampling procedure
3. 2. 3 RESEARCH INSTRUMENTS
The study used a semi-structured questionnaire, which had two parts. The first part dealt
with quantitative data. The second part dealt with qualitative information. The quantitative
data included demographic and socio-economic information, 24-hour recall of all food items
consumed in the household and anthropometric measures (Appendix 1).
Different sections used in the questionnaire were.
1. Socio-demographic and socio-economic section: This consisted of identification of
household members (their age, sex, education level, occupation and money28
contribution to household finance), source of income, animal owned and died within
the 12 last months.
2. Social support system: this section has information on type of support received, food
aid (ration), quantity of food received, source of food consumed, and preparedness to
drought event.
3. Dental status: Type of dental infections, chewing problems.
4. 24-hour recall: Information sought was time food was eaten, name of ingredients,
and amount o f ingredients in family meal and amount consumed by the old person.
5. Anthropometric measurements: the anthropometric data of the elderly taken were
weight, height and mid-upper arm circumference (MUAC)
3. 2. 4 IMPLEMENTATION OF RESEARCH ACTIVITIES
3. 2. 4. 1 Training of field assistants and pre-testing of questionnaires
Four enumerators were recruited and trained. All of them had secondary school education
and had knowledge o f the study community language.
The researcher trained the assistants for four days. The training covered the study
objectives, the survey instruments and interviewing techniques. Training was done on how
to address and approach subjects in a culturally acceptable manner.
Pre-testing was done in 15 households in which data was collected and analysed before the
major data collection. Minor changes on the structure of the questionnaire were made,
where necessary. These questionnaires were not included in the final analysis. The pre
testing was also taken as an opportunity to retrain the field assistants.
29

3. 2. 4. 2 Data collection
Socio-demographic and socio-economic characteristics
Socio-demographic and socio-economic data were collected from the selected households
during the first visit to the households.
Dietary intake
For 24-hours recall, respondents were asked to indicate the amount of all ingredients used to
prepare the meals. This was done using household measures and food models collected
during the pre-testing phase. Detailed description of all meals and the ingredients were
recorded using the proper section designed for that in the questionnaire (Appendix 1).
Household measures o f each ingredient were converted into grams and/or milliliters. Fluid
measuring cylinders graduated in milliliters of capacity 1000ML, 500MLand 100ML were
used measure cooked and raw food items. Volumes were converted into grams using the
food conversion factors produced by FAO before software computation into nutrients.
Anthropometric measurements
Anthropometric measurements were taken using adult weighing scales for weight and adult
tape measures for arm span or half span. MUAC tapes were also used to measure the Mid
Upper Arm Circumference.
30

3 .2 .5 DATA QUALITY CONTROL
Procedure used to ensure quality data was collected included caretul training of
interviewers, close supervision of the field assistants during the actual survey, and daily
check by the rese4archer for consistency, completeness and clarity of the completed
questionnaire.
3. 2. 6 DATA PROCESSING AND ANALYSIS
Data processing and analysis involved the following packages:
a) Nutrition survey software (Update 2000) was used for data entry, plausibility check of
data, data cleaning and for conversion of raw data o f 24-hours recall food intake to
nutrients and to assess the fulfillment of requirements. The Kenya food database was
selected as a reference for nutrient composition of foods.
b) The statistical package for social scientists (SPSS, version 8.0) was mainly used for data
analysis. Descriptive statistics, comparison between means and proportions of
c) Different variables affecting the nutritional situation in households were done by
assessing the significance levels at 0.05 of chi-square test, student t-test. Odd-ratios were
applied to test for the risk of malnutrition due to different nutritional vulnerability
factors.
d) Graphs were plotted using SPSS program and Excel.
31

CHAPTER FOUR: RESULTS
4.1 Socio-demographic characteristics of the study population
Population composition. ase and sender o f the Elderly
The study sample involved 250 households of the elderly with a total population of 795
from two communities, Tugens of Barwesa division and Pokots of Kolowa division. The
male population was lower (Tugen 47% and Pokot 49.5%) than female (Tugen 53% and
Pokots 50.5%) but there was no significant difference between the two sexes (Table 2). Of
250 respondents with a distribution of males and females of 42.4% and 57.6 % respectively,
about a third (36%) were Tugens and the rest (64%) were Pokots.
Table 2 Distribution o f the elderly population by general socio-demographic characteristicsCharacteristic Area
Total TestTugen Pokot
Total population N % N % N % X P
' Male 110 47.0% 277 49.4% 387 48.7%
Female 124 53.0% 284 50.6% 408 51.3%
Total 234 29.4% 561 70.6% 795 100% 0.28 0.586
Elderly population
Male 35 38.9% 71 44.4% 106 42.4%
Female 55 61.1% 89 55.6% 144 57.6%
Total 90 36% 160 64% 250 100% 0.71 0.113
Marital status (elderly)
Married 23 25.6% 97 60.6% 120 48.0% 28.38 0.000
Single 3 3.3% 6 3.8% 9 3.6% 0.57 0.451
Separated 18 20.0% 11 6.9% 29 11.6% 12.26 0.005
Widowed 46 51.1% 46 28.8% 92 36.8% 33.3 0.000
32

The ratio of male to female was not significantly different both for the whole population and
between the two populations. There were more Pokot elderly married (above two thirds
60.6%) than there were among Tugen (slightly more than a quarter 25.6%). There were
significantly more widowed Tugen elderly (slightly more than a half 51.1%) than there were
Pokot elderly (slightly more than a quarter 28.8 %). Overall, slightly there were more than a
third (36.8%) widowed.
For both Tugens and Pokots, the mean age of the elderly population is the same
approximately 73 years as shown in Table 3.
Table 3: Distribution of the elderly population bv age and household size and by division
Age and household size
AreaTotal Test
Tugen Pokot
Mean ±SD Mean ±SD Mean ±SD t-test P
Age of elderly population 73.1±9 73.2±9.8 73.1 ±9.5 -0.092 0.952
Age household member 42±29.1 33.6±28.9 36.1±29.2 -0.097 0.970
Household size 3.9±2.3 2.6±1.3 3.4±2.1 -4.848 0.000
The general population had a mean age of 36 ±29 years. Pokot population (34± 29 years)
was significantly younger than Tugen (42 ±29 years) (p<0.01). The household size for the
whole population was 3 persons; this was significantly smaller for Pokot (3 persons) than
for Tugen (4 persons) (p <0.01).
33

Figure 3: Distribution o f the population in elderly households by age categories
Tugens Pokot Total
________________ Ethnic group_______________
■ Under five d 6-15 years □ 16-55 d Over 55
Dependency ratio (= population aged < 1 5 years + population aged >55 years / population
aged 15 to 55 years), was 3.44 for the total population (Table 2). The population whose age
was over 55 years represented in slightly more than a third (36%) while those whose age
was 15 years and below were 41.5%
Households where lived elderly people had less than a quarter (22.5%) of reproductive age
population with as low as 2.4% of active population for Pokots and 25.2% for Tugens. The
proportion of the elderly living alone was 18.8%. It did not differ significantly between the
two communities (p >0.05).
34

Table 4: Age group repartition of the total population and dependency ratios in households where lived the
elderly.
Tugen Pokot Total
Age group N=234 N= 561 N=795
N % N % n %
Under five 4 1.7 44 7.8 48 6.0
6-15 years 70 29.9 212 37.8 282 35.5
16-55 years 59 25.2 120 21.4 179 22.5
Over 55 years 101 43.2 185 33 179 36.0
Dependency ratio 3.0 3.7 3.4
The distribution o f male and female elders among different age categories was not
significantly different (p>0.05). However female were in higher proportion for the category
of age below 76 years and above 85 years than were male (Table 5).
Table 5: Distribution of the elderly households bv age category and by sex.
Age g ro u p s P
Age and sex of the <65 years 65-75 years 76-85 years >85 years
elderly N=51 N=95 N=71 N=33
Sex Male 20 (39.2%) 36 (37.9%) 36 (50.7%) 14 (42.4%)
Female 31 (60.8%) 59 (62.1%) 35 (49.3%) 19(57.6%) 0.39 l a
Mean age 61.39 ±1.6 69.4 ±2.5 78.76 ±2.1 89.97±1.6 0.000b
3 significance level based on y2 chi-square test b: significance level based on t-test
LlQRAay
35

Education level o f Pokot and Tueen elderly population
Table 6 indicates education levels of the elderly population. The elderly population had low
level of education with about 98.6% who did not attend school (especially all Tugen elders
and 97.8% of Pokots). Pokot elders were more educated than the Tugens (pO.OOl).
Table 6 Education levels of elderly Pokots and Tugens
Characteristic Tugen Pokots Total
N % N % N % x2 P
Education level
Completed primary - - 2 1.1 2 0.7
Adult education - - 2 1.1 2 0.7
Not attended school 101 100 181 97.8 282 98.6 8.57 0.004
4. 2 Socio-economic characteristics of the study population
The main occupations in the two communities were herding, casual works and domestic
activities (Table 7). The type of occupations differed significantly (p < 0.01) between the
Pokots and the Tugens. The latter had close to three quarters (70.3%) without any
occupation, 14.9% were in herding and domestic services. Among the Pokots, more than
half (58.9%) were herding, slightly more than quarter (29.2%) did casual work or had no
occupation.
The major source o f income was the sale of animals for close to two thirds of the total
population (60.8%). About one quarter (23.2%) relied on gift from relatives, 16 % had no36

income source and the rest had other sources or farming. Slightly more than three quarters
(76.4%) owned animals distributed as follows: about three quarters (73.2%) owned goats
and sheep, about half (52%) had cows, 3.6%, 2.4% chicken, donkeys and camels
respectively. The mean numbers of animals owned were respectively 3 cows, 8 goats and
sheep and one or less for chicken, camels and donkeys. Animals, which had died in the past
twelve months, were on average respectively 10 cows, 14 goats and sheep, and one or less
for chicken, camels and donkeys.
Table 7: Occupation and source of income of the elderly Pokot and Tugen population.
Occupation and
source of incomeCommunity Total
N % / 2 test POccupation Tugen
N % N
Pokot
%
Domestic services 15 14.9 22 11.9 37 12.9 0.39 0.530
Herding 15 14.9 109 58.9 124 43.4 61.01 0.001
None/casual labour 71 70.3 54 29.2 125 43.7 45.02 0.001
Source of income
Sale of animals 34 37.8 118 73.8 152 60.8 22.43 0.000
No income source 20 22.2 20 12.5 40 16.0 6.00 0.015
Gifts 36 40.0 22 13.8 58 23.2 28.42 0.000
Pokot people relied significantly (p<0.001) on sales of animals (73.8%) than the Tugen
(37.8%) who instead depended mostly , about half o f the population, on gifts from relatives
(40%) while close to a quarter (22.2%) had no source of income compared with only 13.8%
and 12.5% respectively for the Pokots.
37
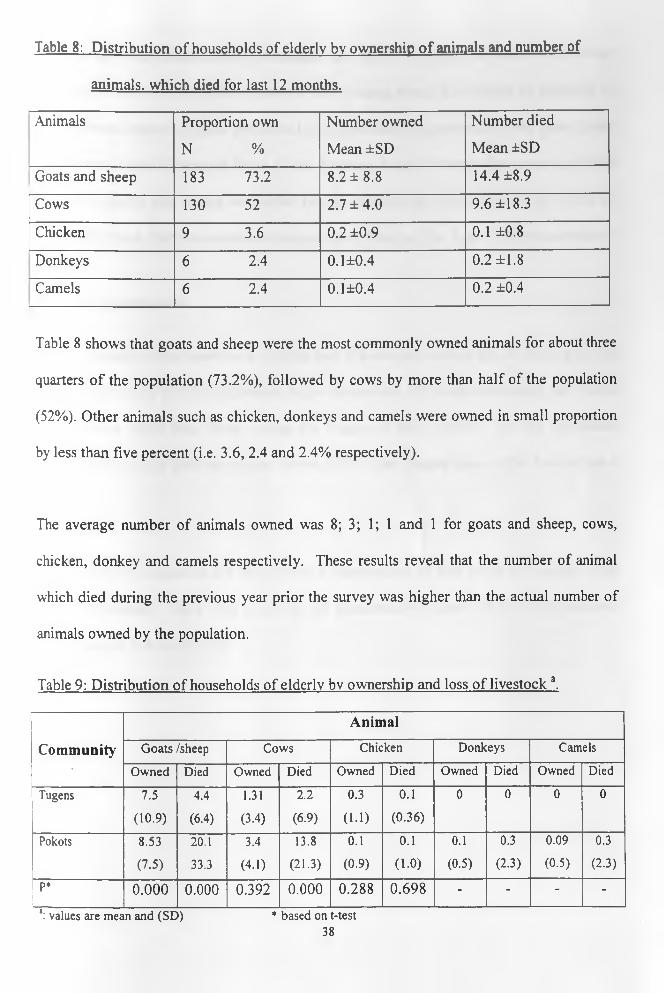
Table 8: Distribution of households of elderly bv ownership o f animals and number of
animals, which died for last 12 months.
Animals Proportion own
N %
Number owned
Mean ±SD
Number died
Mean ±SD
Goats and sheep 183 73.2 8.2 ±8.8 14.4 ±8.9
Cows 130 52 2.7 ±4 .0 9.6 ±18.3
Chicken 9 3.6 0.2 ±0.9 0.1 ±0.8
Donkeys 6 2.4 0.1±0.4 0.2 ±1.8
Camels 6 2.4 0.1±0.4 0.2 ±0.4
Table 8 shows that goats and sheep were the most commonly owned animals for about three
quarters of the population (73.2%), followed by cows by more than half of the population
(52%). Other animals such as chicken, donkeys and camels were owned in small proportion
by less than five percent (i.e. 3.6, 2.4 and 2.4% respectively).
The average number of animals owned was 8; 3; 1; 1 and 1 for goats and sheep, cows,
chicken, donkey and camels respectively. These results reveal that the number of animal
which died during the previous year prior the survey was higher than the actual number of
animals owned by the population.
Table 9: Distribution of households of elderly bv ownership and loss o f livestock a.
Animal
Community Goats /sheep Cows Chicken Donkeys Camels* Owned Died Owned Died Owned Died Owned Died Owned Died
Tugens 7.5 4.4 1.31 2.2 0.3 0.1 0 0 0 0
(10.9) (6.4) (3.4) (6.9) (1.1) (0.36)
Pokots 8.53 20.1 3.4 13.8 0.1 0.1 0.1 0.3 0.09 0.3
(7.5) 33.3 (4.1) (21.3) (0.9) (1.0) (0.5) (2.3) (0.5) (2.3)
P* 0.000 0.000 0.392 0.000 0.288 0.698 - - - -
*: values are mean and (SD) * based on t-test38

Between the two communities, ownership and loss of animals showed a significant
difference based on comparison between means using t-test. The results as indicated in
Table 9 reveal that the Tugens owned and lost significantly, respectively fewer goats (8 and
4) and cows (1 and 2) than the Pokot (9 and 20 goats; 3 and 14 cows). The mean number of
chicken owned by the Tugens was higher but not significantly different from that owned by
the elderly Pokot. Neither camels nor donkeys were found in The Tugen elderly households.
4. 3 Food consumption
About a quarter of the households (24.6%) had at least one lunch in the 48 hours prior the
survey (Table 10). Much significantly higher proportion of households among the Pokots
(19.8%) took lunch than those among the Tugens (4.8%) (p<0.01). All the population
reported they took at least one supper. About 3.3% of the Tugens (none of the Pokots) had a
snack.
The majority of population (89.4%) preferred maize as part of their ration for making Ugali
that they consume. There were more but not significantly Tugens (98.9%) who preferred
maize than for Pokots (83.4%).
39

Table 10: Distribution o f households of elderly by meals taken and food preference
Food consumption Tugens
N=90
Pokots
N= 160
Total
N=250
Statistical test
Meal n % n % n % *2 P
% Took lunch 12 4.8 49 19.8 61 24.6 9.34 0.000
% Took snack 3 3.3 0 0.0 3 1.2 2.97 0.045
% Took supper 90 100 160 100 250 100 - -
Food type preference
Maize 89 98.6 121 83.4 210 89.4 23.19 0.001
Pulses 1 1.4 106 73.6 107 36.8 97.19 0.000
Unimix 0 26 17.9 26 11.1 14.64 0.001
Oil 0 86 40.4 87 36.8 73.74 0.000
Milk 0 4 2.8 4 4.1 0.97 0.165
The average number of meals per day was one meal in general. Pokot elders had significant
(p <0.01) more number of meals per two days (about three meals) than the Tugens (about
two meals).
The number of meals varied also with trend to decrease with the actual age as shown in
Table 11. The observed proportion of population who took lunch showed a decreasing trend
with age from 31.4% in the elderly category of less than 65years to 9.4% in the Elderly
category above 95 years; but that difference was not significant (p>0.05).
40

Table 11: Distribution o f households by number and type of meals and by different age
groups.
MealsAge category of the elderly
<65 years 65-74 years 75-84 years >84 years P
Number o f meals 2.27±0.9 2.24±1.0 2.21±0.8 2.06±0.9 0.72
n % n • % n % n %
% Took snack 1 2 1 1.1 1 1.4 0 0 -
% Took lunch 16 31.4 27 28.4 15 21.4 3 9.40 0.094
% Took supper 51 100 95 100 71 100 33 100 -
The proportion of recommended daily allowances (RDAs) was for iron 75.2%, vitamin A
65.6% while that of the others was less 50%. The average energy recommended daily
allowance was about 27.8% and protein intake 22.8% using FAO/WHO recommendations.
Table 12 below shows average nutrient intakes and average percentages of fulfilment of
recommended dietary intakes.
Table 12. Average nutrient intakes of the elderly Pokots and Tugens in Baringo district.
Nutrient Intakes % of households fulfilling
RDAs
Mean ±SD %
Energy (Kcal) 543.7±171.6 27.8%
Protein (g) 13.2 ±7.1 22.8%
Fiber (g) 12.8±31.9 31.9%
Calcium (mg) 62.4±47.4 7.8%
Iron (mg) 7.6±4.5 75.3%
Zinc(mg) 2.1±2.2 16.4%
Vitamin A (ug) 547.0±255.7 65.6%
Vitamin B1 (mg) 0.3±0.3 28.3%
Vitamin B2 (mg) 0.3±1.1 13.8%
Vitamin B6 (mg) 0.2±0.2 23.4%
41

4. 4 Nutritional status of elderly population in Baringo
The nutritional status was poor with 82.4% of elderly people being malnourished. Tugen
elders reported higher proportion of underweight, about 2 times more likely to be
malnourished (OR: 2.2; 95% Cl: 1.1-4.6) compared to the Pokots. The prevalence of
malnutrition as shown by those with BMI < 18.5 was 88.9% among the Tugens and 78.8%
among Pokots (Table 13).
Table 13: Distribution of Underweight (BMI <18.5) among different age group ot the
elderly Pokots and Tugens.
Age category
Tugen-
Barwesa
N=90
Pokot-
Kolowa
N=160
Total Statistical
test
n % n % n % ■£ P
Less than 65 years 13 14.4 29 18.1 42 20.4 1.38 0.26
65-74 years 35 38.9 40 25 75 38 3.05 0.08
75-84 years 23 25.6 35 21.9 58 28.4 0.02 0.87
More than 84 years 9 10 22 13.8 31 13.2 3.95 0.29
H o rf p 80 88.9 126 78.8 206 82.4 4.08 0.04
The rate of malnutrition was high for elderly aged 65 to 74 years, but no significant
difference was found (p=0.08) as shown in Table 14. The average BMI was slightly higher
than 16.5 for the total population.
42

Table 14: Average body mass index (BMP and mid-upper arm circumference (MUAC) by
age category of the elderly in Baringo District.
Age group Body Mass Index (Mean ±SD)
Less than 65 years 16.5±2.6
65-74 years 16.8 ±2.7
75-84 years 16.8 ±2.3
More than 84 years 16.7 ±1.6
F-test 1.43
P 0.234
The Mid Upper Arm Circumference was significantly decreasing with age of the elder
(F=7.99, p = 0.002). Figure 4 shows a similar trend of MUAC for both males and females.
Meanwhile that difference was not significantly influenced by the sex of the individual. The
average MUAC was high for elderly males aged less than 65 years and those aged more
than 84 years while the same was noticed for females aged between 65 years and 84 years.
Figure 4: Change in mid upper arm circumference with age and sex
Sex— — « Male
... ....... Female
Age category of elders
43
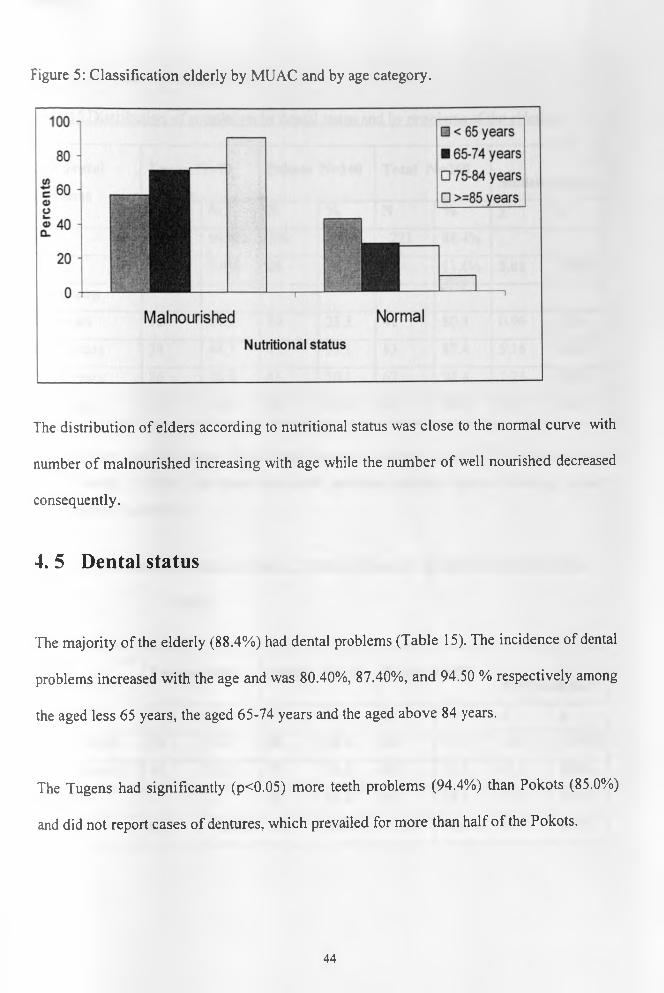
Figure 5: Classification elderly by MUAC and by age category.
The distribution of elders according to nutritional status was close to the normal curve with
number of malnourished increasing with age while the number of well nourished decreased
consequently.
4. 5 Dental status
The majority of the elderly (88.4%) had dental problems (Table 15). The incidence of dental
problems increased with the age and was 80.40%, 87.40%, and 94.50 % respectively among
the aged less 65 years, the aged 65-74 years and the aged above 84 years.
The Tugens had significantly (p<0.05) more teeth problems (94.4%) than Pokots (85.0%)
and did not report cases of dentures, which prevailed for more than half of the Pokots.
44

Table 15 Distribution o f population bv dental status and bv problems of the elderly.
Had dental
problems
Tugen N=90 Pokots N=160 Total N=250Statistical test
N % N % N % x2 PYes
.
85 94.4% 136 85.0% 221 88.4%
No 5 5.6% 24 15.0% 29 11.6% 5.01 0.025
Age group
<65 years 12 14.1 29 21.3 41 80.4 0.96 0.36
65-74 years 38 44.7 45 33.1 83 87.4 5.16 0.023
75-84 years 26 30.6 41 30.1 67 94.4 1.25 0.263
> 84 years 9 10.6 21 15.4 30 90.9 0.17 0.834
Slightly more than two thirds (38.9%) had dentures, close to a third (29.9%) had missing or
decayed teeth (31.2 %). All those with teeth problems reported that the chewing capacity
was affected (Table 16)
Table 16 Distribution o f elders bv type of dental problems they experience and bv ethnic
group.
Types of
dental
problems
Tugens N=90 Pokots N=160 Total N=250Statistical test
N % N % N % x2 P
Missing teeth 38 44.7 28 20.6 66 29.9 14.3 0.0001
Decayed teeth 47 55.3 22 16.2 69 31.2 47.5 0.000
Dentures — - 86 63.2 86 38.9 87.9 0.000
Total 85 94.4% 136 85.0% 221 88.4% 5.01 0.025
45

4. 6 Support systems
Within the community, the major source of support was provided by the child of the elderly
as reported by close to a half (42.4%). Almost half of the population (46.8%) reported
having self-support. Close to two thirds o f elderly Tugen (62%) were supported by their
children while almost the same proportions of child-support (42.4%) and self-support
(46.8%) characterized Pokots. Priority in times of scarcity was most given to children
(84.3% stated by elders). Significant difference in this prioritization was found among
Pokots (90.5%) and Tugen elders (73.3%).
Significantly higher number of elderly Tugen (100%) received food ration compared to
elder Pokots (80%).
Table 17 Source of support of the elderly among Pokot and Tugen
Support
Area
Tugen N=90 Pokot N=160 Total
n % n % n % P
Food relief 90 100 128 80.0 218 87.2 0.000
Community support
Children 56 62.2 50 31.3 106 42.4
Other members 12 13.3 15 9.4 27 10.8
Self 22 24.4 95 59.4 117 46.8 0.000
Most of the elderly (84.5%) gave priority to children in times of food scarcity, 14.5% give
priority to themselves and the remaining 1.2% stated that men should be given first priority
(Table 18).
46

Table 18: Distribution o f households bv priority given for food during time of shortage,
Priority when
food shortage
Area
Total N=250 Statistical testTugen N=90 Pokot N=160
n % n % N % x2 P
Children 66 73.3 143 90.5 209 84.3
Self 23 25.6 13 8.2 36 14.5
Men 1 1.1 2 1.3 3 1.2 13.88 0.001
4. 7 Factors affecting nutritional status of the elderly in Baringo district
4. 7. 1 Social and economic factors
The proportion of malnutrition among people who were living alone (72.3%) was not
significantly different as compared to that of those living with at least one other person
(84.7%). However Table 19 reveals that significantly more married elders were about three
times less likely to be malnourished (44.7%) than unmarried elders (55.3%) showing an
odds ratio o f 2.8 (95%CI: 1.3-5.9).
Table 19 association between social, economic factors and nutritional status
Characteristic Underweight Normal Statistical test
N= 206 N=44
Live alone n % N % P Odds ratio
Yes 34 72.3 13 27.7
No 172 84.7 31 15.3 0.072 0.5(0.2-l.l)
Marital status
Married 90 44.7 30 68.2
Not married 116 55.3 14 31.8 0.005 2.8(1.3-5.9)
47

Economic factors, namely source of income and animal ownership tested for association
with nutritional status o f elders, showed some significance for the entire elderly population
(Table 20).
Table 20: Association between source of income, animal ownership and nutritional status of---------------- _ ----------- :— ~ ~ --------------------- :--- _—— _ — --------- ■ -------
Pokot and Tueen elders.
Characteristic
Underweight
N= 206
N %
Normal
N=44
n %
P Odds ratio
Source of income
Sale of animals 119 57.8 33 75
No income 34 16.5 6 13.6
Gift from relatives 53 25.7 5 11.4 0.075 ns
Animal ownership
Own animals 156 75.7 35 79.5 0.373 ns
Own cows 99 48.1 31 70.35 0.007 2.6 (1.3-5.2)
Own goats 148 71.8 35 79.5 0.295 ns
Own chicken 6 2.9 3 6.8 0.207 ns
Own donkeys/camels 12 5.8 0 0 -
No significant association was found between the source of income or the ownership of
animals (all types) and nutritional status (as classified by BMI) (p >0.05). However
significant association was found (p <0.05) when the nutritional status was classified by
MU AC (see Table 19 and figure 4). Moreover those who owned cows were about three
times more likely to be well nourished than those who did not own cows (OR: 2.6 95%CI:
1.9-5.2).
48

Figure 6: MU AC classification and animal ownership
MU AC status
I I malnourished
□ normal
yes No
own animals
4. 7. 2 Association between social support and nutritional status
No association (p >0.05) was found between the source of social support and the nutritional
status. The elderly who consider children to be the priority for food in times of scarcity were
2.5 times more likely to be underweight (p< 0.05) than those who consider first themselves
(Figure 21).
There were more malnourished elderly among those who received general food relief
(85.8%) than among those who did not receive food ration (59.4%). Meanwhile,
malnourished people had also significant lower means of number of rations received (3
rations) and number o f meals (2 rations) than the well nourished (3 and 3 respectively).
49
Table 21 Distribution o f households by nutritional status and by support systems.
Characteristic
Underweight
N= 206
Normal
N=44
X2 test
P
OR OR 95% Cl
Source of support N % n %
Children 88 83 18 17.0
Other 22 81.5 5 18.5
Self 96 82.1 21 17.9 0.97 ns ns
Priority during crisis
Children 178 85.2 31 14.8
Self 24 66.7 12 33.3
Men 4 80 1 20 0.026 2.6 1.09-5.93
Receive food ration 187 85.8 31 0.001 4.1 1.9-9.2
Mean SD Mean SD t-test P
Times of ration
distributed 2.8 0.7 3.3 1.3 -2.81 0.007
Number of meals 2.1 0.9 2.7 1.1 -3.47 0.001
4. 7. 3 Dental status and nutritional status
The majority of the elderly had teeth problems (86.4%) which affected their chewing ability
(88.8%). No association was found between dental status or type of dental infections and
nutritional status of the elderly population (Table 22). This is because there was no
significant difference in status of teeth between the age categories.
50

Table 22: Dental status and nutritional status
Dentition
problem
Underweight
N= 206
N % n
Normal
N=44
%
Statistical test
X2 P
% Teeth problems 183 88.8 38 86.4 0.22 0.642
Missing teeth 53 29 13 34.2 0.27 0.60
Decayed teeth 57 31.1 12 31.6 0.02 0.95
Dentures 73 39.9 13 34.2 0.56 0.45
Chewing affected 183 88.8 38 86.4 0.22 0.642
4. 7. 4 Food intake and nutritional status
People who had at least one lunch in the 48 hours prior the survey were five times more
likely to have better nutritional status (54.5%) than those who just took supper with or
without snack. The average household size of the underweight elderly (4 members) was
significantly higher (p < 0.05) than that of the well nourished (2 members).
The mean intakes for most nutrients (except calcium) were lower but not significantly for
malnourished people than for well-nourished people as shown in Table 23.
51

Table 23: Food intakes and nutritional status of elderly population
Characteristic Underweight
N= 206
Normal
N=44
Statistical test
Meals n % N % P
% Took lunch 37 18.0 24 54.5 0.000 OR:5.4(2.6-l 1.5)
Mean SD Mean SD
Household size 3.6 2.1 2.7 2.0 0.016
Kcal 536.3 174.1 597 148.4 ns
Protein 13.1 7.3 13.8 6.0 ns
Iron 7.5 4.5 8.2 4.7 ns
Calcium 62.6 48.2 61.4 43 ns
Zinc 2.1 2.09 2.3 2.4 ns
Vitamin A 544.1 262.4 567.5 210 ns
Vitamin B1 0.3 0.26 0.4 0.3 ns
Vitamin B2 0.2 0.17 0.2 0.2 ns
Vitamin B6 0.4 0.29 0.4 0.3 ns
Vitamin C 34.5 26.3 34.8 26.7 ns
52
CHAPTER FIVE: DISCUSSIONS
5. 1 Characteristics of elderly study population
The sample size consisted of 250 households in which at least one old person was living.
Two communities, the Tugens and the Pokots presented different socio-demographic and
economic characteristics. The Pokot population had small number of household members
and high dependency ratio (DR). The high DR gap for the Pokots compared to the Tugens
can be explained by the fact that some households lost their young children during last
ethnic clashes in the region.
The Pokots were most involved in herding, they are pastorolists. Their main source of
income (sale of animals) makes them to be less dependent and mostly self-supported. Their
food intake was significantly different from the Tugen’s in quantity and number of meals.
Generally the diet for the Pokot consisted of porridge taken many times a day with fresh
milk or legumes while most Tugen elders had Ugali eaten once or twice, alone or with a
little amount of vegetables. Lunch, if taken was more found among the Pokots than the
Tugen. That can explain the differences observed in food consumption between the two
communities.
The Tugen reported also the high proportion of dental problems that were affecting chewing
ability o f food.
53

Factors reported to justify food preference were related to chewing and food habit of the
community as reported in other studies (Goland et al., 1986). Most of the Tugens (98.6%)
preferred maize for making Ugali (that is a bread made from maize flour) and the Pokots
(83.4%) liked maize and other foods namely milk and oil. The other aspect in the preference
is that such food could be provided during ration distribution and therefore could therefore
tick the mind of the respondent.
5. 2 Factors affecting nutritional status of elderly population in Baringo district.
The most obvious factor that affects the general situation of the population in Baringo
district was the drought. Most people relied on the food ration, which is poorly distributed.
Therefore apart from poverty and disaster that are mainly striking the area, some other
factors had shown significant associations with poor nutritional status o f the elderly
population. This confirms other findings (Ismail, 1999; Young, 1989 and Bermudez, 1999),
which reported that isolation, mal distribution of food and poor eating habits are the risk
factors to nutritional vulnerability of the elderly population.
5. 2.1. Loneliness and mal-distribution of food.
A number of studies (Russel & Suter, 1993) have shown that older people are more likely to
be given rather than to receive aid in emergencies. This has been proven in Baringo district
with the Pokot community where the elderly were taking care of the young children in the
situation where their parents were killed during the cattle wrestling clashes or when younger
adults have travelled great distance in search of food. In fact, most of the elderly lived with
54

children under fifteen and took them as priority for food in case of scarcity. The priority as
to who to be given food first goes to the young children, which may result in the reduction
of food intake in households.
That can be one o f the reasons explaining why those living alone had good average BMI
status. It could be the problem of mal distribution of scarce food in the household where the
elderly sacrifices his needs to fulfil the young child’s one. People who were staying alone in
the household showed low proportion of malnutrition among those populations.
But when controlled for marital status, those married had better nutritional status than those
who were not married, suggesting that loneliness must be taken as living without a partner
to be considered as a risk factor of malnutrition in this population.
5. 2. 2 Economic status of the household
Socio-economy is also an important factor influencing nutritional status. Generally stated
elsewhere as poverty (Young, 1989), it proved significant associations with malnutrition.
But for the case of Baringo population, the ownership of cows was sole isolated key
determinant in observed differences in nutritional status. The reason can also be due to its
potential to provide milk, which can be added to the household diet or sold to buy other
types o f food. The prevailing drought condition in Baringo might have had an effect on the
population, as they were required to engage in opportunities to access and prepare food
through their own means. Coping activities undertaken to increase household food
availability in response to food shortages were not necessarily options for older Tugen as
they were more vulnerable compared to their counterpart Pokots who had more animals and
that could probably explain the difference in malnutrition rates a amongst the two groups.
55

5. 2. 3 Social support.
Two types of support could be mentioned in this population. The first consisted of non
governmental organizations providing food ration and the second of community or family
support. However, the family and community support system in the study have been broken
down as a result o f the drought, leading in difficulties of the older people accessing food.
Further, community capacity to care for and prioritise it most vulnerable members such as
older people may no longer have been adequate hence contributing to high malnutrition
rates. Fortunately, for those who received food relief, the majority were economically weak
without source o f income as it was the case of most Tugen elders. Community support
depended also on the economic status of the elder person. Most people, who did not own
animals, had no income and therefore relied on food aid. The two factors appeared to be
confounding masking the true relationship between social support and nutritional status.
One of the reasons that might be hiding the association between social support and
nutritional status is the quantity of support it self. As stated in the above section, the food
ration is too little and community self-sufficiency is diminished so that the impact is
difficult to define.
5. 2. 4 Food intake
Studies have shown that (UNHCR/UNICEF/WFP-1998) The initial reference value or
planning figure for general food rations in emergencies is based on the average per capita
nutritional requirements for a population. These requirements are considered in terms of
56

energy, fat, protein and micronutrients. This figure is/can be increased based on specific
circumstances, or is decreased based on the population’s access to other food sources .In
this study, there was consideration in terms of meeting criteria for providing general ratio
based on population especially the Pokots as they accessed other food sources (animals).
However, this figure is rather too low in this circumstance as the Tugen population who
entirely dependent on food aid, were not able to meet the criteria of 2,1 OOkcal per person
per day. Therefore, Poor food intake was principally due to the fact that most households
relied on food relief. Since the ration distributed was little, the quantity of food was small,
the quality poor and the total number of meals low. There was positive significant
association with malnutrition. Since supper was eaten in most households where it was the
sole meal in some o f them, taking lunch showed differences in nutritional status with more
likelihood of malnutrition among those who skipped it. The role of snacking could not be
defined because it was a rare event in this population.
Nutrient intakes averages were below recommended daily allowances (RDAs). Iron (source
maize) and vitamin A (source vegetables) intakes reached about three quarters of the
recommended allowances. Mean energy and protein intakes fulfilled respectively 27% and
22 % of RDAs. The average fibre intake covered about a quarter of the requirements. While
the ratio in question was provided to many people, there are a number of important factors,
however, that results in the ration being inadequate for older people in this drought situation
of Baringo, such as food processing and preparation. In this case: food commodity that was
provided was whole grain cereals (maize) and beans which are difficult to digest for older
people these foods are relatively more difficult to chew, it was established in the study that
most elderly people had difficulties in chewing because of the condition of their teeth.
57

These prevailing factors could have contributed greatly to the poor nutrition status amongst
the Tugen and Pokot elderly in Baringo district.
5.2.5 Factors explaining differences in nutritional status between Tugen and
Pokot elderly in Baringo district during drought period.
The results of the research showed that Tugen elders were more vulnerable to malnutrition
as compared to the Pokots. Different factors, explained above which weigh more or less
proportionately in the two communities may explain those diverse levels of vulnerability:
Socio-economic factors. Tugen elders lived in large households, which had low
economic status. They did not own enough cows since they were more
agriculturalists as compared to the Pokots. Given the drought they could not
produce enough from farming and were dependent on aid, while the Pokots still
had some of their livestock, which were their main source of income through sales.
Moreover most Tugen elders were unmarried, half of them widowed which is
opposite o f the Pokot marital status (more than half were married).
Food intake and food habits. The two communities differed on their food habits
in favour of the Pokots. Tugen elders had poor diet of one starchy meal often made
of maize flour and rarely took lunch. That was what they could get from Food
relief scheme. Given their food habits, few of them added vegetables to their
meals. While Pokot elders had more than one meal per day, which comprised a
variety of food including milk sourced from their cows.
58

CHAPTER SIX: CONCLUSION AND RECOMMENDATIONS
The study consisted of assessing risk factors to nutrition vulnerability of the elderly
population among the Tugens and the Pokots in Baringo district. Continuous drought
disaster is ravaging the area and the population relies mostly on food aid provided by
different organizations. The loss of animals due to the same cause is usually high. Poor diet
in quantity and quality included maize porridge or ugali as main staple eaten alone or with a
little amount of vegetables.
General nutritional status is poor, especially for the Tugens. The majority of the population
is underweight.
Social, biological and economical characteristics of the population are principal factors
affecting nutritional status of the elderly.
1. The age o f the elderly influences current dental status and food intakes. As the
population grows old, it tends to skip some meals decreasing the number of meals
eaten per day. Significant loss of muscle occurs with age. Studies have shown that
(Reubenoff-1999) Sarcopenia, involving the loss of muscle tissue, is a normal
process o f ageing. It has two main important effects, decrease in strength and
reduced protein stores for times of physiological stress such as an acute illness. The
consequences of this physiological change for older persons during emergencies in
this study drought: may be particularly grave. As a result of the characteristic
59

deterioration in dentition, older people prefer to eat softer, more easily digestible
foods (Mirie, W-1997); Access to these foods as described previously, was not
feasible in the drought situation of Baringo. The observations above, opposes the
hypothesis that food intake pattern is not associated with the nutritional status of the
elderly in Baringo district.
2. Social factors such as loneliness, loss of a partner and caring for young grandchild
are associated with high prevalence of malnutrition among the elderly in Baringo
district. A large household in which the old person lived have more risk of elderly
malnutrition. Loneliness can affect the nutritional status only if the elderly has no
partner.
3. Socio-economic factors namely source of income, number of animals owned or
dying during drought have significant associations with the nutritional status. The
numbers of cows owned and the capacity to care after oneself have a positive impact
on current BMI status.
Compared to the Pokots, Tugen elders are at high risk of malnutrition. This may be due to
the gap in socio-economic factors such as marital status, household size, access to food and
source of income; and in their eating habits.
These observations refutes the hypothesis that, there is no association between social and
economic factors and nutritional status of the elderly population
60

The recommendations are:
1. Nutrition education should be introduced in order to encourage the elderly people
improve the selection of foods in their diets in order to meet essential nutrients, which
will also help them consume nutrient dense foods, adequate fluid volumes and easily
digestible foods.
2. A fortified blended food that is easy to cook should be included as part of the basic
general ration, where this is not available, older people (in addition to young children)
should be prioritised to receive a supplement of blended food or other nutrient dense
food.
3. Existing community coping mechanism or structures should be strengthened as the most
important strategy of food and nutrition assistance programme for older people.
4. Include older people in agricultural assistance programme e.g. small scale horticulture
5. Help Age International should design programmes aimed at improving the living
conditions of old people. Such programme should focus on improving access and
availability of food by old people affected by drought in Baringo district.
6. Food habits and eating behaviours are likely to change therefore, project emphasising on
alternative and survival strategy during hungry period should target old people in a
participatory manner. Most old people stick to their old food habits and starve or eat
poorly while some rich foods are available. This will consider a large proportion of
Tugen elders.
7. More targeted intervention programs prioritising the elderly as a vulnerable group.
61

REFERENCES
ACC/SCN (1999). Nutrition and healthy aging. SCN News no 19, December 1999:14
Action, (1999). The provision of care for the elderly. Edinburgh, Churchill Livingtone,
(1981): 149-154. London
Allen L. H., Casterline J. (1994). Vitamin B12 Deficiency in Elderly Individuals, Diagnosis
and Requirements (comment). American Journal Clinical Nutrition. 60 (1):
12-14
Andres, R (1972). Aging and carbohydrates metabolism In Nutrition Foundation. L. A.
caulson, Upsala, Almquist and Wilsell, pp 24-31
Ausman, LM, et al. (1994). Nutrition in the Elderly. In: Shils ME, O lsen JA, editors.
Modem Nutrition in Health and Disease.8th Edition ed. Pennsylvania: Lea
and Febiger: pp770-9.
Bermudez I 0 . & Dwyer J. (1999). Identifying the elderly at risk of malnutrition: A
Universal challenge. ACC/ SCN News No 19, December 1999.
Bluberg J. (1994). Nutrient requirements of the elderly - should there be specific RDAs?
Nutrition Revised. 57 (8pts2): si5-sl 8)
Boisvert WA., et al., (1993). Riboflavin requirements of health elderly humans.
European Journal Clinical Nutrition. (7): 424-430
Briggs. (1984). Nutrition and Physical Fitness. 11th ed.-New York: Holt, Rinehart & Winston.
Busolo, D. (2000) Nutritional Assessment of Older People, Turkana.Unpublished report.
Campbell WW. et al Evans WJ (1996). Protein Requirements Of Elderly people. European
Journal Clinical Nutrition 50 supplement 1: s 180-sl83
62

Castaneda c., et al (1995). Elderly women accommodate to a low protein diet with losses of
body cell mass, muscle function and immune response. American Journal
Clinical Nutrition. 62 (1): 30-39.
Charlton K. E., et al (1997). Iron folate and vitamin B12 status and elderly in South African
population.
Clark Ang., Mankirar GD and Cray I. (1975). Diagenes syndrome; a clinical study of gross
neglect in old age. Lancet (1): 366-368
Collins’s et al (2000). Anthropometric assessment of Nutritional status o f Adults in
Emergency-affected population (Draft)
Debny, B (1977) Measuring Acute Malnutrition: a need to redefine cut-otf points for arm
circumference? Lancetii: 1229-1230
Dichter JC. (1992) Classification and definition of protein Calorie Malnutrition. British
Medical Journal 3:566-569
Eschleman M.M. (1984). Nutrition during the later years o f life. Introductory nutrition and
diet therapy. Ed. B. Lippincott co., Philadelphia: 216-221
Ethangatta, L.K. (1988). Nutritional Status of institutionalised elderly. Msc.Thesis.
University of Nairobi.
Eton-Smith A. N. (1972). Physiological aspect of aging, relationship to nutrition. American
Journal Clinical Nutrition 25: 853-859
FAO/WHO/UNU Experts consultation (1985). Energy and protein requirements. 724
Fereday A.et al, (1997). Protein requirement and ageing: metabolic demand and efficiency
of utilisation. British Journal Nutrition. 77 (5): 685-702
Fielding, W. (2000). Challenges for the year 2000: A discussion paper for the WFP southern
sector strategy retreat pp 5-9, WFP / SCF / UK
63

Fisher et al (1991). Handbook for family Planning Operations Research and Design.
Operations Research Population council, USA pp 43-46
Friedman. P, (1991) Severe Arm-Muscle Wasting: Sign of Lethal Malnutrition in Sick
Elderly Men. Plenum Press. New York and London.pp223-226.
Garry P.J. and Vellas BJ. (1996) Ageing and nutrition. In: Present knowledge in nutrition.
7th edition. Ziegler EE, Filer LJ., Editors. Washington: ILSI Press; pp 414-
419
Geneva, WHO. Technical report series.
Gerritsen GC. (1976). The role of nutrition to diabetes in relation to age. In nutrition,
longevity and ageing, eds. Rockstan M. & Sussman ML. Academic Press Inc.
New York pp 229-252
Green gross S. (1980) the point of view for social promoter. Adaptability and ageing. 9th
International conference of social gerontology, Quebec, 17-29 August 1980.
Pp 105-113
Harris R. (1975). Cardiac changes with age. Physiology and pathology of human ageing.
Editors: Goldman R. & Rockstan M. New York, Academic press, pp 109-122
Help Age International (1999). Older people in disasters and humanitarian crisis: guidelines
for best practice. London, Help Age International Communications
Herbert V. (1981). The elderly needs oral vitamin B12. American Journal Clinical Nutrition.
67: 739-752
Hopper, W. (1968). The Politics Of Food. International Development Research Centre.
Ottawa
Howe P. (1981). Basic Nutrition In Health and Disease. W.B Saunders Company: pp45-70
64

Hurst JW. et al (1974) The heart arteries and vein. 3rd edition. New York, Me Graw-Hill
Ismail S. & Manandhar M. (1999). Better nutrition for older people: Assessment and
Action. London
Ismail S. (1997). Background to research Programme. Assessing the nutritional
vulnerability of older people in developing countries. A report of the
symposium held on September 23 and 24 1997. HelpAge International.
Edited by Gregory K. & Peachey K.
Ismail S. (1999). Assessing nutrition vulnerability in older people in developing countries.
ACC/SCN News No 19, December 1999
Ismail S. (2000). Getting the nutrition o f older people on the international agenda. Center
for ageing and public health. London school of hygiene and tropical
medicine. London (1): 6-7, London.
Kane RL. Et al. (1980). Long-term care, can our society meet the needs of its elderly. Ann.
Rev. Public Health (l):227-253
Kountz, W.B., et al. (1997). Nitrogen balance studies in elderly people. Geriatrics 2:173
Le Gros Clerk F. (1968). Food habits as practical nutrition problem. World Review of
Nutrition & dietetics, Basel/ New York. Kager pp 56-84
Longhurst R. (1987). Famines, Food, and Nutrition: issues and opportunities for policy and
research. Food and Nutrition Bulletin.9 (1): 31-37
McDowell, I. (1985). Evaluation Of Nutrition Education In Africa.Monton Publishers: The
Hague
Mirie W. (1997) ageing and Nutritional needs. East African Medicine Joumal.pp622-4
Modem Nutrition in Health and Disease (1994). 8th edition Pennsylvania: Lea &Febiger
pp770-779
65

Murray TM. (1999). Calcium nutrition and osteoporosis. Canadian Medical Journal (7): 177
Mwaura M. (2000). Experience of HelpAge Kenya in emergency response. Personal
communication, June 2000.
Natarajan V et al., (1993). Assessment o f nutrient intake and associated factors in an Indian
elderly population. Ageing 22 (2): 103-108
Peachey K. (1999). Ageinsm: a factor in nutrition vulnerability of older people?
23(4): 350-358
Pieterse S. (1997). Anthropometric measurements results. Assessing the nutritional
vulnerability of older people in developing countries. A report of the
symposium held on September 23 and 24 1997. HelpAge International.
Edited by Gregory K. & Peachey K.
Pieterse s., Manandhar M. & Is mail S. (1998). Nutritional status and functional ability of
older refugees. Proceeding of the Nutrition Society.
Posner BM. Nutrition and the elderly. Lexington, Mass. Lexington Books, DC Health
Prentice A. (1998). Calcium. Geneva, United Nations ACC/SCN. SCN news (19): 33-36
Quinn K. & Basu TK. (1996). Folate and vitamin B12 status of the elderly.
European Journal Clinical Nutrition. 50 (60).
Recommended dietary allowances, a revised edition committee on dietary allowances, Food
and Nutrition Board, NRC/NAS, Washington DC, 1980.
Richard M.J. (1999). Micronutrients and ageing: intakes and requirements.
Proc. Nutr. Soc. 50(6): 573
Roberts, P. H., et al. (1948). Nutritional status of older women. Nitrogen, calcium and
phosphorus retention in nine women, J.Am.Diet.Assoc. 24:292
Roe D.A. (1979). Alcohol and diet. West port, CT: AVI Publication Co. pp27-41
66

Roe D.A. (1979). Interaction between drugs and nutrients.
Med. Clin. N. Mer (63): 985-1007
Roe, D. A. (1987). Geriatric nutrition. 2nd Ed. New Jersey.
Roland A.D. (1984). Nutrition in adulthood and the later years. Food, nutrition and diet
therapy. 7th ed. Krause & Maha: 319- 333.
Roth M. (1978). Diagnosis of senile and related forms of dementia. In Alzhelmers disease
sniele dementia and related disorders (Aging vol 7). Editors Kartz-man
R, Terry RD. and Bich KL. New York, Raven press, pp 71-85
Reubenoff, R (1999). Inevitable, But Treatable. SCN News 19,PP 27-29. Geneva, United
Nations
Russell R.M. & Suter PM. (1993). Vitamin requirements of elderly people: an update.
American Journal Clinical Nutrition. 58 (1): 4-14
Schneider H.R. (1993). Requirements and supply of vitamin C, E and |3-carotene for elderly
men and women. European Journal Clinical Nutrition. (48): 118-127
Staveren.W.(1994). Food Intake Measurements: Their Validity And Reproductively
The gerontological and geriatric population in Go'teborg, Sweden (1977). Acta Med.
Scand., suppl. (611): 853-859.
Tolonen M .(l990).Vitamins &Minerals In Flealth And Nutrition .NewYork:Horwood.
Tucker K.B. (1999). Vitamins, homocysteine, Heart Disease and cognitive functions.
Geneva, SCN News (19): 30-33
Underwood. B.A. (1970) Nutrition Intervention Strategies In National Development.
Academic Press: New York.
WHO. (1999). Management o f Severe Malnutrition: a Manual for Physicians and Senior
Health workers.Geneva,United Nation s,WHO.
67

Wood RJ, Suter PM. & Russell RM. (1995). Mineral requirements of elderly people. Am. J.
Clin. Nutr. Soc. 58 (3): 573-578
Young K. et al., (1992). Food habits and health in later life: cross-cultural studies.
Proceeding of the 14th International Congress of Nutrition.vol2 August 20-
25,1989 Seoul, Korea: 227-242.
Young V.R., Perera W.D., Winterer J.C. et al (1976). Protein and acid requirement of the
elderly - an overview. In nutrition and Ageing. Ed. Winick M. New York:
John Wiley and Sons, pp 77-118
68

FACTORS AFFECTING THE NUTRITION STATUS OF THE ELDERLY IN THE
DROUGHT PRONE AREAS OF BARINGO DISTRICT.
APPENDIX 1. QUESTIONNAIRE
IDENTIFICATION
District_______________Division___________________ sub-location________________
Location_______________________
1. Household I d ___________ Interviewer name_____________ Interview date________
1. Respondent’s nam e___________________ 3. Sex_____ (l=male 2=female )
4. Marital status____________ (l=married 2=single 3=separated/divorced 4=widowed)
Fill in the following information about the respondent and each person in the household.
0 Name How
many
months
stayed
here last
year
Sex
l=male
2=female
Age (in
years)
Education
(completed
in years)
Occupation Brings
money or
food to the
household
1 =yes 2=no
Codes
Education Regular activities / occupation
1. completed 1-4 of primary 99. Preschool children
2. Completed 5-8 of primary 1. House wife and farming
3. Attending primary (children) 2. Herding
4. Attended secondary school 3. Farming
5. Post secondary 4. Salaried / employed
6. Adult informal education 5. Artisan/jua kali
7. Preschool children 6. Student
8. Not attended school 7. Casual labourer
8. Business / self employed
69

SOURCES OF INCOME
6. How long have you lived here?_____________________________________
8. What are the main sources of incom e_____ (1. salary 2. Pension 3. sale of animals 4.
Crop farming 5. no income 6. Gifts from relatives / friends 7. Business 8. Others
(specify)____________
9. Do you own animals? 1. yes 2. No
10. (If yes} which ones and how many (Fill the table below).
No Type o f livestock Number owned Number died
1 Cows
2 Goats/sheep
3 Camels
4 Donkeys
5 Chicken
6 Others
11. When did you last have rain (month of drought)_____________________
12. Who supports you (1. your children 2. brothers/ sisters 3. community members
4. other relatives 5. self)
13. When there is food shortage whom do you give first priority?________________
(1. children 2. women 3. self 4. men 5. others)
14. Have you received any relief food during this drought?____________ (1. yes 2. no)
15. {If yes}, what did you receive and how much {please circle}
1} maize l)yes 2) no Quantity___________________
2} pulses 1) yes 2) no Quantity___________________
3} oil 1) yes 2) no Quantity___________________
4} Unimix l)yes 2) no Quantity____________________
16. How many times have you received the relief food in the last three months?__________
17. {If yes} Which one?______________(1. Maize 2. Pulses 3. unimix 4. oil 5. milk)
18. From the foods that you received which one did you prefer?________ (1. Maize 2.
Pulses 3. Unimix 4. oil 5. milk 6. None)
19. Do you have any problem with your teeth?________ (1. yes 2. no)
20. {If yes} which one?_______ (1. missing teeth 2. decayed teeth 3. dentures).
70

APPENDIX 2: SUMMARY OF SOCIO-ECONOMIC FACTORS
DIFFERENTIATING POKOT ELDERS FROM TUGENS ELDERS
FACTOR THE TUGENS THE POKOTS
Household size 4 persons 3 persons
Aged Over 55 years 43.2% 33%
Married/widowed 25.6%/51.1 % 60.6%/28.8%
Dependency ratio 3 3.7
Not attended school 100% 97.8%
Herding activity 14.9% 58.9%
Casual labour 70.35 29.2%
Sales of animals 37.8% 73.8%
No income source 22.2% 3.8%
Gift from community 40% 13.8%
Own animals 55.6% 88.1%
Own cows 21.1% 69.4%
Lost cows 21.1% 61.2%
Eat lunch 4.8% 19.87%
Varied diet No Yes
Number of meals 1 per day 1.5 per day
Malnutrition rates 88.9% 78.8%
FACTORS AFFECTING THE NUTRITIONAL STATUS OF THE ELDERLY
FACTORSCompared level of malnutrition
A* g**
Community (The Tugens*/ the Pokots**) More Less
Marital status (Married*/ Unmarried**) Less More
Own cows (Yes*/No**) Less More
Receive food ration (Yes*/no**) Less More
Number of meals (2* versus 3**) More Less
Eating lunch (Yes* /No**) Less More
Household size (3* versus 4**) Less More
71

50
< 65 years 65-74 years 75-84 years >=85 years
Age category of elders
Although the distribution of elders can fit into the normal curve, the proportion of
malnourished increased linearly with age thus the proportion of well nourished decreased
with age.
ut°£'72