recommendations for a national food and nutrition policy ... · service provision factors affecting...
TRANSCRIPT

F O O D S A F E T Y AU T H O R I T Y O F I R E L A N D
1Nutrition
Recommendations for a national food and nutrition
policy for older people

Recommendations for a
national food and nutrition
policy for older people
Published by:Food Safety Authority of Ireland
Abbey CourtLower Abbey Street
Dublin 1
Tel: 8171 300, Fax: 8171 301Email: [email protected] Website: www.fsai.ie
© 2000
ISBN 0-9533624-8-5

F O O D S A F E T Y AU T H O R I T Y O F I R E L A N D
CONTENTS
FOREWORD i
ACKNOWLEDGEMENTS ii
EXECUTIVE SUMMARY iii
1. INTRODUCTION 1
1.1 Background 1
1.2 Terms of reference and aims of the report 2
2. RATIONALE FOR A FOOD AND
NUTRITION POLICY FOR OLDER PEOPLE 3
2.1 Characteristics of the older population 3
2.1.1 Age and demographic trends 3
2.1.2 Nutritional needs of the older population 4
2.2 Health status 4
2.2.1 Life expectancy 4
2.2.2 Mortality rates for older people in Ireland 5
2.3 Nutritional status 8
2.3.1 Nutritional assessment 9
2.3.2 Classifications of poor nutritional status 11
2.3.3 Identifying risk factors associated with poor
nutritional status 12
2.3.4 Incidence of poor nutritional status 14
2.4 Nutrition related diseases and conditions 17
2.4.1 Relationship between diet and chronic non-
infectious diseases 17
2.4.2 Incidence of nutrition related diseases and
conditions in Ireland 22
2.5 Benefits of an adequate nutritional status 24
3. NUTRITIONAL REQUIREMENTS AND
DIETARY GUIDELINES 25
3.1 Introduction 25
3.2 Current recommended dietary allowances 25
3.3 The food pyramid 25
3.4 Nutrient intakes and requirements 26
3.4.1 Energy 26
3.4.2 Protein 30
3.4.3 Carbohydrates 31
3.4.4 Alcohol 32
3.4.5 Fat (saturated and unsaturated) 33
3.4.6 Vitamins 34
3.4.7 Minerals 38
3.4.8 Supplementation 40
3.4.9 Discussion 41
3.5 Dietary guidelines 43
3.5.1 Variety of food 43
3.5.2 Energy and physical activity 43
3.5.3 Starchy foods 43
3.5.4 Fruit and vegetables 44
3.5.5 Dietary fibre 44
3.5.6 Fluid 44
3.5.7 Fat 45
3.5.8 Meat, fish, poultry and dairy foods 45
3.5.9 Food modification: enriched foods, fortified
foods and dietary supplements 45
3.5.10 Alcohol 46
4. ACCESS TO HEALTHY AND APPROPRIATE
FOOD CHOICES FOR OLDER PEOPLE 48
4.1 Access to healthy and appropriate food choices for
older people 48
4.1.1 Public health policy 48
4.2 Supportive environments 48
4.2.1 Transport 48
4.2.2 Housing 48
4.2.3 Income 48
4.2.4 Food retailers 49
4.2.5 Catering 49
4.2.6 Food safety 49
4.3 Community action 51
4.3.1 Nutrition health promotion 51
4.3.2 Community meals 52
4.3.3 Family carers and home help service 52
4.3.4 Primary health care 52
4.3.5 Nutrition education 52
4.4 The health services 53
4.4.1 Acute hospitals 53
4.4.2 Day hospitals 53
4.4.3 Long-term care and inpatient facilities 53
4.4.4 Health service catering 54
4.5 Developing personal skills 54
5. RECOMMENDATIONS 55
5.1 Government action 55
5.2 Implementation of policy 55
5.3 Research 55
5.4 Dietary guidelines 56
5.5 Supportive environments 56
5.6 Community action 56
5.7 Health services 57
5.8 Developing personal skills 58
APPENDICES
APPENDIX I 59
APPENDIX II 60
APPENDIX III 61
APPENDIX IV 62
APPENDIX V 66
GLOSSARY 67
REFERENCES 71
MEMBERS OF THE FOOD AND NUTRITION
POLICY FOR OLDER PEOPLE WORKING
GROUP 85
MEMBERS OF THE NUTRITION
SUB-COMMITTEE 86
F O O D S A F E T Y AU T H O R I T Y O F I R E L A N D

TABLES
Table 2.1. Body mass index classifications 9
Table 2.2. Summary of common risk factors affecting nutritional status 12
Table 2.3. Service provision factors affecting nutritional status in older hospital patients
(or clients in residential and nursing homes) 13
Table 2.4. International studies indicating poor nutritional status in institutionalised older people 15
Table 2.5. International studies indicating poor nutritional status in older people in the
acute hospital setting 15
Table 2.6. International studies indicating poor nutritional status in homebound older people 16
Table 2.7. International studies indicating poor nutritional status in free living older people 16
Table 3.1. Energy requirements for people 60-74 and 75 and over in Ireland 28
Table 3.2. Average daily energy intakes for older people found in the INNS, the Norwich,
Seneca, Boston and NDNS surveys 29
Table 3.3. Average daily energy intakes for older institutionalised people found in the
NDNS (UK) and Boston survey (USA) 29
Table 3.4. Average daily protein intake in older people (60 years and over) in Ireland 30
Table 3.5. Daily carbohydrate intake as % of food and total energy intake in older people
in Ireland and the UK 31
Table 3.6. Alcohol intake as % of total energy in the UK and Ireland 32
Table 3.7. Recommendations for daily intake of essential fatty acids 33
Table 3.8. Daily intake of fat in Ireland and the UK 34
Table 3.9. Recommended Dietary Allowances for vitamins in Ireland 34
Table 3.10. Average daily intake of vitamins in older people in Ireland and the UK 35
Table 3.11. Recommended Dietary Allowances for minerals in Ireland 38
Table 3.12. Average daily intake of minerals in older people in Ireland and the UK 39
Table I.I. Centiles for ideal body weight for older people 59
Table II.I. Recommended Dietary Allowances for Ireland 60
Table III.I. Energy requirements for moderately active adults 61
Table IV.I. Average daily intake of vitamins in UK and Ireland expressed as % of RDA 62
Table IV.II. Average daily intake of minerals in older people in Ireland and the UK
expressed as % of RDA 63
Table IV.III. Daily micronutrient intakes below Reference Nutrient Intakesa and Lower
Reference Nutrient Intakesa in free-living older people 64
Table IV.IV. Daily micronutrient intakes below Reference Nutrient Intakesa and
Lower Reference Nutrient Intakesa in institutionalised older people 65
Table V.I. Percentage of Irish population over 55 years per social class meeting food
pyramid recommendations 66
F O O D S A F E T Y AU T H O R I T Y O F I R E L A N D

FIGURES
Figure 2.1. Life expectancy in Ireland for people aged 65 (1950 to 1994) 5
Figure 2.2. Life expectancy at 65 years for people in select EU countries, 1994 5
Figure 2.3. Death by principle cause in people aged 65-74 and 75+ in Ireland, 1997 6
Figure 2.4. Deaths due to heart disease in people aged 65-74 in select EU countries 7
Figure 2.5. Proportion of deaths due to various types of cancer, Ireland 1997 8
Figure 2.6. Selected HIPE cases for people 65-74 and 75+ in Ireland, 1997 23
Figure 2.7. Registered cases of cancer in people 65-74 and 75+ in Ireland, 1995 24
Figure 3.1. Food Pyramid 26
Figure 3.2. Percentage of the Irish population over 55 years meeting Food Pyramid
recommendations 26
F O O D S A F E T Y AU T H O R I T Y O F I R E L A N D

The nutritional needs of individuals change with lifestyle and over time. As children reach maturity and
adulthood they no longer require nutrition for growth. Instead food and nutrition is needed to replace
expended energy and to provide sufficient protein, fat, carbohydrate, vitamins and minerals as well as other
essential components to meet the body’s needs. With advancing age the ability to store nutrients declines,
as do regulatory and recovery abilities. However, the nutritional requirements of the population aged over
65 years are diverse and are influenced by health, physiological function and susceptibility to disease.
Inappropriate food intake, chronic disease and functional impairment place a substantial number of older
Irish people at high risk of malnutrition. Unrecognised or untreated malnutrition, including both over- and
under-nutrition, can lead to disability, reduce the quality of life, increase morbidity and the need for health
care and social services, and can contribute towards premature institutionalisation and early mortality.
This report on "Recommendations for a national food and nutrition policy for older people" provides
information on the status of nutrition in our older population and on the common risk factors affecting
this status. It relates nutrition to diseases and conditions experienced in the older population and outlines
the benefits of adequate diet.
In order to be of practical use to health professionals and those caring for older people, the report sets
out nutritional requirements and dietary guidelines as well as highlighting barriers that impede proper
eating patterns.
A number of recommendations aimed at improving the nutritional status of our older population are
made. Amongst these is a recommendation for the implementation of "Adding Years to Life and Life to
Years:A Health Promotion Strategy for Older People" published in 1998 by the National Council on Ageing
and Older People and the Department of Health and Children.
The interaction of adequate diet and healthy lifestyle has a strong influence on the wellbeing of this sector
of society. Older people constitute a significant and growing proportion of the Irish population. In 1996,
413,882 people (11.4%) were over the age of 65. By 2011 the percentage is expected to increase to 14%.
Consequently, the growth in the older population, particularly in the group 85 years and over, has far-
reaching implications for nutritional policy.
Implementation of this policy can enable better health and will demonstrate that society values its older
members.
Ms Sheena Rafferty
Chairperson
Food and Nutrition Policy for Older People Working Group
F O O D S A F E T Y AU T H O R I T Y O F I R E L A N D
FOREWORD
I

The Food and Nutrition Policy for Older People Working Group would like to thank the following
for their help and advice; Mr. John Browne and the staff of the National Council on Ageing and Older
People, Ms. Mary Cowman of Age and Opportunity, Prof. Davis Coakley,Trinity College, Dublin, Prof.
Dan Collins, Chair, Microbiology Sub-committee, Ms.Vivien Reid, Dr. Emer Shelley, Dr. Mark Regan and
the staff of the Food Safety Authority of Ireland. The guidance and feedback from the members of
the Nutrition Sub-committee was greatly appreciated. Special thanks also to the researcher, Ms Moira
Hurson for all her hard work and effort.
F O O D S A F E T Y AU T H O R I T Y O F I R E L A N D
ACKNOWLEDGEMENTS
II

Background
The Irish population is ageing. In 1996, 11.4% of the population was over 65 years and this figure is
expected to rise to 14.1% by 2011.There is an important relationship between nutritional status, diet
and health status of the population.A need for optimum nutrition in this ever increasing population
was identified. A Working Group was established by the Nutrition Sub-committee of the Food Safety
Authority of Ireland to address the issue of nutrition and older people in Ireland.
For older people as for the general population, the maintenance of good health depends on safe,
affordable and appropriate foods. Eating a balanced diet high in fresh fruit and vegetables and low in
fat gives some protection against heart disease, stroke, some cancers, obesity and arthritis. In the
developed countries most nutritional problems are related to eating too much but among older
people, under-nutrition may also be a problem. Diet may be insufficient to provide adequate nutrition
in certain circumstances (8).
Among the most common chronic diseases (including cardiovascular and cerebrovascular diseases,
cancer, diabetes, osteoporosis and constipation) suffered by older people are those which are directly
linked to a combination of inappropriate diet and unhealthy lifestyles. Inadequate intake of some
vitamins and minerals are also particularly liable to occur among older people as they adopt more
limited diets. This reduced vitamin and mineral intake can cause specific nutritional diseases or
disorders (15) and early detection of poor nutritional status can assist in the treatment and/or
prevention of many conditions.
Chronic geriatric diseases, physical and psychological disabilities and poverty are among the risk
factors for older people developing malnutrition. Preventing this condition in at-risk groups can
depend on providing home-delivered meals and assisting with food shopping and cooking, particularly
for those who are confined to their own homes within the community. It is also important that
vigilance is maintained with regard to feeding practices in nursing homes. Older people and their
carers need to be aware of the risks of adverse effects of therapeutic drugs and alcohol on nutrition
and professional advice should be sought as far as possible on optimal medication regimens.
As the size of the older population grows there is also an increase in the need for improved social
structures, e.g. easy access to public transport, a health/medical system to assist those with ailing
health and the necessary advice and ability to obtain a satisfactory nutritional status.
F O O D S A F E T Y AU T H O R I T Y O F I R E L A N D
EXECUTIVE SUMMARY
III

Early nutritional intervention can reduce the
length of hospital stay for these older people
following illness and in general can improve
their overall health and well-being (98).
Nutrition intervention has also been shown to
be cost effective for the health care providers
(99, 100).
The implementation of these recommendations
requires commitment from several government
departments and agencies. It is our hope that
these recommendations on policy will provide
the basis for the improvement of the nutritional
status of older people in Ireland.
The Working Group on a Food and Nutrition
Policy for Older People set out to:
• Examine the rationale for a food and
nutrition policy for older people
• Develop food and nutrition guidelines for
key people involved in the care of older
people
• Consider the current provision of service
for older people
• Make recommendations for the future
development and implementation of a Food
and Nutrition Policy for Older People.
Issues addressed
• Risk factors associated with the
development of poor nutritional status and
methods of nutritional assessment.
• Classification and consequences of poor
nutritional status.
• Nutritional requirements of the healthy
older population including dietary guidelines.
• Supportive environments necessary to
provide access to healthy food choices and
thus promote a healthy nutritional status.
• Recommendations for the implementation
of the policy.
Recommendations
Government action
Given the evidence to support the role of
nutrition in promoting health and social gain
for older people, the Department of Health
and Children should take the lead role in co-
ordinating action to improve the nutritional
status of the older population. Communication
between Government departments is required
on matters relevant to food and nutrition for
older people.
Structures exist and should be utilised to facilitate
implementation of the recommendations in this
document.
Specific resources should be allocated for the
implementation of the recommendations in
this document.
Implementation of policy
The Department of Health and Children
should oversee the implementation of policy
at national level. At local level, a co-ordinated
F O O D S A F E T Y AU T H O R I T Y O F I R E L A N D
IV

multi-agency approach should be taken and the
policy should be implemented through the co-
ordinators of services for older people in the
health boards.
An evaluation strategy should be put in place
by each responsible agency to assess whether
the implementation of the policy is effective
and appropriate.
Research
A national food and nutrition consumption
survey specifically targeting the older
population should be carried out. Ideally, this
should become an integral part of on-going
national nutrition surveys.
Research should be carried out to establish
the prevalence of poor nutritional status in
older people in Ireland and to identify those
groups with specific nutritional deficiencies.
A validated nutritional assessment tool needs to
be developed to facilitate the practical assessment
of the nutritional status of older people.
The development of reference data for
anthropometry and biochemistry for older
people is urgently needed.
Recommended dietary allowances specifically
for older people need to be researched and
developed.
Research is required to investigate barriers
that affect access to healthy food choices for
older people.
The requirements of older people with specific
poor nutritional status, e.g. dementia, should be
investigated so that specific recommendations
can be developed for these groups and their
carers.
Dietary guidelines
The dietary guidelines outlined in this policy
should be made available to older people so
that they can be used as the basis for making
healthy food choices. These guidelines will
need to be reviewed on a regular basis taking
into account the findings of scientific research.
Supportive environments
The recommendations outlined in the
document “Adding Years to Life and Life to Years:
A Health Promotion Strategy for Older People” (8)
should be implemented. Recommendations
include those for transport, income and
housing, all of which affect access to healthy
food choices by older people.
The retail sector should be encouraged to
initiate and extend facilities provided for the
older consumer particularly in grocer shops
and supermarkets. Such facilities could include
the wider availability of delivery services.
F O O D S A F E T Y AU T H O R I T Y O F I R E L A N D
V

Caterers should be familiar with healthy eating
guidelines. Catering training should include
nutrition information relating to the specific
needs of older people.
Community action
A nutrition health promotion programme for
the specific needs of the older person should
be developed and implemented at both
national and local level. Community
nutritionists/dieticians can facilitate this
process in each health board in association
with other service providers such as public
health nurses and co-ordinators for services
for older people.
Those providing community meals, e.g. day
care centre workers and those preparing
meals-on-wheels should be aware of the
specific needs and preferences of the older
person. Regular monitoring of the content of
community meals should be undertaken in
each health board area.
Practical easy-to follow food based dietary
guidelines should be developed and made
available to those caring and providing meals
for older people. Family carers and those
providing the Home Help service for older
people should be encouraged to become
familiar with the dietary guidelines for older
people that are contained in this policy
document.
In order to implement this policy it is essential
that health professionals are educated in the
principles of nutrition for older people. This
will require an increased emphasis on nutrition
education and recognition of the importance
of nutrition as a scientific discipline in public
health and medicine. In-service training should
be provided on a continuous basis in
association with services for older people in
each health board and care facility.
Health services
A co-ordinated nutrition service for older
people should be developed as a matter of
urgency. It is recommended that all health
boards should establish a dedicated Nutrition
and Dietetic Advisory Service for older
people. The Eastern Health Board provides a
model of good practice in this area.
Acute hospital setting
Hospitals that specialise in age-related health
care require a dedicated nutrition and dietetic
service.
All acute hospitals should have formal access to
nutrition and dietetic services for age-related
health care for a specified amount of time.
Day hospitals for older people should have
formal access to a specialist in nutrition and
dietetics.
F O O D S A F E T Y AU T H O R I T Y O F I R E L A N D
VI

Long-term care
Formal access to nutrition and dietetic
services should be provided for community
hospitals and welfare homes to assist in the
provision of therapeutic diets and nutritional
support. This would facilitate the monitoring
of menus regularly for nutritional adequacy
and suitability to the individual needs of the
older person.
Nutritional standards should be added by
statute to the standards set in the Nursing
Homes (Care and Welfare) Regulations, 1993
(S.I. No. 226 of 1993).
Primary health care professionals should have
formal access to nutrition and dietetic services
to assist them in supporting the acutely and/or
chronically ill older people in the community.
Caterers in acute hospitals and long-term care
facilities should become familiar with the
specific nutritional needs of older people.
Developing personal skills
The implementation of this policy should
include the development of groups and
resources at local level that include older
people themselves.
F O O D S A F E T Y AU T H O R I T Y O F I R E L A N D
VII

Dietary guidelines
The principle dietary guidelines for healthy older people are:
• A wide variety of foods, including those with high nutrient density should be eaten regularly.
• Energy intake should be balanced with physical activity.
• Starchy foods should be eaten throughout the day. For people with an acute and/or chronic illness
with a limited appetite, intake of starchy foods should be modified to suit their individual needs.
Excessive consumption of sugar dense foods should be avoided.
• For those who are healthy, four or more portions of fruit and vegetables should be eaten daily.
People with an acute and/or chronic illness should modify their fruit and vegetable intake to suit
their individual needs.
• An adequate intake of high fibre foods and fluids should be maintained.
• Meat, poultry and fish should be eaten regularly. Dairy foods such as milk, yoghurt and cheese
should be eaten daily. For those with an acute and/or chronic illness, an increased intake of dairy
foods may be recommended. Fortified milk should be consumed by all older people unless
otherwise recommended.
• For those who are healthy, a moderate fat intake, with a mixture of fats should be included in the
diet. For those who have an acute and/or chronic illness, fat intake should be modified to suit
their individual needs.
• At least eight cups/glasses of fluids should be drunk each day.
• Enriched foods, fortified foods and dietary supplements should be used where specifically indicated
for an individual but a nutritional assessment is required prior to such food modification. The use
of dietary supplements should be reviewed regularly.
• Alcohol should be consumed in moderation.
F O O D S A F E T Y AU T H O R I T Y O F I R E L A N D
VIII

1.1 Background
The older population is growing worldwide in both developed and developing countries. In 1990, 13.7%
of Europe’s population was over 65 years and it is projected that by 2025, this proportion will have
increased to 22.4% (1). In 1996,11.4% of the Irish population was over 65 years of age and this percentage
is expected to increase to 14.1% in 2011 (2). In Ireland in 1960, the life expectancy at birth was 68 years
for males and 71 years for females whereas in 1995 life expectancy was 74 and 79 years respectively.
In Ireland the high birth rate in the 1970’s (3) together with the increase in life expectancy indicates
that the number of people aged over 65 is likely to increase from 393,000 in 1988 to 688,000 in 2025
(4). Also, due to the subsequent low birth rates from the early 1980’s to date (5), the number of older
people as a percentage of the total population is predicted to increase.
Social, economic, physiological and psychological factors and adverse health conditions may influence
eating habits. Poor dietary intake and subsequent poor nutritional status can result in or exacerbate
many conditions of ill health such as cancer, cardiovascular disease, diabetes, etc. As the population
gets older, the prevalence of these diseases is also increasing.
1.2 Terms of reference and aims of the report
The Working Group on a Food and Nutrition Policy for Older People was established with the
following terms of reference:
• To produce recommendations for a food and nutrition policy for older people in Ireland.
• To produce a policy document for the Nutrition Sub-committee of the Food Safety Authority of
Ireland.
This report sets out to facilitate the development and maintenance of good health for older people
through appropriate food consumption. The objectives are to:
• Attempt to ensure adequate food and nutrient intake
• Prevent poor nutritional status
• Avoid excessive food and nutrient intake which may predispose to several chronic diseases
F O O D S A F E T Y AU T H O R I T Y O F I R E L A N D
CHAPTER 1 : INTRODUCTION
1

To this end the Working Group set out to:
• Examine the rationale for a food and nutrition policy for older people
• Develop food and nutrition guidelines for key people involved in the care of older people
• Consider the current service provision for older people
• Make recommendations for the future development and implementation of a Food and Nutrition
Policy for Older People.
F O O D S A F E T Y AU T H O R I T Y O F I R E L A N D
2

2.1 Characteristics of the older population
With advancing age, reserve and storage capacities decline, as do regulatory and recovery abilities.
While these characteristics are associated with all ageing people, these physiological changes depend
substantially on individual conditions and environments. As with the total population, older people
are a heterogeneous population with varying needs. Prior to reviewing the nutritional status and
requirements of this sector of the population it is important to decide on what is meant by the term
“older” and the relationship between age and nutritional status.
2.1.1 Age and demographic trends
The most commonly used definition of old age is based upon chronological age usually taking 65 years
and over as a broad indicator, with pre-retirement age usually 55 - 64 years (6). Throughout this
document the term that will be used for the population aged 65 years and over is “older people” with
sub-categories as follows:
• ‘Young old’ who are aged between 65 and 74 years
• ‘Older old’ who are aged 75 years and over (7, 8).
An expansion in the older population is evident in Ireland with this section of the population
increasing from 10.9% in 1986 to 11.4% in 1996 (9, 2). It is projected that this growth will continue
in the period 1996-2011 when the proportion of the Irish population over 65 years is anticipated to
reach 14.1% (10). While this expansion is expected throughout the older population, the largest
increase is expected in the oldest age sub-group, i.e. those aged 80 years and over. The number of
people in that age group is expected to increase from 79,000 in 1991 (2.2% of the total population)
to 130,000 in 2011 (3.5% of the total population) which is an increase of almost two-thirds (10).
Approximately 91% of the population aged 65 and over in Ireland live in the community in private
households (11). Of these free-living individuals, 26% live alone, of which 20% are male and 31%
female.
As this older population increases, there is also an increase in the need for improved social structures,
e.g. easy access to public transport, a health/medical system to assist those with ailing health and the
necessary advice and ability to obtain a satisfactory nutritional status.
F O O D S A F E T Y AU T H O R I T Y O F I R E L A N D
CHAPTER 2 : RATIONALE FOR A FOOD AND NUTRITIONPOLICY FOR OLDER PEOPLE
3

2.1.2 Nutritional needs of the older
population
Older people represent a very heterogeneous
population in terms of health, physiological
function and susceptibility to disease. For any
given physiological function, the distribution and
heterogeneity of that function becomes more
diverse as the population ages. Digestion, for
example may decline at a slow rate in one older
person but at a faster rate in another person of
the same age. The age at which disability and
increased susceptibility to infection occurs will
be dependent upon the rate of decline of
various physiological functions (12).
The nutritional needs of this group therefore,
are varied and wide-ranging (13) and could be
summarised as follows:
• Healthy older people - Those for whom the
nutritional requirements are similar to
younger adults with the exception of a
number of specific vitamins and minerals.
• Acutely ill older people - Those for whom
nutritional requirements have changed in
response to the stress of an acute illness.
• Chronically ill older people - Those for
whom dietary intakes may be inadequate
and there is an increased need for specific
nutrients.
Nutritional requirements of any one individual
depend on a variety of factors. However, the
health status of these individuals at any one
time will have a crucial effect on their
nutritional requirements.
2.2 Health status
The health status of an individual depends on a
variety of factors, e.g. level of physical activity,
mental health, agility, etc. The health status of
a given population is measured primarily using
indices such as life expectancy, mortality and
morbidity rates. Nutritional status of a given
population is also an indicator of health status,
although for older people nutritional status is
not always easy to measure.
2.2.1 Life expectancy
Over the last 4 decades life expectancy has
steadily increased for both sexes aged over 60
years (Figure 2.1.). From 1950 to 1994 the life
expectancy of women aged 65 increased by
4.1 years and the increase in life expectancy
for men in the same age group was 1.8 years
(14).
F O O D S A F E T Y AU T H O R I T Y O F I R E L A N D
4

Figure 2.1. Life expectancy in Ireland for people aged 65 (1950 to 1994)
1950-1952 1970-1972 1990-1992 1994
65 years + 12.1 + 12.4 + 13.4 + 13.9 years years years years years
65 years + 13.3 + 15 + 17.1 + 17.4 years years years years
In 1994, life expectancy for both sexes aged 65 in Ireland was the lowest compared with all other
countries in the European Union (Figure 2.2.) (8).
Figure 2.2. Life expectancy at 65 years for people in select EU countries, 1994
* all data for 1994 except Italy 1992, Spain 1993, EU Average 1992
** Provisional data
Source: Demographic Statistics, Eurostat 1996. Adapted from National Council on Ageing and Older People, 1998 (8)
2.2.2 Mortality rates for older people in Ireland
The principle causes of death (Figure 2.3.) in people aged 65 and over in Ireland in 1997 were diseases
of the circulatory system (including coronary heart disease, stroke and other cardiovascular diseases),
cancer and pneumonia. Mortality resulting from these diseases accounts for 75% of all deaths in both
the young old and the older old.
F O O D S A F E T Y AU T H O R I T Y O F I R E L A N D
5
0 5 10 15 20 25
Male
Female
EU AverageUnited Kingdom
SweedenSpain
PortugalNetherlandsLuxembourg
ItalyIrelandGreece
GermanyFrance**
FinlandDenmark
BelgiumAustria
Life Expectancy in years
Co
untr
y

Figure 2.3. Death by principle cause in people aged 65-74 and 75+ in Ireland, 1997
* total figure including coronary heart disease, stroke and all other circulatory diseases
Source: Central Statistics Office, Ireland 1997 (2)
These figures follow the pattern of previous years, with (a) cardiovascular disease representing the
most common cause of death in those aged 65 and over and (b) cancer representing the second most
common cause of death in the same age group.
(a) Cardiovascular disease
The two principle cardiovascular diseases (CVD) in Ireland are coronary heart disease (CHD) and
stroke. CHD is the major cause of death in both the young old and the older old age groups (26% and
24% respectively), and stroke is the cause of 7% of deaths in the young old and 11% in the older old.
Although the trend in CHD and stroke mortality has fallen (19% and 33% respectively measured from
the early 1980s), death due to cardiovascular disease in this age group remains higher in Ireland than
in other EU countries (Figure 2.4.) (8).
F O O D S A F E T Y AU T H O R I T Y O F I R E L A N D
6
0
10
20
30
40
50
Cardiovascular diseases in total
Pneumonia
65-74
75 and over
Cancer all other causes
Perc
enta
ge
Cause of death
42%
48%
32%
17%
4%
10%
22%24%

Figure 2.4. Deaths due to heat disease in people aged 65-74 in select EU countries
Source:World Health Statistics Annual, 1993 and 1994. Adapted from National Council on Ageing and Older People, 1998 (8)
(b) Cancer
The overall death rate from cancer in Ireland is increasing and is also above the EU average (8).This
increase in mortality is principally in older people (71% of all cancer deaths in 1997 occurred in those
over 65 years (2)), with trachea, bronchus and lung cancer presenting the main causes of cancer
deaths (Figure 2.5.).
Cancer is a multi-stage process with many inextricably linked causal factors such as lifestyle, genetic
make-up, diet, environment etc. Evidence of contributory factors for the emergence of each stage of
carcinogenesis is regularly emerging and a wide variety of dietary factors may influence each stage of
the process.
F O O D S A F E T Y AU T H O R I T Y O F I R E L A N D
7
0
300
600
900
1200
1500
Irelan
dUK
Male
Female
Dea
ths
per
100,
000
Denm
ark
Germ
any
Net
herla
nds
Greec
eSpa
in
Fran
ceIta
ly

Figure 2.5. Proportion of deaths due to various types of cancer, Ireland 1997
Source: Central Statistics Office, Ireland 1997 (2)
Among the most common chronic diseases (including cardiovascular and cerebrovascular diseases,
cancer, diabetes, osteoporosis, constipation) older people suffer from are those which are directly
linked to a combination of inappropriate diet and unhealthy lifestyles. Inadequate intake of some
vitamins and minerals are also particularly liable to occur among older people as they adopt more
limited diets. This reduced vitamin and mineral intake can cause specific nutritional diseases or
disorders among older people (15) and early detection of poor nutritional status can assist in the
treatment and/or prevention of many conditions.
2.3 Nutritional status
Nutritional well-being is influenced by the nutrient content of foods consumed relative to
requirements that are determined by age, sex, level of physical activity and health status, as well as the
efficiency of nutrient utilisation by the body. Factors such as mental activity, social interactions and
socioeconomic conditions also influence nutritional status. Across the population spectrum, ensuring
an optimum nutritional status by meeting nutritional needs is essential for healthy ageing (16).
A diet is adequate when it provides sufficient energy, protein, fat, carbohydrate, micronutrients
(vitamins and minerals) and other essential components, including dietary fibre to meet the body’s
F O O D S A F E T Y AU T H O R I T Y O F I R E L A N D
8
0
10
20
30
40
50
60
Other Trachea, bronchus &
lung
Perc
enta
ge
Female breast
Stomach Leukae-mia
Cervicuteri
65-74
75 and over
Colon Rectum,rectosigmoid
junction and anus
Type of Cancer

needs in a balanced and diversified manner. If intakes are too low, nutritional deficiencies may occur,
e.g. anaemic and non-anaemic iron deficiency and osteomalacia due to Vitamin D deficiency. On the
other hand, if intakes are excessive, other nutrition-related problems may arise, e.g. the development
of overweight/obesity if more energy is eaten in the diet than is used for growth and activity.Adequate
nutrient intakes are needed to meet energy expenditures of metabolism, physical and mental activity
and also in response to disease and growth (17).
A number of risk factors (see 2.3.2) have been highlighted among the older population which
potentially compromise their nutritional status (18) and may play a role in the development of
debilitating diseases. By identifying such risk factors it should be possible to target individuals or
groups who may be susceptible (19), with a view to preventing and treating poor nutritional status.
2.3.1 Nutritional assessment
Nutritional assessment can identify both those with a poor nutritional status and also those who are
at risk of developing a poor nutritional status. Several methods of assessment are available to
measure a patient’s nutritional status including anthropometric and biochemical measurements and
evaluation of dietary intake.
• Anthropometric measurements consist of body weight, height and skinfold thickness. As ageing
affects body shape, size and composition, obtaining skeletal size from height alone is
unsatisfactory and similarly skinfold thickness measurements only offer a rough guide to body
fatness (16). Body mass index (BMI) is a ratio of weight (in kilograms) over height (in metres
squared) and can be used as a simple indicator of overweight or underweight (20).
The following classification system for BMI is very widely used:
Table 2.1. Body mass index classifications
BMI (kg/m2) Class
<20 Underweight
20-25 Ideal range
25-30 Overweight
>30 Obese
Source:Webb and Copeman, 1996 (16)
F O O D S A F E T Y AU T H O R I T Y O F I R E L A N D
9

The underlying assumption when using BMI to
indicate body fatness is that differences in
weight for any given height are largely due to
differences in body fat content. Loss of height
with age and an increase in the fat to lean ratio
in older people may make the use of the
standard classification system for BMI less
reliable (16). The most appropriate
measurement of height for this age group is
that of the demispan (distance from the web of
the fingers to the sternal notch when the
subject’s arm is held horizontally to the side),
armspan or knee height (7, 21).
As a single parameter BMI cannot be diagnostic
of malnutrition, but it is a useful adjunct to
other anthropometric and biochemical
measurements in nutritional assessment and
may be used in screening programs for
undernutrition in older people (21).
• Biochemical measurements - Many assays,
e.g. serum albumin, transferrin and
micronutrients, are used for the measurement
of tissue, serum and plasma proteins, vitamins
and minerals.They are generally sensitive
indicators of nutritional status. These
measurements however, may be influenced by
factors other than nutritional status such as
medical condition and age (22) and they are
also quite labour intensive and expensive.
• Dietary intake - A range of methods is
available for the evaluation of dietary intake.
Past intake may be assessed by interview or
questionnaire and present intake by records at
the time of eating. Either approach may be
qualitative or quantitative (23), however all the
methods of dietary intake measurement are
subject to error and uncertainties (16).
Simple assessment tools have recently been
developed to assist in the detection of poor
nutritional status in the older person (24, 25,
26, 27), e.g. the Mini Nutritional Assessment.
This was developed by Guigoz et al, (28) and
consists of 18 simple and rapid-to-measure
items. It involves anthropometric assessment,
general assessment, dietary assessment and
subjective assessment. The results categorise
older patients as: (i) well nourished; (ii) at risk
for malnutrition; or (iii) malnourished. Simple
tools such as these can facilitate the design of
appropriate and relevant nutrition
interventions to improve the nutritional status
of older people.
In the older person however, assessment is
fraught with difficulty (29). Currently no gold
standard exists which is practical, efficient, valid
and reliable enough to warrant routine use in
the Irish clinical or community geriatric
assessment setting. Careful interpretation of
information gained from any assessment is of
paramount importance to the usefulness of
results (30).
F O O D S A F E T Y AU T H O R I T Y O F I R E L A N D
10
2.3.2 Classifications of poor
nutritional status
Poor nutritional status may be observed in the
presence or absence of disease states. Lack of
interest in food, reduced taste acuity, poor
food choice and psychiatric morbidity all
contribute to this condition (31) (see 2.3.3).
Davis (32) suggested four main classifications
of poor nutritional status which generally
affect the older person. They are distinct, yet
are often interrelated and comprise long-
standing, recurrent, sudden and specific:
Long standing - Some people exhibit long
latent periods between the onset of nutritional
deficiency and its clinical appearance. This is
generally due to a combination of
circumstances, e.g. social isolation, depression,
undiagnosed disease or limited income
reducing nutrient intake (33). Over a
prolonged period of time body nutrient stores
become depleted, placing the individual at risk
of developing poor nutritional status (34).
Recurrent - In some cases there is a repeated
return to a poor nutritional status which is
accompanied by a reduced resistance to
disease. This recurrent class of poor
nutritional status is often associated with co-
existing medical disorders (19) and repeated
hospital admissions (35).
Sudden - Sudden occurrence of poor
nutritional status is usually related to acute
medical or social stress. Research has shown
that bereavement may contribute to a poorer
quality diet and reduced energy intake (36).
Hip fracture may result in sudden reduced
nutrient intake and weight loss (37).
Specific - This includes the occurrence of
deficiency diseases and nutrition related
conditions, e.g. arthritis, cognitive impairment,
constipation, diabetes, dysphagia, macular
degeneration/cataract, osteoporosis,
cardiovascular diseases, obesity or
underweight and wound healing. These are
considered in more detail in section 2.4.
F O O D S A F E T Y AU T H O R I T Y O F I R E L A N D
11

2.3.3 Identifying risk factors associated with poor nutritional status
Many studies have been performed on the nutrition of older people in order to distinguish relevant
risk factors (19, 13) (Table 2.1.).
These factors are often interrelated and are rarely seen in isolation.
Table 2.2. Summary of common risk factors affecting nutritional status
Being housebound/institutionalised Chronic ill health
Socio-economic status Polypharmacy
Social isolation & loneliness Physiological ageing
Psychiatric morbidity Cognitive impairment/deterioration
Poor dentition Service provision factors (see Table 2.3.)
Source: Lipschitz, 1991 (19),Web and Copeman, 1996 (16)
Homebound or long term care residents - Nutritional deficiencies have been observed more
frequently in long term care residents than in an independent population (34, 18, 13, 38).
Socio-economic status - Lack of education, income and adequate facilities to prepare food have
been identified by a number of researchers as predisposing the older independent person to
decreased nutrient intake (39).
Social isolation and loneliness have both been shown to predispose to poor quality diets and low
energy intake (40, 36, 39).
Psychiatric morbidity - In patients with depression or dementia, apathy, general unhappiness, low
morale, forgetfulness, inability to prepare food, low energy levels and loss of appetite may all directly
affect nutritional status (41).
Poor dentition may reduce the intake of foods which could lead to an inadequate intake of fibre
and protein (42).
F O O D S A F E T Y AU T H O R I T Y O F I R E L A N D
12

Chronic ill health and multiple diseases can contribute to under-nourishment. This contribution
could be due to increased requirements or interference with uptake and/or utilisation of nutrients,
which may be secondary to disease processes or medication (34, 38).
Polypharmacy (the use of several prescribed and/or non-prescribed drugs at the same time) may
interfere with the absorption and metabolism of essential nutrients among older individuals (42)
placing them at risk of developing a poor nutritional status (43).
Physiological ageing and age per se, result in the gradual loss of efficiency of many body systems,
(decreased taste acuity, gut motility etc.) which can directly affect food intake, absorption and
utilisation (42, 31).
Cognitive impairment/deterioration can be contributed to or be exacerbated by nutritional
deficiencies (44).
Table 2.3. Service provision factors affecting nutritional status in older hospital patients
(or clients in residential and nursing homes)
• In many hospitals, the serving of meals is not timed appropriately, leading to long enforced fasts
throughout the day.
• Prolonged holding of food prior to serving leads to deterioration of both nutritional quality and
palatability.
• Inherently unappetising food and limited choice.
• Providing patients with portions of food that are insufficient for their needs due to staff
underestimation.
• Food wastage not monitored or recorded by staff and so very low intakes are not recognised early.
• Inadequate amount of time allowed for slow eaters to finish their meals.
• Lack of staff help and/or feeding aids for those who need help with eating.
Source: adapted from Webb and Copeman, 1996 (16)
The early identification and treatment of poor nutritional status could reduce the risk of disease
complications and reduce the length of hospital stay (27).
F O O D S A F E T Y AU T H O R I T Y O F I R E L A N D
13

2.3.4 Incidence of poor nutritional status
In Ireland, there is a paucity of data available. The 1990 Irish National Nutrition Survey (INNS)
revealed that for all nutrients except vitamin D and folate, the diet of the total healthy Irish population
was nutritionally adequate (45). However, there is little data available on dietary intake that is specific
to the older population.A number of studies have been carried out in other countries, indicating the
nutritional status of older people and Tables 2.4. to 2.7. outline the findings of these studies.
For ease of comparison, the studies have been divided into those carried out on:
• Institutionalised older people in nursing homes and long term care settings (Table 2.4.)
• Older people in the acute hospital setting (those recently admitted to acute hospital setting
where the duration of stay does not exceed 150 days) (Table 2.5.)
• Homebound older people (Table 2.6.)
• Free-living older people (Table 2.7.)
F O O D S A F E T Y AU T H O R I T Y O F I R E L A N D
14

F O O D S A F E T Y AU T H O R I T Y O F I R E L A N D
15
Tabl
e 2.
4.In
tern
atio
nal s
tudi
es in
dica
ting
po
or
nutr
itio
nal s
tatu
s in
inst
itut
iona
lised
old
er p
eopl
e
Cou
ntry
of
Pap
er t
itle
and
refe
renc
e K
ey r
esul
ts
rese
arch
USA
Fact
ors
asso
ciate
d w
ith lo
w b
ody
mas
s in
dex
and
wei
ght
loss
in n
ursin
g ho
me
resid
ents
(46
).U
SAM
alnu
triti
on in
the
inst
itutio
nalis
ed o
lder
ad
ult
(47)
.U
K
A st
udy
of n
utrit
iona
l def
icits
of l
ong-
stay
ge
riatr
ic pa
tient
s (4
8).
Fran
ce
Antio
xida
nt v
itam
ins
in h
ospi
talis
ed e
lder
lypa
tient
s:an
alys
ed d
ieta
ry in
take
s an
d bi
oche
mica
l sta
tus
(49)
.
Tabl
e.2.
5.In
tern
atio
nal s
tudi
es in
dica
ting
po
or
nutr
itio
nal s
tatu
s in
old
er p
eopl
e in
the
acu
te h
osp
ital
set
ting
Cou
ntry
of
Pap
er t
itle
and
refe
renc
e K
ey r
esul
ts
rese
arch
Ir
elan
dPe
rson
al c
omm
unica
tion
(50)
.
Irel
and
The
iden
tifica
tion
and
asse
ssm
ent
of
unde
r nu
triti
on in
pat
ient
s ad
mitt
ed t
o th
e ag
e re
late
d he
alth
car
e un
it of
an
acut
e D
ublin
gen
eral
hos
pita
l (26
).N
orw
ayRe
duce
d nu
triti
onal
sta
tus
in a
n el
derly
pop
ulat
ion
(>70
yea
rs)
is pr
obab
le b
efor
e di
seas
e an
d po
ssib
ly co
ntrib
utes
to
the
deve
lopm
ent
of
dise
ase
(51)
.Sw
eden
Nut
ritio
nal s
tatu
s in
rec
ently
ho
spita
lised
and
free
-livin
g el
derly
su
bjec
ts (
52).
Poor
ora
l int
ake,
eatin
g de
pend
ency
,dec
ubiti
and
che
win
g pr
oble
ms
incr
ease
the
like
lihoo
dof
bo
th
low
BM
I an
d w
eigh
t lo
ss.
Und
ernu
triti
on
in
nurs
ing
hom
e re
side
nts
is
am
ultif
acto
rial
syn
drom
e.Te
n to
85%
of o
lder
adu
lts r
esid
ing
in lo
ng-t
erm
car
e se
ttin
gs a
re m
alno
uris
hed.
All
of t
he e
lder
ly lo
ng-s
tay
hosp
ital p
atie
nts
cons
umed
< 2
/3 R
DA
for
vita
min
s D
,E, B
6an
dfo
lic a
cid,
whi
le m
ost
wer
e al
so c
onsu
min
g <
2/3
RD
A fo
r m
agne
sium
,die
tary
fibr
e,re
tinol
,ir
on a
nd p
anto
then
ic a
cid.
Ove
r ha
lf of
the
se s
ubje
cts
had
a di
et d
efic
ient
in e
nerg
y w
hen
leve
ls o
f phy
sica
l act
ivity
wer
e ta
ken
into
acc
ount
.T
he s
tudy
hig
hlig
hts
low
ant
ioxi
dant
vita
min
inta
kes,
part
icul
arly
vita
min
s E
and
C a
nd a
nim
port
ant
prop
ortio
n of
lo
w
bloo
d vi
tam
in
C
and
beta
-car
oten
e co
ncen
trat
ions
in
hosp
italis
ed e
lder
ly w
omen
.
From
218
acu
te h
ospi
tal
patie
nts
surv
eyed
,16
% h
ad a
BM
I be
low
20
and
10%
wer
em
alno
uris
hed.
Mea
n BM
I be
low
19.
2,al
bum
in b
elow
34g
/l an
d un
derw
eigh
t w
as o
bser
ved
in h
alf
of t
hepa
tient
s in
an
acut
e ho
spita
l set
ting.
Inta
ke o
f vi
tam
ins
and
trac
e el
emen
ts <
2/3
of
the
US
RD
As
was
mor
e co
mm
on i
n th
eho
spita
l gro
up (
rece
ntly
hos
pita
lised
) w
hen
com
pare
d w
ith t
he h
ome
livin
g gr
oup.
Low
nut
ritio
nal i
ndic
es a
re a
com
mon
occ
urre
nce
in e
lder
ly s
ubje
cts
rece
ntly
adm
itted
to
hosp
ital a
nd u
nder
nutr
ition
is r
elat
ed t
o th
e na
ture
of t
he d
isea
se r
athe
r th
an a
ge.

F O O D S A F E T Y AU T H O R I T Y O F I R E L A N D
16
Tabl
e 2.
6.In
tern
atio
nal s
tudi
es in
dica
ting
po
or
nutr
itio
nal s
tatu
s in
ho
meb
oun
d o
lder
peo
ple
Co
untr
y o
f P
aper
tit
le a
nd r
efer
ence
K
ey r
esul
ts
rese
arch
USA
D
ieta
ry c
hara
cter
istics
and
nut
rient
inta
ke in
an
urba
n ho
meb
ound
pop
ulat
ion
(53)
.
USA
Nut
ritio
nal s
tatu
s of
urb
an h
omeb
ound
old
er
adul
ts (
38).
USA
Vi
tam
in D
def
icien
cy in
hom
ebou
nd e
lder
ly pe
rson
s (5
4).
Tabl
e.2.
7.In
tern
atio
nal s
tudi
es in
dica
ting
po
or
nutr
itio
nal s
tatu
s in
fre
e liv
ing
old
er p
eopl
e
Co
untr
y o
f P
aper
tit
le a
nd r
efer
ence
K
ey r
esul
ts
rese
arch
Irel
and
Asse
ssm
ent
of t
he n
utrit
iona
l sta
tus
of r
ural
an
d ur
ban
elde
rly p
eopl
e liv
ing
at h
ome
(55)
.Ir
elan
d Pe
rson
al c
omm
unica
tion
(50)
.
USA
W
hat
is th
e nu
triti
onal
sta
tus
of t
he
elde
rly (
56)?
USA
N
utrit
iona
l risk
in N
ew E
ngla
nd e
lder
s (5
7).
Ital
y N
utrit
iona
l int
ake,
socio
-eco
nom
ic co
nditi
ons,
and
heal
th s
tatu
s in
a la
rge
elde
rly p
opul
atio
n (5
8).
Finl
and
The
nutr
ition
al s
tatu
s of
Fin
nish
hom
e-liv
ing
elde
rly p
eopl
e an
d th
e re
latio
nshi
p be
twee
n en
ergy
inta
ke a
nd c
hron
ic di
seas
es (
59).
Can
ada
Fola
te a
nd v
itam
in B
12st
atus
of t
he
elde
rly (
60).
Mea
n in
take
of
ener
gy,f
olic
aci
d an
d ca
lciu
m w
as b
elow
the
RD
As
for
both
men
and
wom
en,a
nd in
take
of t
hiam
in w
as b
elow
the
RD
A fo
r m
en.
Nut
rien
t in
take
faile
d to
mee
tth
e R
DA
s fo
r ni
ne le
ader
nut
rien
ts in
40-
80%
of t
he s
ampl
e po
pula
tion.
Thi
s st
udy
foun
d a
high
pre
vale
nce
of u
nder
nutr
ition
in
urba
n ho
meb
ound
old
er a
dults
.54
% c
onsu
med
< 7
5% o
f the
ir e
nerg
y ne
eds,
38%
con
sum
ed <
75%
of t
heir
pro
tein
nee
ds,
29%
of
the
wom
en a
nd 6
3% o
f th
e m
en h
ad B
MI
belo
w 2
4,in
dica
ting
that
the
se s
ubje
cts
wer
e un
derw
eigh
t.D
espi
te a
rel
ativ
ely
high
deg
ree
of v
itam
in s
uppl
emen
tatio
n in
the
USA
,hom
ebou
nd e
lder
lype
rson
s ar
e lik
ely
to s
uffe
r fr
om v
itam
in D
def
icie
ncy.
Nut
ritio
nal i
nade
quac
y ex
ists
in b
oth
rura
l and
urb
an s
ubje
cts
stud
ied.
Die
tary
inta
ke o
fbo
th s
ubje
ct g
roup
s is
inad
equa
te w
hen
com
pare
d to
80%
of R
DA
for
elde
rly
Iris
h su
bjec
ts.
In t
his
stud
y 47
pat
ient
s ag
ed 6
5 an
d ov
er,a
tten
ding
thr
ee g
ener
al p
ract
ition
ers
wer
enu
triti
onal
ly a
sses
sed.
With
in t
his
grou
p,15
% w
ere
clas
sifie
d as
und
erw
eigh
t (B
MI<
20)
and
18%
wer
e cl
assi
fied
as o
bese
(BM
I>30
).Th
e pe
rcen
tage
of p
eopl
e w
ith v
itam
in a
nd m
iner
al in
take
s be
low
2/3
of t
he R
DA
was
com
mon
.Lo
w n
utrie
nt in
take
s inc
lude
d th
ose
of v
itam
ins A
,D,t
hiam
in,r
ibof
lavin
,folic
aci
d,ca
lciu
m a
nd z
inc.
41.5
% o
f sub
ject
s w
ere
over
wei
ght
and
mea
n di
etar
y lip
id in
take
s w
ere
cons
ider
ably
abo
vere
com
men
ded
leve
ls.16
% w
ere
unde
rwei
ght,
mea
n di
etar
y ca
lciu
m le
vels
wer
e lo
w a
nd a
bout
28%
of o
lder
indi
vidu
als
faile
d to
con
sum
e ad
equa
te le
vels
for
thre
e or
mor
e ke
y nu
trie
nts.
90%
of o
lder
peo
ple
exam
ined
sho
wed
inad
equa
te in
take
of t
hiam
in a
nd v
itam
in B
6 ,30
-40%
dem
onst
rate
d de
ficie
ncie
s of
vita
min
A,v
itam
in C
,nia
cin,
vita
min
B12,c
alci
um a
nd ir
on,w
hile
only
10%
had
inad
equa
te in
take
of p
rote
in.
Ener
gy in
take
in w
omen
was
low
com
pare
d w
ith t
he N
ordi
c N
utri
ent
Rec
omm
enda
tion.
The
inta
kes
of v
itam
ins
and
min
eral
s m
et t
he r
ecom
men
datio
ns,e
xcep
t fo
r th
ose
of fo
licac
id a
nd z
inc.
Prob
abili
ty a
naly
sis
of d
ieta
ry in
take
rev
eale
d an
app
reci
able
num
ber
of s
ubje
cts
at r
isk
ofde
ficie
ncy
of v
itam
in B
12an
d al
so o
f fol
ate
defic
ienc
y.

2.4 Nutrition related diseases and conditions
2.4.1 Relationship between diet and
chronic non-infectious diseases
Diet alone does not cause diseases such as
cardiovascular disease, cancer, diabetes
mellitus, etc. but it is a contributory factor in
conjunction with environmental and genetic
influences (61).
Among the most common chronic diseases
older people suffer from are those which are
directly linked to a combination of
inappropriate diet and unhealthy lifestyles.
These chronic diseases include cardiovascular
and cerebrovascular diseases, cancer, diabetes
and osteoporosis. Inadequate intake of some
vitamins and minerals are also particularly liable
to occur among older people as they adopt
more limited diets and these inadequate
intakes potentially cause specific nutritional
diseases or disorders among older people (17).
The following section outlines the relationship
between a variety of diseases and nutrition.
(a) Cardiovascular diseases
(including CHD and stroke)
A variety of risk factors are known to
contribute to the development of
cardiovascular disease. Increasing age,
smoking, physical inactivity and other factors
(see below) are known to play a role and many
of these are interrelated. In addition many have
been identified as nutrition related.
Risk factors contributing to the development
of CVD:
• Plasma total cholesterol, triglyceride
levels and fat intake - Numerous
epidemiological and clinical studies have
demonstrated a strong, continuous and
positive relationship between plasma total
cholesterol and risk of CHD. Cholesterol
is transported around the body primarily
by lipoproteins, of which high density
lipoprotein (HDL) and low density
lipoprotein (LDL) are the two principle
forms. The relationship between plasma
total cholesterol and risk of coronary
heart disease resides mainly in the LDL
fraction. Several large prospective studies
and intervention trials have indicated that
high LDL concentration and/or low HDL
concentration represent an independent
risk for CHD. Extensive evidence has also
shown that replacement of saturated fatty
acids in the diet by polyunsaturated fatty
acids is associated with reduced coronary
risk (62).
• High blood pressure - Epidemiological
studies have consistently identified an
important and independent link between
F O O D S A F E T Y AU T H O R I T Y O F I R E L A N D
17

high blood pressure (hypertension) and
various disorders, especially CHD, stroke,
congestive heart failure and impaired renal
function. Hypertension is more common
in people aged 65 years or more. In
absolute terms, hypertension is a much
greater risk factor for cardiovascular
events in older people than it is in young
people (63).
High blood pressure increases the heart’s
workload causing it to enlarge and weaken
over time (64). High blood pressure is the
main risk factor for stroke, with obesity,
alcohol intake and excess salt intake playing
major contributory roles (65, 16). In 1988 the
Intersalt Study (66) (an interpopulation study
involving 10,079 men and women in 52 centres
from 32 countries) assessed the role of
obesity, alcohol and mineral intake in
determining the progressive rise in blood
pressure seen with age in most countries. A
high BMI and high alcohol intake had strong,
independent effects on blood pressure:
- Obesity and overweight
Excess body weight increases the workload of
the heart and is directly linked with CHD
because it influences blood pressure, blood
cholesterol and triglyceride levels and increases
the likelihood of developing diabetes (64).Non-
insulin-dependent diabetes mellitus is two to
three times as frequent in hypertensive
populations than it is in non-hypertensive
populations (63). Excess fatness in adults
causes metabolic changes which increase the
risk of cardiovascular and other diseases (67).
- Excessive alcohol intake
Excessive alcohol intake can raise blood
pressure, and contribute to obesity, raised
triglyceride levels, cancer and other diseases.
It can contribute to the development of heart
failure and stroke (64).
- Minerals
There is evidence that dietary sodium intake,
principally from common table salt, is
important in determining levels of blood
pressure and in particular the rise in blood
pressure with age (67). Other minerals
measured e.g., potassium and magnesium,
seemed to play a beneficial role in limiting the
rise of blood pressure and are readily found in
diets rich in complex carbohydrates, which
also contain a variety of other minerals that
were not studied (65).
• Diabetes mellitus – This condition is the
failure to maintain the concentration of
blood glucose within the normal range. In
an adult population uncontrolled diabetes
mellitus is associated with a large excess
risk of CVD (67). There is a very strong
correlation between obesity and
developing diabetes and the risk of
F O O D S A F E T Y AU T H O R I T Y O F I R E L A N D
18

developing this condition in adults with
BMI over 30 is five times greater than that
of adults with BMI less than 25 (23). Even
when glucose levels are under control,
diabetes seriously increases the risk of
heart disease and stroke (64).
• Homocysteine - Levels of the amino
acid homocysteine increase with age (68)
and current research has identified the
importance of the relationship between
homocysteine and CVD (68, 62). There is
a growing recognition that high levels of
homocysteine are associated with an
increased risk of heart disease. Blood
homocysteine levels are inversely related
to intake and blood concentration of
folate, vitamin B12 and vitamin B6 (69, 62).
• Haematological balance - This is the
balance between the forces that cause
blood to solidify or to remain fluid (70).
Prospective epidemiological studies have
established an association between
disturbances of the haemostatic balance
and the occurrence of coronary events.
The dynamic response of the haemostatic
system to physical exercise, dietary fatty
acids and other environmental factors
remain to be further investigated (62).
• Antioxidant nutrients - Epidemiological
studies have found that low plasma levels
of vitamins C and E, and diets low in fruit
and vegetables, are associated with a
higher risk of CHD (67). The possible
protective effect of antioxidant vitamins
towards CHD is subject to ongoing
research.
(b) Cancer
There is a large body of evidence pertaining to
the relationships between diet and human
cancer. However, partly because of the poor
quality of many studies and partly because of a
lack of data on mechanisms postulated to act
in humans, the value of the data is limited (71).
Fat, fibre and the anti-oxidant vitamins are the
nutrients most frequently studied with respect
to their relationship to cancer development.
Several prospective studies have however failed
to show an association between dietary fat and
breast cancer,while some evidence suggests that
diets low in fibre but rich in saturated fats may
contribute to the risk of colon cancers. Current
evidence would strongly suggest that an
increased intake of antioxidant vitamins through
foods, as opposed to supplements, would
considerably help to reduce the incidence of
certain cancers in Ireland. At present the intake
of fruit and vegetables in Ireland is half that of
the Mediterranean countries (72), where there
is a very high known intake of fruit and
vegetables rich in antioxidants, and a much lower
incidence of cancer.
F O O D S A F E T Y AU T H O R I T Y O F I R E L A N D
19

(c) Diabetes
Type I (insulin dependent) diabetes mellitus
usually develops in childhood. It is caused by
autoimmune damage resulting in an inability of
the body to produce enough insulin. This
results in raised blood glucose levels and those
affected by Type I diabetes require insulin
replacement therapy for life. Type II non-
insulin dependent diabetes mellitus (NIDDM)
is prevalent in older people and those affected
by this condition demonstrate a progressively
inadequate insulin production or an inability to
adequately use the insulin that is produced
(73).Treatment typically includes diet control,
exercise, home blood glucose testing and in
some cases, when these measures are not
enough to bring blood sugar down near the
normal range, oral medication (pills) and/or
insulin shots are required (73). Obesity has
long been accepted as a major precipitating
factor in the development of Type II diabetes
where the risk is related to both the duration
and the degree of obesity (74).
(d) Constipation
Constipation is defined as the passage of hard
stools less frequently than normal for a
particular individual (16). It is the most
common disorder of the gastrointestinal tract
in older people (75). A common cause of
constipation is a diet low in fibre which can be
found in vegetables, fruits and whole grains and
a diet high in fats found in cheese, eggs and
meats. People who eat plenty of high-fibre
foods are less likely to become constipated.
Liquids like water and juice add fluid to the
colon and bulk to stools, making bowel
movements softer and easier to pass. People
who have problems with constipation should
drink enough non-alcoholic fluids every day (76).
(e) Dysphagia
The term dysphagia means difficulty with the
swallowing process. The incidence and
severity of swallowing problems increase with
age and older people with dysphagia are at a
high risk of developing poor nutritional status.
Traditionally, individuals with dysphagia are
placed on modified textured diets. In most
cases, from this time onward, total food intake
decreases (77).
(f) Cognitive impairment/Dementia
Loss of cognitive function is a feature of the
ageing process. It has been shown that mild or
sub-clinical vitamin deficiencies play a role in
the pathogenesis of declining cognitive
function in ageing (78). Research by several
authors has highlighted low levels of folate,
vitamin B12 and B6 as significant in relation to
impaired cognitive function (79, 88, 78, 44).
F O O D S A F E T Y AU T H O R I T Y O F I R E L A N D
20

(g) Osteoporosis
Osteoporosis is characterised by low bone
density and destruction of bone architecture,
leading to increased bone fragility and
increased risk of fracture (81). Bone loss in
osteoporosis accounts for the high incidence
of fractures of waist, hip and spine (82) in older
people. Factors identified in the development
of osteoporosis include insufficiency of
calcium, vitamin D and lack of exercise
resulting in bone resorption (83).
(h) Arthritis
Arthritis is a chronic inflammatory disease
process that affects the joints. In arthritis
sufferers the associated reduced mobility in
addition to certain specific medication
requirements can interfere with nutritional
intake (84).
(i) Gallstones
Gallstones or biliary calculi are by far the most
common biliary disease and the only one in
which there is evidence for a role of the diet.
In developed countries most gallstones (> 70%)
are rich in cholesterol and most of them also
contain calcium salts, chiefly carbonate,
phosphate, palmitate or bilirubinate. About
one third of gallstones are composed mostly
of such salts and the proportion of these
calcium rich stones increases with age (23).
The strong links between obesity and gallstones
encourage the belief that overeating is a key
factor in their development. Evidence for
specific eating habits or dietary components
causing gallstones is inconclusive (23).
(j) Wound healing and immune function
One of the most common problems
encountered by older patients is a delay in the
efficiency of wound healing (85). Sub-optimal
stores of protein, zinc, vitamin A and vitamin C
have been associated with poor wound
healing. Increased susceptibility to infection
and certain cancers (86) in old age may be
related to declining immune function and
adequate protein and micronutrient intakes
are essential to maintaining immune function.
(k) Macular degeneration and cataracts
Age-related macular degeneration (AMD) and
cataracts are the leading cause of irreversible
blindness among people aged over 65 years
(87, 88). Nutrition and lifestyle factors are
emerging as two components which may
prevent or reduce the likelihood of the onset
of these diseases (89). Research indicates that
those with low dietary intakes of vitamin C
have an increased risk of developing cataracts
relative to those with a high intake (88).
Research by Seddon et al, (1989) (88) also
suggests that an increase in vitamin C intake
may reduce the risk of developing AMD.
F O O D S A F E T Y AU T H O R I T Y O F I R E L A N D
21

(l) Obesity
A BMI of more than 30 indicates obesity (see section 2.3.3) and maintaining a healthy weight is
important irrespective of age (90). Being overweight is generally associated with the ‘young old’
population (91), and combined levels of overweight and obesity are also high among this age group
(16). Appendix I shows centiles for ideal body weight for older people.
(m) Underweight
With advancing age (75 years and over) the prevalence of underweight is higher than the prevalence
of obesity, with a significant minority of this group being underweight (16). Being underweight in this
particular age group is associated with nutrient deficiency, increased risk of hip fracture, infection and
mortality (92).
2.4.2 Incidence of nutrition related diseases and conditions in Ireland
It is difficult to draw any firm conclusions to the question of trend in morbidity among older people
in Ireland as suitable data is not available. Bearing this lack of data in mind, that collected by the
Hospital In-Patient Enquiry Scheme (HIPE) and the National Cancer Registry combined give an
indication of the prevalence of some conditions in older people.
a) Hospital In-Patient Enquiry Scheme
In Ireland, the HIPE Scheme is a computer based health information system designed to collect
medical and administrative data, i.e. discharges and deaths from acute hospitals (short stays in acute
hospitals). Each HIPE discharge record represents one episode of care. The records therefore
facilitate analyses of hospital activity rather than incidence of disease, but in doing this they provide
an indication of the prevalence of a particular disease within specified criteria.
Figure 2.6. shows HIPE cases recorded in 1997 (93) for patients in age groups 65-74 years and 75
years and over, indicating diseases of the circulatory system, dysphagia, cataracts, diseases of the bones
and joints and diabetes as the most recorded cases. It should be noted that the data outlined in Figure
2.6. does not include incidence of cancer as these figures are gathered by the National Cancer
Registry and are outlined in Figure 2.7.
F O O D S A F E T Y AU T H O R I T Y O F I R E L A N D
22

Figure 2.6. Selected HIPE cases for people 65-74 and 75+ in Ireland, 1997
Source: ESRI 1999 (93)
b) National Cancer Registry
The National Cancer Registry of Ireland has been collecting comprehensive cancer information for
the Republic of Ireland since 1994.The information collected is used in research into the causes of
cancer, in education and information programmes and in the planning of a national cancer strategy to
deliver cancer care to the whole population (94). Figure 2.7. presents the data for the older
population in age groups 65-74 years and over 75 years, as recorded in 1995. For reasons of clarity,
skin cancer cases are not included in Figure 2.7. The remaining most prevalent types of cancer in
these age groups are lung cancer, prostate, female breast, blood/marrow/spleen cancers and cancer of
the digestive system.
F O O D S A F E T Y AU T H O R I T Y O F I R E L A N D
23
Corona
ry
hear
t dise
ase
Num
ber
of c
ases
Diabet
es
Gallsto
nes
65-74
75 and over
Catar
acts0
1000
2000
3000
4000
5000
6000
7000
8000
Stroke
Arthr
itis
Anaem
ia
Kidne
y dise
ase
Constip
atio
n
Liver d
iseas
e
Goitre
Under
/Ove
rweig
ht
Dysph
agia
Oste
oporo
sis
HIPE discharge record
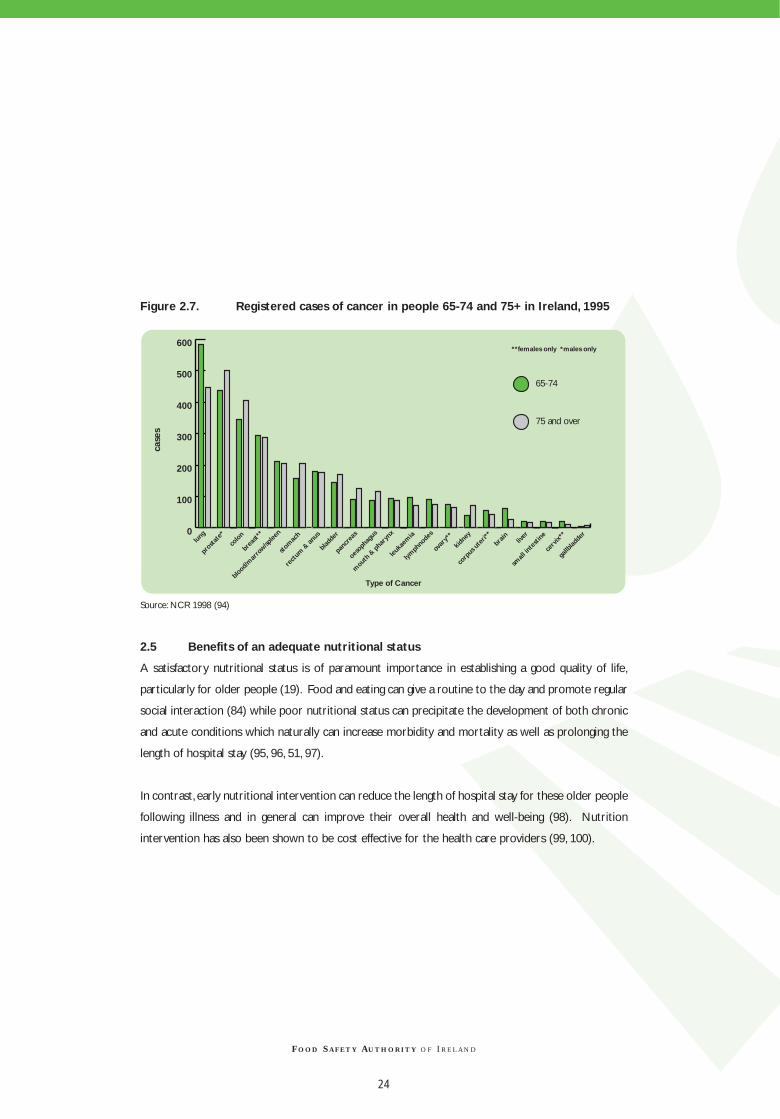
Figure 2.7. Registered cases of cancer in people 65-74 and 75+ in Ireland, 1995
Source: NCR 1998 (94)
2.5 Benefits of an adequate nutritional status
A satisfactory nutritional status is of paramount importance in establishing a good quality of life,
particularly for older people (19). Food and eating can give a routine to the day and promote regular
social interaction (84) while poor nutritional status can precipitate the development of both chronic
and acute conditions which naturally can increase morbidity and mortality as well as prolonging the
length of hospital stay (95, 96, 51, 97).
In contrast, early nutritional intervention can reduce the length of hospital stay for these older people
following illness and in general can improve their overall health and well-being (98). Nutrition
intervention has also been shown to be cost effective for the health care providers (99, 100).
F O O D S A F E T Y AU T H O R I T Y O F I R E L A N D
24
lung
prosta
te*
colo
n
brea
st**
blood/
mar
row/sp
leen
stom
ach
rect
um &
anus
blad
der
panc
reas
oesoph
agus
mout
h & p
hary
nx
leuka
emia
lymph
node
s
ovar
y**
kidne
y
corp
us u
teri*
*
brain
gallb
ladde
rliv
er
small
inte
stine
cerv
ix** 0
100
200
300
400
500
600
65-74
75 and over
**females only *males only
case
s
Type of Cancer

3.1 Introduction
For older people as for the general population, the maintenance of good health depends on safe,
affordable and appropriate foods. Eating a balanced diet high in fresh fruit and vegetables and low in
fat gives some protection against heart disease, stroke, some cancers, obesity and arthritis.The 1990
INNS (45) and the 1992 Kilkenny Health Project (102) both revealed unbalanced diets in their study
populations.The Happy Heart Communities Survey (101) also revealed unsatisfactory diets in middle
aged people, especially with regard to fruit and vegetable intake. Since dietary patterns are carried
over into older age, it is probable that the diet of many older people is also less than optimal. In the
developed countries most nutritional problems are related to eating too much or to an unbalanced
diet.Among older people, under-nutrition may also be a problem (8).
3.2 Current recommended dietary allowances
The Irish recommended dietary allowances (RDAs) have recently been updated (103) (see Appendix
II). With the exception of energy and vitamin D, specific recommendations for different subgroups of
older people have not been included. As in the USA (104), the EU (105) and the UK (106), specific
dietary recommendations for older people have not yet been established.
The macronutrients - carbohydrate, fat, protein and alcohol - are the main sources of energy in the
diet and the micronutrients, vitamins and minerals are also required for optimal metabolic function.
These requirements are dependent on many factors including age, sex, physical activity and health
status (see section 2.1.2.). General information on the function and sources of macro and
micronutrients is outlined in the Recommendations for a Food and Nutrition Policy for Ireland (61).
3.3 The Food Pyramid
The Food Pyramid (Figure 3.1.) illustrates current recommendations for food intake for healthy
people. In 1998 a survey of health related behaviours among adults in Ireland was carried out. This
survey of lifestyle, attitudes and nutrition (the SLÀN survey) (107) examined amongst other criteria
how these recommendations were met by the Irish population (Figure 3.2.).
F O O D S A F E T Y AU T H O R I T Y O F I R E L A N D
CHAPTER 3 : NUTRITIONAL REQUIREMENTS AND DIETARY GUIDELINES
25

Fats and oils – Use small amounts daily Sugars, confectionery, cakes, biscuits and high fat snack foods – Use in small amounts and not too frequentlyAlcohol – If you drink alcohol, drink sensibly, in moderation and preferably with meals
Choose three servings each day
Choose four or more servings each day
Choose two servings each day
Choose six or more servings each day
Others
Meat, Fish & Alternatives
Milk, Cheese & Yoghurt
Fruit & Vegetables
Bread, Cereal, Potato, Rice & Pasta
Figure 3.1. Food Pyramid
Source: Eastern Health Board and Health Promotion Unit (108)
Figure 3.2. Percentage of the Irish population over 55 years meeting Food
Pyramid recommendations
(See Appendix VI for differences in social classes)
Source:The National Health & Lifestyle Surveys, 1999 (107)
F O O D S A F E T Y AU T H O R I T Y O F I R E L A N D
26
0
10
20
30
40
50
60
70
80
Males Females
Percentage consuming recommended 6+ servings per day of cereals, breads & potatoes
Percentage consuming recommended 4+ servings of fruit and vegetables per day
Percentage consuming 2 or less servings of meats, fish or poultry per day
Percentage consuming fried foods more than 4 times per week
Percentage consuming butter daily
Percentage consuming low fat spread daily
Percentage consuming 3 or less servings of dairy produce per day
Perc
enta
ge
48%
57%
64%61%
14%
74%
57%
47%
70%73%
58%
7%
66% 66%
Nutrient intakes and requirements
The 1990 INNS (45), which examined dietary
intakes of a representative sample of the Irish
population, was not designed to specifically
target older people. While the survey does
include people over 60 years, the data is
limited. A second survey, The North-South Food
Consumption Survey, began in 1997 and data is
currently being collected. The first results
from this survey are expected in 2000, but
again the survey was not designed to
specifically target older people.
In the UK, a recent survey was carried out
which specifically targets nutrition in older
people. This survey, National Diet and Nutrition
Survey: people aged 65 years and over (NDNS)
(109), was conducted in 1994/5 and
comparisons to it are made widely throughout
this chapter.
There is much controversy about whether or
not nutritional requirements of older people
are similar to those of younger adults.
However, as energy intake and thus food intake
of older people declines (110, 45, 55), there is
an increased chance of nutritional deficiency
(111) since nutrient requirements do not
lessen (112).
Specific nutrient requirements are considered
in detail in this chapter.
Energy
For those who are fit and healthy, energy
requirements should be based on actual body
weight (111) with the emphasis on the
nutritional quality of the diet (109). For
individuals who have an acute and/or chronic
illness, energy requirements and energy intake
should be based on desirable body weight (16,
111). Energy intakes should be sufficient to
meet macro and micronutrient requirements,
while reducing the risk of developing poor
nutritional status (7).
In adults, when energy intake exceeds energy
expenditure, obesity may develop. Maintaining
energy balance is therefore important in
limiting the risk of developing obesity and its
associated co-morbidities such as diabetes and
cardiovascular disease. The composition of the
diet can affect whether, and to what extent
positive energy balance develops and it can
also affect the body’s ability to maintain energy
balance (114).
The recently revised Irish RDAs for energy
(Table 3.1.) express energy requirements in
terms of actual body weight, ideal body weight
(based on a BMI of 22 kg/m2) with and without
desirable activity levels, where desirable
activity is that level which is being promoted
by public health campaigns.
F O O D S A F E T Y AU T H O R I T Y O F I R E L A N D
27

Table 3.1. Energy requirements for people 60-74 and 75 and over in Ireland Age Desirable With desired Without desired Actual body With desired Without
(years) body weight* physical physical weight** physical activity desired physical
(kg) activity (MJ/d) activity (MJ/d) (kg) (MJ/d) activity (MJ/d)
Males
60-74 63.5 9.2 8.5 73.5 10.0 9.2
75+ 63.5 8.5 7.5 73.5 9.1 8.0
Females
60-74 55.5 7.8 7.2 66.1 8.5 7.8
75+ 55.5 7.6 6.7 66.1 8.3 7.3
* Desirable body weight – desirable weights for observed heights were calculated taking a body mass index (BMI) of 22.
** Actual body weight – weighted median weights observed in several studies (105).
Source: FSAI 1999 (103)
A combination of actual body weights (see Table 3.1.) and the intake data, as calculated in the 1990
INNS, suggests that in Ireland we have a coexisting problem of both over and undernutrition in the
older population.
Several international surveys (Norwich (115), SENECA (116), Boston (117) and NDNS (109)) also
found inadequate energy intakes in older people (see Tables 3.2. and 3.3. for free-living and
institutionalised older people respectively).
F O O D S A F E T Y AU T H O R I T Y O F I R E L A N D
28

Table 3.2.Average daily energy intakes for older people found in the INNS, the
Norwich, Seneca, Boston and NDNS surveys (adapted from 1998 NDNS)
Men Women Men Women Men Women Men Women Men Women
Energy intake 8.1 6.4 8.2-12.7* 6.3-10.9* 8.02 5.98 7.92 6.26 9.5 7.2(MJ/d)
SD N/A N/A - - 1.95 1.41 2.11 1.58 3.1 2.5
Number of 60 85 1217 1241 632 643 237 449 82 84 participants
N/A: not available
SD: Standard Deviation
*Figures for the SENECA survey show the range of average intakes for the 18 towns in which the survey was carried out, together
with the total number of participants for all the towns.
** a factor of 4.184 has been used to convert kcalories to KJ
Source: Maisey et al (1995) (115), SENECA-Investigators (1991) (116), USDA (1992) (117), MAFF (1998) (109), INNS (1990) (45)
Comparisons made for institutionalised older people included in the 1998 NDNS (109) and the
Boston survey (117) also showed an inadequate energy intake (see Table 3.3.):
Table 3.3. Average daily energy intakes for older institutionalised people found in the
NDNS (UK) and Boston survey (USA) (adapted from 1998 NDNS)
NDNS (1998) (UK) USDA Boston survey (1981-4)* (USA)
Age (years) 65 and over 60 and over
Men Women Men Women
Energy intake (MJ/d) 8.14 6.94 8.05 7.19
SD 1.95 1.55 1.54 1.46
Number of participants 204 208 103 163
Methods of measurement 4 day diet diaries 3 day weighing method
SD: Standard Deviation
* a factor of 4.184 has been used to convert kcalories to KJ
Source: MAFF (1998), USDA (1992)
F O O D S A F E T Y AU T H O R I T Y O F I R E L A N D
29
Norwich(1990/91)(UK)
Seneca (1988/9) NDNS: 65 andover (1994/5)
(UK)
USDA Boston survey
(1981-4)** (USA)
1990 INNS(Ireland)
Living status Free living Free living Free living Free living Not recordedAge (years) 68-90 70-75 65 and over 60 and over 60 and over
Methods of 7-day diaries 3 day estimated 4 day diet diaries 3 day weighing 7-day diet history measurement record by diet method
history

Providing an adequate nutrient intake for older people becomes difficult once body weight and
physical activity start to decline. Many older people spend only about 1 hour per day on their feet.
Given low body weights and low activity levels, the opportunities for dietary modification to increase
nutrient intakes are very limited if the overall food consumption is low (7). As energy requirements
are reduced, the food older people eat must be of good nutritional value.
3.4.2 Protein
The primary function of protein in the body is growth and repair of body tissues. However, the body
also requires a constant source of glucose as a fuel for many chemical processes. If the diet is low in
carbohydrate, a greater percentage of dietary protein is used to provide glucose and subsequently
less is available to carry out its primary function (118).
In order to minimise protein loss, it is important that older people maintain an adequate energy
intake, especially during episodes of ill health when energy requirements may rise (7). The average
protein intake recorded in the INNS in adults 60 years and over (Table 3.4.) was above the Irish RDA
of 0.75g/kg body weight/d.
Source: INNS 1990 (45), FSAI 1999 (103)
The average daily protein intakes for men and women reported in the 1998 NDNS were similar to
those reported in the 1990 INNS.
F O O D S A F E T Y AU T H O R I T Y O F I R E L A N D
30
Average dailyprotein intake(g/d)
Average weightobserved in thissection of thepopulation (kg)
Average dailyprotein intake(g/kg bodyweight/d
% RDA (0.75g/kgbody weight/d)
% Total energyderived fromprotein
Table 3.4.Average daily protein intake in older people (60 years and over) in Ireland
Males
(60 and over) 84 74.7 1.125 150 15
Females
(60 and over) 67 65.4 1.025 137 16.4

In the healthy older population protein intake has been found to be sufficient to meet requirements
(111, 7). A higher protein intake may be necessary for those who have an acute and/or chronic illness
and who are homebound or in a long term care facility (7).
3.4.3 Carbohydrates
Carbohydrates are a major source of energy, providing approximately 17 kJ per gram. The average
daily intake of carbohydrates observed in the 1990 INNS was 292g for men (aged 60 and over) and
226g for women (aged 60 and over). This intake constitutes 48.6% of total energy intake for men and
49% for women. There are currently no quantitative guidelines for carbohydrate intake in Ireland.
Table 3.5. Daily carbohydrate intake as % of food and total energy intake in older people
in Ireland and the UK1998 NDNS (UK) 1998 NDNS (UK) 1990 INNS (Ireland)
Living Status Free living Institutionalised Not recorded
Age group (years) 65 and over 65 and over 60 and over
Men Women Men Women Men Women
Average daily carbohydrate intake (g) 232 175 256 222 292 226
% of food energy 48.2 47.5 50.8 51.3 N/A N/A
% of total energy 46.4* 46.9* 50.4* 51.2* 48.6 49
Source: INNS 1990 (45) and MAFF 1998 (110)
* Note dietary UK recommendations: Dietary Reference Values (DRV) for % total energy derived from carbohydrate is 47% (106).
Carbohydrates in the diet are principally made up of sugars, starches and dietary fibre (non-starch
polysaccharides).
a) Sugars
Sugars are soluble carbohydrates. They have been classified into two types:
1) Those sugars that are incorporated naturally into the cell structure of the food, e.g. fruit or
vegetables and are known as intrinsic sugars.
2) Those sugars that are not incorporated (naturally or artificially) into the food’s cellular structure,
e.g. honey, fruit juices, table sugar, preserves and confectionery, and are known as extrinsic or free
sugars. Extrinsic sugars in milk and milk products were deemed to be a special case, so in general
sugars found in honey, fruit juice etc are referred to as non-milk extrinsic sugars (119).
F O O D S A F E T Y AU T H O R I T Y O F I R E L A N D
31

Extrinsic sugars (principally sucrose) are associated with the development of dental caries (61) and a
diet high in non-milk extrinsic sugars may also displace foods that are more nutrient dense. Intakes
in the 1998 NDNS (110) were found to exceed the UK recommendations for non-milk extrinsic
sugars in both free-living and institutionalised older people.
b) Starch
Starches are the major carbohydrates of the human diet and are required as the primary energy
source. Some very high starch diets may be associated with low intakes of some vitamins and minerals
and when other sources of food energy are unavailable this can lead to nutrient deficiency (61).
c) Dietary fibre
Dietary fibre is a non-specific term for that fraction of dietary carbohydrate that cannot be digested
in the human small intestine. An adequate intake of dietary fibre is required to maintain bowel
function. It has a laxative effect and a high fibre diet can be used in the treatment of constipation.
3.4.4 Alcohol
Alcohol yields 29 kJ of energy per gram and most alcoholic beverages are high in energy. In addition
to its contribution to energy and to body weight, alcohol intake raises blood pressure and can also
influence nutrient intake (61).
Table 3.6.Alcohol intake as % of total energy in the UK and Ireland
1998 NDNS (UK) 1998 NDNS (UK) 1990 INNS (Ireland)
Living status Free living Institutionalised Not recorded
Age group (years) 65 and over 65 and over 60 and over
Men Women Men Women Men Women
Alcohol (g/d) 21.5 8.6 10.3 3.9 9.7 1.6
Source: INNS 1990 (45) and MAFF 1998 (110)
Recommendations for alcohol for older people are similar to those for the general adult population
(120). Healthy limits of alcohol intake are 14 units per week for women and 21 units per week for
men (1 unit: 8g alcohol). Findings in the 1990 INNS revealed intakes below these limits.
F O O D S A F E T Y AU T H O R I T Y O F I R E L A N D
32

3.4.5 Fat (saturated and unsaturated)
Fat is a concentrated source of energy yielding 37 kJ per gram. Foods that are high in fat provide a
lot of energy and are good sources of vitamins A, D, E and K and provide the essential fatty acids.
The building blocks of fat are triglycerides made up of three fatty acids and one glycerol and the body
can make the fatty acids it needs with the exception of alpha linolenic acid (n-3) and linoleic acid (n-6).
These are the essential fatty acids and belong to the group of polyunsaturated fatty acids (PUFAs) and
must be supplied in the diet (see Table 3.11 below and Appendix II) (121).
The nature of the fat depends on the types of fatty acids which make up the triglycerides. If the fatty
acid has all the hydrogen atoms it can hold it is said to be saturated. If some of the hydrogen atoms
are missing and have been replaced by a double bond between the carbon atoms, then the fatty acid
is said to be unsaturated. If there is one double bond, the fatty acid is known as a monounsaturated
fatty acid. If there is more than one double bond, then the fatty acid is known as a polyunsaturated
fatty acid.All fats contain both saturated and unsaturated fatty acids but are sometimes described as
saturated or unsaturated depending on the proportions of fatty acids present.
A high fat intake, and in particular a high intake of saturated fatty acids, has been associated with a
raised blood cholesterol level, which is one of the risk factors for coronary heart disease (121).
Table 3.7. reveals average daily fat intakes as found in the 1990 INNS and 1998 NDNS. There are
currently no quantitative recommendations for fat intake provided in Ireland.
Table 3.7. Recommendations for daily intake of essential fatty acids
n-6 PUFA n-3 PUFA
% dietary energy % dietary energy
Males (years) 18-64 2 0.5
65+ 2 0.5
Females (years) 18-64 2 0.5
65+ 2 0.5
Source: FSAI 1999 (103)
Intakes of n-6 and n-3 PUFA as observed in the 1998 NDNS (Table 3.8.) were found to be well above
the Irish recommendations in both free-living and institutionalised older people.
F O O D S A F E T Y AU T H O R I T Y O F I R E L A N D
33
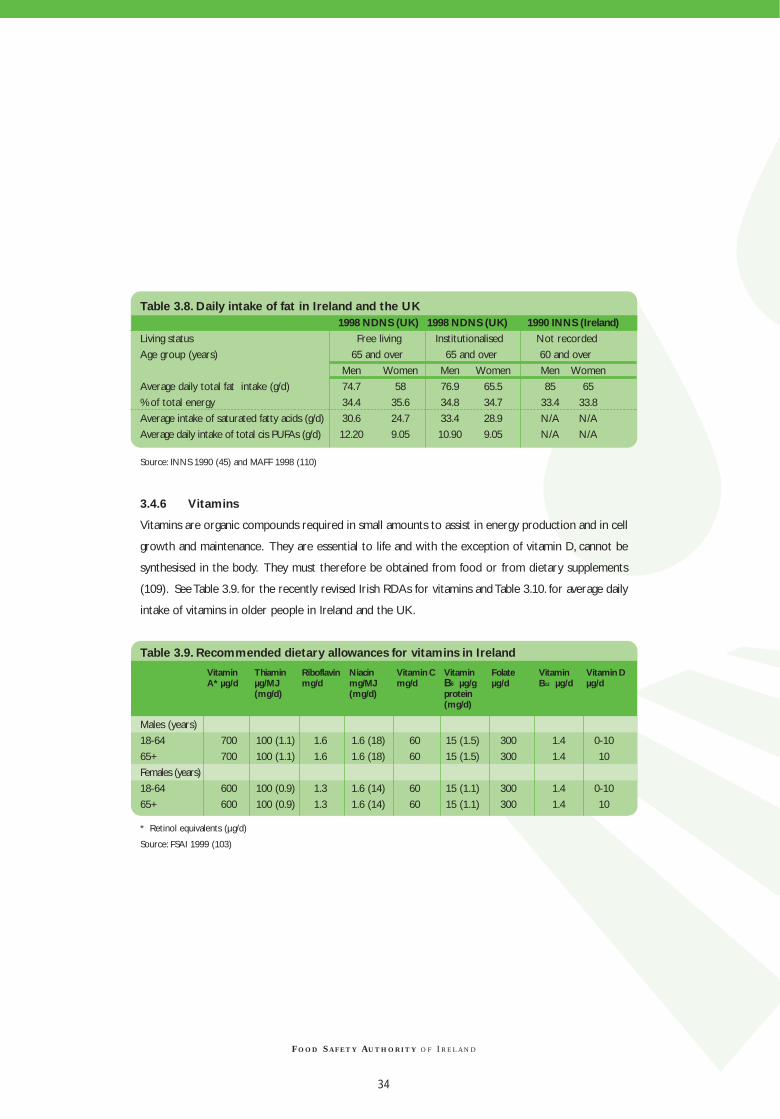
Table 3.8. Daily intake of fat in Ireland and the UK 1998 NDNS (UK) 1998 NDNS (UK) 1990 INNS (Ireland)
Living status Free living Institutionalised Not recorded
Age group (years) 65 and over 65 and over 60 and over
Men Women Men Women Men Women
Average daily total fat intake (g/d) 74.7 58 76.9 65.5 85 65
% of total energy 34.4 35.6 34.8 34.7 33.4 33.8
Average intake of saturated fatty acids (g/d) 30.6 24.7 33.4 28.9 N/A N/A
Average daily intake of total cis PUFAs (g/d) 12.20 9.05 10.90 9.05 N/A N/A
Source: INNS 1990 (45) and MAFF 1998 (110)
3.4.6 Vitamins
Vitamins are organic compounds required in small amounts to assist in energy production and in cell
growth and maintenance. They are essential to life and with the exception of vitamin D, cannot be
synthesised in the body. They must therefore be obtained from food or from dietary supplements
(109). See Table 3.9. for the recently revised Irish RDAs for vitamins and Table 3.10. for average daily
intake of vitamins in older people in Ireland and the UK.
Table 3.9. Recommended dietary allowances for vitamins in Ireland
Males (years)
18-64 700 100 (1.1) 1.6 1.6 (18) 60 15 (1.5) 300 1.4 0-10
65+ 700 100 (1.1) 1.6 1.6 (18) 60 15 (1.5) 300 1.4 10
Females (years)
18-64 600 100 (0.9) 1.3 1.6 (14) 60 15 (1.1) 300 1.4 0-10
65+ 600 100 (0.9) 1.3 1.6 (14) 60 15 (1.1) 300 1.4 10
* Retinol equivalents (µg/d)
Source: FSAI 1999 (103)
F O O D S A F E T Y AU T H O R I T Y O F I R E L A N D
34
VitaminA* µg/d
Thiaminµg/MJ(mg/d)
Riboflavinmg/d
Niacinmg/MJ(mg/d)
Vitamin Cmg/d
VitaminB6 µg/gprotein(mg/d)
Folateµg/d
VitaminB12 µg/d
Vitamin Dµg/d

Table 3.10.Average daily intake of vitamins in older people in Ireland and the UK1998 NDNS (UK) 1998 NDNS (UK) 1990 INNS (Ireland)
Living status Free living Institutionalised Not recorded
Age group (years) 65 and over 65 and over 60 and over
Men Women Men Women Men Women
Vitamin A (µg/d) 1262 1073 1062 974 1128 1228
Thiamin (mg/d) 1.56 1.73 1.35 1.16 1.5 1.2
Riboflavin (mg/d) 1.82 1.76 1.8 1.65 1.8 1.6
Niacin (mg/d) 32.7 26.1 27.3 23.6 36.8 30
Vitamin B6 (mg/d) 2.4 2 1.9 1.6 1.6 1.3
Vitamin B12 (µg/d) 6.1 4.6 4.9 4.6 4.6 4.8
Folate (mg/d) 279 220 235 200 189 177
Biotin (mg/d) 33 26 30 26 N/A N/A
Pantothenic acid (mg/d) 4.5 3.9 33 26 N/A N/A
Vitamin C (mg/d) 71.5 68.1 52.1 54.9 60.8 58.4
Vitamin D (mg/d) 4.56 3.44 3.87 3.36 1.9 1.9
Vitamin E (mg/d) 10.1 10.4 7.8 6.7 3.6 3.1
Source: INNS 1990 (45) and MAFF 1998 (110)
Intakes found in the 1990 INNS (Table 3.10.) were found to be insufficient for folate, vitamin D and
vitamin C when compared to the Irish RDAs. See Appendix IV.
F O O D S A F E T Y AU T H O R I T Y O F I R E L A N D
35

a) Retinol (Vitamin A)
In general, studies of the diets of older people
have found intakes of vitamin A to be adequate
(45, 122, 123, 109). However when it does
occur, low serum vitamin A levels are generally
associated with chronic liver disease (124).
Hypervitaminosis A has been observed in this
age group as a result of over-use of vitamin A
supplementation (124).
b) Thiamin (Vitamin B1)
Vitamin B1 deficiency has been noted in older
people both in Ireland and the UK (125, 126).
In general, if overall food intake declines as a
consequence of decreasing energy intake,
vitamin B1 intake may not be adequate.
Further studies on vitamin B1 status in the
older person are necessary (7).
c) Riboflavin (Vitamin B2)
Low dietary vitamin B2 intakes are common
among the older population (127).
Biochemical deficiencies of vitamin B2 have
been noted in both independent older people
and those in long term care facilities (126, 7).
A low energy intake may be responsible for
low vitamin B2 levels (128).
d) Pyridoxine (Vitamin B6)
There is a strong relationship between vitamin
B6 and protein metabolism, and so
requirements for vitamin B6 are directly related
to protein intake and intakes should remain
similar to those of the younger population
(126). Several studies have found the older
population to have low plasma levels of this
vitamin related to both low dietary intakes and
underlying health problems (126, 123).
e) Cyanocobalamin (Vitamin B12)
It has been shown that serum levels of vitamin
B12 decline with age (7, 129). Many cases of low
serum vitamin B12 levels are known to be
associated with age related decreased
absorption due to gastric atrophy (88).
f) Folic Acid
Folic acid deficiency is common amongst the
older population (129, 125, 130). With lower
energy intakes, older people have difficulty
achieving requirements for folic acid from food
alone (123) and many do not reach the
recommended intakes for this vitamin (45,
131, 123).
This folic acid deficiency may be due to poor
food choice e.g.“tea and toast” type of diet and
prolonged cooking of foods (7). Alcoholism,
depression, polypharmacy (the use of several
prescribed and/or non-prescribed drugs at the
same time) and acute or chronic medical
conditions (127) may also contribute to
deficiency. Low intakes have also been
reported among older people in long-stay and
acute hospital care (132). A recent joint study
of the Mercer’s Institute for Research on
F O O D S A F E T Y AU T H O R I T Y O F I R E L A N D
36

Ageing and the Department of Haematology at
Saint James’s Hospital, Dublin, has shown that
fortified milk helped maintain serum and red
cell folate levels in an older population (130).
g) Biotin
No RDAs for biotin currently exist in Ireland.
There is little information concerning human
biotin requirements and no evidence on which
to base recommendations. Average intake of
biotin in the EU is approximately 28-42 µg/d,
but individuals may consume between 15 and
100 µg/d (105).
h) Pantothenic acid
There are currently no RDAs for pantothenic
acid in Ireland and from the limited studies
which have been performed it is not possible
to establish requirements. Average intakes in
adults are about 4-7 mg/d, but some individuals
consume 3-12 mg/d (105).
i) Ascorbic acid (Vitamin C)
Research indicates that vitamin C intake in an
apparently healthy older population is
adequate for males but not for females (45).
Intakes have also been found to be sub-optimal
in those who have an acute and/or chronic
illness or are in long term care facilities (133).
Fruit, vegetables and potatoes provide vitamin
C but older people may have difficulty
preparing, peeling and chewing these foods (7).
In residential care accommodation, where
food is produced on a large scale and may take
longer to reach its final consumer, vitamin
(particularly vitamin C) content may be
depleted by the time it is consumed. It has
been estimated that meals provided in
residential accommodation, e.g. meals on
wheels, may lose up to 90% of vitamin C
content by the time of delivery (7, 84).
j) Calciferol (Vitamin D)
Sub-optimal vitamin D status in the older
person is due to a number of age-related
changes in synthesis and metabolism (81, 16,
127). With age, exposure to sunlight is often
reduced and particularly in the homebound or
those in long-term care facilities (83, 134, 135),
there is a lessened capacity of the skin to
produce vitamin D (136, 135, 7) and dietary
intakes are low (135, 134). In addition,
compromised liver and kidney function often
occurs which decreases the level of vitamin D
synthesised/stored in the body and interferes
with calcium absorption (110, 127).
Supplementation with vitamin D can correct
deficiencies and reduce the incidence of
fractures in the older population (137, 138, 139).
k) Vitamin E
The most active of the series of vitamin E
compounds is α-tocopherol which accounts
for 90% of the vitamin E present in human
tissues. Vitamin E requirements are
F O O D S A F E T Y AU T H O R I T Y O F I R E L A N D
37

determined, to a large extent by the PUFA content of the diet.A guideline of 0.4 mg α-tocopherol
equivalents : g PUFA was proposed in the RDAs for Ireland (103).
3.4.7 Minerals
Minerals are inorganic elements.Those that are essential for the body’s normal function include iron,
calcium, phosphorus, potassium, magnesium, sodium and chloride. Trace elements are also minerals
but are required only in minute amounts and include zinc, copper, iodine and manganese (109). See
Table 3.11. for the recently revised Irish RDAs for minerals and Table 3.12. for average daily intakes
for several minerals as observed in the 1990 INNS (45) and the 1998 NDNS (110).
Table 3.11. Recommended dietary allowances for minerals in Ireland
Males (years)
18-64 800 550 3100 10 9.5 1.1 55 130
65+ 800 550 3100 10 9.5 1.1 55 130
Females (years)
18-64 800 550 3100 14 7 1.1 55 130
65+ 800 550 3100 9 7 1.1 55 130
Source: FSAI, 1999 (103)
F O O D S A F E T Y AU T H O R I T Y O F I R E L A N D
38
Calcium(mg/d)
Phosphorus(mg/d)
Potassium(mg/d)
Iron(mg/d)
Zinc(mg/d)
Copper(mg/d)
Selenium(µg/d)
Iodine(µg/d)

Table 3.12.Average daily intake of minerals in older people in Ireland and the UK
1998 NDNS (UK) 1998 NDNS (UK) 1990 INNS (Ireland)
Living status Free living Institutionalised Not recorded
Age group (years) 65 and over 65 and over 60 and over
Men Women Men Women Men Women
Iron (mg) 11.6 8.9 9.6 8.3 11.2 9.8
Calcium (mg) 837 697 954 865 958 831
Phosphorus (mg) 1237 898 1199 1055 1506 1210
Magnesium (mg) 254 197 215 194 N/A N/A
Sodium (mg) 2695 2053 2714 2207 N/A N/A
Chloride (mg) 4099 3116 4053 3299 N/A N/A
Potassium (mg) 2715 2208 2429 2148 N/A N/A
Zinc (mg) 8.9 7 8.4 7.1 11.2 9.1
Copper (mg) 1.12 0.87 0.94 0.84 N/A N/A
Iodine (µg) 187 149 193 174 N/A N/A
Source: INNS 1990 (45) and MAFF 1998 (110)
Average daily intakes found in the 1998 NDNS (UK) are lower than the Irish RDAs for iron,
potassium, calcium, zinc and copper.
(a) Calcium
Ninety nine percent of calcium in the body is in the bones and teeth where its primary role is
structural. Several studies have shown relationships between dietary calcium intake and bone status
while calcium absorption has been shown to decline with age (140). However, there is debate as to
whether taking additional calcium in old age will help prevent osteoporosis (see section 2.3.). The
average adult human has approximately 1kg of calcium in the bones. It is difficult to separate the influence
on the bone metabolism of dietary calcium from that of other nutrients since adequate intakes of protein,
energy and many other nutrients are also necessary for bone growth.
(b) Iron
Iron intakes of healthy older people are generally adequate (83, 45, 19). In both men and women, a
progressive increase in iron stores occurs with advancing age. However, the incidence of anaemia in
otherwise healthy older people varies between 5-6% (91).
F O O D S A F E T Y AU T H O R I T Y O F I R E L A N D
39

For those who are homebound or in long-
term care facilities, dietary intakes and iron
stores were found to be low (83, 7). Iron
deficiency was identified as a common
problem in the institutionalised older person
(19). This low iron status was associated with
a reduced food intake and gastrointestinal
blood loss (16). Other pathologies for
anaemia e.g. blood loss associated with peptic
ulcer, diverticular disease, haemorrhoids and
use of medication should be investigated
before the assumption is made that it is due to
nutritional deficiency (7).
(c) Potassium
Potassium, together with sodium, provides a
route for the cellular uptake of molecules
against electrochemical and concentration
gradients. Deficiency in this mineral alters the
electrophysiological characteristics of cell
membranes and causes weakness of skeletal
muscle. Results of a recent study by Tucker K,
et al (141) support the hypothesis that alkaline-
producing dietary components, specifically
potassium and magnesium, contribute to
maintenance of bone mineral density.
(d) Zinc
Zinc deficiency is associated with impaired cell
mediated immune response and with reduced
wound healing. In zinc deficient subjects,
supplements (see 3.2.8) can lead to
improvements in these parameters (7).
(e) Copper
Copper deficiency is usually the consequence
of decreased copper stores at birth, inadequate
dietary copper intake, poor absorption,
elevated requirements induced by rapid growth
or increased copper losses. Copper deficiency
has been reported in subjects with
malabsorption syndromes, during total
parenteral nutrition, during high oral intakes of
zinc and iron and in subjects receiving cation-
chelating agents or high doses of oral alkalis.
The most frequent clinical manifestations of
copper deficiency are anaemia, neutropenia and
bone abnormalities (142).
(f) Magnesium
Despite the low intake seen in most studies of
diets of older people, primary magnesium
deficiency is uncommon. However, deficiency
does occur in association with gastrointestinal
malabsorption, renal dysfunction and
alcoholism (140).
3.4.8 Supplementation
There are certain circumstances where the
use of a combined vitamin and mineral
supplement may be required to compensate
for the decline in total food intake (16). It is
important to emphasise the danger of this
recommendation being interpreted to mean
‘mega’ doses of self-prescribed individual
supplements (110). Such self-prescription may
not provide protection and if taken in excess
F O O D S A F E T Y AU T H O R I T Y O F I R E L A N D
40

may either cause toxic reactions or nutrient
imbalance. Research has shown that
individuals who select their own supplements
without the benefit of professional nutritional
assessment seldom select the nutrients that
are already below recommended levels in the
diet (110).
Commercial companies producing oral
proprietary nutritional supplements employ
qualified nutritionists/dieticians who visit
community hospitals, nursing homes and other
long-term care facilities in both the private and
public sector. However, these visits are usually
to discuss the use of their company’s product
and assist with the practicalities of enteral
feeding. This does not replace the need for
access to nutrition and dietetic services.
3.4.9 Discussion
While adequate nutritional status is vital for any
age group, it is particularly important for older
people. The vast majority of older people in
Ireland are well nourished. However, there are
those who are housebound, living in poor social
circumstances or cognitively impaired who are
at a significant risk of developing nutritional
deficiencies (143). At-risk nutrients include
energy, vitamin D, vitamin C, folic acid, iron,
potassium, calcium, zinc, magnesium and copper.
See Table 3.13. for rich sources of nutrients.
F O O D S A F E T Y AU T H O R I T Y O F I R E L A N D
41

Table 3.13. Rich sources of nutrients
Carbohydrates Cereal, pulses, potatoes, milk, fruits, vegetables
Protein Meat, fish, eggs, milk, cheese, cereals, nuts, pulses
PUFAs Oily fish, fish oils, vegetable oils, walnuts
Vitamin A Liver, whole milk, cheese, butter, carrots, dark green leafy vegetables, orange
coloured fruits
Vitamin C Citrus fruits, juices, kiwi fruits, blackcurrants, green vegetables, tomatoes,
potatoes, blackcurrants
Folic acid Offal, green leafy vegetables, breakfast cereals, potatoes, bread, yeast extract
Vitamin D Sunlight, oily fish, liver, eggs, fortified margarines and milk, fortified breakfast cereals
Thiamin Whole grains, nuts, meat (especially pork)
Vitamin B6 Beef, fish, poultry
Vitamin B12 Fortified cereals, offal, meat, eggs, milk
Vitamin E Vegetable oils, nuts, vegetables, cereals
Vitamin K Dark green leafy vegetables
Niacin Liver, beef, pork, mutton, fish, fortified cereals
Riboflavin Liver, milk, cheese, yoghurt, eggs, green vegetables, yeast extract, fortified cereals
Iron Offal, all red meat, egg yolk, wholegrain cereals, dried fruits, pulses, fortified
breakfast cereals
Calcium Milk, cheese, yoghurt, bones of tinned fish, dark green vegetables
Potassium Vegetables, potatoes, fruit (especially bananas), juices
Magnesium Wholegrain cereals, nuts, spinach
Phosphorus Milk, cheese, meat, fish, eggs
Iodine Milk, seafood, seaweed
Selenium Cereals, meat, fish, offal, cheese, eggs
Copper Green vegetables, fish, liver
Zinc Unrefined cereals, milk, cheese, meat, eggs, fish, wholegrain cereals, pulses
Dietary fibre Wholemeal bread, pasta, wholegrain rice, high fibre cereals, vegetables, pulses,
fruit, dried fruit
Source: Rafferty, S (1996) (143), British Nutrition Foundation (1998) (144)
F O O D S A F E T Y AU T H O R I T Y O F I R E L A N D
42

3.5 Dietary guidelines
3.5.1 Variety of food
Advancing age can be a time of lifestyle change
for many people. Routines may change and this
can alter the eating pattern of the retired
person and their household. Low energy
intake increases the risk of concurrent vitamin
and mineral deficiency. With an adequate
energy intake and by incorporating a wide
variety of nutrient dense foods in the diet most
nutritional requirements should be met. The
diet should be based on fresh foods as far as
possible with eating patterns similar to those
recommended for younger adults. It is
important to taste food before seasonings are
added. Herbs and spices including pepper can
enhance the flavour of the food, however,
reliance on salt to flavour is not recommended.
For those who have an acute and/or chronic
illness, are homebound or are in long-term
care facilities, emphasis should be placed on
consuming foods with a high energy and
nutrient density (foods which contain a
concentration of energy and nutrients) to
achieve energy and nutrient requirements.
Guideline 3.5.1.
Eat a wide variety of foods and include
foods with a high nutrient density.
3.5.2 Energy and physical activity
Food provides energy or fuel for the body.
Some form of physical activity should be
incorporated as part of the daily routine. This
will not only improve physical fitness but also
accommodate higher energy consumption and
thus allow for adequate nutrient intakes.
Regular physical activity can enhance bone
density and hence assist in the prevention of
osteoporosis (see section 2.4.1)
Guideline 3.5.2.
Energy intake should be balanced with
adequate physical activity.
Starchy foods
Starchy foods include bread, potatoes, rice,
cereals and cereal-based foods, some fruit and
pulse vegetables. These are a good source of
energy, vitamins and dietary fibre. For the fit
and healthy older person, starchy foods should
be included daily at each meal. However, it may
be difficult for those who have an acute and/or
chronic illness to eat large quantities of these
foods (84).This group of older people may find
these foods too filling and may need to rely on
other macronutrients as well as starch, to
achieve an adequate energy intake. Excessive
consumption throughout the day of foods
containing a high sugar content could blunt the
appetite for a more varied diet and should be
avoided. However, for those older people with
limited appetite and therefore at risk of
insufficient energy and nutrient intake, intake of
sugar should be modified to suit their needs.
F O O D S A F E T Y AU T H O R I T Y O F I R E L A N D
43

Guideline 3.5.3.
Starchy foods should be eaten throughout
the day. For those who have an acute
and/or chronic illness with a limited
appetite, intake of starchy foods should be
modified to suit individual needs. Excessive
consumption throughout the day of sugar
dense foods should be avoided.
3.5.4 Fruit and vegetables
Intakes of fruit and vegetables among the older
population in Ireland are low compared to
those in other European countries (145). Fruit
and vegetables are rich sources of key
micronutrients such as folic acid and the
antioxidant vitamins, beta-carotene, vitamin E
and vitamin C in addition to dietary fibre. Four
or more portions/servings of fruit and
vegetables per day are likely to ensure
adequate intakes of these nutrients.
Guideline 3.5.4.
For those who are healthy, 4 or more
portions* of fruit and vegetables should
be eaten daily. For those who have an
acute and/or chronic illness, fruit and
vegetable intake should be modified to
meet individual needs.
* 1 portion/serving = 1/2 glass fruit juice, 2
tablespoons cooked vegetables or salad, 1 small
bowl of homemade vegetable soup, 1 medium
sized fresh fruit or 2 tablespoons of cooked fruit.
3.5.5 Dietary fibre
For older people, fibre is particularly
important in the prevention of constipation.
Adequate intakes of fruit, vegetables (especially
legumes and pulses, e.g. peas, beans and lentils),
wholemeal bread and breakfast cereals will
increase fibre content in the diet as well as
providing other nutrients. An adequate fluid
intake and regular physical activity in
conjunction with a high fibre diet can help
alleviate constipation.
Guideline 3.5.5.
An adequate intake of high fibre foods
should be maintained on a daily basis.
3.5.6 Fluid
A regular and adequate intake of fluid is
extremely important for older people. Many
older people have an impaired sense of thirst
and do not drink enough throughout the day.
Insufficient fluid intake results in dehydration
and constipation. Drinks such as water,milk, tea
and/or juices are suitable depending on the
needs of the older person and 8 cups of fluid
should reduce the risk of dehydration and
constipation. Alcoholic drinks should not be
included in the 8 daily cups (see Section 3.3.10.).
Guideline 3.5.6.
Eight cups/glasses* of fluid should be
drunk per day.
*This is equivalent to about 1.5 litres daily.
F O O D S A F E T Y AU T H O R I T Y O F I R E L A N D
44

3.5.7 Fat
Fat provides the most concentrated form of
energy. A reduction in fat intake (particularly
saturated fat) is recommended for the general
population (61). The use of unsaturated oils or
spreads when adding fat to foods will improve
the fat balance in the diet. Oily fish for
example is a good source of unsaturated fat.
Fat intakes should be tailored to meet the
needs of each individual. Older people who
are fit and healthy should adopt guidelines as
for the general population (61). In addition to
providing an excellent source of energy, fat
also enhances food palatability. For this reason
and in order to ensure adequate energy intake,
it may be prudent not to restrict fat intake to
the same degree for those who have an acute
and/or chronic illness and those who are
homebound or in long term care facilities.
Guideline 3.5.7.
For those who are healthy, a moderate
fat intake including a mixture of fats
should be included in the diet. For those
who have an acute and/or chronic illness
fat intakes should be modified to meet
individual needs.
3.5.8 Meat, fish,poultry and dairy foods
Meat is a rich source of nutrients such as
protein, iron, vitamin B12, zinc and nicotinic acid.
Meat and alternatives such as fish and poultry
should be eaten regularly. Dairy foods such as
milk, fortified milk, yoghurt and cheese are
important sources of energy, protein, calcium,
zinc, vitamins A, B2, B12 and B6 and may also
contribute significantly to the
intakes/absorption of niacin, thiamin and folate.
A recent joint study of the Mercer’s Institute
for Research on Ageing and the Department of
Haematology at Saint James’s Hospital, Dublin,
has shown that fortified milk helps maintain
serum and red cell folate levels in an older
population (126).
Guideline 3.5.8.
Meat, poultry and fish should be eaten
regularly. Dairy foods such as milk,
yoghurt and cheese should be eaten
daily. For those who have an acute
and/or chronic illness an increased
intake of dairy foods may be
recommended. Fortified milk should be
consumed by all older people unless
otherwise specified.
3.5.9 Food modification: enriched
foods, fortified foods and
dietary supplements
Food modification, i.e. changing food by adding
extra nutrients, preservatives, etc., may be
required to meet the individual needs of some
specific older people. Individual energy and
nutrient needs will vary and should be
assessed (see section 2.3.1.).
F O O D S A F E T Y AU T H O R I T Y O F I R E L A N D
45

• Enriched foods
Everyday foods may be enriched with
additional energy or nutrient dense foods that
do not increase the volume of the meals (e.g.
milk powder added to ordinary milk, cream
added to porridge or butter/margarine added
to potatoes). This is a useful way of increasing
the energy and nutrient content of a snack or
meal without increasing food volume.
• Fortified foods
Certain foods such as milk, margarines, some
breakfast cereals and breads may be fortified
with vitamins and minerals (e.g. breakfast
cereals fortified with folic acid, milk fortified
with vitamin D and calcium). The consumption
of fortified breakfast cereal is associated with
a higher intake of a range of micronutrients
(146).
• Dietary supplements
Ideally dietary supplements should be
recommended for use by qualified health
professionals.
(a) Vitamin and mineral supplements
Vitamin and mineral supplementation should
not be seen as an alternative to consuming an
adequate and varied diet. If supplements are
being used they should not exceed the
recommended dietary allowances for any
vitamin or mineral unless specifically
prescribed for an individual.
(b) Oral proprietary nutritional
supplements
These are concentrated sources of macro and
micronutrients in varying proportions usually
consumed in liquid form (i.e. nutritionally
complete powdered meal replacers made up
on milk) and are readily digested and
absorbed. They should ideally be prescribed
under dietetic/medical supervision and have
their use reviewed regularly.
Guideline 3.5.9.
A nutritional assessment is required
prior to a recommendation for food
modification or proprietary product
supplementation. Enriched and fortified
foods can be used where indicated
specifically for an individual. The use of
proprietary product supplementation
should be rationalised and reviewed by
qualified health professionals.
Alcohol
To reduce the risk of developing alcohol
related problems it is advisable to develop
sensible drinking practices. Moderation is the
key to sensible drinking. Recommendations
for older people are similar to those for the
adult population (120) and healthy limits of
alcohol intake are 14 units per week for
women and 21 units per week for men.
F O O D S A F E T Y AU T H O R I T Y O F I R E L A N D
46

Guideline 3.5.10.
If alcohol is consumed, it should be done
so in moderation. Healthy limits of
alcohol intake are 14 units* per week for
women and 21 units* per week for men.
*1 unit = 1/2 pint of beer, 1 glass of wine, 1 spirit
measure or 1/8 gill.
F O O D S A F E T Y AU T H O R I T Y O F I R E L A N D
47

4.1 Access to healthy and appropriate food choices for older people
Making healthy food choices is one part of achieving healthy eating guidelines. Measures to improve
access to healthy and appropriate food choices for older people will be considered under the
following headings:
• Public health policy
• Supportive environments
• Community action
• Health services
• Developing personal skills
4.1.1 Public health policy
There is a compelling need to promote healthy ageing with the overall aim of ‘adding life to years’
through a variety of intervention strategies including nutrition.
Recent public health policy documents (147, 148, 8) emphasise a good nutritional status as having a
very important role in preventing many diseases e.g. diabetes, cancer, CVD, etc. Nutrition is also
recognised as a component in the therapeutic treatment of acutely ill or rehabilitating older people.
4.2 Supportive environments
4.2.1 Transport
The ability to shop can be limited by reduced mobility. Lack of transport particularly in rural areas,
can contribute to high levels of dependency on others, which ultimately reduces access to shops (8).
Groceries can be bulky and heavy to carry without adequate transport.
4.2.2 Housing
Adequate housing is a basic requirement for health (8). Kitchen facilities and basic equipment such
as refrigerators, cookers and ovens are all required for food storage and preparation.
4.2.3 Income
The association between poor health and low socio-economic status is well documented (149). Older
people on a pension are one of the groups likely to have a low income (150). Low income groups have
been shown to have a less healthy diet and spend a smaller proportion of their income on food (151).
Deprivation among older people can affect the availability of household amenities and food.
F O O D S A F E T Y AU T H O R I T Y O F I R E L A N D
CHAPTER 4 :ACCESS TO HEALTHY AND APPROPRIATE FOOD CHOICES FOR OLDER PEOPLE
48

4.2.4 Food retailers
In recent decades there have been substantial
changes in the type and distribution of retail
outlets in Ireland. The grocery trade is
dominated by large supermarkets – in 1993,
5% of retail outlets accounted for 60% of total
business (152). Supermarkets tend to be
located on the periphery of towns and cater
primarily for family needs. Architects and
planners should take the needs of older people
into account when developing new shopping
centres. Transport facilities should be provided
in response to such new developments (149).
Food retailers are recognising the increasing
age profile of the consumer and are
responding progressively to their needs. A
large supermarket chain in the UK noted that
the ‘over 60s’ make up 16% of total customer
numbers and contribute to 11% of overall
spending (153). In response, some food
retailers are accommodating the older
consumer by providing more suitable shallow
trolleys, larger signs, and smaller portion sizes.
Improvements in packaging to facilitate easier
handling are also being considered (154).
Some stores provide a home delivery service
for older customers and this valuable service
should be made more widely available.
4.2.5 Catering
There is an increased prevalence of eating
outside the home e.g. in restaurants and cafés.
Caterers may use techniques such as
ingredient manipulation, food selection,
cooking and marketing methods to provide
the consumer with healthy food choices. The
Irish Heart Foundation in association with the
Health Promotion Unit (HPU) of the
Department of Health and Children has
developed an initiative “Happy Heart Eat Out”
which provides caterers with appropriate
information on healthy eating. This should
increase the availability of healthy food choices
for older people (155).
Older people can avail of meals-on-wheels and
luncheon-clubs. Food provided should take
account of the specific nutritional needs of this
age group. The environment where meals are
provided should be conducive to eating and
the enjoyment of food (84).
4.2.6 Food safety
Foodborne disease that may be a mild illness
for a robust adult can be a life threatening
illness for a frail older person. Several factors
contribute to the increased susceptibility to
foodborne infections as well as other
infections in older populations. These include
an age-associated decrease in immune
functions, age-related changes in the
gastrointestinal tract, malnutrition, lack of
exercise, entry into nursing homes and
excessive use of antibiotics. Data from
foodborne outbreaks associated with nursing
F O O D S A F E T Y AU T H O R I T Y O F I R E L A N D
49

homes in the US indicate that older people are
more likely to die from foodborne
Campylobacter, Clostridium perfringens,
Escherichia coli O157:H7, Salmonella and
Staphylococcus aureus infections than the
general population. Infections by Salmonella
species are the most common cause of illness
and death in nursing homes, with Salmonella
enteritidis as the major cause of both morbidity
and mortality (156).
Data from the surveillance scheme of all
general outbreaks of infectious intestinal
disease in England and Wales revealed that
outbreaks in residential institutions accounted
for more than one fifth of all general outbreaks
of infectious intestinal disease. The most
common causes for these were Salmonella,
Clostridium perfringens and SRSV (small round
structured viruses). Many outbreaks in
residential institutions go unrecognised and of
those detected only a proportion are
investigated. However, it was concluded that
the sample obtained, although incomplete, was
representative of all general outbreaks
investigated in England and Wales and
therefore served to highlight the magnitude
and serious nature of infectious intestinal
disease in residential institutions (157). High
rates of morbidity and mortality have been
associated with outbreaks in residential homes
and hospitals both in Ireland and the UK.
Laboratory reports of infectious intestinal
disease in people aged 65 years or over in
England and Wales show that foodborne
disease is the most common cause of infective
diarrhoea in older people. 76 % of the deaths
associated with infectious intestinal diseases in
England and Wales from 1990 to 1994
occurred in people aged 65 years and over. In
an outbreak of E. coli O157:H7 in central
Scotland in December 1996, 501 people fell ill
and 21 people died.All of these who died were
over 69 years, emphasising how vulnerable
older people are.
The introduction of care in the community has
resulted in an increased proportion of older
people living independently. However, the
quality of their food may be poor due to their
inability to obtain and prepare it. Immobility
makes it difficult to shop regularly for fresh
food, visual impairment reduces the capacity to
see if food is going off and fatigue or arthritic
hands may discourage older people from
preparing food adequately. Food stored,
cooled, or heated inappropriately may become
a source of infection (158).
All members of the community should be able to
make safe food choices when eating inside or
outside their homes. Older people who have an
acute and/or chronic illness may be particularly
vulnerable to food poisoning. Paying attention to
personal hygiene and monitoring food preparation
F O O D S A F E T Y AU T H O R I T Y O F I R E L A N D
50

and handling should lead to a reduced incidence of
foodborne and other infections in older people
(156). Guidelines are available from the Food
Safety Authority of Ireland and should be carefully
adhered to when preparing food.
4.3 Community action
4.3.1 Nutrition health promotion
The principal function of the HPU of the
Department of Health and Children is to
develop, implement and co-ordinate national
and local programmes on health promotion.
The National Council on Ageing and Older
People in association with the HPU has
developed a Healthy Ageing Programme and
has published a Health Promotion Strategy for
Older People (8). Nutrition is one of the
priority areas addressed in the strategy and the
overall goal is “to ensure that older people have
an affordable diet which provides adequate
nutrition and which optimises their health
status”. Current nutrition health promotion
activities (aimed at the whole population)
include the National Healthy Eating awareness
campaigns and the provision of information to
the general public and health professionals.
At local level, some health boards have a health
promotion service and older people are
sometimes targeted as part of their overall
remit. A specific leaflet for older people entitled
“Food Tips for Older People” has been
developed by the Nutritional Advisory
Department, Services for the Older Person in
the Eastern Health Board and Health Promotion
Unit of the Department of Health and Children.
At present existing health education
programmes relevant to the needs of older
people are available in some health boards, e.g.
“Well-Being and Empowerment for Older
People” in the Southern Health Board and
“Lifewise and the Older Person” in the North
Eastern Health Board. A project in the North
Western Health Board “Adding Life to Living”
has also been completed. This project focused
on the role of diet in the maintenance of health,
and identified a high prevalence of risk factors
for malnutrition as reported by older people
(159). Further courses are available through the
Vocational Education Committee (VEC) which
has adult education organisers in each county.
These courses could be used to incorporate
information on diet and lifestyle to provide a
holistic approach to health and well-being.
Pre-retirement courses run by some
organisations can provide the opportunity to
address some lifestyle issues such as exercise,
diet and smoking (160).
4.3.2 Community meals
The term community meals includes meals-on-
wheels, meals served at luncheon-clubs and
community centres for the older person (16).
A newer development is the delivery of frozen
meals to people in their homes.
F O O D S A F E T Y AU T H O R I T Y O F I R E L A N D
51

A regular review should be carried out of the
nutritional content of meals provided for the
older person. Voluntary organisations
providing meals should receive advice and
support on an ad hoc basis from health boards.
To support these voluntary services, the
Nutritional Advisory Department, Services for
the Older Person in the Eastern Health Board,
has initiated one day seminars providing
information on nutrition, food safety and
hygiene for voluntary agencies in each
community care area of the Eastern Health
Board to support these services.
4.3.3 Family carers and home help
service
The home help service, care assistants and
family carers have a major role to play in
supporting the nutritional well-being of older
people. Nutrition education and resources
available to these groups are limited.
4.3.4 Primary health care
Primary health care professionals remain an
important source of information about health
and nutrition for older people (161). In the
community, these include public health nurses
(PHNs), general practitioners (GPs), practice
nurses, pharmacists etc. The number of older
people who are acutely and/or chronically ill
and depend on community services is
increasing steadily.
Given the time constraints and demands
placed on professionals in the community
nutrition input can be limited. In addition, the
lack of consistent accurate information on all
aspects of food and health for the health
professional and the public is recognised as a
barrier to healthy eating (90). The North
Western Health Board, however, provides a
comprehensive nutrition and dietetic service
to primary health care (162).
4.3.5 Nutrition education
Nutrition education for health professionals,
service providers and formal carers of older
people is unstructured at present and varies in
content and facilitation throughout the
country. PHNs and GPs receive minimal
education in nutrition as part of their
professional training and are often the only
source of nutrition information for the carers
of older people and the older people
themselves. PHNs are given nutrition lectures
as part of their postgraduate training but
course content varies, as does the qualification
of the facilitator. The home-help service relies
on the PHNs to provide education on
nutrition for older people. Nutrition input
into any course given to these groups is
essential, not only to increase awareness of the
role that good nutrition plays but also to
enable early identification of those most at risk
from poor nutritional status. A review of
courses available for service providers, formal
F O O D S A F E T Y AU T H O R I T Y O F I R E L A N D
52

and informal carers of older people is available
in the publication ‘Training Carers of Older
People:An Advisory Report’ (163).
4.4 Health services
A postal survey was carried out by the Working
Group through the secretariat of the Food
Safety Advisory Board to ascertain what
nutrition and dietetic services are currently
being provided in Ireland for older people. This
section includes the findings of this postal survey.
The overall nutrition and dietetic services for
older people in the community are limited.
Community dieticians/nutritionists are
employed in most health boards primarily for
the general population. The Eastern Health
Board has a unique service which involves two
dietetic posts specifically dedicated to the care
of older people. This service is mainly directed
at older people in long-term care and other
community settings. In addition, the nutrition
services in hospitals while present, may not be
dedicated to the needs of the older person.
4.4.1 Acute hospitals
Currently, there is only one acute hospital in the
country with a whole-time nutritionist/dietician
dedicated to the care of older people. The time
allocated to the care of older people in all other
acute hospital settings varies widely. This
indicates a lack of equity and accessibility to
nutrition and dietetic services for older people.
There has been a systematic increase in the
number of specialist geriatric departments in
the acute hospitals since 1988. Similarly, all
health boards except the Southern, have
increased the number of geriatricians
employed (164). However, the provision of
nutrition and dietetic services to these
facilities has been limited and as a
consequence, such input is often not available.
4.4.2 Day hospitals
The provision of day hospital services varies
between the different health boards, with
many facilities available nationally. There is no
specialist in nutrition and dietetics available to
these facilities.
4.4.3. Long-term care and inpatient
facilities
Long-term care facilities include the hospital
service, long-term care beds, welfare
accommodation and the private nursing
homes. The Eastern Health Board nutrition
and dietetic services are available to health
board facilities only. In the remaining health
boards, there is a very limited service, which is
provided by either community or acute
hospital based dieticians/nutritionists.
Since 1986 there has been a significant
increase in the provision of nursing home beds
(164). It is likely that this trend will continue
as the number of older people in the
F O O D S A F E T Y AU T H O R I T Y O F I R E L A N D
53

population increases and volunteers who
might have been available to care for older
people at home opt for paid employment
(165). In general there are no formal nutrition
and dietetic services available to nursing
homes despite the increase in the numbers of
residents receiving some form of nutritional
support in these facilities. The Nursing Homes
(Care and Welfare) Regulations, 1993 (S.I. No.
226 of 1993) acknowledge the importance of
nutrition and diet for residents. However, no
recommendations are made regarding the
provision of nutrition and dietetic services to
these facilities.
4.4.4 Health service catering
Caterers are responsible for the provision of
food in acute hospital care and long-term care
facilities. National guidelines are not available
for caterers preparing food for older people.
(a) Acute hospitals
In acute hospitals catering is managed to meet
the needs of the general population and this
often fails to meet the requirements of older
patients (166). Guidelines should be
developed to provide food for older people
which takes into account the following groups:
• those who have therapeutic dietary
requirements due to acute and/or chronic
illness
• those who are nutritionally at risk.
(b) Long-term care facilities
Guidelines should be developed to provide
adequate food for people in long-term care
facilities. These guidelines should take into
account the following:
• the need for therapeutic diets for those
residents who have an acute and/or
chronic illness
• the specific nutritional needs of long stay
residents.
4.5 Developing personal skills
Older people should be given the opportunity
to develop skills to ensure adequate food and
nutrient intake. These include skills relating to
food preparation, budgeting and ability to
access healthy food choices. A nutrition input
should be included in courses available to
older people and their carers. Older people
should be involved in the implementation of
this policy at local level (167).
F O O D S A F E T Y AU T H O R I T Y O F I R E L A N D
54
5.1 Government action
• Given the evidence to support the role of nutrition in promoting health and social gain for older
people, the Department of Health and Children should take the lead role in co-ordinating action
to improve the nutritional status of the older population.
• Communication between government departments is required on matters relevant to food and
nutrition for older people. Structures exist and should be utilised to facilitate implementation of
the recommendation of this document.
• Specific resources should be allocated for the implementation of the recommendations in this
document.
5.2 Implementation of policy
• The Department of Health and Children should oversee the implementation of policy at national
level. At local level, a co-ordinated multi-agency approach should be taken and the policy should
be implemented through the co-ordinators of services for older people in the health boards.
• An evaluation strategy should be put in place by each responsible agency to assess whether the
implementation of the policy is effective and appropriate.
5.3 Research
• A national food and nutrition consumption survey specifically targeting the older population should
be carried out. Ideally, this should become an integral part of on-going national nutrition surveys.
• Research should be carried out to establish the prevalence of poor nutritional status in older
people in Ireland and identify those groups with specific nutritional deficiencies.
• A validated nutritional assessment tool needs to be developed to facilitate the practical assessment
of the nutritional status of older people.
• The development of reference data for anthropometry and biochemistry for older people is
urgently needed.
• Recommended dietary allowances specifically for older people need to be researched and
developed.
• Research is required to investigate barriers which affect access to healthy food choices for older people.
F O O D S A F E T Y AU T H O R I T Y O F I R E L A N D
CHAPTER 5 : RECOMMENDATIONS
55

• The requirements of older people with specific poor nutritional status, e.g. dementia, should be
investigated so that specific recommendations can be developed for these groups and their carers.
5.4 Dietary guidelines
• The dietary guidelines outlined in this policy (see section 3.3) should be made available to older
people so that they can be used as the basis for making healthy food choices.
• These guidelines will need to be reviewed on a regular basis taking into account the findings of
scientific research.
5.5 Supportive environments
• The recommendations outlined in the document “Adding Years to Life and Life to Years: A
Health Promotion Strategy for Older People” (8) should be implemented. Recommendations
include those for transport, income and housing, all of which affect access to healthy food choices
by older people.
• The retail sector should be encouraged to initiate and extend facilities provided for the older
consumer particularly in grocer shops and supermarkets. Such facilities could include the wider
availability of home delivery services.
• Caterers should be familiar with healthy eating guidelines. Catering training should include
nutrition information relating to the specific needs of older people.
5.6 Community action
• A dedicated nutrition health promotion programme for the specific needs of the older person
should be developed and implemented at both national and local level. Community
nutritionists/dieticians can facilitate this process in each health board in association with other
service providers such as public health nurses and co-ordinators for services for older people.
• Those providing community meals should be aware of the specific needs and preferences of the
older person. Regular monitoring of the content of community meals should be undertaken in
each health board area.
• Practical easy-to follow food based dietary guidelines should be developed and made available to
those caring and providing meals for older people. Family carers and those providing the home
F O O D S A F E T Y AU T H O R I T Y O F I R E L A N D
56
help service for older people should be encouraged to become familiar with the dietary guidelines
for older people that are contained in this policy document.
• In order to implement this policy it is essential that health professionals are educated in the
principles of nutrition for older people. This will require an increased emphasis on nutrition
education and recognition of the importance of nutrition as a scientific discipline in public health
and medicine. In-service training should be provided on a continuous basis in association with
services for older people in each health board and care facility.
5.7 Health services
A co-ordinated nutrition service for older people should be developed as a matter of urgency. It is
recommended that all health boards should establish a dedicated Nutrition and Dietetic Advisory
Service for older people. The Eastern Health Board provides a model of good practice in this area.
Acute hospital setting
• Hospitals that specialise in age-related health care require a dedicated nutrition and dietetic
service.
• All acute hospitals should have formal access to nutrition and dietetic services for age-related
health care for a specified amount of time.
• Day hospitals for older people should have formal access to a specialist in nutrition and
dietetics.
Long-term care
• Formal access to nutrition and dietetic services should be provided for community hospitals and
homes to assist in the provision of therapeutic diets and nutritional support. This would
facilitate the monitoring of menus regularly for nutritional adequacy and suitability to the
individual needs of the older person.
• Nutritional standards should be added by statute to the standards set in the Nursing Homes
(Care and Welfare) Regulations, 1993 (S.I. No. 226 of 1993).
• Primary health care professionals should have formal access to nutrition and dietetic services to
assist them in supporting the acutely and/or chronically ill older people in the community.
• Caterers in acute hospitals and long-term care facilities should become familiar with the specific
nutritional needs of older people.
F O O D S A F E T Y AU T H O R I T Y O F I R E L A N D
57

5.8 Developing personal skills
• The implementation of this policy should include the development of groups and resources at
local level that include older people themselves.
F O O D S A F E T Y AU T H O R I T Y O F I R E L A N D
58

APPENDIX I
Table I.I. Centiles for ideal body weight for older people
Percentile 65-74 years Over 75 years
Male (kg) Female (kg) Male (kg) Female (kg)
10 57 50 53 45
20 62 54 57 49
30 65 57 62 52
40 68 60 66 56
50 71 63 69 59
60 75 66 72 62
70 79 69 76 66
80 84 74 78 69
90 89 83 84 74
Adapted from Lehmann et al, 1991 (168)
Values below the 10th centile are the level below which medical screening is recommended.
F O O D S A F E T Y AU T H O R I T Y O F I R E L A N D
59

F O O D S A F E T Y AU T H O R I T Y O F I R E L A N D
APPENDIX II
60
Tabl
e II
.I.R
eco
mm
ende
d D
ieta
ry A
llow
ance
s
Age
Prot
ein
n-6
n-3
Vita
min
T
hiam
inR
ibof
lavi
nN
iaci
nV
itam
inV
itam
inFo
late
Vita
min
Vita
min
Cal
cium
Phos
p-Po
tass
ium
Iron
Zin
cC
oppe
rSe
leni
umIo
dine
PUFA
aPU
FAa
Ab
CB 6
B 12
Dho
rus
year
sg/
kg b
ody
% d
ieta
ry %
die
tary
µg/d
µg/M
Jm
g/d
mg/
MJ
mg/
dµg
/g
µg/d
µg/d
µg/d
mg/
dm
g/d
mg/
dm
g/d
mg/
dm
g/d
µg/d
µg/d
wei
ght/
den
ergy
ener
gypr
otei
n
Chi
ldre
n
1-3
1.1
30.
540
010
00.
81.
645
1510
00.
710
800
300
800
84
0.4
1070
4-6
1.0
20.
540
010
01.
01.
645
1520
00.
90-
1080
035
011
009
60.
615
90
7-10
1.
02
0.5
500
100
1.2
1.6
4515
200
1.0
0-10
800
450
2000
107
0.7
2510
0
Mal
es
11-1
4 1.
02
0.5
600
100
1.4
1.6
5015
300
1.3
0-15
1200
775
3100
139
0.8
3512
0
15-1
7 0.
92
0.5
700
100
1.6
1.6
6015
300
1.4
0-15
1200
775
3100
149
1.0
4513
0† F
emal
es
11-1
4 0.
952
0.5
600
100
1.2
1.6
5015
300
1.3
0-15
1200
625
3100
149
0.8
3512
0
15-1
7 0.
852
0.5
600
100
1.3
1.6
6015
300
1.4
0-15
1200
625
3100
147
1.0
4513
0
Mal
es
18-6
4 0.
752
0.5
700
100
1.6
1.6
6015
300
1.4
0-10
800
550
3100
109.
51.
155
130
65+
0.
752
0.5
700
100
1.6
1.6
6015
300
1.4
1080
055
031
0010
9.5
1.1
5513
0† F
emal
es
18-6
4 0.
752
0.5
600
100
1.3
1.6
6015
300
1.4
0-10
800
550
3100
147
1.1
5513
0
65+
0.
752
0.5
600
100
1.3
1.6
6015
300
1.4
1080
055
031
009
71.
155
130
Preg
nanc
y*0.
752
0.5
700
100
1.6
1.6
8015
500
1.6
1012
0055
031
0015
71.
155
130
(+10
g/d)
Lact
atio
n¶0.
752
0.5
950
100
1.7
1.6
(+2)
8015
400
1.9
1012
0095
031
0015
121.
475
160
(+10
g/d)
*Sec
ond
half
of p
regn
ancy
;¶
Fir
st s
ix m
onth
s of
lact
atio
n.a
Pol
yuns
atur
ated
fatt
y ac
ids;
b R
etin
ol e
quiv
alen
ts (
µg/d
) †N
eura
l tub
e de
fect
s ca
n be
pre
vent
ed b
y pe
rico
ncep
tual
inge
stio
n of
folic
aci
d.So
urce
,FSA
I (10
3)

F O O D S A F E T Y AU T H O R I T Y O F I R E L A N D
APPENDIX III
61
Age
(years)
Desirable
Body
Weight* (kg)
With desired
physical
activity
(MJ/d)
Without
desired
physical
activity (MJ/d)
Actual Body
Weight**(kg)
With desired
physical
activity
(MJ/d)
Without
desired
physical
activity (MJ/d)
Table 111.1. Energy requirements for moderately active adults
Males
18-29 66.3 12.5 11.9 74.6 13.4 12.7
30-59 66.3 11.5 10.7 74.6 12.1 11.3
60-74 63.5 9.2 8.5 73.5 10.0 9.2
75+ 63.5 8.5 7.5 73.5 9.1 8.0
Females
18-29 57.3 9.1 8.5 62.1 9.6 9.0
30-59 57.3 8.9 8.3 62.1 9.2 8.5
60-74 55.5 7.8 7.2 66.1 8.5 7.8
75+ 55.5 7.6 6.7 66.1 8.3 7.3
* Desirable weights for observed heights were calculated taking a Body Mass Index (BMI) of 22.
** Weighted median weights as observed in several studies (1).
Source: FSAI (103)
It is important to note that energy requirements are calculated in terms of desirable and actual body
weight, and at two levels of physical activity.

Table IV.I.Average daily intake of vitamins in UK and Ireland expressed as % of RDA.
1998 NDNS (UK) 1998 NDNS (UK) 1990 INNS (Ireland)
Living status Free living Institutionalised Not recorded
Age group (years) 65 and over 65 and over 60 and over
Men Women Men Women Men Women
Vitamin A
%RDA (%RNI) 180 (180) 179 (179) 152 (152) 162 (162) 161 205
Thiamin
%RDA (%RNI) 142 (174 ) 192 (216) 122 (150) 128 (145) 136 133
Riboflavin
%RDA (%RNI) 114 (140) 135 (160) 113 (138) 127 (150) 113 123
Niacin
%RDA (%RNI) 182 (204) 186 (218) 152 (171) 169 (197) 204 214
Vitamin B6
%RDA (%RNI) 160 (172) 181 (205) 127 (154) 146 (162) 107 118
Vitamin B12
%RDA (%RNI) 435 (409) 329 (306) 350 (330) 329 (305) 329 343
Folate
%RDA (%RNI) 93 (139) 73 (110) 78 (117) 67 (100) 63 59
Vitamin C
%RDA (%RNI) 119 (179) 113 (170) 87 (130) 92 (137) 101 97
Vitamin D
%RDA (%RNI) 46 (46) 34 (34) 39 (39) 34 (34) 19 19
(% of UK RNI given in brackets for intakes observed in the UK NDNS)
Source: INNS 1990 (45) and MAFF 1998 (110)
UK RNIs are generally lower than Irish RDAs (except for potassium, selenium and iodine, where RNIs
are higher and retinol and cyanocobalamin where the values are the same). Table IV.I. demonstrates
that average daily intakes found in the 1998 NDNS are lower than the UK RNIs for vitamin D only,
but when compared to Irish RDAs insufficient intake for folate is also observed. Intakes found in the
1990 INNS were found to be insufficient for folate, vitamin D and vitamin C when compared to the
Irish RDAs.
F O O D S A F E T Y AU T H O R I T Y O F I R E L A N D
APPENDIX IV
62
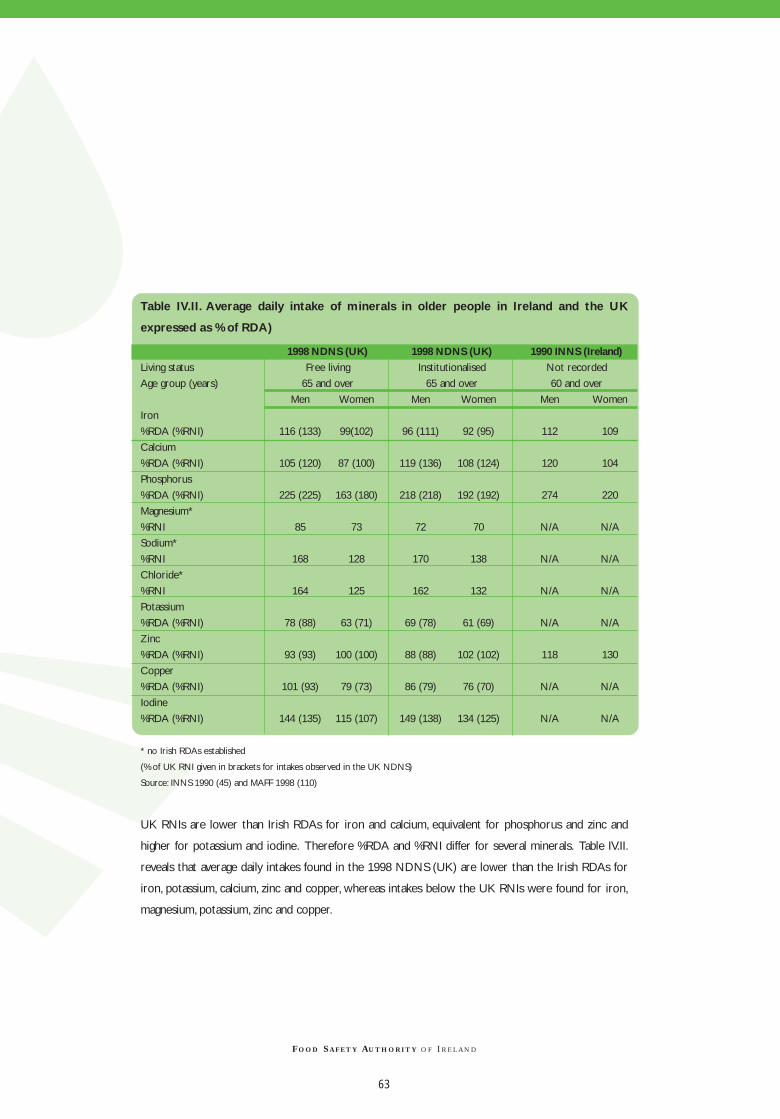
Table IV.II. Average daily intake of minerals in older people in Ireland and the UK
expressed as % of RDA)
1998 NDNS (UK) 1998 NDNS (UK) 1990 INNS (Ireland)
Living status Free living Institutionalised Not recorded
Age group (years) 65 and over 65 and over 60 and over
Men Women Men Women Men Women
Iron
%RDA (%RNI) 116 (133) 99(102) 96 (111) 92 (95) 112 109
Calcium
%RDA (%RNI) 105 (120) 87 (100) 119 (136) 108 (124) 120 104
Phosphorus
%RDA (%RNI) 225 (225) 163 (180) 218 (218) 192 (192) 274 220
Magnesium*
%RNI 85 73 72 70 N/A N/A
Sodium*
%RNI 168 128 170 138 N/A N/A
Chloride*
%RNI 164 125 162 132 N/A N/A
Potassium
%RDA (%RNI) 78 (88) 63 (71) 69 (78) 61 (69) N/A N/A
Zinc
%RDA (%RNI) 93 (93) 100 (100) 88 (88) 102 (102) 118 130
Copper
%RDA (%RNI) 101 (93) 79 (73) 86 (79) 76 (70) N/A N/A
Iodine
%RDA (%RNI) 144 (135) 115 (107) 149 (138) 134 (125) N/A N/A
* no Irish RDAs established
(% of UK RNI given in brackets for intakes observed in the UK NDNS)
Source: INNS 1990 (45) and MAFF 1998 (110)
UK RNIs are lower than Irish RDAs for iron and calcium, equivalent for phosphorus and zinc and
higher for potassium and iodine. Therefore %RDA and %RNI differ for several minerals. Table IV.II.
reveals that average daily intakes found in the 1998 NDNS (UK) are lower than the Irish RDAs for
iron, potassium, calcium, zinc and copper, whereas intakes below the UK RNIs were found for iron,
magnesium, potassium, zinc and copper.
F O O D S A F E T Y AU T H O R I T Y O F I R E L A N D
63

Table IV.III. Daily micronutrient intakes below Reference Nutrient Intakesa and Lower
Reference Nutrient Intakesa in free-living older people
Nutrient Males Females
RNI %below LRNI %below RNI %below LRNI %below
RNI LRNI RNI LRNI
Vitamin A (µg/d) 700 43 300 5 600 44 250 3
Thiamin b, c (mg/d) 0.9 (0.8) 9 (7) 0.5 (0.5) <0.5 0.8 (0.7) 11 (8) 0.4 (0.4) <0.5
Riboflavin (mg/d) 1.3 25 0.8 5 1.1 31 0.8 9
Niacin c (mg/d) 16 (14) 1 (2) 10 (9) <0.5 12 (12) 2 8 (8) <0.5
Vitamin B6b, c (mg/d) 1.3 (1.2) 9 (8) 0.9 (0.8) 2 (1) 1(1.0) 9 (12) 0.8 (0.7) 2 (1)
Vitamin B12 (µg/d) 1.5 1 1 <0.5 1.5 5 1 1
Folate (µg/d) 200 25 100 1 200 48 100 5
Vitamin C (mg/d) 40 28 10 2 40 36 10 1
Vitamin D b (µg/d) 10 93 - 10 96 -
Calcium (mg/d) 700 35 400 5 700 57 400 9
Phosphorus (mg/d) 550 1 310 <0.5 550 3 310 <0.5
Potassium (mg/d) 3500 85 2000 17 3500 97 2000 39
Iron (mg/d) 8.7 27 4.7 1 8.7 54 4.7 5
Zinc (mg/d) 9.5 62 5.5 8 7 59 4 5
Copper (mg/d) 1.2 72 1.2 89
Iodine (µ/d) 140 30 70 2 140 52 70 6
Magnesium (mg/d) 300 72 190 21 270 87 150 23
Sodium* (mg/d) 1600 7 575 0 1600 22 575 0
Chloride** (mg/d) 2500 8 890 0 2500 25 890 0
*80% of men and 49% of women had intakes higher than 2000 mg/d **83% of men and 52% of women had intakes higher than 3000 mg/d
a Values for men and women aged 50 years and over (values in brackets for people aged 75 years and over)
b Values are for men/women aged 65 years and over
c Values in brackets for people aged 75 years and over
Source: 1998 MAFF (110)
F O O D S A F E T Y AU T H O R I T Y O F I R E L A N D
64

Table IV.IV. Daily micronutrient intakes below Reference Nutrient Intakesa and Lower
Reference Nutrient Intakesa in institutionalised older people
Nutrient Males Females
RNI %below LRNI %below RNI %below LRNI %below
RNI LRNI RNI LRNI
Vitamin A (µg/d) 700 30 300 1 600 23 250 1
Thiamin b, c (mg/d) 0.9 (0.8) 17 (N/A) 0.5 <0.5 0.8 (0.7) 13 (N/A) 0.4 <0.5
Riboflavin (mg/d) 1.3 26 0.8 3 1.1 14 0.8 3
Niacin c (mg/d) 16 (14) 8 (N/A) 10 (9) <0.5 12 2 8 (8) <0.5
Vitamin B6b, c (mg/d) 1.3 (1.2) 18 (N/A) 0.9 (0.8) 1 1 9 0.8 (0.7) 2
Vitamin B12 (µg/d) 1.5 1 1 0 1.5 2 1 0
Folate (µg/d) 200 41 100 4 200 53 100 5
Vitamin C (mg/d) 40 37 10 1 40 48 10 >0.5
Vitamin D b (µg/d) 10 98 - 10 99 -
Calcium (mg/d) 700 22 400 <0.5 700 28 400 1
Phosphorus (mg/d) 550 <0.5 310 0 550 1 310 0
Potassium (mg/d) 3500 94 2000 27 3500 98 2000 40
Iron (mg/d) 8.7 41 4.7 5 8.7 62 4.7 6
Zinc (mg/d) 9.5 65 5.5 13 7 48 4 3
Copper (mg/d) 1.2 86 1.2 91
Iodine (µ/d) 140 28 70 1 140 42 70 1
Magnesium (mg/d) 300 90 190 39 270 96 150 22
Sodium* (mg/d) 1600 10 575 0 1600 17 575 0
Chloride** (mg/d) 2500 11 890 0 2500 20 890 0
*77% of men and 53% of women had intakes higher than 2000 mg/d **76% of men and 53% of women had intakes higher than 3000 mg/d
a Values for men and women aged 50 years and over (values in brackets for people aged 75 years and over)
b Values are for men/women aged 65 years and over
c Values in brackets for people aged 75 years and over
Source: 1998 MAFF (110)
F O O D S A F E T Y AU T H O R I T Y O F I R E L A N D
65

Table V.I. Percentage of Irish population over 55 years per social class meeting food
pyramid recommendations
F O O D S A F E T Y AU T H O R I T Y O F I R E L A N D
APPENDIX V
66
Percentage consuming recommended 4+
servings of fruit and vegetables per day
Percentage consuming recommended 6+
servings per day of cereals, bread and potatoes.
Percentage consuming recommended 3 or
less servings of dairy products per day
Percentage consuming recommended 2 or
less servings of meat, fish or poultry per day
Percentage consuming fried foods more than
4 times per week
Social class distribution of SLÁN and Census 1996:
Census SLÁN% %
SC1 : Professional workers 7 7SC2 : Managerial; technical 29 37SC3 : Non-manual 24 19SC4 : Skilled manual 11 18SC5 : Semi-skilled 17 13SC6 : Unskilled 11 7
Males SC 1-2 Females SC 1-2Males SC 3-4 Females SC 3-4Males SC 5-6 Females SC 5-6
Source: Health Promotion Unit, Department of Health and Children, Ireland, 1999 (107)
0
10
20
30
40
50
60
70
80
Perc
enta
ge
60%
65%
47%
72%74%
63%
0
10
20
30
40
50
60
70
80
Perc
enta
ge
55% 55%
74%
55% 54%
66%
0
5
10
15
20
Perc
enta
ge
16%
13% 13%
6%7%
8%
0
10
20
30
40
50
60
70
80
Perc
enta
ge
64% 63%66%
70%
80%
68%
0
10
20
30
40
50
Perc
enta
ge
47%50%
46% 45%47%
48%

Alkali:
A substance (hydroxide or carbonate of an
alkali metal) having marked basic properties.
Alkaline:
Of, relating to, containing or having the
properties of an alkali or alkali metal; having a
pH of more than 7.
Anaemia:
A condition in which the blood is deficient in
red blood cells, in haemoglobin, or in total
volume.
Anthropometry:
The technique whereby the composition of
the body can be measured.
Antioxidant:
Any of various substances (as beta-carotene,
vitamin C and alpha-tocopherol) that inhibit
oxidation or reactions promoted by oxygen
and peroxides, and that include many held to
protect the living body from the deleterious
effects of free radicals.
Arthritis:
Inflammation of joints due to infectious,
metabolic or constitutional causes.
Blood pressure:
Pressure exerted by the blood upon the walls
of the blood vessels, especially arteries.
BMI (Body Mass Index):
Weight in kilogram divided by height measured
in meters squared.This is used to relate weight
to the height of an individual.
C-reactive protein:
A protein present in blood serum in various
abnormal states (as inflammation or tumorous
condition).
Cardiovascular:
Of, relating to or involving the heart and blood
vessels.
Cataract:
A clouding of the lens of the eye or its
surrounding transparent membrane that
obstructs the passage of light.
Chelate:
A compound having a ring structure that
usually contains a metal ion held by co-
ordinate bonds.
Cognitive:
Of, relating to or being conscious intellectual
activity (as thinking, reasoning, remembering,
imagining, or learning words).
Coronary Heart Disease:
A condition that reduces the blood flow
through the coronary arteries to the heart
muscle.
F O O D S A F E T Y AU T H O R I T Y O F I R E L A N D
GLOSSARY
67

Diabetes Mellitus:
A variable disorder of carbohydrate metabolism
caused by a combination of hereditary and
environmental factors. Usually characterised by
inadequate secretion or utilisation of insulin, by
excessive urine production, by excessive
amounts of sugar in the blood and urine, and by
thirst, hunger and loss of weight.
Decubitus:
Prolonged lying down (as in bed).
Dementia:
A condition of deteriorated mentality that is
characterised by marked decline from the
individual’s former intellectual level and often
by emotional apathy.
Demography:
The study of mankind collectively, especially of
geographical distribution and physical
distribution.
DRV (Dietary Reference Value):
A term used in reference to RNI, LRNI, EAR
and safe intake (see below).
Dysphagia:
Difficulty in swallowing.
EAR (Estimated Average Requirement):
Of a group of people for energy or protein or
a vitamin or mineral. About half will usually
need more than the EAR, and half less.
Gastrointestinal tract:
The stomach and intestine as a functional unit.
Haematology:
A medical science that deals with the blood
and blood-forming organs.
Haemorrhoids:
A mass of dilated veins in swollen tissue at the
margin of the anus or nearby within the
rectum.
HDL (High-Density Lipoprotein):
A lipoprotein of blood plasma that is
composed of a high proportion of protein with
little triglyceride and cholesterol.
Incidence:
The rate of occurrence of new cases of a
particular disease in a population being
studied.
LDL (Low-Density Lipoprotein):
A lipoprotein of blood plasma that is
composed of a moderate proportion of
protein with little triglyceride and a high
proportion of cholesterol.
F O O D S A F E T Y AU T H O R I T Y O F I R E L A N D
68
Leukopenia:
A condition in which the number of leukocytes
circulating in the blood is abnormally low and
which is most commonly due to a decreased
production of new cells in conjunction with
various infectious diseases, as a reaction to
various drugs or other chemicals, or in
response to irradiation.
Lipoprotein:
Any of a large class of conjugated proteins
composed of a complex of protein and lipid.
LRNI (Lower Reference Nutrient Intake):
The amount of a nutrient that is enough for
only a few people in a group who have low
needs.
Macronutrient:
These are nutrients which are required in large
amounts and are the main sources of energy in
the diet, e.g. carbohydrate, protein, fat and
alcohol.
Macular degeneration:
A loss of central vision in both eyes produced
by pathological changes in the macula lutea and
characterised by spots of pigmentation or
other abnormalities.
Malabsorption:
Faulty absorption of nutrient materials from
the alimentary canal.
Micronutrient:
These nutrients are required in small amounts
and are needed for optimal body function e.g.
vitamins and minerals.
Mineral:
A solid homogeneous crystalline chemical
element or compound that results from the
inorganic processes of nature.
Morbidity:
The incidence of disease: the rate of sickness
(as in a specified community or group).
Mortality:
The number of deaths in a given time or place;
mortality rate/death rate: the proportion of
deaths to population.
Neutropenia:
Leukopenia in which the decrease in white
blood cells is chiefly in neutrophils.
Nutritional Assessment:
Methods used to determine the nutritional
status of an individual.
Obesity:
A condition characterised by excessive bodily fat.
Osteoporosis:
A condition that is characterised by decrease
in bone mass with decreased density and
enlargement of bone spaces producing
porosity and fragility.
F O O D S A F E T Y AU T H O R I T Y O F I R E L A N D
69

Parenteral:
Situated or occurring outside the intestine
(parenteral drug administration by
intravenous, intramuscular or subcutaneous
injection).
Prevalence:
The percentage of a population that is affected
with a particular disease at a given time.
Peptic Ulcer:
An ulcer in the wall of the stomach or
duodenum resulting from the digestive action of
the gastric juice on the mucous membrane when
the latter is rendered susceptible to its action.
Polypharmacy:
The use of several prescribed and/or non-
prescribed drugs at the same time.
RDA (Recommended Dietary Allowance):
The level of intake of nutrients that, on the
basis of scientific knowledge, are judged to be
adequate to meet the known nutrient needs of
practically all healthy persons.
RNI (Reference Nutrient Intake):
The amount of a nutrient that is enough or
more than enough for about 97% of people in
a group.
Safe Intake:
A term used to indicate intake or range of
intakes of a nutrient for which there is not
enough information to estimate RNI, EAR or
LRNI. It is an amount that is enough for almost
everyone but not so large as to cause
undesirable effects
Stroke:
Sudden diminution or loss of consciousness,
sensation and voluntary motion caused by
rupture or obstruction (as by a clot) of an
artery of the brain.
Trace element:
A chemical element present in minute
quantities; one used by organisms and held
essential to their physiology.
Vitamin:
Any of various organic substances that are
essential in minute quantities to the nutrition
of most animals and some plants, act especially
as coenzymes and precursors of coenzymes in
the regulation of metabolic processes but do
not provide energy or serve as building units,
and are present in natural foodstuffs or are
sometimes produced within the body.
F O O D S A F E T Y AU T H O R I T Y O F I R E L A N D
70

1. U.S. Census Bureau (1993) An ageing
world II - international population reports.
Washington D.C.: U.S. Government Printing
Office.
2. Central Statistics Office (1997) Irish
census 96. Principle demographic results.
Dublin: Stationery Office.
3. Central Statistics Office (1997) Press
Release 30 October 1996. Census - Volume
2,Ages and Marital Status.Visited Oct 1999.
URL:http://www.cso.ie/pressreleases/prelcen96v2.html
4. U.S. Census Bureau (1999) International
Data Base.Visited Sep 1999.
URL: http://www.census.gov/ipc/www/idbprint.html
5. Central Statistics Office (1998)
Numbers of Births, Marriages and Deaths
1950 to 1998. Visited: Jan 2000.
URL:http://www.cso.ie/principalstats/pristat7.html
6.Ashton, L (1997) Implications of an ageing
society:A challenge and an Opportunity. The
Older Consumer - Towards the Millennium
and Beyond. Conference Programme
Leatherhead Food Research Association.
7. Department of Health and Social
Security (1992) The Nutrition of Elderly
People. Report on Health and Social Subjects
No. 43. London: HMSO.
8. National Council on Ageing and
Older People and the Department of
Health and Children (1998) Adding years
to life and life to years:A Health Promotion
Strategy for Older People. Dublin: National
Council on Ageing and Older People.
9. Central Statistics Office (1989) Irish
census 86. Ages and martial status.Volume 2.
Dublin: Stationery Office.
10. Fahey,T (1995) Health and Social Care
implications of population ageing in Ireland,
1991-2011. Report Number 42.
Dublin: National Council for the Elderly.
11. Department of Public Health,
Eastern Health Board (1998) Public
Health in the Eastern Health Board Region.
Dublin:Wood Printcraft.
12. Rosenberg, IH (1997) Nutrition and
senescence. Nutrition Reviews, 55(1), Part II
p69-73.
13. Guigoz,Y (1997) Recommended dietary
allowances (RDA) for the free-living elderly.
Facts, Research and Intervention in Geriatrics.
Paris: Serdi Publishing.
14. Department of Health and Children
(1998) Life expectancy at selected ages for
the period 1950 to 1994. Visited: Jan 2000.
URL:http://www.doh.ie/statistics/health_statistics/vit
al.html
F O O D S A F E T Y AU T H O R I T Y O F I R E L A N D
REFERENCES
71

15. Food and Agriculture Organization
of the United States/World Health
Organization (1992) Major issues for
nutrition strategies. Caring for the socio-
economically deprived and nutritionally
vulnerable. International Conference on
Nutrition. FAO/WHO 1992 Italy.
16.Webb, GP and Copemann, J (1996)
The Nutrition of Older Adults. Bristol:
Arnold.
17. Food and Agriculture Organization
of the United States/World Health
Organization (1992) Nutrition and
development – a global assessment.
International Conference on Nutrition.
FAO/WHO: Italy.
18. Posner, BM and Levine, E (1991)
Nutrition Services for older Americans. In:
Chernoff, R (ed) Geriatric Nutrition the
Health Professional’s Handbook.
Gaithersburg, Maryland:An Aspen Publication.
19. Lipschitz, DA (1991) Nutrition and
health in the elderly. Current Opinion in
Gastroenterology, 7 p227 283.
20. Garrow, JS and Webster, J (1985)
Quetelet’s Index (W/H2) as a measure of
fatness. International Journal of Obesity, 9
p147-53
21. Kwok,T and Whitelaw, MN (1991)
The use of armspan in nutritional assessment
of the elderly. Journal of the American
Geriatric Society, 39(5) p492-496.
22. Mitchell, CO and Chernoff, R (1991)
Nutritional assessment of the elderly. In:
Chernoff, R (ed) Geriatric Nutrition the
Health Professional’s Handbook.
Gaithersburg, Maryland:An Aspen Publication.
23. Garrow, JS and James,WPT (1993)
Human Nutrition and Dietetics. Edinburgh:
Churchill Livingstone.
24. Guigoz,Y,Vellas, B and Garry, PJ
(1994) The mini nutritional assessment: a
practical tool for grading the nutritional state
of elderly patients. Facts and research in
Gerontology. Paris: Serdi Publishing.
25. Hickson, M and Hill, M (1997)
Implementing a nutritional assessment tool in
the community: a report describing the process,
audit and problems encountered. Journal of
Human Nutrition and Dietetics, 10 p373-37.
26. Charles, R, Mulligan, S and O’Neill, D
(1999) The identification and assessment of
under nutrition in patients admitted to the
age related health care unit of an acute
Dublin general hospital. Irish Journal of
Medical Science, 168/3, p180-185.
F O O D S A F E T Y AU T H O R I T Y O F I R E L A N D
72

27.Ward, J et al (1998) Development of a
screening tool for assessing risk of
undernutrition in patients in the community.
Journal of Human Nutrition and Dietetics, 11
p323 – 330.
28. Guigoz,Y,Vellas, B and Garry, PJ
(1996) Assessing the nutritional Status of the
Elderly:The Mini Nutritional Assessment as
Part of the Geriatric Evaluation. Nutrition
Reviews, Jan 54(1) pS59-S65.
29. Davies, L (1989) Risk factors for
malnutrition. In: Horowitz,A et al (eds)
Nutrition in the Elderly. Published on behalf
of the World Health Organization by Oxford
University Press.
30. Charles, RP (1998) Nutrition
assessment methods for the older Irish adult
in the clinical and community settings.
Proceedings on the Nutrition Society, 57
p599-602.
31. Payette, H and Gray-Donald, K
(1997) Risk of malnutrition in an elderly
population receiving home care services.
Facts, Research and Intervention in Geriatrics
1997 (Nutrition in the Elderly). New York:
Springer Publishing Company.
32. Davis, L (1988) Practical nutrition for
the elderly. Nutrition Reviews, 46(2) p 83-87.
33. Howarth, CC (1989) Dietary intake
studies in elderly people. World Review of
Nutrition and Dietetics, 59 p1-70.
34. Lehmann,A (1989) A review:
undernutrition in elderly people. Age and
ageing, 18 p339-353.
35. Friedmann, JM et al (1997) Predicting
early nonelective hospital readmission in
nutritionally compromised older adults.
American Journal of Clinical Nutrition, 65
p1714-1720.
36. Hoffman, N (1993) Diet in the elderly
(Needs and Risks). Medical Clinics of North
America, 77 p745-755.
37. Bastow, MD, Rawlings, J and Allison,
SP (1983) Benefits of supplementary tube
feeding after fractured neck of femur: a
randomised controlled trial. British Medical
Journal, 287 p1589-1592.
38. Ritchie, CS et al (1997) Nutritional status
of urban homebound older adults. American
Journal of Clinical Nutrition, 6 p815-818.
39.Walker, D and Beauchene, RE (1991)
The relationship of loneliness, social isolation,
and physical health to dietary adequacy of
independently living elderly. Journal of
American Dietetic Association, 91 p300-304.
F O O D S A F E T Y AU T H O R I T Y O F I R E L A N D
73
40. Davis, MA et al (1990) Living
arrangements and dietary quality of older U.S.
adults. Journal of American Dietetic
Association, 90 p1667-1672.
41. Browne, JP et al (1997) General
Practitioner and Public Health Nurse Views of
Nutritional Risk Factors in the Elderly. Irish
Journal of Medical Science, 66(1) p23-25.
42. Powers, JSP and Folk, CM (1992)
Nutritional concerns in the elderly. Southern
Medical Journal, 851p107-1112.
43. Blumberg, JF and Suter, P (1991)
Pharmacology, nutrition and the elderly:
Interactions and implications. In: Chernoff, R
(ed) Geriatric Nutrition the Health
Professional’s Handbook. Gaithersburg,
Maryland:An Aspen Publication.
44. Ortega, RM et al (1997) Dietary intake
and cognitive function in a group of elderly
people. American Journal of Clinical
Nutrition, 66 p803-809.
45. Irish Nutrition and Dietetic Institute
(1990) The Irish National Nutritional Survey
(INNS). Dublin: Irish Nutrition and Dietetic
Institute.
46. Blaum, CS et al. Factors associated
with low body mass index and weight loss in
nursing home residents. Journal of
Gerontology. Series A: Biological Sciences and
Medical Sciences 1995 May: 50 (3): M162-8.
47. Kerstetter et al (1992) Malnutrition in
the institutionalised older adult. Journal of
the American Dietetic Association, 92(9)
1109-16.
48. Lipski, PS et al (1993) A Study of
Nutritional Deficits of Long-stay Geriatric
Patients. Age and Ageing, 22(4): 244-55.
49. Schmuck,A et al (1996) Antioxidant
vitamins in hospitalised elderly patients:
analysed dietary intakes and biochemical
status. European Journal of Clinical Nutrition,
50(7): 473-8.
50. Corish, C (1998) Personal
Communication with Sheena Rafferty.
51. Mowe, M et al (1994) Reduced nutritional
status in an elderly population (>70 y) is
probable before disease and possibly contributes
to the development of disease. American
Journal of Clinical Nutrition, 60(2): 298.
52. Cederholm,T et al (1992) Nutritional
Status in Recently hospitalized and Free-Living
Elderly Subjects. Gerontology, 38 (1-2):105-10.
F O O D S A F E T Y AU T H O R I T Y O F I R E L A N D
74

53. Posner, BE (1987) Dietary
characteristics and nutrient intake in an urban
homebound population. Journal of the
American Dietetic Association Apr;
87(4):452-6.
54. Gloth, FM 3rd et al (1995) Vitamin D
deficiency in homebound elderly persons.
Journal of the American Medical Association,
6:274(21): 1683-6.
55. Fogarty, J et al (1992) Assessment of the
nutritional status of rural and urban elderly living
at home. Irish Medical Journal, 92(1): 14-16.
56. Zheng, JJ et al (1989) What is the
nutritional status of the elderly? Geriatrics,
44(6): 57-8, 60, 63-4.
57. Posner, BM et al (1994) Nutritional Risk
in New England Elders. Journal of
Gerontology, 49(3): M123-32.
58. Bianchetti,A et al (1990) Nutritional
intake, socio-economic conditions and health
status in a large elderly population. Journal of
the American Geriatric Society, 38(5),521-526.
59. Rissanen, PM et al (1996) The
Nutritional Status of Finnish Home-living
Elderly people and the Relationship between
Energy Intake and Chronic Diseases. Age and
Ageing, 25(2):133-8.
60. Quinn, K et al (1996) Folate and vitamin
B 12 status of the elderly. European Journal
of Clinical Nutrition, 50(6):340-2.
61. Department of Health (1995)
Recommendations for a Food and Nutrition
Policy for Ireland. Dublin: Stationery Office.
62.World Health Organization (1994)
Cardiovascular disease risk factors: new areas
for research.WHO Technical Report Series
841. Geneva:WHO.
63.World Health Organization Expert
Committee on Hypertension Control
(1994).Visited Jul 1999.
URL:http://www.who.int/ncd/cvd/trs862.html
64.American Heart Association (1999)
Heart and Stroke A-Z Guide. Visited Jul 1999.
URL:http://www.americanheart.org/Heart_and_Stro
ke_A_Z_Guide/
65.World Health Organization (1990)
Diet, nutrition, and the prevention of chronic
diseases.WHO Technical Report Series 797.
Geneva:WHO.
66. INTERSALT Cooperative Research
Group (1988) INTERSALT: an international
study of electrolyte excretion and blood
pressure: results for 24-hour urinary sodium
and potassium excretion. British Medical
Journal, 297:319-328.
F O O D S A F E T Y AU T H O R I T Y O F I R E L A N D
75

67. Department of Health and Social
Security (1994) Nutritional Aspects of
Cardiovascular Disease. Report on Health
and Social Subjects No 46. London: HMSO.
68. Stampfer, MJ and Malinow, MR
(1995).Can lowering homocysteine levels
reduce cardiovascular risk? The New England
Journal of Medicine, 3323p28-329.
69.Ward,M et al (1997) Plasma homocysteine,
a risk factor for cardiovascular disease, can be
effectively lowered by physiological amounts of
folic acid. Quarterly Journal of Medicine, 90 p1-6.
70. Shafer, Diane and Rush, Sherry (1998)
Introduction. In: Hemostasis Basics Programmed
Learner. Provided by Dade Behring Hemostasis
Technical Services.Visited Aug 1999.
URL:http://www.dadebehring.com/hemo/tutorial/tut
orial.htmNatural
71. Department of Health and Social
Security (1998) Nutritional Aspects of the
Development of Cancer. Report on Health
and Social Subjects No 48. London: HMSO.
72. Food Safety Advisory Committee
(1994) Diet and Cancer. (Updated Version)
Report to the Minister for Health and the
Minister for Agriculture, Food and Forestry
No 20. Dublin:The Stationary Office.
73.American Diabetes Association
(1997) Type 2 Diabetes. Visited Sep 1999.
URL:http://www.diabetes.org/ada/c20b.asp and
http://www.diabetes.org/ada/c30c.asp
74.World Health Organization (1988).
Healthy nutrition: preventing nutrition related
diseases in Europe.WHO regional
publications, European series No 24.WHO:
Copenhagen.
75. Kassianos, G (1993) Constipation.
Cave of the Elderly, 5 p444-445.
76. National Digestive Diseases
Information Clearinghouse (1998)
Constipation. NIH Publication No. 95-2754
July 1995; e-text updated: November 1998.
Visited: Sep 1999.
URL:http://www.niddk.nih.gov/health/digest/pubs/co
nst/const.htm
77. Steingold, G and Vartan, K (1991) The
last frontier: satisfying food for everyone.
Nursing Homes, March/April p1-4.
78. Riggs, KM et al (1996) Relationships of
vitamin B-12, vitamin B-6, folate and
homocysteine to cognitive performance in
the Normative Ageing Study. American
Journal of Clinical Nutrition, 63 p306-314.
F O O D S A F E T Y AU T H O R I T Y O F I R E L A N D
76

79. Goodwin, JS, Goodwin, JM and
Garry, PJ (1983) Association between
nutritional status and cognitive functioning in
a healthy elderly population. Journal of the
American Medical Association, 248 p2917-21.
80. Rosenberg, IH and Miller, JW (1992)
Nutritional factors in physical and cognitive
functions of elderly people. American Journal
of Clinical Nutrition, 55 p1237S-1247S.
81. Shearer, MJ (1997) The role of vitamins
D and K in bone health and osteoporosis
prevention. Proceedings of the Nutrition
Society, 56 p915-937.
82. Robins, SP and New, SA (1997)
Markers of bone turnover in relation to bone
health. Proceedings of the Nutrition Society,
56 p903-914.
83. Bunker,WV and Clayton, BE (1989)
Research reviews: Studies in the nutrition of
elderly people with particular reference to
essential trace elements. Age and Ageing, 18
p422-429.
84. Caroline Walker Trust (1995) The
Caroline Walker Trust Eating Well for Older
People. London: Caroline Walker Trust.
85. Bucknall,T (1984) Factors affecting wound
healing. In: Bucknall,T and Hed, Ellis (eds)
Wound-healing For Surgeons. UK: Bailliere
Tindall.
86. Department of Health (1996) Cancer
services in Ireland:A national strategy.
Dublin: Stationery Office.
87. Dawson, CR and Schwab, IR (1981)
Epidemiology of cataract - a major cause of
preventable blindness. Bulletin of the World
Health Organization, 59 p493-501.
88. Seddon, JM et al (1994) Dietary
carotenoids, vitamins A, C and E, and
advanced age-related macular degeneration.
Journal of the American Medical Association,
272 p1413-1420.
89. Snodderly, DM (1995) Evidence for
protection against age-related macular
degeneration by carotenoids and antioxidant
vitamins. American Journal of Clinical
Nutrition, 62(supplement) p1448S-1461S.
90. Department of Health (1991)
Nutrition Health Promotion. Framework for
action. Dublin: Department of Health, Health
Promotion Unit.
F O O D S A F E T Y AU T H O R I T Y O F I R E L A N D
77

91. SENECA Investigators (1996)
Longitudinal changes in iron and protein
status of elderly Europeans. European Journal
of Clinical Nutrition, 50(suppl.2) pS16-S24.
92. Lehmann,A (1991) Nutrition in old age:
an update and questions for future research:
part 1. Reviews in Clinical Gerontology, 1
p135-145.
93.The Economic and Social Research
Institute (16 June 1999) Analysis of HIPE
cases for specific diagnoses. (Letter
correspondence to Christina Tlustos, FSAI).
HIPE data available at:The Economic and
Social Research Institute, 4 Burlington Road,
Dublin 4, Ireland.
94. National Cancer Registry of Ireland
(1998) Official Webpage. Visited Sep 1999
URL: http://indigo.ie/~cancereg/
95. Sullivan, DH (1992) Risk factors for
early hospital readmission in a select
population of geriatric rehabilitation patients:
the significance of nutritional status. Journal
of the American Geriatric Society, 40 p792-
798.
96. Keller, HH (1993) Malnutrition in
institutionalised elderly: How and why?
Journal American Gerontology Society, 41
p1212-1218.
97. Delmi, M et al (1990) Dietary
supplementation in elderly patients with
fractured neck of femur. Lancet, 335 p1013-
1016.
98.Woo, J, Ho, SC and Mak,YT (1994)
Nutritional status of elderly patients during
recovery from chest infection and the role of
nutritional supplementation assessed by a
prospective randomised single-blind trial.
Age and Ageing, 23 p40-48.
99. Larsson, F and Unosson, M (1990)
Effect of dietary supplement on nutritional
status and clinical outcome in 501 geriatric
patients a randomised study. Clinical
Nutrition, 9 p179-184.
100. Shields, PL (1994) Justification for
nutrition teams. Long term survival and cost
effectiveness of prolonged in-patients TPN for
acute GI failure: 10 years experience. Clinical
Nutrition, 13 (Supplement 1) p57.
101. Irish Heart Foundation (1994) Happy
heart communities’ survey. Dublin: Irish Heart
Foundation.
102. Kilkenny Health Project (1992) A
pilot programme for coronary heart disease
prevention in Ireland (1985-1990). Kilkenny
Heart Project.
F O O D S A F E T Y AU T H O R I T Y O F I R E L A N D
78

103. Food Safety Authority of Ireland
(1999) Recommended Dietary Allowances for
Ireland. Dublin: FSAI.
104. National Research Council (1989)
Recommended dietary allowances. 10th
Washington: National Academy Press.
105. European Scientific Committee for
Food (1993) Nutrient and energy intakes for
the European Community. Published by the
Commission of the European Communities.
106. Department of Health and Social
Security (1991) Dietary reference values for
food energy and nutrients for the United
Kingdom. Report on Health and Social
Subjects No. 41. London: HMSO.
107. Health Promotion Unit, Department
of Health and Children (1999) The National
Health & Lifestyle Surveys.
108. Nutrition Advisory Service for the
Elderly, Eastern Health Board and
Health Promotion Unit, Department of
Health and Children. Eat well. Food Tips
for Older People. Leaflet.
109. Ministry of Agriculture, Fisheries
and Food and Department of Health
(1998) National Diet and Nutrition Survey:
people aged 65 years and over. London:The
Stationary Office.
110. Guthrie, HA (1988) Nutrient
requirements of the elderly. In: Chernoff, R
and Lipschitz (eds) Health Promotion and
Disease Prevention in the Elderly. New York:
Raven Press, Ltd.
111. Department of Health and
Children (1998) A review of the Health
Promotion Framework for Action Nutrition
Plan. Dublin: Stationery Office.
112. Munro, HN, Suter, PM and Russell,
RM (1987) Nutritional requirements of the
elderly. Annals Review Nutrition 7 p23-49.
113. James,WPT (1989) Energy. In:
Horowitz,A et al (eds) Nutrition in the Elderly.
Published on behalf of the World Health
Organization by Oxford University Press.
114. FAO/WHO (1997) Carbohydrates in
Human Nutrition - Report of the Joint
FAO/WHO Expert Consultation 14-18 April
1997.
URL:http://www.fao.org/WAICENT/FAOINFO/ECO
NOMIC/ESN/Carboweb/Carbo.htm
115. Maisey, S et al (1995) Variation in food
group and nutrient intake with day of the
week in an elderly population.
British Journal of Nutrition, 73(3) p359-73.
F O O D S A F E T Y AU T H O R I T Y O F I R E L A N D
79

116. Euronut – SENECA (1991) Nutrition
and the elderly in Europe. 1st European
Congress on Nutrition and Health in the
Elderly.The Netherlands, December 1991.
European Journal of Clinical Nutrition, 45
Supplement 3 p1-196.
117. USDA Human Nutrition Research
Centre on Ageing (1992) Nutrition of the
elderly, Boston nutrition status survey. (Eds)
Hartz, SC, Russel, RM and Rosenberg IH.
London: Smith-Gordon & Co. Ltd.
118. British Nutrition Foundation (1998)
Nutrition Facts/Facts on Carbohydrate/
Energy and Nutrients/Food and Nutrition
Information.Visited Aug 1999.
URL:http://www.nutrition.org.uk/index.htm
119. Department of Health and Social
Security (1991) Nutrition and health in old
age. Report on Health and Social Subjects
No. 16. London: HMSO.
120. Department of Health, Ireland
(1996) National Alcohol Policy. Dublin:The
Stationary Office.
121. British Nutrition Foundation (1998)
Nutrition Facts on Fat/Energy and
Nutrients/Food and Nutrition Information.
Visited Nov 1999.
URL:http://www.nutrition.org.uk/index.htm
122. Euronut SENECA Investigators
(1991) Intake of vitamins and minerals.
European Journal of Clinical Nutrition, 45
(Supplement 3) p121-138.
123. Russell, RM (1997) New views on the
RDAs for older adults. Journal of the American
Dietetic Association, 97(5) p515-518.
124. Suter, PM (1991) Vitamin requirements.
In: Chernoff, R (ed) Geriatric Nutrition the
Health Professional’s Handbook.
Gaithersburg, Maryland:An Aspen Publication
125. O’Keeffe, ST et al (1994) Thiamine
deficiency in hospitalized elderly patients.
Gerontology, 40 p18-24.
126. Bailey,AL et al (1997) Relationships
between micronutrient intake and
biochemical indicators of nutrient adequacy in
a ‘free-living’ elderly UK population. British
Journal of Nutrition, 77 p225-242.
127. Russell, RM and Suter, MS (1993)
Vitamins requirements of the elderly: an update.
American Journal Clinical Nutrition, 58 p4-14.
128.Van der Wielen, RPJ et al (1995)
Dietary intakes of energy and water-soluble
vitamins in different categories of ageing. In:
Van der Wielen, RPJ (ed) Vitamin intake and
status in elderly Europeans.Wageningen
Agricultural University Netherlands.
F O O D S A F E T Y AU T H O R I T Y O F I R E L A N D
80

129. Joosten, E et al (1993) Metabolic
evidence that deficiencies of vitamin B-12
(cobalamin) folate and vitamin B-6 occur
commonly in elderly people. American
Journal of Clinical Nutrition, 58 p468-176.
130. Keane, E et al (1998) The use of folic
acid fortified milk in the elderly population.
Gerontology, 38 p280-284.
131. Lowik, MRH et al (1990) Nutrition and
ageing: Nutritional Status of “apparently
healthy” elderly. (Dutch Nutrition Surveillance
System). Journal of American College
Nutrition, 9(1)1p8-27.
132. Rosenberg, IH et al (1982) Folate
nutrition in the elderly. American Journal of
Clinical Nutrition, 36 p1060-1066.
133. Goldberg, JP (1991) Ageing and the
cardiovascular system. In: Chernoff, R (ed)
Geriatric Nutrition the Health Professional’s
Handbook. Gaithersburg, Maryland:An Aspen
Publication
134. Jacques, PF et al (1997) Plasma 25-
hydroxyvitamin D and its determinants in an
elderly population sample. American Journal
of Clinical Nutrition, 66 p929 -926.
135.Thurnham, DI (1992) Micronutrients:
how important in old age? European Journal of
Clinical Nutrition, 46(Supplement 3) pS29-S37.
136. Meade,A, Moloney, M and
O’Keeffe, D (1986) Prevalence of Vitamin D
deficiency in the elderly in two rural areas in
Ireland. Irish Medical Journal, 79 p359.
137. Keane, EM et al (1992) Vitamin-D-
fortified liquid milk - A highly effective
method of vitamin D administration for
house-bound and institutionalised elderly.
Gerontology, 38 p280-284.
138. Chapuy, MC et al (1994) Effects of
calcium and cholecalciferol treatment for
three years on hip fractures in elderly
women. British Medical Journal, 308 p1081-
1082.
139. McKenna, MJ et al (1995) Safety and
efficacy of increasing wintertime vitamin D
and calcium intake by milk fortification.
Quarterly Journal of Medicine, 88 p895-898.
140.Tucker, K (1995) Micronutrient Status and
Ageing. Nutrition Reviews, 53(9) (II) pS9-15.
141.Tucker, K (1999) Potassium,
magnesium, and fruit and vegetable intakes
are associated with greater bone mineral
density in elderly men and women. American
Journal of Clinical Nutrition, 69(4) p727-36.
F O O D S A F E T Y AU T H O R I T Y O F I R E L A N D
81

142. Uauy, R et al (1998) Essentiality of
copper in humans.American Journal of
Clinical Nutrition, 67(suppl) p952S-9S.
143. Rafferty, S (1996) Nutritional Needs of
the elderly. Nutrition Forum, July 1996.
144. British Nutrition Foundation (1998)
Nutrition Facts on Vitamins; Nutrition Facts
on Minerals/Nutrition Facts/Food and
Nutrition Information.Visited Nov 1999.
URL:http://www.nutrition.org.uk/index.htm
145. Hurson, M, Corish, C and Sugrue,
S (1997) Dietary intakes in Ireland of a
healthy elderly population. Irish Journal of
Medical Science, 166 p220-224.
146. Sommerville, J and O’Regan, M
(1993) The contribution of breakfast to
micronutrient adequacy of the Irish diet.
Journal of Human Nutrition and Dietetics, 6
p223-228.
147.Working Party on Services for the
Elderly (1988) The years ahead:A Policy for
the Elderly. Dublin: Stationery Office.
148. Department of Health (1994)
Shaping a healthier Future. A Strategy for
effective healthcare in the 1990s. Dublin:
Stationery Office.
149. Fahey,T and Murray, P (1994) Health
and autonomy among the over 65s. Dublin:
National Council for the Elderly in Ireland.
150. Murphy–Lawless, J (1992) The
adequacy of income and family expenditure.
Dublin: Combat Poverty Agency.
151. Ministry of Agriculture, Fisheries
and Food (1997) National Food Survey
1997. Annual Household Food Consumption
and Expenditure. London: HMSO.
152. National Nutrition Surveillance
Centre (1993) Nutrition Surveillance in
Ireland. Galway: Standard Printers.
153. Martin,K (1997) Food retailing for the
older consumer. The Older Consumer -
Towards the Millennium and Beyond.
Conference Programme Leatherhead Food
Research Association.
154. Mee P. (1997) Personal Communication
with Sheena Rafferty.
155.The Irish Heart Foundation (1998)
Happy Heart Eat Out Evaluation. Dublin: Irish
Heart Foundation.
156. Smith, L (1998) Foodborne Illness in
the elderly. Journal of Food Protection, 61(9)
p 1229-1239.
F O O D S A F E T Y AU T H O R I T Y O F I R E L A N D
82

157. Ryan, MJ et al (1997) Outbreaks of
infectious intestinal disease in residential
institutions in England and Wales 1992-1994.
Journal of Infection, 34 p 49-54.
158. Djuretic,T et al (1996) Infectious
intestinal disease in elderly people.
Communicable Disease Review, 6 Review No
8, p R107-R112.
159. Mullin, B (1998) Community Nutrition
in the North Western Health Board Region.
Identifying the nutritional needs of older
people.A report presented in part
requirement of Diploma in Community
Development at the National University of
Ireland, Galway.
160. Usher, N (1994) Medium-term strategy
- Adding health to life: preparing the middle-
aged for an active, independent and healthy
old age. In: National Council for the Elderly
(ed) Measures to promote the health and
autonomy of older people in Ireland. Dublin:
National Council for the Elderly.
161. Sorenson,A, Chapman, N and
Sundwall, DN (1991) Health promotion and
disease prevention in the elderly. In: Chernoff,
R (ed) Geriatric Nutrition the Health
Professional’s Handbook. Gaithersburg,
Maryland:An Aspen Publication.
162. Keenaghan, C (1997) North Western
Health Board Community Nutrition Project,
Evaluation Report. Public Health Department,
North Western Health Board.
163. O’Donovan, O et al (1997) Training
carers of older people:An Advisory report.
National Council for the Elderly. Report
No.47. Dublin: National Council for the
Elderly.
164. Ruddle, H, Donoghue, F and
Mulvihill, R (1997) The Years Ahead Report:
A review of the implementation of its
recommendations. National Council on
Ageing and Older People Report Number 48.
Dublin: National Council on Ageing and Older
People.
165. Finucane, P,Tiernang, J and Moane
G (1994) In support services for carers of
elderly people living at home. Dublin:
National Council on Ageing and Older
people.
166. Stephen,A et al (1997) Food
provision, wastage and intake in elderly
hospital patients. Proceedings of the
Nutrition Society, 56(2) p220A.
167.World Health Organization (1986)
Ottawa Charter for Health Promotion.
Geneva:WHO.
F O O D S A F E T Y AU T H O R I T Y O F I R E L A N D
83

168. Lehmann,AB (1991) Normal values
for weight, skeletal size and body mass indices
in 890 men and women aged over 65 years.
Clinical Nutrition, 10 p18-22.
F O O D S A F E T Y AU T H O R I T Y O F I R E L A N D
84

Chair
Ms Sheena Rafferty
Health Promotion Department
Eastern Health Board
Members
Ms Regina Buckley
Institute of Community Health Nursing
Eastern Health Board
Ms Ruth Charles
Care of the Older Person
Irish Nutrition and Dietetic Institute
Dr Terry Connors
National Council on Ageing and Older
Persons
(Since July 1998)
Ms Patricia Dawson
Physical Activity Programmes Co-ordinator
Age and Opportunity
Ms Moira Hurson
Research Nutritionist
Mr Eddie Matthews
Director of Services for the Elderly
Eastern Health Board
Dr Des O’Neill
Irish Society of Physicians in Geriatric
Medicine
Ms Vivien Reid
Departments of Preventive Medicine and
Cardiology
St.Vincent’s Hospital, Dublin
(Representing the Nutrition Sub-committee)
Ms Katrina Ronis
Health Promotion Unit
Department of Health and Children
Ms Trish Whelan
National Council on Ageing and Older
Persons
(until May 1998)
Secretariat
Ms Sonya Byrne
Food Safety Authority of Ireland
Mr Michael Mulkerrin
Food Safety Authority of Ireland
(until June 1998)
F O O D S A F E T Y AU T H O R I T Y O F I R E L A N D
MEMBERS OF THE FOOD AND NUTRITION POLICY FOROLDER PEOPLE WORKING GROUP
85

Chair
Dr Emer Shelley
Eastern Health Board
Baggot Street Hospital
Members
Prof Albert Flynn
Department of Nutrition
University College, Cork
Dr Mary Flynn
Dublin Institute of Technology
Kevin Street, Dublin
Dr Emer Daly
The National Food Centre
Dunsinea, Dublin
Dr John Kearney
Institute of European Food Studies
Trinity College, Dublin
Prof Cecily Kelleher
Centre for Health Promotion Studies
National University of Ireland, Galway
Mr Michael Mulkerrin*
Food Unit
Department of Health and Children
Ms Ursula O’Dwyer
Consultant Dietician
Department of Health and Children
Mr John O’Mahony
Department of Agriculture, Food and Rural
Development
Ms Kathryn Raleigh
Food, Drink & Tobacco Federation
IBEC
Ms Vivien Reid
Department of Preventive Medicine and
Cardiology
St Vincent’s Hospital, Dublin
Dr Helen M Roche
Department of Clinical Medicine
The Trinity Centre for Health Sciences
Secretariat
Ms Sonya Byrne
Food Safety Authority of Ireland
*Note: Mr Mulkerrin resigned from the
Secretariat in June 1998.
F O O D S A F E T Y AU T H O R I T Y O F I R E L A N D
MEMBERS OF NUTRITION SUB-COMMITTEE
86

F O O D S A F E T Y AU T H O R I T Y O F I R E L A N D
NOTES
87

F O O D S A F E T Y AU T H O R I T Y O F I R E L A N D
NOTES
88


Food Safety Authority of IrelandAbbey Court, Lower Abbey Street,
Dublin 1
Údarás Sábháilteachta Bia na hÉireannCúirt na Mainistreach, Sráid na Mainistreach Íocht.,
Baile Átha Cliath 1
Telephone: +353 1 817 1300Facsimile: +353 1 817 1301
E-mail: [email protected]: www.fsai.ie
£5.00 ¤¤6.35