west pokot county 2017 short rains food security
TRANSCRIPT

1
WEST POKOT COUNTY 2017 SHORT RAINS FOOD SECURITY ASSESSMENT
REPORT
A joint report by the Kenya Food Security Steering Group (KFSSG)1 and the West Pokot
County Steering Group
February 2018
1 Fredrick Aloo (Ministry of Agriculture Livestock & Fisheries(SDL), Lydiah Wachuka (Ministry of Health)

2
TABLE OF CONTENTS Executive Summary ...........................................................................................................................................3
1.0 INTRODUCTION ..................................................................................................................................4
1.1 County background ....................................................................................................................................4 1.2 Objectives and approach ............................................................................................................................4
2.0 DRIVERS OF FOOD AND NUTRITION SECURITY IN THE COUNTY ....................................5
2.1 Rainfall Performance .................................................................................................................................5 2.2 Insecurity/Conflicts ....................................................................................................................................5 2.3 Other Shocks and Hazards .........................................................................................................................5
3.0 IMPACTS OF DRIVERS ON ACUTE FOOD AND NUTRITION SECURITY ............................6
3.1 Availability ................................................................................................................................................6 3.1.1. Crop production .................................................................................................................................6
3.1.2 Livestock production...........................................................................................................................7
3.2 Access ..................................................................................................................................................... 10 3.2.1 Markets .............................................................................................................................................10
3.2.2 Terms of trade ...................................................................................................................................11
3.2.3 Income sources ..................................................................................................................................11
3.2.4 Water availability, access and utilization ..........................................................................................12
3.2.5 Food consumption .............................................................................................................................13
3.2.6 Coping strategy .................................................................................................................................13
3.3 Utilization ............................................................................................................................................... 14 3.3.1. Morbidity and mortality patterns .....................................................................................................14
3.3.2 Immunization and Vitamin A supplementation ................................................................................14
3.3.3. Nutritional status and dietary diversity ............................................................................................15
3.3.4. Hygiene and sanitation .....................................................................................................................16
3.4 Trends of key food security indicators .................................................................................................17
4.0. CROSS CUTTING ISSUES .....................................................................................................................18
4.1 EDUCATION ......................................................................................................................................... 18 5.0 FOOD SECURITY PROGNOSIS ............................................................................................................20
5.1 Assumptions ............................................................................................................................................ 20 5.2 Food security outlook 3 months (February - April 2018) ....................................................................... 20 5.3 Food security outlook of 6 months (May - July 2018) ............................................................................ 20
6.0 CONCLUSION AND INTERVENTIONS ..............................................................................................21
6.1 Conclusion .............................................................................................................................................. 21 6.1.1 Phase classification ...........................................................................................................................21
6.1.2 Summary of findings .........................................................................................................................21
6.1.3 Sub-county ranking ...........................................................................................................................21
6.2 On-going Interventions ........................................................................................................................... 22 6.2.1 Non-food interventions .....................................................................................................................22
6.3 Recommended Interventions................................................................................................................... 25 6.3.1 Food interventions.............................................................................................................................25
6.3.2 Non-food interventions .....................................................................................................................25

3
Executive Summary
Mixed farming livelihood zone in the county has remained in Minimal Food Security Phase
classification, Agro Pastoral and Pastoral livelihood zone are classified under Stressed Food Security
phase. Food security situation in the county has improved compared to last year in the same season.
Households remained in the Acceptable category in January 2018 as same period the previous year,
a number of households in the borderline category dropped to poor category, indicating a worsening
food insecurity situation. The Food Consumption Score (FCS) of 2016 same period was 82.3percent
and 68.5percent in SMART survey with 38.9percent of households in the Pastoral zone being
categorized as having acceptable FCS in comparison with 73.3percent households under the same
category in the Agro-pastoral and mixed livelihood zones. The proportion of children at risk of
malnutrition according to Mid Upper Arm Circumference (MUAC) is 5.8 percent compared to 13.3
in January 2017 at the same time last year.
Food availability at household level was near-normal in the mixed farming livelihood zone as food
stocks and milk were available. However, stocks were depleted in the pastoral and agro-pastoral
livelihood zone and households were depending on markets for food. Livestock production in all
livelihood zones was below normal due to reduced availability of forage which can be attributed to
poor rejuvenation of pasture due to previous rainfall failures.
Food access was a challenge as maize prices, a staple food in the county, was below the long-term
average (LTA) and the previous year’s price, attributed to increased demand due to low supplies in
the county. Income from livestock production, the major source of income for approximately 70
percent of the populace had reduced due to migration of a large proportion of livestock to Uganda in
the previous season. The current low numbers of livestock have implications on household assets
and low availability of milk in the pastoral and agro-pastoral livelihood zones. The purchasing
power of households in the pastoral and agro-pastoral livelihood zones had therefore been eroded.
Close to 78 percent of households in the county accessed water from unprotected water sources and
90 percent did not treat water before consumption. Latrine coverage was below optimal at 47 percent
with 53 percent practising open defecation or shared latrines and only 2.2 percent washed hands
during the four critical times. The poor hygiene and sanitation practices had predisposed households
to water-borne diseases which ranked high in the county’s morbidity trends and affected optimal
food utilization and outcome in the body.
The major contributing factors of food insecurity include; fall army worm infestation, insecurity
along the borders of the county with Marakwet, insecurity along the borders with neighboring
counties hindered access to pasture. Pasture condition was on a deteriorating trend while most parts
of the county received 125-200 percent of normal rainfall with even spatial distribution and poor
temporal distribution. There was an early cessation. The fall army worm had destroyed crops in both
the agro-pastoral and pastoral-all species livelihood zone and there was substantial crop failure.

4
1.0 INTRODUCTION
1.1 County background
West Pokot County is located in the North-Western
part of the country. It borders the Republic of Uganda
to the west, Baringo County to the east, Trans Nzoia
and Elgeyo Marakwet counties to the south and
Turkana County to the north. The county is
administratively divided into four sub-counties namely;
Pokot North, Pokot South, Pokot Central and Pokot
West. It has an area of 9,169.4 square kilometers with a
population of 649,418 persons (Projected Kenya
National Bureau of Statistics, 2016) and consist of
three main livelihood zones namely; Pastoral (All
species) comprising 33 percent of the population,
mixed farming comprising 30 percent and agro pastoral
comprising 37 percent of the population (Figure 1).
1.2 Objectives and approach
The main objective of the Short Rains Food Security Assessment was to develop an objective,
evidence-based and transparent food security situation analysis following the 2017 short rains
season, taking into account the cumulative effects of last three previous seasons. The analysis is
aimed at providing immediate and medium term recommendations for possible response options
based on the situation analysis. Data was collected through primary and secondary sources.
Secondary data was collected through sectoral checklists which were filled by technical sector
representative. Secondary data collected from the early warning system was relied upon to provide
trends for the different food security indicators. Primary data was collected during the County field
visits through community and market interviews. Technical reports were also provided by the
sectoral technical members at the County level.
Data was analyzed by means of tables, pie charts, proportions by percentages, bar charts and
frequencies.
Figure 1.Populating by livelihood zone

5
Figure 2: Rainfall performance in West Pokot
County
2.0 DRIVERS OF FOOD AND NUTRITION SECURITY IN THE COUNTY
2.1 Rainfall Performance
The County experienced a normal onset of rains, in
the second dekad of October 2017. The spatial
distribution was even and temporal distribution was
poor. Most areas in the lowlands received between
140 and 200 percent of normal rainfall. While the
highlands received between 125 and 200 percent of
normal rainfall (Figure 2). An early cessation of
rainfall was witnessed during the second dekad of
November both in the highlands and lowlands.
Normally, rains cease in the third dekad of December
with off season rains being experienced in the month
of January in mixed farming livelihood zone.
2.2 Insecurity/Conflicts
There was conflict along the border of the county with Marakwet County over pasture which
resulted in closure of Chesogon market and Schools along the borders. Specific hotspots of
insecurity included Chesegon, Akulo, Amaler, Cheptulel, Amolem and Lotongot.
2.3 Other Shocks and Hazards
There was outbreak of the fall army worm in the county that destroyed the crops planted thus
resulting in low production of maize. Most households, about 90 percent are currently relying on
market purchases for food in the agro-pastoral and pastoral-all species livelihood zones. Foot and
Mouth Disease (FMD) outbreak was reported in Mixed farming livelihood zones of Lelan, Siyoi,
Kapenguria and Mnagei wards. Contagious Bovine Pleural Pneumonia (CBPP), Contagious Caprine
Pleural Pneumonia (CCPP) and Peste des Petits Ruminants (PPR) is endemic in pastoral and agro
pastoral livelihood zones of Pokot central Kiwawa, Kasei and Riwo in Pokot North however the
cases were normal.

6
3.0 IMPACTS OF DRIVERS ON ACUTE FOOD AND NUTRITION SECURITY
3.1 Availability
The county depends on domestic agricultural and livestock production for food, and net food
imports. Food availability relates to crop and livestock production across all livelihood zones. In
crop production, food stocks available at household and market levels are considered while in
livestock production; livestock ownership, forage and milk availability and livestock body condition
are taken into account.
3.1.1. Crop production
The short rain season accounts for approximately 20 percent of crop production. During the short
rains the major crops grown are mainly beans, maize, Irish potatoes and bulb onions. The table 1
shows the contribution of the three major crops to both food and income across the livelihoods.
Table 1: Contribution of major crops grown to food and income
Contribution to Food Contribution to cash income
Agro pastoral Mixed
farming
Pastoral Agro pastoral Mixed
farming
Pastoral
Maize 52 39 55 21 30 15
Beans 15 15 10 21 8 20
a) Rain-fed crop production
In mixed farming and Agro pastoral areas, there were reduced agricultural activity from the short
rains as the farmers rely on the long rains for farming. During short rains, area planted under maize
declined by 10 percent while area under beans and Irish potato increased by 47 and 8 eight percent
of Long Term Average (LTA) respectively (Table 2). The decline in acreage under maize and
subsequent lower production may be attributed to early cessation of the rains resulting in low soil
moisture content to enhance crop maturity. There was an increase in beans production by 34 percent
attributed to timely planting of early maturing crop variety. Irish potato production increased by over
49 percent of the LTA; this was attributed by the interventions by Food and Agricultural
Organization (FAO) in promotion of drought resistant variety and early maturing crops.
Table 2: Rain-fed crop production
Crop Area planted
during 2017
Short rains
season
(Ha)
Long Term
Average
area planted
during the Short
rains season (Ha)
2017 Short rains
season
production
(90 kg bags)
Projected/Actual
Long Term Average
production during the
Short rains season
(90 kg bags)
1 Maize 25 28 625 700
2.Beans 292 199 2336 1745 4.Irish potatoes 1056 986 16800 11250
b) Irrigated crop production
The acreage under maize increased by 28 percent of the LTA while that of beans was stable. (Table
3). The increase was due to opening up of more land to irrigated agriculture coupled with provision
of water pumps and certified seeds by the county government. Maize production was 57 percent of
the LTA, the decline was attributed to the fall army worm infestation.

7
Table 3: Irrigated Crop Crop Area planted
during 2017
Short rains
season
(Ha)
Long Term
Average
area planted during
the Short rains
season (Ha)
2017 Short rains
season
production
(90 kg bags)
Projected/Actual
Long Term Average
production during the
Short rains season
(90 kg bags)
Beans 205 200 1,080 1,200
Bulb Onions 4,450 4,000 44,600 34,000
Maize 655 512 4,690 8,250
c) Main cereal stocks
The current food stocks held are mainly from the long rains harvest. Stocks held by households are
below the long term average (LTA) by 47 percent due to crop failure as a result of early cessation of
the short rains. The stocks held by traders, millers and the National Cereals and Produce Board
(NCPB) are below the long term average by 57, 70 and 89 percent. (Table 4). Food stocks in the
mixed farming zones are diminishing while in the pastoral and agro pastoral zones, no food stocks
are held at household level and households are depending on market purchases indorsed to low
production during the current season.
Table 4: Commodity stocks in West Pokot County
Maize stocks held by Quantities of maize held (90-kg bags) Long Term Average quantities
held (90-kg bags) at similar
time of the year
House Holds 159,450 298,932
Traders 13,876 32,313
Millers 45 150
NCPB 3,678(6,621 -50kgs bags) 30,885
Total 177,049 362,280
Available maize stocks are likely to last for four months in mixed farming livelihood zone while
under normal situation, stocks would last for six months. However, households in the pastoral-all
species and agro-pastoral livelihood zones are relying on markets for maize which is also normal.
3.1.2 Livestock production
The main livestock types found in the county include cattle, goats, sheep, camel and poultry.
Livestock production supports a significant proportion of the human population across the three
major livelihood zones as shown in the table below (Table 5).
Table 5. Contribution of livestock to food and income Livelihood zone Percent contribution to income
Livestock production Food crop production
Agro-pastoral 25 30
Mixed farming 23 41
Pastoral-all species 24 69
Forage condition
The current pasture condition is poor in the pastoral-all species and ranges from poor to fair in agro-
pastoral livelihood zones, attributed to insufficient regeneration, high temperatures and rapid
depletion by grazing livestock. In mixed farming livelihood zones the pasture condition range from
fair to good and may be attributed to the above normal rains received and favorable temperatures
that were not as high as in the pastoral and agro pastoral livelihood zones. The available pasture is
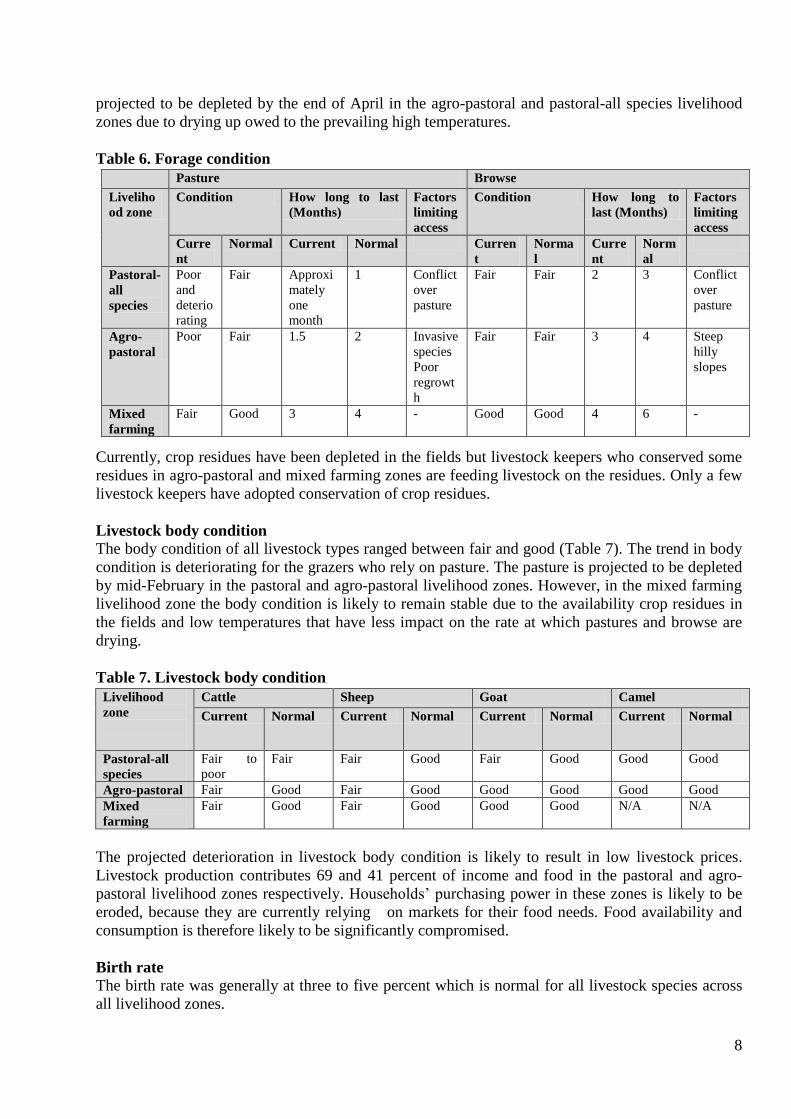
8
projected to be depleted by the end of April in the agro-pastoral and pastoral-all species livelihood
zones due to drying up owed to the prevailing high temperatures.
Table 6. Forage condition
Currently, crop residues have been depleted in the fields but livestock keepers who conserved some
residues in agro-pastoral and mixed farming zones are feeding livestock on the residues. Only a few
livestock keepers have adopted conservation of crop residues.
Livestock body condition
The body condition of all livestock types ranged between fair and good (Table 7). The trend in body
condition is deteriorating for the grazers who rely on pasture. The pasture is projected to be depleted
by mid-February in the pastoral and agro-pastoral livelihood zones. However, in the mixed farming
livelihood zone the body condition is likely to remain stable due to the availability crop residues in
the fields and low temperatures that have less impact on the rate at which pastures and browse are
drying.
Table 7. Livestock body condition
The projected deterioration in livestock body condition is likely to result in low livestock prices.
Livestock production contributes 69 and 41 percent of income and food in the pastoral and agro-
pastoral livelihood zones respectively. Households’ purchasing power in these zones is likely to be
eroded, because they are currently relying on markets for their food needs. Food availability and
consumption is therefore likely to be significantly compromised.
Birth rate
The birth rate was generally at three to five percent which is normal for all livestock species across
all livelihood zones.
Pasture Browse
Liveliho
od zone
Condition How long to last
(Months)
Factors
limiting
access
Condition How long to
last (Months)
Factors
limiting
access
Curre
nt
Normal Current Normal Curren
t
Norma
l
Curre
nt
Norm
al
Pastoral-
all
species
Poor
and
deterio
rating
Fair Approxi
mately
one
month
1 Conflict
over
pasture
Fair Fair 2 3 Conflict
over
pasture
Agro-
pastoral
Poor Fair 1.5 2 Invasive
species
Poor
regrowt
h
Fair Fair 3 4 Steep
hilly
slopes
Mixed
farming
Fair Good 3 4 - Good Good 4 6 -
Livelihood
zone
Cattle Sheep Goat Camel
Current Normal Current Normal Current Normal Current Normal
Pastoral-all
species
Fair to
poor
Fair Fair Good Fair Good Good Good
Agro-pastoral Fair Good Fair Good Good Good Good Good Mixed
farming
Fair Good Fair Good Good Good N/A N/A

9
Tropical livestock units (TLUs)
The TLUs have reduced across all livelihood zones for both medium and low income households
compared with the normal situation at this time of the year (Table 8). The reduction is attributed to
mortalities reported in the last three previous rainfall failure seasons and reduced birth rates due to
deteriorating livestock body conditions hence increased cases of abortions.
Table 8. Tropical Livestock Units
LHZ Pastoral Agro –
pastoral
Mixed farming
Current 8 6 5
Normal 10 10 5
Variation by wealth
group
Poor income 2-3 2-3 2-3
Medium income 4-6 4-5 3-4
Milk production and consumption
Milk production has reduced at household level due to below-normal forage availability (Table 9).
Cattle, the major producers of milk in the pastoral and agro-pastoral livelihood zone, migrated to
Uganda in search of pasture. Reduced milk availability had resulted in reduction of milk
consumption and increase in prices at markets across all livelihood zones.
Table 9. Milk production and consumption
Water for Livestock
The main sources of water currently in use include water pans, boreholes, shallow wells, and rivers
(Table 10). Others include springs, piped water and streams, they are the normal sources at this time
of the year. However, some open water sources have dried up making livestock walk longer
distances to access water. Due to the high temperatures and heavy silting, the open water sources are
drying up at a rate of 60 percent in the pastoral-all species livelihood zone and 40 percent in the
agro-pastoral livelihood zone.
Table 10. Water for livestock
Livelihood
zone
Sources Return average
distances (km)
Expected duration to
last (months)
Current Normal Current Normal Current Normal
Pastoral-all
species
Water pans
Boreholes
Shallow wells
Laggas Rivers
Water pans
Boreholes
Shallow wells
Laggas Rivers
8 6 1
4
Agro-pastoral Water pans
Boreholes
Shallow wells
Laggas Rivers
Water pans
Boreholes
Shallow wells
Laggas Rivers
5 4 3 4
Mixed
farming
Rivers, Streams,
Springs, Piped
water
Rivers, Streams,
Springs, Piped
water
2.5 1 4 5
Livelihood zone
Milk Production
(Litres)/Household
Milk consumption
(Litres) per Household
Prices (Ksh)/Litre
Current LTA Current LTA Current LTA
Mixed farming 2.5 3 1 2 60 30
Agro-pastoral 1.5 2 1 2 90 45
Pastoral-all species 1 1.5 0.5 1.5 90 45

10
Figure 3: Maize prices West Pokot County
Migration
Migration occurred mainly in the Pastoral and agro pastoral livelihood zones. In Mixed farming
livelihood zone there was no migration. Cattle have migrated to Uganda in the Amdat, Karita and
Lokales. The current migration routes are Sook-Nakwijit-Karita (along the border), Lomut-Ortum-
Riwo-Karita, Kasei-Ngotut-Ngongosowon-Lokilotor and Kiwawa/Alale-Loroo-Achorichor. A small
proportion of livestock that had earlier migrated to Uganda about 20 percent came back after the
recent short rains. However, the trend is likely to reverse and more animals are migrating again to
Uganda due to rapid depletion of pasture and poor rejuvenation. The migrations are not normal and
are as a result of cumulative effects of the previous poor seasons (short rains 2016 and long rains
2017). The movements have resulted in reduced milk availability and consumption for the
households in the pastoral and agro-pastoral livelihood zones. It has also reduced income from milk
sales.
Livestock Diseases and Mortalities
There were no major disease out breaks reported in the county except a few cases of black quarter in
Patei that was contained through vaccination. The mortality rates were slightly higher than normal
in pastoral and agro pastoral livelihood zones and stable in the mixed farming livelihood zones
(Table 11).
Table 11. Livestock Mortalities
3.2 Access
Access to food in the county is largely characterized by the functionality of markets particularly for
households in the agro-pastoral and pastoral-all species livelihood zone who are currently relying on
them for food. In this section, prices of key commodities, terms of trade and income sources are
discussed together with gaps in food consumption and the coping strategies employed to bridge
them.
3.2.1 Markets
Market operations
The main markets in the county include
Makutano, Kacheliba, Sigor. Lomut and
Chepareria. Market were operating
normally apart from Chesegon market in
the pastoral livelihood zone was not
operational due to insecurity.
Maize prices
Maize prices were at 30 percent below
the long term average and seven percent
lower than the price posted at a similar
period in 2017 (Figure 3). The below
average prices have been attributed to the
above noraml rainfall experienced in the
Livelihood
zone
Cattle Sheep Goat Camel
Current Normally Current Normally Current Normally Current Normally
Pastoral-
all species
5 3 8 5 8 4 2 4
Agro-
pastoral
3 2 1.5 1 3 2 N/A N/A
Mixed
Farming
2.5 2 1 1 2.5 2 N/A N/A

11
Figure 4: Goat prices in West Pokot County
Figure 5: Terms of Trade in West Pokot County.
last short rain and fall army worm infestation. The highest prices were posted in the pastoral-all
species at Kshs 45 per kilo gram while the lowest were recorded in the mixed farming livelihood
zone at Kshs 40/kg. Maize prices are expected to increase because of low stocks available in the
county and reduced external supplies. The imports meant to cover the deficit in availability may not
sustain the demand for the commodity as households are mainly dependat on market purchases.
Goat prices Goat prices were 20 percent higher than the
2012-2016 LTA and 52 percent higher than
the price recorded in 2017 at a similar time
(Figure 4). Prices were significantly
higher-than-normal as browse condition
was still good. The highest prices were
recorded in the mixed farming livelihood
zone while the pastoral-all species
livelihood zone recorded the least price.
Goat prices are likely to derteriorate in the
next three months as the browse condition
deteriorates.
3.2.2 Terms of trade
The terms of trade (TOT) were 75
percent higher than the 2012-2016 LTA
and 65 percent above at a similar
period last year (Figure 5). The high
terms of trade implied that households
can currently purchase more maize with
the proceeds from the sale of a goat
compared with normal times. The TOT
was lowest in the pastoral-all species
livelihood zone and highest in the agro
pastoral livelihood zone implying that
households’ purchasing power was low
in pastoral livelihood zone as
compared to agro pastoral. The trend is
likely to deteriorate in households’
purchasing power as goat prices are
expected to decline with the deteriorating forage condition.
3.2.3 Income sources
The main sources of income in the county include livestock and food crop production (Table 12).
Table 12. Income sources Livelihood zone Percent contribution to income
Livestock production Food crop production
Agro-pastoral 26 20
Mixed farming 30 25
Pastoral-all species 69 5

12
Other sources of income in the county include cash crop farming, Beekeeping, petty trade and
poultry production. Since income from the main source had dwindled in the pastoral-all species and
agro-pastoral livelihood zone, households had resorted mainly to charcoal burning to earn a living.
3.2.4 Water availability, access and utilization
Water availability
The three major sources of water currently being used in the county include boreholes, rivers and
water pans. They are also the normal sources at this time of the year (Table 13). Recharge after the
short rains was 65 percent in the mixed farming livelihood zone and 40 percent in the agro-pastoral
and pastoral-all species livelihood zone. The current operational water sources are normal at this
time of the year. In the pastoral livelihood zone water pans are about 25 percent capacity in places
like Alale, Konyao and Kasei with implications that both human and livestock will not depend on
water pans but boreholes.
Table 13. Water availability
Water access and utilization
Although the recharge was below optimal, water for domestic consumption was still available and
the distances to water sources had remained relatively within normal ranges in the mixed livelihood
zone (Table14) despite slight increases in the distances walked in agro pastoral livelihood zone. The
return distance to water for domestic use has increased by 40 percent compared to normal in the
Livelih
ood
zone
Water
Source
(Three
(3)
major
sources)
No. of
Normal
Operat
ional
No. of
Current
Operatio
nal
Sources
Projected
Duration
(Operatio
nal
Sources)
Normal
Duration
that
water
last in
months
percent of
full
Capacity
Recharge
d by the
Rains
Locality of Non-
operational Water
Sources
Pastor
al
1.Boreh
oles
120 100 4 months 4months Normal Lokarkar,Amaler,Otuko,
Nasal,
Kalukuna,Kodera,
Kois,Kowolok,Kopeyon
Lokidedel
2.Water
pans
30 40 3 months 4months 40 Chepkarlal, Kompus,
Kamkongwo, Nasal
Lochariamonya
3.Rivers 3 3 Permanent
source
Permane
nt source
50
Agro
pastor
al
1.Water
pans
20 18 2months 4months 45 Riwo, Masol, chesow,
Ketiaman, Chpekesem,
Cheptamas, Ruruka
Chpelianol, Topongile
2.Boreh
oles
28 22 4months 4months normal Kongelai,Kanyarkwat,A
durkoit, chepkopegh
3.Rivers 4 4 Permanent
source
Permane
nt source
normal
Mixed
farmin
g
1.Spring
s
214 214 12months 12month
s
70percent
2.Rivers 12 12 Permanent
source
Permane
nt source
70
3.Boreh
oles
20 15 4months 4months normal

13
pastoral livelihood zone. The waiting time had also marginally reduced However, the current high
temperatures may contribute to drying up of water sources resulting in increased distances to water
sources. The situation is likely to be further exacerbated by the fact that over 60 percent of
households consume water from unprotected water source which could be the reason why diarrhea
was ranked high in the current morbidity trends in the county.
Table 14. Water access and utilization
Cost of water
The cost of water at the source (boreholes) is nil but the cost of ferrying the water has increased. The
cost of carrying a 20 litre jerrican in pastoral livelihood zone has increased from 20 to 50 Ksh, while
in Agro-pastoral it has remained at Kshs 20. The increase of cost in pastoral livelihood zone is
attributed to distance as the boreholes are eight kilometres from the households.
Water consumption
Water consumption varies across the Livelihood zones, with the highest consumption at 15 litres per
person per day in mixed farming livelihood zone and 10 litres in Agro- pastoral livelihood zones.
The least consumption is in pastoral livelihood zone at an average of 5 litres per person per day. The
variation is normal at this time of the year and the current consumption status is higher compared to
February 2017, hence slight improvements have been made in water consumption at household level. The
improvement is attributed to the availability of water at major water sources.
3.2.5 Food consumption
Although households remained in the Acceptable category in January 2018 as same period the
previous year, a number of households in the borderline category dropped to the poor category,
indicating a worsening FCS if conditions persist. The FCS of 2017 same period was 82.3 percent and
68.5 percent in SMART survey with 38.9 percent of households in the Pastoral zone being
categorized as having acceptable FCS in comparison with 73.3 percent households under the same
category in the Agro-pastoral and mixed livelihood zones.
3.2.6 Coping strategy
The coping strategy index was 9.1 meaning fewer household were applying coping mechanisms to
access food, which is within acceptable normal in the month of January 2018 and an improvement
from 18.1 in the same period in 2017 this was due to health and nutrition interventions. The most
common strategy was reducing number of meals and use less preferred foods in pastoral zones.
Ward /
livelihoo
d zone
Return Distance to
Water for
Domestic Use
(Km)
Cost of Water at
Source (Ksh. Per
20litres)
Waiting Time at
Water Source
(Minutes)
Average Water
Consumption
(Litres/person/day)
Norm
al
Current Normal Current Normal Current Normal Current
Pastoral-
all
species
5 7
nil Nil 60 120 mins 5 8
Agro
pastoral
2 3
nil Nil 30min 30min 10 10
Mixed
farming
0.2 0.2
nil Nil 0-30mins 0-15mins 15 15

14
3.3 Utilization
3.3.1. Morbidity and mortality patterns
The main morbidities affecting children under years are (Upper Respiratory Tract Infections) URTI
at 48.5%, diarrhoea at 10% and
malaria at 48.8% across all
livelihood zones. There was a
slight increase in malaria by 5%
and a 4% increase in URTI
compared to same period the
previous year (Figure 6). The
increase could be attributed to
interruptions in health care access
due to industrial strikes and rains.
A slight reduction in diarrhoea was
noted as water access increased
during rainy season.
Among the general population, there was noted increase in URTI and diarrhoea in the general
population compared to same period the previous year. Upper respiratory tract infection contributed
to 48.5 percent in July to December 2017 compared to 20.9Percent in 2016.The increase can be
attributed cold weather during the rainy seasons. Diarrhoea contribute 10.9 percent among the three
diseases in to December 2016 and had a slight increase to 12.6 percent in July to Dec 2017, while
malaria incidences contributed to 68.8 percent of the total reported cases among the three major
disease categories. URTI incidences were more than double in 2017 compared to 2016 period under
review as there was low rain. The under-fives mortality and the crude mortalities remained within
the normal rates.
3.3.2 Immunization and Vitamin A supplementation
Immunization Coverage –fully immunized children OPV and measles
The immunization coverage for fully immunized children dropped by 29.2 percent from 61.6 percent
the previous year to 32.4 percent which could be attributed to health worker strikes as the health care
workers were not available to offer services and generate data. In addition, long distances to health
facilities and inconsistent outreaches also played a role especially in pastoral livelihood zones. The
number of children accessing services reduced hence the reduced coverage. There was reduction in
vitamin A coverage for 2017 for both 6-11 months and 12-57 months, compared to same period in
2016 reduced due to staff strikes. Table 15 this is below the national target of 80 percent. The
pastoral livelihood zones had lower coverage due to long distances to the facilities and irregular
outreach services.
Table 15: Vitamin A Supplementation coverage (source DHIS, Nutrition survey Year Children 6-11 months Children 12 to 59 months Children 6-
11 months
Children 12 to
59 months
Received
vitamin A
Target (6-
11
months)
Received
vitamin A
Target (12-
59 months)
Percentage
coverage
Percentage
coverage
July to December
2017
8997 11473 23802 87466 39.6 10.7
July to December
2016
2942 10794 6886 82286 52.3 26.2
33.8%
24.1%
42%37.8%
14.3%
47.8%
0
10
20
30
40
50
60
URTI Diarrhoea Malaria
2016
2017
Disease trend in children under five years :July -Dec 2016 and July to dec 2017 compared
Figure 6: Disease trend in children under five in West Pokot County

15
Figure 7: Proportion of children at risk of malnutrition
(MUAC)
3.3.3. Nutritional status and dietary diversity
Exclusive breastfeeding rates are 39.9%, but still normal from previous years, this is much below the
national target of 80%, due to cultural practices, poor maternal diet, high maternal workload and lack
of information. In the highland areas, the rates are much higher due to better food security factors
and better access to health facilities. The period of initiation of breastfeeding is timely across all
livelihood zones. Only 29.3% of children meet the minimum dietary and meal frequency for children
6-23 months fed in a day, Table 16.
Table 16: Infant and Young Child Nutrition (KAP Survey may 2017) Year , Month of
Survey
Rate of early
initiation to
breastfeeding
Rate of exclusive
breastfeeding
Minimum Meal
Frequency for
children 6-23
months
Minimum Dietary
Diversity for children
6-23 months
2017 95.5% 39.9% 29.3% 36.9%
2016 89.5% 37.9% 16.4%
2015 78.7% 43.5% 52.0%
NDMA sentinel site estimates for
acute malnutrition by MUAC show an
improvement in 2017 compared to the
same season in 2016 despite the
plateau phase from the month of
September (Figure 7).
The proportion of children at risk of
malnutrition was at 5.8% in January
2018 which is an improvement from
the previous year same period which
was at 43 percent and 53 percent of
the long term average. The
improvement could be attributed to increased case finding through mass screening and nutrition
support programmes in place.
Malnutrition status- GAM levels (SMART SURVEY)
While there isn’t current Survey data on
acute malnutrition status for West Pokot,
recent SMART survey report of 2017
showed a GAM of 20.4% which is critical. In
2017, the stunting rate remained high at
39.9% (SMART 2017) and has reduced from
45.9% (KDHS 2014) but above national
levels of 26%, (Figure 9). This is attributed
to low Exclusive breastfeeding rates and
poor infant and young child feeding
practices, frequent illness, low dietary
diversity and maternal workload. Long
distance Napitiro (7km) to access health
services at Konyao Health Centre.
0
10
20
30
40
50
2017June 2016 June 2015 June
malnutrition Trends- GAM levels
GAM) by weight for height Z scores % SAM
% Chronic Malnutrition (Stunting)
Figure 9: Malnutrition trends-GAM levels in
West Pokot

16
Selective Feeding Programme Admission Trends (SFP/OTP)
The number of cases admitted at the
supplementary feeding programme
remained high and slightly above
normal due to active case finding
through mass screening, (Figure 10).
The number with severe acute
malnutrition admitted in the outpatient
feeding programme was high
compared to normal from the previous
years. This was due to an increase in
outreaches by partners as a result of
high GAM levels from SMART
survey June 2017. This led to
identification of many cases with
severe acute malnutrition
3.3.4. Hygiene and sanitation
Latrine Coverage & Utilization
Table 17: latrine coverage Latrine Coverage Household Relieving Points in Percentage
% Coverage Own Latrine
(%)
Shared Latrine
(%)
Open defecation (bushes)
(%)
July to December
2016 % coverage
46.9 35.3 11.7 53.1
January to June
2017
% Coverage
52.7 38.4 14.3 47.3
Latrine coverage is high but at an average of 52.7% with variations across all livelihoods. The
highlands have the highest coverage with pastoral and agro pastoral zones having less than 10%
coverage, (Table 17).
Water treatment trends
Table 18: water Treatment trends Year Month of
the Survey
% of HH
Treating
Water
Treatment Methods
Boiling Chemicals Traditional
Herbs
Pot
Filters
Others
( Specify)
2017 June 11.1% 72 25 0.65 3.3 0.7
2016 June 15.6 9.5 4.3 1.2 1.8 1.2
2015 June 24.7 58.3 39.8 2.56 13.3 2.9
2014 June 16.9 65.0 28.0 2.4 6.7 4.4
Low water treatment rates recorded across all livelihood zones where communities drink direct from
the source, boiling is the most common method of treatment, Table 18
0
200
400
600
800
1000
1200
Jan Feb Mar Apr May Jun Jul Aug Sep Oct Nov Dec
selective feeding admissions (SFP)
2017 2016 2015 2014 2013
Figure 3: Trend of Selective feeding admissions (SFP)

17
05
10152025303540
JuneSMART
May (KAPSurvey)
June(SMARTSurvey)
June(SMARTSurvey)
June(SMARTSurvey)
2017 2017 2016 2015 2014
TREN DS I N % HO U S EHO LDS HA N D W A S HI N G - 4 C RI TI C A L TI M ES
Hand washing- 4 Critical Times
Hand washing is very low with no visible
handwashing facilities in almost all
livelihoods. Most affected were in the agro-
pastoral and pastoral zones. Contamination
was visible especially in water pans where
animals and humans do not have designated
watering points, (Figure 11).
Figure 11: Hand Washing Trends
3.4 Trends of key food security indicators
Table 15. Trends of food security indicators Indicator Short rains assessment, Feb 2017 Short rains assessment, Feb 2018
percent of maize stocks held by
households (mixed farming)
107 percent of LTA (Short rains
assessment, Feb 2016)
53percent of LTA (Short rains
assessment, Feb 2018)
Livestock body condition Poor to fair Fair to Good
Water consumption (litres per
person per day)
Pastoral : 8
Agro-pastoral:10
Mixed farming:15
Pastoral: 5
Agropastoral 10
Mixed farming 15
Price of maize (Ksh. per kg) 40 41
Distance to grazing (km) Pastoral: 8km
Agro-Pastoral: 5
Mixed: 2
Pastoral – 10
Agropastoral: 6
Mixed: 2
Mid Upper Arm
Circumference
13.3 5.8
Terms of trade
(number of kilograms purchased
from the proceeds of the sale of
a goat)
50 83
Coping strategy index 18.1 9.1
Food consumption score
(percent)
Poor 6.7
Borderline 24.8
Acceptable 53
(June Feb 2017 )
Poor 7
Borderline 40
Acceptable 53
(Feb 2018)

18
4.0. CROSS CUTTING ISSUES
4.1 EDUCATION
Access (enrollment)
There was a 25.8 percent increase in enrolment in third term of 2017 compared to first term 2018 for
early childhood development (ECD) while the enrolment in primary and secondary schools
increased by 12.9 and 4.3 percent respectively. (Table 17). There were more boys than girls enrolled
across the two terms because boys’ education was more valued than the girls’ particularly in pastoral
livelihood zone of Pokot North and Pokot central sub counties. Early marriages that undermine girl
child education is still being practiced.
Table 16. Enrolment Term III 2017 Term I 2018 (includes new
students registered and drop-outs
since Term III 2017)
Enrolment № Boys № Girls Total № Boys № Girls Total
ECD 31043 30269 61312 38378 38766 77144
Primary 92673 83434 176107 101763 97038 198801
Secondary 15605 14951 30556 16770 15112 31882
Participation (Attendance)
At ECD level attendance rate was relatively stable in the county at 99.5 percent in third term 2017
and first term 2018 for boys and girls (Table 18). In primary school attendance rate was 92 percent
which was stable and can be attributed to school feeding program and reduced distance to water
sources. Participation in secondary school was stable mainly because of the government policy of
100 percent transition.
Table 17. Attendance
Retention
Across the three levels of learning more girls dropped out of school than boys (Table 22). The
dropout in ECDE can be attributed to the lack of food in schools. Conflict along the border of
Elgeyo Marakwet County may have contributed to drop out in addition to family labour
responsibilities. Absence of a school meals program was also a major contributor to drop-outs
coupled with high poverty levels that forced pupils to look for income-generating activities. In
secondary schools, students dropped out of school because they could not afford school fees, early
Term III 2017 Term I 2018
Indicator September
2017
October 2017 November
2017
January2018 February 2018
School
attendance
№
Boys
№
Girls
№
Boys
№
Girls
№
Boys
№
Girls
№
Boys
№
Girls
№
Boys
№ Girls
ECD 30112 29361 30112 29361 37227 37603 37227 37603 37227 37603
Primary 89893 81765 98710 94127 98710 94127 98710 94127 98710 94127
Secondary 15605 14951 15605 14951 15605 14951 16770 15112 16770 15112

19
marriages and early pregnancies. Across the three levels of education, there was the cross-cutting
reason of parents finding little value in educating their children. This was evidenced by low literacy
levels especially in pastoral and lower regions of agropastoral zone.
Table 22: Drop-outs in West Pokot County
Indicator End of Term II 2017 End of Term III 2017
Students dropped out from
school
№ Boys № Girls № Boys № Girls
ECD 36 44 36 44
Primary 71 76 71 76
Secondary 24 26 24 26
School meals program
There are two types of school meals program in the county: Regular School Meals Program (RSMP)
in Pokot North and Home-Grown School Meals Program (HGSMP) in the other three sub-counties.
A total of 276 schools are having school feeding Programme with HGSM having 54,828 pupils
while RSMP has 35,118 beneficiaries. The feeding program has enhanced access, participation and
retention as evidenced by improved attendance and enrolment in the county. It has also improved
performance in schools due to enhanced retention and participation. However, pupils sometimes
missed meals due to delays in food deliveries or when there was no water in school to cook the food
particularly in Pokot Central and Pokot North sub-counties. Currently about 251 schools are without
any type of school feeding with an enrolment of 108, 655 and did not have a similar program at
around the same time last year.
Inter-sector links
All schools in the county had functional latrines although they were inadequate in isolated schools.
However, 80 percent of the schools did not have hand-washing facilities and 65 percent did not have
drinking water within 100m as compared to the same time last year. In addition to the school meals
program, deworming at ECDE centers as a food security and nutrition-related intervention were
undertaken.

20
5.0 FOOD SECURITY PROGNOSIS
5.1 Assumptions
In the next six months, food security outcomes are likely to be determined by the following
assumptions:
The pastoral-all species and agro-pastoral livelihood zones are likely to experience near normal
to below normal rains in the month of April (Climate outlook forum 2018 )
Maize prices are likely to maintain an above-average trend through to May.
Rangeland conditions are likely to deteriorate due to insufficient regeneration occasioned by
poor temporal distribution of the short rains coupled with prevailing dry conditions.
Conflict is likely to continue along the borders of West Pokot and Elgeyo Marakwet -Turkana
counties.
5.2 Food security outlook 3 months (February- April 2018)
In the month of April, the long rains season is expected to have begun and would possibly
rejuvenate forage and recharge water sources. Some of the herds that migrated will return and milk
availability will improve though marginally increasing consumption and supplementing domestic
incomes from milk sales. As the livestock body condition improves due to increased forage and
water availability, prices will increase thereby boosting livestock keepers’ purchasing power.
Improved prices will coincide with harvests from the mixed farming livelihood zone of the county’s
staples which will reduce food commodity prices further improving pastoralists’ terms of trade. Food
consumption gaps will therefore reduce as food intake improves and fewer and less severe coping
strategies are employed. As milk availability improves, the nutritional status of children aged below
five years will improve as diets become more diversified. With increased availability of rangeland
resources, conflicts will reduce. Since these improvements are likely to be significant, most
households in the pastoral and agro-pastoral livelihood zones are likely to remain in stress (IPC
Phase 2). Households in the mixed farming livelihood zone are expected to remain in Minimal (IPC
Phase 1) because they will have harvested their staples and have food stocks available. The long
rains will also rejuvenate pasture and browse thereby increasing livestock production. Therefore,
these households are unlikely to have significant food consumption gaps and will continue to have a
good dietary diversity while employing few and not-so-severe coping strategies.
5.3 Food security outlook of 6 months (May – July 2018)
Pasture situation is likely to be normal due to extension of off season rains. Open water sources are
likely to be charged to capacity resulting in reduced distance to water sources. As water availability
and forage become enhanced, livestock body condition is likely to be good and fetch higher prices
in the markets. With about 90 percent of households in the pastoral and agro-pastoral livelihood
zones depending on markets, the high prices will strengthen their purchasing power as the price of
maize declines due to early crop harvests. Households in these zones will have low food
consumption gaps and malnutrition rates among children under five may significantly decline.
21
6.0 CONCLUSION AND INTERVENTIONS
6.1 Conclusion
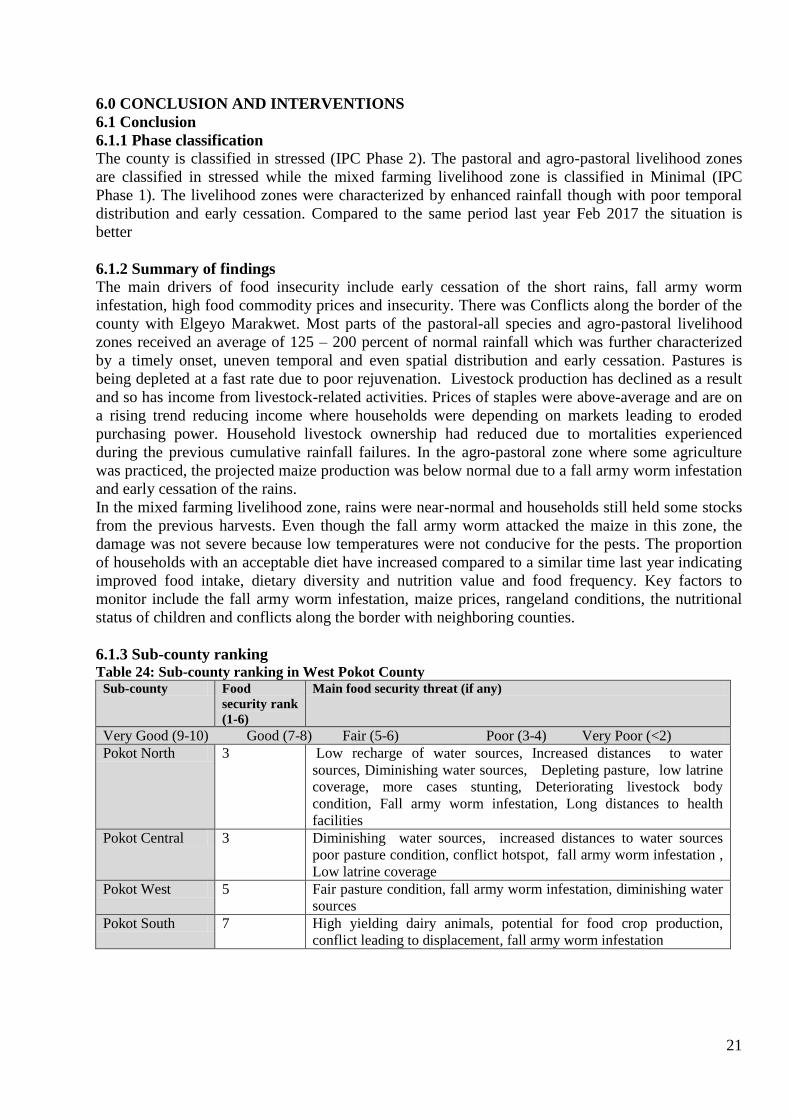
6.1.1 Phase classification
The county is classified in stressed (IPC Phase 2). The pastoral and agro-pastoral livelihood zones
are classified in stressed while the mixed farming livelihood zone is classified in Minimal (IPC
Phase 1). The livelihood zones were characterized by enhanced rainfall though with poor temporal
distribution and early cessation. Compared to the same period last year Feb 2017 the situation is
better
6.1.2 Summary of findings
The main drivers of food insecurity include early cessation of the short rains, fall army worm
infestation, high food commodity prices and insecurity. There was Conflicts along the border of the
county with Elgeyo Marakwet. Most parts of the pastoral-all species and agro-pastoral livelihood
zones received an average of 125 – 200 percent of normal rainfall which was further characterized
by a timely onset, uneven temporal and even spatial distribution and early cessation. Pastures is
being depleted at a fast rate due to poor rejuvenation. Livestock production has declined as a result
and so has income from livestock-related activities. Prices of staples were above-average and are on
a rising trend reducing income where households were depending on markets leading to eroded
purchasing power. Household livestock ownership had reduced due to mortalities experienced
during the previous cumulative rainfall failures. In the agro-pastoral zone where some agriculture
was practiced, the projected maize production was below normal due to a fall army worm infestation
and early cessation of the rains.
In the mixed farming livelihood zone, rains were near-normal and households still held some stocks
from the previous harvests. Even though the fall army worm attacked the maize in this zone, the
damage was not severe because low temperatures were not conducive for the pests. The proportion
of households with an acceptable diet have increased compared to a similar time last year indicating
improved food intake, dietary diversity and nutrition value and food frequency. Key factors to
monitor include the fall army worm infestation, maize prices, rangeland conditions, the nutritional
status of children and conflicts along the border with neighboring counties.
6.1.3 Sub-county ranking Table 24: Sub-county ranking in West Pokot County
Sub-county Food
security rank
(1-6)
Main food security threat (if any)
Very Good (9-10) Good (7-8) Fair (5-6) Poor (3-4) Very Poor (<2)
Pokot North 3 Low recharge of water sources, Increased distances to water
sources, Diminishing water sources, Depleting pasture, low latrine
coverage, more cases stunting, Deteriorating livestock body
condition, Fall army worm infestation, Long distances to health
facilities
Pokot Central 3 Diminishing water sources, increased distances to water sources
poor pasture condition, conflict hotspot, fall army worm infestation ,
Low latrine coverage
Pokot West 5 Fair pasture condition, fall army worm infestation, diminishing water
sources
Pokot South 7 High yielding dairy animals, potential for food crop production,
conflict leading to displacement, fall army worm infestation

22
6.2 On-going Interventions
6.2.1 Non-food interventions Table 25: On-going non-food interventions Intervention
Objective Location Activity
Target
Cost No. of
beneficiaries
Time
Frame
Proposed
Implementer
s
Agriculture
Immediate Interventions
Distribution of
farm inputs (
maize seeds,
Beans, green
grams, fertilizer
fertilizers)
To improved
food
production
All sub counties Capacity
building
8.192M 5,000 2017-
2019
County
government
National
government
Development of
irrigation
infrastructure
To enhance
food security
status of the
communities
Weiwei, Sekerr,
Batei, Riwo
Construction
and equipping
of irrigation
structures
60 M 5,000 2017-
2019
National
Government
and County
Government of
West Pokot
Construction of
water pans (7),
shallow
wells(2) and
sub-surface
dam(3) for
domestic use
and irrigated
fruit trees
To increased
farm
productivity
and
increased
food security
Masol,Chepareria
, Mnagei, Riwo,
Increase
acreage under
irrigation
Promote
appropriate
water
harvesting
technologies
100M
17,500
2017-
2019
West Pokot
County
Government-
Agriculture
Nutrition and
Food Utilization
To increased
household
food
nutrition
All Sub Counties Capacity
building LMIS
and
Maternal
Infant and
Young Child
Nutrition
2 M 3,000 2017-
2019
West Pokot
County
Government-
Agriculture
Medium and Long Term on going Interventions
Promotion of
drought tolerant
high value
crops (cowpeas,
sorghum, green
grams)
To enhance
food security
status of the
communities
All ASAL Wards Capacity
building
Purchase of
seeds and
fertilizers farm
inputs
20M 7,000 2017-
2019
West Pokot
County
Government-
Agriculture
Bulking of
tissue culture
banana
plantlets,
avocadoes and
mangoes for
sale to farmers
at subsidized
To promote
production
of
horticultura
l crops
Batei
Kapenguria
Weiwei
Procure
tissue culture
plantlets
Capacity
building and
extension
services
12M 20,000 2017-
2019
West Pokot
County
Government-
Agriculture
Intervention
Objective Location Activity
Target
Cost No. of
beneficiaries
Time
Frame
Proposed
Implementers
Livestock Sector
Immediate
Disease
surveillance and
Vaccination
against CCPP
and sheep and
goat pox, Black
quarter
To reduced
livestock
mortality,
increased
production
All sub-counties
-Routine
vaccination
-Participatory
disease
Surveillance
20M 40,000 Dec-Feb
2019
MOALF,
West Pokot
County
Government
Feeds
provision; Hay
and Range
To increase
chances of
livestock
Pokot North
Pokot Central
Pokot West
Procurement
and purchase
of feeds
20M 20,000
Livestock(TLUs
)
Dec,2017
-Feb,
2019
MOALF,
West Pokot
County

23
Intervention
Objective Location Activity
Target
Cost No. of
beneficiaries
Time
Frame
Proposed
Implementer
s cubes survival
during
drought
period
Government
Medium and Long Term ongoing interventions
Pasture
establishment
and
conservation
To reduced
livestock
mortality,
increased
production
Pokot North,
Pokot Central
Pokot South
West Pokot
Procurement
of appropriate
pasture seeds
Capacity
building on
pasture
production and
management
23.3M
5,000 Mar
2018-
June
2019
MOALF(BLRP
)
BCG
RPLRP
West Pokot
County
Government
Partners
Livestock breed
improvement
To improve
on livestock
productivity
All Sub-counties Capacity
building
Provision of
extension
services
18 M 4,000 Dec,2017
-Feb,
2019
Livestock
department and
ASDSP
County
Government
(Livestock
Dept) Nasukuta
Galla Buck
Schemes
To improve
on livestock
productivity
Pokot North,
Pokot Central
Pokot South
West Pokot
Procurement
of breeding
bucks
5M 500 Dec,2017
-Feb,
2019
West Pokot
County
Government
Partners
Development of
6 livestock
marketing
infrastructures
To improved
household
income
through
markets
Pokot North,
Pokot Central
Pokot South
West Pokot
Construction
of a livestock
market
39M 3,000 Dec,2017
-Feb,
2019
West Pokot
County
Government
Partners
Intervention
Objective Location Activity
Target
Cost No. of
beneficiaries
Time
Frame
Proposed
Implementers
Health Sector
Immediate
Vitamin A
Supplementatio
n
To
improved
child
immunity
All sub counties Targeting to
increase
coverage
600,00
0
108910 Dec,2017
-Feb,
2019
MOH, MOE,
Partners
(ACF,UNICEF)
Zinc
Supplementatio
n
To reduce
severity of
Diarrhoea
All health
facilities
IMCI
Integrated
management
of childhood
illnesses
450,00
0
108910 Dec,2017
-Feb,
2019
MOH, MOE,
Partners
(ACF,UNICEF)
Management of
Acute
Malnutrition
(IMAM)
To reduce
mortality
and prevent
under
nutrition
82 0f 90 health
facilities and 61
outreach sites
Conduct mass
screening
Strengthen
community
referral
Scale up
integrated
outreaches
Strengthen
communicatio
n and social
mobilization
9.6M 743456 Dec,2017
-Feb,
2019
MOH, Partners
(ACF, WFP,
CBOs, KRCS,
AMPATH plus)
Iron Folate
Supplementatio
n among
Pregnant
Women
Reduced
maternal
anaemia
Improve the
health of
infants
All immunizing
health facilities
and outreach sites
Build capacity
for health care
workers and
CHVs
Procure IFAS
2.4M 23867
Dec,2017
-Feb,
2019
MOH, Partners
(ACF,
UNICEF,
CBOs, KRCS,
AMPATH plus,
world vision
Kenya)

24
Intervention
Objective Location Activity
Target
Cost No. of
beneficiaries
Time
Frame
Proposed
Implementer
s Deworming To increase
food intake
and
utilization
All immunizing
health facilities
conduct
ECDE/School
based
deworming
during Malezi
bora weeks
1M 108913 Dec,2017
-Feb,
2019
MOH, MOE,
Partners (ACF,
UNICEF
CBOs, KRCS,
AMPATH plus,
world vision
Kenya)
Food
Fortification
To improved
nutritional
status
Wholesalers,
supermarkets,
retail shops, open
markets and
households
Procurement
and provision
of
complementar
y foods
5M 781211 Dec,2017
-Feb,
2019
MOH, Partners
(ACF,
UNICEF,
WVK,
AMPATH plus,
CBOs)MOH,
Intervention
Objective Location Activity
Target
Cost No. of
beneficiaries
Time
Frame
Proposed
Implementers
Water Sector
Immediate
Rehabilitation
of water supply
Increased
access to
safe water.
Alale, Sigor,
Konyao, Napitiro
Procurement
of equipment
Installation
Capacity
building
33.5M 23,000 2018-
2019
County
Government
WVI
Upgrading of
high yielding
boreholes Solar
powered
To enhance
water
provision
junction Konyao
Embasis, Rukei,
Chemulunjo
Tuturiamoi
Procurement
of solar panels
Installation
15.2M 22,500 2018-
2019
County
Government
and National
Government
(Rift valley
water services
board)
Pipeline
extension
Increased
access to
safe water.
Sigor
Chewoyet
Procurement
of equipment
Installation
Capacity
building
03M 3,000 2018-
2019
County
Government
Rehabilitation
of gravity water
scheme
Increased
access to
safe water.
Embosich,
Tolgoin,
Kapkimuny,
Kokpor
Procurement
of equipment
Installation
Capacity
building
19M 50,000 2018-
2019
County
Government
Intervention
Objective Location Activity
Target
Cost No. of
beneficiaries
Time
Frame
Proposed
Implementers
Medium and long term ongoing interventions
Rehabilitation,
drilling and
equipping of
boreholes
To increase
in access to
safe water
Kakoliong,
Kakres,
Kolkonya,
Nauma
Siting,
Procurment,
and
installation
6M 5000 1year County
Government
Gravity scheme
Rehabilitation
To increased
knowledge
on safe
water.
Kesot, Cheptorok Conduct water
resouse
management
Planting of
trees
20.6M 30,000 1year County
Government
Construction of
20,000 m3
water pans
To increased
knowledge
on safe
water.
Lodiokour,
cheptamus,
Chepkaralal
Topographical
survey
Procurement
and excavation
of pan
60M 20,000 2018-
2019
County
Government,
RPLRP,
DRSLP, KCSP
Intervention
Objective Location Activity
Target
Cost No. of
beneficiaries
Time
Frame
Proposed
Implementers
Education
Provision of
tanks
To increase
in access to
All Sub-counties Procurment,
and
50M 165schools 2018-
2019
County
Government,

25
Intervention
Objective Location Activity
Target
Cost No. of
beneficiaries
Time
Frame
Proposed
Implementer
s safe water installation Development
partners
HGSM Improved
retention,
enrolment
and
attendance
All Sub-counties Procurement
and capacity
building
54828 155M WFP/GOK
RSMP Improved
retention,
enrolment
and
attendance
All Sub-counties Procurement
and capacity
building
35118 56M WFP/GOK
Long Term Intervention
Rehabilitation
of 12 boreholes
To increase
in access to
safe water
All Sub-counties Procurement,,
drilling and
installation
2000 WVI
6.3 Recommended Interventions
6.3.1 Food interventions Table 26: Recommended food interventions in West Pokot County Sub-county Food security rank (1-4) Proportion in need of immediate
food assistance (percent)
Pokot North 1 25-30
Pokot Central 2 20 – 25
Pokot West 3 10 -15
Pokot South 4 5 – 10
6.3.2 Non-food interventions Table 27: Recommended non-food interventions
Sub
County/
Ward
Intervention
Location No. of
beneficiar
ies
Proposed
Implementers
Required
Resources
Available
Resources
Time
Frame
Water Sector
Immediate recommended interventions
Central
Pokot
North
Pokot
West
Pokot
Equipping the
drilled
boreholes
Kosholoi,
Tiriokwo
kakoliong,
Kakres,
Kokwenya
Tukumwok
ECD,
Miskwony,
Kaptarin sec
school
18,000
County
Government/Wo
rld Vision/Red
Cross
5.9M land 2-
3months
North
Pokot
Pokot
De-silting of
water pans
Kodich
Kompus
Chepkaralal
Cheptamas
5,000 County
Government
6M Land 3months

26
Sub
County/
Ward
Intervention
Location No. of
beneficiar
ies
Proposed
Implementers
Required
Resources
Available
Resources
Time
Frame
Central Chepkesem
Ketiamam
Ruruka
Chepialianol
South
Pokot
Rehabilitation
of a spring
Chepkondol
Samich
5,000 County
Government
0.5M Land 2months
Medium and long-term recommended interventions
South
pokot
Gravity
scheme project
Pusol, Parua,
Ortum,
Cheptorok
20,000 County
Government
10M Land 6months
Central
pokot
Construction
of water pan
Kachangaya 8,000 County
Government
0.6M Land 2months
Central
pokot
Upgrade of
Solar system
(Borehole)
Sigor girls 1,200 County
Government
1.7M Land 3 months
North
pokot
Drill all the
sited boreholes
Chedawa,
Kalam, Kour,
Nomoru,
lobok,
8,000 County
Government
9.2M Land 8months
Livestock Sector
Immediate recommended interventions
All Sub
Counties
Provision of
supplementary
livestock feed
relief
All Sub
Counties
3000 National and
County
Government
20M 2017-
2018
All Sub
Counties
Livestock off-
take
All Sub
Counties
3000 National and
County
Government
100M 2017-
2018
All Sub
Counties
Enhanced
establishment
of pastures and
rangeland
reseeding.
All Sub
Counties
11500 Livestock
department,
DRSLP,
MOAL&F
Individual
farmers, farmer
groups
1.5M
Land
Technical
personnel
Continues
All Sub
Counties
Disease
surveillance
and
vaccination
All Sub
Counties
Livestock
department,
county
government
1M Technical
personnel
Continues
Medium and Long Term recommended Interventions
All Sub
Counties
Development
of livestock
marketing
infrastructure.
All Sub
Counties
120000 MOAL&F,
County govt.
CMC,
5M
Land
Land 2017-
2018

27
Sub
County/
Ward
Intervention
Location No. of
beneficiar
ies
Proposed
Implementers
Required
Resources
Available
Resources
Time
Frame
All Sub
Counties
Promotion of
alternative
livelihoods
through
livestock
Improvement
by purchasing
breeding
stocks and
promotion of
bee keeping
All Sub
Counties
3200
RPLRP,
livestock
department,
MOAL&F,
ASDSP,
Co-operative
Dept,
Community
3M Technical
personnel,
land
2017-
2018
Health and Nutrition Sector
Immediate recommended interventions
All Sub
Counties
Accelerated
mass screening
and referral of
acutely
malnourished
children under
5 years
Conduct
lifeline
communicatio
n and
messaging
All Sub
Counties
108912
Children
under 5
22858
Pregnant
and
lactating
mothers
County
Government,
MOH, Partners
(ACF, KRCS,
UNICEF,
WVK, youth
Bunge, SIKOM
Fred hollows),
3.5M Human
resource
though
inadequate
1year(Jun
e 2017-
June2018
)
All Sub
Counties
Accelerated
Integrated
outreach
services
Pastoral and
agro pastoral
zones across
the county and
parts of mixed
farming zones
108912
Children
under 5
22858
Pregnant
and
lactating
mothers
County
Government,
MOH, Partners
(ACF, KRCS,
UNICEF,
WVK, youth
Bunge, SIKOM
Fred hollows)
5M Human
resource
though
inadequate
1year(Jun
e 2017-
June2018
)
All Sub
Counties
Blanket
supplementary
feeding/protect
ion ration for
children less
than 5 years
Pastoral and
agro pastoral
zones across
the county and
parts of mixed
farming zones
108912
Children
under 5
County
Government,
MOH, Partners
(ACF, KRCS,
UNICEF,
WVK, youth
Bunge, SIKOM
Fred hollows)
11M Human
resource
though
inadequate
1year(Jun
e 2017-
June2018
)
All Community
mobilization
and advocacy
for E- MIYCN
Pastoral and
agropastoral
zones acrss the
county and
parts of mixed
farming zones
Whole
populating
(672298)
County
Government,
MOH, Partners
(ACF, KRCS,
UNICEF,
WVK, Youth
Bunge, SIKOM
Fred hollows)
2M Human
resource
though
inadequate
1year

28
Sub
County/
Ward
Intervention
Location No. of
beneficiar
ies
Proposed
Implementers
Required
Resources
Available
Resources
Time
Frame
All
Provision of
WASH
Facilities
Pastoral and
agropastoral
zones acrss the
county and
parts of mixed
farming zones
Household
s with
children
under five
years,
pregnant
County
Government,
MOH,Partners
(ACF, KRCS,
UNICEF,
WVK, youh
Bunge, SIKOM
Fred hollows)
5M Human
resource
though
inadequate
1year
Medium and Long term Recommended Interventions
All Sub
Counties
Roll out of
IMAM surge
model
Pastoral and
agro pastoral
zones across
the county
454593 MOH, ACF,
UNICEF
3.2M for
training
Human
resource
1 year
All Sub
Counties
Enhance
Promotion of
appropriate
MIYCN
All Sub
Counties
649418 County
Government,
MOH Partners
(ACF, KRCS,
UNICEF,
WVK, youth
Bunge, SIKOM
Fred hollows)
3.2M for
training
Human
resource
1 year
All Sub
Counties
Enhance
promotion of
appropriate
WASH
practices
All Sub
Counties
649418 County
Government,
MOH, Partners
(ACF, KRCS,
UNICEF,
WVK, youth
Bunge, SIKOM
Fred hollows)
3.2M for
training
Human
resource
1 year
All Sub
Counties
Training on
integrated
management
of acute
malnutrition
All Sub
Counties
100 newly
recruited
health
care
service
providers.
County
Government,
MOH, Partners
(ACF,
3.2M for
training
Human
resource
1 year
Education Sector
Pokot
West
Pokot
Central
Pokot
South
Extend HGSM
to all schools
Whole Sub
County
108655 GOK, WFP 57,348,90
0
Water,
Fire wood,
Man power
Termly
All the
sub
counties
Provision of
water
harvesting
tanks
All Sub
Counties
100,000 GOK,WFP 7 million Logistics 1 yearly
All the
sub
Infrastructural
development
Whole Sub
County
200,000 GOK / Donors 20M Logistics
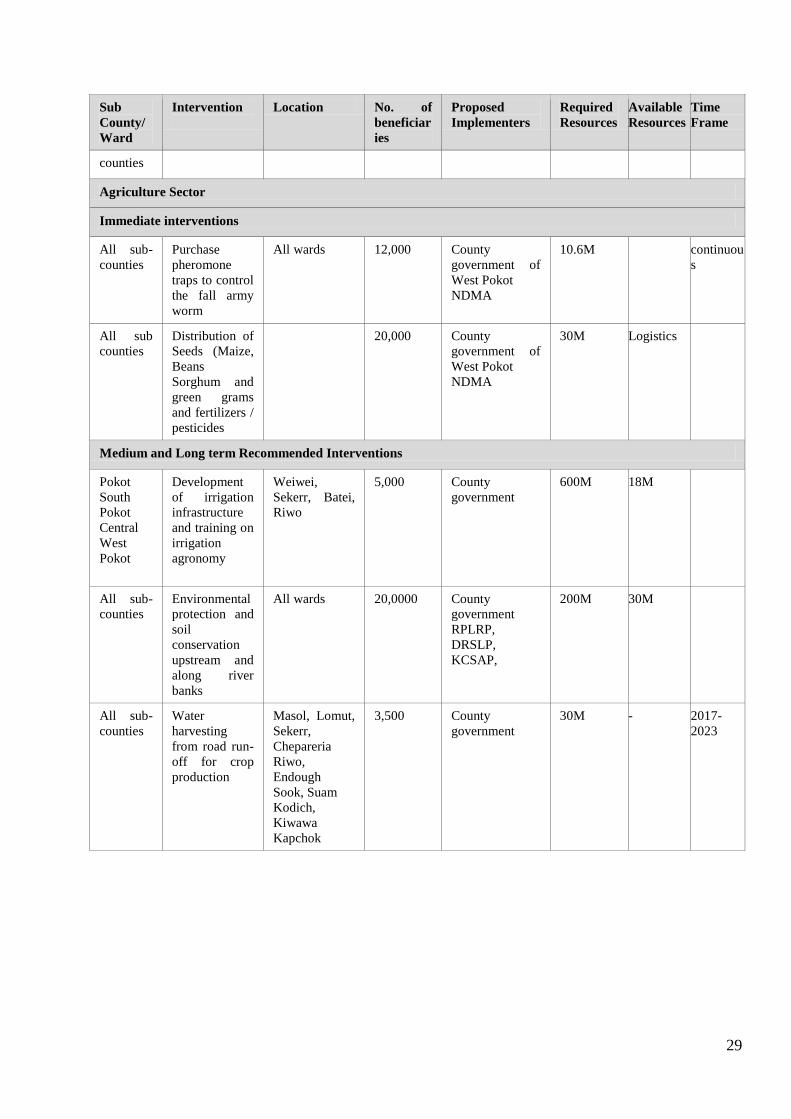
29
Sub
County/
Ward
Intervention
Location No. of
beneficiar
ies
Proposed
Implementers
Required
Resources
Available
Resources
Time
Frame
counties
Agriculture Sector
Immediate interventions
All sub-
counties
Purchase
pheromone
traps to control
the fall army
worm
All wards 12,000 County
government of
West Pokot
NDMA
10.6M continuou
s
All sub
counties
Distribution of
Seeds (Maize,
Beans
Sorghum and
green grams
and fertilizers /
pesticides
20,000 County
government of
West Pokot
NDMA
30M Logistics
Medium and Long term Recommended Interventions
Pokot
South
Pokot
Central
West
Pokot
Development
of irrigation
infrastructure
and training on
irrigation
agronomy
Weiwei,
Sekerr, Batei,
Riwo
5,000 County
government
600M 18M
All sub-
counties
Environmental
protection and
soil
conservation
upstream and
along river
banks
All wards 20,0000 County
government
RPLRP,
DRSLP,
KCSAP,
200M 30M
All sub-
counties
Water
harvesting
from road run-
off for crop
production
Masol, Lomut,
Sekerr,
Chepareria
Riwo,
Endough
Sook, Suam
Kodich,
Kiwawa
Kapchok
3,500 County
government
30M - 2017-
2023