small scale field test demonstrating sequestration in
TRANSCRIPT
Small Scale Field Test Demonstrating Sequestration in
Arbuckle Saline Aquifer and by CO2-EOR at Wellington Field, Sumner County, Kansas
DE-FE0006821
W. Lynn Watney* and Jason Rush, Joint PIs Jennifer Raney, Asst. Project Manager
Kansas Geological Survey University of Kansas
U.S. Department of Energy National Energy Technology Laboratory
FY15 Carbon Storage Peer Review March 2-6, 2015
*presenter

2
Presentation Outline
Project Objectives – Demonstrate state-of-the-art MVA (monitoring, verification, and
accounting) tools and techniques – Integrate MVA data and analysis with reservoir modeling studies to
demonstrate and ensure 99% CO2 storage permanence.
Progress to Date on Key Technical Issues – Evaluated injectivity and storage – Characterized caprock and internal baffle – Optimized MVA design to successfully evaluate -
• CO2 storage for CO2-EOR • Saline aquifer
– Evaluating USDW & Seismicity
Plans for Remaining Technical Issues
Project wrap-up
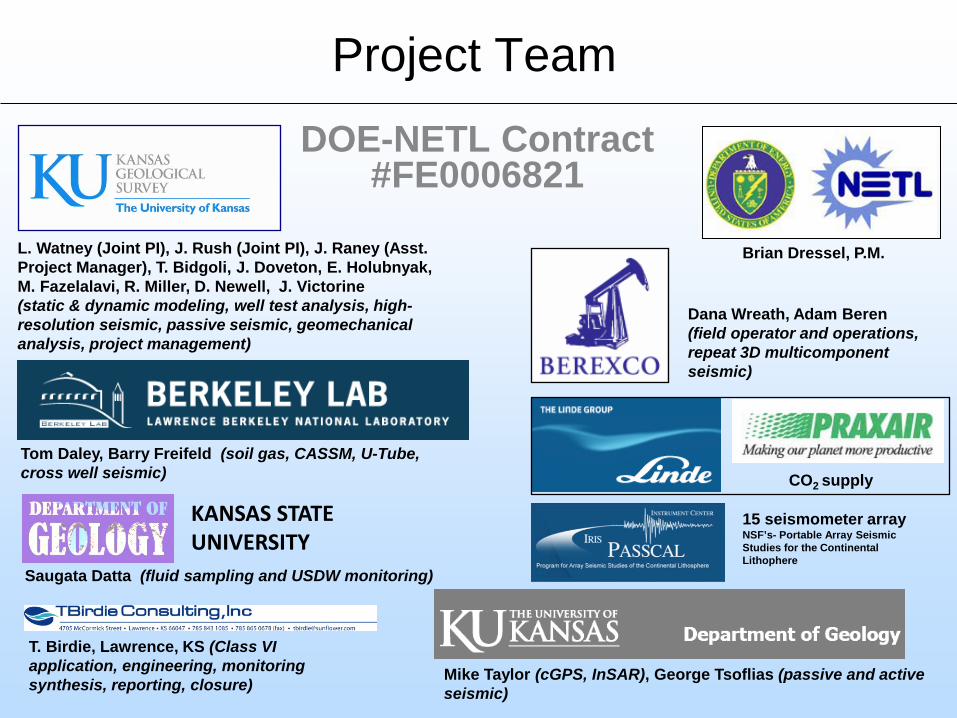
Project Team
DOE-NETL Contract #FE0006821
L. Watney (Joint PI), J. Rush (Joint PI), J. Raney (Asst. Project Manager), T. Bidgoli, J. Doveton, E. Holubnyak, M. Fazelalavi, R. Miller, D. Newell, J. Victorine (static & dynamic modeling, well test analysis, high-resolution seismic, passive seismic, geomechanical analysis, project management)
Tom Daley, Barry Freifeld (soil gas, CASSM, U-Tube, cross well seismic)
KANSAS STATE UNIVERSITY
Saugata Datta (fluid sampling and USDW monitoring)
Mike Taylor (cGPS, InSAR), George Tsoflias (passive and active seismic)
Brian Dressel, P.M.
Dana Wreath, Adam Beren (field operator and operations, repeat 3D multicomponent seismic)
T. Birdie, Lawrence, KS (Class VI application, engineering, monitoring synthesis, reporting, closure)
CO2 supply
15 seismometer array NSF’s- Portable Array Seismic Studies for the Continental Lithophere

Goals and Objectives • Program goals being addressed :
– Demonstrate that 99 percent of injected CO2 remains in the injection zone – Conduct small field test to support characterization, site operations, monitoring, and closure practices for Class VI geosequestration permit, Region 7 EPA, Kansas City, KS -- Conduct small scale field test to demonstrate geosequestration and improve oil recovery from oil reservoir overlying the saline aquifer test.
• Project benefits of this small scale field test:
– Advance the science and practice of carbon sequestration in the Midcontinent and carbonate reservoirs & saline aquifers – Evaluate reliable, cost effective MVA tailored to the geologic setting – Optimize methods for remediation and risk management – Technology transfer to local petroleum industry for implementation of CCUS – Enable additional projects and facilitate discussions on regulations and policy
4

Wellington Field Sumner County
Kansas
• Site at rural oil field operating since 1929
• 55 current operating wells, 20.7 MM bbls produced, 46k bbls annually
• Effective waterflood, ready for CO2-EOR
• Phase I -- Approximately 26,000 tons to be injected in the Mississippian dolomite reservoir for EOR (2015)
• Phase II -- Approximately 26,000 tons to be injected in the Arbuckle dolomite aquifer for CO2 sequestration (2016)
5

Progress to Date on Key Technical Issues
Injectivity and storage -- 2 basement tests, 490 m core, extensive log suite, multi-component 3D seismic, multiple well tests
– Flow-unit based injectivity & storage –> Petrel static model – Characterize complex, multi-scale pore system typical of carbonate reservoirs – Fracture/fault and geomechanical characterization based on core,
microimaging and spectral sonic logs, well tests, step-rate test, 3D seismic – Compositional simulations to maximize CO2-EOR oil recovery and predict fate
of CO2 in saline injection zone CMG dynamic model Caprock and internal baffle characterization
– Multi-faceted characterization using full core, imaging logs, seismic, lab tests – In situ geochemical studies including reactive transport modeling (S. Carrol,
LLNL via separate contract with NETL) EPA permit review & assessment of water quality of the USDW
– Received only Request for Additional Information (RAI), but no Notice of Deficiency (NOD) after EPA review of Class VI application
– Drilled three shallow MVA wells to evaluate USDW – Geochemical analysis and observations indicate non-potable, high TDS brine – Robust static and dyamic models indicate safe injection levels substantially
below regulation thresholds
6

Wellington Field
Mississippian Oil Reservoir & Arbuckle Saline Aquifer Showing Newly Drilled Wells and Wells with Modern Logs
N
Rush, KGS
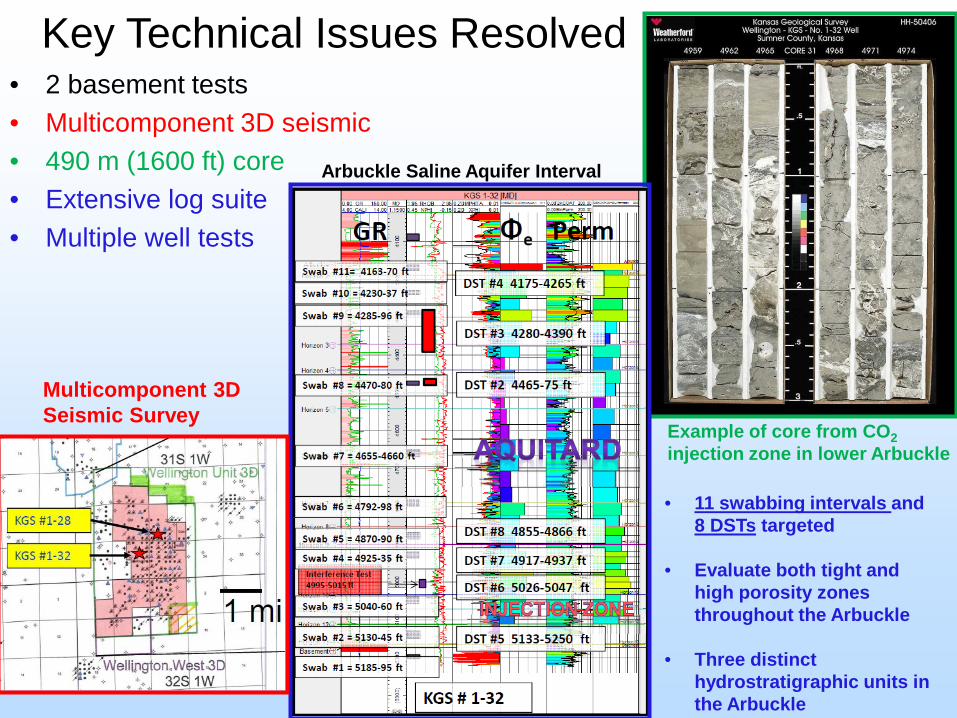
• 2 basement tests • Multicomponent 3D seismic • 490 m (1600 ft) core • Extensive log suite • Multiple well tests
Example of core from CO2 injection zone in lower Arbuckle
• 11 swabbing intervals and 8 DSTs targeted
• Evaluate both tight and
high porosity zones throughout the Arbuckle
• Three distinct hydrostratigraphic units in the Arbuckle
Multicomponent 3D Seismic Survey
Key Technical Issues Resolved
Arbuckle Saline Aquifer Interval
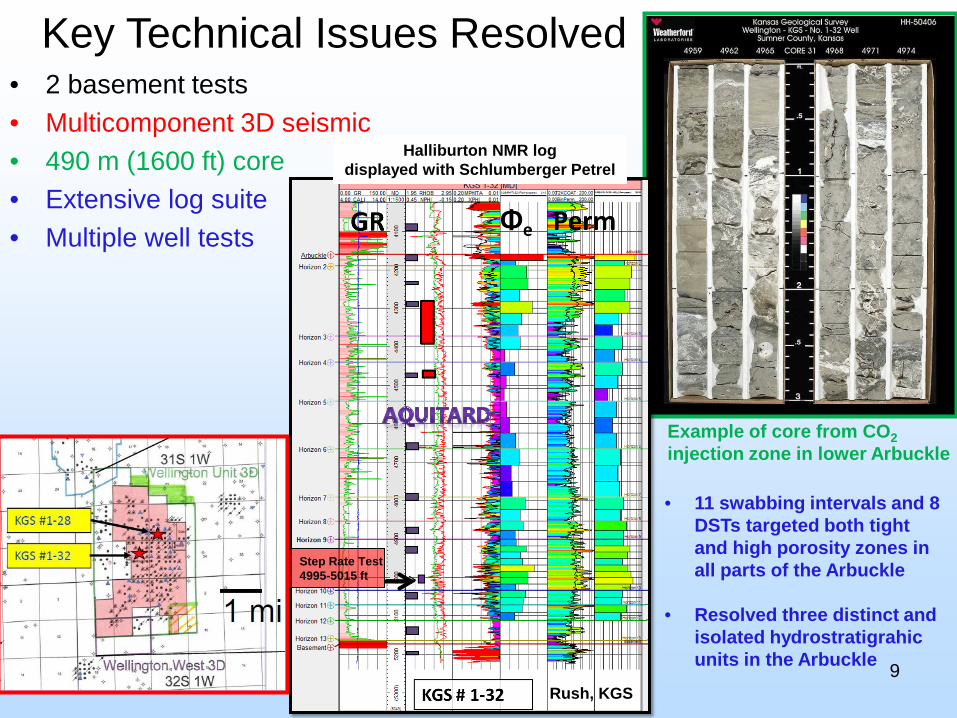
• 2 basement tests • Multicomponent 3D seismic • 490 m (1600 ft) core • Extensive log suite • Multiple well tests
9
Example of core from CO2 injection zone in lower Arbuckle
• 11 swabbing intervals and 8 DSTs targeted both tight and high porosity zones in all parts of the Arbuckle
• Resolved three distinct and isolated hydrostratigrahic units in the Arbuckle
Key Technical Issues Resolved
Step Rate Test 4995-5015 ft
Rush, KGS
Halliburton NMR log displayed with Schlumberger Petrel

Extensive, Integrated Characterization of the Arbuckle Saline Aquifer at Wellington Field
Depth vs. Ф & k, fracture features plot from 480 whole core samples Step-rate test pressure-time plot, #1-32 & #1-28, 1 km apart
Oxygen and hydrogen isotopes Lower and Upper Arbuckle at Wellington
are not in hydraulic communication
12 mi2 Wellington multi-component 3D
Scheffer, KGS/KU
Fazelalavi, KGS
Paragon Geophysical, Wichita
Weatherford
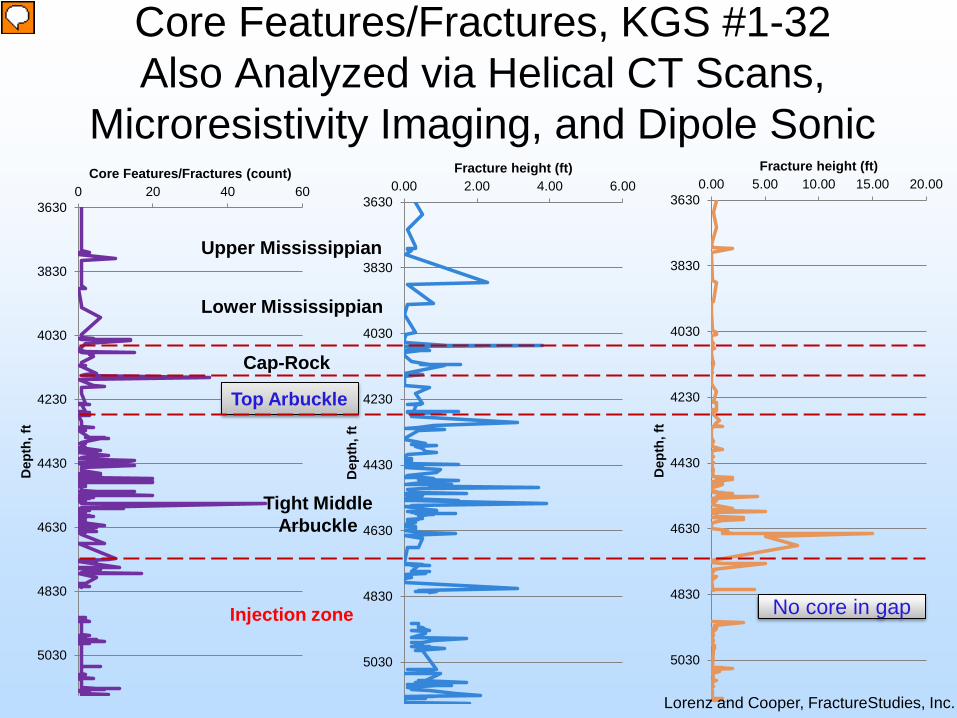
Core Features/Fractures, KGS #1-32 Also Analyzed via Helical CT Scans,
Microresistivity Imaging, and Dipole Sonic
3630
3830
4030
4230
4430
4630
4830
5030
0 20 40 60
Dep
th, f
t
Core Features/Fractures (count)
3630
3830
4030
4230
4430
4630
4830
5030
0.00 2.00 4.00 6.00
Dep
th, f
t
Fracture height (ft)
3630
3830
4030
4230
4430
4630
4830
5030
0.00 5.00 10.00 15.00 20.00
Dep
th, f
t
Fracture height (ft)
Top Arbuckle
Injection zone
Tight Middle Arbuckle
Cap-Rock
Lower Mississippian
Upper Mississippian
No core in gap
Lorenz and Cooper, FractureStudies, Inc.

12
Confining Zone Characterization
Entry Pressure Analysis
• Entry Pressure methodology applied to estimate sealing integrity of confining zone.
• High Entry Pressure
in confining zone suggesting high probability for CO2 confinement.
Using Halliburton NMR Log and Schlumberger Techlog software to display Fazelalavi, KGS

Progress to Date Key Technical Issues
• Milestone 1. - Submitted Class VI application, June 2014 – Vetted application with extensive interval review prior to submission to EPA – Response to EPA through 3/1/2015 – addressed questions, no USDW in AOR,
final discussions to reduce financial assurance low pressure and small lateral extent of supercritical CO2
• Task 5 -- Secured reliable CO2 industrial suppliers (Praxair, Linde), July 2014
• Milestone 2. Refined static and dynamic models of the Mississippian oil reservoir – Task 3 -- Obtained Class II to inject CO2 in Mississippian in February 2015 – Task 9 -- Drill Berexco Wellington KGS #2-32 in late March 2015 – Task 10 -- Re-pressurize reservoir to prepare for CO2 injection in April-May
• Milestone 3. Pre-injection MVA baseline recording – Obtaining data from a 15 seismometer array since Fall 2014 – Collecting data from cGPS and inSAR for processing since August 2014 – Drilling and sampling of three shallow monitoring wells indicate low yield and
high salinity (absence of USDW?)
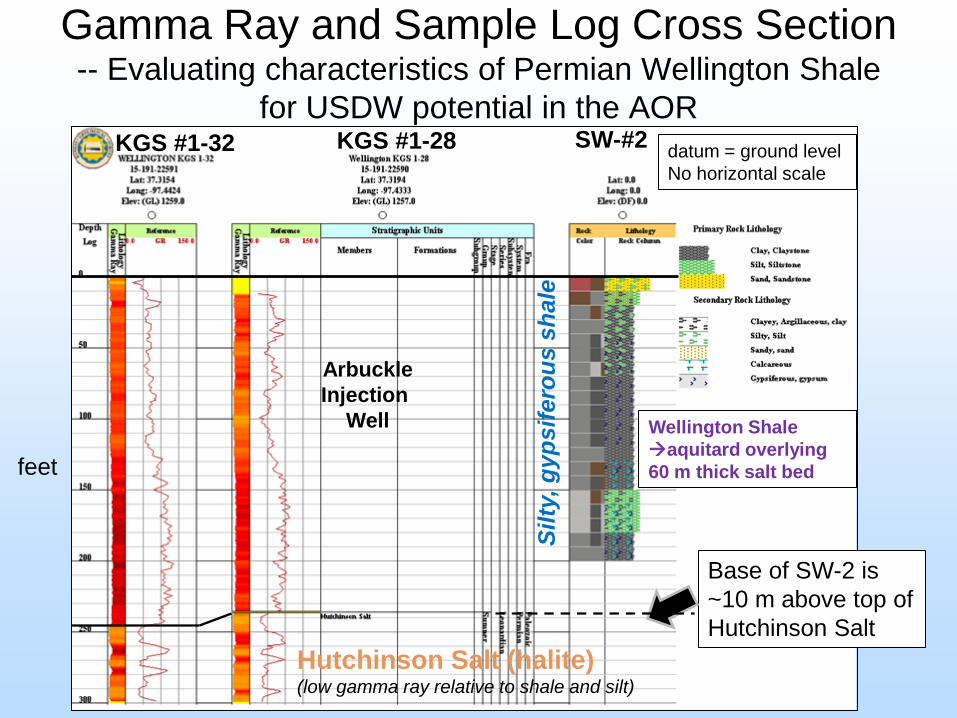
Base of SW-2 is ~10 m above top of Hutchinson Salt
Gamma Ray and Sample Log Cross Section -- Evaluating characteristics of Permian Wellington Shale
for USDW potential in the AOR
Hutchinson Salt (halite) (low gamma ray relative to shale and silt)
SW-#2 datum = ground level No horizontal scale
Silty
, gyp
sife
rous
sha
le
Arbuckle Injection
Well
feet
KGS #1-28 KGS #1-32
Wellington Shale aquitard overlying 60 m thick salt bed

Permeability Estimation in Well SW -1 Wellington Shale is an Aquitard
0. 10. 20. 30. 40. 50.0.
20.
40.
60.
80.
100.
Time (day)
Dis
plac
emen
t (ft)
Obs. WellsShallow Well#1
Aquifer ModelConfined
SolutionDougherty-Babu
ParametersT = 0.00394 ft2/dayS = 0.02369Kz/Kr = 0.1Sw = 0.r(w) = 0.25 ftr(c) = 0.125 ft
• Low permeability of 0.00005 ft/day ~0.01 md • An aquitard with properties equivalent to a caprock T. Birdie

Risk Assessment Freshwater aquifers in Kansas
Minor aquifers in Wellington Field area
High Plains/Ogallala Ozark
Glacial Drift
Alluvial
Dakota
Wellington
T. Birdie

Required Increase in Pore Pressure (psi) in Arbuckle for Migration of Brines from the Arbuckle into Freshwater Aquifers
Dakota
High Plains
Glacial Drift
• Need to ensure these pressures are not exceeded if improperly abandoned wells or communicative faults are present within zone of influence
T. Birdie
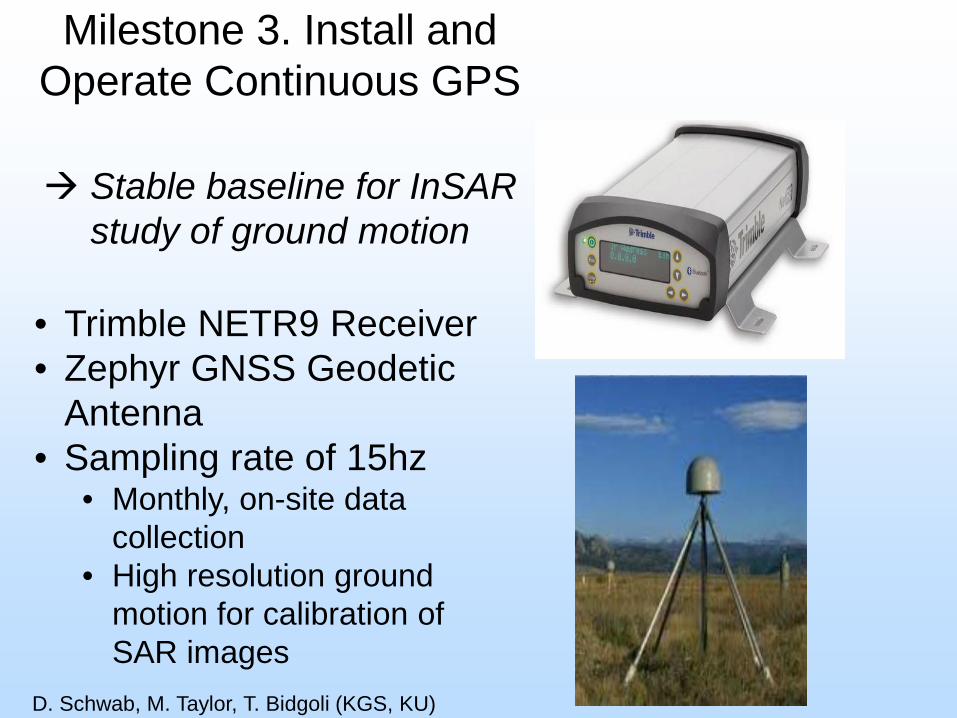
• Trimble NETR9 Receiver • Zephyr GNSS Geodetic
Antenna • Sampling rate of 15hz
• Monthly, on-site data collection
• High resolution ground motion for calibration of SAR images
Milestone 3. Install and Operate Continuous GPS
Stable baseline for InSAR
study of ground motion
D. Schwab, M. Taylor, T. Bidgoli (KGS, KU)

Raw cGPS Data (Recorded 9/14 2/15) a Steady Baseline for Calibration of InSAR
• Data processed at KU under the direction of Leigh Stearns using GIPSY-OASIS
• Noise is primarily due to tidal effects
B.
C. A.
X lateral motion
Y lateral motion Daily vertical motion
D. Schwab, M. Taylor, T. Bidgoli (KGS, KU)
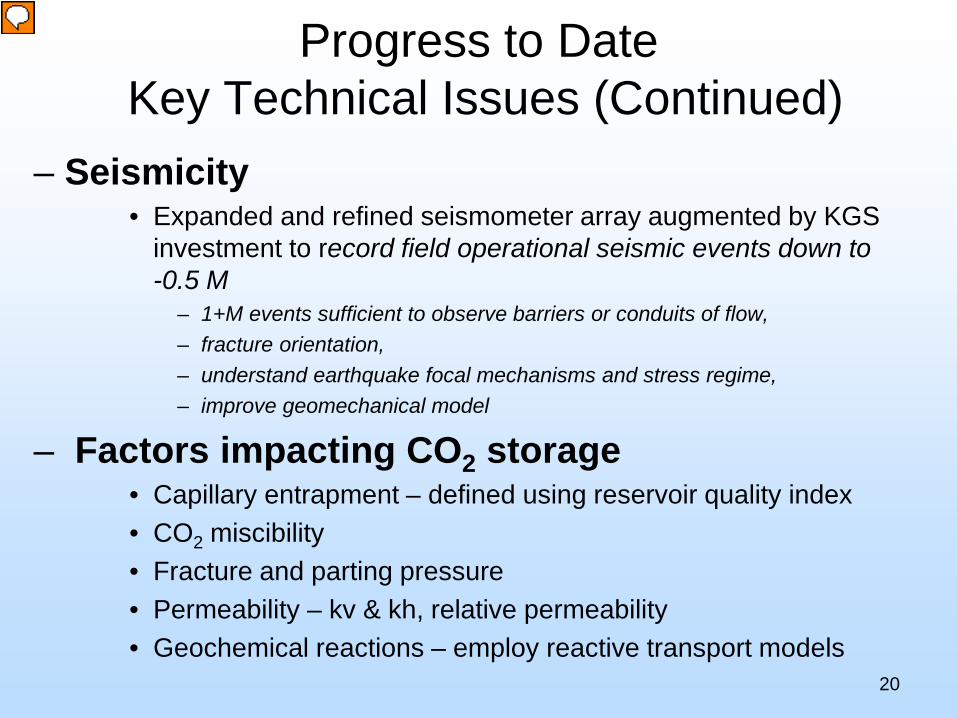
Progress to Date Key Technical Issues (Continued)
– Seismicity • Expanded and refined seismometer array augmented by KGS
investment to record field operational seismic events down to -0.5 M
– 1+M events sufficient to observe barriers or conduits of flow, – fracture orientation, – understand earthquake focal mechanisms and stress regime, – improve geomechanical model
– Factors impacting CO2 storage • Capillary entrapment – defined using reservoir quality index • CO2 miscibility • Fracture and parting pressure • Permeability – kv & kh, relative permeability • Geochemical reactions – employ reactive transport models
20

IRIS Seismometer Installation
21
Shelby Peterie, KGS Exploration Services, checking installation in July 2014
Housing setup for Sercel (Mark Products) L-22D-3D sensors, ~5 ft below surface to minimize surface noise; installed below frost line in bedrock
R. Miller and S. Peterie, KGS
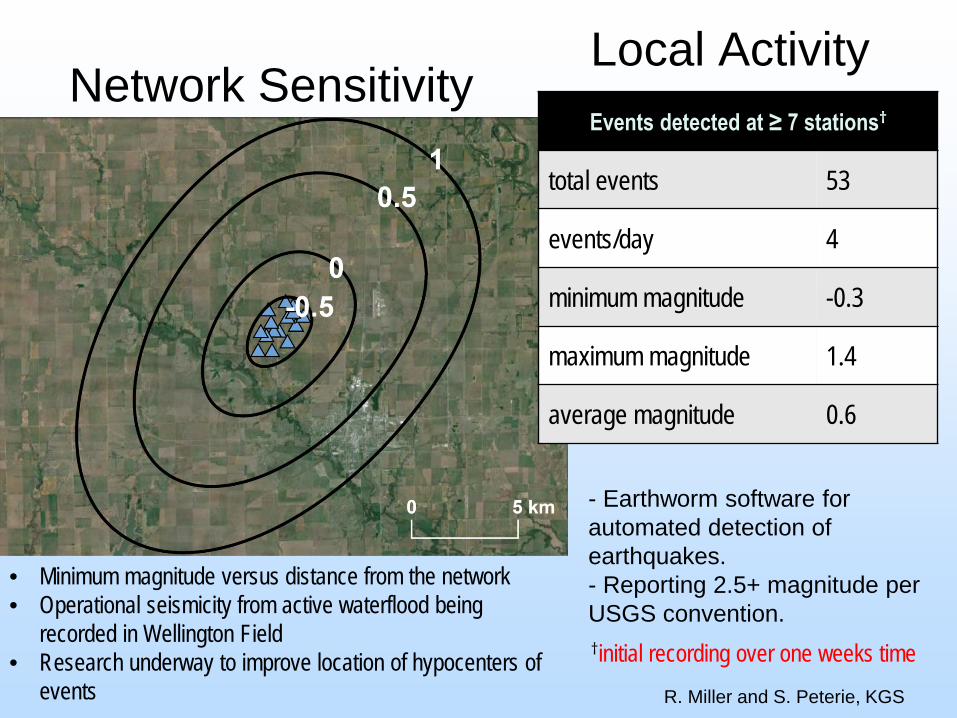
Network Sensitivity
• Minimum magnitude versus distance from the network • Operational seismicity from active waterflood being
recorded in Wellington Field • Research underway to improve location of hypocenters of
events
Events detected at ≥ 7 stations†
total events 53
events/day 4
minimum magnitude -0.3
maximum magnitude 1.4
average magnitude 0.6
Local Activity
- Earthworm software for automated detection of earthquakes. - Reporting 2.5+ magnitude per USGS convention. †initial recording over one weeks time
R. Miller and S. Peterie, KGS

Resolution of Hypocenters from IRIS Seismometer Array at Wellington
Refining location of operational seismicity -- Initially for the CO2-EOR injection to evaluate feasibility of methodology
Mississippian and Arbuckle injection zones have good impedance
impedance
CO2 injection
Triangulate hypocenters
Adapting Java toolset to manage, interpret, and display solutions on project maps (Victorine, KGS) Time, location (x,y,z) of event from seismometers
KGS #1-32 --Synthetic seismogram integrated with well logs and stratigraphy – Java app. (Victorine, KGS)

Future Plans and Expectations • Arbuckle model framework requested and shared with EPA • Geochemical analyses from USDW well and soil gas lysimeters for
baseline & risk mitigation • Pending supplemental funding from KU for KU Geology & KGS
– Install several downhole geophones in two T/A wells – Install three new 3-component broadband seismometers purchased by KGS
• Spud Mississippian injection well, Berexco Wellington KGS #2-32 – March (23-27) with Class II permit
• Repressurize and inject CO2 into Mississippian – April/May 2015 – 120 metric tons per day, up to 26,000 metric tons, ~ 7.5 months maximum
• Drill, complete, and start injection in #2-28 Arbuckle monitoring well – 6 mo. fabrication lead time CASSM, U-Tube, and Fiber Optic Array (pending
decision); 2 months equip, test, and prepare #1-28 for injection – Anticipate public comment period for Class VI permit in May-July, receive
permit in August-September – Inject ~April 2016 and finish by September 30, 2016 followed by 1 yr. PISC

Future Plans and Expectations (Continued)
• Complete installation and evaluate baseline monitoring data from Wellington Field
• Precise measurements of field response during injection with MVA technology - Sampling and analyzing produced fluids during Mississippian
injection - Actively monitor/process seismometer array data to track events - InSAR-cGPS ground motion
• Validation of models and predictions • Meeting with public in Wellington town hall meeting following
commencement of Mississippian injection.
25

Porosity Model (log/3D seismic) of the Siliceous Dolomite Reservoir
Upper Mississippian, Wellington Field
Milestone 3. Site Characterization of the Mississippian Reservoir for CO2-EOR
Porosity Inversion of the 3D Seismic Wellington Field Total Miss thickness ~400 ft including caprock
Pay <50 ft at top (warmer colors) Complex westward offlapping geometries of porous lithofacies -- Looking SW
Rush, KGS
0.02
0.25
KGS 1-32
KGS 1-28
Wellington KGS #2-32

Milestone 3. Site Characterization of the Mississippian
RQI = 0.0314 (K/Фe)0.5
Montalvo, KU & Barker, KSU
Fazelalavi, KGS
50 ft
Oil Pay
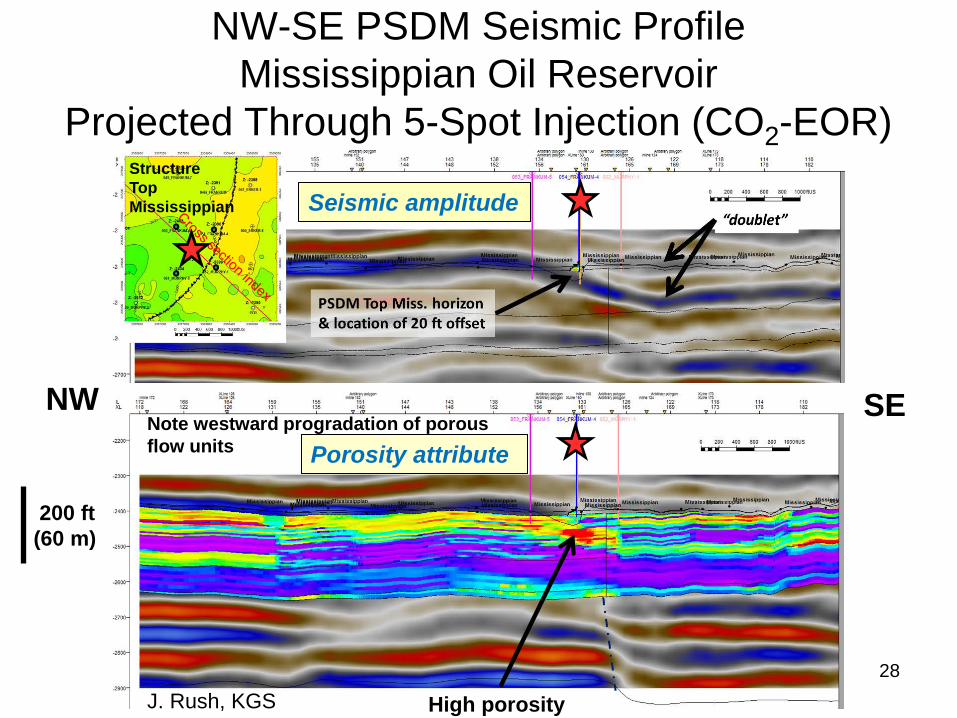
NW-SE PSDM Seismic Profile Mississippian Oil Reservoir
Projected Through 5-Spot Injection (CO2-EOR)
28
Note westward progradation of porous flow units
Structure Top Mississippian Seismic amplitude
Porosity attribute
NW SE
J. Rush, KGS
200 ft (60 m)
High porosity

A) 15- Seismic Array (Sept 2014) – Miller , ERS CGPS & InSAR (Sept 2014) & 3D seismic interp. – KU/KGS -Taylor, Schwab, & Tsoflias , Bidgoli
C) Drill Arbuckle Monitoring Well (Fall 2015) - Berexco
B) Drill Miss Injection Well (April 2015) & Inject CO2 (~May 2015) - Berexco, Praxair, Linde
D) Equip KGS 2-28 for MVA & KGS 1-28 for CO2 Injection (~October 2015 to March 2016) – LBNL (Daley, Freifeld), Berexco -- Distributed Fiber Optic Arrays , pending, EPRI (Trautz)
E) Begin Arbuckle CO2 Injection, ~ March 2016
F) Fluid sampling & analysis for Pre- and post-Injection Monitoring -- Berexco, KSU (Datta and Reese)
CGPS
G) Geomodeling, simulation, and testing (ongoing) -- KGS Energy Research (ERS)
H) Class VI permitting & reporting – Birdie, KGS

Arbuckle Geocellular Permeability Model
Rush and Holubnyak, KGS

Simulation of Arbuckle CO2 Injection Bottom Hole Pressure and
Free-Phase CO2 Maximum Plume
31
With Capillary pressure
Without Capillary pressure
With Capillary Pressure
Without Capillary Pressure
Holubnyak, KGS

Mississippian Reservoir Will Serve as Ideal Trap for Leaking -- is under-pressured and blanket-like in distribution
-- will act as to capture leaking CO2 if escape from the Arbuckle test -- if detect CO2, run high resolution 2D seismic to characterize leakage
Monitor Mississippian wells above CO2 plume in the Arbuckle
Porosity Fence Diagram
32
Rick Miller 2-D Seismic
Rush, KGS

Monitoring, Verification, and Accounting
• Innovative monitoring technologies: – cGPS recording since August 2014 – SAR data being collected ~20 day intervals – Observe small (-0.5 to 1 M) operational (waterflood) seismicity since Sept. 2014 – Prospect remains to secure Disttributed Fiber Optic Arrays with VSP for Arbuckle
monitoring 33
U-Tube Real time detection using continuous source cross-well seismic
InSAR in conjunction with cGPS
CASSM & Croswell Seismic Tomography
B. Freifeld, LBNL
T. Daley, LBNL
M. Taylor, KU

Perforations Packer
Sensor Source
Injection Well KGS 1-28
Monitor Well KGS 2-28
Arbuckle: Potential CO2 Plumes
~400 ft
Dept
h (ft
)
4900
5000
4800
5100
5200
CASSM Raypath
CASSM Design for Arbuckle Monitoring
T. Daley, LBNL
Crosswell Tomography will be used to evaluate imaging of CO2 by CASSM during the injection
35
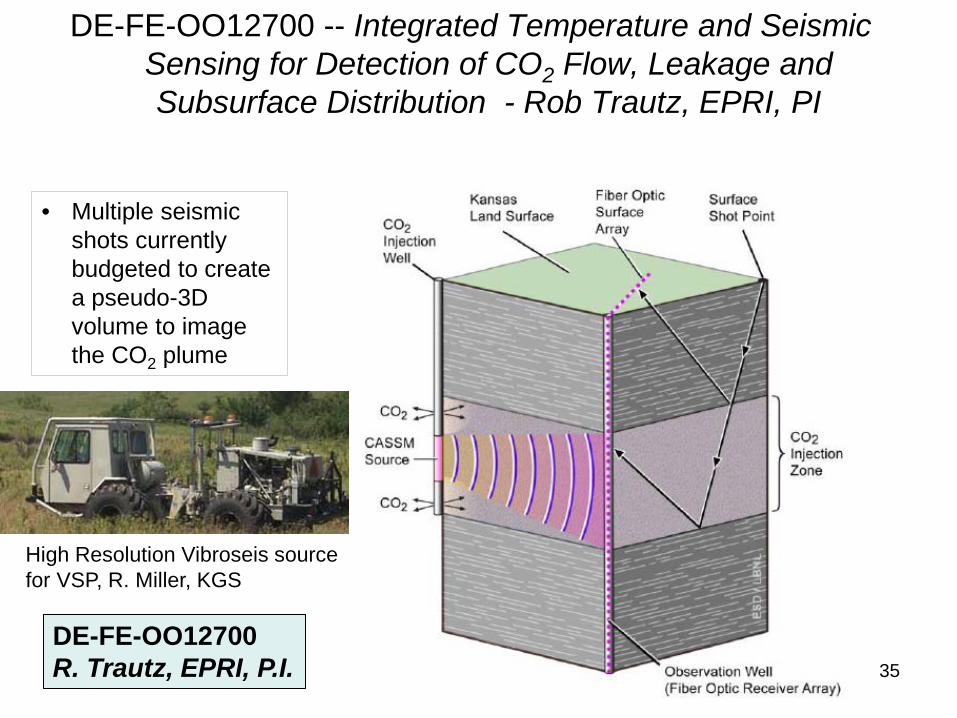
DE-FE-OO12700 -- Integrated Temperature and Seismic Sensing for Detection of CO2 Flow, Leakage and Subsurface Distribution - Rob Trautz, EPRI, PI
DE-FE-OO12700 R. Trautz, EPRI, P.I.
• Multiple seismic shots currently budgeted to create a pseudo-3D volume to image the CO2 plume
High Resolution Vibroseis source for VSP, R. Miller, KGS
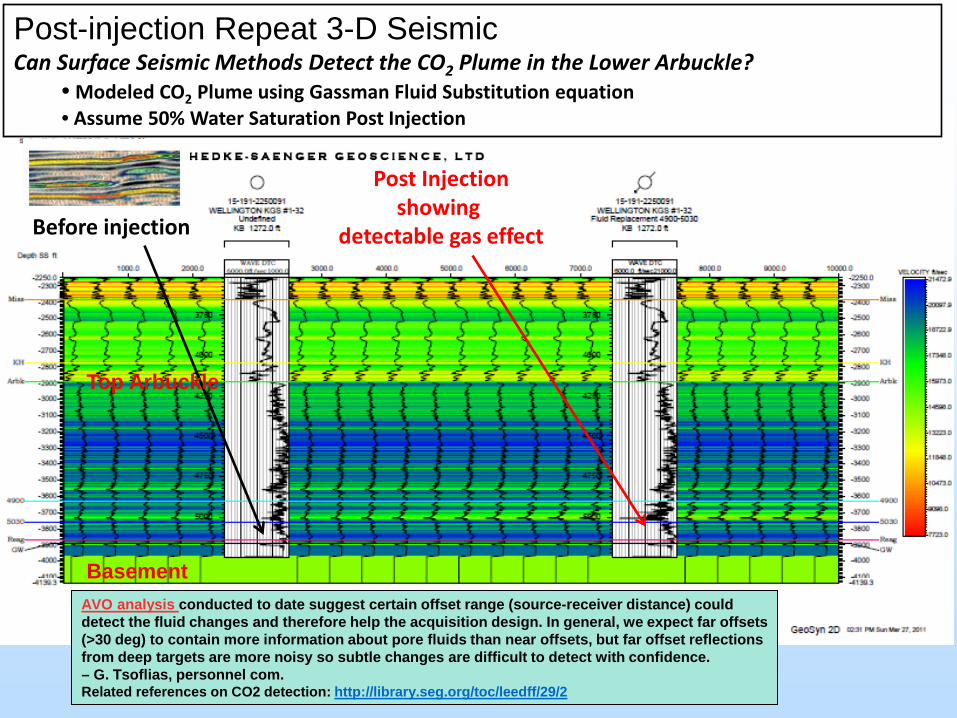
Post-injection Repeat 3-D Seismic Can Surface Seismic Methods Detect the CO2 Plume in the Lower Arbuckle?
• Modeled CO2 Plume using Gassman Fluid Substitution equation • Assume 50% Water Saturation Post Injection
Before injection
Post Injection showing
detectable gas effect
AVO analysis conducted to date suggest certain offset range (source-receiver distance) could detect the fluid changes and therefore help the acquisition design. In general, we expect far offsets (>30 deg) to contain more information about pore fluids than near offsets, but far offset reflections from deep targets are more noisy so subtle changes are difficult to detect with confidence. – G. Tsoflias, personnel com. Related references on CO2 detection: http://library.seg.org/toc/leedff/29/2
Top Arbuckle
Basement
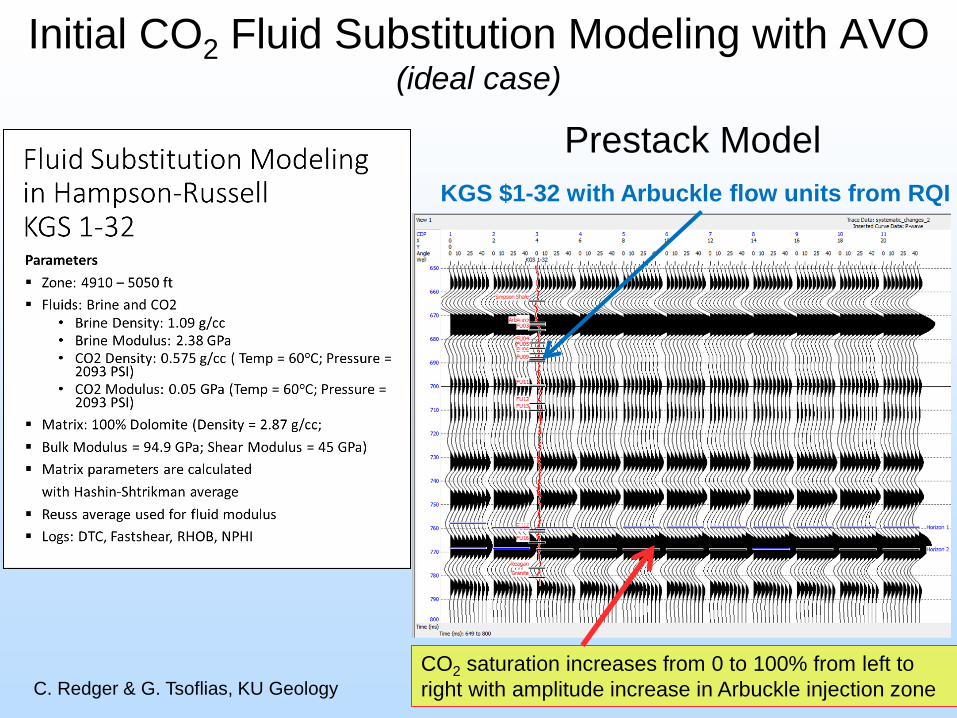
Initial CO2 Fluid Substitution Modeling with AVO (ideal case)
C. Redger & G. Tsoflias, KU Geology CO2 saturation increases from 0 to 100% from left to right with amplitude increase in Arbuckle injection zone
KGS $1-32 with Arbuckle flow units from RQI
Prestack Model
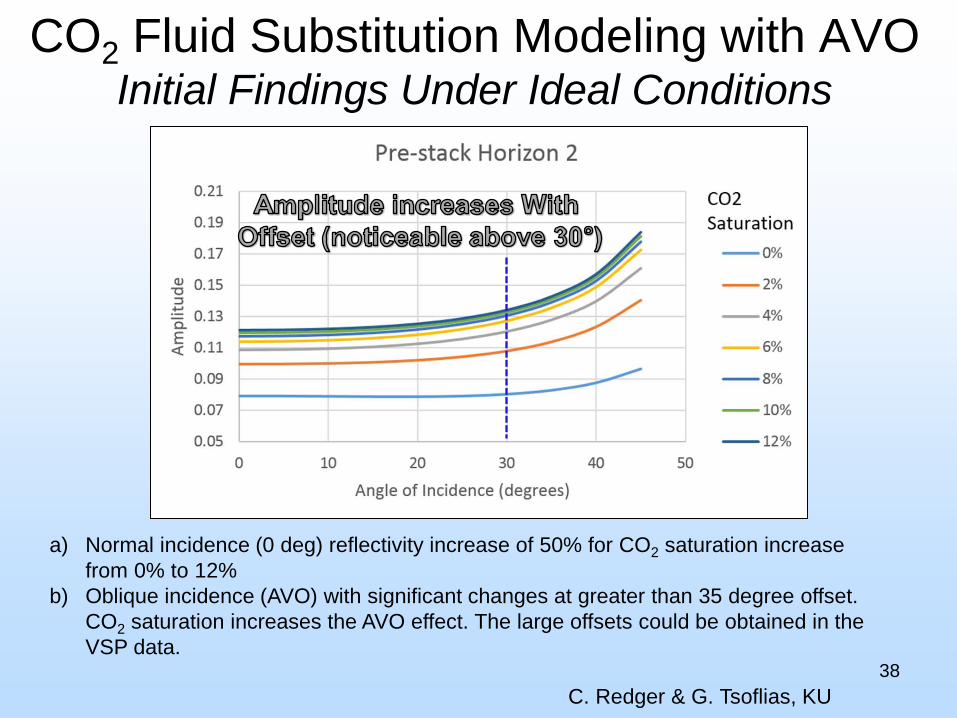
CO2 Fluid Substitution Modeling with AVO Initial Findings Under Ideal Conditions
38
a) Normal incidence (0 deg) reflectivity increase of 50% for CO2 saturation increase from 0% to 12%
b) Oblique incidence (AVO) with significant changes at greater than 35 degree offset. CO2 saturation increases the AVO effect. The large offsets could be obtained in the VSP data.
C. Redger & G. Tsoflias, KU

Project Wrap-Up Key Findings to Date o Increased relevancy of this project to the DOE portfolio.
• Potential to improve monitoring of CO2 plume using passive seismic
• Refined static and dynamic models calibration for commercial carbon storage in the Midcontinent
• Spectrum of seismic methods, core analyses, and petrophysics improving geomechanical models
o Drilling, coring, logging, testing Mississippian injection well (March 23-27) with Class II permit in hand
Lessons Learned o Improved methods and outcomes expected from test anticipated
using recent efforts to refine Petrel-CMG models
Outstanding Project Issues o Obtain Class VI in a timely manner
39
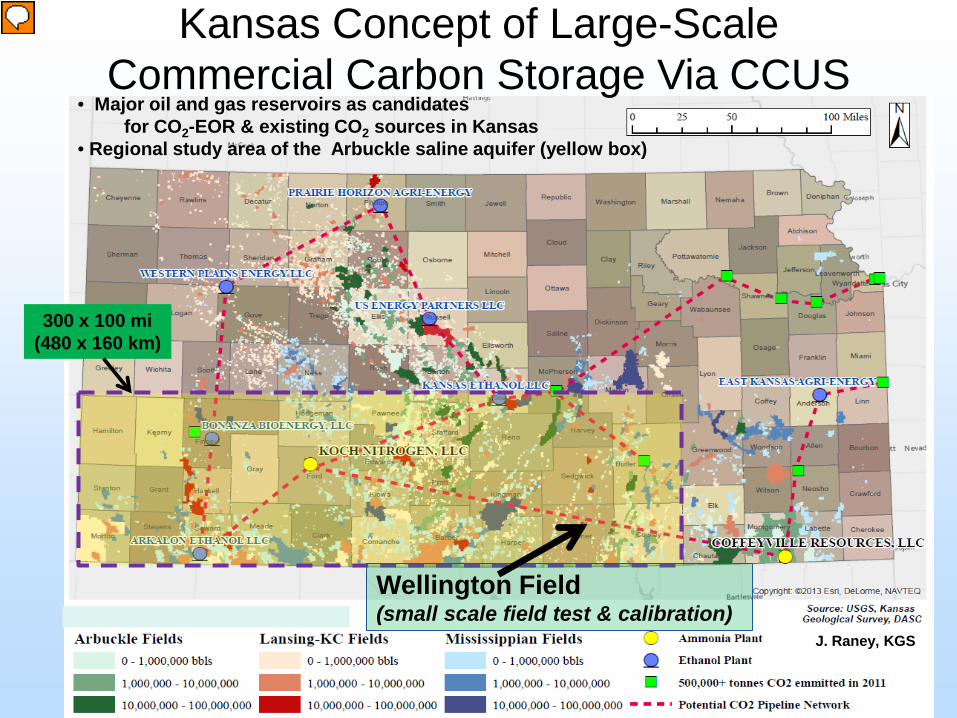
• Major oil and gas reservoirs as candidates for CO2-EOR & existing CO2 sources in Kansas • Regional study area of the Arbuckle saline aquifer (yellow box)
Wellington Field (small scale field test & calibration) Cumulative Oil Produced (2013)
Kansas Concept of Large-Scale Commercial Carbon Storage Via CCUS
J. Raney, KGS
300 x 100 mi (480 x 160 km)

Wellington Will Continue to Serve as a Calibration Site
Regional CO2 Storage Estimates in Southern Kansas Using Numerical Models from DE-FE-0002056
Mega Model 1 • 10 injection sites
including Wellington Field (Site #1)
• 50 years to 2065
• Max injection rate per well = 5,900 tonnes/day • Limiting Injection Pressure = 150 % of ambient pressure at site • CO2 Trapping Processes Simulated:
Structural, Hydrodynamic, Solubility, Residual, Mineral • Conservative initial model as a closed system
Mega Model 2 • 10 injection sites of
Mega Model 1 plus 103 uniformly distributed wells
• 150 years to 2165
Injection site
300 x 100 mi (480 x 160 km)

Initial Commercial scale CO2 Injection Model DE-FE-0002056
Significant CO2 storage can be managed at Wellington Field
0.05
0.9
16 flow units
Gasconade Dolomite to Gunter Ss. Interval (lower Arbuckle)
3 injectors
300 m
G. Williams, Gerlach, Fazelalavi, Doveton, Holubnayak

Conclusion • Unique integration of Wellington Field with the Kansas CO2
Initiative engaging the entire community – petroleum industry, CO2 suppliers, lawmakers, and regulators – Use of Wellington Field as the focal point for discussion – Use of Wellington Field as a calibration site and field demonstration to
engage petroleum industry on merits of CO2-EOR – Convey requirements for using and storing anthropogenic sources of
CO2 – Test best practices
• cost-effective characterization, modeling, and monitoring to aid in applying next-generation CO2-EOR methods
– Refine model realizations to optimize for commercial scaleCO2 sequestration
• Managing operation, reduce economic and environmental risks, compliance with regulations
– Couple the oil field and the underlying saline aquifer to increase the CO2 sequestration capacity 43

44

Example Time Lapse Crosswell Imaging of CO2 Plumes
Frio-I 2004 Cranfield 2010
Schematic Crosswell
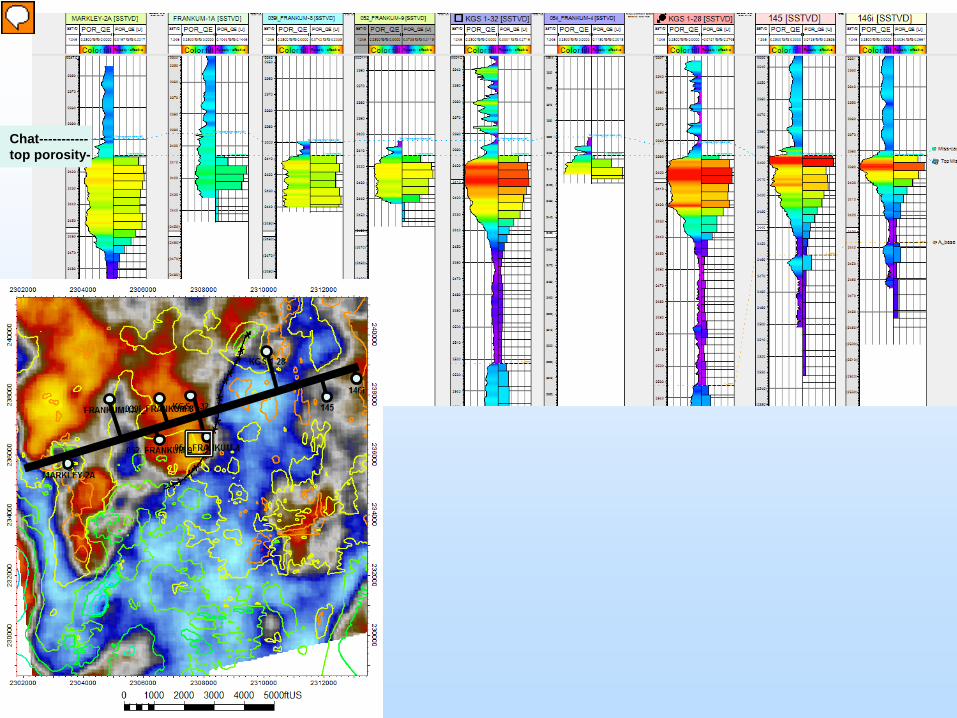
Chat----------- top porosity-

Drill Stem Test Confirms
Underpressured Mississippian
• Multiple DST’s conducted to characterize formations
47