tti large scale co2 sequestration options san joaquin valley december 7, 2007 presentation by...
TRANSCRIPT

TTILarge Scale CO2 Sequestration Options
San Joaquin Valley
December 7, 2007 Presentation
by
Terralog Technologies USA, Inc.
BP CO2 sequestration

TTILarge Scale CO2 Sequestration Options
San Joaquin Valley
Meeting Objectives:
• Present overview of project efforts to date on evaluation of CO2 sequestration candidates in the southern San Joaquin Valley
• Discuss and agree on go-forward workplan

TTILarge Scale CO2 Sequestration Options
San Joaquin Valley

TTILarge Scale CO2 Sequestration Options
San Joaquin Valley
Structure of the San Joaquin Valley.
NSB=Northern Sierran block; SSB=Southern Sierran block; NDH=northern Diablo homocline; WFB= westside fold belt; M-TS=Maricopa-Tejon subbasin
(Bartow, 1991)

TTILarge Scale CO2 Sequestration Options
San Joaquin Valley
(DOGGR, 1998)
TTILarge Scale CO2 Sequestration Options
San Joaquin Valley
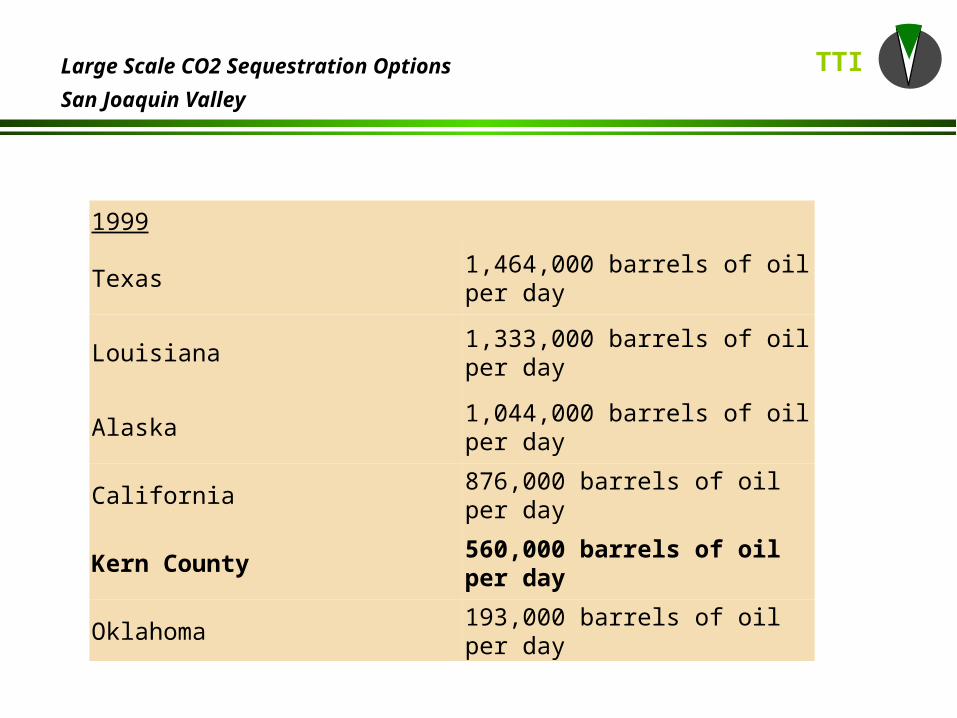
1999
Texas 1,464,000 barrels of oil per day
Louisiana 1,333,000 barrels of oil per day
Alaska 1,044,000 barrels of oil per day
California 876,000 barrels of oil per day
Kern County 560,000 barrels of oil per day
Oklahoma 193,000 barrels of oil per day

TTILarge Scale CO2 Sequestration Options
San Joaquin Valley
Oil fields in the southern San Joaquin Valley; studied fields in red

TTILarge Scale CO2 Sequestration Options
San Joaquin Valley
Midway-SunsetBelridge SouthKern RiverCymricElk HillsBuena VistaLost HillsMcKittrickMount PosoKern FrontColes Levee NorthEdisonBelridge NorthFruitvaleRio BravoGreeleyYowlumneRound Mountain
For each field:
•Geology•Wells and Development History•Production History and Data•Potential Capacity for CO2 Sequestration•Structure Contour Map•Cross Section•Composite Well Log and Stratigraphic Column

TTILarge Scale CO2 Sequestration Options
San Joaquin Valley
Example: Elk Hills
Structure contour map showing field structure of three anticlinesCross section showing fault separation between each anticline

TTILarge Scale CO2 Sequestration Options
San Joaquin Valley
Elk Hills stratigraphic column and well logLowermost production from Carneros Ss

TTILarge Scale CO2 Sequestration Options
San Joaquin Valley
ZONE FORMATION AGE DEPTH (ft) THICKNESS (ft)
Tulare Tulare Pleistocene 1,120 50
Mya Gas San Joaquin Pliocene 2,300 50
Scalez San Joaquin Pliocene 2,400 80
Mulinia Etchegoin Pliocene 2,700 55
Bittium Etchegoin Pliocene 2,850 20
Wilhelm Etchegoin Pliocene 3,000 60
Gusher Etchegoin Pliocene 3,200 60
Calitroleum Etchegoin Pliocene 3,200 22
Olig Reef Ridge Miocene 5,000 15
Stevens Monterey Miocene 5,900-7,100 150-400
Northwest Stevens
Monterey Miocene 8,900 200
Carneros Temblor Miocene 9,300 170
Agua Temblor Oligocene 9,500 480
Producing Zones in the Elk Hills field

TTILarge Scale CO2 Sequestration Options
San Joaquin Valley

TTILarge Scale CO2 Sequestration Options
San Joaquin Valley

TTILarge Scale CO2 Sequestration Options
San Joaquin Valley
Estimated Saline Aquifer Capacity

TTILarge Scale CO2 Sequestration Options
San Joaquin Valley
Workplan
Additional research on geology and evolution of San Joaquin Valley
Complete field reviews, including identification of sequestration targets and capacities
Summarize historical production
Describe geology and sequestration potential of saline aquifers
Compare potential sequestration candidates