geomechanics and co2 sequestration - stanford … · geomechanics and co2 sequestration...
TRANSCRIPT
Geomechanics and CO2 Sequestration
Investigators Mark D. Zoback, Professor, Geophysics Department; and Hannah Ross and Amie Lucier, Graduate Research Assistants, Geophysics Department Introduction This final report covers the activities in two areas:
I. Sequestration in Coal beds: The objective of this work is to examine the feasibility of CO2 sequestration in sub-bituminous coals of the Powder River Basin of Wyoming. Previous studies in the area that we carried out were related to identification of optimal wellbore completion methods for minimizing the amount of water produced during coal bed methane (CBM) production [Colmenares and Zoback, 2006]. In the work carried out in this study, we extended the data collection and geomechanical analyses previously conducted to evaluate the effectiveness of CO2 sequestration and enhanced CBM production (ECBM). A comprehensive series of reservoir simulations have been carried out that incorporate geostatistical variance of key hydrologic parameters. The results of these studies are summarized below.
II. Sequestration in Deep Saline Aquifers: We have participated in a collaborative
study of the feasibility of CO2 injection at the site of a coal burning electrical power plant in the Ohio River Valley. Within West Virginia, Ohio, Pennsylvania, Kentucky, Illinois and Indiana, annual CO2 emissions from power plants reached nearly 700 Mt in 2000. More than 98% of these emissions were from 185 coal burning power plants. According to the Environmental Protection Agency’s (EPA) eGRID2002 database, of these sources, 108 emitted more than 1 Mt CO2/yr with 22 emitting over 10 Mt CO2/yr [2002]. Locating CO2 sequestration sites close to large point sources such as these can significantly reduce the cost of sequestration by minimizing the associated transportation costs. Failure to find sites with acceptable storage capacity in the vicinity of these CO2 sources could make geological sequestration an impractical option for mitigating greenhouse gas emissions in a large portion of the United States. Using data collected at the Mountaineer site, we carried out a geomechanical analysis of a potential injection zone, the Rose Run Sandstone, and adjacent formations to assess the suitability of this site for long-term storage of anthropogenic CO2. Due to the low-to-moderate porosity and permeability of the potential injection zones, it is likely that hydraulic fracturing of the injection zones and/or horizontal injection wells will be necessary to increase injectivity and allow for more cost-effective sequestration. The methodology used for the Mountaineer site analysis can be applied to other saline formations in the region to assess the importance of geomechanical constraints on CO2 sequestration. We addressed two general aspects of similar formations in the region: their overall hydrogeologic attributes (porosity, permeability, formation thickness, etc.) to assess whether injection rates could be maintained at pressures consistent with geomechanical constraints while sequestering CO2 volumes emitted by typical power plants and whether the potential exists for induced seismicity if leakage and vertical migration of CO2 results in appreciable pressure
Geomechanics and CO2 Sequestration Zoback
GCEP Technical Report 2006 1
changes in the caprock. A paper on these results has now been published [Lucier et al., 2006b]. Results to Date I. Sequestration in Coal beds
Introduction
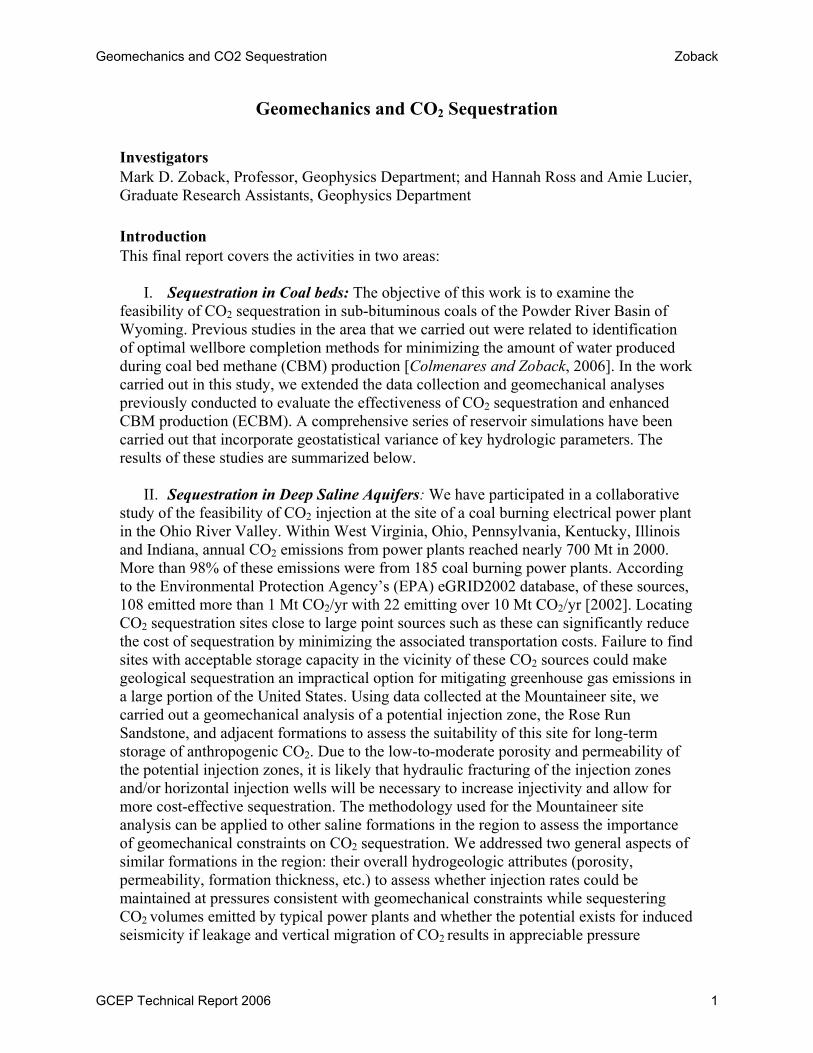
We examined the feasibility of sequestering CO2 in unmineable coalbeds by conducting a reservoir characterization study and fluid flow simulations on coalbeds in the Powder River Basin (PRB), Wyoming, USA. In particular, we were interested in modeling the effects of horizontal hydraulic fractures on CO2 injectivity and enhanced coalbed methane recovery (ECBM). Our study focused on the sub-bituminous Big George coal, part of the Wyodak-Anderson coal zone of the Tertiary Fort Union Formation. A 3D model of the Big George coal was constructed in an area of the PRB where the least principal stress is vertical, thereby guaranteeing horizontal hydraulic fractures. We built our model using well logs from coalbed methane (CBM) wells, and populated the model with permeability and porosity values using geostatistical techniques and history-matching.
109W
109W
108W
108W
107W
107W
106W
106W
105W
105W
104W
104W
103W
103W
42N 42N
43N 43N
44N 44N
45N 45N
46N 46N
47N 47N
0 50 100
km
Big HornM
ountains
Buffalo
Sheridan
Gillette
MontanaWyoming
Wyo
min
g
North Dakota
Sou
th D
akot
a
Black Hills
N
DouglasCasper
Powde
r Rive
r
Tong
ue R
iver
Existing CO2pipelinesPossible futureextension
To Shute Creek Plant
0 50 100
km
Coal Bed MethaneDevelopment Area
Study Area
Figure 1: Location map of the Powder River Basin, Wyoming, and our study area
(modified from [Colmenares and Zoback, 2006]). Our 3D model is located in the southern part of our study area.
Reservoir characterization
Geomechanics and CO2 Sequestration Zoback
GCEP Technical Report 2006 2
We have focused our study on the Big George coal, which is located in the central part of the PRB and is an amalgamation of five coalbeds. The average depth of the Big George coal is 335m and it varies in thickness from 14 to 62m. Water enhancement tests and gamma ray logs have been used to characterize the Big George coal in our study area. Gamma ray logs from CBM wells gave us the depth and thickness of the coal, and water enhancement tests were analyzed to determine the direction of hydraulic fracture propagation in the coal. Water enhancement tests are used by CBM operators in the PRB to connect the CBM wells to the natural coalbed fracture network. In some areas the hydraulic fractures are found to propagate vertically, whereas in others they grow horizontally [Colmenares and Zoback, 2006]. Knowing where vertical hydraulic fractures will form in the coal is especially important when choosing a site for CO2 sequestration because hydraulic fractures that propagate vertically may penetrate the overlying strata creating potential leakage conduits for CO2.
We constructed a 3D model of the Big George coal in an area of the PRB where the
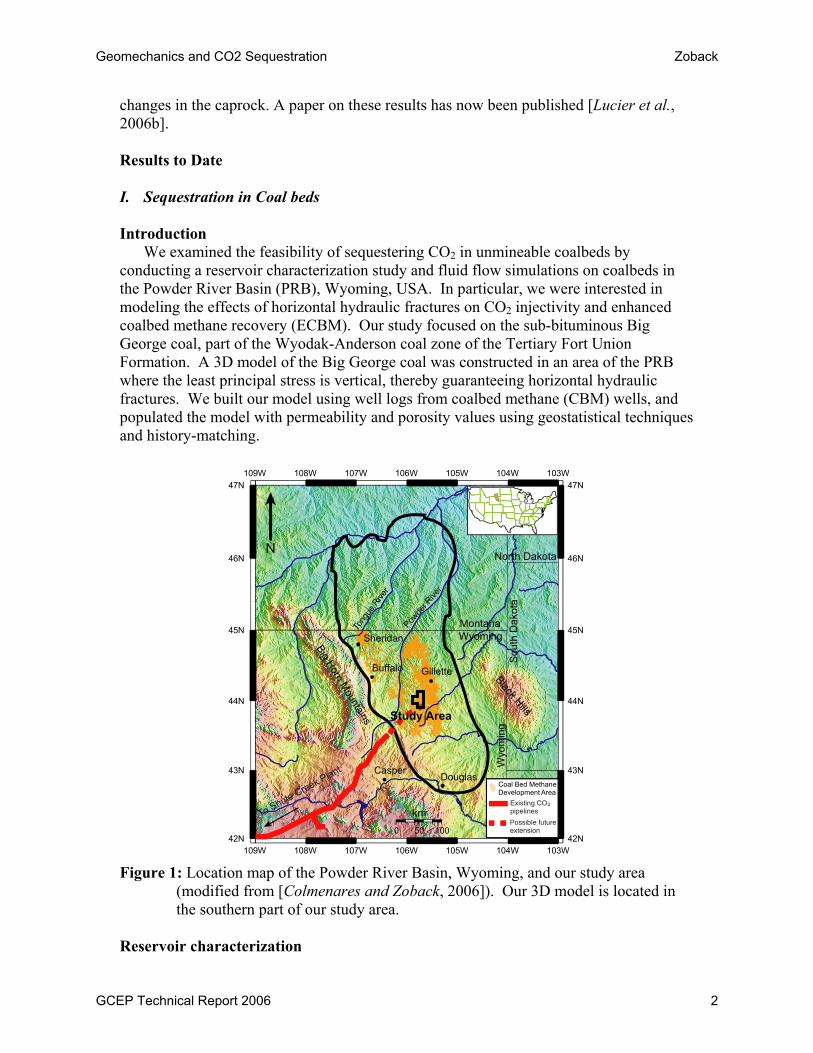
least principal stress (S3) is the overburden stress, which means that hydraulic fractures will propagate horizontally in this area. In our model the Big George coal is approximately 16m thick and ranges in depth (to the top) from 315-361m, with a slight dip to the west (Figure 2). The number of grid blocks in our model is 10332 (42x41x6). We used simple kriging and sequential Gaussian simulation to populate our 3D model with multiple cleat and matrix permeability and porosity realizations (to capture heterogeneity and anisotropy). Our initial permeability and porosity values came from the literature and we have further constrained the cleat permeability and porosity values through history-matching production data from the active CBM wells used to build our 3D model (Figure 2).
mD
16m
800m
N4440363127221814951
mD
4440363127221814951
1391261131008673604733207
mD
a) b) c)
Figure 2: a) Horizontal face cleat permeability. b) Horizontal butt cleat permeability. c) Vertical face cleat permeability. This figure shows our 3D model populated with cleat permeability values for realization 1. The heterogeneity and anisotropy in coal cleat permeability is modeled using geostatistical techniques. The horizontal face cleat permeability is higher than in the butt cleat or vertical directions.
Geomechanics and CO2 Sequestration Zoback
GCEP Technical Report 2006 3
Reservoir simulations Reservoir fluid flow simulations were run on a 5-spot well pattern (four producers
and one injection well) with 80-acre well spacing using the Computer Modelling Group’s ECBM simulator GEM. Our model and simulation input parameters are listed in Table 1. At present we have run all our simulations with pure CO2 gas injection, with and without coal matrix shrinkage and swelling, and with and without a horizontal hydraulic fracture placed at the base of the injection well. Coal matrix shrinkage and swelling is modeled by the [Palmer and Mansoori, 1996] equation included in GEM, and the horizontal hydraulic fracture is modeled as a square fracture with dimensions 60mx60m, porosity of 30%, and permeability of 1000mD. In addition, we used gas adsorption isotherms specific to PRB coal.
Our base case simulation is of CBM production for 11 years with no CO2 injection,
whereas subsequent simulations include CO2 injection after 5 years of CBM production, with a total simulation time of 11 years. To prevent accidental hydraulic fracturing of the coal near the injection well, we set the maximum value of the bottom hole pressure (BHP) to less than 6200 kPa, the fracture pressure in this area [Colmenares and Zoback, 2006]. Results and discussion
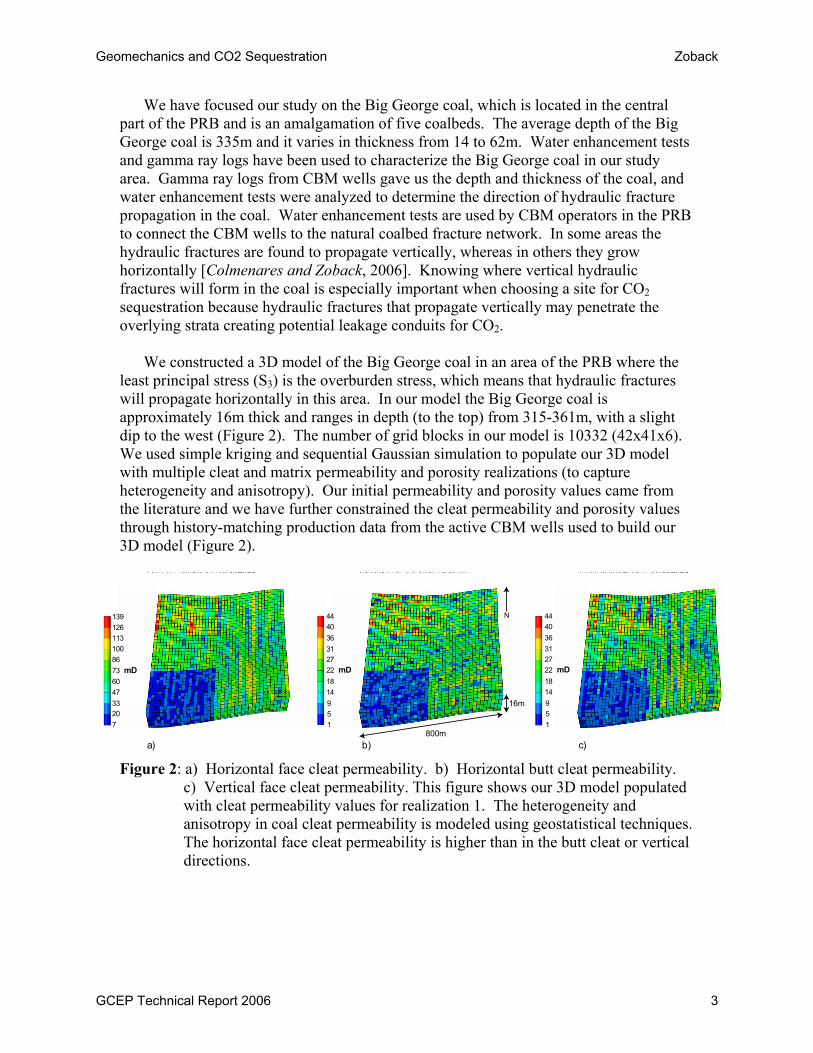
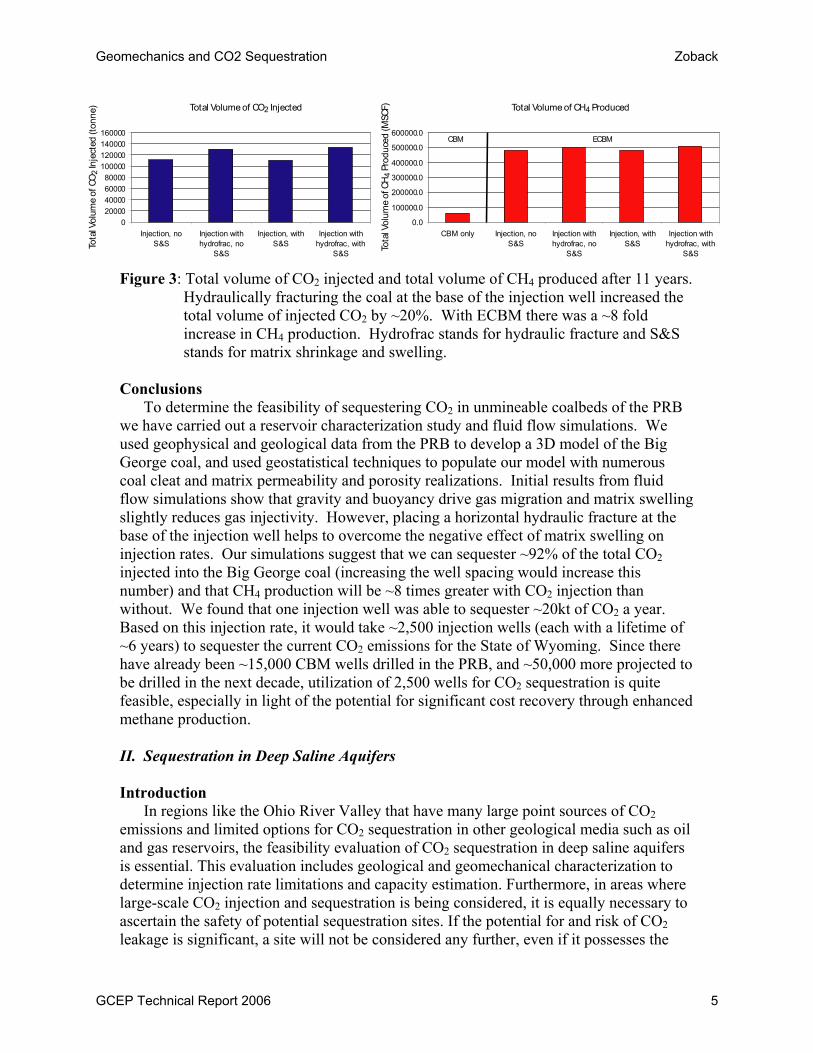
Our fluid flow simulations of CO2 injection into the Big George coal of the PRB show that gravity and buoyancy are the major driving forces behind gas flow within the coal. Gravity and buoyancy caused the gas to migrate upwards at first and then along the top of the coal, which reduced gas sweep efficiency and sequestration. We also find that coal matrix swelling results in a very slight reduction in CO2 injectivity, but that hydraulically fracturing the coal close to its base mitigates the negative effect of permeability reduction on injection rate (Figure 3). Placement of a hydraulic fracture at the base of the injection well increased the total volume of CO2 injected into the coal by ~20% (Figure 3). In regards to ECBM, CH4 production was ~8 times greater with CO2 injection than without (Figure 3).
In order to model the expected decrease in CO2 injectivity due to matrix swelling we
used a multiphase composite version of the Palmer and Mansoori equation (1996, 1998; GEM 2005). However, matrix swelling had very little effect on CO2 injectivity and CH4 production, as shown in Figure 3. We find that the high cleat compressibility for the Big George coal dominates the modified Palmer and Mansoori equation so that the linear elastic term (which incorporates cleat compressibility) is comparable in magnitude to the matrix shrinkage and swelling term (which incorporates matrix volume strain due to the adsorption and desorption of gases). Decreasing the cleat compressibility would mean that the matrix shrinkage and swelling term had a more significant effect on injectivity. The matrix shrinkage and swelling term would also be more important in the porosity and permeability calculations if higher matrix volume strains were used. We are currently running laboratory experiments on coal samples from the PRB to characterize coal matrix shrinkage and swelling.
Geomechanics and CO2 Sequestration Zoback
GCEP Technical Report 2006 4
020000400006000080000
100000120000140000160000
Injection, noS&S
Injection withhydrofrac, no
S&S
Injection, withS&S
Injection withhydrofrac, with
S&S
0.0
100000.0
200000.0
300000.0
400000.0
500000.0
600000.0
CBM only Injection, noS&S
Injection withhydrofrac, no
S&S
Injection, withS&S
Injection withhydrofrac, with
S&S
Total Volume of CH4 Produced
Tota
lVol
ume
of C
H4
Prod
uced
(MSC
F)Total Volume of CO2 InjectedTo
talV
olum
e of
CO2 I
njec
ted
(tonn
e)
ECBMCBM
Figure 3: Total volume of CO2 injected and total volume of CH4 produced after 11 years.
Hydraulically fracturing the coal at the base of the injection well increased the total volume of injected CO2 by ~20%. With ECBM there was a ~8 fold increase in CH4 production. Hydrofrac stands for hydraulic fracture and S&S stands for matrix shrinkage and swelling.
Conclusions
To determine the feasibility of sequestering CO2 in unmineable coalbeds of the PRB we have carried out a reservoir characterization study and fluid flow simulations. We used geophysical and geological data from the PRB to develop a 3D model of the Big George coal, and used geostatistical techniques to populate our model with numerous coal cleat and matrix permeability and porosity realizations. Initial results from fluid flow simulations show that gravity and buoyancy drive gas migration and matrix swelling slightly reduces gas injectivity. However, placing a horizontal hydraulic fracture at the base of the injection well helps to overcome the negative effect of matrix swelling on injection rates. Our simulations suggest that we can sequester ~92% of the total CO2 injected into the Big George coal (increasing the well spacing would increase this number) and that CH4 production will be ~8 times greater with CO2 injection than without. We found that one injection well was able to sequester ~20kt of CO2 a year. Based on this injection rate, it would take ~2,500 injection wells (each with a lifetime of ~6 years) to sequester the current CO2 emissions for the State of Wyoming. Since there have already been ~15,000 CBM wells drilled in the PRB, and ~50,000 more projected to be drilled in the next decade, utilization of 2,500 wells for CO2 sequestration is quite feasible, especially in light of the potential for significant cost recovery through enhanced methane production. II. Sequestration in Deep Saline Aquifers Introduction
In regions like the Ohio River Valley that have many large point sources of CO2 emissions and limited options for CO2 sequestration in other geological media such as oil and gas reservoirs, the feasibility evaluation of CO2 sequestration in deep saline aquifers is essential. This evaluation includes geological and geomechanical characterization to determine injection rate limitations and capacity estimation. Furthermore, in areas where large-scale CO2 injection and sequestration is being considered, it is equally necessary to ascertain the safety of potential sequestration sites. If the potential for and risk of CO2 leakage is significant, a site will not be considered any further, even if it possesses the
Geomechanics and CO2 Sequestration Zoback
GCEP Technical Report 2006 5
needed capacity. The Ohio River Valley CO2 Storage Project seeks to evaluate the potential of deep saline aquifer sequestration at the site of one of the large point sources discussed above [Gupta et al., 2005b]. Specifically, this project focuses on a site-specific characterization of the subsurface beneath American Electric Power’s 1.3 GW Mountaineer Power Plant in New Haven, West Virginia, which emitted 7.2 Mt of CO2 in 2000. The evaluation of this site is based on data collected from a seismic reflection survey, geophysical logging and well testing of a 2800 m (below ground surface), vertical borehole (AEP#1 well), and regional field data. During the site characterization, several potential injection zones were identified based on permeability and porosity logs. This study focuses on the Ordovician Rose Run Sandstone from about 2355 m to 2388 m. The permeability, determined from a nuclear magnetic resonance (NMR) transverse relaxation log, is < 1 mD for much of the borehole but occasionally peaks to about 50-100 mD in potential injection zones. The zones identified as possible injection sites have average effective porosities ranging from 4.1% to 6.9%. Many possible injection zones in deep sedimentary basins such as the Appalachian Basin appear to have low-to-moderate permeability and porosity, reinforcing the need to understand the geomechanical influences that will guide any reservoir stimulation techniques. The results of this study not only have implications for injection at the Mountaineer site, but also for deep aquifer settings throughout the Ohio River Valley region. Building a Geomechanical Model
The geomechanical analysis quantifies the magnitude and orientation of the three principal stresses and can be used to determine whether the stress state affects the viability of the Rose Run Sandstone to act as an effective CO2 storage unit. The three principal stresses are the vertical stress (Sv) and the minimum and maximum horizontal stresses (Shmin and SHmax). Our methodology for determining the in situ stress state followed [Zoback et al., 2003b] and is outlined in detail by [Lucier et al., 2006a]. Once the state of stress was determined, we used the information to obtain safe injection pressures, investigate stimulation methods, model a hydraulic fracture to enhance injectivity, compare feasibility of similar injection sites, and investigate the possibilities of induced seismicity at the site.
We briefly present the results of that analysis as it pertains to the modeling and flow
simulation work that is presented below. We calculated the magnitude of Sv by integrating the density log over the depth of the well and determined the Sv gradient with depth to be 26.2 MPa/km. We then used the drilling induced borehole failures observed in an electrical image log to determine the orientation of the two horizontal stresses, Shmin and SHmax. Drilling-induced tensile fractures were observed between 2150 and 2775 m, a zone that includes the Rose Run Sandstone, and they indicate an SHmax azimuth of N47˚E ± 13˚.This SHmax azimuth is consistent with the regional stress orientations found in the World Stress Map database [Zoback and Zoback, 1989]. We used minifrac tests to measure the pore pressure and magnitude of the least principal stress, S3, which in this case is Shmin. Six open-hole minifrac tests were completed in and around the Rose Run Sandstone. The pre-injection formation pressure measured during the minifrac tests indicate a Pp gradient of 11 MPa/km, which is slightly higher than freshwater hydrostatic due to the density of the high salinity brine [Gupta et al., 2005a]. The Shmin magnitude
Geomechanics and CO2 Sequestration Zoback
GCEP Technical Report 2006 6
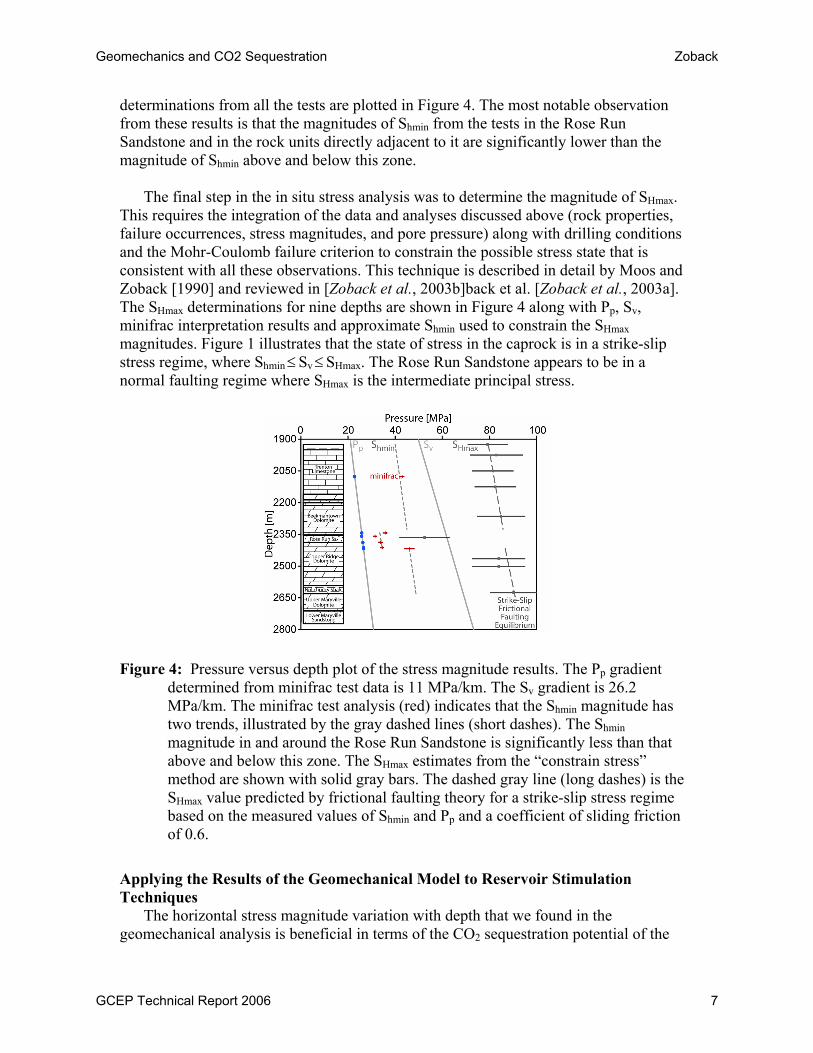
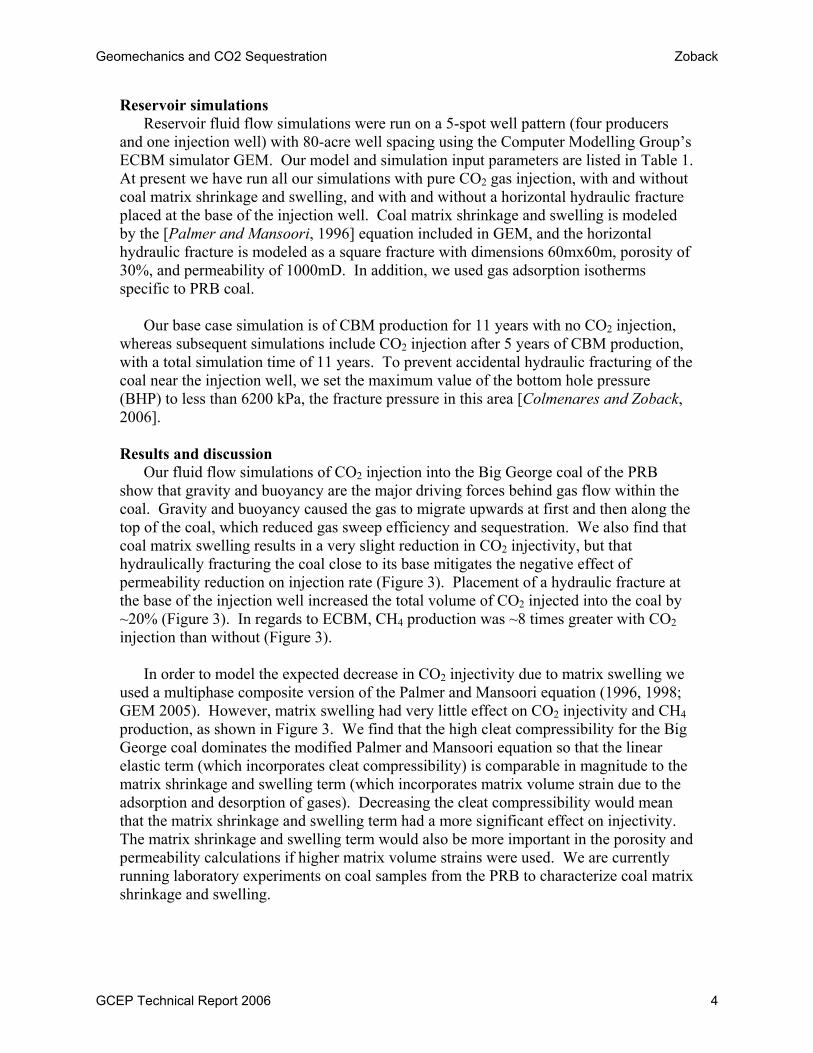
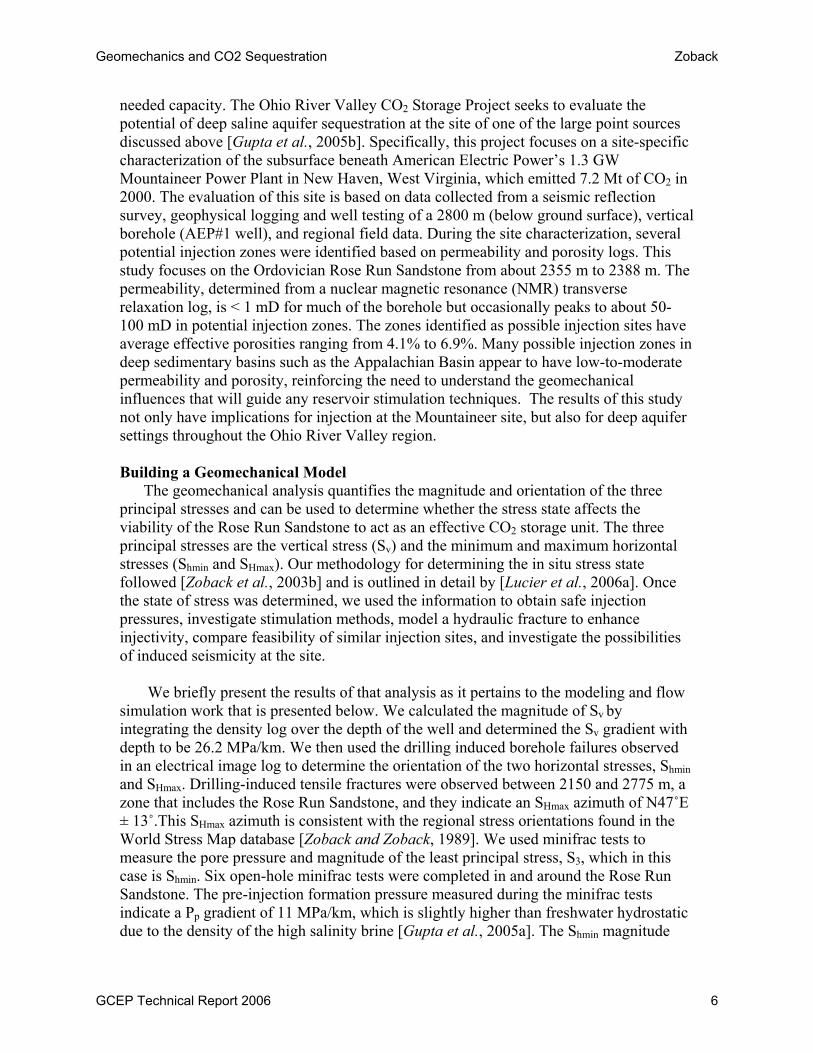
determinations from all the tests are plotted in Figure 4. The most notable observation from these results is that the magnitudes of Shmin from the tests in the Rose Run Sandstone and in the rock units directly adjacent to it are significantly lower than the magnitude of Shmin above and below this zone.
The final step in the in situ stress analysis was to determine the magnitude of SHmax.
This requires the integration of the data and analyses discussed above (rock properties, failure occurrences, stress magnitudes, and pore pressure) along with drilling conditions and the Mohr-Coulomb failure criterion to constrain the possible stress state that is consistent with all these observations. This technique is described in detail by Moos and Zoback [1990] and reviewed in [Zoback et al., 2003b]back et al. [Zoback et al., 2003a]. The SHmax determinations for nine depths are shown in Figure 4 along with Pp, Sv, minifrac interpretation results and approximate Shmin used to constrain the SHmax magnitudes. Figure 1 illustrates that the state of stress in the caprock is in a strike-slip stress regime, where Shmin≤Sv≤SHmax. The Rose Run Sandstone appears to be in a normal faulting regime where SHmax is the intermediate principal stress.
Figure 4: Pressure versus depth plot of the stress magnitude results. The Pp gradient determined from minifrac test data is 11 MPa/km. The Sv gradient is 26.2 MPa/km. The minifrac test analysis (red) indicates that the Shmin magnitude has two trends, illustrated by the gray dashed lines (short dashes). The Shmin magnitude in and around the Rose Run Sandstone is significantly less than that above and below this zone. The SHmax estimates from the “constrain stress” method are shown with solid gray bars. The dashed gray line (long dashes) is the SHmax value predicted by frictional faulting theory for a strike-slip stress regime based on the measured values of Shmin and Pp and a coefficient of sliding friction of 0.6.
Applying the Results of the Geomechanical Model to Reservoir Stimulation Techniques
The horizontal stress magnitude variation with depth that we found in the geomechanical analysis is beneficial in terms of the CO2 sequestration potential of the
Geomechanics and CO2 Sequestration Zoback
GCEP Technical Report 2006 7
Rose Run Sandstone. Due to the much lower value of the least principal stress in and around the Rose Run Sandstone relative to that of the surrounding formations, it would be possible to fracture this zone during injection without compromising the integrity of the caprock. In the observed stress state, a vertical hydraulic fracture would propagate in the Rose Run Sandstone in a NE-SW direction away from the wellbore when the pressure exceeds 31-34 MPa. As long as the pressure in the wellbore remains less than the Shmin value for the caprock (42-44 MPa), the hydraulic fracture will be contained to the zone of lower horizontal compressive stress leaving the caprock intact. The injectivity-related benefits of hydraulically fracturing the injection zone are investigated below. Another option for increasing CO2 injection is drilling horizontal wells that extend several hundred meters in the injection zone. In order to evaluate well stability, we determined the necessary rock strength, Co, needed to completely prevent breakouts from occurring for various well orientations given the stress state determined in the geomechanical analysis. For simplicity, the analysis assumes balanced drilling, in which the drilling mud weight equals the formation pore pressure. One case we examined is a horizontal well in the direction of SHmax, the same direction that a hydraulic fracture would form. In the strike-slip stress state of the caprock, we find that as the well deviation in the SHmax direction increases from vertical to horizontal, the well stabilizes. In fact, a vertical well, like AEP#1, has the least stable well trajectory for this state of stress. However, we observed very few breakouts in the caprock below 2180 m in this well suggesting a deviated well will remain stable in the caprock. In the normal state of stress of the Rose Run Sandstone, a horizontal well would require a higher Co to prevent breakouts than a vertical well. However, breakouts will only occur if Co is less than 100 MPa. The Co measured in the Rose Run Sandstone is more than 200 MPa. Based on this analysis, it is clear that directional drilling can be effectively implemented at the Mountaineer site. Increased injectivity from hydraulic fracture stimulation
We use geostatistical aquifer modeling and fluid flow simulations to investigate the benefits of hydraulic fracturing for increasing injectivity. The details of the reservoir modeling and fluid flow simulations are outlined in Lucier et al. [Lucier et al., 2006a]. It should also be noted that more detailed compositional reservoir modeling of the Mountaineer site to develop injection and monitoring system designs is being conducted separately.
Given the information collected during the Mountaineer site characterization, we built
two 3D reservoir models. The two models used in this study represent the Rose Run Sandstone: (1) in its native state and (2) with a stimulated hydraulic fracture. The geometries of the models are the same and were based on a regional data set for the Rose Run Sandstone, which indicates a N10ºE strike, a gentle 2-3º dip to the SE and a thickness varying between 15 and 50 m, with an average of 30 m. The 6 km by 6 km grid is centered around the AEP#1 well and has 150 x 172 x 5 grid block. To introduce a hydraulic fracture, we oriented the grid blocks in a direction consistent with that of SHmax, N45ºE. The width of the grid blocks along the center diagonal is about 1 m in the NW-SE direction, to approximate the presence of a hydraulic fracture. We used the sequential Gaussian simulation (SGS) method to produce equally probable realizations of porosity
Geomechanics and CO2 Sequestration Zoback
GCEP Technical Report 2006 8
and permeability that reflect the data variability and spatial statistics. In the hydraulic fracture model, we assigned a porosity of 30% and permeability of 1000 mD to the thin grid blocks extending 300 m from the center grid block (AEP#1 well location) along the N45ºE axis. We believe that these property values approximate those associated with the fracture and surrounding formation after fracturing.
We used a commercial black-oil simulator which, despite some limitations, has
sufficient capabilities for the purpose of this study. The simulator input is based on the characterization and geomechanical analysis of the Mountaineer site. The injection rate is controlled by a bottom hole pressure (BHP) constraint: 32 MPa for the non-fractured model and 42 MPa for the hydraulically fractured model, based on the Rose Run and caprock fracture pressures respectively. Producer wells along the boundary of the grid enforce a constant 11 MPa/km pressure gradient boundary condition that is consistent with the open system of the reservoir. The ratio of vertical to horizontal permeability is 0.5. The fluid properties used in the simulations are detailed in [Lucier et al., 2006].
We created five realizations for each of two permeability distributions that differed by
an order of magnitude to reflect the uncertainty in the upscaled permeability values for a total of ten realizations of each model (lower bound permeability ranges from 1 to 15 md, upper bound permeability ranges from 10 to 150 md). The porosity of these models ranges from 1-12 % with a mean of 4%.We simulated CO2 injection for 30 years on all 20 realizations. The hydraulic fracture increases injection rate and cumulative injection by 3.5-4 times that of the non-fractured realizations. In the lower bound permeability realizations, the injection rate remains nearly constant after 5 years, at about 8 kt CO2/yr (without fracture) and 31 kt CO2/yr (with fracture). A small amount of variability is apparent between realizations. In the upper bound permeability realizations, the cumulative injection after 30 years is about 12 times higher than that of the associated lower bound permeability realizations, for example 0.24 Mt CO2 versus 3.5 Mt CO2 (without fracture) and 1 Mt CO2 versus 11.6 Mt CO2 (with fracture). In the fractured model – upper bound permeability cases, the CO2 reaches the lateral extent of the 6 km x 6 km area. These results suggest that every 10-12 Mt of CO2 injected requires about a 6 km x 6 km area given the thickness and porosity of the Rose Run Sandstone. Applications to saline reservoirs with similar characteristics
We did a preliminary investigation of generalized sequestration potential in the Ohio River Valley region building from the models and simulations made for the hydraulic fracturestudy. We investigated the difference in injectivity and lateral extent of the CO2 plume in reservoirs of similar in situ conditions as the Mountaineer site, but with varying permeability, porosity and thickness. Using one realization of each of the two models from the hydraulic fracture study (the realizations with the median value for cumulative injection), we systematically altered the permeability, porosity and thickness creating 27 realizations for both the non-fractured and fractured and models. The realizations have 3 permeability ranges: the base permeability used in the hydraulic fracture study (1-15 md), 5x permeability (5-75 md), and the 10x permeability which served as the upper bound permeability in the hydraulic fracture study (10-150 md). For each permeability range, we created models of 3 different average thicknesses: 30 m (corresponding to the
Geomechanics and CO2 Sequestration Zoback
GCEP Technical Report 2006 9
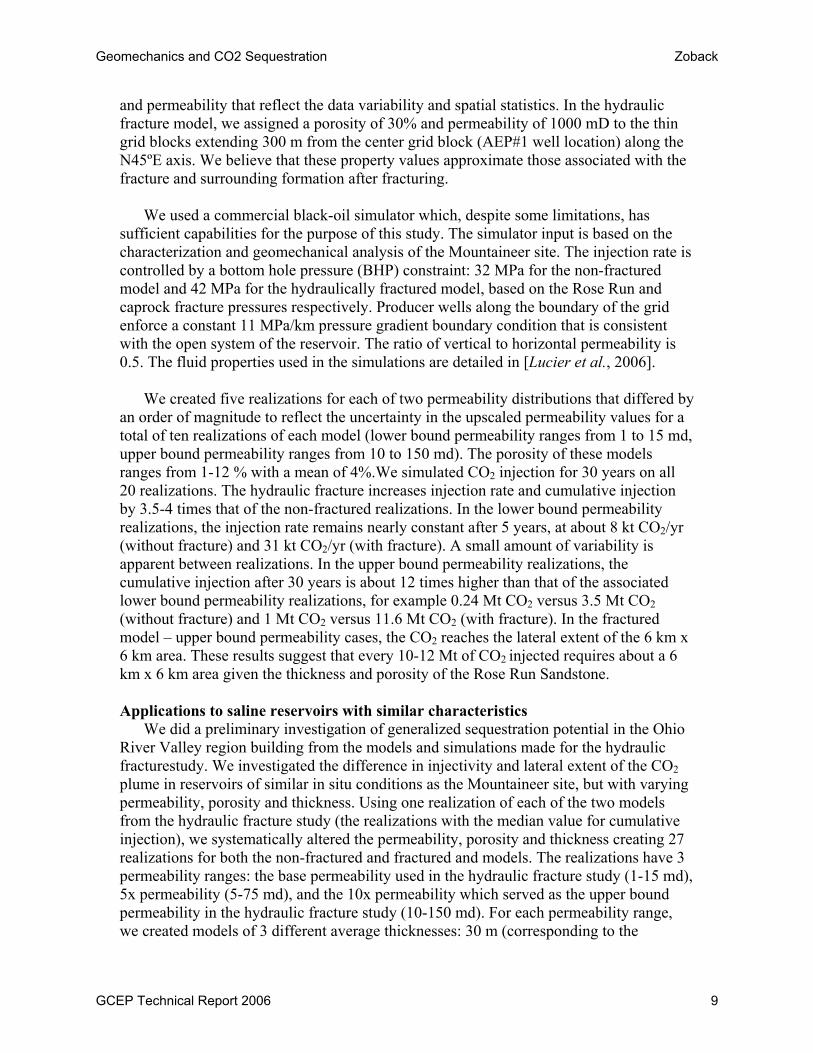
Mountaineer site), 60 m, and 90 m. For each permeability and thickness combination, we made 3 different porosity realizations: mean porosity of 4% (corresponding to the Mountaineer site), 8% and 12%. We used the same simulation input parameters as in the hydraulic fracture study. The results of the cumulative CO2 injection and spatial extent of the CO2 plume after 30 years for the hydraulic fracture model are shown in Figure 5.
Figure 5: Comparison of CO2 injection simulation results for the hydraulic fracture model with varying combinations of permeability, thickness, and porosity characteristics. The left plot shows cumulative injection after 30 years and the right plot shows map area of the CO2 plume at the top of the reservoir.
To generalize these results, a reservoir’s injectivity is most sensitive to its average permeability and then to its thickness. A higher porosity for a given permeability/thickness combination results in less injection, but better utilizes the later extent of the reservoir. On average, doubling the permeability leads to a 2.2 times increase in injection while doubling the thickness results in a 1.9 times increase in injection. Doubling the porosity resulted in 0.94 times the injection, but nearly cuts in half the lateral extent of the CO2 plume. Simulation studies such as these can be used in first order comparisons of different potential sequestration sites.
The results of the geomechanical analysis can also be applied to investigating
injection induced seismicity, which occurs when the increase in pore pressure caused by fluid injection decreases the effective normal stress resolved on optimally-oriented, pre-existing faults such that it induces fault slip. Injection induced seismicity typically occurs during fluid injection in regions with frictional equilibrium stress states, and it is well documented at a number of sites in tectonically stable intraplate areas [Pine et al., 1983; Raleigh et al., 1976; Zoback and Harjes, 1997]. This is consistent with the theory that much of the intraplate continental crust is likely in frictional equilibrium [Townend and Zoback, 2000]. Evidence of a frictional equilibrium stress state at the Mountaineer site includes (1) the drilling-induced tensile fractures observed along much of the borehole from 2150 to 2775 m and (2) the observation that the SHmax values determined at the Mountaineer site are consistent with the SHmax magnitudes predicted by Coulomb frictional-failure theory assuming that the coefficient of friction on pre-existing faults is 0.6. Our modeling shows that if we assume a coefficient of sliding friction along the optimal fault planes of 0.6, reactivation could occur with very small increases in Pp. In the caprock stress state nearly vertical strike-slip faults striking north-northeast or east-
Geomechanics and CO2 Sequestration Zoback
GCEP Technical Report 2006 10
northeast are optimally oriented for reactivation. If the coefficient of sliding friction along the faults is higher (e.g., 0.8) or the existing faults are not as optimally oriented, a larger Pp perturbation is necessary to induce slip. Although injection induced seismicity has not been an issue in the past for the Appalachian Basin, previous injection has not been at the same scale as CO2 sequestration, making this an important issue to consider in future site studies. Given that small Pp perturbations have the potential to induce seismicity in the given stress state, and the lack of laterally extensive data for identifying faults in the area, monitoring of microseismic events will be an important technique for any sequestration project in the region. Conclusions
Understanding the geomechanical constraints in deep saline reservoirs being considered as CO2 sequestration sites is necessary for developing the appropriate injection strategy, estimating injection potential, comparing different sites in a similar geological setting, and quantifying injection induced seismicity risk. At the Mountaineer site and others similar to it, stimulation techniques like hydraulic fractures and horizontal wells can be used to address limitations in injectivity due to low-to-moderate permeability and thickness. However, even with these techniques it is unlikely that all of the CO2 emitted in the Ohio River Valley region can be efficiently sequestered in reservoirs similar to those modeled in this study. If emissions in the region continue at the current rate, over the next 30 years 21 Gt of CO2 will be released. Sequestering this much CO2 would require 700 ideal sites (as defined in this study: 10-150 md permeability, 90 m thickness, 12% mean porosity, 300 m half length hydraulic fracture), 2,100 moderate sites (as defined in this study: 5-75 md permeability, 60 m thickness, 8% mean porosity, 300 m half length hydraulic fracture), or 21,000 poor quality sites (as defined in this study: 1-15 md permeability, 30 m thickness, 4% mean porosity, 300 m half length hydraulic fracture). To quantify sequestration potential in the Ohio River Valley region, it will be imperative to characterize as many reservoirs as possible, define the range of acceptable injection rates and capacity limits for any potential site, and filter out unacceptable sites. Once this is completed, we can get a first order estimate of the scale at which CO2 sequestration in the Ohio River Valley region can realistically proceed. References Cited Colmenares, L.B., and M.D. Zoback, Hydraulic fracturing and wellbore completion of
coalbed methane (CBM) wells in the Powder River Basin, Wyoming: Implications for water and gas production, American Association of Petroleum Geologists Bulletin, in press, 2006.
EPA, eGRID2002: Emissions and Generation Resource Integrated Database, <http://www.epa.gov/cleanenergy/egrid/download.htm>, Nov. 15, 2004, 2002.
Gupta, N., P. Jagucki, D. Meggyesy, F. Spane, T.S. Ramakrishnan, and A. Boyd, Determining carbon sequestration reservoir potential at a site-specific location within the Ohio River Valley Region, in Proceedings of the 7th International Greenhouse Gas Control Technologies (GHGT-7), edited by C.F. Gilboy, pp. 9, Elsevier, Vancouver, Canada, 2005a.
Gupta, N., P. Jagucki, D. Meggyesy, F. Spane, T.S. Ramakrishnan, and A. Boyd, Determining carbon sequestration reservoir potential at a site-specific location
Geomechanics and CO2 Sequestration Zoback
GCEP Technical Report 2006 11
within the Ohio River Valley Region, in Proceedings of the 7th International Greenhouse Gas Control Technologies (GHGT-7), edited by D.W.K. E.S. Rubin, and C.F. Gilboy, Elsevier, Vancouver, Canada, 2005b.
Lucier, A., M.D. Zoback, N. Gupta, and T.S. Ramakrishnan, Geomechanical aspects of CO2 sequestration in a deep saline reservoir in the Ohio River Valley region, in Environmental Geosciences, pp. 1-19, 2006.
Moos, D., and M.D. Zoback, Utilization of Observations of Well Bore Failure to Constrain the Orientation and Magnitude of Crustal Stresses - Application to Continental, Deep-Sea Drilling Project, and Ocean Drilling Program Boreholes, in Journal of Geophysical Research-Solid Earth and Planets, pp. 9305-9325, 1990.
Palmer, I., and J. Mansoori, How Permeability Depends on Stress and Pore Pressure in coalbeds: A New Model. SPE 36737, 1996.
Pine, R.J., P. Ledingham, and C.M. Merrifield, Insitu Stress Measurement in the Carnmenellis Granite .2. Hydrofracture Tests at Rosemanowes Quarry to Depths of 2000-M, in International Journal of Rock Mechanics and Mining Sciences, pp. 63-72, 1983.
Raleigh, C.B., J.H. Healy, and J.D. Bredehoeft, Experiment in Earthquake Control at Rangely, Colorado, in Science, pp. 1230-1237, 1976.
Townend, J., and M.D. Zoback, How faulting keeps the crust strong, in Geology, pp. 399-402, 2000.
Zoback, M.D., C.A. Barton, M. Brudy, D.A. Castillo, T. Finkbeiner, B.R. Grollimund, D.B. Moos, P. Peska, C.D. Ward, and D.J. Wiprut, Determination of stress orientation and magnitude in deep wells, in International Journal of Rock Mechanics and Mining Sciences, pp. 1049-1076, 2003.
Zoback, M.D., and H.P. Harjes, Injection-induced earthquakes and crustal stress at 9 km depth at the KTB deep drilling site, Germany, in Journal of Geophysical Research-Solid Earth, pp. 18477-18491, 1997.
Zoback, M.D., and M.L. Zoback, Tectonic stress field of the conterminous United States, in Geological Society of America Memoirs, pp. 523-539, 1989.
Publications 1. Lucier, AM, MD Zoback, N Gupta, TS Ramakrishnan, 2005, Geomechanical
applications to the characterization of a deep saline reservoir for CO2 sequestration, Eos Trans. AGU, 86(52), Fall Meet. Suppl., Abstract GC13A-1207.
2. Lucier, A., M.D. Zoback, N. Gupta, and T.S. Ramakrishnan, 2006, Geomechanical aspects of CO2 sequestration in a deep saline reservoir in the Ohio River Valley region, in Environmental Geosciences, pp. 1-19.
3. Ross, H. E. and Zoback, M. D., 2005, Feasibility of Enhanced Coalbed Methane Recovery Through CO2 Sequestration, Powder River Basin, Wyoming: Reservoir Characterization and Flow Simulation: Eos Trans. AGU, 86(52), Fall Meet. Suppl., Abstract B33A-1013.
Contacts Mark Zoback: [email protected] Hannah Ross: [email protected] Amie Lucier: [email protected]
Geomechanics and CO2 Sequestration Zoback
GCEP Technical Report 2006 12