singapore company focus cromwell european reit · cromwell is a global real estate manager with...
TRANSCRIPT

ed: JS / sa: JS, PY
BUY (Initiating Coverage)
Last Traded Price ( 6 Apr 2018): EUR0.59 (STI : 3,442.50)
Price Target 12-mth: EUR0.63 (7% upside and 7% yield)
Potential Catalyst: Delivering or exceeding IPO forecast and/or
acquisitions Analyst Mervin SONG, CFA +65 6682 3715 [email protected] Derek TAN +65 6682 3716 [email protected]
Price Relative
Forecasts and Valuation FY Dec (EURm) 2017F* 2018F 2019F
Gross Revenue 10.1 123 127 Net Property Inc 6.39 80.6 84.5 Total Return (1.8) 59.4 61.7 Distribution Inc 5.34 68.0 70.2 EPU (Euro cts.) (0.1) 3.76 3.88 EPU Gth (%) nm nm 3 DPU (Euro cts.) 0.34 4.30 4.40 DPU Gth (%) nm nm 2 NAV per shr (Euro cts.) 53.2 52.8 52.4 PE (X) nm 15.7 15.2 Distribution Yield (%) 0.6 7.3 7.5 P/NAV (x) 1.1 1.1 1.1 Aggregate Leverage (%) 36.9 37.8 38.7 ROAE (%) (0.4) 7.1 7.4 Other Broker Recs: B: 2 S: 0 H: 1
ICB Industry : Financials ICB Sector: Real Estate Investment Trusts Principal Business: Cromwell European REIT (CERT) is the first Singapore-listed REIT with a Pan-European portfolio and offers a unique blend of properties spread across different countries and asset classes. Its initial portfolio comprises 74 properties
* For period 1 December to 31 December 2017
Source of all dataon this page: Company, DBS Bank, Bloomberg Finance L.P.
At A Glance
Issued Capital (m shrs) 1573.99
Mkt. Cap (EURm/US$m) 928.7 / 1,143.5
Major Shareholders (%)
Cromwell Singapore Holdings Pte 34.3
Tang Gordon 13.9
Cerberus Singapore 11.7
Free Float (%) 21.7
3m Avg. Daily Val (US$m) 0.60
DBS Group Research . Equity
10 Apr 2018
Singapore Company Focus
Cromwell European REIT Bloomberg: CERT SP | Reuters: N/A Refer to important disclosures at the end of this report
European delights
• First Pan-European S-REIT with a diversified portfolio of
office, light industrial/logistics and retail properties
• Exposure to improving European economy and real estate
markets with high yield spreads
• Sponsored by an experienced real estate manager with an
extensive European real estate platform
• Initiating coverage with BUY and EUR0.63 TP
Leveraged to an improving Europe. Cromwell European Real Estate
Investment Trust (CERT) is the first Singapore-listed REIT with a
diversified Pan-European portfolio that offers investors a unique
opportunity to invest in office, light industrial/logistics and retail
assets located in Denmark, Germany, France, Italy, and the
Netherlands. With an improving European economy, CERT is well
positioned to benefit from an uplift in rents. In addition, with
European property yield spreads being above the historical 10-year
average, CERT is poised to gain from increases in property values.
Long WALE with inbuilt organic growth. With a weighted average
lease expiry (WALE) of 4.9 years, CERT offers strong income
visibility. With the majority of leases also linked to inflation or
similar indices, the CERT has an inbuilt organic growth profile.
Upside from acquisitions. Backed by Cromwell Property Group
(CPG) which has a track record of over 15 years in Europe
combined with “on the ground” presence in various European
markets, in our view CREIT has the requisite support to identify
DPU accretive acquisitions. In addition, while there is a lack of
familiarity with CPG by some investors, we believe ARA Asset
Management a well-known real estate fund manager, taking a
19.5% interest in CPG should give investors confidence over
CPG’s execution capability.
Valuation:
We initiate coverage with a DCF-based TP of EUR0.63. This is
based on WACC of 5.5% and terminal growth rate of 1.5%.
Key Risks to Our View:
The key risk to our view is lower-than-expected rental income,
arising from loss of tenants or slower upturn in rents/inflation.

Page 2
Company Focus
Cromwell European REIT
Table of Contents
Investment Summary 3
Diversified Pan-European portfolio 4
Exposure to the improving European real estate market 11
Sponsored by an Experienced Global Real Estate Manager
with an Extensive European Platform 13
SWOT Analysis 16
Key Risks 17
REIT Structure 18
Key Management Team 19
Fee Structure 26
Financials - Income Statement 35
Financials - Balance Sheet 38
Financials - Cashflow Statement 39
Valuation 40
Market Review 45
Portfolio Summary 63
Analysts
Mervin SONG, CFA +65 6682 3715 [email protected] Derek TAN +65 6682 3716 [email protected]

Page 3
Company Focus
Cromwell European REIT
Investment Summary
First S-REIT with a Pan-European portfolio that is large enough
and diversified across asset classes and geographies. Cromwell
European Real Estate Investment Trust (CERT) is the first
Singapore-listed REIT with a large and diversified Pan-
European portfolio that offers investors a unique opportunity
to invest in office, light industrial/logistics and retail assets
located in Denmark, Germany, France, Italy and the
Netherlands. The initial portfolio comprises 74 properties with
an aggregate lettable area of approximately 1.1m square
meters (sqm). The appraised value of the initial portfolio is
approximately EUR1.35bn, which is based on the higher of
two independent valuations. The key asset classes of office,
light industrial/logistics comprise 47.4% and 42.1% of the
initial portfolio by asset value respectively. The residual 10.5%
comprises mainly government campuses and/or retail assets.
The initial portfolio is also spread out across five countries
with the Netherlands contributing 34.5% of appraised value,
followed by Italy (29.9%), France (22.1%), Germany (7.7%),
and Denmark (5.8%).
Exposure to improving European markets. CERT provides
investors exposure to the continued economic recovery in
Europe, with GDP growth in the Eurozone accelerating to
2.5% in 2017 up from 1.7% in 2016, which is expected to be
sustained at a healthy level over the next few years. In
addition, unemployment rates are expected to fall further with
household consumption, investment, and industrial
production activity expected to increase going forward.
Against this favourable macro backdrop, Cushman &
Wakefield forecasts a steady increase in rents over the next
three years.
Attractive European property yield spreads. On top of the
improving macro fundamentals, European properties in our
view provide a compelling investment opportunity based on
the attractive property yield spreads. Based on Cushman &
Wakefield’s data, the differential between European real
estate yields and long term government bond yields are near
historic highs and above the historical 10-year average. The
yield spread for light industrial and office currently stands at
7.3% and 4.2% respectively. In addition, the European real
estate yield spread of 4.3% compares favourably to the 3.3%,
1.8% and 0.8% yield spread on offer in the US, Singapore
and Hong Kong respectively.
Predominantly freehold or ongoing leasehold properties.
Approximately 88.0% of the initial portfolio by appraised
value comprises either freehold land or ongoing leasehold
land which is classified as continuing leasehold or perpetual
leasehold. We find this compares favourably with other
Singapore REITs who predominantly hold properties with up
to 99-year leases.
Sponsored by an experienced global real estate manager with
an extensive European platform. CERT’s Sponsor is Cromwell
Property Group (CPG) which is listed on the Australian Stock
Exchange. Cromwell is a global real estate manager with total
assets under management (AUM) of c.A$10.1bn spread
across Australia, New Zealand and Europe. In addition, it has
an over 15-year track record in the European real estate
industry with a total AUM of EUR3.4bn in Europe. The
Sponsor’s deep European expertise is also supported by the
“on the ground” presence in various European markets. While
acknowledging that many Asian based investors are not
familiar with CPG, ARA Asset Management, an established
real estate manager who is the manager for listed REITs such
as Suntec and Fortune REIT, taking a c.19.5% interest in
Cromwell Property Group, should allay potential concerns
over CPG’s execution capability.
Long dated lease expiry profile with diversified and high
quality tenant base. The initial portfolio has a long weighted
average lease expiry by headline rent based on the next
permissible break date at the tenant’s election (WALE) and
weighted average lease expiry by headline rent based on the
final termination date of the lease agreement (WALT) of 4.9
and 5.8 years respectively. The long WALE and WALT provides
strong medium income visibility and stability for the REIT. This
is further underpinned by having no more than 12.4% of
leases expiring in each year up to FY21. Income stability is also
attributed to a low tenant concentration risk with over 700
leases spread across various trade sectors and locations. No
trade sector and tenant makes up more than 24.6% and
19.9% of total headline rent as at 30 April 2017 respectively.
Embedded rental escalations. The majority of CERT’s leases
are linked to inflation or similar indices which not only provide
a built-in rental growth mechanism but also act as a natural
hedge against potential rate rises driven by rising inflation.
Cromwell European REIT is helmed by an experienced team
comprising Mr. Philip Levinson as CEO, Mr. Thierry Leleu as
Chief Investment Officer, Mr. Daniel Donner as CFO and Ms.
Elena Arabadjieva as Head of Investor Relations. The
management team has extensive European real estate and
Singapore REIT management experience. Their experience
ranges from 15 to 32 years in property investment,
management, development, finance and investor relations.
Initiate with BUY and TP of EUR0.63. We initiate coverage
with a BUY call and a TP of EUR0.63. We believe CERT offers
an attractive combination of high yield of around 7.3%,
strong cashflow visibility, and steady DPU growth outlook
underpinned by embedded rental escalations. In addition,
CERT’s Sponsor has an established 15-year track record in
Europe, which provides the REIT with the necessarily platform
to identify and seek DPU-accretive opportunities.
Page 4
Company Focus
Cromwell European REIT
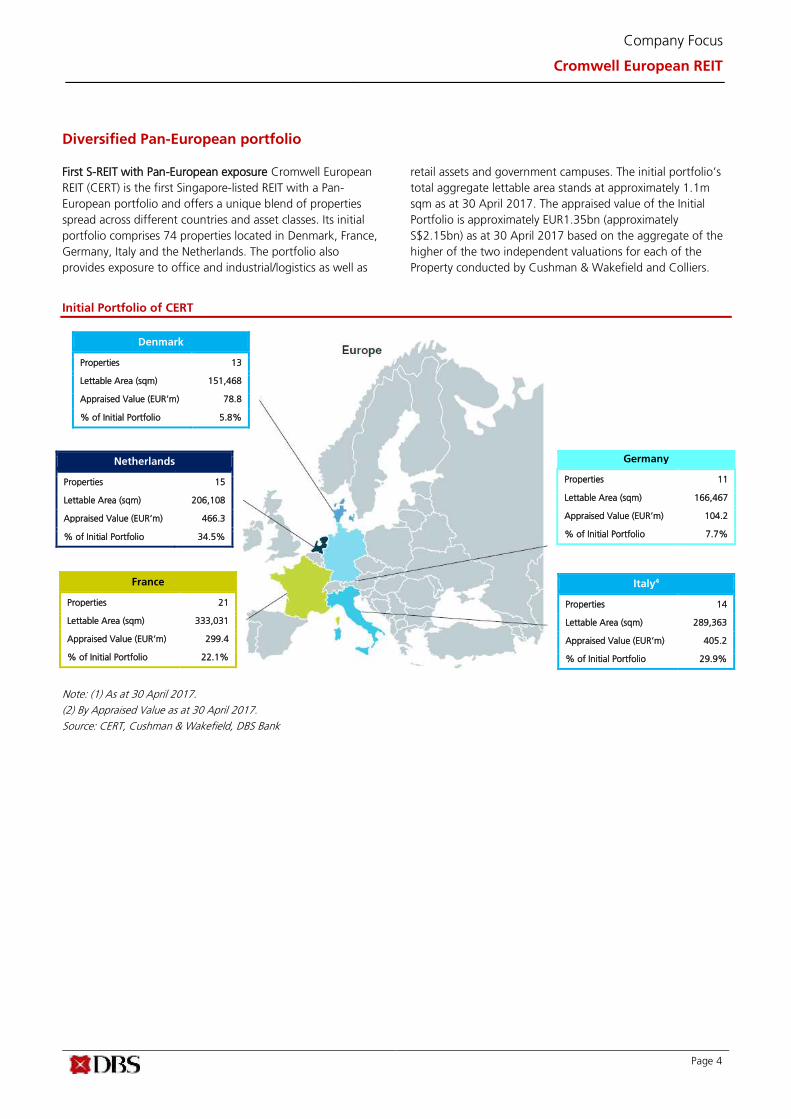
Diversified Pan-European portfolio
First S-REIT with Pan-European exposure Cromwell European
REIT (CERT) is the first Singapore-listed REIT with a Pan-
European portfolio and offers a unique blend of properties
spread across different countries and asset classes. Its initial
portfolio comprises 74 properties located in Denmark, France,
Germany, Italy and the Netherlands. The portfolio also
provides exposure to office and industrial/logistics as well as
retail assets and government campuses. The initial portfolio’s
total aggregate lettable area stands at approximately 1.1m
sqm as at 30 April 2017. The appraised value of the Initial
Portfolio is approximately EUR1.35bn (approximately
S$2.15bn) as at 30 April 2017 based on the aggregate of the
higher of the two independent valuations for each of the
Property conducted by Cushman & Wakefield and Colliers.
Initial Portfolio of CERT
Note: (1) As at 30 April 2017.
Note: (1) As at 30 April 2017.
(2) By Appraised Value as at 30 April 2017.
Source: CERT, Cushman & Wakefield, DBS Bank
Denmark
Properties 13
Lettable Area (sqm) 151,468
Appraised Value (EUR’m) 78.8
% of Initial Portfolio 5.8%
Netherlands
Properties 15
Lettable Area (sqm) 206,108
Appraised Value (EUR’m) 466.3
% of Initial Portfolio 34.5%
Germany
Properties 11
Lettable Area (sqm) 166,467
Appraised Value (EUR’m) 104.2
% of Initial Portfolio 7.7%
Italy4
Properties 14
Lettable Area (sqm) 289,363
Appraised Value (EUR’m) 405.2
% of Initial Portfolio 29.9%
France
Properties 21
Lettable Area (sqm) 333,031
Appraised Value (EUR’m) 299.4
% of Initial Portfolio 22.1%
Page 5
Company Focus
Cromwell European REIT
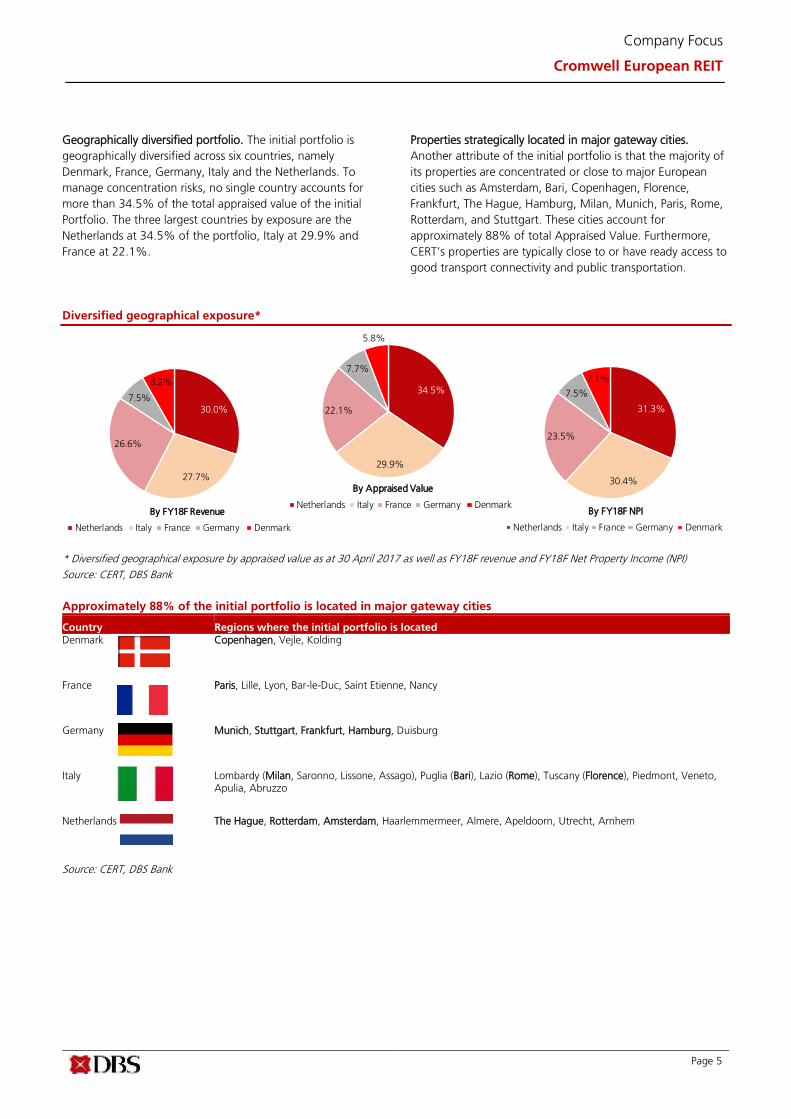
Geographically diversified portfolio. The initial portfolio is
geographically diversified across six countries, namely
Denmark, France, Germany, Italy and the Netherlands. To
manage concentration risks, no single country accounts for
more than 34.5% of the total appraised value of the initial
Portfolio. The three largest countries by exposure are the
Netherlands at 34.5% of the portfolio, Italy at 29.9% and
France at 22.1%.
Properties strategically located in major gateway cities.
Another attribute of the initial portfolio is that the majority of
its properties are concentrated or close to major European
cities such as Amsterdam, Bari, Copenhagen, Florence,
Frankfurt, The Hague, Hamburg, Milan, Munich, Paris, Rome,
Rotterdam, and Stuttgart. These cities account for
approximately 88% of total Appraised Value. Furthermore,
CERT’s properties are typically close to or have ready access to
good transport connectivity and public transportation.
Diversified geographical exposure*
* Diversified geographical exposure by appraised value as at 30 April 2017 as well as FY18F revenue and FY18F Net Property Income (NPI)
Source: CERT, DBS Bank
Approximately 88% of the initial portfolio is located in major gateway cities
Country Regions where the initial portfolio is located Denmark Copenhagen, Vejle, Kolding
France Paris, Lille, Lyon, Bar-le-Duc, Saint Etienne, Nancy
Germany Munich, Stuttgart, Frankfurt, Hamburg, Duisburg
Italy Lombardy (Milan, Saronno, Lissone, Assago), Puglia (Bari), Lazio (Rome), Tuscany (Florence), Piedmont, Veneto, Apulia, Abruzzo
Netherlands The Hague, Rotterdam, Amsterdam, Haarlemmermeer, Almere, Apeldoorn, Utrecht, Arnhem
Source: CERT, DBS Bank
34.5%
29.9%
22.1%
7.7%
5.8%
Netherlands Italy France Germany Denmark
By Appraised Value
30.0%
27.7%
26.6%
7.5%
8.2%
Netherlands Italy France Germany Denmark
By FY18F Revenue
31.3%
30.4%
23.5%
7.5%
7.1%
Netherlands Italy France Germany Denmark
By FY18F NPI

Page 6
Company Focus
Cromwell European REIT
Spread over two major assets classes. The initial portfolio is
also spread across two major asset classes. Office is the largest
segment at 47.4% of the initial portfolio by appraised value,
followed by light industrial/logistics at 42.1%. CERT also has
exposure to government campuses, a retail asset and a hotel
which in total represents 10.5% of the initial portfolio as at
30 April 2017. This varied exposure in our view provides some
protection from any major downturn in any asset class in any
particular country.
Office portfolio in Italy and the Netherlands. The initial
portfolio’s office exposure is largely focused on quality office
buildings located in the central business districts and city
fringe locations of major and regional cities in Italy and the
Netherlands. Key locations include Amsterdam, Rotterdam
and The Hague in the Netherlands as well as Milan and Rome
in Italy. These markets according to Cushman & Wakefield
have favourable demand and supply dynamics, namely rising
demand but limited new inventory.
Light industrial/logistics properties across Europe. CERT’s
exposure to the light industrial/logistics segment is dominated
by properties located in industrial parks and/or within
proximity to key urban industrial locations across Europe. The
key markets CERT has targeted for its initial portfolio include
Denmark, France, Germany, Italy and the Netherlands have
limited new supply.
Diversified asset class exposure*
* Diversified asset class exposure by appraised value as at 30 April 2017 as well as FY18F revenue and FY18F NPI. Others relate to three
government-let campuses as well as one hotel and one retail asset in Italy. The campuses are master-leased to Agenzia del Demanio (the Italian
State Property Office), an economic public entity of the Italian Ministry of Economic and Finance, which has in turn re-assigned the leases to
various Italian governmental entities. The hotel is master leased.
Source: CERT, DBS Bank
Asset class breakdown by country*
* Appraised value as at 30 April 2017
Source: CERT, DBS Bank
52%
18%
14%
13%
2%
Light industrial / logistics by value
France Germany Denmark Netherlands Italy
61%
39%
Office by value
Netherlands Italy
47.4%
42.1%
10.5%
Office Light Industrial/Logistics Others
By Appraised Value
39.2%
48.6%
12.3%
Office Light Industrial/Logistics Others
By FY18F Revenue
41.1%
45.1%
13.8%
Office Light Industrial/Logistics Others
By FY18F NPI

Page 7
Company Focus
Cromwell European REIT
Predominantly freehold, perpetual or continuing leasehold
assets. In our view, another key attractive attribute is that
88% of the initial portfolio by total appraised value comprises
of either freehold land or ongoing leasehold land, which is
classified as Continuing Leasehold or Perpetual Leasehold. In
our view, this compares favourably to other S-REIT’s who
typically hold Singapore properties which have a leasehold
tenure of up to 99 years.
Healthy occupancy levels but upside remains. The initial
portfolio’s occupancy remains at a healthy level standing at
87.7% as at 30 April 2017. However, with improving real
estate fundamentals across the initial portfolio’s key markets,
as well as active asset management initiatives to be
undertaken by the Manager, with the support of the Sponsor,
there remains potential to drive vacancy rates lower. To that
end, we expect overall portfolio occupancy to increase to
92.6% by FY19 from the initial 87.7% level.
Good cashflow visibility with long WALE and well staggered
lease profile. We believe the initial portfolio provides investors
with good cashflow visibility owing to its long weighted
average lease expiry by headline rent based on the next
permissible break date at the tenant’s election (WALE) and
weighted average lease expiry by headline rent based on the
final termination date of the lease agreement (WALT) of 4.9
and 5.8 years respectively. This is further underpinned by
having a well staggered lease expiry profile, with no more
than 12.4% of leases (by WALE) expiring in each year up to
FY21.
Low tenant concentration risks with diversified trade sector
mix. Income stability is also attributed to a low tenant
concentration risk with over 700 leases spread across various
trade sectors and locations. No trade sector and tenant makes
up no more than 24.6% and 19.9% of total headline rent as
at 30 April 2017 respectively. The top ten tenants represent
only 44.2% of the initial portfolio’s total headline rent. In
addition, no property makes up for more than 11.7% of the
initial portfolio by value as at 30 April 2017, with the top ten
properties contributing 57.3% by value.
Land tenure breakdown
Source: CERT, DBS Bank
Occupancy levels
Occupancy 30-Apr-17 FY17F* FY18F FY19F
Office 94.8% 95.9% 97.4% 99.5%
Industrial/Logistics 82.9% 84.2% 85.6% 89.0%
Other 100.0% 100.0% 100.0% 100.0%
Total occupancy 87.7% 88.8% 90.0% 92.6%
* Annualised for the period 1 December to 31 December 2017
Source: CERT, DBS Bank
Lease Expiry Profile of the Initial Portfolio by Headline Rent (as at 30 April 2017)
Source: REIT Manager, DBS Bank
WALE and WALT by Asset Class (as at 30 April 2017)
Initial Portfolio WALE (years) WALT (years)
Office 6.9 7.1 Light Industrial / Logistics 3.0 4.7 Others 5.8 6.1 Initial Portfolio 4.9 5.8
Source: CERT, DBS Bank
69.2%
18.8%
12.0% Freehold
Continuing Leasehold /Perpetual Leasehold
Leashold
8.3% 12.4% 10.6% 9.0% 10.4%
49.3%
6.4% 8.4% 5.8% 6.5% 10.1%
62.8%
FY17 FY18 FY19 FY20 FY21 FY22 and beyond
% by WALE % by WALT
Page 8
Company Focus
Cromwell European REIT
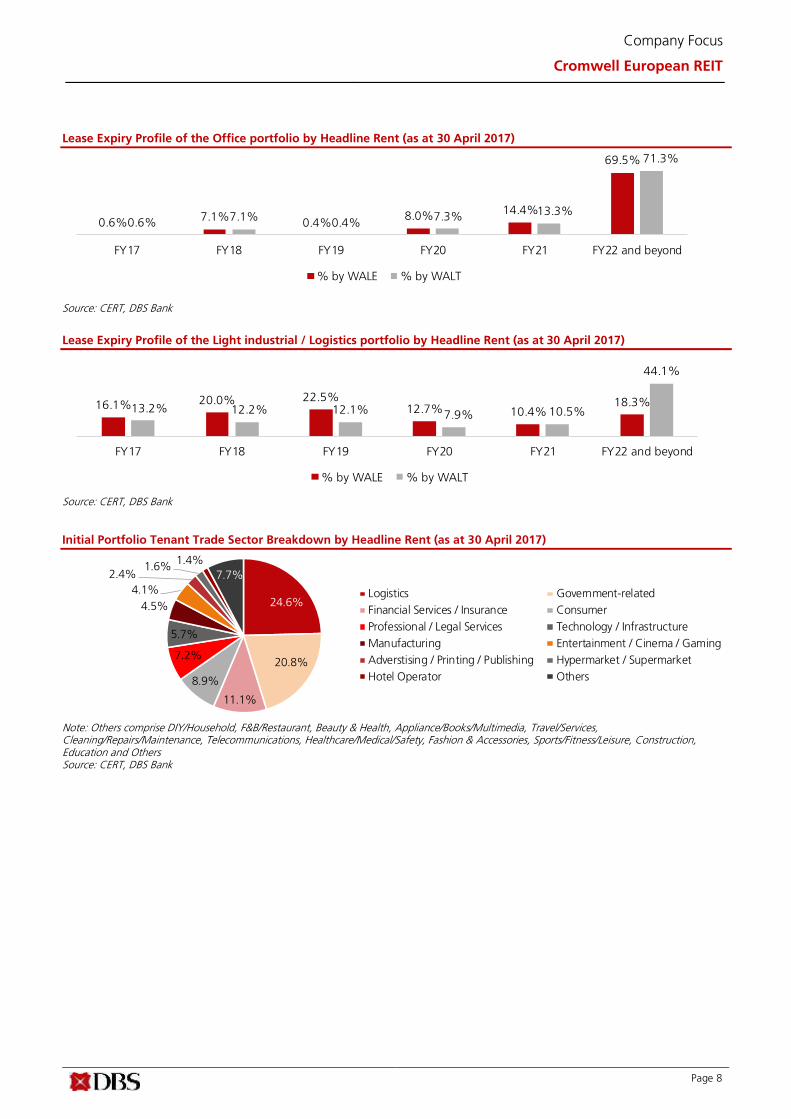
Lease Expiry Profile of the Office portfolio by Headline Rent (as at 30 April 2017)
Source: CERT, DBS Bank
Lease Expiry Profile of the Light industrial / Logistics portfolio by Headline Rent (as at 30 April 2017)
Source: CERT, DBS Bank
Initial Portfolio Tenant Trade Sector Breakdown by Headline Rent (as at 30 April 2017)
Note: Others comprise DIY/Household, F&B/Restaurant, Beauty & Health, Appliance/Books/Multimedia, Travel/Services, Cleaning/Repairs/Maintenance, Telecommunications, Healthcare/Medical/Safety, Fashion & Accessories, Sports/Fitness/Leisure, Construction, Education and Others Source: CERT, DBS Bank
16.1% 20.0% 22.5%12.7% 10.4%
18.3%13.2% 12.2% 12.1% 7.9% 10.5%
44.1%
FY17 FY18 FY19 FY20 FY21 FY22 and beyond
% by WALE % by WALT
24.6%
20.8%
11.1%
8.9%
7.2%
5.7%
4.5%
4.1%
2.4%1.6%
1.4%
7.7%
Logistics Government-related
Financial Services / Insurance Consumer
Professional / Legal Services Technology / Infrastructure
Manufacturing Entertainment / Cinema / Gaming
Adverstising / Printing / Publishing Hypermarket / Supermarket
Hotel Operator Others
0.6%7.1%
0.4%8.0%
14.4%
69.5%
0.6%7.1%
0.4%7.3% 13.3%
71.3%
FY17 FY18 FY19 FY20 FY21 FY22 and beyond
% by WALE % by WALT

Page 9
Company Focus
Cromwell European REIT
Top ten tenants contributed c.44.2% of total Headline Rent (as at 30 April 2017)
No. Tenant No. of
leases
Trade Sector % of Total Headline Rent
(as at 30 April 2017)
1 Agenzia del Demanio (Italian State Property Office) 3 Government-related 19.9%
2 Nationale Nederlanden 2 Financial services/Insurance 7.0%
3 Kamer van Koophandel 2 Professional/Legal services 3.2%
4 Chicago Bridge & Iron Company 2 Technology/Infrastructure 2.9%
5 Holland Casino Rotterdam 1 Entertainment / Cinema /
Gaming
2.7%
6 A.Manzoni & c. S.p.A. 1 Advertising & Publications 2.2%
7 Coolblue BV 1 Technology/Infrastructure 2.1%
8 Nilfisk-Advance A/S 2 Consumer 1.4%
9 Confidential Tenant** 1 Confidential 1.4%
10 CBRE 1 Professional/Legal services 1.4%
Top 10 Tenants for Initial Portfolio 44.2%
* Agenzia del Demanio has three lease agreements including two master lease agreements over seven Properties ** The name and trade sector of the “Confidential Tenant” cannot be disclosed as CERT (through the relevant Italian alternative investment fund) is bound by a strict confidentiality obligation to treat confidential all the information concerning the lease agreement and the lessee’s activities. (1) Agenzia del Demanio (Italian State Property Office) is responsible for the management, rationalisation and development of all state-owned properties. (2) Agenzia del Demanio has two master lease agreements over seven Properties. A third lease with a government related entity is in place at one property. (3) Nationale-Nederlanden is an insurance and asset management company based in the Netherlands. It is active in 18 countries with a history of over 170 years. Nationale-Nederlanden is Part of the NN-Group, which is listed on the Amsterdam Stock Exchange with a market capitalisation of approximately C12.0 billion as at the Latest Practicable Date. It is rated BBB+ (stable) by S&P (as at 11 May 2017) and A (stable) by Fitch Ratings (as at 23 December 2016). (4) Kamer van Koophandel is the Dutch Chamber of Commerce. (5) Chicago Bridge & Iron Company is an engineering, construction, fabrication and technology company and is a leading provider of technology and infrastructure for the energy industry. With over 125 years of history and over 42,000 employees, it is listed on the New York Stock Exchange with a market capitalisation of approximately US$1.7bn. (6) Holland Casino Rotterdam was founded in 1976 as the only government-licensed provider of casino gaming in the Netherlands, with 2,500 employees and over 14 casinos in the Netherlands servicing over 1 million customers. The State has economic and voting rights comparable to those of a shareholder in a company, therefore the Finance Ministry is a pseudo-shareholder. (7) A. Manzoni & c. S.p.A. is a subsidiary of GEDI Gruppo Editoriale (“GEDI”), and provides marketing and advertising services for GEDI newspapers, magazines, radio stations and Internet sites. GEDI is listed on the Borsa Italiana, and has a market capitalisation of approximately €348m. (8) Coolblue BV is a private Dutch-e-commerce company founded in 1999 and operates over 300 webshops and eight physical stores in the Netherlands and Belgium under the “Coolblue” brand. (9) Nilfisk is a manufacturer of commercial cleaning equipment and contract cleaners, with operations in 45 countries. It is part of the NKT Group, which is listed in Copenhagen with a market capitalisation of approximately 7.1bn Danish Krone. (10) CBRE Group, Inc. is the world’s largest commercial real estate services and investment firm, with 2015 revenues of US$10.9bn and more than 70,000 employees (excluding affiliate offices). It is listed on the New York Stock Exchange, and has a market capitalisation of US$13.8bn. CBRE has been included in the Fortune 500 since 2008. Source: CERT, DBS Bank

Page 10
Company Focus
Cromwell European REIT
Top ten properties by appraised value (as at 30 April 2017)
No. Property Country City Lettable Area
(sqm)
FY18F revenue
(EUR’m)
Appraised Value (EUR’m) % of Total Appraised Value
of the Initial Portfolio
1 Haagse Poort Netherlands The Hague 68,390 13.4 158.8 11.7%
2 Central Plaza Netherlands Rotterdam 33,179 11.9 157.5 11.6%
3 Parc Des Docks France Paris 73,431 9.0 104.0 7.7%
4 Bari Europa Italy Bari 123,320 9.4 83.1 6.1%
5 Milano Piazza
Affari
Italy Milan 7,602 3.9 81.7 6.0%
6 Roma Amba
Aradam
Italy Rome 16,689 3.6 49.8 3.7%
7 De Ruijterkade Netherlands Amsterdam 8,741 2.4 40.3 3.0%
8 Veemarkt Netherlands Amsterdam 21,702 2.6 38.7 2.9%
9 Roma Pianciani Italy Rome 10,725 3.0 33.9 2.5%
10 Kirchheim
(Parsdorfer
Weg)
Germany Munich 26,445 2.3 27.9 2.1%
Total
390,224 61.5 775.7 57.3%
Source: CERT, DBS Bank
Embedded organic growth with inflation-linked leases. The
majority of CERT’s leases provide for in-built organic growth.
Rents for the various properties are tied to inflation or similar
indices. This also has the benefit of providing the portfolio
with a natural hedge against potential rate rises driven by
rising inflation. Based on Cushman & Wakefield’s analysis,
inflation in the Eurozone has recovered from its low in 2016,
and is forecasted to accelerate over the coming few years.
Page 11
Company Focus
Cromwell European REIT
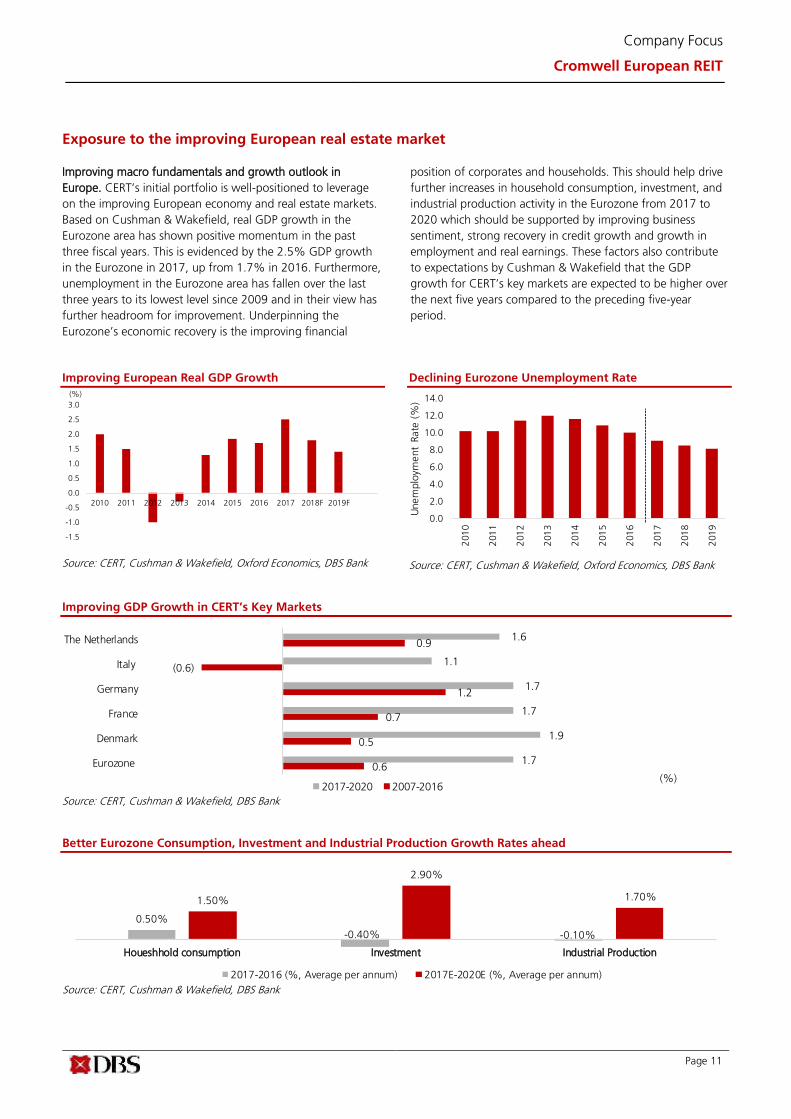
Exposure to the improving European real estate market Improving macro fundamentals and growth outlook in
Europe. CERT’s initial portfolio is well-positioned to leverage
on the improving European economy and real estate markets.
Based on Cushman & Wakefield, real GDP growth in the
Eurozone area has shown positive momentum in the past
three fiscal years. This is evidenced by the 2.5% GDP growth
in the Eurozone in 2017, up from 1.7% in 2016. Furthermore,
unemployment in the Eurozone area has fallen over the last
three years to its lowest level since 2009 and in their view has
further headroom for improvement. Underpinning the
Eurozone’s economic recovery is the improving financial
position of corporates and households. This should help drive
further increases in household consumption, investment, and
industrial production activity in the Eurozone from 2017 to
2020 which should be supported by improving business
sentiment, strong recovery in credit growth and growth in
employment and real earnings. These factors also contribute
to expectations by Cushman & Wakefield that the GDP
growth for CERT’s key markets are expected to be higher over
the next five years compared to the preceding five-year
period.
Improving European Real GDP Growth
Source: CERT, Cushman & Wakefield, Oxford Economics, DBS Bank
Declining Eurozone Unemployment Rate
Source: CERT, Cushman & Wakefield, Oxford Economics, DBS Bank
Improving GDP Growth in CERT’s Key Markets
Source: CERT, Cushman & Wakefield, DBS Bank
Better Eurozone Consumption, Investment and Industrial Production Growth Rates ahead
Source: CERT, Cushman & Wakefield, DBS Bank
0.0
2.0
4.0
6.0
8.0
10.0
12.0
14.0
201
0
201
1
201
2
201
3
201
4
201
5
201
6
201
7
201
8
201
9
Unem
plo
yment
Rate
(%
)
0.50%
-0.40% -0.10%
1.50%
2.90%
1.70%
Houeshhold consumption Investment Industrial Production
2017-2016 (%, Average per annum) 2017E-2020E (%, Average per annum)
0.6
0.5
0.7
1.2
(0.6)
0.9
1.7
1.9
1.7
1.7
1.1
1.6
Eurozone
Denmark
France
Germany
Italy
The Netherlands
(%)2017-2020 2007-2016
-1.5
-1.0
-0.5
0.0
0.5
1.0
1.5
2.0
2.5
3.0
2010 2011 2012 2013 2014 2015 2016 2017 2018F 2019F
(%)
Page 12
Company Focus
Cromwell European REIT
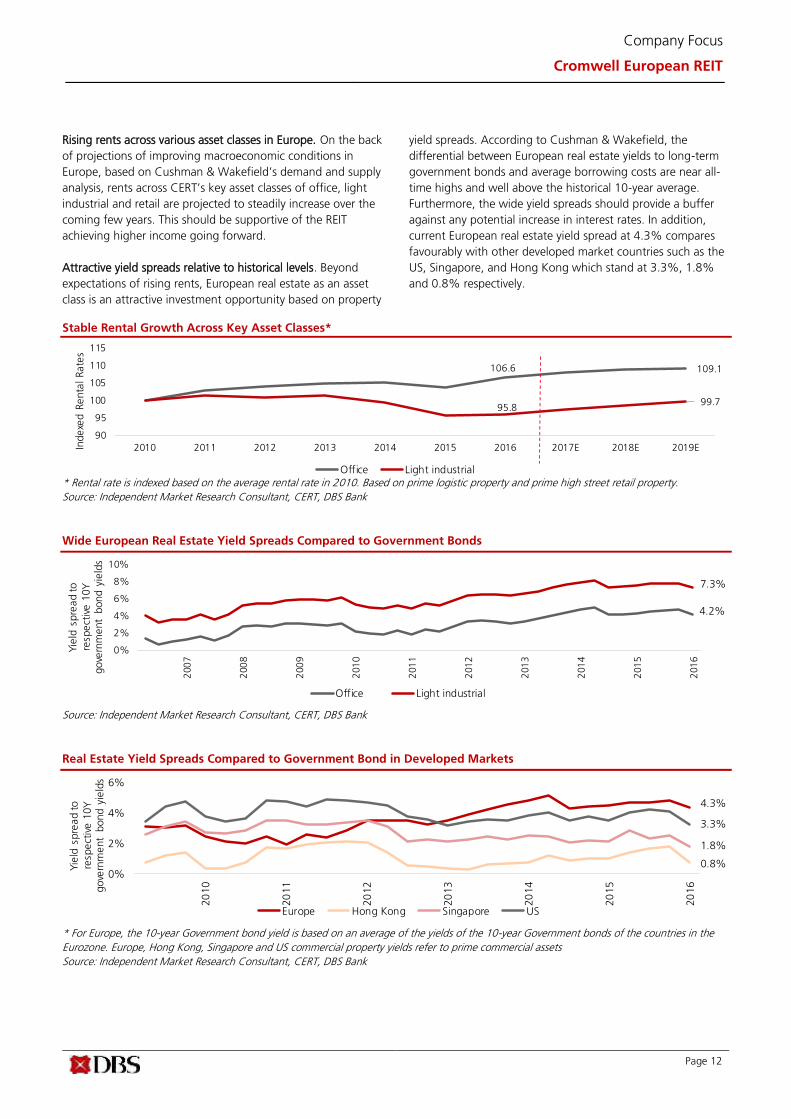
Rising rents across various asset classes in Europe. On the back
of projections of improving macroeconomic conditions in
Europe, based on Cushman & Wakefield’s demand and supply
analysis, rents across CERT’s key asset classes of office, light
industrial and retail are projected to steadily increase over the
coming few years. This should be supportive of the REIT
achieving higher income going forward.
Attractive yield spreads relative to historical levels. Beyond
expectations of rising rents, European real estate as an asset
class is an attractive investment opportunity based on property
yield spreads. According to Cushman & Wakefield, the
differential between European real estate yields to long-term
government bonds and average borrowing costs are near all-
time highs and well above the historical 10-year average.
Furthermore, the wide yield spreads should provide a buffer
against any potential increase in interest rates. In addition,
current European real estate yield spread at 4.3% compares
favourably with other developed market countries such as the
US, Singapore, and Hong Kong which stand at 3.3%, 1.8%
and 0.8% respectively.
Stable Rental Growth Across Key Asset Classes*
* Rental rate is indexed based on the average rental rate in 2010. Based on prime logistic property and prime high street retail property.
Source: Independent Market Research Consultant, CERT, DBS Bank
Wide European Real Estate Yield Spreads Compared to Government Bonds
Source: Independent Market Research Consultant, CERT, DBS Bank
Real Estate Yield Spreads Compared to Government Bond in Developed Markets
* For Europe, the 10-year Government bond yield is based on an average of the yields of the 10-year Government bonds of the countries in the
Eurozone. Europe, Hong Kong, Singapore and US commercial property yields refer to prime commercial assets
Source: Independent Market Research Consultant, CERT, DBS Bank
0%
2%
4%
6%
20
10
20
11
20
12
20
13
20
14
20
15
20
16
Yie
ld s
pre
ad to
resp
ect
ive 1
0Y
gove
rnm
ent
bond y
ield
s
Europe Hong Kong Singapore US
4.3%
3.3%
1.8%
0.8%
106.6 109.1
95.8 99.7
90
95
100
105
110
115
2010 2011 2012 2013 2014 2015 2016 2017E 2018E 2019EIndexe
d R
enta
l Rate
s
Office Light industrial
0%
2%
4%
6%
8%
10%
200
7
200
8
200
9
201
0
201
1
201
2
201
3
201
4
201
5
201
6
Yie
ld s
pre
ad to
resp
ect
ive 1
0Y
gove
rnm
ent
bond y
ield
s
Office Light industrial
4.2%
7.3%

Page 13
Company Focus
Cromwell European REIT
Sponsored by an Experienced Global Real Estate Manager with an Extensive European Platform Sponsor – Cromwell Property Group. CERT’s Sponsor,
Cromwell Property Group, is a global real estate owner and
investment manager which has been listed on the Australian
Stock Exchange since 2005. Headquartered in Brisbane,
Australia, it has a market capitalisation of c.A$2.1bn
(EUR1.3bn), and a direct property investment portfolio valued
at c.A$2.4bn (c.EUR1.5bn). The Sponsor also has a global real
estate funds management platform offering regional
specialisation across different markets with total assets under
management (AUM) of c.A$10.1bn (c.EUR6.3bn) across
Australia, New Zealand, and Europe. It manages over 330
properties globally across 16 countries, housing more than
3,600 tenants in a total area of c.3.9m sqm.
Established European track record and “on-the-ground”
presence. The Sponsor has an over 15-year track record in the
European real estate industry with a total AUM of c.EUR4.0bn.
A key competitive advantage that the Sponsor has is its “on-
the-ground” presence in each market. This is established by
having over 190 employees located in 20 offices across 13
countries in Europe. This in-depth local expertise and market
knowledge as well as its established capabilities across the real
estate value chain, including leasing, repositioning,
refurbishment and the development of new assets, have
drawn many investors including sovereign wealth and pension
funds, global real estate specialists and financial institutions to
its various funds. We believe this expertise will also be valuable
to CERT as it executes on its strategy of driving rents higher,
reducing vacancy, redeveloping its properties and acquiring
new assets.
Potential partnership with ARA Asset Management. In early
March 2018, ARA Asset Management (ARA) announced that
it will acquire a 19.5% interest in Cromwell Property Group
subject to the Foreign Investment Review Board in Australia.
ARA is an integrated real estate fund manager with S$40bn in
AUM across various private real estate funds and publicly listed
REITs such as Suntec REIT, Fortune REIT and Cache Logistics
Trust. In addition, ARA was recently privatised by Warburg
Pincus a global private equity firm. ARA has over 1,300 staff in
21 cities in eight countries. We believe should ARA become
one of Cromwell Property Group’s major shareholders, there is
potential for CERT to benefit from the potential colloboration
between its Sponsor, ARA and wider Warburg Pincus network
in terms of deal flow and access to tenants.
Cromwell Property Group’s Global Presence
Source: CERT, DBS Bank

Page 14
Company Focus
Cromwell European REIT
Alignment of interest with c.34% Sponsor stake. The
properties in the initial portfolio are largely being acquired
from funds managed by the Sponsor for third-party investors.
Nonetheless, the Sponsor’s confidence in the long-term
success of CERT is demonstrated by its commitment to hold a
strategic stake of c.34% in the REIT.
No ROFR pipeline but liquid European property market
provides a bounty of acquisition opportunities. As the Sponsor
has not extended a first right of refusal (ROFR) to the CERT as
it manages other property funds, we believe the lack of a
ROFR is not an impediment to the REIT acquiring assets on an
accretive basis. This is because the European property market
is one of the most liquid in the world. For example, in 2015,
the European commercial real estate market had
approximately EUR3.7tn of invested stock, equivalent to
c.29% of the total invested stock globally. Furthermore, the
volume of transactions has been steadily increasing since
2010, reaching EUR271bn in 2016. In addition, there are
significant close-ended real estate funds maturing over the
next decade, which provides the opportunity for CERT to
acquire assets. The Sponsor’s European platform also has
ready access to a wide array of property transactions. In 2016,
the Sponsor’s European platform evaluated over EUR40bn of
potential acquisitions, and completed approximately EUR1.1bn
of acquisitions. In addition, the Sponsor has completed over
EUR900m worth of acquisitions across various countries in
Europe in the 18 months leading up to 31 August 2017.
Extensive on the ground presence in Europe
Source: CERT, DBS Bank
European commercial real estate transaction volumes
(EUR’bn)
Source: Cushman & Wakefield, Real Capital Analytics, DBS Bank
Cromwell Europe’s AUM Breakdown by Geography*
* As at 31 December 2017. Benelux stands for Belgium, Netherlands
and Luxemburg while CEE stands for Central and Eastern Europe
Source: CERT, DBS Bank
Cromwell Europe’s AUM Breakdown by Asset Class*
* As at 31 December 2017.
Source: CERT, DBS Bank
304
159
89
130148 156
194
239
319
271
108
0
50
100
150
200
250
300
350
2007 2008 2009 2010 2011 2012 2013 2014 2015 2016 20171H
EUR b
illio
n
Office Retail Industrial Others
24.0%
25.0%
9.0%
10.0%
11.0%
11.0%
10.0%
Benelux
CEE
UK
France
Germany
Nordics
Italy
49.0%
25.0%
12.0%
13.0%Office
Retail
Industrial/Logistics
Other
Page 15
Company Focus
Cromwell European REIT
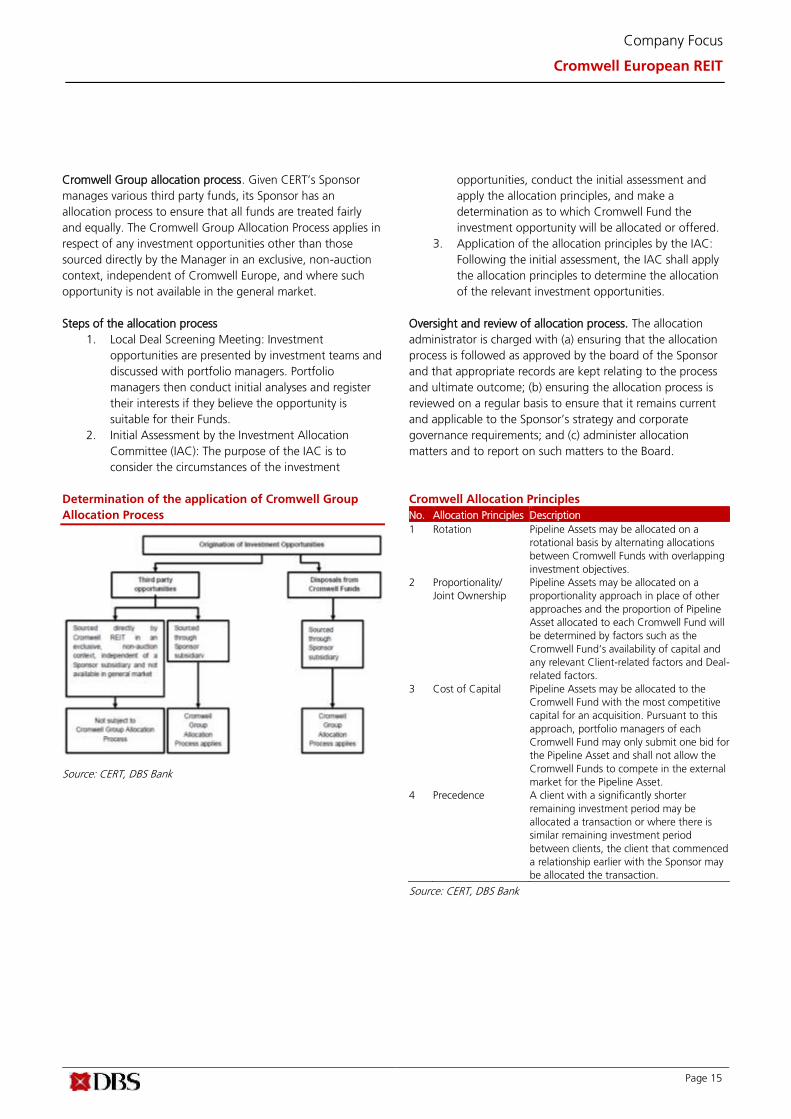
Cromwell Group allocation process. Given CERT’s Sponsor
manages various third party funds, its Sponsor has an
allocation process to ensure that all funds are treated fairly
and equally. The Cromwell Group Allocation Process applies in
respect of any investment opportunities other than those
sourced directly by the Manager in an exclusive, non-auction
context, independent of Cromwell Europe, and where such
opportunity is not available in the general market.
Steps of the allocation process
1. Local Deal Screening Meeting: Investment
opportunities are presented by investment teams and
discussed with portfolio managers. Portfolio
managers then conduct initial analyses and register
their interests if they believe the opportunity is
suitable for their Funds.
2. Initial Assessment by the Investment Allocation
Committee (IAC): The purpose of the IAC is to
consider the circumstances of the investment
opportunities, conduct the initial assessment and
apply the allocation principles, and make a
determination as to which Cromwell Fund the
investment opportunity will be allocated or offered.
3. Application of the allocation principles by the IAC:
Following the initial assessment, the IAC shall apply
the allocation principles to determine the allocation
of the relevant investment opportunities.
Oversight and review of allocation process. The allocation
administrator is charged with (a) ensuring that the allocation
process is followed as approved by the board of the Sponsor
and that appropriate records are kept relating to the process
and ultimate outcome; (b) ensuring the allocation process is
reviewed on a regular basis to ensure that it remains current
and applicable to the Sponsor’s strategy and corporate
governance requirements; and (c) administer allocation
matters and to report on such matters to the Board.
Determination of the application of Cromwell Group
Allocation Process
Source: CERT, DBS Bank
Cromwell Allocation Principles
No. Allocation Principles Description
1 Rotation Pipeline Assets may be allocated on a
rotational basis by alternating allocations
between Cromwell Funds with overlapping
investment objectives.
2 Proportionality/
Joint Ownership
Pipeline Assets may be allocated on a
proportionality approach in place of other
approaches and the proportion of Pipeline
Asset allocated to each Cromwell Fund will
be determined by factors such as the
Cromwell Fund’s availability of capital and
any relevant Client-related factors and Deal-
related factors.
3 Cost of Capital Pipeline Assets may be allocated to the
Cromwell Fund with the most competitive
capital for an acquisition. Pursuant to this
approach, portfolio managers of each
Cromwell Fund may only submit one bid for
the Pipeline Asset and shall not allow the
Cromwell Funds to compete in the external
market for the Pipeline Asset.
4 Precedence A client with a significantly shorter
remaining investment period may be
allocated a transaction or where there is
similar remaining investment period
between clients, the client that commenced
a relationship earlier with the Sponsor may
be allocated the transaction.
Source: CERT, DBS Bank
Page 16
Company Focus
Cromwell European REIT
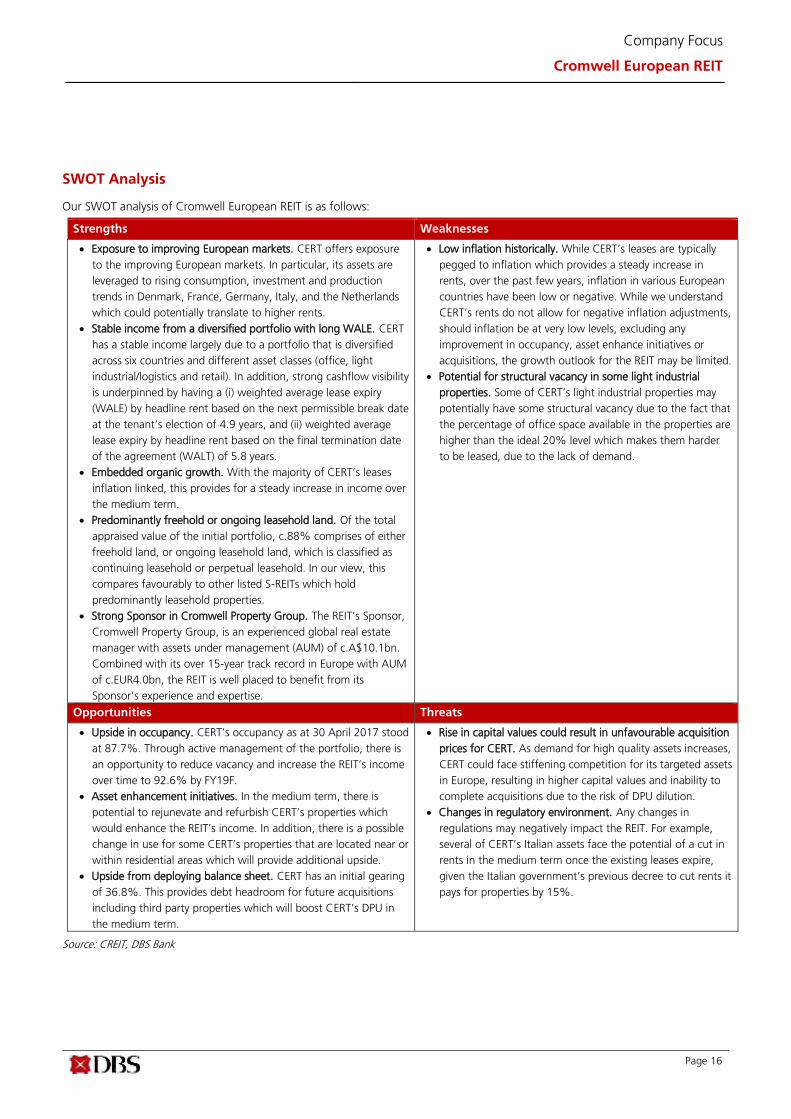
SWOT Analysis
Our SWOT analysis of Cromwell European REIT is as follows:
Strengths Weaknesses
• Exposure to improving European markets. CERT offers exposure
to the improving European markets. In particular, its assets are
leveraged to rising consumption, investment and production
trends in Denmark, France, Germany, Italy, and the Netherlands
which could potentially translate to higher rents.
• Stable income from a diversified portfolio with long WALE. CERT
has a stable income largely due to a portfolio that is diversified
across six countries and different asset classes (office, light
industrial/logistics and retail). In addition, strong cashflow visibility
is underpinned by having a (i) weighted average lease expiry
(WALE) by headline rent based on the next permissible break date
at the tenant’s election of 4.9 years, and (ii) weighted average
lease expiry by headline rent based on the final termination date
of the agreement (WALT) of 5.8 years.
• Embedded organic growth. With the majority of CERT’s leases
inflation linked, this provides for a steady increase in income over
the medium term.
• Predominantly freehold or ongoing leasehold land. Of the total
appraised value of the initial portfolio, c.88% comprises of either
freehold land, or ongoing leasehold land, which is classified as
continuing leasehold or perpetual leasehold. In our view, this
compares favourably to other listed S-REITs which hold
predominantly leasehold properties.
• Strong Sponsor in Cromwell Property Group. The REIT’s Sponsor,
Cromwell Property Group, is an experienced global real estate
manager with assets under management (AUM) of c.A$10.1bn.
Combined with its over 15-year track record in Europe with AUM
of c.EUR4.0bn, the REIT is well placed to benefit from its
Sponsor’s experience and expertise.
• Low inflation historically. While CERT’s leases are typically
pegged to inflation which provides a steady increase in
rents, over the past few years, inflation in various European
countries have been low or negative. While we understand
CERT’s rents do not allow for negative inflation adjustments,
should inflation be at very low levels, excluding any
improvement in occupancy, asset enhance initiatives or
acquisitions, the growth outlook for the REIT may be limited.
• Potential for structural vacancy in some light industrial
properties. Some of CERT’s light industrial properties may
potentially have some structural vacancy due to the fact that
the percentage of office space available in the properties are
higher than the ideal 20% level which makes them harder
to be leased, due to the lack of demand.
Opportunities Threats
• Upside in occupancy. CERT’s occupancy as at 30 April 2017 stood
at 87.7%. Through active management of the portfolio, there is
an opportunity to reduce vacancy and increase the REIT’s income
over time to 92.6% by FY19F.
• Asset enhancement initiatives. In the medium term, there is
potential to rejunevate and refurbish CERT’s properties which
would enhance the REIT’s income. In addition, there is a possible
change in use for some CERT’s properties that are located near or
within residential areas which will provide additional upside.
• Upside from deploying balance sheet. CERT has an initial gearing
of 36.8%. This provides debt headroom for future acquisitions
including third party properties which will boost CERT’s DPU in
the medium term.
• Rise in capital values could result in unfavourable acquisition
prices for CERT. As demand for high quality assets increases,
CERT could face stiffening competition for its targeted assets
in Europe, resulting in higher capital values and inability to
complete acquisitions due to the risk of DPU dilution.
• Changes in regulatory environment. Any changes in
regulations may negatively impact the REIT. For example,
several of CERT’s Italian assets face the potential of a cut in
rents in the medium term once the existing leases expire,
given the Italian government’s previous decree to cut rents it
pays for properties by 15%.
Source: CREIT, DBS Bank

Page 17
Company Focus
Cromwell European REIT
Key Risks
Country-related risks. The initial portfolio is, and future properties
will be, located in Denmark, France, Germany, Italy, and the
Netherlands. As a result, CERT’s Gross Revenue and results of
operations depend upon the performance of the Denmark,
France, Germany, Italy and the Netherlands economies. An
economic decline in Denmark, France, Germany, Italy and the
Netherlands, or the impact of a downturn in the overall national
economy in which the relevant property is located could
adversely affect CERT’s operations and future growth.
Interest rates risk. In the event that benchmark interest rates
increase over time, CERT might face higher borrowing costs
which will have a negative impact on distributions.
However, we understand approximately 75.0% to 85.0% of
the aggregate amount under the Asset Financing Facilities
will be on a fixed interest rate basis via interest rate hedging
while the remainder will be on a floating interest rate basis
with no interest rate hedging.
Risk of non-renewal and non-replacement of key tenants in
the initial portfolio. CERT’s financial condition and results of
operations and capital growth may be adversely affected by
the bankruptcy, insolvency or downturn in the businesses of
one or more of the anchor tenants or a significant number
of tenants of any of the Properties, as well as the decision
by one or more of these tenants not to renew its lease or to
terminate its lease before it expires. As at 30 April 2017, the
top 10 tenants of the initial portfolio contributed 44.2% of
the total headline rent of CERT. As such, if a major tenant or
a significant number of tenants terminate their leases or do
not renew their leases at expiry, CERT’s financial condition,
results of operations and capital growth may be adversely
affected. In addition, while some of the headline lease
periods for some of the REIT’s leases appear long, the
tenants have the option to vacate their properties before the
expiry of the lease term. Nevertheless, the weighted average
lease expiry by the next permissible break date at the
tenant’s election is still long at 4.9 years, only slightly shorter
than the weighted average lease expiry by headline rent
based on the final termination date of the agreement
(WALT) of 5.8 years.
Foreign currency risks. While the majority of the REIT’s
income and expenses are mainly denominated in Euros,
income and expenses for its Danish properties are
denominated in the Danish Krone. Nevertheless, exposure to
Denmark is small at around 5% of overall group net
property income (NPI). In addition, investors who receive
distributions in SGD are exposed to the SGD/EUR FX rate.
Properties might require significant capital expenditures
beyond the Manager’s estimates. Some of the properties in
the initial portfolio are more than 10 to 15 years old. In
order for the properties to remain competitive and relevant,
CERT may require periodic capital expenditures beyond the
Manager’s estimates at the time of acquisition for
refurbishment, renovation for improvements and
development.
Regulatory risks. Any changes in regulations or government
actions may negatively impact the REIT. For example, seven
of the REIT’s Italian assets face the potential for a cut in
rents in the medium term once the existing leases expire,
given the Italian government’s previous decree to cut rents it
pays for properties by 15%. In addition, part of Parc Des
Docks, one of the REIT’s top 10 properties, located in Paris,
may be acquired by the French government at the end of
2019 for the construction of a hospital and medical
university. We understand the French government is likely to
pay market value for the acquired land. However, to protect
the interest of unitholders, while the expropriate area is
valued at EUR64m, the REIT will only pay EUR52m upfront
and will pay up to an additional EUR12m subject to the final
compensation from the French government and costs
associated with providing rent free for tenants during the
expropriation period.

Page 18
Company Focus
Cromwell European REIT
REIT Structure
CERT is established with the principal investment strategy of
investing directly or indirectly, in a diversified portfolio of
income-producing real estate assets in Europe that are used
primarily for office, light industrial / logistics and retail
purposes, as well as real estate-related assets in connection
with the foregoing.
CERT’s initial portfolio will comprise freehold and leasehold
interests in 74 properties primarily in the office, light industrial
/ logistics and retail asset classes located in Denmark, France,
Germany, Italy, and the Netherlands with an indicative
Appraised Value of c.EUR1.4bn (S$2.3bn) as at 30 April 2017.
The initial portfolio will comprise of properties which are
acquired from third party vendors and properties which are
held by funds that are currently managed by the Sponsor
Group on behalf of investors. CERT intends to acquire the
properties held by the initial portfolio Funds either through an
acquisition of the relevant initial portfolio Fund itself or
through an acquisition of the relevant holding special purpose
companies of the initial portfolio Fund. The Italian Diversified
Portfolio Properties that are acquired from third party vendors
will be completed by way of acquiring the Property directly in
an asset acquisition.
Overview of the Holding Structure of Cromwell European REIT
Source: CERT, DBS Bank
Page 19
Company Focus
Cromwell European REIT
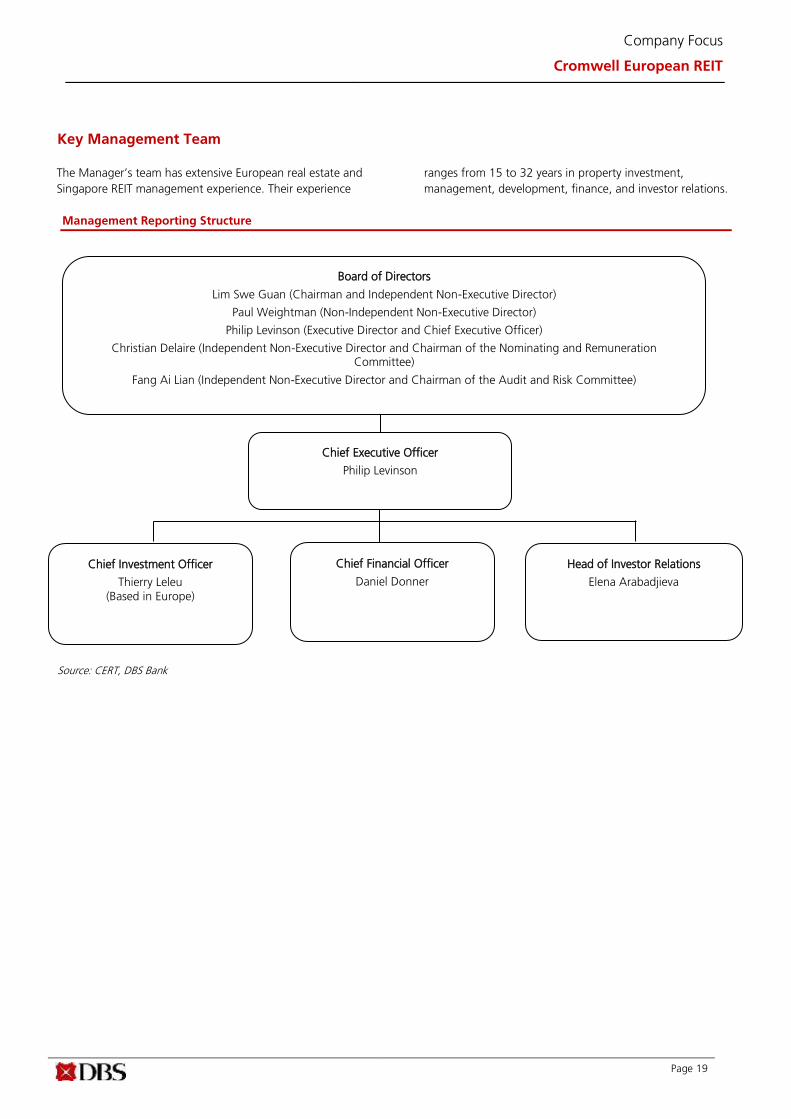
Key Management Team
The Manager’s team has extensive European real estate and
Singapore REIT management experience. Their experience
ranges from 15 to 32 years in property investment,
management, development, finance, and investor relations.
Management Reporting Structure
Source: Trustee-Manager, DBS Bank
Source: CERT, DBS Bank
Chief Executive Officer
Philip Levinson
Board of Directors
Lim Swe Guan (Chairman and Independent Non-Executive Director)
Paul Weightman (Non-Independent Non-Executive Director)
Philip Levinson (Executive Director and Chief Executive Officer)
Christian Delaire (Independent Non-Executive Director and Chairman of the Nominating and Remuneration Committee)
Fang Ai Lian (Independent Non-Executive Director and Chairman of the Audit and Risk Committee)
Head of Investor Relations
Elena Arabadjieva
Chief Investment Officer
Thierry Leleu (Based in Europe)
Chief Financial Officer
Daniel Donner
Page 20
Company Focus
Cromwell European REIT
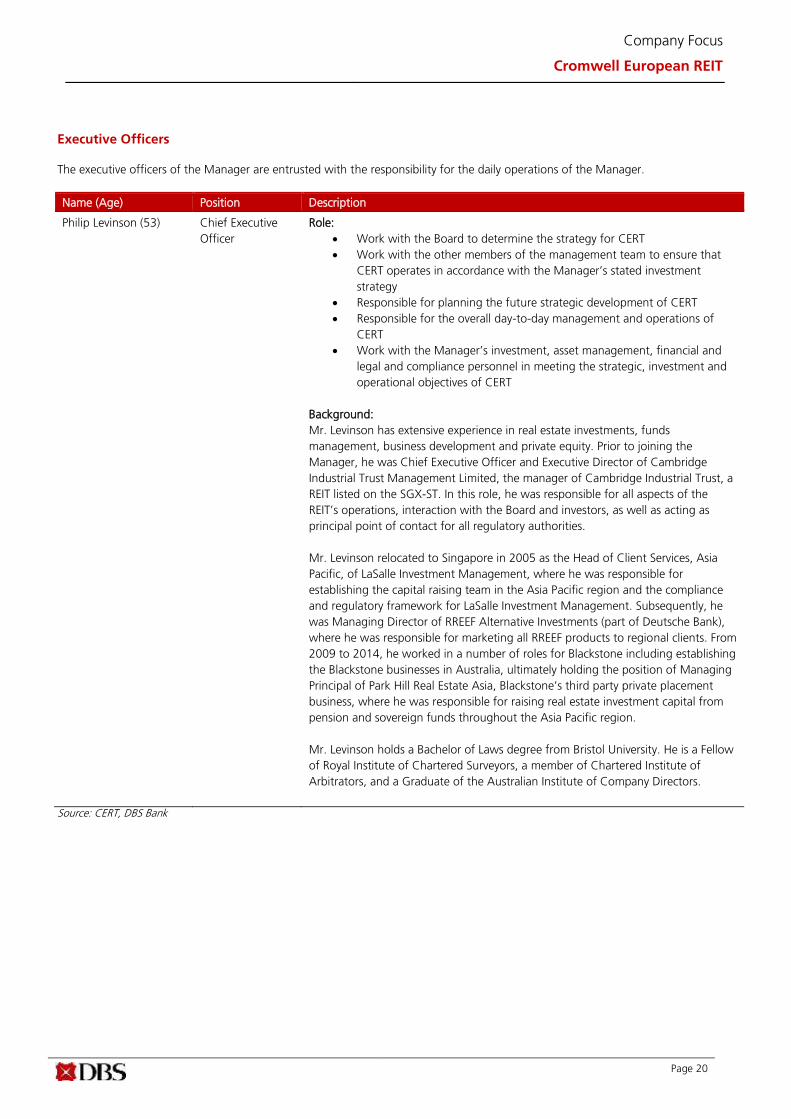
Executive Officers
The executive officers of the Manager are entrusted with the responsibility for the daily operations of the Manager.
Name (Age) Position Description
Philip Levinson (53) Chief Executive
Officer
Role:
• Work with the Board to determine the strategy for CERT
• Work with the other members of the management team to ensure that
CERT operates in accordance with the Manager’s stated investment
strategy
• Responsible for planning the future strategic development of CERT
• Responsible for the overall day-to-day management and operations of
CERT
• Work with the Manager’s investment, asset management, financial and
legal and compliance personnel in meeting the strategic, investment and
operational objectives of CERT
Background:
Mr. Levinson has extensive experience in real estate investments, funds
management, business development and private equity. Prior to joining the
Manager, he was Chief Executive Officer and Executive Director of Cambridge
Industrial Trust Management Limited, the manager of Cambridge Industrial Trust, a
REIT listed on the SGX-ST. In this role, he was responsible for all aspects of the
REIT’s operations, interaction with the Board and investors, as well as acting as
principal point of contact for all regulatory authorities.
Mr. Levinson relocated to Singapore in 2005 as the Head of Client Services, Asia
Pacific, of LaSalle Investment Management, where he was responsible for
establishing the capital raising team in the Asia Pacific region and the compliance
and regulatory framework for LaSalle Investment Management. Subsequently, he
was Managing Director of RREEF Alternative Investments (part of Deutsche Bank),
where he was responsible for marketing all RREEF products to regional clients. From
2009 to 2014, he worked in a number of roles for Blackstone including establishing
the Blackstone businesses in Australia, ultimately holding the position of Managing
Principal of Park Hill Real Estate Asia, Blackstone’s third party private placement
business, where he was responsible for raising real estate investment capital from
pension and sovereign funds throughout the Asia Pacific region.
Mr. Levinson holds a Bachelor of Laws degree from Bristol University. He is a Fellow
of Royal Institute of Chartered Surveyors, a member of Chartered Institute of
Arbitrators, and a Graduate of the Australian Institute of Company Directors.
Source: CERT, DBS Bank

Page 21
Company Focus
Cromwell European REIT
Name (Age) Position Description
Daniel Donner (42) Chief Financial
Officer (CFO)
Role:
• Work with the Chief Executive Officer and the other members of the
management team to formulate strategic plans for CERT in accordance
with the Manager’s stated investment strategy
• Responsible for applying the appropriate capital management strategy,
including tax and treasury matters, as well as finance and accounting
matters
• Oversee the implementation of CERT’s short and medium-term business
plans, fund management activities and financial condition
Background:
Mr. Donner has more than 15 years of experience in audit, corporate finance and
real estate. From 2002 to 2006, he was the Senior Manager of BDO North
Queensland.
From 2006 to 2008, he was the Financial Controller of the Hedley Group. From
2008 to 2015, he was the Director in Audit and Assurance Services of Pitcher
Partners (Brisbane), where he led statutory auditing of listed and unlisted
corporations. From 2015 to 2017, he was the Financial Controller of the Sponsor,
where he was responsible for statutory financial reporting, compliance reporting
and the management of the Finance Department of the Sponsor.
His responsibilities as Financial Controller of ASX-listed Cromwell Property Group
included being responsible for the preparation of their financial statements in
accordance with International Financial Reporting Standards (“IFRS”). In his position
as Director of Audit & Assurance Services at Pitcher Partners Brisbane, he led in the
statutory audit of listed and unlisted corporates whose financial statements were
prepared in IFRS and provided IFRS advisory services. As the group
accountant/financial controller of Hedley Group of Companies, he was part of the
IPO team and assisted in the establishment of the company’s accounting system in
IFRS.
Mr. Donner holds a Diploma in Business Administration from the Humboldt
University of Berlin. He is also a member of the Chartered Accountants Australia
and New Zealand. After making all reasonable enquiries, and to the best of their
knowledge and belief, nothing has come to the attention of the members of the
Audit and Risk Committee to cause them to believe that Mr. Donner does not have
the competence, character and integrity expected of a Chief Financial Officer of the
Manager. The Audit and Risk Committee is of the opinion that Mr. Donner is
suitable as the Chief Financial Officer on the basis of his qualifications and relevant
past experience. Mr. Donner has also confirmed that he is sufficiently familiar with
the operations of CERT and/or properties comprising the initial portfolio.
Source: CERT, DBS Bank

Page 22
Company Focus
Cromwell European REIT
Name (Age) Position Description
Thierry Leleu (49) Chief Investment
Officer
Role:
• Work with the Chief Executive Officer and the other members of the
management team to execute the investment programme of the Manager
• Responsible for identifying, researching and evaluating potential
acquisitions and related investments with a view to enhancing CERT’s
portfolio, or divestments where a property is no longer strategic, fails to
enhance the value of CERT’s portfolio or fails to be yield accretive
• In order to support these various initiatives, the investment team develops
financial models to test the financial impact of different courses of action
Background:
Prior to joining the Manager, Mr. Leleu was Head of Strategic Initiatives of
Cromwell European Holdings, where he was responsible for the identification and
execution of strategic initiatives. From 2013 to 2016, Mr. Leleu was Head of Funds
Management of Cromwell Europe, where he had overall responsibility for the
deployment of equity, the performance of funds under management and driving
the asset management teams to execute on the agreed business plans. He was also
responsible for the development and launch of new products for equity investors as
well as European research. From 2008 to 2013, Mr. Leleu was General Manager,
Europe of GE Capital Real Estate’s Global Investment Management division. His
previous roles included General Counsel for GE Capital Real Estate Europe and
Fund Director of a European private equity real estate fund. Mr. Leleu also practised
as a solicitor for more than 10 years and was a Partner at leading international law
firms.
Mr. Leleu graduated from the economic and financial section of the Institute
d’Etudes Politiques de Paris. He holds a Juris Doctor degree (J.D.) from Université
Paris, and Master of Laws from Harvard Law School.
Source: CERT, DBS Bank

Page 23
Company Focus
Cromwell European REIT
Name (Age) Position Description
Elena Arabadjieva (45) Head of Investor
Relations
Role:
• Responsible for facilitating communications and liaising with the
Unitholders
• Producing annual reports to the Unitholders
• Ensuring compliance by CERT with the reporting requirements under the
Listing Manual and the law
• Responsible for maintaining continuous disclosure and transparent
communications with the Unitholders and the market
Background:
Ms. Arabadjieva is an experienced investor relations and communications
professional with over 18 years of experience in Asia. Prior to joining the Manager,
she was the Head of Investor Relations and Corporate Communications of
Cambridge Industrial Trust Management Limited, the manager of Cambridge
Industrial Trust where she oversaw the full communications portfolio of the REIT,
which included investor and media relations, as well as stakeholders’ engagement.
From 2010 to 2015, Ms. Arabadjieva was the Director of Investor Relations of
Genting Singapore PLC, which is listed on the SGX-ST. From 2008 to 2010, she was
the Head of MICE (Meetings, Incentives, Conventions and Exhibitions) of Resorts
World Sentosa (wholly-owned subsidiary of Genting Singapore PLC) where she was
responsible for the sales, business development and partnerships for the Resorts
World Convention Centre. She was also the Director of Marketing and
Communications of Suntec Singapore International Convention and Exhibition
Centre from 2003 to 2007.
Ms. Arabadjieva holds a Master’s degree in Architecture from the University of
Architecture, Civil Engineering and Geodesy (Bulgaria) and a Masters of Business
Administration from INSEAD (France).
Source: CERT, DBS Bank

Page 24
Company Focus
Cromwell European REIT
Board of Directors of the Manager
The Board is entrusted with the responsibility for the overall management of the Manager. The following table sets forth certain information regarding the directors of the Manager:
Name (Age) Position Description
Lim Swe Guan (63) Chairman and
Non-Executive
Director
Mr. Lim Swe Guan is the Chairman and an Independent Non-Executive
Director of the Manager. He is also a member of the Nominating and
Remuneration Committee and the Audit and Risk Committee.
Mr. Lim has extensive experience in the investment management and real
estate sectors. From 1986 to 1995, he was with Jones Lang Wootton in
Sydney, where his last held position was Research Director. He joined
SUNCORP Investments, Brisbane, Australia and worked as the Portfolio
Manager of Property Funds from 1995 to 1997. From 1997 to 2008, he was
with the Government of Singapore Investment Corporation, where his last
held position was Regional Manager. From 2008 to 2011, he was the
Managing Director of GIC Real Estate. His responsibilities included being the
Regional Head of Property Investment for Australia, Japan and Southeast Asia
and the Global Head of the Corporate Investments Group that invests in
public REITs and property companies.
Mr. Lim is currently an Independent Director of Global Logistic Properties,
which has been listed on the SGX-ST, since 2010. He is also an Independent
Director of General Property Trust Group (GPT: ASX) since 2011 and Sunway
Berhad (5211.KL) since 2011. Mr. Lim is also the Chairman of the Asia Pacific
Real Estate Association (APREA), a non-profit organisation that promotes real
estate investment in the Asia Pacific region.
Mr. Lim holds a Bachelor of Science in Estate Management from the
University of Singapore and a Master of Business Administration from the
Colgate Darden Graduate School of Business, The University of Virginia. He is
also a Chartered Financial Analyst of the Institute of Chartered Financial
Analysts.
Paul Weightman (56) Non-Independent
Non-Executive
Director
Mr. Paul Weightman is a Non-Independent Non-Executive Director of the
Manager. Mr. Weightman has extensive experience in funds management,
property development and investment, financial structuring, public listings,
mergers and acquisitions and joint ventures. He is currently the Chief
Executive Officer and Managing Director of the Sponsor, and is regarded as
the key driver of the Sponsor’s success since its inception in 1998. Prior to
joining Cromwell, Mr. Weightman practised as a solicitor for more than 20
years. He was a Partner at McKenna Morris Fletcher Lawyers (Singapore) from
1989 to 1991 and Phillips Fox from 1992 to 1993, where he then acted as
Managing Partner up to 1998. He was also the founder and a Partner at
Creagh Weightman Lawyers from 1999 to 2001.
Mr. Weightman holds a Bachelor of Laws degree and a Bachelor of
Commerce degree from University of Queensland, Australia. He is also a
Fellow of the Royal Institute of Chartered Surveyors.
Source: CERT, DBS Bank
Page 25
Company Focus
Cromwell European REIT
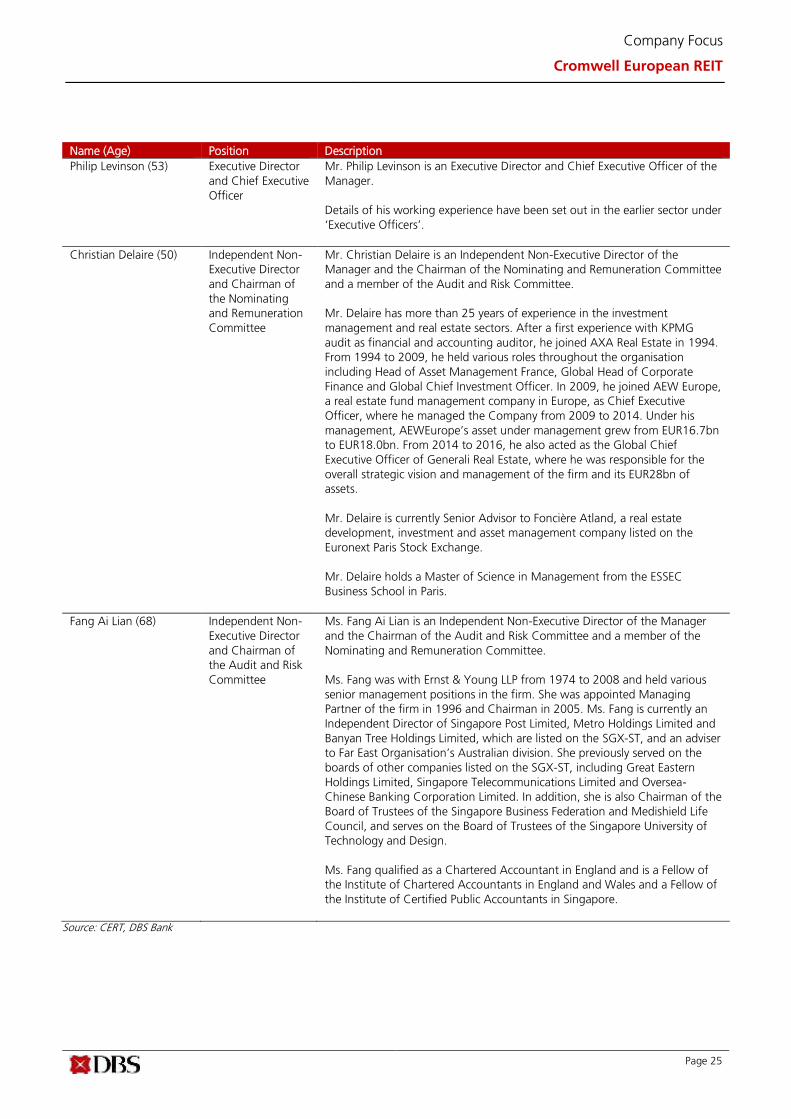
Name (Age) Position Description
Philip Levinson (53) Executive Director
and Chief Executive
Officer
Mr. Philip Levinson is an Executive Director and Chief Executive Officer of the
Manager.
Details of his working experience have been set out in the earlier sector under
‘Executive Officers’.
Christian Delaire (50) Independent Non-
Executive Director
and Chairman of
the Nominating
and Remuneration
Committee
Mr. Christian Delaire is an Independent Non-Executive Director of the
Manager and the Chairman of the Nominating and Remuneration Committee
and a member of the Audit and Risk Committee.
Mr. Delaire has more than 25 years of experience in the investment
management and real estate sectors. After a first experience with KPMG
audit as financial and accounting auditor, he joined AXA Real Estate in 1994.
From 1994 to 2009, he held various roles throughout the organisation
including Head of Asset Management France, Global Head of Corporate
Finance and Global Chief Investment Officer. In 2009, he joined AEW Europe,
a real estate fund management company in Europe, as Chief Executive
Officer, where he managed the Company from 2009 to 2014. Under his
management, AEWEurope’s asset under management grew from EUR16.7bn
to EUR18.0bn. From 2014 to 2016, he also acted as the Global Chief
Executive Officer of Generali Real Estate, where he was responsible for the
overall strategic vision and management of the firm and its EUR28bn of
assets.
Mr. Delaire is currently Senior Advisor to Foncière Atland, a real estate
development, investment and asset management company listed on the
Euronext Paris Stock Exchange.
Mr. Delaire holds a Master of Science in Management from the ESSEC
Business School in Paris.
Fang Ai Lian (68) Independent Non-
Executive Director
and Chairman of
the Audit and Risk
Committee
Ms. Fang Ai Lian is an Independent Non-Executive Director of the Manager
and the Chairman of the Audit and Risk Committee and a member of the
Nominating and Remuneration Committee.
Ms. Fang was with Ernst & Young LLP from 1974 to 2008 and held various
senior management positions in the firm. She was appointed Managing
Partner of the firm in 1996 and Chairman in 2005. Ms. Fang is currently an
Independent Director of Singapore Post Limited, Metro Holdings Limited and
Banyan Tree Holdings Limited, which are listed on the SGX-ST, and an adviser
to Far East Organisation’s Australian division. She previously served on the
boards of other companies listed on the SGX-ST, including Great Eastern
Holdings Limited, Singapore Telecommunications Limited and Oversea-
Chinese Banking Corporation Limited. In addition, she is also Chairman of the
Board of Trustees of the Singapore Business Federation and Medishield Life
Council, and serves on the Board of Trustees of the Singapore University of
Technology and Design.
Ms. Fang qualified as a Chartered Accountant in England and is a Fellow of
the Institute of Chartered Accountants in England and Wales and a Fellow of
the Institute of Certified Public Accountants in Singapore.
Source: CERT, DBS Bank

Page 26
Company Focus
Cromwell European REIT
Fee Structure Asset management fees below peers but property
management fees at the upper end of the range. The REIT
Manager of CERT will take 0.23% p.a. of the value of
deposited properties as base management fees and 25% p.a.
of the change in y-o-y DPUs as performance fees. In our view,
even though the total asset management fee is lower than the
peer average of approximately 0.44%, the REIT’s property
management fee is on the high side. The REIT pays its property
manager 0.67% p.a. of deposited properties, which is higher
than our estimate of the peer average of 0.33%. The sum of
asset management and property management fees for CERT is
around 0.93% which is higher than our estimated peer
average of 0.77%.
100% of fees in units. The REIT Manager has elected to
receive 100% of the base management fee and performance
fee in units for FY17F-FY19F. No Performance Fee is payable
for FY17.
Comparable REIT Manager Fees as a % of Total Property Value
Comparable REIT Property Management Fees as a % of Total Property Value
Comparable REIT Asset Management and Property Management Fees as a % of Total Property Value
Grouped by asset class (Mixed/Retail/Office/Industrial/Hospitality)
Source: CERT, Various S-REITs, DBS Bank estimates
0.29%0.34%
0.43% 0.44%0.50%
0.25%
0.45%
0.26%
0.53%
0.25%
0.50% 0.50%
0.70%0.63%
0.49%
0.32%
0.0%
0.1%
0.2%
0.3%
0.4%
0.5%
0.6%
0.7%
0.8%
CEREIT MAGIC MCT Suntec SGREIT CRCT CMT CCT IREIT Cache FLT AREIT MLT KDC ART AHT
Average 0.44%
0.67%
0.23%
0.29%
0.42%
0.20%
0.51%
0.31%
0.11%0.06%
0.34%
0.07%
0.33%
0.19%
0.32%
0.58%
0.93%
0.0%
0.1%
0.2%
0.3%
0.4%
0.5%
0.6%
0.7%
0.8%
0.9%
1.0%
CEREIT MAGIC MCT Suntec SGREIT CRCT CMT CCT IREIT Cache FLT AREIT MLT KDC ART AHT
Average 0.33%
0.96%
0.57%
0.72%0.86%
0.70%0.76% 0.76%
0.37%
0.59% 0.59% 0.57%
0.83%0.89%
0.95%1.07%
1.25%
0.0%
0.2%
0.4%
0.6%
0.8%
1.0%
1.2%
1.4%
CEREIT MAGIC MCT Suntec SGREIT CRCT CMT CCT IREIT Cache FLT AREIT MLT KDC ART AHT
Average 0.77%
Page 27
Company Focus
Cromwell European REIT
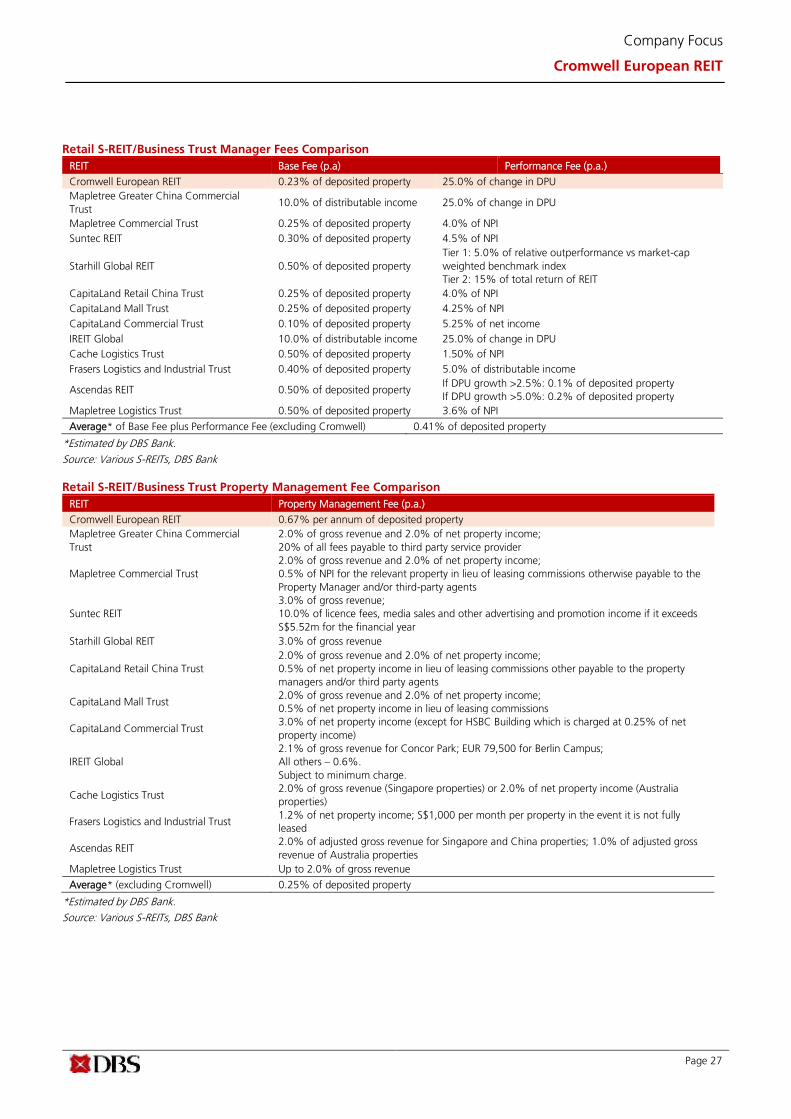
Retail S-REIT/Business Trust Manager Fees Comparison
REIT Base Fee (p.a) Performance Fee (p.a.)
Cromwell European REIT 0.23% of deposited property 25.0% of change in DPU
Mapletree Greater China Commercial
Trust 10.0% of distributable income 25.0% of change in DPU
Mapletree Commercial Trust 0.25% of deposited property 4.0% of NPI
Suntec REIT 0.30% of deposited property 4.5% of NPI
Starhill Global REIT 0.50% of deposited property
Tier 1: 5.0% of relative outperformance vs market-cap
weighted benchmark index
Tier 2: 15% of total return of REIT
CapitaLand Retail China Trust 0.25% of deposited property 4.0% of NPI
CapitaLand Mall Trust 0.25% of deposited property 4.25% of NPI
CapitaLand Commercial Trust 0.10% of deposited property 5.25% of net income
IREIT Global 10.0% of distributable income 25.0% of change in DPU
Cache Logistics Trust 0.50% of deposited property 1.50% of NPI
Frasers Logistics and Industrial Trust 0.40% of deposited property 5.0% of distributable income
Ascendas REIT 0.50% of deposited property If DPU growth >2.5%: 0.1% of deposited property
If DPU growth >5.0%: 0.2% of deposited property
Mapletree Logistics Trust 0.50% of deposited property 3.6% of NPI
Average* of Base Fee plus Performance Fee (excluding Cromwell) 0.41% of deposited property
*Estimated by DBS Bank.
Source: Various S-REITs, DBS Bank
Retail S-REIT/Business Trust Property Management Fee Comparison
REIT Property Management Fee (p.a.)
Cromwell European REIT 0.67% per annum of deposited property
Mapletree Greater China Commercial
Trust
2.0% of gross revenue and 2.0% of net property income;
20% of all fees payable to third party service provider
Mapletree Commercial Trust
2.0% of gross revenue and 2.0% of net property income;
0.5% of NPI for the relevant property in lieu of leasing commissions otherwise payable to the
Property Manager and/or third-party agents
Suntec REIT
3.0% of gross revenue;
10.0% of licence fees, media sales and other advertising and promotion income if it exceeds
S$5.52m for the financial year
Starhill Global REIT 3.0% of gross revenue
CapitaLand Retail China Trust
2.0% of gross revenue and 2.0% of net property income;
0.5% of net property income in lieu of leasing commissions other payable to the property
managers and/or third party agents
CapitaLand Mall Trust 2.0% of gross revenue and 2.0% of net property income;
0.5% of net property income in lieu of leasing commissions
CapitaLand Commercial Trust 3.0% of net property income (except for HSBC Building which is charged at 0.25% of net
property income)
IREIT Global
2.1% of gross revenue for Concor Park; EUR 79,500 for Berlin Campus;
All others – 0.6%.
Subject to minimum charge.
Cache Logistics Trust 2.0% of gross revenue (Singapore properties) or 2.0% of net property income (Australia
properties)
Frasers Logistics and Industrial Trust 1.2% of net property income; S$1,000 per month per property in the event it is not fully
leased
Ascendas REIT 2.0% of adjusted gross revenue for Singapore and China properties; 1.0% of adjusted gross
revenue of Australia properties
Mapletree Logistics Trust Up to 2.0% of gross revenue
Average* (excluding Cromwell) 0.25% of deposited property
*Estimated by DBS Bank.
Source: Various S-REITs, DBS Bank
Page 28
Company Focus
Cromwell European REIT
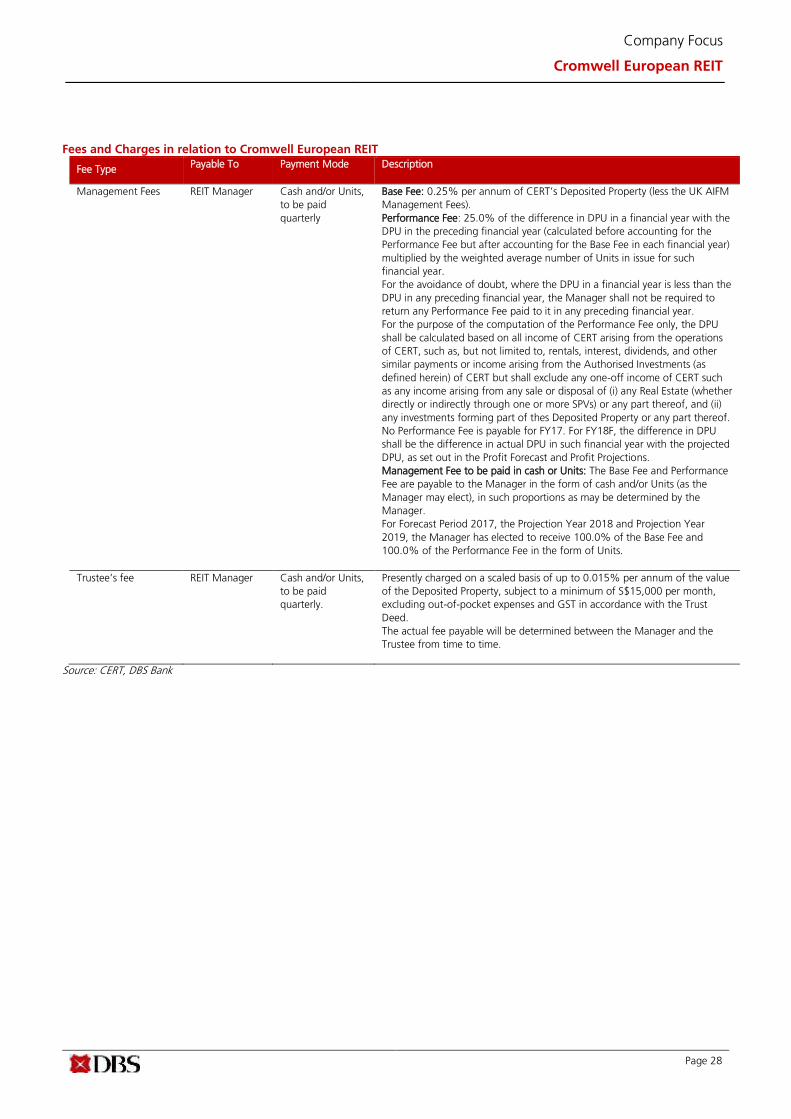
Fees and Charges in relation to Cromwell European REIT
Fee Type Payable To Payment Mode Description
Management Fees REIT Manager Cash and/or Units,
to be paid
quarterly
Base Fee: 0.25% per annum of CERT’s Deposited Property (less the UK AIFM
Management Fees).
Performance Fee: 25.0% of the difference in DPU in a financial year with the
DPU in the preceding financial year (calculated before accounting for the
Performance Fee but after accounting for the Base Fee in each financial year)
multiplied by the weighted average number of Units in issue for such
financial year.
For the avoidance of doubt, where the DPU in a financial year is less than the
DPU in any preceding financial year, the Manager shall not be required to
return any Performance Fee paid to it in any preceding financial year.
For the purpose of the computation of the Performance Fee only, the DPU
shall be calculated based on all income of CERT arising from the operations
of CERT, such as, but not limited to, rentals, interest, dividends, and other
similar payments or income arising from the Authorised Investments (as
defined herein) of CERT but shall exclude any one-off income of CERT such
as any income arising from any sale or disposal of (i) any Real Estate (whether
directly or indirectly through one or more SPVs) or any part thereof, and (ii)
any investments forming part of thes Deposited Property or any part thereof.
No Performance Fee is payable for FY17. For FY18F, the difference in DPU
shall be the difference in actual DPU in such financial year with the projected
DPU, as set out in the Profit Forecast and Profit Projections.
Management Fee to be paid in cash or Units: The Base Fee and Performance
Fee are payable to the Manager in the form of cash and/or Units (as the
Manager may elect), in such proportions as may be determined by the
Manager.
For Forecast Period 2017, the Projection Year 2018 and Projection Year
2019, the Manager has elected to receive 100.0% of the Base Fee and
100.0% of the Performance Fee in the form of Units.
Trustee’s fee REIT Manager Cash and/or Units,
to be paid
quarterly.
Presently charged on a scaled basis of up to 0.015% per annum of the value
of the Deposited Property, subject to a minimum of S$15,000 per month,
excluding out-of-pocket expenses and GST in accordance with the Trust
Deed.
The actual fee payable will be determined between the Manager and the
Trustee from time to time.
Source: CERT, DBS Bank
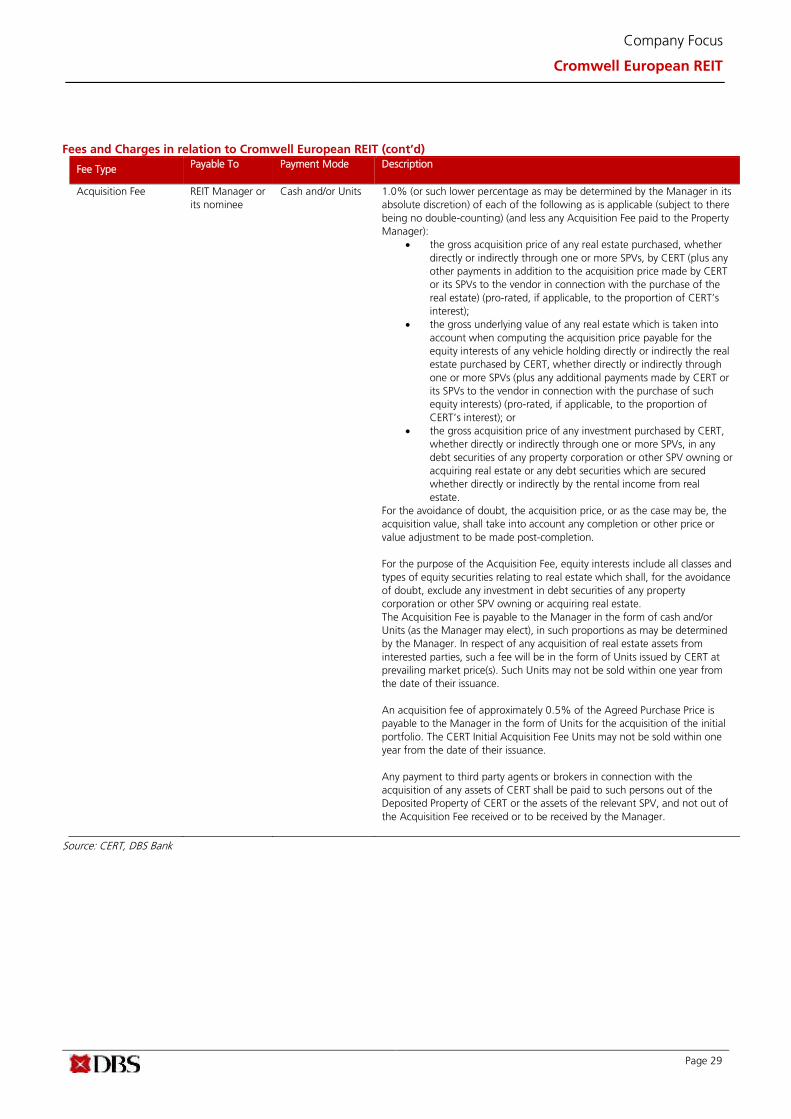
Page 29
Company Focus
Cromwell European REIT
Fees and Charges in relation to Cromwell European REIT (cont’d)
Fee Type Payable To Payment Mode Description
Acquisition Fee REIT Manager or
its nominee
Cash and/or Units 1.0% (or such lower percentage as may be determined by the Manager in its
absolute discretion) of each of the following as is applicable (subject to there
being no double-counting) (and less any Acquisition Fee paid to the Property
Manager):
• the gross acquisition price of any real estate purchased, whether
directly or indirectly through one or more SPVs, by CERT (plus any
other payments in addition to the acquisition price made by CERT
or its SPVs to the vendor in connection with the purchase of the
real estate) (pro-rated, if applicable, to the proportion of CERT’s
interest);
• the gross underlying value of any real estate which is taken into
account when computing the acquisition price payable for the
equity interests of any vehicle holding directly or indirectly the real
estate purchased by CERT, whether directly or indirectly through
one or more SPVs (plus any additional payments made by CERT or
its SPVs to the vendor in connection with the purchase of such
equity interests) (pro-rated, if applicable, to the proportion of
CERT’s interest); or
• the gross acquisition price of any investment purchased by CERT,
whether directly or indirectly through one or more SPVs, in any
debt securities of any property corporation or other SPV owning or
acquiring real estate or any debt securities which are secured
whether directly or indirectly by the rental income from real
estate.
For the avoidance of doubt, the acquisition price, or as the case may be, the
acquisition value, shall take into account any completion or other price or
value adjustment to be made post-completion.
For the purpose of the Acquisition Fee, equity interests include all classes and
types of equity securities relating to real estate which shall, for the avoidance
of doubt, exclude any investment in debt securities of any property
corporation or other SPV owning or acquiring real estate.
The Acquisition Fee is payable to the Manager in the form of cash and/or
Units (as the Manager may elect), in such proportions as may be determined
by the Manager. In respect of any acquisition of real estate assets from
interested parties, such a fee will be in the form of Units issued by CERT at
prevailing market price(s). Such Units may not be sold within one year from
the date of their issuance.
An acquisition fee of approximately 0.5% of the Agreed Purchase Price is
payable to the Manager in the form of Units for the acquisition of the initial
portfolio. The CERT Initial Acquisition Fee Units may not be sold within one
year from the date of their issuance.
Any payment to third party agents or brokers in connection with the
acquisition of any assets of CERT shall be paid to such persons out of the
Deposited Property of CERT or the assets of the relevant SPV, and not out of
the Acquisition Fee received or to be received by the Manager.
Source: CERT, DBS Bank
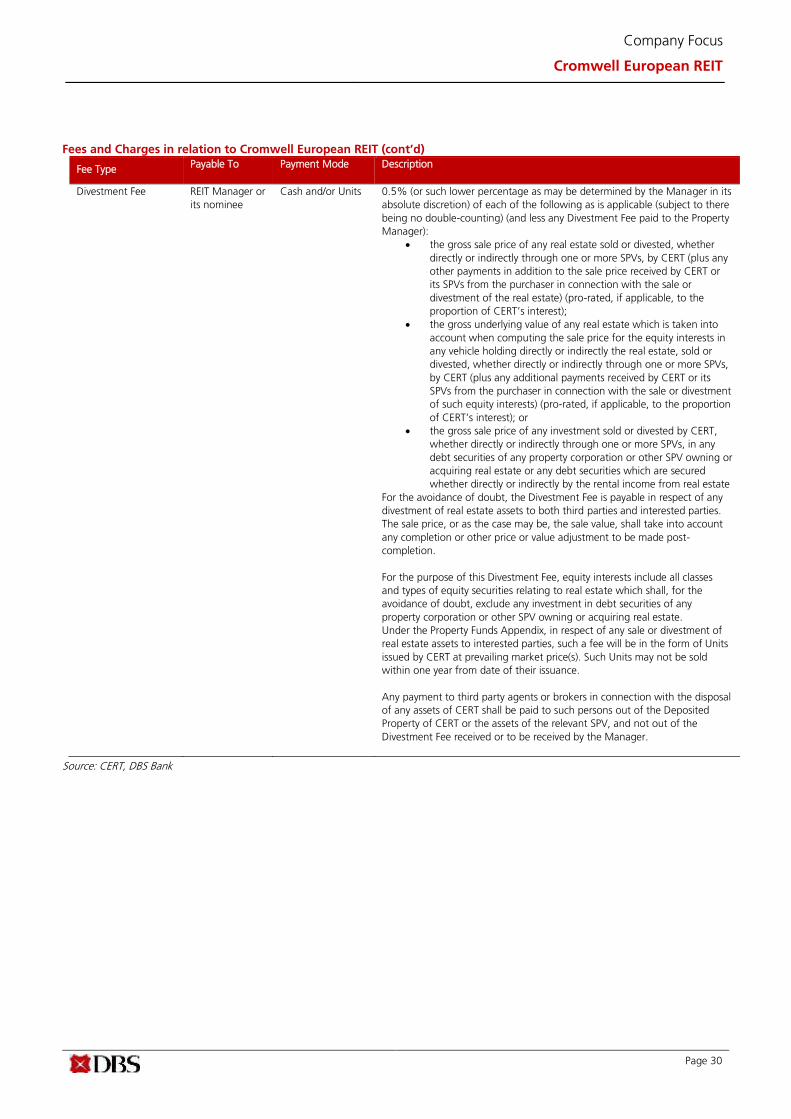
Page 30
Company Focus
Cromwell European REIT
Fees and Charges in relation to Cromwell European REIT (cont’d)
Fee Type Payable To Payment Mode Description
Divestment Fee REIT Manager or
its nominee
Cash and/or Units 0.5% (or such lower percentage as may be determined by the Manager in its
absolute discretion) of each of the following as is applicable (subject to there
being no double-counting) (and less any Divestment Fee paid to the Property
Manager):
• the gross sale price of any real estate sold or divested, whether
directly or indirectly through one or more SPVs, by CERT (plus any
other payments in addition to the sale price received by CERT or
its SPVs from the purchaser in connection with the sale or
divestment of the real estate) (pro-rated, if applicable, to the
proportion of CERT’s interest);
• the gross underlying value of any real estate which is taken into
account when computing the sale price for the equity interests in
any vehicle holding directly or indirectly the real estate, sold or
divested, whether directly or indirectly through one or more SPVs,
by CERT (plus any additional payments received by CERT or its
SPVs from the purchaser in connection with the sale or divestment
of such equity interests) (pro-rated, if applicable, to the proportion
of CERT’s interest); or
• the gross sale price of any investment sold or divested by CERT,
whether directly or indirectly through one or more SPVs, in any
debt securities of any property corporation or other SPV owning or
acquiring real estate or any debt securities which are secured
whether directly or indirectly by the rental income from real estate
For the avoidance of doubt, the Divestment Fee is payable in respect of any
divestment of real estate assets to both third parties and interested parties.
The sale price, or as the case may be, the sale value, shall take into account
any completion or other price or value adjustment to be made post-
completion.
For the purpose of this Divestment Fee, equity interests include all classes
and types of equity securities relating to real estate which shall, for the
avoidance of doubt, exclude any investment in debt securities of any
property corporation or other SPV owning or acquiring real estate.
Under the Property Funds Appendix, in respect of any sale or divestment of
real estate assets to interested parties, such a fee will be in the form of Units
issued by CERT at prevailing market price(s). Such Units may not be sold
within one year from date of their issuance.
Any payment to third party agents or brokers in connection with the disposal
of any assets of CERT shall be paid to such persons out of the Deposited
Property of CERT or the assets of the relevant SPV, and not out of the
Divestment Fee received or to be received by the Manager.
Source: CERT, DBS Bank
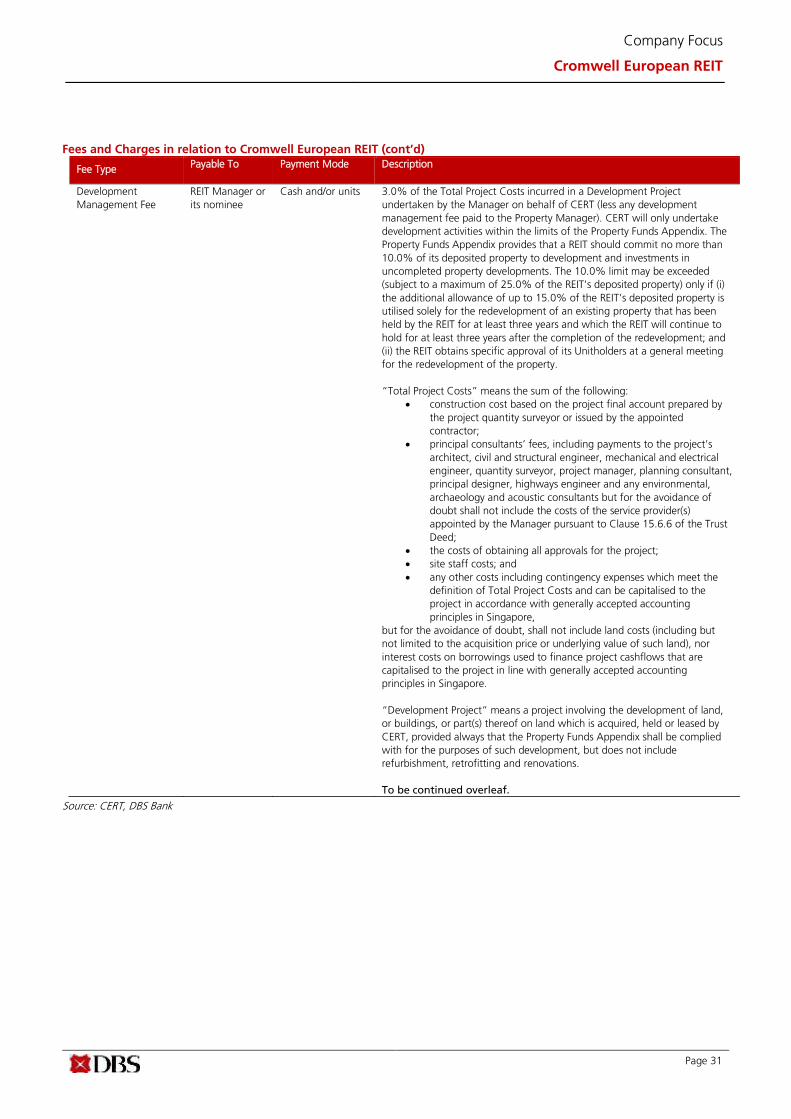
Page 31
Company Focus
Cromwell European REIT
Fees and Charges in relation to Cromwell European REIT (cont’d)
Fee Type Payable To Payment Mode Description
Development
Management Fee
REIT Manager or
its nominee
Cash and/or units 3.0% of the Total Project Costs incurred in a Development Project
undertaken by the Manager on behalf of CERT (less any development
management fee paid to the Property Manager). CERT will only undertake
development activities within the limits of the Property Funds Appendix. The
Property Funds Appendix provides that a REIT should commit no more than
10.0% of its deposited property to development and investments in
uncompleted property developments. The 10.0% limit may be exceeded
(subject to a maximum of 25.0% of the REIT’s deposited property) only if (i)
the additional allowance of up to 15.0% of the REIT’s deposited property is
utilised solely for the redevelopment of an existing property that has been
held by the REIT for at least three years and which the REIT will continue to
hold for at least three years after the completion of the redevelopment; and
(ii) the REIT obtains specific approval of its Unitholders at a general meeting
for the redevelopment of the property.
“Total Project Costs” means the sum of the following:
• construction cost based on the project final account prepared by
the project quantity surveyor or issued by the appointed
contractor;
• principal consultants’ fees, including payments to the project’s
architect, civil and structural engineer, mechanical and electrical
engineer, quantity surveyor, project manager, planning consultant,
principal designer, highways engineer and any environmental,
archaeology and acoustic consultants but for the avoidance of
doubt shall not include the costs of the service provider(s)
appointed by the Manager pursuant to Clause 15.6.6 of the Trust
Deed;
• the costs of obtaining all approvals for the project;
• site staff costs; and
• any other costs including contingency expenses which meet the
definition of Total Project Costs and can be capitalised to the
project in accordance with generally accepted accounting
principles in Singapore,
but for the avoidance of doubt, shall not include land costs (including but
not limited to the acquisition price or underlying value of such land), nor
interest costs on borrowings used to finance project cashflows that are
capitalised to the project in line with generally accepted accounting
principles in Singapore.
“Development Project” means a project involving the development of land,
or buildings, or part(s) thereof on land which is acquired, held or leased by
CERT, provided always that the Property Funds Appendix shall be complied
with for the purposes of such development, but does not include
refurbishment, retrofitting and renovations.
To be continued overleaf.
Source: CERT, DBS Bank

Page 32
Company Focus
Cromwell European REIT
Fees and Charges in relation to Cromwell European REIT (cont’d)
Fee Type Payable To Payment Mode Description
Development
Management Fee
(cont’d)
REIT Manager or
its nominee
Cash and/or units Where the estimated Total Project Costs are greater than S$200.0m, the
Trustee and the Manager’s independent directors will first review and
approve the quantum of the Development Management Fee, whereupon the
Manager may be directed by the independent directors to reduce the
development management fee. Further, in cases where the market pricing
for comparable services is, in the Manager’s view, materially lower than the
development management fee, the independent directors of the Manager
shall have the right to direct a reduction of the Development Management
Fee to less than 3.0%of the Total Project Costs.
The Development Management Fee is payable to the Manager in the form of
cash and/or Units (as the Manager may elect in its sole discretion). For the
avoidance of doubt, in respect of a Development Project, there will be no
double counting of fees and the Manager will not be entitled to concurrently
receive both the development management fee as well as the acquisition
fee. As land costs will not be included in the computation of Total Project
Costs, the Manager shall be entitled to receive an Acquisition Fee on the
land costs.
Acquisition Fee Property
Manager
Cash and/or Units The Property Manager is entitled to an Acquisition Fee computed in the same
manner as the Acquisition Fee payable to the Manager, provided that any
Acquisition Fee paid to the Property Manager will reduce the Acquisition Fee
paid to the Manager.
For the avoidance of doubt, the aggregate amount of the Acquisition Fee
paid to both the Manager and the Property Manager shall not exceed the
amount stipulated under Clause 15.2.1 of the Trust Deed that is payable to
the Manager.
The Manager and the Property Manager shall agree in good faith on the split
of Acquisition Fee payable to the Manager and the Property Manager.
The Acquisition Fee is payable to the Property Manager in the form of cash
and/or Units (as may be agreed between the Manager and the Property
Manager from time to time, and in the event that there is no such
agreement, the payment shall be in the form of cash). In respect of any
acquisition of real estate assets from interested parties, such a fee will be in
the form of Units issued at prevailing market price(s). Such Units may not be
sold within one year from the date of their issuance.
Source: CERT, DBS Bank

Page 33
Company Focus
Cromwell European REIT
Fees and Charges in relation to Cromwell European REIT (cont’d)
Fee Type Payable To Payment Mode Description
Divestment Fee Property
Manager
Cash and/or Units The Property Manager is entitled to a Divestment Fee computed in the same
manner as the Divestment Fee payable to the Manager, provided that any
Divestment Fee paid to the Property Manager will reduce the Divestment Fee
paid to the Manager.
For the avoidance of doubt, the aggregate amount of the Divestment Fee
paid to both the Manager and the Property Manager shall not exceed the
amount stipulated under Clause 15.2.1 of the Trust Deed that is payable to
the Manager.
The Manager and and the Property Manager shall agree in good faith on the
split of Divestment Fee payable to the Manager and the Property Manager.
The Divestment Fee is payable to the Property Manager in the form of cash
and/or Units (as may be agreed between the Manager and the Property
Manager from time to time, and in the event that there is no such
agreement, the payment shall be in the form of cash). In respect of any
divestment of real estate assets from interested parties, such a fee will be in
the form of Units issued at prevailing market price(s). Such Units may not be
sold within one year from the date of their issuance.
Development Fee Property
Manager
Cash and/or Units The Property Manager is entitled to a Development Management Fee
computed in the same manner as the Development Management Fee
payable to the Manager, provided that any Development Management Fee
paid to the Property Manager will reduce the Development Management Fee
paid to the Manager.
The Manager and the Property Manager shall agree in good faith on the split
of Development Management Fee payable to the Manager and the Property
Manager.
For the avoidance of doubt, in the event where the estimated Total Project
Costs are greater than S$200.0m and the independent directors of the
Manager have directed a reduction of the Development Management Fee
to less than 3.0%, the total Development Management Fee paid to the
Manager and the Property Manager shall not exceed such amount.
The Development Management Fee is payable to the Property Manager in
the form of cash and/or Units (as may be agreed between the Manager and
the Property Manager from time to time, and in the event that there is no
such agreement, the payment shall be in the form of cash).
Property and Portfolio
Management Fee
Property
Manager
Cash and/or Units 0.67% per annum of the Deposited Property (excluding the value of any
Property which is not managed by the Property Manager (and the Individual
Property Manager)).
The Property and Portfolio Management Fee is payable to the Property
Manager in the form of cash and/or Units (as may be agreed between the
Manager and the Property Manager from time to time, and in the event that
there is no such agreement, the payment shall be in the form of cash).
For the Forecast Period 2017, the Projection Year 2018 and the Projection
Year 2019, the Property Manager has elected to receive 40.0% of the
Property and Portfolio Management Fee in the form of Units.
Source: CERT, DBS Bank

Page 34
Company Focus
Cromwell European REIT
Fees and Charges in relation to Cromwell European REIT (cont’d)
Fee Type Payable To Payment Mode Description
Leasing Fee Property
Manager
Cash and/or Units The Property Manager is entitled to the following leasing fees:
a) (in relation to new leases secured by the Property Manager) 5.0%
of the Net Rent Receivable (capped at 20% of the Average Rent
Receivable);
b) (in relation to renewal of leases secured by the Property Manager)
2.5% of the Net Rent Receivable (capped at 10% of the Average
Rent Receivable); and
c) (in relation to leases in respect of which fees are owed to a third
party agent) 1.0% of the Net Rent Receivable, (capped at 4% of
the Average Rent Receivable).
“Average Rent Receivable” means the average yearly Net Rent Receivable.
“Net Rent Receivable” means the aggregate gross rent payable over the full
terms of the lease, less any incentives and/or rent-frees (which are to be
deducted on a straight line basis over the full term of the lease).
The Leasing Fee is payable to the Property Manager in the form of cash
and/or Units (as may be agreed between the Manager and the Property
Manager from time to time, and in the event that there is no such
agreement, the payment shall be in the form of cash).
Project Management
Fee
Property
Manager
Cash and/or Units 5.0% of the construction cost for any refurbishment, retrofitting, addition
and alteration or renovation works to the relevant property.
The Project Management Fee is payable to the Property Manager in the form
of cash and/or Units (as may be agreed between the Manager and the
Property Manager from time to time, and in the event that there is no such
agreement, the payment shall be in the form of cash).
Reimbursables Property
Manager
Cash The Property Manager is also entitled to the following reimbursements:
• Reimbursable Employment Costs: The Intermediate Entities or the
SPV Owner (each as defined below) shall reimburse the salary,
allowances, levies and all other expenses involved for the
employment of the employees of the Individual Property Manager
(approved by the Manager) engaged solely for site supervision of
the Property (such costs are part of the Annual Business Plan and
Budget approved by the Intermediate Entities or the SPV Owner
on the recommendation of the Manager or otherwise agreed
between the Intermediate Entities or the SPV Owner and the
Manager).
• Reimbursable Advertising Costs: The Intermediate Entities or the
SPV Owner shall reimburse the Individual Property Manager the
costs in relation to the promotion of leasing for or sales of the
Property provided that prior approval of the Manager for such cost
incurred has been obtained.
• Project Management Expenses: In connection with the provision of
project management services, the Intermediate Entities or the SPV
Owner shall reimburse the Individual Property Manager for certain
costs provided that such costs shall have been pre-approved by
the SPV Owner, on the recommendation of the Manager and in
accordance with the project budget.
UK AIFM
Management Fee
UK AIFM Cash The UK AIFM is entitled to a management fee of 0.28% of the gross asset
value per annum of the Italian AIFs (being Cromwell Europa 1 and Cromwell
Europa 2).
Source: CERT, DBS Bank

Page 35
Company Focus
Cromwell European REIT
Financials – Income Statement
Steady improvement on the back of increases in occupancy
and embedded rental escalations. We project CERT to deliver
gross revenue and NPI compound annual growth rate (CAGR)
of 2.3% and 5.0% between FY17F (annualised) and FY19F
respectively. The upturn is largely on the back of an
improvement in occupancy across all segments. This is on the
assumption that portfolio occupancy increases from 88.8% in
FY17F to 92.6% by FY19F. In addition, CERT’s should benefit
from the CPI-linked rents (estimated CPI of between 0.75% to
1.9%). The faster growth in NPI compared to revenues is due
to fixed cost leverage from higher occupancies as well as
reduction in non-recoverable expenses. We estimate this will
also result in overall NPI margins improving from 63.2% in
FY17 to 66.6% in FY19.
Management fees – pegged to distributable income. We
believe base fees and performance fees of CERT are structured
to motivate the Manager to grow DPU, ensuring that interests
of the Manager are well aligned with that of unitholders.
Annual base fees are paid based on 0.23% of the value of
CERT’s properties. In addition, the Manager will be paid an
annual performance fee that is based on 25% of the
difference in DPU in a financial year and DPU in the preceding
financial year. No Performance Fee is payable for FY17. For
FY18, the performance fee will be based on 25% of the
difference between actual DPU and CERT’s own FY18 DPU
projection. The Manager has elected to receive 100% of the
base and performance fees for FY17-19F in units.
2.1% all-in cost of borrowings. We understand CERT will
secure various debt facilities with an estimated average all-in
interest rate of around 2.1% per annum. Approximately
75.0% to 85.0% of the aggregate amount under the Asset
Financing Facilities will be on a fixed interest rate basis with
interest rate hedging while the remainder will be on a floating
interest rate basis with no interest rate hedging.
Non-tax deductible expenses. Largely consists of management
fees payable to the Manager (100% of fees paid in units in
FY17-19F), amortisation of debt issuance costs, amortisation
of tenant incentive and non-cash items.
Distribution income – 100% till FY19F. The Manager intends
to pay 100% of distributable income till FY19. Thereafter, the
REIT will have a distribution payout of at least 90% of its
distributable income. Distributions will be made on a semi-
annual basis.
Contribution to Gross Revenue (FY17-19F)*
*FY17F annualised based on December 2017 numbers. CERT has yet
to release its FY17F results
Source: DBS Bank estimates Contribution to NPI (FY17-19F)*
*FY17F annualised based on December 2017 numbers. CERT has yet
to release its FY17F results
Source: DBS Bank estimates
Steady increase in DPU
*FY17F annualised based on December 2017 numbers. CERT has yet
to release its FY17F results
Source: DBS Bank estimates
Improving occupancy
Segment 30-Apr-17 FY17F* FY18F FY19F
Office 94.8% 95.9% 97.4% 99.5%
Industrial/Logistics 82.9% 84.2% 85.6% 89.0%
Other 100.0% 100.0% 100.0% 100.0%
Portfolio 87.7% 88.8% 90.0% 92.6%
Source: CERT, DBS Bank estimates
46.4 48.4 50.5
59.8 59.9 61.3
2.4 2.4 2.412.7 12.7 12.8
0
20
40
60
80
100
120
140
FY17F annualised FY18F FY19F
Office Industrial/Logistics Retail Other
EUR'm 2.3% CAGR
155.0 159.6 164.5
30.9 33.1 35.4
34.8 36.4 37.9
1.71.7
1.79.29.4
9.5
0
10
20
30
40
50
60
70
80
90
FY17F annualised FY18F FY19F
Office Industrial/Logistics Retail Other
EUR'm 5.0% CAGR
98.4 102.6 107.0
3.9
4.0
4.1
4.2
4.3
4.4
4.5
FY17F annualised FY18F FY19F
4.0% CAGR
EUR'cts

Page 36
Company Focus
Cromwell European REIT
Revenue segmentals*
FY Dec (EUR’m) FY17F** FY18F FY19F
Gross Revenue
Office
- Netherlands 2.5 30.5 32.3
- Italy 1.4 17.9 18.2
Office Subtotal 3.9 48.4 50.5
Industrials / Logistics
- France 2.7 32.8 33.1
- Germany 0.8 9.3 10.0
- Denmark 0.8 10.1 10.5
- Netherlands 0.5 6.6 6.6
- Italy 0.1 1.1 1.1
Industrials / Logistics Subtotal 5.0 59.9 61.3
Others 1.3 15.1 15.3
Total 10.1 123.4 127.0
* All numbers are rounded up to the nearest decimal.
** FY17 based on the period 1 December to 31 December 2017. CERT has yet to release its FY17F results Source: DBS Bank estimates
NPI segmentals* FY Dec (EUR’m) FY17F** FY18F FY19F
NPI
Office
- Netherlands 1.7 20.5 22.2
- Italy 0.9 12.6 13.2
Office Subtotal 2.6 33.1 35.4
Industrials / Logistics
- France 1.5 19.0 19.8
- Germany 0.4 6.1 6.5
- Denmark 0.5 5.8 6.1
- Netherlands 0.4 4.8 4.7
- Italy 0.1 0.8 0.8
Industrials / Logistics Subtotal 2.9 36.4 37.9
Others 0.9 11.1 11.2
Total 6.4 80.6 84.5
* All numbers are rounded up to the nearest decimal
** FY17 is for the period 1 December to 31 December 2017. CERT has yet to release its FY17F results Source: DBS Bank estimates

Page 37
Company Focus
Cromwell European REIT
Income Statement*
FY Dec (EUR’m) FY17F** FY18F FY19F
Gross Revenue*** 10.1 123.4 127.0
Property Expenses (3.7) (42.9) (42.5)
Net Property Income 6.4 80.6 84.5
Other Operating Income
Manager's management fee (0.3) (3.2) (3.8)
Trust Expenses (0.0) (0.2) (0.2)
Others (0.3) (2.3) (2.3)
Other Expenses (0.5) (5.7) (6.3)
EBIT 5.9 74.9 78.3
Net Interest Expense (0.9) (10.0) (10.1)
Share of Associate/JV Income - - -
Net Income 5.0 64.9 68.2
Tax (0.4) (5.6) (6.4)
Fair Value Gains/(Losses)
Net Income After Tax (1.8) 59.4 61.7
Total Return (1.8) 59.4 61.7
Non-tax Deductible Items 7.1 8.7 8.5
Distributable Income 5.3 68.0 70.2
Revenue Growth (%) nm nm 2.9%
NPI Growth (%) nm nm 4.9%
Distributable Income Growth (%) nm nm 3.2%
Distribution Payout Ratio (%) 100% 100% 100%
NPI Margin 63.2% 65.3% 66.6%
EBIT Margin 57.9% 60.7% 61.6%
* All numbers are rounded up to the nearest decimal. For FY17F, FY18F and FY19F, the projections are DBS Bank estimates.
** FY17 is for the period 1 December to 31 December 2017. CERT has yet to release its FY17F results
*** Includes rental guarantee for Milano Piazza Affari property for three years and covers an amount equivalent to the full rental achievable at the
property. This is equivalent to EUR3.54m annually less the effective rental income for the property.
Source: DBS Bank estimates

Page 38
Company Focus
Cromwell European REIT
Financials – Balance Sheet
Initial property value of EUR1.3bn. The appraised value of the
initial portfolio consisting of 74 properties is c.EUR1.3bn as at
30 April 2017. The largest exposure is in the office sector
(47.4% of the total portfolio), followed by light
industrial/logistics (42.1%), and others (10.5%). In terms of
geographical mix, the Netherlands, Italy, and France provide
the three largest exposures at 34.5%, 29.9% and 22.1% of
the initial portfolio respectively. Germany and Denmark only
contribute 7.7% and 5.8% by appraised value.
Initial aggregate leverage of c.37%. CERT will have an initial
aggregate leverage ratio of c.37%. Its initial gross borrowings
will be EUR487m (including debt held under JVs). The
weighted average debt maturity is c.4.0 years. We expect
aggregate leverage to rise over the next couple of years as we
assume CERT debt funds its capital expenditure and there are
no positive revaluations of its properties.
Interest costs. We understand Cromwell European REIT will
secure various debt facilities with an estimated average all-in
interest rate of around 2.1% per annum.
Asset Breakdown of Initial Portfolio by Asset Class
Source: CERT, DBS Bank
Balance Sheet*
FYE Dec (EUR’m) Initial balance sheet FY17F FY18F FY19F
Investment Properties 1,310.5*** 1,306.3 1,325.2 1,344.4
Cash & Cash Equivalents 39.3 45.7 45.2 45.2
Receivables 16.7 16.7 17.6 18.1
Other Current Assets 0.0 0.0 0.0 0.0
Other Long Term Assets 8.3 8.3 8.3 8.3
Total Assets 1,374.9 1,377.1 1,396.3 1,416.1
Short Term Debt 0.0 0.0 0.0 0.0
Other Current Liabilities 23.4 23.4 23.4 23.4
Trade Payables 18.6 18.6 19.0 19.5
Long Term Debt 487.3 489.5 508.3 527.5
Other LT Liabilities 8.5 8.5 8.5 8.5
Unitholders’ funds 837.2 837.2 837.2 837.2
Total Funds & Liabilities 1,374.9 1,377.1 1,396.3 1,416.1
Net Debt/(Cash) 448.0 443.8 463.1 482.3
Leverage Analysis
Aggregate leverage ** 37% 37% 38% 39%
* All numbers are rounded up to the nearest decimal. For FY18F and FY19F, the projections are DBS Bank estimates. Proforma FY17 numbers are
based on Manager’s numbers.
** Aggregate leverage includes the deferred consideration of EUR12m which will be retained by the REIT in respect of Parc des Docks. *** Includes fair value loss arising from transaction costs on the acquisition of the initial portfolio and Acquisition Fee payable to the Manager in units.
Source: CERT, DBS Bank estimates
47.4%
42.1%
10.5%
Office Light Industrial/Logistics Others
By Appraised Value
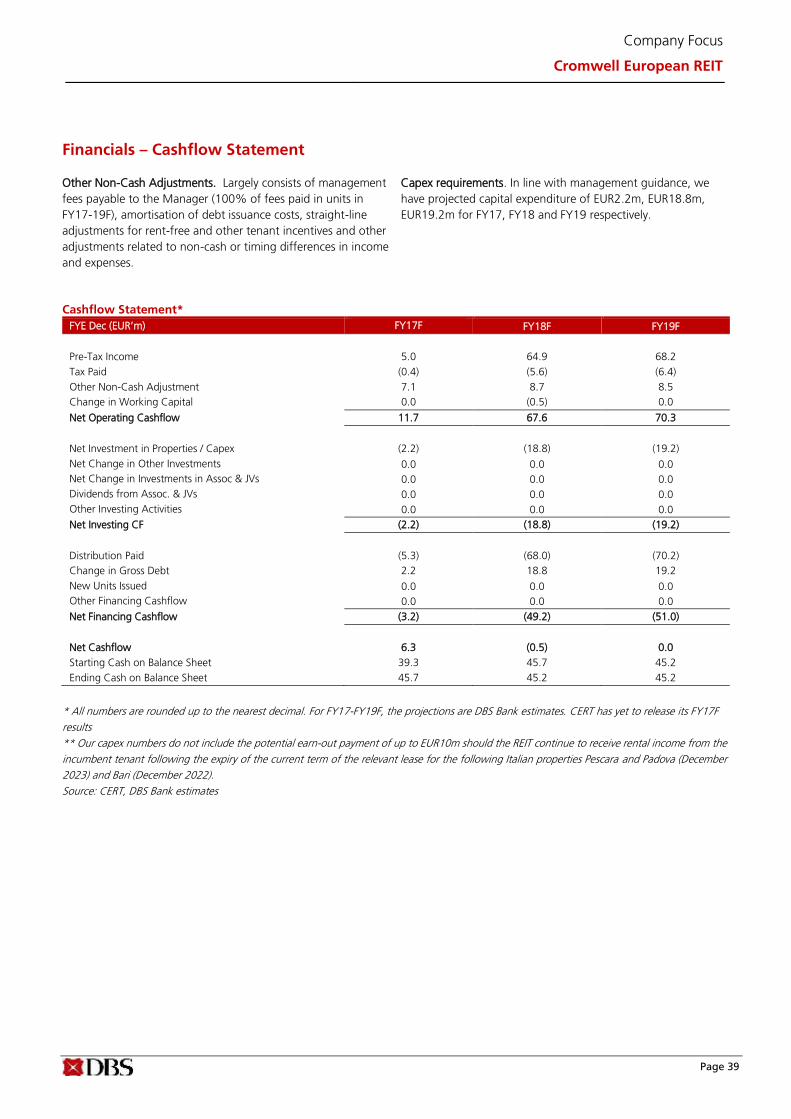
Company Focus
Cromwell European REIT
Page 39
Financials – Cashflow Statement Other Non-Cash Adjustments. Largely consists of management
fees payable to the Manager (100% of fees paid in units in
FY17-19F), amortisation of debt issuance costs, straight-line
adjustments for rent-free and other tenant incentives and other
adjustments related to non-cash or timing differences in income
and expenses.
Capex requirements. In line with management guidance, we
have projected capital expenditure of EUR2.2m, EUR18.8m,
EUR19.2m for FY17, FY18 and FY19 respectively.
Cashflow Statement*
FYE Dec (EUR’m) FY17F FY18F FY19F
Pre-Tax Income 5.0 64.9 68.2
Tax Paid (0.4) (5.6) (6.4)
Other Non-Cash Adjustment 7.1 8.7 8.5
Change in Working Capital 0.0 (0.5) 0.0
Net Operating Cashflow 11.7 67.6 70.3
Net Investment in Properties / Capex (2.2) (18.8) (19.2)
Net Change in Other Investments 0.0 0.0 0.0
Net Change in Investments in Assoc & JVs 0.0 0.0 0.0
Dividends from Assoc. & JVs 0.0 0.0 0.0
Other Investing Activities 0.0 0.0 0.0
Net Investing CF (2.2) (18.8) (19.2)
Distribution Paid (5.3) (68.0) (70.2)
Change in Gross Debt 2.2 18.8 19.2
New Units Issued 0.0 0.0 0.0
Other Financing Cashflow 0.0 0.0 0.0
Net Financing Cashflow (3.2) (49.2) (51.0)
Net Cashflow 6.3 (0.5) 0.0
Starting Cash on Balance Sheet 39.3 45.7 45.2
Ending Cash on Balance Sheet 45.7 45.2 45.2
* All numbers are rounded up to the nearest decimal. For FY17-FY19F, the projections are DBS Bank estimates. CERT has yet to release its FY17F
results
** Our capex numbers do not include the potential earn-out payment of up to EUR10m should the REIT continue to receive rental income from the
incumbent tenant following the expiry of the current term of the relevant lease for the following Italian properties Pescara and Padova (December
2023) and Bari (December 2022).
Source: CERT, DBS Bank estimates
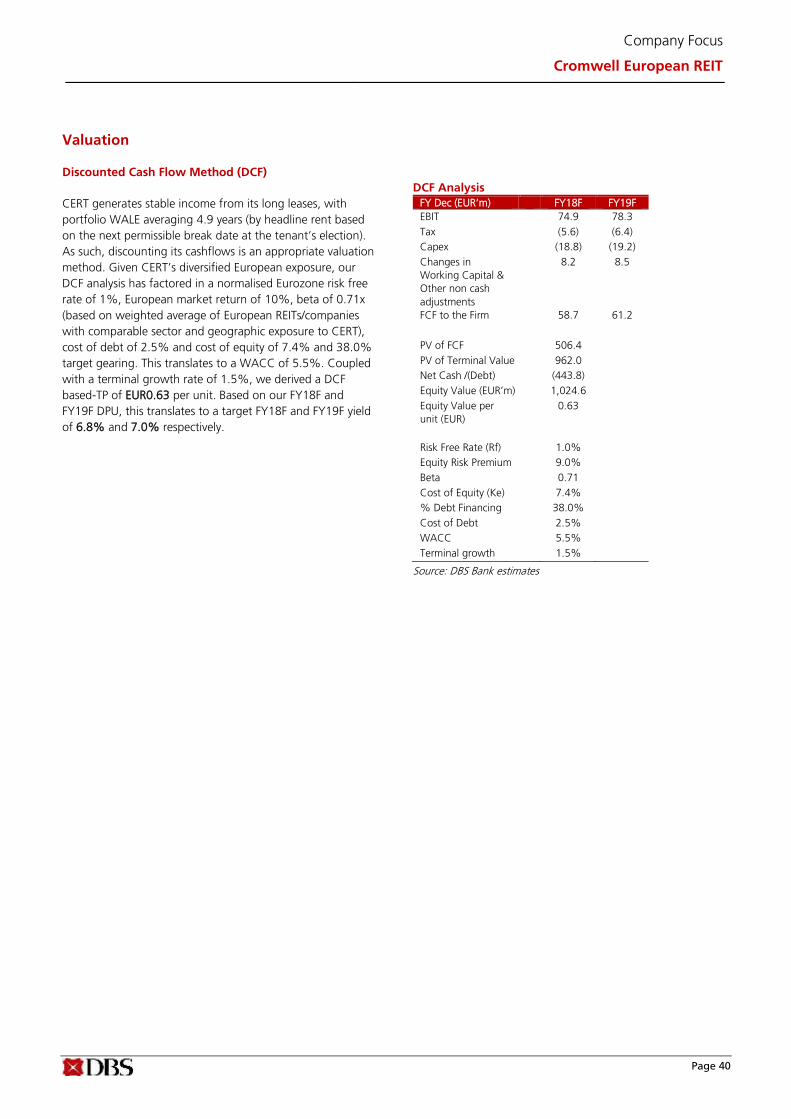
Company Focus
Cromwell European REIT
Page 40
Valuation Discounted Cash Flow Method (DCF)
CERT generates stable income from its long leases, with
portfolio WALE averaging 4.9 years (by headline rent based
on the next permissible break date at the tenant’s election).
As such, discounting its cashflows is an appropriate valuation
method. Given CERT’s diversified European exposure, our
DCF analysis has factored in a normalised Eurozone risk free
rate of 1%, European market return of 10%, beta of 0.71x
(based on weighted average of European REITs/companies
with comparable sector and geographic exposure to CERT),
cost of debt of 2.5% and cost of equity of 7.4% and 38.0%
target gearing. This translates to a WACC of 5.5%. Coupled
with a terminal growth rate of 1.5%, we derived a DCF
based-TP of EUR0.63 per unit. Based on our FY18F and
FY19F DPU, this translates to a target FY18F and FY19F yield
of 6.8% and 7.0% respectively.
DCF Analysis
FY Dec (EUR’m) FY18F FY19F
EBIT 74.9 78.3
Tax (5.6) (6.4)
Capex (18.8) (19.2)
Changes in
Working Capital &
Other non cash
adjustments
8.2 8.5
FCF to the Firm 58.7 61.2
PV of FCF 506.4
PV of Terminal Value 962.0
Net Cash /(Debt) (443.8)
Equity Value (EUR’m) 1,024.6
Equity Value per
unit (EUR)
0.63
Risk Free Rate (Rf) 1.0%
Equity Risk Premium 9.0%
Beta 0.71
Cost of Equity (Ke) 7.4%
% Debt Financing 38.0%
Cost of Debt 2.5%
WACC 5.5%
Terminal growth 1.5%
Source: DBS Bank estimates
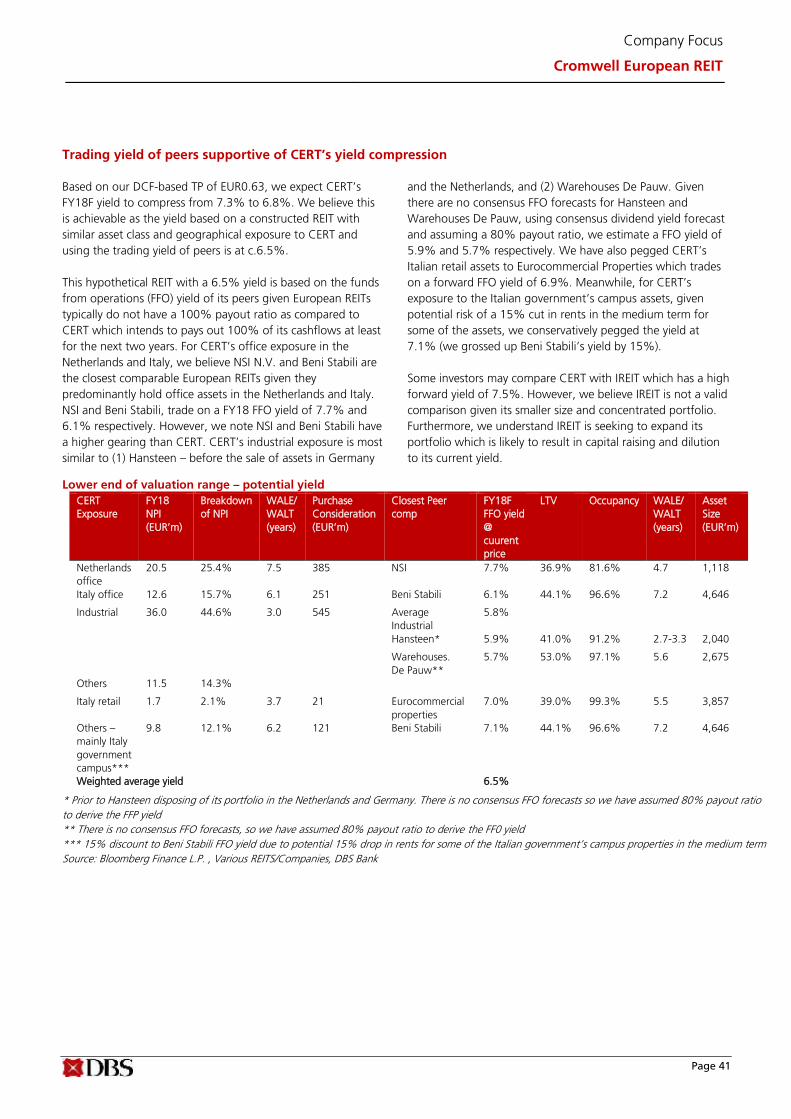
Company Focus
Cromwell European REIT
Page 41
Trading yield of peers supportive of CERT’s yield compression
Based on our DCF-based TP of EUR0.63, we expect CERT’s
FY18F yield to compress from 7.3% to 6.8%. We believe this
is achievable as the yield based on a constructed REIT with
similar asset class and geographical exposure to CERT and
using the trading yield of peers is at c.6.5%.
This hypothetical REIT with a 6.5% yield is based on the funds
from operations (FFO) yield of its peers given European REITs
typically do not have a 100% payout ratio as compared to
CERT which intends to pays out 100% of its cashflows at least
for the next two years. For CERT’s office exposure in the
Netherlands and Italy, we believe NSI N.V. and Beni Stabili are
the closest comparable European REITs given they
predominantly hold office assets in the Netherlands and Italy.
NSI and Beni Stabili, trade on a FY18 FFO yield of 7.7% and
6.1% respectively. However, we note NSI and Beni Stabili have
a higher gearing than CERT. CERT’s industrial exposure is most
similar to (1) Hansteen – before the sale of assets in Germany
and the Netherlands, and (2) Warehouses De Pauw. Given
there are no consensus FFO forecasts for Hansteen and
Warehouses De Pauw, using consensus dividend yield forecast
and assuming a 80% payout ratio, we estimate a FFO yield of
5.9% and 5.7% respectively. We have also pegged CERT’s
Italian retail assets to Eurocommercial Properties which trades
on a forward FFO yield of 6.9%. Meanwhile, for CERT’s
exposure to the Italian government’s campus assets, given
potential risk of a 15% cut in rents in the medium term for
some of the assets, we conservatively pegged the yield at
7.1% (we grossed up Beni Stabili’s yield by 15%).
Some investors may compare CERT with IREIT which has a high
forward yield of 7.5%. However, we believe IREIT is not a valid
comparison given its smaller size and concentrated portfolio.
Furthermore, we understand IREIT is seeking to expand its
portfolio which is likely to result in capital raising and dilution
to its current yield.
Lower end of valuation range – potential yield
CERT
Exposure
FY18
NPI
(EUR’m)
Breakdown
of NPI
WALE/
WALT
(years)
Purchase
Consideration
(EUR’m)
Closest Peer
comp
FY18F
FFO yield
@
cuurent
price
LTV Occupancy WALE/
WALT
(years)
Asset
Size
(EUR’m)
Netherlands
office
20.5 25.4% 7.5 385 NSI 7.7% 36.9% 81.6% 4.7 1,118
Italy office 12.6 15.7% 6.1 251 Beni Stabili 6.1% 44.1% 96.6% 7.2 4,646
Industrial 36.0 44.6% 3.0 545 Average
Industrial
5.8%
Hansteen* 5.9% 41.0% 91.2% 2.7-3.3 2,040
Warehouses.
De Pauw**
5.7% 53.0% 97.1% 5.6 2,675
Others 11.5 14.3%
Italy retail 1.7 2.1% 3.7 21 Eurocommercial
properties
7.0% 39.0% 99.3% 5.5 3,857
Others –
mainly Italy
government
campus***
9.8 12.1% 6.2 121 Beni Stabili 7.1% 44.1% 96.6% 7.2 4,646
Weighted average yield 6.5%
* Prior to Hansteen disposing of its portfolio in the Netherlands and Germany. There is no consensus FFO forecasts so we have assumed 80% payout ratio
to derive the FFP yield
** There is no consensus FFO forecasts, so we have assumed 80% payout ratio to derive the FF0 yield
*** 15% discount to Beni Stabili FFO yield due to potential 15% drop in rents for some of the Italian government’s campus properties in the medium term
Source: Bloomberg Finance L.P. , Various REITS/Companies, DBS Bank

Company Focus
Cromwell European REIT
Page 42
Sector and company exposure by value
Exposure Country
REIT/Company Office Industrial Retail Other Netherlands Italy Germany France Denmark UK Belgium Others
CERT 47.4% 42.1% - 10.5% 34.5% 29.9% 7.7% 22.1% 5.8% - - -
NSI 66.0% - 17.0% 17.0% 100.0% - - - - - - -
Beni Stabili 90.7% - 9.3% - - 100.0% - - - - - -
CREIT Industrial portfolio - 100.0% - - 12.9% 2.2% 16.7% 54.3% 14.0% - - -
Hansteen* - 100.0% - - 15.2% - 43.8% - - 39.1% - 1.9%
Warehouses De Pauw - 100.0% - - 49.9% - - 4.7% - - 39.6% 5.7%
Eurocommercial Properties
- - 100.0% - - 45.0% - 34.0% - - - 21.0%
* Prior to Hansteen disposing of its portfolio in the Netherlands and Germany
Source: Bloomberg Finance L.P. , Various REITS/Companies, DBS Bank
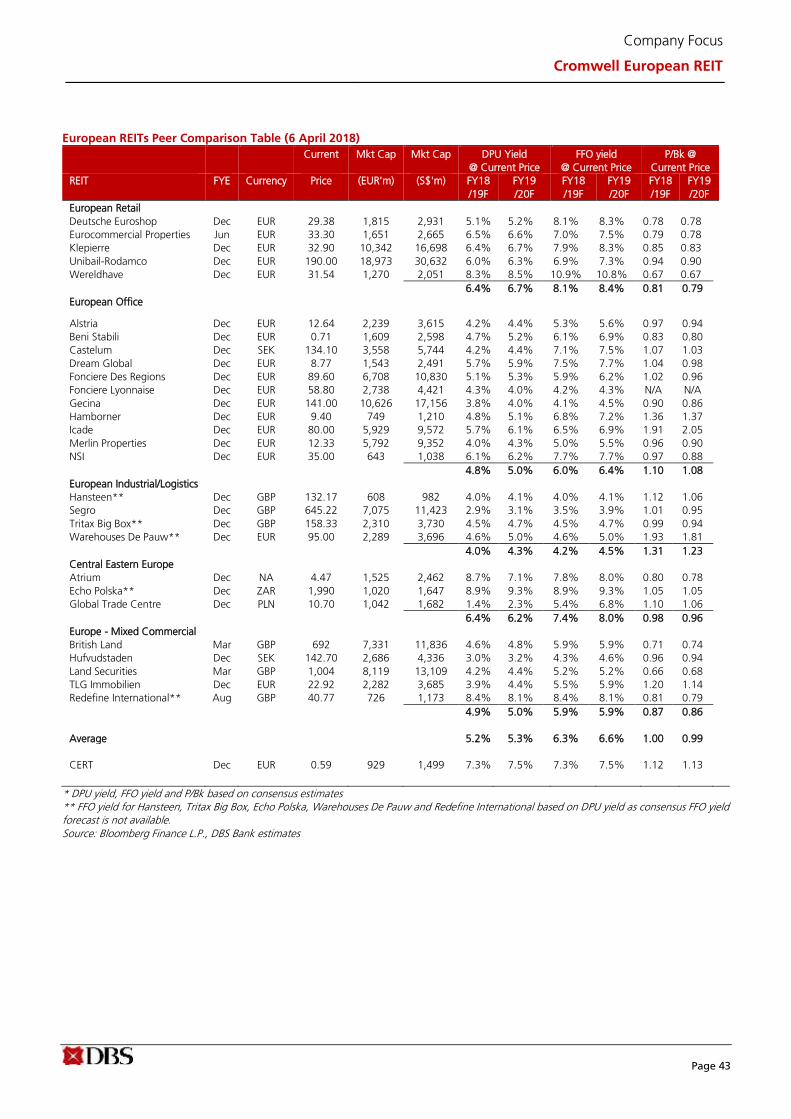
Company Focus
Cromwell European REIT
Page 43
European REITs Peer Comparison Table (6 April 2018)
Current Mkt Cap Mkt Cap DPU Yield
@ Current Price
FFO yield
@ Current Price
P/Bk @
Current Price
REIT FYE Currency Price (EUR'm) (S$'m) FY18
/19F
FY19
/20F
FY18
/19F
FY19
/20F
FY18
/19F
FY19
/20F
European Retail
Deutsche Euroshop Dec EUR 29.38 1,815 2,931 5.1% 5.2% 8.1% 8.3% 0.78 0.78
Eurocommercial Properties Jun EUR 33.30 1,651 2,665 6.5% 6.6% 7.0% 7.5% 0.79 0.78
Klepierre Dec EUR 32.90 10,342 16,698 6.4% 6.7% 7.9% 8.3% 0.85 0.83
Unibail-Rodamco Dec EUR 190.00 18,973 30,632 6.0% 6.3% 6.9% 7.3% 0.94 0.90
Wereldhave Dec EUR 31.54 1,270 2,051 8.3% 8.5% 10.9% 10.8% 0.67 0.67
6.4% 6.7% 8.1% 8.4% 0.81 0.79
European Office
Alstria Dec EUR 12.64 2,239 3,615 4.2% 4.4% 5.3% 5.6% 0.97 0.94
Beni Stabili Dec EUR 0.71 1,609 2,598 4.7% 5.2% 6.1% 6.9% 0.83 0.80
Castelum Dec SEK 134.10 3,558 5,744 4.2% 4.4% 7.1% 7.5% 1.07 1.03
Dream Global Dec EUR 8.77 1,543 2,491 5.7% 5.9% 7.5% 7.7% 1.04 0.98
Fonciere Des Regions Dec EUR 89.60 6,708 10,830 5.1% 5.3% 5.9% 6.2% 1.02 0.96
Fonciere Lyonnaise Dec EUR 58.80 2,738 4,421 4.3% 4.0% 4.2% 4.3% N/A N/A
Gecina Dec EUR 141.00 10,626 17,156 3.8% 4.0% 4.1% 4.5% 0.90 0.86
Hamborner Dec EUR 9.40 749 1,210 4.8% 5.1% 6.8% 7.2% 1.36 1.37
Icade Dec EUR 80.00 5,929 9,572 5.7% 6.1% 6.5% 6.9% 1.91 2.05
Merlin Properties Dec EUR 12.33 5,792 9,352 4.0% 4.3% 5.0% 5.5% 0.96 0.90
NSI Dec EUR 35.00 643 1,038 6.1% 6.2% 7.7% 7.7% 0.97 0.88
4.8% 5.0% 6.0% 6.4% 1.10 1.08
European Industrial/Logistics
Hansteen** Dec GBP 132.17 608 982 4.0% 4.1% 4.0% 4.1% 1.12 1.06
Segro Dec GBP 645.22 7,075 11,423 2.9% 3.1% 3.5% 3.9% 1.01 0.95
Tritax Big Box** Dec GBP 158.33 2,310 3,730 4.5% 4.7% 4.5% 4.7% 0.99 0.94
Warehouses De Pauw** Dec EUR 95.00 2,289 3,696 4.6% 5.0% 4.6% 5.0% 1.93 1.81
4.0% 4.3% 4.2% 4.5% 1.31 1.23
Central Eastern Europe
Atrium Dec NA 4.47 1,525 2,462 8.7% 7.1% 7.8% 8.0% 0.80 0.78
Echo Polska** Dec ZAR 1,990 1,020 1,647 8.9% 9.3% 8.9% 9.3% 1.05 1.05
Global Trade Centre Dec PLN 10.70 1,042 1,682 1.4% 2.3% 5.4% 6.8% 1.10 1.06
6.4% 6.2% 7.4% 8.0% 0.98 0.96
Europe - Mixed Commercial
British Land Mar GBP 692 7,331 11,836 4.6% 4.8% 5.9% 5.9% 0.71 0.74
Hufvudstaden Dec SEK 142.70 2,686 4,336 3.0% 3.2% 4.3% 4.6% 0.96 0.94
Land Securities Mar GBP 1,004 8,119 13,109 4.2% 4.4% 5.2% 5.2% 0.66 0.68
TLG Immobilien Dec EUR 22.92 2,282 3,685 3.9% 4.4% 5.5% 5.9% 1.20 1.14
Redefine International** Aug GBP 40.77 726 1,173 8.4% 8.1% 8.4% 8.1% 0.81 0.79
4.9% 5.0% 5.9% 5.9% 0.87 0.86
Average 5.2% 5.3% 6.3% 6.6% 1.00 0.99
CERT Dec EUR 0.59 929 1,499 7.3% 7.5% 7.3% 7.5% 1.12 1.13
* DPU yield, FFO yield and P/Bk based on consensus estimates ** FFO yield for Hansteen, Tritax Big Box, Echo Polska, Warehouses De Pauw and Redefine International based on DPU yield as consensus FFO yield forecast is not available. Source: Bloomberg Finance L.P., DBS Bank estimates
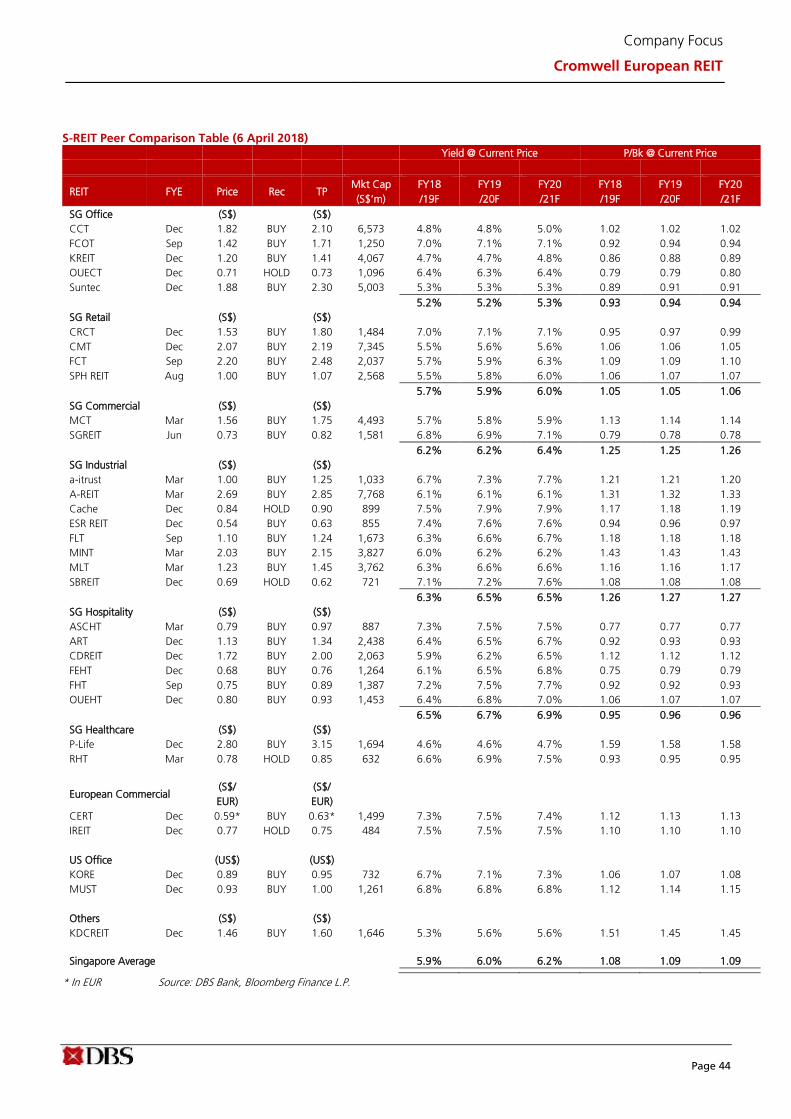
Company Focus
Cromwell European REIT
Page 44
S-REIT Peer Comparison Table (6 April 2018)
Yield @ Current Price P/Bk @ Current Price
REIT FYE Price Rec TP Mkt Cap
(S$’m)
FY18
/19F
FY19
/20F
FY20
/21F
FY18
/19F
FY19
/20F
FY20
/21F
SG Office (S$) (S$)
CCT Dec 1.82 BUY 2.10 6,573 4.8% 4.8% 5.0% 1.02 1.02 1.02
FCOT Sep 1.42 BUY 1.71 1,250 7.0% 7.1% 7.1% 0.92 0.94 0.94
KREIT Dec 1.20 BUY 1.41 4,067 4.7% 4.7% 4.8% 0.86 0.88 0.89
OUECT Dec 0.71 HOLD 0.73 1,096 6.4% 6.3% 6.4% 0.79 0.79 0.80
Suntec Dec 1.88 BUY 2.30 5,003 5.3% 5.3% 5.3% 0.89 0.91 0.91
5.2% 5.2% 5.3% 0.93 0.94 0.94
SG Retail (S$) (S$)
CRCT Dec 1.53 BUY 1.80 1,484 7.0% 7.1% 7.1% 0.95 0.97 0.99
CMT Dec 2.07 BUY 2.19 7,345 5.5% 5.6% 5.6% 1.06 1.06 1.05
FCT Sep 2.20 BUY 2.48 2,037 5.7% 5.9% 6.3% 1.09 1.09 1.10
SPH REIT Aug 1.00 BUY 1.07 2,568 5.5% 5.8% 6.0% 1.06 1.07 1.07 5.7% 5.9% 6.0% 1.05 1.05 1.06
SG Commercial (S$) (S$)
MCT Mar 1.56 BUY 1.75 4,493 5.7% 5.8% 5.9% 1.13 1.14 1.14
SGREIT Jun 0.73 BUY 0.82 1,581 6.8% 6.9% 7.1% 0.79 0.78 0.78 6.2% 6.2% 6.4% 1.25 1.25 1.26
SG Industrial (S$) (S$)
a-itrust Mar 1.00 BUY 1.25 1,033 6.7% 7.3% 7.7% 1.21 1.21 1.20
A-REIT Mar 2.69 BUY 2.85 7,768 6.1% 6.1% 6.1% 1.31 1.32 1.33
Cache Dec 0.84 HOLD 0.90 899 7.5% 7.9% 7.9% 1.17 1.18 1.19
ESR REIT Dec 0.54 BUY 0.63 855 7.4% 7.6% 7.6% 0.94 0.96 0.97
FLT Sep 1.10 BUY 1.24 1,673 6.3% 6.6% 6.7% 1.18 1.18 1.18
MINT Mar 2.03 BUY 2.15 3,827 6.0% 6.2% 6.2% 1.43 1.43 1.43
MLT Mar 1.23 BUY 1.45 3,762 6.3% 6.6% 6.6% 1.16 1.16 1.17
SBREIT Dec 0.69 HOLD 0.62 721 7.1% 7.2% 7.6% 1.08 1.08 1.08 6.3% 6.5% 6.5% 1.26 1.27 1.27
SG Hospitality (S$) (S$)
ASCHT Mar 0.79 BUY 0.97 887 7.3% 7.5% 7.5% 0.77 0.77 0.77
ART Dec 1.13 BUY 1.34 2,438 6.4% 6.5% 6.7% 0.92 0.93 0.93
CDREIT Dec 1.72 BUY 2.00 2,063 5.9% 6.2% 6.5% 1.12 1.12 1.12
FEHT Dec 0.68 BUY 0.76 1,264 6.1% 6.5% 6.8% 0.75 0.79 0.79
FHT Sep 0.75 BUY 0.89 1,387 7.2% 7.5% 7.7% 0.92 0.92 0.93
OUEHT Dec 0.80 BUY 0.93 1,453 6.4% 6.8% 7.0% 1.06 1.07 1.07 6.5% 6.7% 6.9% 0.95 0.96 0.96
SG Healthcare (S$) (S$)
P-Life Dec 2.80 BUY 3.15 1,694 4.6% 4.6% 4.7% 1.59 1.58 1.58
RHT Mar 0.78 HOLD 0.85 632 6.6% 6.9% 7.5% 0.93 0.95 0.95
European Commercial (S$/
EUR) (S$/
EUR)
CERT Dec 0.59* BUY 0.63* 1,499 7.3% 7.5% 7.4% 1.12 1.13 1.13
IREIT Dec 0.77 HOLD 0.75 484 7.5% 7.5% 7.5% 1.10 1.10 1.10
US Office (US$) (US$)
KORE Dec 0.89 BUY 0.95 732 6.7% 7.1% 7.3% 1.06 1.07 1.08
MUST Dec 0.93 BUY 1.00 1,261 6.8% 6.8% 6.8% 1.12 1.14 1.15
Others (S$) (S$)
KDCREIT Dec 1.46 BUY 1.60 1,646 5.3% 5.6% 5.6% 1.51 1.45 1.45
Singapore Average 5.9% 6.0% 6.2% 1.08 1.09 1.09
* In EUR Source: DBS Bank, Bloomberg Finance L.P.

Page 45
Company Focus
Cromwell European REIT
Extract from the Independent Market Review
Eurozone outlook
The Eurozone’s economic recovery is now on a stronger
footing during the first half of 2017 with annual growth rate
projected to be 2.2%, according to Oxford Economics. This
will represent an improvement from the 1.7% and 1.9%
growth rate in 2016 and 2015 respectively, implying that the
uncertainties generated from Brexit and political uncertainty
have dissipated somewhat.
Looking ahead, according to Cushman & Wakefield, economic
prospects are generally positive with GDP growth forecasts for
Germany, France, Spain and Portugal being revised up in
recent months, while Ireland and Spain are expected to be the
top performing Eurozone economies in 2017. Italy will
continue to be one of the weaker performers, but its average
growth rate over 2017F-2020F of close to 1.1% is an
improvement over -0.6% growth achieved between 2006-
2016. Italy’s economy faces the headwinds of political
uncertainty and weak reform momentum, although the
banking system looks to have resolved its immediate
challenges.
Key macro indicators in Europe
Indicators 2016 2017 2018 2007-2016 2017-2020 Outlook
GDP Growth (%) 1.7 2.2 1.8 0.6 1.7 up
Household Consumption (%) 2 1.6 1.6 0.5 1.5 up
Investment (%) 3.4 4.3 2.6 -0.4 2.9 up
Industrial Production (%) 1.4 2.2 1.8 -0.1 1.7 up
Unemployment Rate (%) 10 9.1 8.5 10.1 8.4 down
Inflation (CPI) (%) 0.2 1.5 1.4 1.5 1.6 flat
10-year Bond Rates (%) 0.9 1.2 1.6 3.1 1.7 down
Short Term Rates (%) -0.3 -0.3 -0.3 1.3 -0.2 down
Source: Oxford Economics, Cushman & Wakefield, DBS Bank
Real GDP growth in the Eurozone is picking up DBS Bank Remarks
Expect the Eurozone to see a
pick-up in economic
performance in the coming
years.
Source: Oxford Economics, Cushman & Wakefield, DBS Bank
-1.5
-1.0
-0.5
0.0
0.5
1.0
1.5
2.0
2.5
2010 2011 2012 2013 2014 2015 2016 2017F 2018F 2019F
(%)
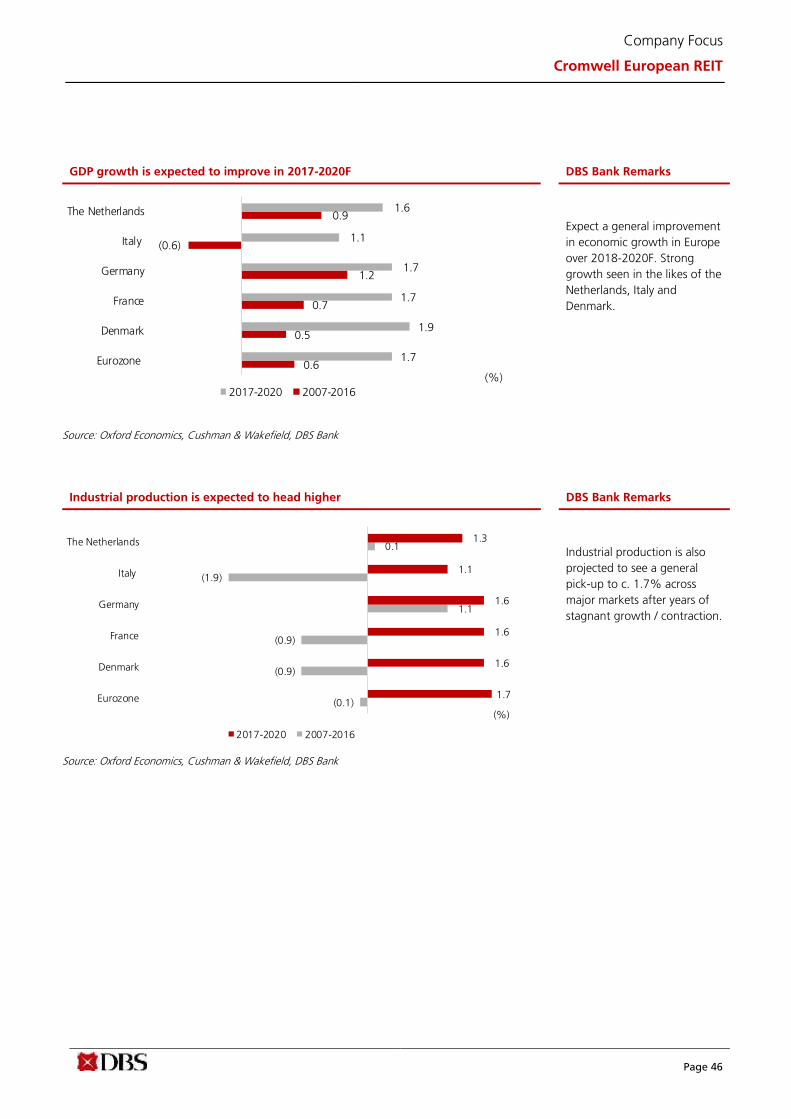
Page 46
Company Focus
Cromwell European REIT
GDP growth is expected to improve in 2017-2020F DBS Bank Remarks
Expect a general improvement
in economic growth in Europe
over 2018-2020F. Strong
growth seen in the likes of the
Netherlands, Italy and
Denmark.
Source: Oxford Economics, Cushman & Wakefield, DBS Bank
Industrial production is expected to head higher DBS Bank Remarks
Industrial production is also
projected to see a general
pick-up to c. 1.7% across
major markets after years of
stagnant growth / contraction.
Source: Oxford Economics, Cushman & Wakefield, DBS Bank
0.6
0.5
0.7
1.2
(0.6)
0.9
1.7
1.9
1.7
1.7
1.1
1.6
Eurozone
Denmark
France
Germany
Italy
The Netherlands
(%)
2017-2020 2007-2016
(0.1)
(0.9)
(0.9)
1.1
(1.9)
0.1
1.7
1.6
1.6
1.6
1.1
1.3
Eurozone
Denmark
France
Germany
Italy
The Netherlands
(%)
2017-2020 2007-2016

Page 47
Company Focus
Cromwell European REIT
Unemployment rate to improve. Eurozone unemployment has
fallen from a high of 12% in 2013 to just above 9% in May
2017. The labour market recovery has further to run as
countries that still have relatively high unemployment rates,
such as Spain, Italy, France and Portugal, continue to create
jobs and implement strategies to tackle youth unemployment.
By 2019, according to Cushman & Wakefield, the Eurozone
unemployment rate is expected to fall to around 8% which
would be the lowest since 2008.
Inflation rate to remain low as policy remains accommodative.
Eurozone Inflation rate is expected to be contained within
2.0% growth per annum given that the European Central
Bank (ECB) continues to maintain an ultra-loose monetary
policy stance and has stated that it will evaluate price
pressures on an aggregate level going forward and ignore
faster headline inflation in countries such as Germany, Spain
and Sweden.
Inflation is projected to remain low and this is helping retail
sales while, more generally, a pick-up in global activity has
aided industrial production. Business confidence in the
Eurozone outlook has also been improving which has
translated to higher investment levels. The main risk to the
outlook continues to be monetary policy tightening although
we expect the ECB to proceed with unwinding in a slow and
controlled manner.
Potential risk
Brexit impact still uncertain. While Brexit remains a clear
uncertainty given that the uncertain economic implications,
most commentators now view that a more probable outcome
over the medium term will be an extended period of low
growth rather than economic contraction. Economic activity is
being supported by very accommodative fiscal and monetary
policies, while the depreciation of the Pound has boosted
demand for UK exports. The government is not expected to
implement further austerity in response to the weakening
fiscal outlook, while the Bank of England has signalled that
further monetary policy easing is possible.
Political uncertainty. Downside risk will also stem from the
uncertain domestic and international political environment.
Eurozone exports are forecast to increase by 3.0% in 2017, up
from 2.6% in 2016. However, the anticipated Brexit-linked
slowdown in the UK economy and potential developments in
US trade policy are key uncertainties to those forecasts. The
US is one of the primary export markets for several Eurozone
economies. If the Trump administration were to follow
through on campaign pledges to erect trade barriers, this has
the potential to negatively impact world trade and the
European export sector.
Unemployment rate to see vast improvement DBS Bank Remarks
Most countries are expected
to see an improvement in
unemployment rate over
2018-2020F with the
exception of Italy.
Source: Oxford Economics, Cushman & Wakefield, DBS Bank
10.1
6.2
9.4
6.1
9.6
5.6
8.4
6
8.7
3.3
11.0
4.8
Eurozone
Denmark
France
Germany
Italy
The Netherlands
(%)
2017-2020 2007-2016

Page 48
Company Focus
Cromwell European REIT
European Real Estate outlook Strong inflows to Europe. According to Cushman &
Wakefield, a combination of steady economic growth, modest
inflation and low interest rates are key factors that will drive
investment volumes into Europe. Investment continues to flow
from all areas of the world with capital flows from Asia
expected to surpass North American capital as the largest
source of inward investment in 2017 and 2018. However,
investment from European funds and institutions will continue
to remain the dominant source of capital.
The UK is the largest market in Europe, with over US$800bn
of invested stock, followed by France (US$720bn) and
Germany (US$650bn). Together, these markets account for
over half of the invested stock across Europe. Italy and Spain
are the next largest markets, with total invested stock of just
under US$250bn each. The four Nordic markets have a
combined invested stock of over US$380bn, with Sweden and
Norway representing more than two-thirds of this regional
total. Similarly, the Netherlands accounts for over two-thirds
of the value of invested stock in the Benelux region.
European Invested Stock by region (US$bn) DBS Bank Remarks
Source: Cushman & Wakefield, DBS Bank
France and Germany have
seen the most amount of
invested stock after the UK.
European Invested Stock (country breakdown %) DBS Bank Remarks
Source: Cushman & Wakefield, DBS Bank
UK, France, and Germany
account for more than 50% of
total invested stock in Europe.
0
100
200
300
400
500
600
700
800
900
UK France Germany Italy Spain Nordic Benelux CEE Rest ofEurope
US$bn, 2016
United Kingdom20.6%
France18.1%
Germany16.4%
Nordics9.7%
Benelux6.9%
Italy6.1%
Spain6.0%
Switzerland5.7%
CEE3.8%
Others3.5%
Russia2.8%
Baltics0.4%
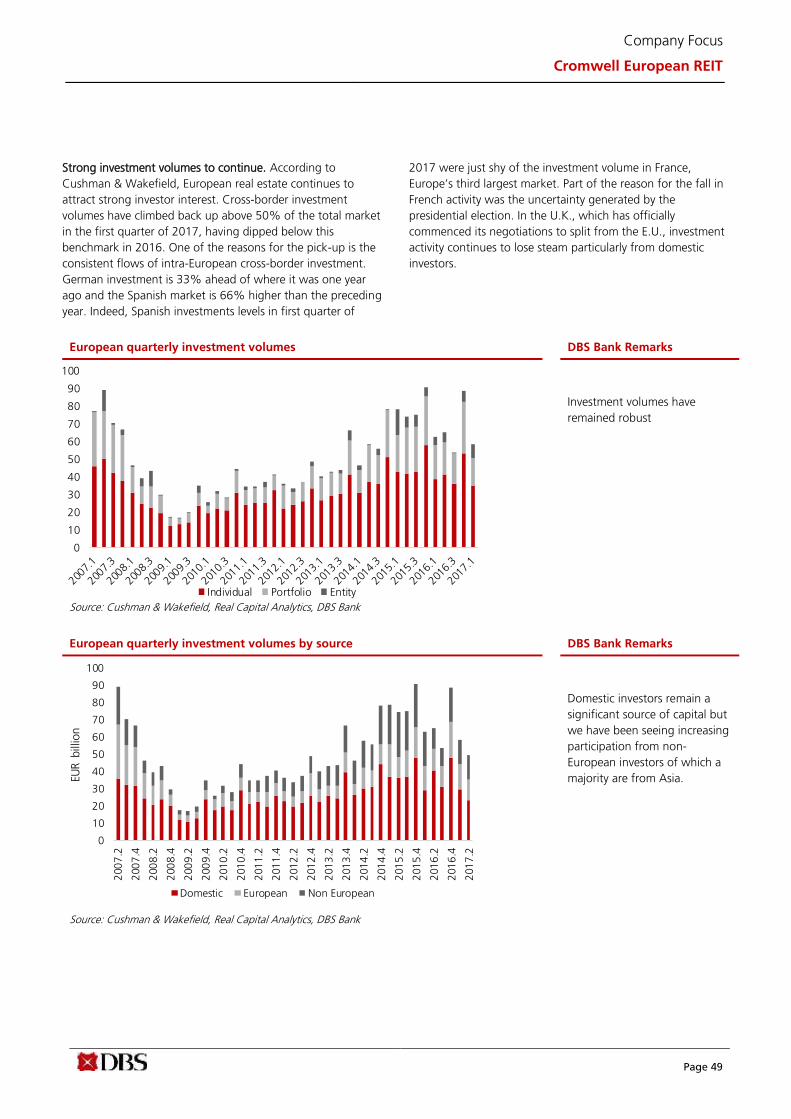
Page 49
Company Focus
Cromwell European REIT
Strong investment volumes to continue. According to
Cushman & Wakefield, European real estate continues to
attract strong investor interest. Cross-border investment
volumes have climbed back up above 50% of the total market
in the first quarter of 2017, having dipped below this
benchmark in 2016. One of the reasons for the pick-up is the
consistent flows of intra-European cross-border investment.
German investment is 33% ahead of where it was one year
ago and the Spanish market is 66% higher than the preceding
year. Indeed, Spanish investments levels in first quarter of
2017 were just shy of the investment volume in France,
Europe’s third largest market. Part of the reason for the fall in
French activity was the uncertainty generated by the
presidential election. In the U.K., which has officially
commenced its negotiations to split from the E.U., investment
activity continues to lose steam particularly from domestic
investors.
European quarterly investment volumes DBS Bank Remarks
Source: Cushman & Wakefield, Real Capital Analytics, DBS Bank
Investment volumes have
remained robust
European quarterly investment volumes by source DBS Bank Remarks
Source: Cushman & Wakefield, Real Capital Analytics, DBS Bank
Domestic investors remain a
significant source of capital but
we have been seeing increasing
participation from non-
European investors of which a
majority are from Asia.
0
10
20
30
40
50
60
70
80
90
100
200
7.2
200
7.4
200
8.2
200
8.4
200
9.2
200
9.4
201
0.2
201
0.4
201
1.2
201
1.4
201
2.2
201
2.4
201
3.2
201
3.4
201
4.2
201
4.4
201
5.2
201
5.4
201
6.2
201
6.4
201
7.2
EUR b
illio
n
Domestic European Non European
0
10
20
30
40
50
60
70
80
90
100
Individual Portfolio Entity
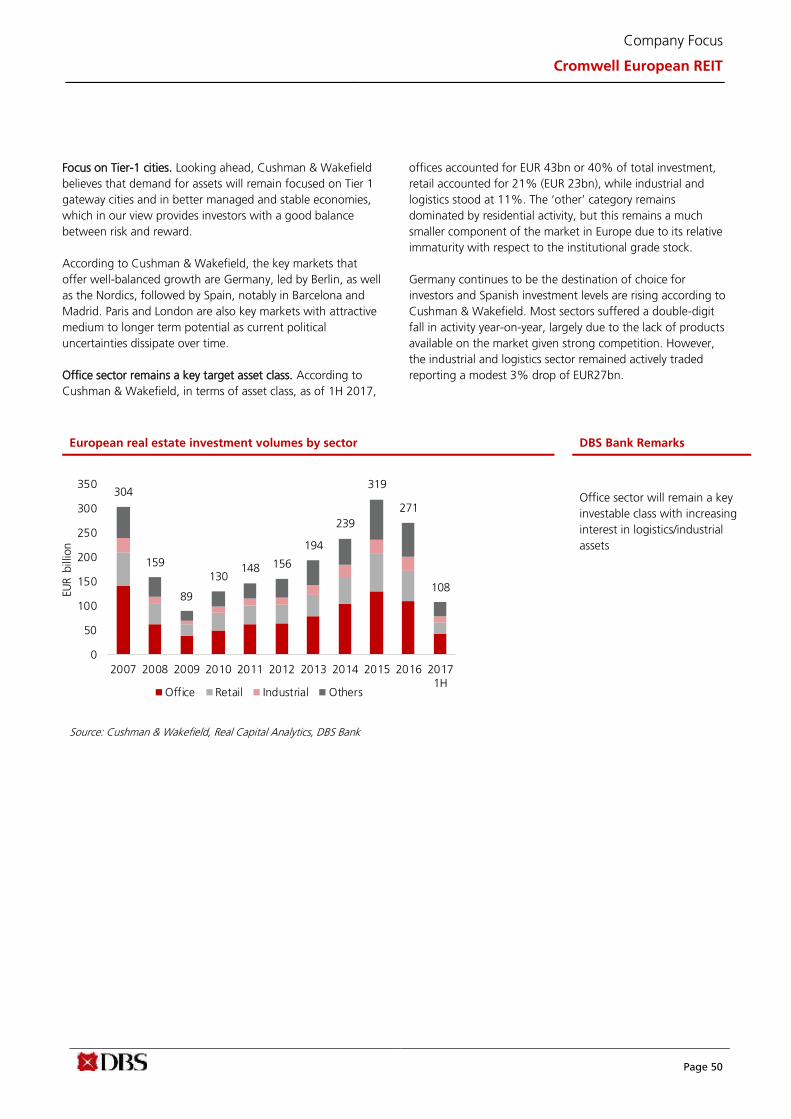
Page 50
Company Focus
Cromwell European REIT
Focus on Tier-1 cities. Looking ahead, Cushman & Wakefield
believes that demand for assets will remain focused on Tier 1
gateway cities and in better managed and stable economies,
which in our view provides investors with a good balance
between risk and reward.
According to Cushman & Wakefield, the key markets that
offer well-balanced growth are Germany, led by Berlin, as well
as the Nordics, followed by Spain, notably in Barcelona and
Madrid. Paris and London are also key markets with attractive
medium to longer term potential as current political
uncertainties dissipate over time.
Office sector remains a key target asset class. According to
Cushman & Wakefield, in terms of asset class, as of 1H 2017,
offices accounted for EUR 43bn or 40% of total investment,
retail accounted for 21% (EUR 23bn), while industrial and
logistics stood at 11%. The ‘other’ category remains
dominated by residential activity, but this remains a much
smaller component of the market in Europe due to its relative
immaturity with respect to the institutional grade stock.
Germany continues to be the destination of choice for
investors and Spanish investment levels are rising according to
Cushman & Wakefield. Most sectors suffered a double-digit
fall in activity year-on-year, largely due to the lack of products
available on the market given strong competition. However,
the industrial and logistics sector remained actively traded
reporting a modest 3% drop of EUR27bn.
European real estate investment volumes by sector DBS Bank Remarks
Source: Cushman & Wakefield, Real Capital Analytics, DBS Bank
Office sector will remain a key
investable class with increasing
interest in logistics/industrial
assets
304
159
89
130148 156
194
239
319
271
108
0
50
100
150
200
250
300
350
2007 2008 2009 2010 2011 2012 2013 2014 2015 2016 20171H
EUR b
illio
n
Office Retail Industrial Others
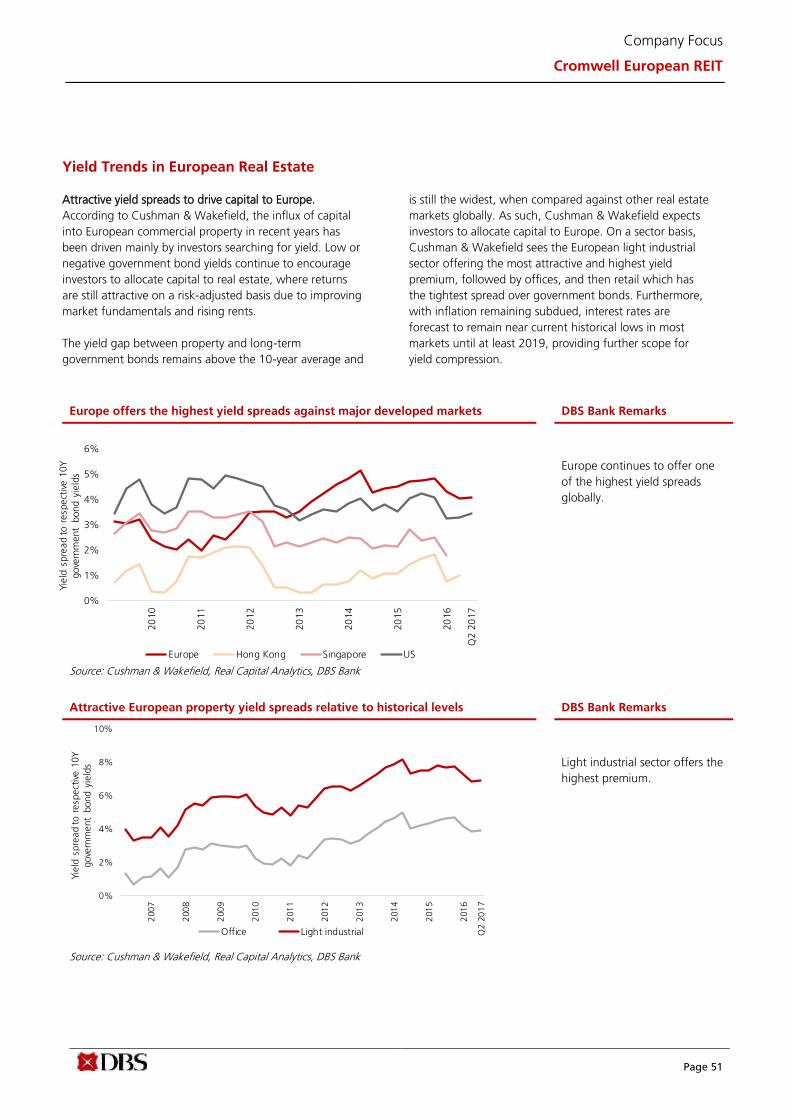
Page 51
Company Focus
Cromwell European REIT
Yield Trends in European Real Estate
Attractive yield spreads to drive capital to Europe.
According to Cushman & Wakefield, the influx of capital
into European commercial property in recent years has
been driven mainly by investors searching for yield. Low or
negative government bond yields continue to encourage
investors to allocate capital to real estate, where returns
are still attractive on a risk-adjusted basis due to improving
market fundamentals and rising rents.
The yield gap between property and long-term
government bonds remains above the 10-year average and
is still the widest, when compared against other real estate
markets globally. As such, Cushman & Wakefield expects
investors to allocate capital to Europe. On a sector basis,
Cushman & Wakefield sees the European light industrial
sector offering the most attractive and highest yield
premium, followed by offices, and then retail which has
the tightest spread over government bonds. Furthermore,
with inflation remaining subdued, interest rates are
forecast to remain near current historical lows in most
markets until at least 2019, providing further scope for
yield compression.
Europe offers the highest yield spreads against major developed markets DBS Bank Remarks
Source: Cushman & Wakefield, Real Capital Analytics, DBS Bank
Europe continues to offer one
of the highest yield spreads
globally.
Attractive European property yield spreads relative to historical levels DBS Bank Remarks
Source: Cushman & Wakefield, Real Capital Analytics, DBS Bank
Light industrial sector offers the
highest premium.
0%
1%
2%
3%
4%
5%
6%
20
10
20
11
20
12
20
13
20
14
20
15
20
16
Q2 2
017
Yie
ld s
pre
ad to r
esp
ect
ive 1
0Y
gove
rnm
ent
bond y
ield
s
Europe Hong Kong Singapore US
0%
2%
4%
6%
8%
10%
200
7
200
8
200
9
201
0
201
1
201
2
201
3
201
4
201
5
201
6
Q2 2
01
7
Yie
ld s
pre
ad to r
esp
ect
ive 1
0Y
gove
rnm
ent
bond y
ield
s
Office Light industrial

Page 52
Company Focus
Cromwell European REIT
Lack of good assets to acquire results in a squeeze in
yields. The availability of suitable investment stock will
remain a key factor determining the level of activity in the
European real estate market. This means that the shortage
of quality assets will lead to further yield compression in
prime yields, especially in core markets like France and
Germany. According to Cushman & Wakefield, asset yield
spreads against 10-year government bond yields will
continue to narrow going forward, especially for assets in
Tier-1 gateway cities.
Capital could head to other regions apart from Tier-1
cities. This shortage of suitable investment stock in Tier-1
cities will also encourage capital to look for higher returns
in other peripheral markets and encourage more risk
taking and thus bring about a more dynamic real estate
market. As such, Cushman & Wakefield believes that
investors may look at Central & Eastern European markets
given the higher yields on offer. In addition, there is also
potential for yields in these markets to compress, if yields
within the core markets tighten further. This trend will
likely benefit markets in Benelux (most notably the
Netherlands), Central and Eastern Europe (CEE) and
Southern Europe.
The yield gap between prime and average assets is notable
across European real estate. In general, prime yields have
compressed faster than average and secondary asset yields
as a flight to quality from investors has resulted in a
sharper compression on the highest quality assets. The
current all sector spread is 155 bps which is significantly
higher than the long term average and marks a significant
change in risk pricing to the 2007-2009 period.
On a sector basis, the spread between prime and
secondary offices is currently at 140 bps which is
significant. As the Eurozone economy continues to recover,
thereby reducing required risk premiums, Cushman &
Wakefield expects to see yields on secondary assets
compressing further, supported by improving
fundamentals driving operating incomes higher in the
medium term.
The spread between prime and secondary retail is the most
significant at 235 bps, reflecting heightened concerns over
the demand drivers for traditional retail in an age of
growing e-commerce and technological disruption to
shopping patterns.
The spread between prime and secondary in the industrial
and logistics sector currently sits at 94 bps. The logistics
sector, in particular, is benefiting from strong structural
support in the shape of growing demand from e-
commerce driven supply chain operators. New asset types
like downtown warehouses and distribution centres are
therefore becoming increasingly attractive to investors,
providing an alternative to traditional big box stores.
Yield compression in European real estate (all asset class) DBS Bank Remarks
Source: Cushman & Wakefield, Real Capital Analytics, DBS Bank
While yields have compressed,
the spread between prime and
average yields remain above
historical average, implying
room to compress further.
3
4
5
6
7
8
9
2008 2009 2010 2011 2012 2013 2014 2015 2016
Eurozone all sectors yield Prime location all sectors yield
%
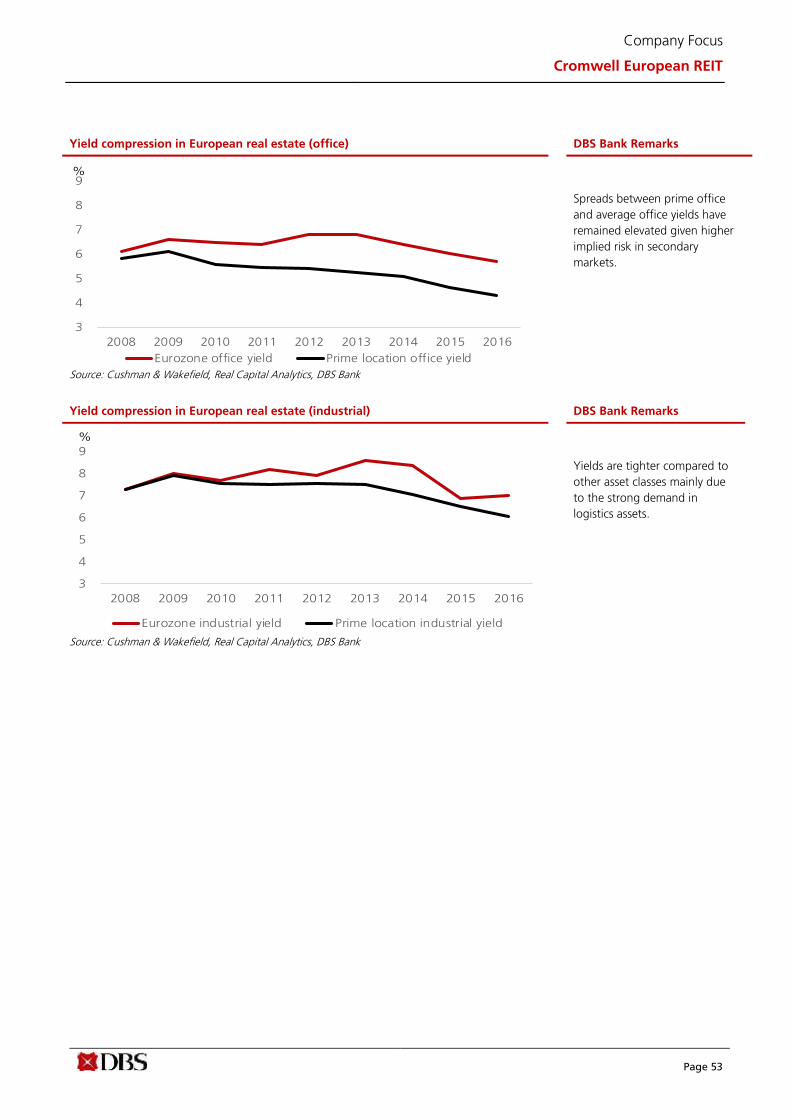
Page 53
Company Focus
Cromwell European REIT
Yield compression in European real estate (office) DBS Bank Remarks
Source: Cushman & Wakefield, Real Capital Analytics, DBS Bank
Spreads between prime office
and average office yields have
remained elevated given higher
implied risk in secondary
markets.
Yield compression in European real estate (industrial) DBS Bank Remarks
Source: Cushman & Wakefield, Real Capital Analytics, DBS Bank
Yields are tighter compared to
other asset classes mainly due
to the strong demand in
logistics assets.
3
4
5
6
7
8
9
2008 2009 2010 2011 2012 2013 2014 2015 2016
Eurozone office yield Prime location office yield
%
3
4
5
6
7
8
9
2008 2009 2010 2011 2012 2013 2014 2015 2016
Eurozone industrial yield Prime location industrial yield
%

Page 54
Company Focus
Cromwell European REIT
Demand & Supply Trends
Office sector to see falling vacancies. According to
Cushman & Wakefield, the European prime office market
has seen a positive recovery over the past couple of years
as labour market conditions have gradually strengthened.
The average prime office vacancy rate dropped to 8.3% at
the end of 2016 - the lowest level since 2008 - suggesting
a healthy appetite for space from office occupiers in recent
years. Office net absorption levels have surpassed new
completions over the past three years. Meanwhile, new
office completions remain lower than the 10-year average
of 4m sqm, partly due to risk-averse lenders being less
willing to lend on speculative projects.
Looking ahead, Cushman & Wakefield expects to see
average regional vacancy rate to remain stable on the back
of stronger demand and the withdrawal of old office stock
which will offset rising new supply.
Retail sector – mixed bag. The European retail sector has
benefitted from robust consumer spending, which has
been the main driver of the regional economic recovery in
recent years. Consumers have remained resilient,
supported by ultra-accommodative monetary policies and
low inflation. That said, the structural demand story for the
retail sector is becoming more challenging. The changing
nature of consumer habits - driven largely by the strong
growth in e-commerce - is taking its toll on demand for
retail space, particularly in secondary locations.
The current retail environment favours dominant, regional
centres capable of providing consumers with an experience
in addition to a point of sale transaction. The concept of
‘experience retail’ has led to the growth of Leisure and
Food & Beverage being part of the overall shopping centre
floorspace. In addition to the experience end of the
market, convenience retail is also performing well and is
typically characterised by smaller units in urban areas,
aimed at time pressed consumers. Many companies built
on hypermarket and supermarket formats are moving into
smaller store formats.
Industrial and logistics sector to see strong increases in
rent. According to Cushman & Wakefield, the industrial
sector has seen strong activity in recent years, with a surge
in demand for logistics and warehousing space. The
growth in online sales is the main driver of demand, as
retailers, e-tailers and third-party logistics providers target
distribution spaces close to the major cities they are
servicing. Online retailers, such as Amazon and Zalando,
now account for a big share of demand for logistics space.
With new technologies increasingly facilitating the
interaction between consumer and retailer, Cushman &
Wakefield expects demand for the logistics/warehouse
space to continue to thrive in the coming years.
Urban logistics is the part of the market experiencing
intense demand and investor interest. The rise of e-
commerce means tenant demand is robust, with record
rents being achieved in tightly constrained urban areas
where logistics space is typically competing with alternative
use, namely residential. A structural shift is emerging
whereby traditional large sheds are struggling to compete
on a rental growth basis with urban logistics units. One of
the rising risks for older industrial units is obsolescence
which might not meet the requirements from new
occupiers.
Prime office demand & supply (LHS, m sqm), vacancy rate (RHS %) DBS Bank Remarks
Source: Cushman & Wakefield, Real Capital Analytics, DBS Bank
Office sector to see improving
prospects.
0%
2%
4%
6%
8%
10%
12%
0
1
2
3
4
5
6
7
2008 2009 2010 2011 2012 2013 2014 2015 2016 2017F 2018F 2019F
Office new supply, LHS Office absorption, LHS10-yr average new supply, LHS 10-yr average absorption, LHSOffice vacancy rate, RHS
Mill
ion,
sqm

Page 55
Company Focus
Cromwell European REIT
Rental Outlook
According to Cushman & Wakefield, most European
economies struggled to build momentum in the years
following the financial crisis in 2008, due to slow decision
making on banking sector problems, heightened country
level risks associated with high deficits and debt liabilities
and delayed monetary policy decisions by many European
central banks, especially when compared with the US
Federal Reserve and the Bank of England. This delayed the
recovery in domestic demand, which has - only in the last
couple of years - become the main engine of growth
across Europe.
As business and consumer confidence returned, occupier
demand has strengthened across all property sectors.
Some of the strongest rental growth in recent years being
seen in the fast recovering markets on Europe’s periphery,
most notably Spain and Ireland, where rents are still on a
strong upward trend and are yet to reach their pre-crisis
peaks. Overall, strengthening market fundamentals across
Europe saw average prime rents rise by 6% in 2015 and
2016, which is the strongest annualised rate of growth
since 2007.
Looking ahead, occupier demand is expected to remain
healthy, especially in core markets, but slowing
employment growth, rising new supply and already
elevated rental levels are likely to moderate rental growth
prospects. As a result, rents are expected to increase, but
at a slower pace, in 2017-19.
European rental and capital growth DBS Bank Remarks
Source: Cushman & Wakefield, Real Capital Analytics, DBS Bank
The next leg of capital value
upside will stem on the ability
for rental growth.
-10.0%
-5.0%
0.0%
5.0%
10.0%
15.0%
20.0%
25.0%
2009 2010 2011 2012 2013 2014 2015 2016 2017F 2018F 2019F 2020F
Capital Growth Rental Growth
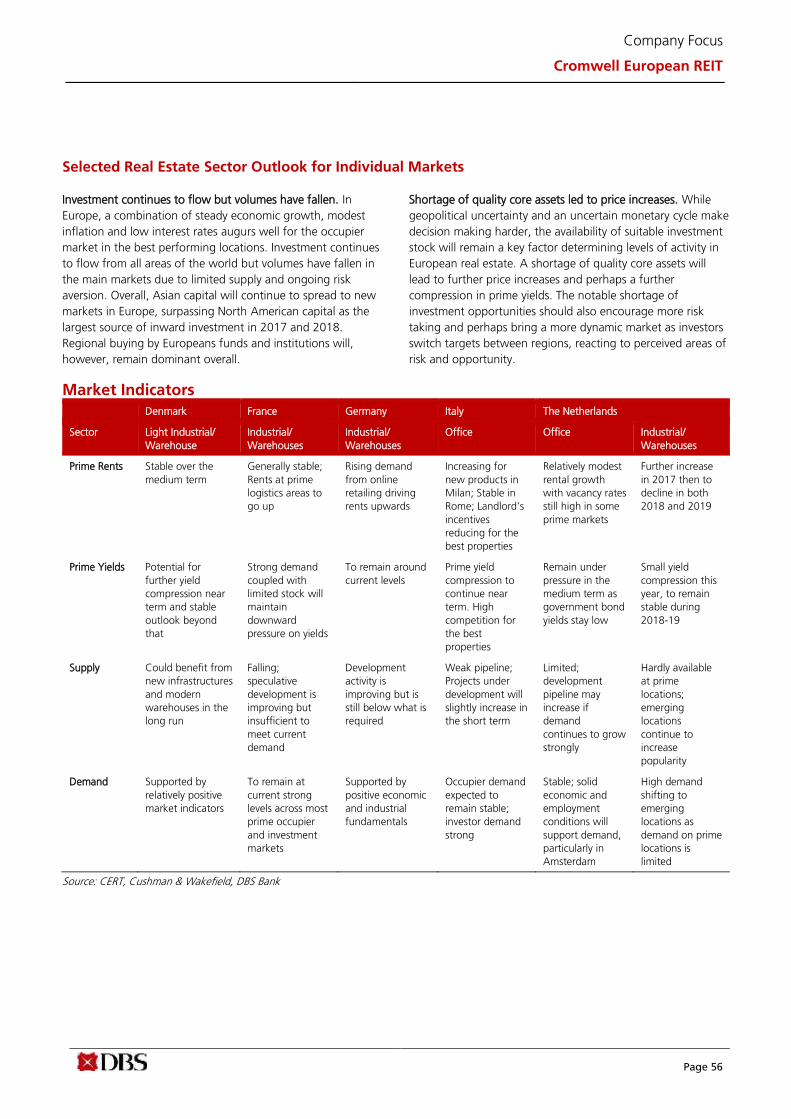
Page 56
Company Focus
Cromwell European REIT
Selected Real Estate Sector Outlook for Individual Markets
Investment continues to flow but volumes have fallen. In
Europe, a combination of steady economic growth, modest
inflation and low interest rates augurs well for the occupier
market in the best performing locations. Investment continues
to flow from all areas of the world but volumes have fallen in
the main markets due to limited supply and ongoing risk
aversion. Overall, Asian capital will continue to spread to new
markets in Europe, surpassing North American capital as the
largest source of inward investment in 2017 and 2018.
Regional buying by Europeans funds and institutions will,
however, remain dominant overall.
Shortage of quality core assets led to price increases. While
geopolitical uncertainty and an uncertain monetary cycle make
decision making harder, the availability of suitable investment
stock will remain a key factor determining levels of activity in
European real estate. A shortage of quality core assets will
lead to further price increases and perhaps a further
compression in prime yields. The notable shortage of
investment opportunities should also encourage more risk
taking and perhaps bring a more dynamic market as investors
switch targets between regions, reacting to perceived areas of
risk and opportunity.
Market Indicators
Denmark France Germany Italy The Netherlands
Sector Light Industrial/
Warehouse
Industrial/
Warehouses
Industrial/
Warehouses
Office Office Industrial/
Warehouses
Prime Rents Stable over the
medium term
Generally stable;
Rents at prime
logistics areas to
go up
Rising demand
from online
retailing driving
rents upwards
Increasing for
new products in
Milan; Stable in
Rome; Landlord’s
incentives
reducing for the
best properties
Relatively modest
rental growth
with vacancy rates
still high in some
prime markets
Further increase
in 2017 then to
decline in both
2018 and 2019
Prime Yields Potential for
further yield
compression near
term and stable
outlook beyond
that
Strong demand
coupled with
limited stock will
maintain
downward
pressure on yields
To remain around
current levels
Prime yield
compression to
continue near
term. High
competition for
the best
properties
Remain under
pressure in the
medium term as
government bond
yields stay low
Small yield
compression this
year, to remain
stable during
2018-19
Supply Could benefit from
new infrastructures
and modern
warehouses in the
long run
Falling;
speculative
development is
improving but
insufficient to
meet current
demand
Development
activity is
improving but is
still below what is
required
Weak pipeline;
Projects under
development will
slightly increase in
the short term
Limited;
development
pipeline may
increase if
demand
continues to grow
strongly
Hardly available
at prime
locations;
emerging
locations
continue to
increase
popularity
Demand Supported by
relatively positive
market indicators
To remain at
current strong
levels across most
prime occupier
and investment
markets
Supported by
positive economic
and industrial
fundamentals
Occupier demand
expected to
remain stable;
investor demand
strong
Stable; solid
economic and
employment
conditions will
support demand,
particularly in
Amsterdam
High demand
shifting to
emerging
locations as
demand on prime
locations is
limited
Source: CERT, Cushman & Wakefield, DBS Bank

Page 57
Company Focus
Cromwell European REIT
Denmark – Light Industrial/Warehouse Market introduction: recovery continues. The Danish economic
recovery continued in 2017, with GDP growth hitting 2.1% up
from 1.7% in 2016. The warehouse market has been relatively
stable in recent years, although prime logistics properties did
see yields reducing 75bps to 6.75% in 2016 and has since
remained relatively tight. The main focus for industrial
occupiers in Denmark is the Greater Copenhagen area. In
addition, there is prime triangle area in Jutland.
Occupier focus: Greater Copenhagen and beyond. The prime
market is characterised by Grade A properties with long lease
tenancy contracts, while secondary assets have less flexible
agreements and are therefore less appealing to potential
tenants. Greater Copenhagen has traditionally been the main
focus for occupiers, but other markets such as Vejle, Kolding
and Fredericia are now seeing better demand from occupiers.
Demand is rising and vacancy rates in Copenhagen are now at
the lowest level since the financial crisis. Prime logistics rents
increased 4.5% to 575 DKK/sqm/year (77.3 EUR/sqm/year) in
2016 and are forecast to remain around this level over the
medium term.
Investment focus: yield compression to continue. The
industrial investment market is small according to Cushman &
Wakefield, when compared with the office and retail sectors.
Following the financial crisis, prime yields drifted out to 7.5%
and remained around these levels until the end of 2015. As
demand increased in 2016, prime yields reduced by 75bps to
end the year at 6.75%. Thereafter, prime yields dipped to
6.5% in 1Q17 and have remained relatively tight. Yield
compression is driven by strong investor appetite, attractive
pricing on a relative basis (property is cheaper compared with
other fixed income alternatives), lack of stock and large
amount of equity available.
Outlook: stable rent. Based on Cushman & Wakefield’s
analysis, the warehouse segment has historically comprised a
small share of the investment market and this is not expected
to change. Investor appetite for prime Grade A investment
products will remain strong in the near term. Yields are
expected to bottom out at 6.50% in 2017, remain stable in
2018 and may start to soften from 2019 onwards due to
changes in financial conditions. On the occupier side, we
believe there is limited rental growth potential around
Copenhagen area in the near term, therefore rents are
expected to remain around current levels.
Denmark Economic Indicators
Source: Cushman & Wakefield, DBS Bank Denmark Industrial Indicators
Source: Cushman & Wakefield, DBS Bank
Denmark Industrial Rent, Capital Growth, Yield
Source: Cushman & Wakefield, DBS Bank
-6.0
-5.0
-4.0
-3.0
-2.0
-1.0
0.0
1.0
2.0
3.0
0.0
0.5
1.0
1.5
2.0
2.5
3.0
3.5
4.0
4.5
20
07
20
08
20
09
20
10
20
11
20
12
20
13
20
14
20
15
20
16
20
17
20
18
20
19
% p
a
%
CPI, LHS Base Rate, LHS GDP Growth, RHS
-4.0
-3.0
-2.0
-1.0
0.0
1.0
2.0
3.0
70
75
80
85
90
95
100
Industrial Production, LHS (2006=100)
Private Consumption (%), RHS
0.0
1.0
2.0
3.0
4.0
5.0
6.0
7.0
8.0
-30.0
-20.0
-10.0
0.0
10.0
20.0
200
7
200
8
200
9
201
0
201
1
201
2
201
3
201
4
201
5
201
6
201
7
201
8
201
9
%
% p
a
Rental Growth, LHS Capital Growth, LHS Yield, RHS
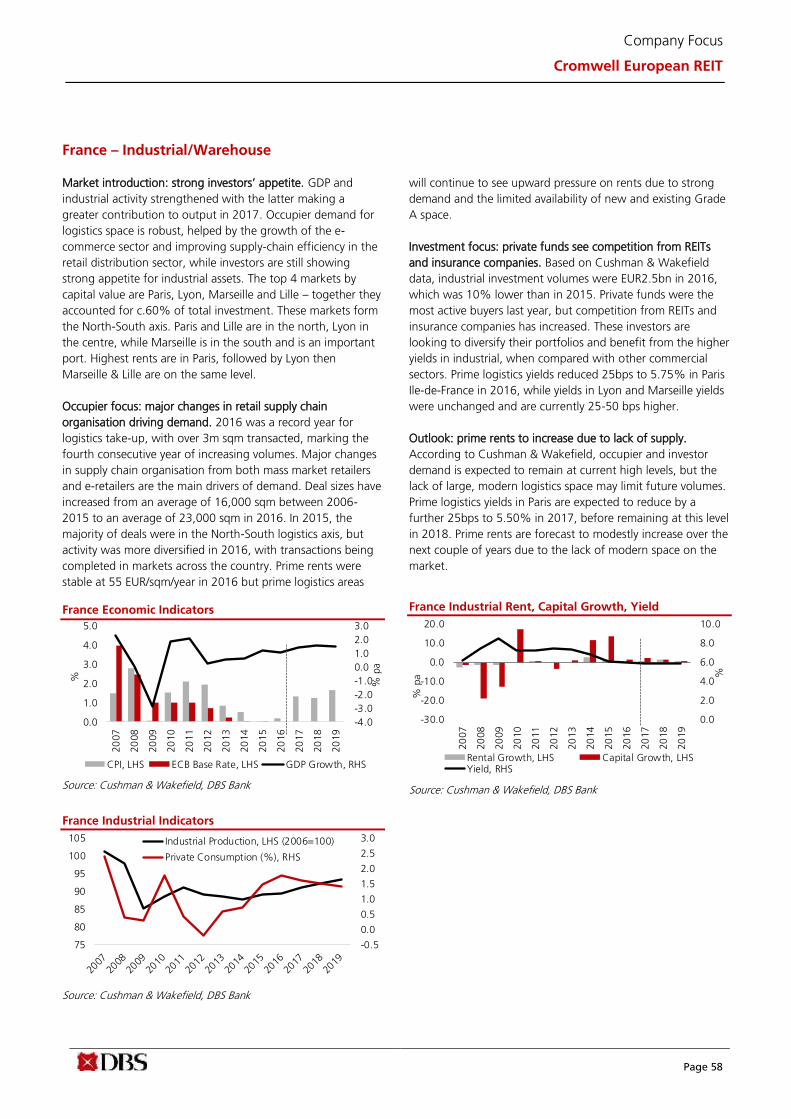
Page 58
Company Focus
Cromwell European REIT
France – Industrial/Warehouse
Market introduction: strong investors’ appetite. GDP and
industrial activity strengthened with the latter making a
greater contribution to output in 2017. Occupier demand for
logistics space is robust, helped by the growth of the e-
commerce sector and improving supply-chain efficiency in the
retail distribution sector, while investors are still showing
strong appetite for industrial assets. The top 4 markets by
capital value are Paris, Lyon, Marseille and Lille – together they
accounted for c.60% of total investment. These markets form
the North-South axis. Paris and Lille are in the north, Lyon in
the centre, while Marseille is in the south and is an important
port. Highest rents are in Paris, followed by Lyon then
Marseille & Lille are on the same level.
Occupier focus: major changes in retail supply chain
organisation driving demand. 2016 was a record year for
logistics take-up, with over 3m sqm transacted, marking the
fourth consecutive year of increasing volumes. Major changes
in supply chain organisation from both mass market retailers
and e-retailers are the main drivers of demand. Deal sizes have
increased from an average of 16,000 sqm between 2006-
2015 to an average of 23,000 sqm in 2016. In 2015, the
majority of deals were in the North-South logistics axis, but
activity was more diversified in 2016, with transactions being
completed in markets across the country. Prime rents were
stable at 55 EUR/sqm/year in 2016 but prime logistics areas
will continue to see upward pressure on rents due to strong
demand and the limited availability of new and existing Grade
A space.
Investment focus: private funds see competition from REITs
and insurance companies. Based on Cushman & Wakefield
data, industrial investment volumes were EUR2.5bn in 2016,
which was 10% lower than in 2015. Private funds were the
most active buyers last year, but competition from REITs and
insurance companies has increased. These investors are
looking to diversify their portfolios and benefit from the higher
yields in industrial, when compared with other commercial
sectors. Prime logistics yields reduced 25bps to 5.75% in Paris
Ile-de-France in 2016, while yields in Lyon and Marseille yields
were unchanged and are currently 25-50 bps higher.
Outlook: prime rents to increase due to lack of supply.
According to Cushman & Wakefield, occupier and investor
demand is expected to remain at current high levels, but the
lack of large, modern logistics space may limit future volumes.
Prime logistics yields in Paris are expected to reduce by a
further 25bps to 5.50% in 2017, before remaining at this level
in 2018. Prime rents are forecast to modestly increase over the
next couple of years due to the lack of modern space on the
market.
France Economic Indicators
Source: Cushman & Wakefield, DBS Bank France Industrial Indicators
Source: Cushman & Wakefield, DBS Bank
France Industrial Rent, Capital Growth, Yield
Source: Cushman & Wakefield, DBS Bank
-0.5
0.0
0.5
1.0
1.5
2.0
2.5
3.0
75
80
85
90
95
100
105 Industrial Production, LHS (2006=100)
Private Consumption (%), RHS
-4.0
-3.0
-2.0
-1.0
0.0
1.0
2.0
3.0
0.0
1.0
2.0
3.0
4.0
5.0
20
07
20
08
20
09
20
10
20
11
20
12
20
13
20
14
20
15
20
16
20
17
20
18
20
19
% p
a
%
CPI, LHS ECB Base Rate, LHS GDP Growth, RHS
0.0
2.0
4.0
6.0
8.0
10.0
-30.0
-20.0
-10.0
0.0
10.0
20.0
20
07
20
08
20
09
20
10
20
11
20
12
20
13
20
14
20
15
20
16
20
17
20
18
20
19
%
% p
a
Rental Growth, LHS Capital Growth, LHSYield, RHS

Page 59
Company Focus
Cromwell European REIT
Germany – Industrial/Warehouse
Market introduction: good expansion appetite. According to
Cushman & Wakefield, the German industrial sector had a
positive 2017. This translated to good appetite for investment
and expansion in the top industrial hubs, driven by e
commerce providers and manufacturers. German key
industrial locations tend to be within the proximity of major
urban areas such as Munich, Berlin, Hamburg. Manufacturing
is particularly prevalent in the Bavaria and Baden-Wurttemberg
regions, near the key cities of Munich and Stuttgart. Key
logistics warehousing locations focused on areas near major
motorway intersections while the largest freight airports are
located in Frankfurt and Leipzig.
Occupier focus: weak availability of large and modern stocks.
Based on Cushman & Wakefield’s analysis, occupier demand is
stable and the outlook for the leasing market remains positive.
Logistics occupiers are targeting both first-tier and second-tier
locations as they search for opportunities to optimise their
distribution networks across the country. The weak availability
of large, modern, Grade A stock remains a key feature of the
market, however. Developers are slowly responding to this
and speculative construction has improved, but it is still well
below what is needed to meet current requirements. The
availability of land is shrinking and land prices are rising, which
is forcing developers and occupiers to look outside of the
traditional industrial hubs for opportunities. Tenants looking
for smaller warehouse and distribution spaces are increasingly
turning to refurbishments of older stock in urban areas.
Demand for this segment of the market is mainly driven by
online retailers looking for distribution hubs closer to
customers.
Investment focus: more buyers targeting second tier.
Investment demand is driven primarily by local institutions and
property companies, although overseas buyers have been
more active recently. Prime supply constraints have weighed
on volumes in core locations but more buyers are now
targeting second tier and secondary markets to take
advantage of the higher yield profiles, while forward funding
deals and properties with redevelopment potential are also in
demand. Prime logistics yields reduced by an average of 25bps
in 2016 and are forecast to remain around current levels.
Outlook: rent to remain on uptrend. According to Cushman &
Wakefield, demand for logistics and warehouse space is
forecast to remain strong, with the need for restructuring
delivery chains and networks to satisfy consumers’ demand for
fast delivery bringing a new dynamic to the market. The
supply constraints are not expected to ease any time soon and
rents are expected to remain under pressure to rise across
many core locations.
Germany Economic Indicators
Source: Cushman & Wakefield, DBS Bank
Germany Industrial Indicators
Source: Cushman & Wakefield, DBS Bank
Germany Industrial Rent, Capital Value and Yield
Source: Cushman & Wakefield, DBS Bank
-8.0
-6.0
-4.0
-2.0
-
2.0
4.0
6.0
-6.0
-4.0
-2.0
0.0
2.0
4.0
6.0
20
07
20
08
20
09
20
10
20
11
20
12
20
13
20
14
20
15
20
16
20
17
20
18
20
19
CPI Base Rate GDP Growth
%
% p
a
0.0
0.5
1.0
1.5
2.0
2.5
-30.0
-20.0
-10.0
0.0
10.0
20.0
20
07
20
08
20
09
20
10
20
11
20
12
20
13
20
14
20
15
20
16
20
17
20
18
20
19
GVA Manufacturing Real Private Consumption
%
%
0.0
2.0
4.0
6.0
8.0
-10.0
-5.0
0.0
5.0
10.0
15.0
20.0
20
07
20
08
20
09
20
10
20
11
20
12
20
13
20
14
20
15
20
16
20
17
20
18
20
19
Rental Growth, LHS Capital Growth, LHSYield, RHS
% p
a
%

Page 60
Company Focus
Cromwell European REIT
Italy – Office
Market introduction: Milan and Rome are main office markets.
According to Cushman & Wakefield, the positive trend
registered in the Italian office market over the past two years
continues. The Milan occupier market, in particular, saw a
high level of activity and an increase in prime rental value.
Within the investment market, Milan and Rome have been
confirmed as the most attractive cities, mainly for city center
opportunities; together they counted for the majority of the
office investment in Italy. Milan’s occupational base is
dominated by financial and business services while Rome is
home to many government departments, hence the public
sector accounts for a larger proportion of occupier demand.
Occupier focus: prefer high-quality and iconic properties. The
occupational market continued to be active, particularly in
Milan, which recorded the highest level of take up ever
registered in the first quarter of a year in the last decade,
based on Cushman & Wakefield data. Occupiers confirm their
orientation towards high-quality and iconic properties. CBD
and Periphery have been the most active submarkets,
registering the largest transactions of the quarter (> 5,000
sqm), with the IT/communication sector playing a significant
role. In today's market the pipeline is improving, however, due
to the current lack of grade A availability, a number of assets
are being pre-leased before being officially on the market. In
Rome, occupational figures were in line with the previous
year, although the market continues to be characterised by
small-size transactions, especially in the Centre and CBD areas.
Quality is a driver for demand and there has been a marginal
increase in grade A green take up. Pipeline remains tied to
landlords securing a tenant before beginning construction.
Investment focus: core investment assets are most preferred.
The office investment market continued its dynamic trend,
with international investors confirming their interest. Milan
maintained its leadership in the country, favored by the higher
quality of stock, the perception of lower risk and greater
number of opportunities that meet investors’ requirements.
Interest in the Rome market remains. Core investment assets
are the most attractive for investors; however, due to limited
availability of quality products, there is an increasing demand
for value-added opportunities in core locations.
Outlook: spread between prime and secondary yields to
increase further. According to Cushman & Wakefield, the
office sector is expected to continue to drive investments
throughout the year, with the spread between prime and
secondary yields increasing further. Core investors are the
main players and opportunistic investors will continue to look
at the Italian market with interest.
Italy Economic Indicators
Source: Cushman & Wakefield, DBS Bank
Italy Office Demand, Supply and Vacancy
Source: Cushman & Wakefield, DBS Bank
Italy Office Rent, Capital Value and Yield
Source: Cushman & Wakefield, DBS Bank
-6.0
-4.0
-2.0
0.0
2.0
4.0
-1.0
0.0
1.0
2.0
3.0
4.0
5.0
20
07
20
08
20
09
20
10
20
11
20
12
20
13
20
14
20
15
20
16
20
17
20
18
20
19
% p
a
%
CPI, LHS Base Rate, LHS GDP Growth, RHS
0.02.04.06.08.010.012.014.016.0
0
100
200
300
400
500
600
20
07
20
08
20
09
20
10
20
11
20
12
20
13
20
14
20
15
20
16
20
17
20
18
20
19
%
SQ
M,
Thousa
nds
Completions, LHS Take-up, LHSVacancy Rate, RHS
0.0
1.0
2.0
3.0
4.0
5.0
6.0
-30.0
-20.0
-10.0
0.0
10.0
20.0
30.0
200
7
200
8
200
9
201
0
201
1
201
2
201
3
201
4
201
5
201
6
201
7
201
8
201
9
%
% p
a
Rental Growth, LHS Capital Growth, LHSYield, RHS

Page 61
Company Focus
Cromwell European REIT
Netherlands – Office
Market introduction: Amsterdam the largest market.
According to Cushman & Wakefield, business confidence
indicators was strong in 2017, with firms showing a good
appetite for investment and staff hiring, despite the
uncertainty in the lead up to the general election in March.
The office market is benefitting from this favourable
environment and demand from both occupiers and investors
remains healthy. The Netherlands’ main office markets are
located in the four key economic centres of the country:
Amsterdam, Rotterdam, The Hague and Utrecht. Amsterdam
is by the far the largest market, and is popular with occupiers
in Tech & Media sector or with firms operating in financial
services, clustered in the city centre or in the South Axis
submarket.
Occupier focus: high demand for modern multi-functional
buildings. There was a healthy flow of new requirements
across the main office markets. Demand for modern
multifunctional office buildings in the Randstad area is high
and rising, driven mainly by Media and Technology firms and
the Serviced Office sector. Demand is stable in other regional
markets. Healthy demand and office stock conversion to other
uses (e.g. hotels) have pushed vacancy rates lower in
Amsterdam. Prime rents were generally stable in the majority
of office markets in 2016, but there were some pockets of
rental growth in submarkets such as Rotterdam CBD,
Amsterdam - Centre and Hoofddorp. Despite limited new
supply and decreasing availability of prime space, rental
growth is forecast to be limited in 2017-18.
Investment focus: yield compression and double-digit capital
value growth in the last two years. The weight of domestic
and international capital that was invested in Dutch offices in
2015/16 compressed prime yields by an average of 120bps in
two years, resulting in double-digit capital value growth.
Investors are mainly focusing on core assets in Amsterdam,
but there is also strong appetite for quality assets in
Rotterdam, The Hague and Utrecht. The supply of prime stock
is dwindling across all these locations, however, and this
combined with favourable economic conditions and low
interest rates will ensure prime yields remain under pressure to
reduce further in the near term.
Outlook: Brexit could a be a potential positive. Cushman &
Wakefield believes that with the cloud of political uncertainty
dissipating, the office market should expect confidence to rise
further among occupiers and investors in 2017. Some
investors are viewing Brexit as a potentially positive driver for
the Dutch office market if firms relocate from the UK,
although there is little evidence of this happening just yet.
Speculative development is failing to keep pace with demand
and the supply constraints in core locations are forecast to
continue.
Netherlands Economic Indicators, % pa
Source: Cushman & Wakefield, DBS Bank Netherlands Office Demand, supply & Vacancy (%)
Source: Cushman & Wakefield, DBS Bank
Netherlands Office Rent, Capital Value and Yield (%)
Source: Cushman & Wakefield, DBS Bank
-5.0-4.0-3.0-2.0-1.0 - 1.0 2.0 3.0 4.0 5.0
-4.0-3.0-2.0-1.00.01.02.03.04.0
20
07
20
08
20
09
20
10
20
11
20
12
20
13
20
14
20
15
20
16
20
17
20
18
20
19
CPI Inflation, LHS Base Rate, LHSGDP Growth, RHS
%
% p
a
0
4
8
12
16
0.0
0.2
0.4
0.6
0.8
20
07
20
08
20
09
20
10
20
11
20
12
20
13
20
14
20
15
20
16
20
17
20
18
20
19
Mill
ions
Sqm
Completions, LHS Take-up, LHSVacancy Rate, RHS
%
0.0
2.0
4.0
6.0
8.0
-24
-16
-8
0
8
16
24
200
7
200
8
200
9
201
0
201
1
201
2
201
3
201
4
201
5
201
6
201
7
201
8
201
9
Rental Growth, LHS Capital Growth, LHS Yield, RHS
% %

Page 62
Company Focus
Cromwell European REIT
Netherlands – Industrial/Warehouse
Market introduction: healthy take-up in 2017. We understand
that the take-up of industrial space in 2017 was healthy, with
1H17 takeup reporting a 16% y-o-y growth which was the
highest take-up figure ever recorded during the first 6 months
of any year. At the same time, vacancy remains lower in the
industrial property segment. Dutch logistics market is one of
the more established in Europe owing also to the strategic
position of the country. Main markets are Amsterdam
Schiphol Airport and the port of Rotterdam. These two
markets count for more than 38% of total transactions in
2016. Other important markets are Eindhoven, The Hague and
Utrecht.
Occupier focus. Demand driven by SME and e-commerce. The
drivers behind this take-up are the growth of the SME sector
and e-commerce. We see that SME turnover has been rising
for some time and this is currently having an impact on the
demand for industrial space. Also, the improved take-up of
logistics space cannot be viewed separately from the rising
emergence of e-commerce. That influence will only become
more pronounced in the coming years. Not only has the take-
up of logistics property grown, the transactions are also
becoming ever larger. During the first 6 months of 2017, the
largest logistics transaction ever was realised with the
construction of a logistics centre by Inditex of 170,000 sqm in
Lelystad. The complex is intended for the distribution of
various fashion brands.
Investment focus: prime yields dropped further due to limited
supply and growing demand. Prime investment products on
logistic hotspots in the country remained limited during the
first half of 2017. Emerging markets continue to benefit as
investors’ interest further grew. Due to the limited supply and
growing investors’ demand, prime yields for logistic hotspots
in the country further dropped with an average of 11 bps for
the southern cities in the country.
Outlook: growth will moderate. According to Cushman &
Wakefield, prime rental value growth for this year is foreseen
in line with 2016. Rents are expected to decline both in 2018
and 2019 due to shift in demand in emerging locations. Prime
yields are still slightly compressing this year but then are
expected to remain stable in 2018-19.
Netherlands Economic Indicators
Source: Cushman & Wakefield, DBS Bank
Netherlands Industrial Indicators
Source: Cushman & Wakefield, DBS Bank
Netherlands Industrial Rent, Capital Growth, Yield
Source: Cushman & Wakefield, DBS Bank
-5.0-4.0-3.0-2.0-1.00.01.02.03.04.05.0
0.00.51.01.52.02.53.03.54.04.5
20
07
20
08
20
09
20
10
20
11
20
12
20
13
20
14
20
15
20
16
20
17
20
18
20
19
% p
a
%
CPI, LHS Base Rate, LHS GDP Growth, RHS
-3.0
-2.0
-1.0
0.0
1.0
2.0
3.0
92
94
96
98
100
102
104
106
Private Consumption (%), RHS
Industrial Production, LHS (2006=100)
0.0
2.0
4.0
6.0
8.0
10.0
-30.0
-20.0
-10.0
0.0
10.0
20.0
30.0
20
07
20
08
20
09
20
10
20
11
20
12
20
13
20
14
20
15
20
16
20
17
20
18
20
19
%
% p
a
Rental Growth, LHS Capital Growth, LHS Yield, RHS

Page 63
Company Focus
Cromwell European REIT
Summary of Portfolio as at 30 April 2017
Office properties
No Property Country Region %
Ownership
Land
Tenure
Lettable
Area
(sqm)
Occupancy @
30Apr17
FY18F Gross
Revenue
(EUR’m)*
Cushman
Valuation
(EUR’m)
Colliers
Valuation
(EUR’m)
Agreed
Purchase
Price
(EUR’m)
WALE
(years)
WALT
(years)
1 Haagse Port Netherlands The Hague 100.0% Perpetual
leasehold
68,390 91.2% 13.1 158.8 152.4 158.8 5.7 5.7
2 Central Plaza Netherlands Rotterdam 100.0% Leasehold
interest
ending 31
July 2088
33,179 97.7% 11.9 157.5 152.7 156.8 9.3 9.3
3 De
Ruijterkade
Netherlands Amsterdam 100.0% Leasehold
interest
ending 30
June 2088
8,741 100.0% 2.4 40.3 35.0 36.4 8.3 8.3
4 Koningskade Netherlands The Hague 100.0% Perpetual
leasehold
5,696 100.0% 1.4 17.0 15.6 16.6 9.5 9.5
5 Blaak Netherlands Rotterdam 100.0% Freehold 7,788 85.0% 1.4 16.7 15.7 16.0 6.4 6.4
6 Milano Pizza
Affari
Italy Lombardy 100.0% Freehold 7,602 100.0% 3.9 81.7 77.6 81.7 3.3 3.7
7 Roma Amba
Aradam
Italy Lazio 100.0% Freehold 16,689 100.0% 3.6 48.3 49.8 49.8 5.7 5.7
8 Roma
Pianciani
Italy Lazio 100.0% Freehold 10,725 100.0% 3.0 33.9 33.9 33.9 5.7 5.7
9 Assago Italy Lombardy 100.0% Freehold 16,326 82.9% 2.4 27.6 26.8 27.6 5.5 6.0
10 Milano
Nervesa
Italy Lombardy 100.0% Freehold 9,713 100.0% 2.2 22.5 25.4 25.4 4.7 4.7
11 Firenze Italy Tuscany 100.0% Freehold 9,150 100.0% 1.5 17.4 16.7 17.4 6.7 6.7
12 Cuneo Italy Piedmont 100.0% Freehold 8,795 100.0% 0.8 9.6 9.7 9.6 5.7 5.7
13 Mestre Italy Veneto 100.0% Freehold 4,100 100.0% 0.5 5.1 5.7 5.6 6.7 6.7
Total
206,895 94.8% 48.1 636.1 617.0 635.4 6.9 7.1
* FY18F gross revenue are DBS Bank estimates
Source: CERT, DBS Bank
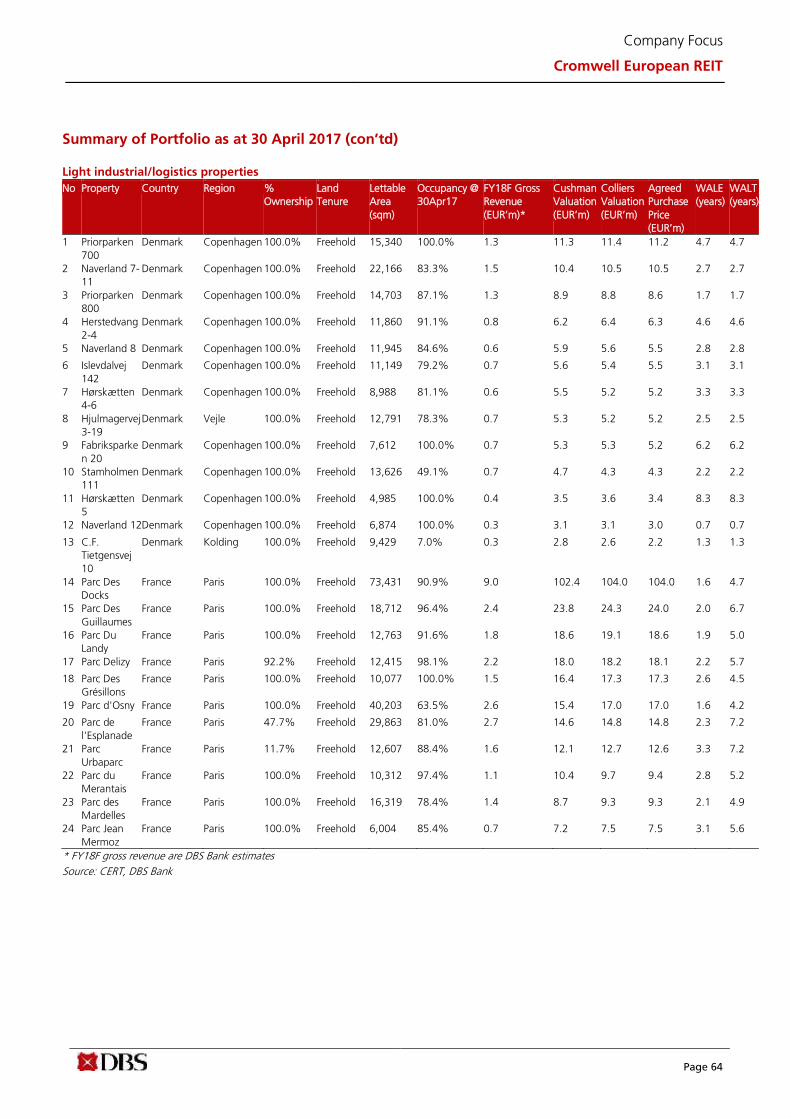
Page 64
Company Focus
Cromwell European REIT
Summary of Portfolio as at 30 April 2017 (con’td)
Light industrial/logistics properties
No Property Country Region %
Ownership
Land
Tenure
Lettable
Area
(sqm)
Occupancy @
30Apr17
FY18F Gross
Revenue
(EUR’m)*
Cushman
Valuation
(EUR’m)
Colliers
Valuation
(EUR’m)
Agreed
Purchase
Price
(EUR’m)
WALE
(years)
WALT
(years)
1 Priorparken
700
Denmark Copenhagen 100.0% Freehold 15,340 100.0% 1.3 11.3 11.4 11.2 4.7 4.7
2 Naverland 7-
11
Denmark Copenhagen 100.0% Freehold 22,166 83.3% 1.5 10.4 10.5 10.5 2.7 2.7
3 Priorparken
800
Denmark Copenhagen 100.0% Freehold 14,703 87.1% 1.3 8.9 8.8 8.6 1.7 1.7
4 Herstedvang
2-4
Denmark Copenhagen 100.0% Freehold 11,860 91.1% 0.8 6.2 6.4 6.3 4.6 4.6
5 Naverland 8 Denmark Copenhagen 100.0% Freehold 11,945 84.6% 0.6 5.9 5.6 5.5 2.8 2.8
6 Islevdalvej
142
Denmark Copenhagen 100.0% Freehold 11,149 79.2% 0.7 5.6 5.4 5.5 3.1 3.1
7 Hørskætten
4-6
Denmark Copenhagen 100.0% Freehold 8,988 81.1% 0.6 5.5 5.2 5.2 3.3 3.3
8 Hjulmagervej
3-19
Denmark Vejle 100.0% Freehold 12,791 78.3% 0.7 5.3 5.2 5.2 2.5 2.5
9 Fabriksparke
n 20
Denmark Copenhagen 100.0% Freehold 7,612 100.0% 0.7 5.3 5.3 5.2 6.2 6.2
10 Stamholmen
111
Denmark Copenhagen 100.0% Freehold 13,626 49.1% 0.7 4.7 4.3 4.3 2.2 2.2
11 Hørskætten
5
Denmark Copenhagen 100.0% Freehold 4,985 100.0% 0.4 3.5 3.6 3.4 8.3 8.3
12 Naverland 12 Denmark Copenhagen 100.0% Freehold 6,874 100.0% 0.3 3.1 3.1 3.0 0.7 0.7
13 C.F.
Tietgensvej
10
Denmark Kolding 100.0% Freehold 9,429 7.0% 0.3 2.8 2.6 2.2 1.3 1.3
14 Parc Des
Docks
France Paris 100.0% Freehold 73,431 90.9% 9.0 102.4 104.0 104.0 1.6 4.7
15 Parc Des
Guillaumes
France Paris 100.0% Freehold 18,712 96.4% 2.4 23.8 24.3 24.0 2.0 6.7
16 Parc Du
Landy
France Paris 100.0% Freehold 12,763 91.6% 1.8 18.6 19.1 18.6 1.9 5.0
17 Parc Delizy France Paris 92.2% Freehold 12,415 98.1% 2.2 18.0 18.2 18.1 2.2 5.7
18 Parc Des
Grésillons
France Paris 100.0% Freehold 10,077 100.0% 1.5 16.4 17.3 17.3 2.6 4.5
19 Parc d'Osny France Paris 100.0% Freehold 40,203 63.5% 2.6 15.4 17.0 17.0 1.6 4.2
20 Parc de
l'Esplanade
France Paris 47.7% Freehold 29,863 81.0% 2.7 14.6 14.8 14.8 2.3 7.2
21 Parc
Urbaparc
France Paris 11.7% Freehold 12,607 88.4% 1.6 12.1 12.7 12.6 3.3 7.2
22 Parc du
Merantais
France Paris 100.0% Freehold 10,312 97.4% 1.1 10.4 9.7 9.4 2.8 5.2
23 Parc des
Mardelles
France Paris 100.0% Freehold 16,319 78.4% 1.4 8.7 9.3 9.3 2.1 4.9
24 Parc Jean
Mermoz
France Paris 100.0% Freehold 6,004 85.4% 0.7 7.2 7.5 7.5 3.1 5.6
* FY18F gross revenue are DBS Bank estimates
Source: CERT, DBS Bank
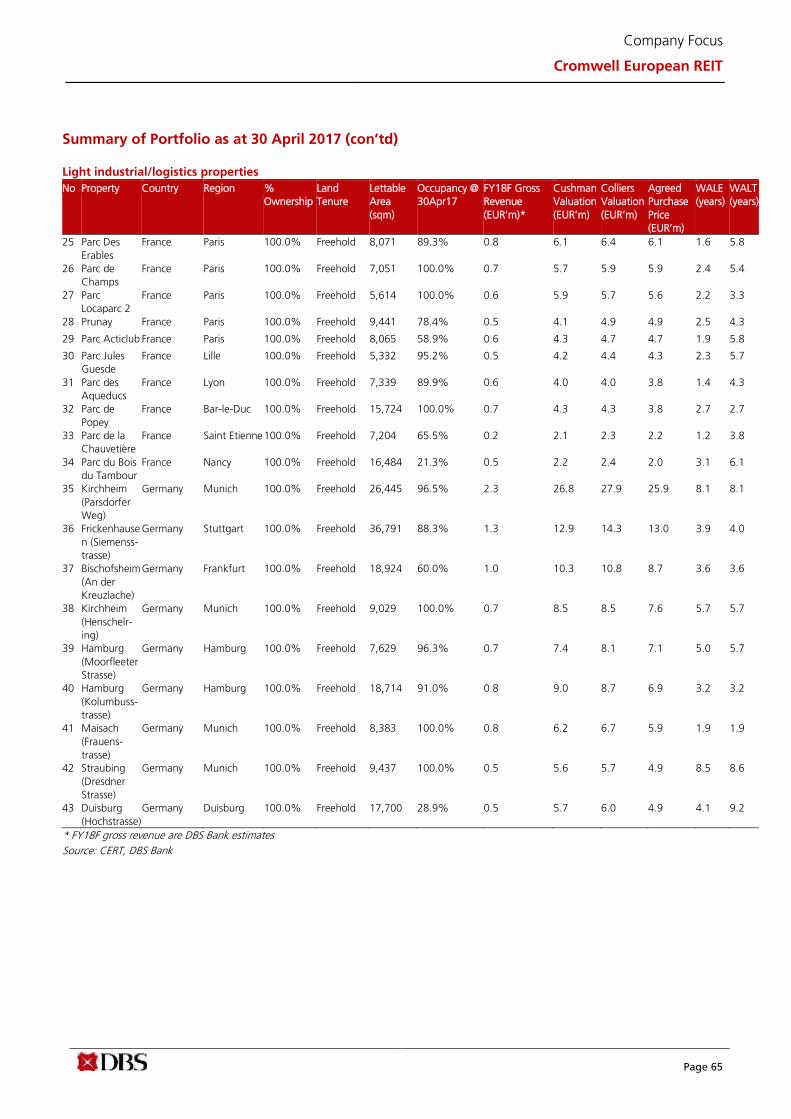
Page 65
Company Focus
Cromwell European REIT
Summary of Portfolio as at 30 April 2017 (con’td)
Light industrial/logistics properties
No Property Country Region %
Ownership
Land
Tenure
Lettable
Area
(sqm)
Occupancy @
30Apr17
FY18F Gross
Revenue
(EUR’m)*
Cushman
Valuation
(EUR’m)
Colliers
Valuation
(EUR’m)
Agreed
Purchase
Price
(EUR’m)
WALE
(years)
WALT
(years)
25 Parc Des
Erables
France Paris 100.0% Freehold 8,071 89.3% 0.8 6.1 6.4 6.1 1.6 5.8
26 Parc de
Champs
France Paris 100.0% Freehold 7,051 100.0% 0.7 5.7 5.9 5.9 2.4 5.4
27 Parc
Locaparc 2
France Paris 100.0% Freehold 5,614 100.0% 0.6 5.9 5.7 5.6 2.2 3.3
28 Prunay France Paris 100.0% Freehold 9,441 78.4% 0.5 4.1 4.9 4.9 2.5 4.3
29 Parc Acticlub France Paris 100.0% Freehold 8,065 58.9% 0.6 4.3 4.7 4.7 1.9 5.8
30 Parc Jules
Guesde
France Lille 100.0% Freehold 5,332 95.2% 0.5 4.2 4.4 4.3 2.3 5.7
31 Parc des
Aqueducs
France Lyon 100.0% Freehold 7,339 89.9% 0.6 4.0 4.0 3.8 1.4 4.3
32 Parc de
Popey
France Bar-le-Duc 100.0% Freehold 15,724 100.0% 0.7 4.3 4.3 3.8 2.7 2.7
33 Parc de la
Chauvetière
France Saint Etienne 100.0% Freehold 7,204 65.5% 0.2 2.1 2.3 2.2 1.2 3.8
34 Parc du Bois
du Tambour
France Nancy 100.0% Freehold 16,484 21.3% 0.5 2.2 2.4 2.0 3.1 6.1
35 Kirchheim
(Parsdorfer
Weg)
Germany Munich 100.0% Freehold 26,445 96.5% 2.3 26.8 27.9 25.9 8.1 8.1
36 Frickenhause
n (Siemenss-
trasse)
Germany Stuttgart 100.0% Freehold 36,791 88.3% 1.3 12.9 14.3 13.0 3.9 4.0
37 Bischofsheim
(An der
Kreuzlache)
Germany Frankfurt 100.0% Freehold 18,924 60.0% 1.0 10.3 10.8 8.7 3.6 3.6
38 Kirchheim
(Henschelr-
ing)
Germany Munich 100.0% Freehold 9,029 100.0% 0.7 8.5 8.5 7.6 5.7 5.7
39 Hamburg
(Moorfleeter
Strasse)
Germany Hamburg 100.0% Freehold 7,629 96.3% 0.7 7.4 8.1 7.1 5.0 5.7
40 Hamburg
(Kolumbuss-
trasse)
Germany Hamburg 100.0% Freehold 18,714 91.0% 0.8 9.0 8.7 6.9 3.2 3.2
41 Maisach
(Frauens-
trasse)
Germany Munich 100.0% Freehold 8,383 100.0% 0.8 6.2 6.7 5.9 1.9 1.9
42 Straubing
(Dresdner
Strasse)
Germany Munich 100.0% Freehold 9,437 100.0% 0.5 5.6 5.7 4.9 8.5 8.6
43 Duisburg
(Hochstrasse)
Germany Duisburg 100.0% Freehold 17,700 28.9% 0.5 5.7 6.0 4.9 4.1 9.2
* FY18F gross revenue are DBS Bank estimates
Source: CERT, DBS Bank
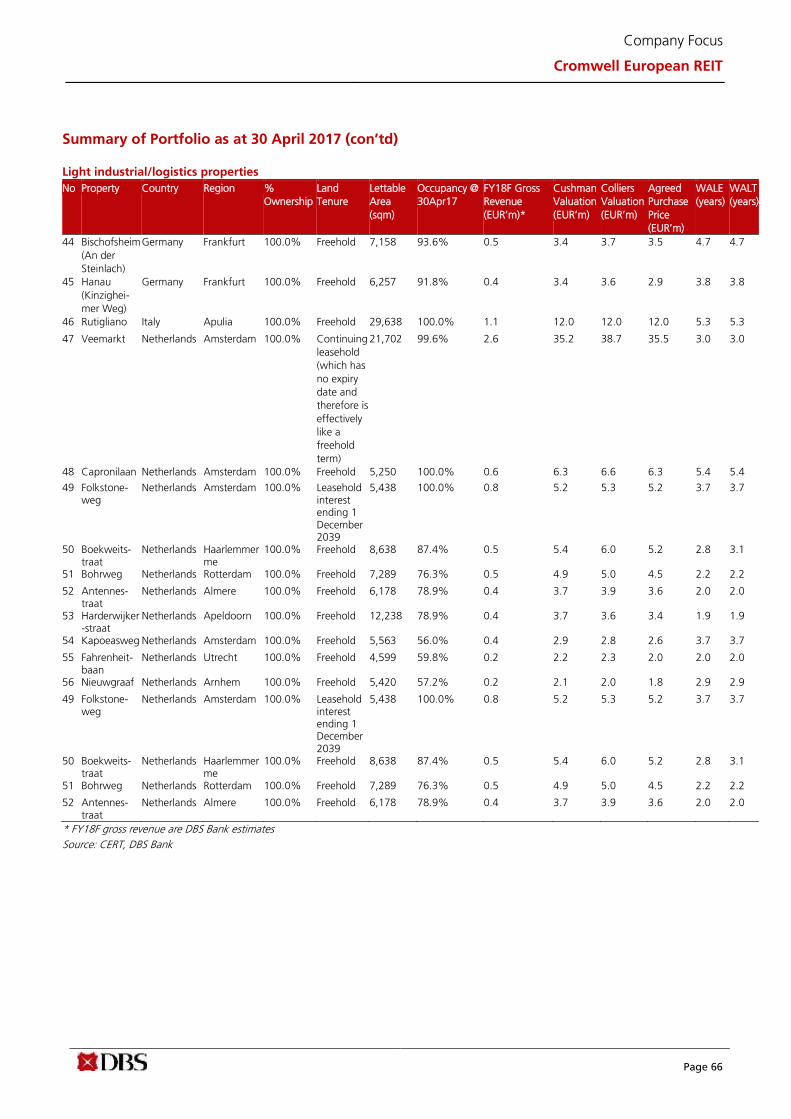
Page 66
Company Focus
Cromwell European REIT
Summary of Portfolio as at 30 April 2017 (con’td)
Light industrial/logistics properties
No Property Country Region %
Ownership
Land
Tenure
Lettable
Area
(sqm)
Occupancy @
30Apr17
FY18F Gross
Revenue
(EUR’m)*
Cushman
Valuation
(EUR’m)
Colliers
Valuation
(EUR’m)
Agreed
Purchase
Price
(EUR’m)
WALE
(years)
WALT
(years)
44 Bischofsheim
(An der
Steinlach)
Germany Frankfurt 100.0% Freehold 7,158 93.6% 0.5 3.4 3.7 3.5 4.7 4.7
45 Hanau
(Kinzighei-
mer Weg)
Germany Frankfurt 100.0% Freehold 6,257 91.8% 0.4 3.4 3.6 2.9 3.8 3.8
46 Rutigliano Italy Apulia 100.0% Freehold 29,638 100.0% 1.1 12.0 12.0 12.0 5.3 5.3
47 Veemarkt Netherlands Amsterdam 100.0% Continuing
leasehold
(which has
no expiry
date and
therefore is
effectively
like a
freehold
term)
21,702 99.6% 2.6 35.2 38.7 35.5 3.0 3.0
48 Capronilaan Netherlands Amsterdam 100.0% Freehold 5,250 100.0% 0.6 6.3 6.6 6.3 5.4 5.4
49 Folkstone-weg
Netherlands Amsterdam 100.0% Leasehold interest ending 1 December 2039
5,438 100.0% 0.8 5.2 5.3 5.2 3.7 3.7
50 Boekweits-traat
Netherlands Haarlemmerme
100.0% Freehold 8,638 87.4% 0.5 5.4 6.0 5.2 2.8 3.1
51 Bohrweg Netherlands Rotterdam 100.0% Freehold 7,289 76.3% 0.5 4.9 5.0 4.5 2.2 2.2
52 Antennes-traat
Netherlands Almere 100.0% Freehold 6,178 78.9% 0.4 3.7 3.9 3.6 2.0 2.0
53 Harderwijker-straat
Netherlands Apeldoorn 100.0% Freehold 12,238 78.9% 0.4 3.7 3.6 3.4 1.9 1.9
54 Kapoeasweg Netherlands Amsterdam 100.0% Freehold 5,563 56.0% 0.4 2.9 2.8 2.6 3.7 3.7
55 Fahrenheit-baan
Netherlands Utrecht 100.0% Freehold 4,599 59.8% 0.2 2.2 2.3 2.0 2.0 2.0
56 Nieuwgraaf Netherlands Arnhem 100.0% Freehold 5,420 57.2% 0.2 2.1 2.0 1.8 2.9 2.9
49 Folkstone-weg
Netherlands Amsterdam 100.0% Leasehold interest ending 1 December 2039
5,438 100.0% 0.8 5.2 5.3 5.2 3.7 3.7
50 Boekweits-traat
Netherlands Haarlemmerme
100.0% Freehold 8,638 87.4% 0.5 5.4 6.0 5.2 2.8 3.1
51 Bohrweg Netherlands Rotterdam 100.0% Freehold 7,289 76.3% 0.5 4.9 5.0 4.5 2.2 2.2
52 Antennes-traat
Netherlands Almere 100.0% Freehold 6,178 78.9% 0.4 3.7 3.9 3.6 2.0 2.0
* FY18F gross revenue are DBS Bank estimates
Source: CERT, DBS Bank

Page 67
Company Focus
Cromwell European REIT
Summary of Portfolio as at 30 April 2017 (con’td) Light industrial/logistics properties
No Property Country Region %
Ownership
Land
Tenure
Lettable
Area
(sqm)
Occupancy @
30Apr17
FY18F Gross
Revenue
(EUR’m)
Cushman
Valuation
(EUR’m)
Colliers
Valuation
(EUR’m)
Agreed
Purchase
Price
(EUR’m)
WALE
(years)
WALT
(years)
53 Harderwijker-straat
Netherlands Apeldoorn 100.0% Freehold 12,238 78.9% 0.4 3.7 3.6 3.4 1.9 1.9
54 Kapoeasweg Netherlands Amsterdam 100.0% Freehold 5,563 56.0% 0.4 2.9 2.8 2.6 3.7 3.7
55 Fahrenheit-baan
Netherlands Utrecht 100.0% Freehold 4,599 59.8% 0.2 2.2 2.3 2.0 2.0 2.0
56 Nieuwgraaf Netherlands Arnhem 100.0% Freehold 5,420 57.2% 0.2 2.1 2.0 1.8 2.9 2.9
Total 762,916 82.9% 59.9 550.4 567.5 545.1 3.0 4.7
(1) Although Stamholmen 111 currently has a low occupancy rate due to the relatively low demand for secondary offices in the area, a new tenant is expected to lease space at the property and the lease is currently in the process of being approved. The new tenant would increase the occupancy rate from 49.1% to 63.7%. (2) Although C.F. Tietgensvej 10 currently has a low occupancy rate, a new tenant has signed a lease for 2,658 sqm of the property for a 10-year term. The new tenant would increase the occupancy rate from 7.0% to 35.0%. (3) In respect of Parc Delizy, CERT will own 92.2% of the whole Property (4) In respect of Parc de l’Esplanade, CERT will own three buildings wholly; and have co-ownership in two clusters of buildings, with 58.1% ownership of one larger cluster of buildings and 47.7% ownership of a small cluster of buildings. (5) In respect of Parc Urbaparc, CERT will own 6 buildings and one small unit in one of the buildings Urbaparc 3. CERT will own 11.7% in Urbaparc 3. CERT will hold 100% of the rest of this Property. (6) Parc Acticlub is a property which leases multiple small units to its tenants. The occupancy rate was at approximately 95% until March 2016, and subsequently decreased to 58.9% following several tenant bankruptcies. However, two new leases have been signed which increases the occupancy rate to 66%. (7) Parc du Bois du Tambour has a low occupancy rate due to its location and the rental market in the area. There are discussions with a new tenant to take up approximately 8,493 sqm of space which involves investing capital expenditure of approximately EUR2.0m to undertake works on site in order to secure the tenant. The new tenant would increase the occupancy rate to 73%. (8) Duisburg (Hochstrasse) is a property built to suit the former landlord of the property, which consists of a warehouse, offices, canteen and showroom. The occupancy rate for Duisburg (Hochstrasse) is low due to the lack of demand for such premises in an industrial area, the limited access to the units in the property and general wear and tear related to the property. However, the Property Manager is in advanced discussions with a potential tenant to lease part of the property for a 12-year term. The potential tenant has indicated that it is willing to lease some office areas which have been previously considered as a structural void. The new lease would increase the occupancy rate to 60%. (9) The occupancy rate of Kapoeasweg is low due to the bankruptcy of a tenant which occurred at the end of 2016. However, the Property Manager is currently in discussions with two potential tenants to lease the vacant units of the property. (10) The occupancy rate of Nieuwgraaf is low due to the challenging climate caused by the global financial crisis. However, as the economy improves and the businesses of the areas surrounding the recover, the Property Manager expects to increase the occupancy rate of the property. ** FY18F gross revenue are DBS Bank estimates Source: CERT, DBS Bank
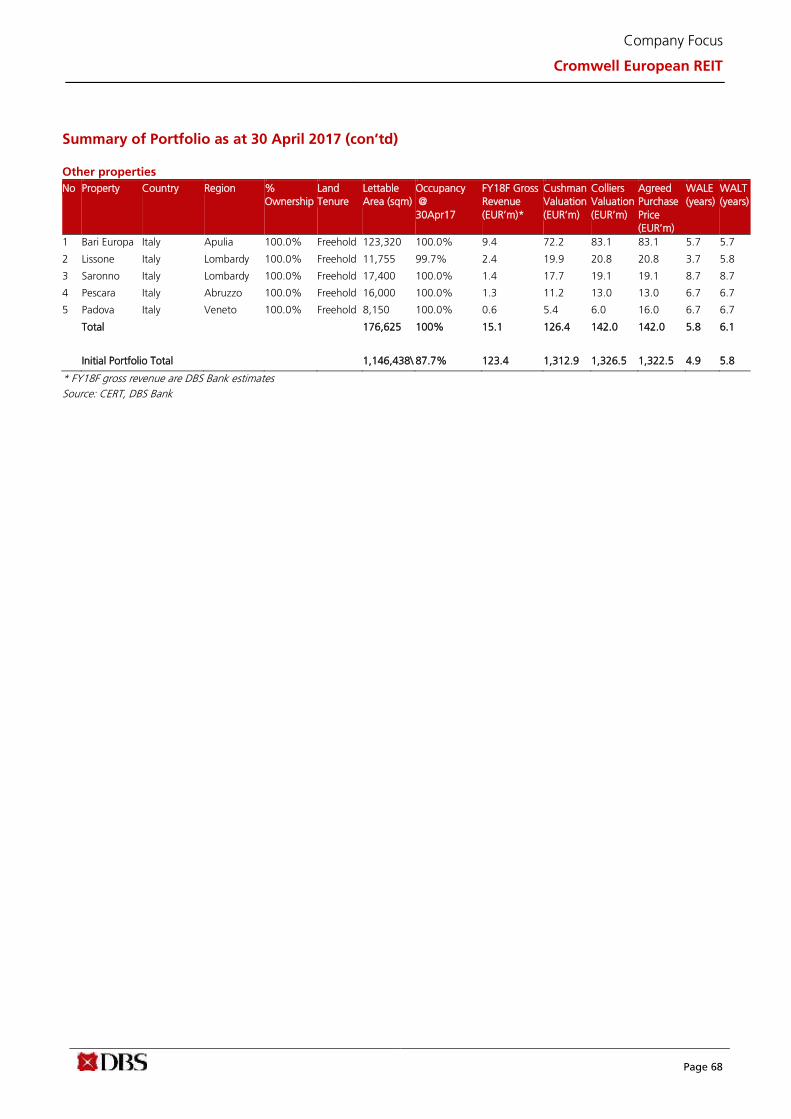
Page 68
Company Focus
Cromwell European REIT
Summary of Portfolio as at 30 April 2017 (con’td)
Other properties
No Property Country Region %
Ownership
Land
Tenure
Lettable
Area (sqm)
Occupancy
@
30Apr17
FY18F Gross
Revenue
(EUR’m)*
Cushman
Valuation
(EUR’m)
Colliers
Valuation
(EUR’m)
Agreed
Purchase
Price
(EUR’m)
WALE
(years)
WALT
(years)
1 Bari Europa Italy Apulia 100.0% Freehold 123,320 100.0% 9.4 72.2 83.1 83.1 5.7 5.7
2 Lissone Italy Lombardy 100.0% Freehold 11,755 99.7% 2.4 19.9 20.8 20.8 3.7 5.8
3 Saronno Italy Lombardy 100.0% Freehold 17,400 100.0% 1.4 17.7 19.1 19.1 8.7 8.7
4 Pescara Italy Abruzzo 100.0% Freehold 16,000 100.0% 1.3 11.2 13.0 13.0 6.7 6.7
5 Padova Italy Veneto 100.0% Freehold 8,150 100.0% 0.6 5.4 6.0 16.0 6.7 6.7
Total 176,625 100% 15.1 126.4 142.0 142.0 5.8 6.1
Initial Portfolio Total 1,146,438\ 87.7% 123.4 1,312.9 1,326.5 1,322.5 4.9 5.8
* FY18F gross revenue are DBS Bank estimates
Source: CERT, DBS Bank

Page 69
Company Focus
Cromwell European REIT
DBS Bank recommendations are based an Absolute Total Return* Rating system, defined as follows:
STRONG BUY (>20% total return over the next 3 months, with identifiable share price catalysts within this time frame)
BUY (>15% total return over the next 12 months for small caps, >10% for large caps)
HOLD (-10% to +15% total return over the next 12 months for small caps, -10% to +10% for large caps)
FULLY VALUED (negative total return i.e. > -10% over the next 12 months)
SELL (negative total return of > -20% over the next 3 months, with identifiable catalysts within this time frame)
Share price appreciation + dividends
Completed Date: 10 Apr 2018 08:10:21 (SGT) Dissemination Date: 10 Apr 2018 09:09:30 (SGT)
Sources for all charts and tables are DBS Bank unless otherwise specified.
GENERAL DISCLOSURE/DISCLAIMER
This report is prepared by DBS Bank. This report is solely intended for the clients of DBS Bank Ltd, its respective connected and associated
corporations and affiliates only and no part of this document may be (i) copied, photocopied or duplicated in any form or by any means or (ii)
redistributed without the prior written consent of DBS Bank.
The research set out in this report is based on information obtained from sources believed to be reliable, but we (which collectively refers to DBS
Bank Ltd, its respective connected and associated corporations, affiliates and their respective directors, officers, employees and agents (collectively,
the “DBS Group”) have not conducted due diligence on any of the companies, verified any information or sources or taken into account any other
factors which we may consider to be relevant or appropriate in preparing the research. Accordingly, we do not make any representation or
warranty as to the accuracy, completeness or correctness of the research set out in this report. Opinions expressed are subject to change without
notice. This research is prepared for general circulation. Any recommendation contained in this document does not have regard to the specific
investment objectives, financial situation and the particular needs of any specific addressee. This document is for the information of addressees
only and is not to be taken in substitution for the exercise of judgement by addressees, who should obtain separate independent legal or financial
advice. The DBS Group accepts no liability whatsoever for any direct, indirect and/or consequential loss (including any claims for loss of profit)
arising from any use of and/or reliance upon this document and/or further communication given in relation to this document. This document is not
to be construed as an offer or a solicitation of an offer to buy or sell any securities. The DBS Group, along with its affiliates and/or persons
associated with any of them may from time to time have interests in the securities mentioned in this document. The DBS Group, may have
positions in, and may effect transactions in securities mentioned herein and may also perform or seek to perform broking, investment banking and
other banking services for these companies.
Any valuations, opinions, estimates, forecasts, ratings or risk assessments herein constitutes a judgment as of the date of this report, and there can
be no assurance that future results or events will be consistent with any such valuations, opinions, estimates, forecasts, ratings or risk assessments.
The information in this document is subject to change without notice, its accuracy is not guaranteed, it may be incomplete or condensed, it may
not contain all material information concerning the company (or companies) referred to in this report and the DBS Group is under no obligation to
update the information in this report.
This publication has not been reviewed or authorized by any regulatory authority in Singapore, Hong Kong or elsewhere. There is no planned
schedule or frequency for updating research publication relating to any issuer.
The valuations, opinions, estimates, forecasts, ratings or risk assessments described in this report were based upon a number of estimates and
assumptions and are inherently subject to significant uncertainties and contingencies. It can be expected that one or more of the estimates on
which the valuations, opinions, estimates, forecasts, ratings or risk assessments were based will not materialize or will vary significantly from actual
results. Therefore, the inclusion of the valuations, opinions, estimates, forecasts, ratings or risk assessments described herein IS NOT TO BE RELIED
UPON as a representation and/or warranty by the DBS Group (and/or any persons associated with the aforesaid entities), that:
(a) such valuations, opinions, estimates, forecasts, ratings or risk assessments or their underlying assumptions will be achieved, and
(b) there is any assurance that future results or events will be consistent with any such valuations, opinions, estimates, forecasts, ratings or risk
assessments stated therein.
Please contact the primary analyst for valuation methodologies and assumptions associated with the covered companies or price targets.
Page 70
Company Focus
Cromwell European REIT
Any assumptions made in this report that refers to commodities, are for the purposes of making forecasts for the company (or companies)
mentioned herein. They are not to be construed as recommendations to trade in the physical commodity or in the futures contract relating to the
commodity referred to in this report.
DBSVUSA, a US-registered broker-dealer, does not have its own investment banking or research department, has not participated in any public
offering of securities as a manager or co-manager or in any other investment banking transaction in the past twelve months and does not engage
in market-making.
ANALYST CERTIFICATION
The research analyst(s) primarily responsible for the content of this research report, in part or in whole, certifies that the views about the
companies and their securities expressed in this report accurately reflect his/her personal views. The analyst(s) also certifies that no part of his/her
compensation was, is, or will be, directly or indirectly, related to specific recommendations or views expressed in the report. The research analyst (s)
primarily responsible for the content of this research report, in part or in whole, certifies that he or his associate1 does not serve as an officer of the
issuer or the new listing applicant (which includes in the case of a real estate investment trust, an officer of the management company of the real
estate investment trust; and in the case of any other entity, an officer or its equivalent counterparty of the entity who is responsible for the
management of the issuer or the new listing applicant) and the research analyst(s) primarily responsible for the content of this research report or
his associate does not have financial interests2 in relation to an issuer or a new listing applicant that the analyst reviews. DBS Group has
procedures in place to eliminate, avoid and manage any potential conflicts of interests that may arise in connection with the production of
research reports. The research analyst(s) responsible for this report operates as part of a separate and independent team to the investment
banking function of the DBS Group and procedures are in place to ensure that confidential information held by either the research or investment
banking function is handled appropriately. There is no direct link of DBS Group's compensation to any specific investment banking function of the
DBS Group.
COMPANY-SPECIFIC / REGULATORY DISCLOSURES
1. DBS Bank Ltd, DBS HK, DBS Vickers Securities (Singapore) Pte Ltd (“DBSVS”), DBSV HK or their subsidiaries and/or other affiliates have
proprietary positions in CapitaLand Commercial Trust, Frasers Commercial Trust, Keppel REIT, Suntec REIT, CapitaLand Retail China Trust,
CapitaLand Mall Trust, Frasers Centrepoint Trust, SPH REIT, Mapletree Commercial Trust, Starhill Global REIT, Ascendas REIT, Cache Logistics
Trust, Frasers Logistics & Industrial Trust, Mapletree Industrial Trust, Mapletree Logistics Trust, Soilbuild Business Space Reit, Ascendas
Hospitality Trust, Ascott Residence Trust, CDL Hospitality Trusts, Frasers Hospitality Trust, OUE Hospitality Trust, Parkway Life Real Estate
Investment Trust, RHT Health Trust, Cromwell European Real Estate Investment Trust, Keppel-KBS US REIT, Manulife US Real Estate Inv,
Keppel DC REIT, recommended in this report as of 28 Feb 2018.
2. Neither DBS Bank Ltd, DBS HK nor DBSV HK market makes in equity securities of the issuer(s) or company(ies) mentioned in this Research
Report.
3. DBS Bank Ltd, DBS HK, DBSVS, DBSV HK, their subsidiaries and/or other affiliates have a net long position exceeding 0.5% of the total issued
share capital in CapitaLand Commercial Trust, Frasers Commercial Trust, Keppel REIT, Suntec REIT, SPH REIT, Mapletree Commercial Trust,
Starhill Global REIT, Cache Logistics Trust, Frasers Logistics & Industrial Trust, Mapletree Industrial Trust, Mapletree Logistics Trust, Soilbuild
Business Space Reit, Ascendas Hospitality Trust, Ascott Residence Trust, CDL Hospitality Trusts, Frasers Hospitality Trust, OUE Hospitality Trust,
Cromwell European Real Estate Investment Trust, Keppel-KBS US REIT, Manulife US Real Estate Inv, Keppel DC REIT, recommended in this
report as of 28 Feb 2018.
4. DBS Bank Ltd, DBS HK, DBSVS, DBSVUSA, DBSV HK or their subsidiaries and/or other affiliates beneficially own a total of 1% of any class of
common equity securities of Frasers Commercial Trust, SPH REIT, Starhill Global REIT, Cache Logistics Trust, Frasers Logistics & Industrial Trust,
Soilbuild Business Space Reit, Ascendas Hospitality Trust, Ascott Residence Trust, CDL Hospitality Trusts, Frasers Hospitality Trust, OUE
Hospitality Trust, Cromwell European Real Estate Investment Trust, Keppel-KBS US REIT, Manulife US Real Estate Inv, Keppel DC REIT, as of 28
Feb 2018.
1 An associate is defined as (i) the spouse, or any minor child (natural or adopted) or minor step-child, of the analyst; (ii) the trustee of a trust of
which the analyst, his spouse, minor child (natural or adopted) or minor step-child, is a beneficiary or discretionary object; or (iii) another person accustomed or obliged to act in accordance with the directions or instructions of the analyst.
2 Financial interest is defined as interests that are commonly known financial interest, such as investment in the securities in respect of an issuer or a
new listing applicant, or financial accommodation arrangement between the issuer or the new listing applicant and the firm or analysis. This term does not include commercial lending conducted at arm's length, or investments in any collective investment scheme other than an issuer or new listing applicant notwithstanding the fact that the scheme has investments in securities in respect of an issuer or a new listing applicant.
Page 71
Company Focus
Cromwell European REIT
Compensation for investment banking services:
5. DBS Bank Ltd, DBS HK, DBSVS, DBSV HK, their subsidiaries and/or other affiliates of DBSVUSA have received compensation, within the past
12 months for investment banking services from CapitaLand Commercial Trust, Frasers Commercial Trust, Keppel REIT, OUE Commercial REIT,
Suntec REIT, CapitaLand Retail China Trust, CapitaLand Mall Trust, Frasers Centrepoint Trust, Ascendas India Trust, Cache Logistics Trust, ESR
REIT, Frasers Logistics & Industrial Trust, Mapletree Industrial Trust, Mapletree Logistics Trust, Soilbuild Business Space Reit, Ascott Residence
Trust, CDL Hospitality Trusts, Parkway Life Real Estate Investment Trust, RHT Health Trust, Cromwell European Real Estate Investment Trust,
Keppel-KBS US REIT, Manulife US Real Estate Inv, as of 28 Feb 2018.
6. DBS Bank Ltd, DBS HK, DBSVS, DBSV HK, their subsidiaries and/or other affiliates of DBSVUSA, within the next 3 months, will receive or
intend to seek compensation for investment banking services from CapitaLand Commercial Trust, CapitaLand Mall Trust, Ascendas REITas of
28 Feb 2018.
7. DBS Bank Ltd, DBS HK, DBSVS, their subsidiaries and/or other affiliates of DBSVUSA have managed or co-managed a public offering of
securities for CapitaLand Commercial Trust, Frasers Commercial Trust, Keppel REIT, OUE Commercial REIT, Suntec REIT, CapitaLand Retail
China Trust, CapitaLand Mall Trust, Frasers Centrepoint Trust, Ascendas India Trust, Cache Logistics Trust, ESR REIT, Frasers Logistics &
Industrial Trust, Mapletree Industrial Trust, Mapletree Logistics Trust, Ascott Residence Trust, CDL Hospitality Trusts, Parkway Life Real Estate
Investment Trust, RHT Health Trust, Keppel-KBS US REIT, Manulife US Real Estate Inv, in the past 12 months, as of 28 Feb 2018.
8. DBSVUSA does not have its own investment banking or research department, nor has it participated in any public offering of securities as a
manager or co-manager or in any other investment banking transaction in the past twelve months. Any US persons wishing to obtain further
information, including any clarification on disclosures in this disclaimer, or to effect a transaction in any security discussed in this document
should contact DBSVUSA exclusively.
Disclosure of previous investment recommendation produced:
9. DBS Bank Ltd, DBS Vickers Securities (Singapore) Pte Ltd (''DBSVS''), their subsidiaries and/or other affiliates may have published other
investment recommendations in respect of the same securities / instruments recommended in this research report during the preceding 12
months. Please contact the primary analyst listed in the first page of this report to view previous investment recommendations published by
DBS Bank Ltd, DBS Vickers Securities (Singapore) Pte Ltd (''DBSVS''), their subsidiaries and/or other affiliates in the preceding 12 months.

Page 72
Company Focus
Cromwell European REIT
RESTRICTIONS ON DISTRIBUTION
General This report is not directed to, or intended for distribution to or use by, any person or entity who is a citizen or resident of or
located in any locality, state, country or other jurisdiction where such distribution, publication, availability or use would be
contrary to law or regulation.
Australia This report is being distributed in Australia by DBS Bank Ltd. (“DBS”) or DBS Vickers Securities (Singapore) Pte Ltd
(“DBSVS”). DBS holds Australian Financial Services Licence no. 475946.
DBSVS is exempted from the requirement to hold an Australian Financial Services Licence under the Corporation Act 2001
(“CA”) in respect of financial services provided to the recipients. DBSVS is regulated by the Monetary Authority of Singapore
under the laws of Singapore, which differ from Australian laws.
Distribution of this report is intended only for “wholesale investors” within the meaning of the CA.
Hong Kong This report has been prepared by a person(s) who is not licensed by the Hong Kong Securities and Futures Commission to
carry on the regulated activity of advising on securities in Hong Kong pursuant to the Securities and Futures Ordinance
(Chapter 571 of the Laws of Hong Kong). This report is being distributed in Hong Kong and is attributable to DBS Vickers
Hong Kong Limited, a licensed corporation licensed by the Hong Kong Securities and Futures Commission to carry on the
regulated activity of advising on securities pursuant to the Securities and Futures Ordinance (Chapter 571 of the Laws of
Hong Kong).
For any query regarding the materials herein, please contact Paul Yong (CE. No. ASE988) at [email protected].
Indonesia This report is being distributed in Indonesia by PT DBS Vickers Sekuritas Indonesia.
Malaysia This report is distributed in Malaysia by AllianceDBS Research Sdn Bhd ("ADBSR"). Recipients of this report, received from
ADBSR are to contact the undersigned at 603-2604 3333 in respect of any matters arising from or in connection with this
report. In addition to the General Disclosure/Disclaimer found at the preceding page, recipients of this report are advised
that ADBSR (the preparer of this report), its holding company Alliance Investment Bank Berhad, their respective connected
and associated corporations, affiliates, their directors, officers, employees, agents and parties related or associated with any
of them may have positions in, and may effect transactions in the securities mentioned herein and may also perform or seek
to perform broking, investment banking/corporate advisory and other services for the subject companies. They may also
have received compensation and/or seek to obtain compensation for broking, investment banking/corporate advisory and
other services from the subject companies.
Wong Ming Tek, Executive Director, ADBSR
Singapore This report is distributed in Singapore by DBS Bank Ltd (Company Regn. No. 196800306E) or DBSVS (Company Regn No.
198600294G), both of which are Exempt Financial Advisers as defined in the Financial Advisers Act and regulated by the
Monetary Authority of Singapore. DBS Bank Ltd and/or DBSVS, may distribute reports produced by its respective foreign
entities, affiliates or other foreign research houses pursuant to an arrangement under Regulation 32C of the Financial
Advisers Regulations. Where the report is distributed in Singapore to a person who is not an Accredited Investor, Expert
Investor or an Institutional Investor, DBS Bank Ltd accepts legal responsibility for the contents of the report to such persons
only to the extent required by law. Singapore recipients should contact DBS Bank Ltd at 6327 2288 for matters arising from,
or in connection with the report.
Thailand This report is being distributed in Thailand by DBS Vickers Securities (Thailand) Co Ltd.
United
Kingdom
This report is produced by DBS Bank Ltd which is regulated by the Monetary Authority of Singapore.
This report is disseminated in the United Kingdom by DBS Vickers Securities (UK) Ltd, ("DBSVUK"). DBSVUK is authorised and regulated by the Financial Conduct Authority in the United Kingdom.
In respect of the United Kingdom, this report is solely intended for the clients of DBSVUK, its respective connected and
associated corporations and affiliates only and no part of this document may be (i) copied, photocopied or duplicated in any
form or by any means or (ii) redistributed without the prior written consent of DBSVUK. This communication is directed at
persons having professional experience in matters relating to investments. Any investment activity following from this
communication will only be engaged in with such persons. Persons who do not have professional experience in matters
relating to investments should not rely on this communication.

Page 73
Company Focus
Cromwell European REIT
Dubai
International
Financial
Centre
This research report is being distributed by DBS Bank Ltd., (DIFC Branch) having its office at PO Box 506538, 3rd Floor,
Building 3, East Wing, Gate Precinct, Dubai International Financial Centre (DIFC), Dubai, United Arab Emirates. DBS Bank
Ltd., (DIFC Branch) is regulated by The Dubai Financial Services Authority. This research report is intended only for
professional clients (as defined in the DFSA rulebook) and no other person may act upon it.
United Arab
Emirates
This report is provided by DBS Bank Ltd (Company Regn. No. 196800306E) which is an Exempt Financial Adviser as defined
in the Financial Advisers Act and regulated by the Monetary Authority of Singapore. This report is for information purposes
only and should not be relied upon or acted on by the recipient or considered as a solicitation or inducement to buy or sell
any financial product. It does not constitute a personal recommendation or take into account the particular investment
objectives, financial situation, or needs of individual clients. You should contact your relationship manager or investment
adviser if you need advice on the merits of buying, selling or holding a particular investment. You should note that the
information in this report may be out of date and it is not represented or warranted to be accurate, timely or complete. This
report or any portion thereof may not be reprinted, sold or redistributed without our written consent.
United States This report was prepared by DBS Bank Ltd. DBSVUSA did not participate in its preparation. The research analyst(s) named
on this report are not registered as research analysts with FINRA and are not associated persons of DBSVUSA. The research
analyst(s) are not subject to FINRA Rule 2241 restrictions on analyst compensation, communications with a subject company,
public appearances and trading securities held by a research analyst. This report is being distributed in the United States by
DBSVUSA, which accepts responsibility for its contents. This report may only be distributed to Major U.S. Institutional
Investors (as defined in SEC Rule 15a-6) and to such other institutional investors and qualified persons as DBSVUSA may
authorize. Any U.S. person receiving this report who wishes to effect transactions in any securities referred to herein should
contact DBSVUSA directly and not its affiliate.
Other
jurisdictions
In any other jurisdictions, except if otherwise restricted by laws or regulations, this report is intended only for qualified,
professional, institutional or sophisticated investors as defined in the laws and regulations of such jurisdictions.
DBS Regional Research Offices
HONG KONG DBS Vickers (Hong Kong) Ltd Contact: Paul Yong 18th Floor Man Yee Building 68 Des Voeux Road Central Central, Hong Kong Tel: 65 6878 8888 Fax: 65 65353 418 e-mail: [email protected] Participant of the Stock Exchange of Hong Kong
MALAYSIA AllianceDBS Research Sdn Bhd Contact: Wong Ming Tek (128540 U) 19th Floor, Menara Multi-Purpose, Capital Square, 8 Jalan Munshi Abdullah 50100 Kuala Lumpur, Malaysia. Tel.: 603 2604 3333 Fax: 603 2604 3921 e-mail: [email protected]
SINGAPORE DBS Bank Ltd Contact: Janice Chua 12 Marina Boulevard, Marina Bay Financial Centre Tower 3 Singapore 018982 Tel: 65 6878 8888 Fax: 65 65353 418 e-mail: [email protected] Company Regn. No. 196800306E
INDONESIA PT DBS Vickers Sekuritas (Indonesia) Contact: Maynard Priajaya Arif DBS Bank Tower Ciputra World 1, 32/F Jl. Prof. Dr. Satrio Kav. 3-5 Jakarta 12940, Indonesia Tel: 62 21 3003 4900 Fax: 6221 3003 4943 e-mail: [email protected]
THAILAND DBS Vickers Securities (Thailand) Co Ltd Contact: Chanpen Sirithanarattanakul 989 Siam Piwat Tower Building, 9th, 14th-15th Floor Rama 1 Road, Pathumwan, Bangkok Thailand 10330 Tel. 66 2 857 7831 Fax: 66 2 658 1269 e-mail: [email protected] Company Regn. No 0105539127012 Securities and Exchange Commission, Thailand