signal settings synchronization and dynamic traffic modelling · signal settings synchronization...
TRANSCRIPT

European Transport Trasporti Europei (2013) Issue 53 Paper ndeg 7 ISSN 1825-3997
- 1 -
SIGNAL SETTINGS SYNCHRONIZATION AND
DYNAMIC TRAFFIC MODELLING
Gaetano FUSCO Maurizio BIELLI
Ernesto CIPRIANI
Stefano
GORI
Marialisa NIGRO
Universitagrave degli Studi di Roma La Sapienza via Eudossiana 18 Roma gaetanofuscouniroma1it Istituto di Analisi dei Sistemi ed Informatica CNR viale Manzoni 30 Roma bielliiasirmcnrit
Universitagrave degli Studi Roma Tre Dipartimento di Scienze dellrsquoIngegneria Civile Via Vito Volterra 62
eciprianuniroma3it sgoriuniroma3it mnigrouniroma3it
Abstract
The object of the paper is to investigate the effect of signal synchronization on the traffic flow
patterns on the network and validate results of synchronization problem in signal setting design A
platoon based traffic model is applied to solve both one-way and two-way synchronization problems
in under-saturated conditions Assessment of results through dynamic traffic assignment model
shows that solution found is rather robust and if more traffic is attracted by the improved arterial
performance larger benefits can be achieved on the whole network A specific analysis has been conducted to point out the representation of queue propagation and the gridlock phenomenon
Keywords Road traffic network models Traffic signal synchronization Dynamic traffic assignment
1 Introduction
The paper aims at dealing with some relevant issues arising in design of the road
network signal settings namely the interaction between signal synchronization and
drivers behavior and the possible need for validating results of synchronization problem
through dynamic traffic assignment models
This problem is interesting by both a theoretical and an application point of view
since several mathematical studies and experimental results have shown that usual
signal setting policies which simply adjust signal parameters according to the measured
traffic may lead to system unstable solutions and deteriorate network performances
At core of the problem is the difference between a user equilibrium flow pattern
where individuals choose their paths in order to minimize their own travel time and a
system optimizing flow that minimizes total delay of all users The problem is object of
an intensive research activity by the scientific community by many years Valuable
literature reviews are reported in Cantarella et al (1991) and Taale and Van Zuylen
(2001) More recent contributions have been provided among others by Cascetta et al
European Transport Trasporti Europei (2013) Issue 53 Paper ndeg 7 ISSN 1825-3997
- 2 -
(2006) who introduced a clear distinction between local and global approaches to signal
optimization and by Chiou (2011) who introduced an algorithm based on a quasi-
Newton subgradient projection and contraction method and Adacher and Cipriani
(2010) who proposed a surrogate algorithm
The global optimal signal settings on a road network aims at optimizing traffic signals
by imposing a consistent pattern of traffic flows This is a complex problem that
involves traffic dynamics usersrsquo route choice and application of suitable control
strategies With several noticeable exceptions (Ghali and Smith 1995 Smith and Ghali
1990 Abdelfatah and Mahmassani 1998 Abdelghani et al 1999) the problem is
usually tackled by following an equilibrium approach that is by searching for a
possibly optimal configuration of mutually consistent traffic flows and signal variables
The equilibrium approach assumes but does not reproduce the existence of a process
where drivers correct their route choice day-to-day according to the modified network
performances until no further improvement could be achieved The traffic flow is
modeled by a stationary relationship between link travel time and link flow In this case
although the delay at node approaches can be taken into account as it may be added to
the link cost neither a realistic modeling of traffic congestion on a road network or an
explicit representation of real-time traffic control is possible A different approach
consisting of formulating the day-to-day route choice process explicitly has been
recently followed by Cantarella et al (2012) who individuated stability conditions for
simple O-D networks
Although the combined problem of signal settings and traffic assignment is a well
known non convex problem a systematic analysis of the objective function of the
global optimization signal setting problem highlighted in several examples large quasi-
convex intervals for even different levels and patterns of traffic demand (Cipriani and
Fusco 2004) So benefits of signal synchronization (as computed by assuming traffic
flows as given) may be either nullified by redistribution of traffic or even amplified (at
network level) if synchronization allows the artery accommodate more traffic without
vehicle delays increasing Thus it is useful to examine the effectiveness of the signal
setting solution and validate it by applying a traffic assignment model
The question is worth of investigation also because of the different models usually
applied for signal settings and for traffic assignment
When signal settings include synchronization the time-independent equilibrium
assumption introduced in traffic assignment is inadequate to appreciate the effect of
signal offsets and a dynamic traffic assignment approach is required
In the paper we discuss these issues and examine them through numerical examples
on real-size road networks
In section 2 we describe a platoon progression model that extends a simpler delay
model for synchronized arteries (Papola and Fusco 2000) by introducing different
hypotheses of driving behavior along the artery The extended model was recently
implemented in a software program which applies a mixed genetic-hill climbing
algorithm to optimize signal synchronization with active bus priority strategies at
signals (Colombaroni et al 2009 Fusco et al 2010)
Different signal setting strategies are then tested for both one-way and two-way
synchronization problems in section 3
In section 4 we assess the consistency of these macroscopic models with dynamic
traffic assignment models based on the so-called mesoscopic approach that reproduces
the longitudinal interaction between vehicles at an aggregate level and simulates
individual behavior at nodes including route choice The analysis is supported by
numerical experiments on a wide study area located in Rome Italy
European Transport Trasporti Europei (2013) Issue 53 Paper ndeg 7 ISSN 1825-3997
- 3 -
2 Traffic model
21 Hypotheses
Several different hypotheses about driversrsquo behavior can be considered
If there is no information about the synchronization speed it is usual assuming that
the vehicle speed on each link depends on the average link traffic density
However if one envisions that an information system advises drivers about the
synchronization speed it is possible to consider several alternative hypotheses
depending if we allow drivers accelerating to gain possible available space produced by
exiting and entering maneuvers or not In each hypothesis we assume to include the
transient phase of motion into the effective red time
Three reasonable hypotheses are
1) all drivers travel at the synchronization speed vs
2) the leading vehicle of each platoon tends to travel at the synchronization speed vs
while the following vehicles of the same platoon tend to travel at least at vs (that is
at the steady-state if there are no empty spaces inside of the platoon all vehicles
travel at speed vs otherwise if vehicles exiting the artery leave available some
spaces inside of the platoon following vehicles accelerate in order to refill the
empty space ldquocompressingrdquo then the platoon)
3) the first vehicle passed during the green time travels at the synchronization speed vs
while all following vehicles along the artery including the leading vehicles of
successive platoons tend to travel at least at vs (that is each following driver that
has available space in front of him or her will accelerate at a given acceleration rate
until he or she reaches the previous vehicle if the link is long enough)
The hypotheses above provide different possible platoon patterns along the artery in
case 1) each platoon will have a constant length while progressing along the artery (that
is it will occupy the same time interval even if the number of vehicles changes passing
from one arc to another) until it is stopped at a node (if it does) in case 2) platoons will
have a time length lpj = npj q(vs) where npj is the number of vehicles of platoon p on
the arc j and q(vs) is the flow corresponding to the synchronization speed vs in case 3)
there will be just one platoon arriving at each node
Moreover we assume that the synchronization speed is not far from the critical speed
(ie the speed corresponding to saturation flow) we also hypothesize that at every
intersection there is enough green time to accommodate all arriving vehicles traveling at
the synchronization speed that is
ni j
i1
m
q vs g j (1)
where q(vs) is the flow at the synchronization speed vs gj is the green time for the
coordinated route at intersection j and nij is the number of vehicles belonging to the i-th
platoon (over a total number of m platoons) arriving during the cycle length at
intersection j
22 Node delay model
Delay at nodes on coordinated routes is defined as the time lost with respect to a
travel at constant speed vs
European Transport Trasporti Europei (2013) Issue 53 Paper ndeg 7 ISSN 1825-3997
- 4 -
We assume that on each link all vehicles can actually reach the synchronization speed
vs even if they are stopped at a node Thus both upstream and downstream there are
steady state traffic condition where all vehicles travel at speed vs and at a time interval
1q(vs) each other Figure 1 depicts vehicle trajectories assumed in the model for node
delay and describes the delay of first vehicle d1 the delay of the last vehicle of the
platoon dn the lost time at start ka the lost time in the stopping phase kj the time length
of the platoon at steady-state conditions nq(vs)
It follows from the figure that if all vehicles can accelerate up to the synchronization
speed vs and no vehicle enters or exits the artery at intersection j delays d1 and dn are
equal as well as those of all vehicles belonging to this platoon
With respect to traditional formulations of node delay which consider only upstream
delay we include both upstream and downstream delay (Newell 1989) Moreover we
obtain in such a way a simpler linear expression of total delay
As shown in Figure 1 we exclude the transient phase of vehicle progression and we
refer only to steady-state condition So the link model becomes trivial while the main
issue is represented by platoon re-combination at nodes as explained in section 23
n
q(v )s
d n
d 1
n
q(v )s
n
q(v )s
Arsquo Brsquo
A B
ka
k f
1 2 n
1 2 n
Figure 1 Vehicle trajectories assumed in the model for the delay at one node of a
synchronized route
Since we include the transient phases of motion in the effective red time we obtain
the following linear formulae for the delay at nodes whose expressions depend on the
arrival time and the time length of the platoon the offset and red time of the signal as
well as the time needed to clear a queue if any at the end of red
Case A Platoon p arrives at node i after the start of red and before the queue (if any) at
the end of red time has been cleared (front-delayed platoon illustrated in Figure 2)
i ri
2 tip i
ri
2i (2)
European Transport Trasporti Europei (2013) Issue 53 Paper ndeg 7 ISSN 1825-3997
- 5 -
Dip q(vs)lip i ri
2i tip
(3)
zip q vs lip (4)
where
i is the offset of node i defined as the difference between the instants of half red time
of node i and node 1
ri is the effective red time of node i
i is the time needed to clear the queue at the end of red at node i it is given by the total
number of vehicles delayed at node i before the platoon p arrives divided by q(vs)
q(vs) is the traffic flow at the synchronization speed
tip and lip are respectively the arrival time and the time length of platoon p at node i
Dip and zip are respectively the total delay and the number of vehicles of platoon p
stopped at node i
The term between parentheses in the definition of the total delay represents the average
delay per vehicle d
Figure 2 Delay d at one node for a front-delayed platoon (case A)
The condition that platoon p ends during the green time
tip lip i ri
2C (5)
is an obvious consequence of capacity condition so it is not needed if we write capacity
conditions explicitly
The case of no queue at the end of red time at node i is a particular one which
belongs to case A it is then =0 and the condition is that platoon p arrives before the
end of the red time
Case B Platoon p arrives at node i after the queue (if any) at the end of red time has
been cleared and ends after the start of red time (rear-delayed platoon illustrated in
Figure 3)
i ri
2i tip i C
ri
2 (6)
x
r r
+Ct time t+l
xi
d
++r2
European Transport Trasporti Europei (2013) Issue 53 Paper ndeg 7 ISSN 1825-3997
- 6 -
Dip q(vs) tip lip i C ri
2
ri (7)
zip q vs tip lip i C ri
2
(8)
where C is the cycle length at node i
Figure 3 Delay d at one node and time interval which stopped vehicles belong to for a
rear-delayed platoon (case B)
The condition that platoon p ends before the queue clearance time is an obvious
consequence of capacity condition so it is not necessary
i C ri
2 ti p li p i C
ri
2 (9)
Again the case of no queue at node i at the end of red time is a particular case
belonging to the condition above in such a case it is i =0 and the condition is that
platoon p arrives after the end of the red time and ends during the red time
Case C Platoon p arrives at node i after the queue (if any) at the end of red time has
been cleared and ends before the start of red time (no-delayed platoon)
i ri
2i tip i C
ri
2 (10)
tip lip i C ri
2 (11)
Dip 0 (12)
zip 0 (13)
Case C can also be obtained from both A and B cases by adding the condition that
delay is always non-negative
x
r
+Ct time
xi
d=r
-r2 t+l +r2 +r2+
European Transport Trasporti Europei (2013) Issue 53 Paper ndeg 7 ISSN 1825-3997
- 7 -
Figure 4 No-delayed platoon (case C)
Remark The classification of one platoon is not independent to the arrival times of
other platoons which determine the queue clearance time i Thus delay at node i is a
function of signal settings and traffic patterns at nodes 12hellipi
23 Arterial delay model
The delay model has been developed specifically to assess synchronization strategies
along signalized arteries The logic of the algorithm is depicted in the flow chart in
Figure 5
Platoon classification explained in Section 22 is at the core of the arterial model as it
is needed not only to determine the average delay and the number of stopped vehicles
but also to determine the departure time and the time length of platoons by taking into
account as they combine together at nodes
x
r r
+C time ++r2
xi
t t+l
European Transport Trasporti Europei (2013) Issue 53 Paper ndeg 7 ISSN 1825-3997
- 8 -
Figure 5 Flow chart of the algorithm applied to compute delay model at nodes of
synchronized arteries
The mechanism of platoon recombination at nodes is exemplified in Figure 6 where
two platoons A-type and B-type arrive at the node i The figure depicts also a third
platoon of vehicles entering the artery from side streets starts at the beginning of the
effective red time for the artery (ie at the beginning of the effective green time for side
streets)
DEPARTURES Starting times and time
length of each platoon at node i
ARRIVAL TIMES Arrival times and time
length of each platoon at node i+1
PLATOON CLASSIFICATION AT
NODE i+1 Delays and number of
stops of each platoon
PLATOON RECOMBINATION AT
NODE i+1
i = i+1
Initialization i=1
DATA geometry cycle length green splits offsets traffic flow patterns
European Transport Trasporti Europei (2013) Issue 53 Paper ndeg 7 ISSN 1825-3997
- 9 -
Figure 6 Example of platoon recombination at node i
Since A-type platoon (denoted as 1 in the figure) is split into 2 sub-platoons (1rsquo and
1rdquo in the figure) and platoon 2 arrives before the queue has been cleared it joins platoon
1rdquo Departures at the node are then composed by platoon 1rsquo whose starting time
coincides with its arrival time by platoon 2 which starts at the end of the effective red
time and by platoon 3 entering the artery from side streets
The link module computes the arrival times and the time length of platoons at
downstream intersection The arrival time is determined by applying either the
synchronization speed or an acceleration rate accordingly to the assumptions
introduced in section 21 and verifying if following platoons can catch up the preceding
one The time length is computed by subtracting the vehicles that exit the artery at the
upstream node and assuming that all vehicles belonging to the platoon can accelerate
compressing then the platoon Platoon progression and recombination along the links is
illustrated by the example in Figure 7
The first vehicle of platoon 1 travels at the synchronization speed vs Dashed line
represents the trajectory of the last vehicle if no vehicle had got the artery and it had
traveled at the synchronization speed however due to exiting vehicles all vehicles
within the platoon can travel at a higher speed as indicated by the solid line for the last
vehicle traveling at vrdquo All vehicles of the entering platoon (numbered as 2 in the
figure) travel at a speed vrsquogt vs and may catch up the preceding platoon depending on
the link length and the value of vrdquo This is the case of platoon 2 in figure However
platoon 3 starts at the end of effective red time travels at speed vrsquo and the leading
vehicle can not catch up the tail of platoon 2 Successive vehicles within the platoon can
accelerate in order to refill the empty spaces left by exiting vehicles and such a
condition is applied to compute the time length of the platoon at node i+1
3
x
r
+C time
xi
r
1 1
1rsquo
1rdquo 2
2
1rsquo
1 1
2
2
ka
3
European Transport Trasporti Europei (2013) Issue 53 Paper ndeg 7 ISSN 1825-3997
- 10 -
Figure 7 Example of platoon progression and recombination along a link
The node delay module computes delays at every approach of the artery by checking
for each arriving platoon which condition occurs among the A) B) C) cases introduced
in the previous section Since the existence and the length of a queue can not be
determined before all platoons have been analyzed the delay computation requires an
iterative procedure that classifies the different platoons progressively It is worth noting
that such a procedure involves few iterations because the platoons can both catch up
each other along the links and recompose together at nodes when more platoons arrive
during the red phase
3 Signal synchronization strategies
The traditional approach to signal control assumes traffic pattern as given and signal
parameters (cycle length green splits and offsets) as design variables Signal
synchronization of two-way arteries can be applied by following two different
approaches -maximal bandwidth and minimum delay- although a solution procedure
that applies the former problem to search for the solution of the latter one has been
developed (Papola and Fusco 1998) Specifically it is well known that given the
synchronization speed and the vector of distances between nodes the offsets that
maximize the green bandwidth are univocally determined by the cycle length of the
artery Such a property of the maximal bandwidth problem has been exploited to
facilitate the search for a sub-optimal solution of the minimum delay problem Thus a
linear search of the sub-optimal cycle length is first carried out starting from the
minimum cycle length for the artery and then a local search is performed starting from
the offset vector corresponding to that cycle length
If demand does not exceed capacity the platoon progression model described in
section 2 makes it possible a quick evaluation of the artery delay without involving any
simulation Nevertheless the performances of the solutions obtained by applying the
platoon progression model will be further assessed by dynamic traffic assignment
Two-way synchronization as a complex non-convex problem usually requires
heuristic procedures to compute the signal solution that minimize delays The simple
platoon model introduced here allows implementing instead a systematic investigation
x
time
xi
t
xi+1
vs vrsquo
vrsquordquo
1
3
2
ka
vrsquo
vrdquo
vs
European Transport Trasporti Europei (2013) Issue 53 Paper ndeg 7 ISSN 1825-3997
- 11 -
of the space of design variables in order to individuate the relationship between signal
settings and traffic flow
In case of one-way synchronization simple strategies can be envisioned for offset
optimization
Both one-way and two-way synchronization problems are illustrated in the following
with reference to a real 6-node 26km long artery composed by the streets Viale Regina
Margherita and Viale Liegi in the city of Rome
31 One-way synchronization
We first tackle the one-way synchronization problem One could expect that the
average delay for one-way synchronized arteries should be quite nil if offsets are
adjusted accordingly to the travel time of the first vehicle of the platoon However due
to entering and exiting vehicles the platoon pattern might vary significantly along the
artery and the strategy that synchronizes signals with the trajectory of the first vehicle
may be even far from the optimum Accordingly to the phenomenon of platoon
recombination explained in section 23 we introduce two different strategies for one-
way signal synchronization that aim at exploiting the platoon computation carried out
by the platoon progression model The simplest Strategy A consists of starting the red
of each node just after the end of the primary platoon (that is the platoon with the most
number of vehicles) In the second strategy Strategy B the red is checked to start after
the end of every platoon and the position giving the least delay is then selected
Numerical tests were conducted by carrying out a systematic analysis of the optimal
offsets on the abovementioned artery by assuming a one-way circulation in direction
Viale Regina Margherita-Viale Liegi The average traffic flow was taken as independent
variable ranging from 001 to 020 vehslane For each value of the average flow ten
different experiments have been performed by taking in each of them a different
random vector of entering and exiting traffic Green splits have been assumed as given
while 5 different values of the cycle length have been considered Both strategies A and
B have been applied in each case and corresponding average delays are reported in
Figures 8 and 9 respectively For low traffic volumes (01vehslane) average delays
range from 5sveh to 10sveh for strategy A and from 1s to 2s when adopting strategy B
For medium traffic volumes (020 vehslane) strategy A provides delays ranging form
20sveh to about 50sveh while strategy B can reduce delays as 35-6sveh Thus the
latter strategy B outperforms the former one and the difference is striking especially
for large traffic flows Such an occurrence highlights that the performances of the artery
are heavily affected by the complex process of platoon re-combination at nodes so that
the strategy that favors the main platoon can be ineffective if it is stopped later while
secondary platoons can run without being delayed
European Transport Trasporti Europei (2013) Issue 53 Paper ndeg 7 ISSN 1825-3997
- 12 -
Figure 8 Relationship between average delay and traffic volume on Viale Regina
Margherita-Viale Liegi by assuming one-way circulation for different cycle length and
synchronization Strategy A at each node the red starts just after the end of the primary
platoon
Figure 9 Relationship between average delay and traffic volume on Viale Regina
Margherita-Viale Liegi by assuming one-way circulation for different cycle length and
synchronization Strategy B at each node the red can start just after the end of any
platoon and the most suitable is selected
European Transport Trasporti Europei (2013) Issue 53 Paper ndeg 7 ISSN 1825-3997
- 13 -
32 Two-way synchronization
Then we deal with the more general two-way synchronization problem Analogous
numerical experiments concerning the application of the platoon progression model
have been carried out on the same artery considering both traffic directions
Results of the synchronization method are illustrated in Fig10 where the average
delay is shown for 20 different random extractions of entering and exiting traffic
Figure 10 Relationship between average delay and traffic volume on the two-way
artery Viale Regina Margherita-Viale Liegi for different values of cycle length
For any given value of the cycle length the average arterial delay is a continuous
convex function of traffic flow However it is not a convex function with respect to
cycle length for higher values of flow (for example 018vehs) the lowest average
delay is provided when C=70s higher values would be obtained if the cycle length were
decreased at 60s as well as if it were increased at 80s or at 90s However if the cycle
length were increased at 100s the delay would decreased again giving rise so to a third
inversion of the sign of the function derivative It is worth noticing also that if the most
appropriate cycle length is used for different values of flow the synchronization
solution is rather robust with respect to variations of flow In fact when the flow
increases from 001vehs to 020 vehs the average delay increases only from 20s to 42s
Further analyses concern the relationship between the objective function and the
design variables for given traffic flows as it occurs in usual signal setting problems On
this regard actual traffic volumes observed in the peak-off period are considered
In a first experiment the common cycle length of the artery has been set equal to the
maximal cycle length of the junctions The green times have been adjusted consequently
to keep the green splits unchanged Thus the offsets are the only control vector In a
European Transport Trasporti Europei (2013) Issue 53 Paper ndeg 7 ISSN 1825-3997
- 14 -
second experiment also the cycle length has been varied from the minimum cycle for
the most critical junction of the artery (namely 32s) to its current value (1085s) As
before the objective functions of the two problems are the maximal bandwidth and the
minimum delay for the artery
The corresponding values of maximum bandwidth and sub-optimal minimum delay
offsets are reported in Table 1 and Table 2 respectively
Table 1 Offsets of maximum bandwidth [s] for different values of cycle length
Cycle [s]
Node N 32 42 52 62 72 82 92 102 1085
1 0 0 0 0 0 0 0 0 0
2 149 195 242 288 335 381 428 474 1047
3 149 405 502 598 335 381 428 474 504
4 309 195 502 598 695 791 888 474 504
5 155 204 92 611 349 398 446 1005 526
6 177 233 29 34 400 455 511 56 65
Table 2 Offsets of minimum delay [s] for different values of cycle length
Offset of minimum delay [s]
Cycle [s]
Node N 32 42 52 62 72 82 92 102 1085
1 0 0 0 0 0 0 0 0 0
2 319 395 452 108 125 641 768 944 17
3 159 55 452 598 45 381 428 474 475
4 289 195 262 378 125 591 648 474 505
5 185 414 272 611 350 398 446 845 851
6 197 323 49 34 430 545 631 76 59
Figure 11 plots the value of delay at nodes along the artery for different values of the
cycle length and the corresponding sub-optimal offsets by assuming acceleration
capabilities of vehicles and then allowing a platoon catching up the preceding one
As expected the delay function is non convex The lowest value is obtained for a
cycle length of 42s while other local minima are obtained for the cycle lengths of 72s
and 102s
European Transport Trasporti Europei (2013) Issue 53 Paper ndeg 7 ISSN 1825-3997
- 15 -
0
20
40
60
80
100
120
32 42 52 62 72 82 92 102
Cycle length [s]
Dela
y [
sv
eh
]
Figure 11 Estimation of node delay along the artery by the platoon progression model
for different values of the cycle length
4 Experiments on signal control strategies by applying different traffic models
41 Signal control and dynamic assignment problems
Dynamic traffic assignment models are the advanced modeling framework suited to
simulate traffic patterns in congested urban networks as they can both simulate the flow
progression along links and reproduce the complex interaction between traffic flow and
route choice behavior of users In order to validate the results of the synchronization
solution provided by the platoon model a dynamic traffic assignment model is applied
with a twofold goal The first concerns the consistency between the platoon model and
the mesoscopic models implemented in dynamic traffic assignment models the second
the impact that synchronization would induce on driversrsquo route choice and then on
traffic patterns
Several software packages for solving dynamic traffic assignment are now available
Two of the most popular and advanced (Dynasmart 2004 and Dynameq 2005) have
been taken into consideration in this research and have been object of a systematic
comparison
Both have been applied to a selected area of the road network of Rome having 51
centroids 300 nodes 870 links 70 signalized junctions (18 under control) including
the artery Viale Regina Margerita-Viale Liegi Figure 12 shows the study network as
displayed by the two software packages
European Transport Trasporti Europei (2013) Issue 53 Paper ndeg 7 ISSN 1825-3997
- 16 -
Figure 12 The study network in Dynameq (on the left) and Dynasmart (on the right)
The red ellipse indicates the synchronized artery Viale Regina Margerita-Viale Liegi
Both models require a time dependent origin ndash destination demand matrix which can
be estimated using network observations such link flow counts measured speeds (see
Bera and Rao 2011 for a review Cipriani et al 2011 for a dynamic model) Despite
both procedures are simulation based they differ on several points the modeling
approach of traffic flow (Dynameq assumes a fundamental triangular diagram
Dynasmart a modified Greenshield model) the route choice (two phases for Dynameq
a path generation phase in which one new path at each iteration is added until the
maximum predefined number of paths is reached and a convergence phase in which no
new paths are added one phase for Dynasmart which does not introduce any
distinction between the generation phase and the convergence phase) the simulation
process (Dynameq uses an event based procedure Dynasmart a macroparticle
simulation model) the convergence criterion (time based for Dynameq flow based for
Dynasmart)
Dynameq model exploits variants of gradient like directions and the method of
successive averages (MSA) to determine pre-trip dynamic equilibrium path choices
The path choices are modelled as decision variables governed by a user optimal
principle where each driver seeks to minimize the used path travel time All drivers
have perfect access to information which consists of the travel times on all paths (used
and unused) The solution algorithm takes the form of an iterative procedure designed to
converge to these conditions and consists of two main components
1 A method to determine a new set of time-dependent path input flows given the
experienced path travel times at the previous iteration
2 A method to determine the actual link flows and travel times that result from a
given set of path inflow rates This is referred to as the network loading
component which is carried out using an efficient event-based traffic simulation
model The model explicitly represents the operation of traffic signals and
realistically captures traffic congestion phenomena such as the upstream spill-
back of congestion from link to link
Thus Dynameq aims especially at providing a detailed representation of traffic flow
by following a microsimulation approach It reproduces the traffic behavior at junction
approaches by an explicit lane changing model and resolves conflicts at nodes by
applying a gap acceptance rule It simulates pre-timed signal traffic control and ramp
metering
European Transport Trasporti Europei (2013) Issue 53 Paper ndeg 7 ISSN 1825-3997
- 17 -
On the other hand Dynasmart provides a simpler framework to model the traffic flow
and aims rather at allowing simulating the impact of real-time strategies of traffic
control and information systems (like actuated traffic signal ramp metering variable
message signs and vehicle route guidance) on usersrsquo behavior
Comparison of link traffic flows between a static assignment model (Emme2) and
dynamic assignment models shows not very dissimilar results (R2=069) but as
expected the static model provides higher values of link traffic flows In fact the static
model assumes that the whole trip demand is assigned within a steady-state simulation
period while dynamic models simulate the whole charging and discharging process of
the network by complying with capacity constraint
In a first experiment Dynameq was applied to simulate the artery by assuming a cycle
length of 1085 seconds (which better fits the current conditions) and the corresponding
suboptimal offset vector (last column of Table 2)
Two issues are dealt with one concerns the effectiveness of synchronization taking
into account the interaction between traffic control and driversrsquo route choice to the
solution found the other one regards the capability of such a simple model to estimate
the average travel time along the artery
As for the first issue results reported in Table 3 show a significant reduction of delay
on the artery (about 13) which is even more important if we consider that due to its
improved performances the artery attracts 138 more traffic The total travel time on
the whole network decreases as about 2 although the study area is much wider than
the influence area of the artery and more important the objective function of the
synchronization algorithm accounts only the travel time of the artery
Table 3 Offsets Comparison of arterial and network results pre and post
synchronization
Current scenario Synchronization Difference
Average arterial travel time
[s] 1765 1540 -127
Average total arterial traveled distance
[vehkm] 414 471 +138
Average total network
travel time [vehh] 876 855 -24
Values referred to 5 minutes time intervals
As for the second issue since signals have been set by assuming the traffic flows as
given and the dynamic traffic assignment provided the equilibrium traffic flows
corresponding to these signals to validate the platoon progression model the latter has
been applied again by taking these equilibrium traffic flows as input
Although the platoon progression model is based on a much simpler theory that
assumes stationary and homogeneous traffic flow the two models provide very similar
results As far as the two assumptions considered in the platoon progression model
namely the possibility or not that platoons can always catch-up each other indicated as
hypotheses b) and c) in section 21 the former assumption provided a better
correspondence with the microsimulation performed by Dynameq as shown in Figures
13 and 14 for the two directions respectively
European Transport Trasporti Europei (2013) Issue 53 Paper ndeg 7 ISSN 1825-3997
- 18 -
Figure 13 Comparison between simulation and platoon progression model
(Arterial direction 1 Cycle length 1085 s)
Figure 14 Comparison between simulation and platoon progression model
(Arterial direction 2 Cycle length 1085 s)
Then experiments have been repeated by assuming the two local minima values for
the cycle length that had been computed by applying the platoon progression model
(namely 42 s and 72 s)
European Transport Trasporti Europei (2013) Issue 53 Paper ndeg 7 ISSN 1825-3997
- 19 -
Table 4 Comparison of arterial and network results pre and post synchronization
(C=42s)
Current scenario Synchronization Difference
Average arterial travel time
[s] 1765 1538 -129
Average total arterial traveled distance
[vehkm] 414 599 +447
Average total network
travel time [vehh] 876 1001 +143
Table 5 Comparison of arterial and network results pre and post synchronization
(C=72s)
Current scenario Synchronization Difference
Average arterial travel time
[s] 1765 1488 -157
Average total arterial traveled distance
[vehkm] 414 526 +271
Average total network
travel time [vehh] 876 886 +11
Results summarized in Tables 4 and 5 show similar values of delay reduction on the
artery (about 13 and 16 for C=42s and C=72s respectively) with an even higher
increase of traffic with respect to the previous experiment
However a slight worsening affects the total network travel time which increases as
143 for a cycle length of 42s and 11 for a cycle length of 72s (Table 4)
Thus synchronization is very effective to improve the performances of the artery
Moreover traffic patterns are very sensitive to improved signal settings so that the
artery attracts much higher traffic volumes As signal settings affect also performances
of transversal roads arterial improvements do not imply a reduction of total network
travel time This is as more evident as closer the cycle length is to the minimum value
that satisfies the capacity conditions In this case in fact even small perturbations of
traffic can heavily affect the average delay especially on transversal roads
The validation of platoon progression model for different values of cycle length
(Figure 15) shows that the differences between the two models become larger when
shorter values of cycle are used In such cases the green is long just enough to allow the
traffic flow being served and even a small random increase of traffic produces a
temporary over-saturation and a relevant increase of delay which can not be predicted
by a stationary model
European Transport Trasporti Europei (2013) Issue 53 Paper ndeg 7 ISSN 1825-3997
- 20 -
-
20
40
60
80
100
120
140
160
180
200
40 50 60 70 80 90 100 110Cycle length [s]
Dela
y [
s]Dynamic User Equilibrium
platoon progression
model with catchup
platoon progressionl
model without catchup
Figure 15 Delay on the arterial computed by different models for different values of
cycle length
42 Some remarks on queue simulation in dynamic traffic assignment in over-
saturated conditions
In traffic network simulation modeling of queue progression and clearance is crucial
to ensure a realistic and accurate simulation of the traffic congestion As a matter of
fact spill back of queues at nodes may reduce the capacity of upstream intersections
and may so provide even a large increase of the overall delay Moreover simulation of
high congested networks by dynamic traffic models can often lead to gridlock
conditions that block the simulation Because of the relevance of gridlock on the
dynamic assignment problem it has been object of a more detailed study addressed to
analyze its starting point and its propagation across the network
For this purpose peak-hour conditions having a total hourly demand of about 31000
trips with a time-varying profile have been simulated by applying both dynamic user
equilibrium assignment models introduced in Section 41
It has been observed that gridlock starts when a queue at one node blocks the traffic
flow on a transversal link The total block of traffic characterizing a gridlock condition
occurs when all the links belonging to a circuit are saturated by a queue in this case
dynamic network traffic models predict that the outflow is zero so that all links
belonging to a circuit each of them blocks the flow from the upstream link and the
queue can not be dissipated
To focus on a specific critical condition for gridlock starting we analyze in detail the
queue spilling back along one of the main arteries of the study area in direction of the
city center (Via Nomentana in Figure 16) in the time interval between the 20th and the
80th minute of simulation
European Transport Trasporti Europei (2013) Issue 53 Paper ndeg 7 ISSN 1825-3997
- 21 -
Figure 16 Links of Via Nomentana
Values of occupancy in Figure 17 display how the queue starts around the 25-th
minute from downstream link (identified by number 805 in figure) and then spills back
to upstream links reaching the last one (identified by number 714 in figure) after 10
minutes At the 70-th minute all blocked vehicles on the downstream link starts to
move and the queue is partially cleared at the end of simulation
Figure 17 Occupancy of links of Via Nomentana as computed by Dynasmart
Unlike in static traffic assignment link saturation does not depend only on the flow
entering the link which is indeed only 25 of its saturation flow but depends on the
intersection at the end of the downstream link (picture on the left in Figure 17) Spill
back and dissipation of queues across the network is displayed in Figure 18 It
highlights that the queue on Via Nomentana is induced by the queue on the transversal
link (Viale Gorizia) which blocks the outflow from Via Nomentana (picture on the left
in the Figure)
European Transport Trasporti Europei (2013) Issue 53 Paper ndeg 7 ISSN 1825-3997
- 22 -
Via
Nom
enta
na
Cor
so T
ries
te
Viale Gorizia
Via SCostanza
Piazza
Verbano
Via
Nom
enta
na
Cor
so T
ries
te
Viale Gorizia
Via SCostanza
Piazza
Verbano
Via
Nom
enta
na
Cor
so T
ries
te
Viale Gorizia
Via SCostanza
Piazza
Verbano
Via
Nom
enta
na
Cor
so T
ries
te
Viale Gorizia
Via SCostanza
Piazza
Verbano
Via
Nom
enta
na
Cor
so T
ries
te
Viale Gorizia
Via SCostanza
Piazza
Verbano
Via
Nom
enta
na
Cor
so T
ries
te
Viale Gorizia
Via SCostanza
Piazza
Verbano
Figure 18 Queue movement across the network as computed by Dynasmart in three
different consecutive time instants (from left to right)
Similar conditions occur on the parallel artery directed to the city center (Corso
Trieste) as well as on another transversal artery (Via di Santa Costanza) which
connects Corso Trieste and Via Nomentana Such a situation is critical for a gridlock
condition (picture at the center of Figure 18)
Anyway in the example shown the queue on Corso Trieste does not spill back up to
Via Nomentana so that the gridlock condition is not attained and the queue can finally
be cleared
Picture on the right of Figure 18 illustrates also a definite gridlock condition occurring
in Piazza Verbano where the links component of the roundabout are not long enough to
allocate the queues fed by the upstream roads After the gridlock is reached queues can
not be cleared and vehicles involved in it cannot reach their destination at the end of the
simulation
Accurate calibration of the most important parameters of the model as link storage
capacity and critical speed is then required to properly simulate usual recurrent
congestion conditions when temporary over-saturation occurs and even long and multi-
branched queues spill back across the network but are always dissipated as the demand
flow decreases
Actually dynamic traffic models are conceived to simulate the congestion mechanism
and can reproduce stopping and queuing phenomena but cannot reproduce the
subsequent phase of traffic re-starting after downstream conditioning has been removed
This is true for all dynamic traffic models starting from the well-known car following
model (Rothery 1998) that reproduces drivers behavior along a link to the most
advanced dynamic network models analyzed here
To reproduce the phenomenon of slow queue movement and allow outflow from
saturated links a minimum speed corresponding to jam density has been introduced in
Dynasmart
However Dynameq applies an adaptive gridlock prevention algorithm that permits to
stop the vehicles on a link when they are going to feed a potential gridlock situation In
the case under study the link 805 is recognized as a potential source for gridlock
conditions as it reaches a critical value of the occupancy rate Thus the outflow from
the upstream link (indicated as 688) is reduced and is controlled until critical conditions
are definitely disappeared (picture on the left in Figure 19) Picture on the right shows
how the occupancy of link 688 is still high until the risk of a gridlock decreases (after
the 65th minute)
European Transport Trasporti Europei (2013) Issue 53 Paper ndeg 7 ISSN 1825-3997
- 23 -
Figure 19 Outflow and occupancy of different links of Via Nomentana as computed by
Dynameq
The analyses conduced confirm that dynamic traffic assignment models can capture
the spreading and clearance of congestion on road networks as confirmed also by
Figure 20 which highlights the good correspondence between simulated and observed
saturation degrees on links 805 and 688
The main problems experienced in practical applications to real networks arise from
calibration and more specifically from the need of a fine tuning of link jam density and
saturation flow to properly reproduce the gridlock phenomenon This is especially true
on narrow mesh road networks as in many European historical towns
However to authorsrsquo knowledge no model has yet been developed to describe the
behavioral mechanism behind the dissipation of multi-branching queues on a road
network
Figure 20 Observed and simulated degree of saturation of different links of Via
Nomentana as computed by Dynameq
5 Conclusions and further developments
Main results of a research project on interaction between signal settings and traffic
flow patterns on road networks have been presented
Different approaches to model traffic flow have been introduced and compared the
platoon progression model on a synchronized artery a generalization of the cell
European Transport Trasporti Europei (2013) Issue 53 Paper ndeg 7 ISSN 1825-3997
- 24 -
transmission model a microsimulation queuing model two dynamic traffic assignment
models
In numerical applications to a real-size artery we observed a good correspondence
between the platoon progression model and dynamic traffic simulation models if
signals are far from saturation Non-convexity of the minimum delay synchronization
problem does not guarantee obtaining the global optimal solution nevertheless the
objective function seems to be rather robust with respect to flow changes so that travel
time improvement provided by signal synchronization on a main artery may induce
more drivers to use it without any significant increase of delay on it and on the
contrary with a decrease of delay on other roads of the network
Numerical tests on a real-size network highlighted that the gridlock phenomenon is
very relevant to simulate the road network under heavy congested conditions Hence
more research efforts should be undertaken to develop a model that properly reproduce
the dissipation of multi-branched queues on the network
As far as signal control we introduced a synchronization algorithm based on the
platoon progression model which revealed to be very effective in reducing arterial
travel times Current research on signal control is focusing on both arterial
synchronization and real-time distributed control The dynamic traffic control concerns
a Linear-Quadratic regulator designed to keep signals settings and traffic flows stably
near a desired state namely the solution of the global optimization of signal settings
problem
Acknowledgment ndash The paper summarizes the results of the research project ldquoInteraction between
signal settings and traffic flow patterns on road networksrdquo granted by the Italian Ministry of University
and Research with the Fund for Investments on Basic Research (FIRB) The project joins three research
units belonging respectively to the University of Rome ldquoLa Sapienzardquo the University ldquoRoma Trerdquo and
the Institute for Information System Analysis (IASI) of the Italian National Council of Research
References
Abdelfatah AS Mahmassani H (1998) System optimal time-dependent path
assignment and signal timing in traffic networks paper presented at the 77th Annual
Meeting of Transportation Research Board
Abdelghany K Valdes D Abdelfatah A and Mahmassani H (1999) Real-time
traffic assignment and path-based signal coordination application to network traffic
management 78th Annual Meeting of Transportation Research Board Washington
January 1999
Adacher L and Cipriani E (2010) A surrogate approach for the global optimization
of signal settings and traffic assignment problem Proc Of the 13th Intern IEEE Conf
on Intelligent Transportation Systems Funchal 19-22 September 2010
Bera S Rao KVK (2011) Estimation of origin-destination matrix from traffic
counts the state of the art European Transport Trasporti Europei 49 pp 2-23
Cantarella GE Velonagrave P Vitetta A (2012) Signal setting with demand assignment
Global optimization with day-to-day dynamic stability constraints Journal of Advanced
Transportation 46 pp 254-268
Cantarella GE Improta and G Sforza A (1991) Road network signal setting
equilibrium conditions In Papageorgiou M (Ed) Concise Encyclopedia of Traffic
and Transportation Systems Pergamon Press pp 366ndash371
European Transport Trasporti Europei (2013) Issue 53 Paper ndeg 7 ISSN 1825-3997
- 25 -
Cascetta E Gallo M Montella B (2006) Models and algorithms for the
optimization of signal settings on urban networks with stochastic assignment models
Ann Oper Res 144 pp 301ndash328
Chiou SW (2011) A novel algorithm for area traffic capacity control with elastic
travel demands Applied Mathematical Modelling 35 2 February 2011 pp 650-666
Cipriani E Fusco G (2004) Combined Signal Setting Design and Traffic
Assignment Problem European Journal of Operational Research 155 pp 569ndash583
Cipriani E Florian M Mahut M Nigro M (2011) A gradient approximation
approach for adjusting temporal origin-destination matrices Transportation Research-
Part C 19 270-282
Colombaroni C Fusco G Gemma A (2009) Optimization of Traffic Signals on
Urban Arteries through a Platoon-Based Simulation Model Proc of the 11th WSEAS
Int Conference on Automatic Control Modeling and Simulation pp 450-455
Dynameq userrsquos manual ndash Release 11 November 2005
Dynasmart-P Version 10 Userrsquos Guide September 2004
Fusco G Colombaroni C Gemma A (2010) A Model and an Algorithm for Signal
Synchronization and Bus Priority on Urban Arteries Proc of the Int Conference
Models and Technologies for Intelligent Transportation Systems pp 354-360 Aracne
Ghali MO and Smith MJ (1995) A model for the dyamic system optimum traffic
assignment problem Transportation Research-Part B 28 pp155-17
Newell GF (1989) Theory of Highway Traffic Signals Course Notes UCB-ITS-CN-
89-1 University of California at Berkeley
Papola N and Fusco G (1998) Maximal Bandwidth Problems a New Algorithm
Based on the Properties of Periodicity of the System Transportation Research-Part B
32 pp 277-288
Papola N and Fusco G (2000) A new analytical model for traffic signal
synchronization Proceedings of 2nd ICTTS Conference Beijing China 31 July-2
August 2000
Rothery RW (1998) Car Following Models in Traffic Flow Theory Nathan H
Gartner Carroll Messer Ajay K Rathi (eds) Transportation Research Board
httpwwwtfhrcgovitstfttfthtm
Smith MJ and Ghali MO (1990) Traffic assignment traffic control and road
pricing In CDaganzo (ed) Proc of the 12th International Symposium on
Transportation and Traffic Theory pp147-170 New York Elsevier
Taale H and van Zuylen HJ (2001) The combined traffic assignment and control
problemndashndashan overview of 25 years of research In 9th World Conference on Transport
Research Seoul Chorea July 22ndash27

European Transport Trasporti Europei (2013) Issue 53 Paper ndeg 7 ISSN 1825-3997
- 14 -
second experiment also the cycle length has been varied from the minimum cycle for
the most critical junction of the artery (namely 32s) to its current value (1085s) As
before the objective functions of the two problems are the maximal bandwidth and the
minimum delay for the artery
The corresponding values of maximum bandwidth and sub-optimal minimum delay
offsets are reported in Table 1 and Table 2 respectively
Table 1 Offsets of maximum bandwidth [s] for different values of cycle length
Cycle [s]
Node N 32 42 52 62 72 82 92 102 1085
1 0 0 0 0 0 0 0 0 0
2 149 195 242 288 335 381 428 474 1047
3 149 405 502 598 335 381 428 474 504
4 309 195 502 598 695 791 888 474 504
5 155 204 92 611 349 398 446 1005 526
6 177 233 29 34 400 455 511 56 65
Table 2 Offsets of minimum delay [s] for different values of cycle length
Offset of minimum delay [s]
Cycle [s]
Node N 32 42 52 62 72 82 92 102 1085
1 0 0 0 0 0 0 0 0 0
2 319 395 452 108 125 641 768 944 17
3 159 55 452 598 45 381 428 474 475
4 289 195 262 378 125 591 648 474 505
5 185 414 272 611 350 398 446 845 851
6 197 323 49 34 430 545 631 76 59
Figure 11 plots the value of delay at nodes along the artery for different values of the
cycle length and the corresponding sub-optimal offsets by assuming acceleration
capabilities of vehicles and then allowing a platoon catching up the preceding one
As expected the delay function is non convex The lowest value is obtained for a
cycle length of 42s while other local minima are obtained for the cycle lengths of 72s
and 102s
European Transport Trasporti Europei (2013) Issue 53 Paper ndeg 7 ISSN 1825-3997
- 15 -
0
20
40
60
80
100
120
32 42 52 62 72 82 92 102
Cycle length [s]
Dela
y [
sv
eh
]
Figure 11 Estimation of node delay along the artery by the platoon progression model
for different values of the cycle length
4 Experiments on signal control strategies by applying different traffic models
41 Signal control and dynamic assignment problems
Dynamic traffic assignment models are the advanced modeling framework suited to
simulate traffic patterns in congested urban networks as they can both simulate the flow
progression along links and reproduce the complex interaction between traffic flow and
route choice behavior of users In order to validate the results of the synchronization
solution provided by the platoon model a dynamic traffic assignment model is applied
with a twofold goal The first concerns the consistency between the platoon model and
the mesoscopic models implemented in dynamic traffic assignment models the second
the impact that synchronization would induce on driversrsquo route choice and then on
traffic patterns
Several software packages for solving dynamic traffic assignment are now available
Two of the most popular and advanced (Dynasmart 2004 and Dynameq 2005) have
been taken into consideration in this research and have been object of a systematic
comparison
Both have been applied to a selected area of the road network of Rome having 51
centroids 300 nodes 870 links 70 signalized junctions (18 under control) including
the artery Viale Regina Margerita-Viale Liegi Figure 12 shows the study network as
displayed by the two software packages
European Transport Trasporti Europei (2013) Issue 53 Paper ndeg 7 ISSN 1825-3997
- 16 -
Figure 12 The study network in Dynameq (on the left) and Dynasmart (on the right)
The red ellipse indicates the synchronized artery Viale Regina Margerita-Viale Liegi
Both models require a time dependent origin ndash destination demand matrix which can
be estimated using network observations such link flow counts measured speeds (see
Bera and Rao 2011 for a review Cipriani et al 2011 for a dynamic model) Despite
both procedures are simulation based they differ on several points the modeling
approach of traffic flow (Dynameq assumes a fundamental triangular diagram
Dynasmart a modified Greenshield model) the route choice (two phases for Dynameq
a path generation phase in which one new path at each iteration is added until the
maximum predefined number of paths is reached and a convergence phase in which no
new paths are added one phase for Dynasmart which does not introduce any
distinction between the generation phase and the convergence phase) the simulation
process (Dynameq uses an event based procedure Dynasmart a macroparticle
simulation model) the convergence criterion (time based for Dynameq flow based for
Dynasmart)
Dynameq model exploits variants of gradient like directions and the method of
successive averages (MSA) to determine pre-trip dynamic equilibrium path choices
The path choices are modelled as decision variables governed by a user optimal
principle where each driver seeks to minimize the used path travel time All drivers
have perfect access to information which consists of the travel times on all paths (used
and unused) The solution algorithm takes the form of an iterative procedure designed to
converge to these conditions and consists of two main components
1 A method to determine a new set of time-dependent path input flows given the
experienced path travel times at the previous iteration
2 A method to determine the actual link flows and travel times that result from a
given set of path inflow rates This is referred to as the network loading
component which is carried out using an efficient event-based traffic simulation
model The model explicitly represents the operation of traffic signals and
realistically captures traffic congestion phenomena such as the upstream spill-
back of congestion from link to link
Thus Dynameq aims especially at providing a detailed representation of traffic flow
by following a microsimulation approach It reproduces the traffic behavior at junction
approaches by an explicit lane changing model and resolves conflicts at nodes by
applying a gap acceptance rule It simulates pre-timed signal traffic control and ramp
metering
European Transport Trasporti Europei (2013) Issue 53 Paper ndeg 7 ISSN 1825-3997
- 17 -
On the other hand Dynasmart provides a simpler framework to model the traffic flow
and aims rather at allowing simulating the impact of real-time strategies of traffic
control and information systems (like actuated traffic signal ramp metering variable
message signs and vehicle route guidance) on usersrsquo behavior
Comparison of link traffic flows between a static assignment model (Emme2) and
dynamic assignment models shows not very dissimilar results (R2=069) but as
expected the static model provides higher values of link traffic flows In fact the static
model assumes that the whole trip demand is assigned within a steady-state simulation
period while dynamic models simulate the whole charging and discharging process of
the network by complying with capacity constraint
In a first experiment Dynameq was applied to simulate the artery by assuming a cycle
length of 1085 seconds (which better fits the current conditions) and the corresponding
suboptimal offset vector (last column of Table 2)
Two issues are dealt with one concerns the effectiveness of synchronization taking
into account the interaction between traffic control and driversrsquo route choice to the
solution found the other one regards the capability of such a simple model to estimate
the average travel time along the artery
As for the first issue results reported in Table 3 show a significant reduction of delay
on the artery (about 13) which is even more important if we consider that due to its
improved performances the artery attracts 138 more traffic The total travel time on
the whole network decreases as about 2 although the study area is much wider than
the influence area of the artery and more important the objective function of the
synchronization algorithm accounts only the travel time of the artery
Table 3 Offsets Comparison of arterial and network results pre and post
synchronization
Current scenario Synchronization Difference
Average arterial travel time
[s] 1765 1540 -127
Average total arterial traveled distance
[vehkm] 414 471 +138
Average total network
travel time [vehh] 876 855 -24
Values referred to 5 minutes time intervals
As for the second issue since signals have been set by assuming the traffic flows as
given and the dynamic traffic assignment provided the equilibrium traffic flows
corresponding to these signals to validate the platoon progression model the latter has
been applied again by taking these equilibrium traffic flows as input
Although the platoon progression model is based on a much simpler theory that
assumes stationary and homogeneous traffic flow the two models provide very similar
results As far as the two assumptions considered in the platoon progression model
namely the possibility or not that platoons can always catch-up each other indicated as
hypotheses b) and c) in section 21 the former assumption provided a better
correspondence with the microsimulation performed by Dynameq as shown in Figures
13 and 14 for the two directions respectively
European Transport Trasporti Europei (2013) Issue 53 Paper ndeg 7 ISSN 1825-3997
- 18 -
Figure 13 Comparison between simulation and platoon progression model
(Arterial direction 1 Cycle length 1085 s)
Figure 14 Comparison between simulation and platoon progression model
(Arterial direction 2 Cycle length 1085 s)
Then experiments have been repeated by assuming the two local minima values for
the cycle length that had been computed by applying the platoon progression model
(namely 42 s and 72 s)
European Transport Trasporti Europei (2013) Issue 53 Paper ndeg 7 ISSN 1825-3997
- 19 -
Table 4 Comparison of arterial and network results pre and post synchronization
(C=42s)
Current scenario Synchronization Difference
Average arterial travel time
[s] 1765 1538 -129
Average total arterial traveled distance
[vehkm] 414 599 +447
Average total network
travel time [vehh] 876 1001 +143
Table 5 Comparison of arterial and network results pre and post synchronization
(C=72s)
Current scenario Synchronization Difference
Average arterial travel time
[s] 1765 1488 -157
Average total arterial traveled distance
[vehkm] 414 526 +271
Average total network
travel time [vehh] 876 886 +11
Results summarized in Tables 4 and 5 show similar values of delay reduction on the
artery (about 13 and 16 for C=42s and C=72s respectively) with an even higher
increase of traffic with respect to the previous experiment
However a slight worsening affects the total network travel time which increases as
143 for a cycle length of 42s and 11 for a cycle length of 72s (Table 4)
Thus synchronization is very effective to improve the performances of the artery
Moreover traffic patterns are very sensitive to improved signal settings so that the
artery attracts much higher traffic volumes As signal settings affect also performances
of transversal roads arterial improvements do not imply a reduction of total network
travel time This is as more evident as closer the cycle length is to the minimum value
that satisfies the capacity conditions In this case in fact even small perturbations of
traffic can heavily affect the average delay especially on transversal roads
The validation of platoon progression model for different values of cycle length
(Figure 15) shows that the differences between the two models become larger when
shorter values of cycle are used In such cases the green is long just enough to allow the
traffic flow being served and even a small random increase of traffic produces a
temporary over-saturation and a relevant increase of delay which can not be predicted
by a stationary model
European Transport Trasporti Europei (2013) Issue 53 Paper ndeg 7 ISSN 1825-3997
- 20 -
-
20
40
60
80
100
120
140
160
180
200
40 50 60 70 80 90 100 110Cycle length [s]
Dela
y [
s]Dynamic User Equilibrium
platoon progression
model with catchup
platoon progressionl
model without catchup
Figure 15 Delay on the arterial computed by different models for different values of
cycle length
42 Some remarks on queue simulation in dynamic traffic assignment in over-
saturated conditions
In traffic network simulation modeling of queue progression and clearance is crucial
to ensure a realistic and accurate simulation of the traffic congestion As a matter of
fact spill back of queues at nodes may reduce the capacity of upstream intersections
and may so provide even a large increase of the overall delay Moreover simulation of
high congested networks by dynamic traffic models can often lead to gridlock
conditions that block the simulation Because of the relevance of gridlock on the
dynamic assignment problem it has been object of a more detailed study addressed to
analyze its starting point and its propagation across the network
For this purpose peak-hour conditions having a total hourly demand of about 31000
trips with a time-varying profile have been simulated by applying both dynamic user
equilibrium assignment models introduced in Section 41
It has been observed that gridlock starts when a queue at one node blocks the traffic
flow on a transversal link The total block of traffic characterizing a gridlock condition
occurs when all the links belonging to a circuit are saturated by a queue in this case
dynamic network traffic models predict that the outflow is zero so that all links
belonging to a circuit each of them blocks the flow from the upstream link and the
queue can not be dissipated
To focus on a specific critical condition for gridlock starting we analyze in detail the
queue spilling back along one of the main arteries of the study area in direction of the
city center (Via Nomentana in Figure 16) in the time interval between the 20th and the
80th minute of simulation
European Transport Trasporti Europei (2013) Issue 53 Paper ndeg 7 ISSN 1825-3997
- 21 -
Figure 16 Links of Via Nomentana
Values of occupancy in Figure 17 display how the queue starts around the 25-th
minute from downstream link (identified by number 805 in figure) and then spills back
to upstream links reaching the last one (identified by number 714 in figure) after 10
minutes At the 70-th minute all blocked vehicles on the downstream link starts to
move and the queue is partially cleared at the end of simulation
Figure 17 Occupancy of links of Via Nomentana as computed by Dynasmart
Unlike in static traffic assignment link saturation does not depend only on the flow
entering the link which is indeed only 25 of its saturation flow but depends on the
intersection at the end of the downstream link (picture on the left in Figure 17) Spill
back and dissipation of queues across the network is displayed in Figure 18 It
highlights that the queue on Via Nomentana is induced by the queue on the transversal
link (Viale Gorizia) which blocks the outflow from Via Nomentana (picture on the left
in the Figure)
European Transport Trasporti Europei (2013) Issue 53 Paper ndeg 7 ISSN 1825-3997
- 22 -
Via
Nom
enta
na
Cor
so T
ries
te
Viale Gorizia
Via SCostanza
Piazza
Verbano
Via
Nom
enta
na
Cor
so T
ries
te
Viale Gorizia
Via SCostanza
Piazza
Verbano
Via
Nom
enta
na
Cor
so T
ries
te
Viale Gorizia
Via SCostanza
Piazza
Verbano
Via
Nom
enta
na
Cor
so T
ries
te
Viale Gorizia
Via SCostanza
Piazza
Verbano
Via
Nom
enta
na
Cor
so T
ries
te
Viale Gorizia
Via SCostanza
Piazza
Verbano
Via
Nom
enta
na
Cor
so T
ries
te
Viale Gorizia
Via SCostanza
Piazza
Verbano
Figure 18 Queue movement across the network as computed by Dynasmart in three
different consecutive time instants (from left to right)
Similar conditions occur on the parallel artery directed to the city center (Corso
Trieste) as well as on another transversal artery (Via di Santa Costanza) which
connects Corso Trieste and Via Nomentana Such a situation is critical for a gridlock
condition (picture at the center of Figure 18)
Anyway in the example shown the queue on Corso Trieste does not spill back up to
Via Nomentana so that the gridlock condition is not attained and the queue can finally
be cleared
Picture on the right of Figure 18 illustrates also a definite gridlock condition occurring
in Piazza Verbano where the links component of the roundabout are not long enough to
allocate the queues fed by the upstream roads After the gridlock is reached queues can
not be cleared and vehicles involved in it cannot reach their destination at the end of the
simulation
Accurate calibration of the most important parameters of the model as link storage
capacity and critical speed is then required to properly simulate usual recurrent
congestion conditions when temporary over-saturation occurs and even long and multi-
branched queues spill back across the network but are always dissipated as the demand
flow decreases
Actually dynamic traffic models are conceived to simulate the congestion mechanism
and can reproduce stopping and queuing phenomena but cannot reproduce the
subsequent phase of traffic re-starting after downstream conditioning has been removed
This is true for all dynamic traffic models starting from the well-known car following
model (Rothery 1998) that reproduces drivers behavior along a link to the most
advanced dynamic network models analyzed here
To reproduce the phenomenon of slow queue movement and allow outflow from
saturated links a minimum speed corresponding to jam density has been introduced in
Dynasmart
However Dynameq applies an adaptive gridlock prevention algorithm that permits to
stop the vehicles on a link when they are going to feed a potential gridlock situation In
the case under study the link 805 is recognized as a potential source for gridlock
conditions as it reaches a critical value of the occupancy rate Thus the outflow from
the upstream link (indicated as 688) is reduced and is controlled until critical conditions
are definitely disappeared (picture on the left in Figure 19) Picture on the right shows
how the occupancy of link 688 is still high until the risk of a gridlock decreases (after
the 65th minute)
European Transport Trasporti Europei (2013) Issue 53 Paper ndeg 7 ISSN 1825-3997
- 23 -
Figure 19 Outflow and occupancy of different links of Via Nomentana as computed by
Dynameq
The analyses conduced confirm that dynamic traffic assignment models can capture
the spreading and clearance of congestion on road networks as confirmed also by
Figure 20 which highlights the good correspondence between simulated and observed
saturation degrees on links 805 and 688
The main problems experienced in practical applications to real networks arise from
calibration and more specifically from the need of a fine tuning of link jam density and
saturation flow to properly reproduce the gridlock phenomenon This is especially true
on narrow mesh road networks as in many European historical towns
However to authorsrsquo knowledge no model has yet been developed to describe the
behavioral mechanism behind the dissipation of multi-branching queues on a road
network
Figure 20 Observed and simulated degree of saturation of different links of Via
Nomentana as computed by Dynameq
5 Conclusions and further developments
Main results of a research project on interaction between signal settings and traffic
flow patterns on road networks have been presented
Different approaches to model traffic flow have been introduced and compared the
platoon progression model on a synchronized artery a generalization of the cell
European Transport Trasporti Europei (2013) Issue 53 Paper ndeg 7 ISSN 1825-3997
- 24 -
transmission model a microsimulation queuing model two dynamic traffic assignment
models
In numerical applications to a real-size artery we observed a good correspondence
between the platoon progression model and dynamic traffic simulation models if
signals are far from saturation Non-convexity of the minimum delay synchronization
problem does not guarantee obtaining the global optimal solution nevertheless the
objective function seems to be rather robust with respect to flow changes so that travel
time improvement provided by signal synchronization on a main artery may induce
more drivers to use it without any significant increase of delay on it and on the
contrary with a decrease of delay on other roads of the network
Numerical tests on a real-size network highlighted that the gridlock phenomenon is
very relevant to simulate the road network under heavy congested conditions Hence
more research efforts should be undertaken to develop a model that properly reproduce
the dissipation of multi-branched queues on the network
As far as signal control we introduced a synchronization algorithm based on the
platoon progression model which revealed to be very effective in reducing arterial
travel times Current research on signal control is focusing on both arterial
synchronization and real-time distributed control The dynamic traffic control concerns
a Linear-Quadratic regulator designed to keep signals settings and traffic flows stably
near a desired state namely the solution of the global optimization of signal settings
problem
Acknowledgment ndash The paper summarizes the results of the research project ldquoInteraction between
signal settings and traffic flow patterns on road networksrdquo granted by the Italian Ministry of University
and Research with the Fund for Investments on Basic Research (FIRB) The project joins three research
units belonging respectively to the University of Rome ldquoLa Sapienzardquo the University ldquoRoma Trerdquo and
the Institute for Information System Analysis (IASI) of the Italian National Council of Research
References
Abdelfatah AS Mahmassani H (1998) System optimal time-dependent path
assignment and signal timing in traffic networks paper presented at the 77th Annual
Meeting of Transportation Research Board
Abdelghany K Valdes D Abdelfatah A and Mahmassani H (1999) Real-time
traffic assignment and path-based signal coordination application to network traffic
management 78th Annual Meeting of Transportation Research Board Washington
January 1999
Adacher L and Cipriani E (2010) A surrogate approach for the global optimization
of signal settings and traffic assignment problem Proc Of the 13th Intern IEEE Conf
on Intelligent Transportation Systems Funchal 19-22 September 2010
Bera S Rao KVK (2011) Estimation of origin-destination matrix from traffic
counts the state of the art European Transport Trasporti Europei 49 pp 2-23
Cantarella GE Velonagrave P Vitetta A (2012) Signal setting with demand assignment
Global optimization with day-to-day dynamic stability constraints Journal of Advanced
Transportation 46 pp 254-268
Cantarella GE Improta and G Sforza A (1991) Road network signal setting
equilibrium conditions In Papageorgiou M (Ed) Concise Encyclopedia of Traffic
and Transportation Systems Pergamon Press pp 366ndash371
European Transport Trasporti Europei (2013) Issue 53 Paper ndeg 7 ISSN 1825-3997
- 25 -
Cascetta E Gallo M Montella B (2006) Models and algorithms for the
optimization of signal settings on urban networks with stochastic assignment models
Ann Oper Res 144 pp 301ndash328
Chiou SW (2011) A novel algorithm for area traffic capacity control with elastic
travel demands Applied Mathematical Modelling 35 2 February 2011 pp 650-666
Cipriani E Fusco G (2004) Combined Signal Setting Design and Traffic
Assignment Problem European Journal of Operational Research 155 pp 569ndash583
Cipriani E Florian M Mahut M Nigro M (2011) A gradient approximation
approach for adjusting temporal origin-destination matrices Transportation Research-
Part C 19 270-282
Colombaroni C Fusco G Gemma A (2009) Optimization of Traffic Signals on
Urban Arteries through a Platoon-Based Simulation Model Proc of the 11th WSEAS
Int Conference on Automatic Control Modeling and Simulation pp 450-455
Dynameq userrsquos manual ndash Release 11 November 2005
Dynasmart-P Version 10 Userrsquos Guide September 2004
Fusco G Colombaroni C Gemma A (2010) A Model and an Algorithm for Signal
Synchronization and Bus Priority on Urban Arteries Proc of the Int Conference
Models and Technologies for Intelligent Transportation Systems pp 354-360 Aracne
Ghali MO and Smith MJ (1995) A model for the dyamic system optimum traffic
assignment problem Transportation Research-Part B 28 pp155-17
Newell GF (1989) Theory of Highway Traffic Signals Course Notes UCB-ITS-CN-
89-1 University of California at Berkeley
Papola N and Fusco G (1998) Maximal Bandwidth Problems a New Algorithm
Based on the Properties of Periodicity of the System Transportation Research-Part B
32 pp 277-288
Papola N and Fusco G (2000) A new analytical model for traffic signal
synchronization Proceedings of 2nd ICTTS Conference Beijing China 31 July-2
August 2000
Rothery RW (1998) Car Following Models in Traffic Flow Theory Nathan H
Gartner Carroll Messer Ajay K Rathi (eds) Transportation Research Board
httpwwwtfhrcgovitstfttfthtm
Smith MJ and Ghali MO (1990) Traffic assignment traffic control and road
pricing In CDaganzo (ed) Proc of the 12th International Symposium on
Transportation and Traffic Theory pp147-170 New York Elsevier
Taale H and van Zuylen HJ (2001) The combined traffic assignment and control
problemndashndashan overview of 25 years of research In 9th World Conference on Transport
Research Seoul Chorea July 22ndash27
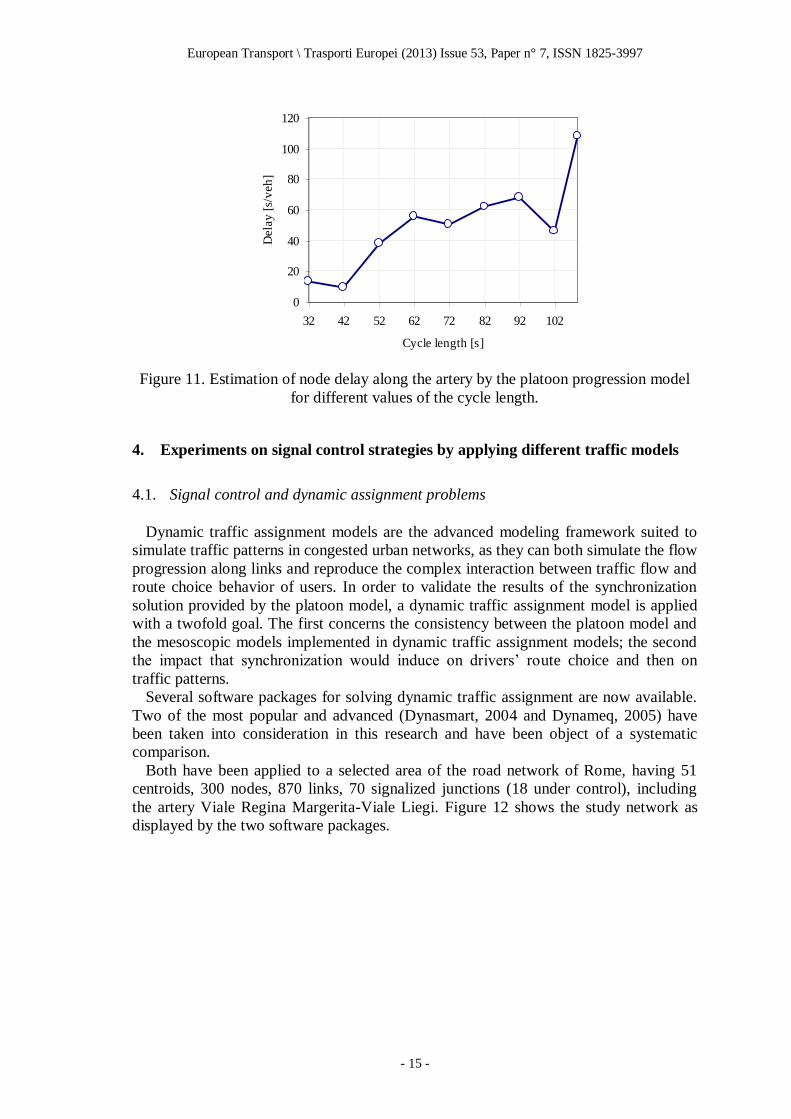
European Transport Trasporti Europei (2013) Issue 53 Paper ndeg 7 ISSN 1825-3997
- 23 -
Figure 19 Outflow and occupancy of different links of Via Nomentana as computed by
Dynameq
The analyses conduced confirm that dynamic traffic assignment models can capture
the spreading and clearance of congestion on road networks as confirmed also by
Figure 20 which highlights the good correspondence between simulated and observed
saturation degrees on links 805 and 688
The main problems experienced in practical applications to real networks arise from
calibration and more specifically from the need of a fine tuning of link jam density and
saturation flow to properly reproduce the gridlock phenomenon This is especially true
on narrow mesh road networks as in many European historical towns
However to authorsrsquo knowledge no model has yet been developed to describe the
behavioral mechanism behind the dissipation of multi-branching queues on a road
network
Figure 20 Observed and simulated degree of saturation of different links of Via
Nomentana as computed by Dynameq
5 Conclusions and further developments
Main results of a research project on interaction between signal settings and traffic
flow patterns on road networks have been presented
Different approaches to model traffic flow have been introduced and compared the
platoon progression model on a synchronized artery a generalization of the cell
European Transport Trasporti Europei (2013) Issue 53 Paper ndeg 7 ISSN 1825-3997
- 24 -
transmission model a microsimulation queuing model two dynamic traffic assignment
models
In numerical applications to a real-size artery we observed a good correspondence
between the platoon progression model and dynamic traffic simulation models if
signals are far from saturation Non-convexity of the minimum delay synchronization
problem does not guarantee obtaining the global optimal solution nevertheless the
objective function seems to be rather robust with respect to flow changes so that travel
time improvement provided by signal synchronization on a main artery may induce
more drivers to use it without any significant increase of delay on it and on the
contrary with a decrease of delay on other roads of the network
Numerical tests on a real-size network highlighted that the gridlock phenomenon is
very relevant to simulate the road network under heavy congested conditions Hence
more research efforts should be undertaken to develop a model that properly reproduce
the dissipation of multi-branched queues on the network
As far as signal control we introduced a synchronization algorithm based on the
platoon progression model which revealed to be very effective in reducing arterial
travel times Current research on signal control is focusing on both arterial
synchronization and real-time distributed control The dynamic traffic control concerns
a Linear-Quadratic regulator designed to keep signals settings and traffic flows stably
near a desired state namely the solution of the global optimization of signal settings
problem
Acknowledgment ndash The paper summarizes the results of the research project ldquoInteraction between
signal settings and traffic flow patterns on road networksrdquo granted by the Italian Ministry of University
and Research with the Fund for Investments on Basic Research (FIRB) The project joins three research
units belonging respectively to the University of Rome ldquoLa Sapienzardquo the University ldquoRoma Trerdquo and
the Institute for Information System Analysis (IASI) of the Italian National Council of Research
References
Abdelfatah AS Mahmassani H (1998) System optimal time-dependent path
assignment and signal timing in traffic networks paper presented at the 77th Annual
Meeting of Transportation Research Board
Abdelghany K Valdes D Abdelfatah A and Mahmassani H (1999) Real-time
traffic assignment and path-based signal coordination application to network traffic
management 78th Annual Meeting of Transportation Research Board Washington
January 1999
Adacher L and Cipriani E (2010) A surrogate approach for the global optimization
of signal settings and traffic assignment problem Proc Of the 13th Intern IEEE Conf
on Intelligent Transportation Systems Funchal 19-22 September 2010
Bera S Rao KVK (2011) Estimation of origin-destination matrix from traffic
counts the state of the art European Transport Trasporti Europei 49 pp 2-23
Cantarella GE Velonagrave P Vitetta A (2012) Signal setting with demand assignment
Global optimization with day-to-day dynamic stability constraints Journal of Advanced
Transportation 46 pp 254-268
Cantarella GE Improta and G Sforza A (1991) Road network signal setting
equilibrium conditions In Papageorgiou M (Ed) Concise Encyclopedia of Traffic
and Transportation Systems Pergamon Press pp 366ndash371
European Transport Trasporti Europei (2013) Issue 53 Paper ndeg 7 ISSN 1825-3997
- 25 -
Cascetta E Gallo M Montella B (2006) Models and algorithms for the
optimization of signal settings on urban networks with stochastic assignment models
Ann Oper Res 144 pp 301ndash328
Chiou SW (2011) A novel algorithm for area traffic capacity control with elastic
travel demands Applied Mathematical Modelling 35 2 February 2011 pp 650-666
Cipriani E Fusco G (2004) Combined Signal Setting Design and Traffic
Assignment Problem European Journal of Operational Research 155 pp 569ndash583
Cipriani E Florian M Mahut M Nigro M (2011) A gradient approximation
approach for adjusting temporal origin-destination matrices Transportation Research-
Part C 19 270-282
Colombaroni C Fusco G Gemma A (2009) Optimization of Traffic Signals on
Urban Arteries through a Platoon-Based Simulation Model Proc of the 11th WSEAS
Int Conference on Automatic Control Modeling and Simulation pp 450-455
Dynameq userrsquos manual ndash Release 11 November 2005
Dynasmart-P Version 10 Userrsquos Guide September 2004
Fusco G Colombaroni C Gemma A (2010) A Model and an Algorithm for Signal
Synchronization and Bus Priority on Urban Arteries Proc of the Int Conference
Models and Technologies for Intelligent Transportation Systems pp 354-360 Aracne
Ghali MO and Smith MJ (1995) A model for the dyamic system optimum traffic
assignment problem Transportation Research-Part B 28 pp155-17
Newell GF (1989) Theory of Highway Traffic Signals Course Notes UCB-ITS-CN-
89-1 University of California at Berkeley
Papola N and Fusco G (1998) Maximal Bandwidth Problems a New Algorithm
Based on the Properties of Periodicity of the System Transportation Research-Part B
32 pp 277-288
Papola N and Fusco G (2000) A new analytical model for traffic signal
synchronization Proceedings of 2nd ICTTS Conference Beijing China 31 July-2
August 2000
Rothery RW (1998) Car Following Models in Traffic Flow Theory Nathan H
Gartner Carroll Messer Ajay K Rathi (eds) Transportation Research Board
httpwwwtfhrcgovitstfttfthtm
Smith MJ and Ghali MO (1990) Traffic assignment traffic control and road
pricing In CDaganzo (ed) Proc of the 12th International Symposium on
Transportation and Traffic Theory pp147-170 New York Elsevier
Taale H and van Zuylen HJ (2001) The combined traffic assignment and control
problemndashndashan overview of 25 years of research In 9th World Conference on Transport
Research Seoul Chorea July 22ndash27
European Transport Trasporti Europei (2013) Issue 53 Paper ndeg 7 ISSN 1825-3997
- 24 -
transmission model a microsimulation queuing model two dynamic traffic assignment
models
In numerical applications to a real-size artery we observed a good correspondence
between the platoon progression model and dynamic traffic simulation models if
signals are far from saturation Non-convexity of the minimum delay synchronization
problem does not guarantee obtaining the global optimal solution nevertheless the
objective function seems to be rather robust with respect to flow changes so that travel
time improvement provided by signal synchronization on a main artery may induce
more drivers to use it without any significant increase of delay on it and on the
contrary with a decrease of delay on other roads of the network
Numerical tests on a real-size network highlighted that the gridlock phenomenon is
very relevant to simulate the road network under heavy congested conditions Hence
more research efforts should be undertaken to develop a model that properly reproduce
the dissipation of multi-branched queues on the network
As far as signal control we introduced a synchronization algorithm based on the
platoon progression model which revealed to be very effective in reducing arterial
travel times Current research on signal control is focusing on both arterial
synchronization and real-time distributed control The dynamic traffic control concerns
a Linear-Quadratic regulator designed to keep signals settings and traffic flows stably
near a desired state namely the solution of the global optimization of signal settings
problem
Acknowledgment ndash The paper summarizes the results of the research project ldquoInteraction between
signal settings and traffic flow patterns on road networksrdquo granted by the Italian Ministry of University
and Research with the Fund for Investments on Basic Research (FIRB) The project joins three research
units belonging respectively to the University of Rome ldquoLa Sapienzardquo the University ldquoRoma Trerdquo and
the Institute for Information System Analysis (IASI) of the Italian National Council of Research
References
Abdelfatah AS Mahmassani H (1998) System optimal time-dependent path
assignment and signal timing in traffic networks paper presented at the 77th Annual
Meeting of Transportation Research Board
Abdelghany K Valdes D Abdelfatah A and Mahmassani H (1999) Real-time
traffic assignment and path-based signal coordination application to network traffic
management 78th Annual Meeting of Transportation Research Board Washington
January 1999
Adacher L and Cipriani E (2010) A surrogate approach for the global optimization
of signal settings and traffic assignment problem Proc Of the 13th Intern IEEE Conf
on Intelligent Transportation Systems Funchal 19-22 September 2010
Bera S Rao KVK (2011) Estimation of origin-destination matrix from traffic
counts the state of the art European Transport Trasporti Europei 49 pp 2-23
Cantarella GE Velonagrave P Vitetta A (2012) Signal setting with demand assignment
Global optimization with day-to-day dynamic stability constraints Journal of Advanced
Transportation 46 pp 254-268
Cantarella GE Improta and G Sforza A (1991) Road network signal setting
equilibrium conditions In Papageorgiou M (Ed) Concise Encyclopedia of Traffic
and Transportation Systems Pergamon Press pp 366ndash371
European Transport Trasporti Europei (2013) Issue 53 Paper ndeg 7 ISSN 1825-3997
- 25 -
Cascetta E Gallo M Montella B (2006) Models and algorithms for the
optimization of signal settings on urban networks with stochastic assignment models
Ann Oper Res 144 pp 301ndash328
Chiou SW (2011) A novel algorithm for area traffic capacity control with elastic
travel demands Applied Mathematical Modelling 35 2 February 2011 pp 650-666
Cipriani E Fusco G (2004) Combined Signal Setting Design and Traffic
Assignment Problem European Journal of Operational Research 155 pp 569ndash583
Cipriani E Florian M Mahut M Nigro M (2011) A gradient approximation
approach for adjusting temporal origin-destination matrices Transportation Research-
Part C 19 270-282
Colombaroni C Fusco G Gemma A (2009) Optimization of Traffic Signals on
Urban Arteries through a Platoon-Based Simulation Model Proc of the 11th WSEAS
Int Conference on Automatic Control Modeling and Simulation pp 450-455
Dynameq userrsquos manual ndash Release 11 November 2005
Dynasmart-P Version 10 Userrsquos Guide September 2004
Fusco G Colombaroni C Gemma A (2010) A Model and an Algorithm for Signal
Synchronization and Bus Priority on Urban Arteries Proc of the Int Conference
Models and Technologies for Intelligent Transportation Systems pp 354-360 Aracne
Ghali MO and Smith MJ (1995) A model for the dyamic system optimum traffic
assignment problem Transportation Research-Part B 28 pp155-17
Newell GF (1989) Theory of Highway Traffic Signals Course Notes UCB-ITS-CN-
89-1 University of California at Berkeley
Papola N and Fusco G (1998) Maximal Bandwidth Problems a New Algorithm
Based on the Properties of Periodicity of the System Transportation Research-Part B
32 pp 277-288
Papola N and Fusco G (2000) A new analytical model for traffic signal
synchronization Proceedings of 2nd ICTTS Conference Beijing China 31 July-2
August 2000
Rothery RW (1998) Car Following Models in Traffic Flow Theory Nathan H
Gartner Carroll Messer Ajay K Rathi (eds) Transportation Research Board
httpwwwtfhrcgovitstfttfthtm
Smith MJ and Ghali MO (1990) Traffic assignment traffic control and road
pricing In CDaganzo (ed) Proc of the 12th International Symposium on
Transportation and Traffic Theory pp147-170 New York Elsevier
Taale H and van Zuylen HJ (2001) The combined traffic assignment and control
problemndashndashan overview of 25 years of research In 9th World Conference on Transport
Research Seoul Chorea July 22ndash27