shelf life extension of preformed pizza …digitool.library.mcgill.ca/thesisfile123317.pdf · shelf...
TRANSCRIPT
SHELF LIFE EXTENSION OF PREFORMED PIZZA USING PULSED ULTRAVIOLET
LIGHT
By
Tina Mohammadbeygy
Department of Bioresource Engineering
Macdonald Campus, McGill University
Ste-Anne-de-Bellevue, Quebec, Canada
A thesis submitted to McGill University in partial fulfillment of the
requirements of the degree of
Master of Science
December, 2013
© Tina Mohammadbeygy, 2013

i
DEDICATION
I dedicate this piece of work to my parents.

ii
ABSTRACT
Mold is a common post-processing contaminant in pizza. Since contamination could
occur in post-baking process, other safety barriers in addition to packaging are needed to ensure
the continued safety of preformed pizza. The present research investigated the use of pulsed UV-
light for the purpose of decontaminating Penicillium roqueforti (a common mold in bakery
products) on the surfaces of agar media, bread and preformed pizza.
In the first step in the present study, critical process parameters were optimized to
enhance the efficiency of pulsed UV-light treatments. The spatial distribution of pulsed UV-light
was investigated. A bench-top pulsed UV system was used to produce up to 1,000 V (20 J). The
Petri plates inoculated with Penicillium roqueforti were treated 10 min in the first three effective
levels in the treatment chamber (5, 10 and 15 cm). 30, 75 and 90 percent of the surface area of
the tray was exposed to pulsed light at 5, 10 and 15 cm from pulsed light lamp, respectively.
Apple juice was also used as a simple substrate to characterize the efficacy of the pulsed light
apparatus. Apple juice inoculated with E. coli was treated with pulsed UV-light at the same
distances (5, 10 and 15 cm) from the light source, 3 voltage inputs (400, 750 and 1,000 V) and 3
treatment times (1, 5 and 10 min). The log reduction in E. coli population treated by pulsed UV-
light varied from 1.4 to 2.05 log CFU ml-1
.
In the second phase of the study, the consistency of mold growth (Penicillium roqueforti)
on the surface of flat bread was investigated using two different methods of inoculation; random
spot and spread. The consistency trend over time was similar in both methods of inoculation.
Two different inoculum populations (102 and 10
3 CFU ml
-1) were also used to assess the effect of
inoculum concentration on the distribution and consistency of mold growth. Samples inoculated
with 102 CFU ml
-1 yielded more homogenously distributed colonies. The efficacy of these two
inoculation methods was also evaluated on pizza bread with and without toppings after
treatment. Parameters of 400 V, 1,200 pulses and a distance of 5 cm from the UV strobe resulted
in complete inactivation of P. roqueforti on the surface of bread in random spot and spread
inoculated samples (by visual inspection).
In the third phase of the study, two methods, e.g., sensory and microbiological analyses,
were used to evaluate the effectiveness of pulsed light treatment for shelf life extension of pizza
and bread. Up to 40 days shelf-life extension was achieved for 8, 32, and 40 percent of samples
with minimal, intermediate and maximal pulsed light treatment, respectively. Samples treated

iii
with the more intense voltage (1,000 V) showed steady surviving population less than 102
CFU
g-1
over the storage time in 21 days. However, 500 V treated breads and controls showed mold
growth on every analysis day (more than 103
CFU g-1
).
In the fourth phase of the study, the effectiveness of a broad-spectrum pulsed ultraviolet
light was evaluated for the decontamination of Penicillium roqueforti on the surface of solid
agar. Process parameters evaluated were treatment time (1, 3, 5, 7 and 10 min) and voltage input
(500, 750 and 1,000 V). The population of Penicillium roqueforti was reduced after 10 min of
exposure to pulsed light by 3.74, 5.36 and 6.14 log CFU ml-1
, respectively for 500, 750 and
1,000 V. The inactivation data were used to construct models to estimate the inactivation. The
log-linear and Weibull models were constructed. The results presented in this study indicate that
first-order kinetics is not suitable for the estimation of P. roqueforti inactivation on solid agar
with pulsed UV light. However, the inactivation kinetics was best described by the Weibull
model with the smallest root mean squared error (RMSE) (R2 ≥ 0.92). Weibull model can be
successfully used to estimate the inactivation and the concavity exhibited in the survival curves
observed in this study.
Finally in the last phase of study, culture-dependent and independent methods were
applied to study the ecology of preformed pizza produced in a pizzeria on the Island of Montreal.
Classical microbiological analyses were performed to identify the main microbial groups present
in the product. The average population of mesophilic aerobic bacteria (MAB), mesophilic
anaerobic bacteria (MANB), lactic acid bacteria (LAB), molds and yeasts (M+Y) were 6.6±0.5,
less than 2.4, 2.8±0.6 and 5.4±0.4 log CFU g-1
, respectively. Fungal diversity was analyzed by
extracting DNA from naturally spoiled preformed pizza samples. Molecular methods
incorporating conventional PCR targeting the 18S rRNA gene of fungi, TA cloning of PCR-
amplified fragments and sequencing were carried out to detect spoilage fungi in naturally spoiled
pre-formed pizza. The cloning approach enabled the putative identification of Saccharomyces
cerevisiae, Saccharomyces sp. WW-W23, Penicillium expansum, Penicillium freii, Penicillium
sp. HSL, Penicillium sp. ljg1, Rhodotorula mucilaginosa, Monascus fuliginosus, Hordeum
jubatum, Galactomyces geotrichum strains as well as uncultured fungus and uncultured
eukaryote clones.
Overall, pulsed UV-light was found to have a potential use for the decontamination of
spoilage microorganisms on the surfaces of solid agar and bakery products. However, further

iv
investigation using higher treatment voltages is necessary in order to achieve a higher target
decontamination of P. roqueforti.

v
RÉSUMÉ
La pizza pré-cuisinée est couramment contaminée par la moisissure. Puisque la
contamination pourrait se produire durant les procédés d’après cuisson, d'autres mesures, en plus
de l'emballage, sont nécessaires pour assurer la sécurité permanente des pizzas pré-cuisinée.
Cette recherche a examiné l'utilisation de la lumière UV pulsée pour décontaminer Penicillium
roqueforti sur la surface de l'agar solide, du pain et de pizzas préformées.
Dans la première étape de la présente étude, les paramètres critiques du procédé ont été
optimisés pour améliorer l'efficacité des traitements à la lumière pulsée. La répartition spatiale de
la lumière UV pulsée a été étudiée. Un Samtech de paillasse à UV pulsée a été utilisé pour
générer jusqu'à 1000 V (20 J). Les boîtes de Petri inoculées avec Penicillium roqueforti ont été
traitées 10 min dans une chambre de traitement pour les trois premiers niveaux d’efficacité (5, 10
et 15 cm). Les résultats démontrent que 30, 75 et 90 pour cent de la surface du plateau a été
exposée à la lumière pulsée à 5, 10 et 15 cm respectivement de la source lumineuse. Du jus de
pomme a également été utilisé comme substrat simple pour caractériser l'efficacité du dispositif à
lumière pulsée. Le jus de pomme inoculé avec E. coli a été traité avec la lumière pulsée aux
mêmes distances (5, 10 et 15 cm) de la source lumineuse que précédemment, sous trois entrées
de tension (400, 750 et 1000 V) et de temps de traitement (1, 5 et 10 min). La réduction en log de
la population de E. coli traitée par la lumière UV pulsée varie de 1.4 à 2.05 log UFC ml-1
. Cette
répartition a été obtenue avec des traitements de 120 impulsions à 400 V jusqu’à 1200
impulsions à 1000 V.
Dans la deuxième phase de l'étude, la cohérence de la croissance des moisissures
(Penicillium roqueforti) sur la surface du pain plat a été étudiée en utilisant deux méthodes
différentes d'inoculation : par inoculation ponctuelle aléatoire et par étalement. La cohérence de
la croissance a respecté une tendance similaire dans le temps pour les deux méthodes
d'inoculation. Deux populations d'inoculum différentes (102 et 10
3 UFC ml
-1) ont également été
utilisées pour évaluer l'effet de la densité de l'inoculum sur la distribution et la cohérence de la
croissance de moisissures. Les échantillons inoculés avec 102 UFC ml
-1 ont donné une
distribution des colonies plus homogène. L'efficacité de ces deux méthodes d'inoculation a
également été évaluée sur le pain à pizza avec et sans garnitures après le traitement. Les
paramètres de 400 V, 1200 impulsions et 5 cm de distance de l'impulsion d'UV ont abouti à une

vi
inactivation complète de P. roqueforti sur la surface des échantillons de pain inoculés autant
pour la méthode d’inoculation aléatoire que par étalement (par inspection visuelle).
À la troisième phase de cette étude, deux méthodes, soit l'analyse sensorielle et
microbiologique, ont été utilisées pour évaluer l'efficacité du traitement à la lumière pulsée pour
prolonger la durée de vie de la pizza et du pain. Jusqu'à 40 jours de prolongement de la durée de
conservation a été obtenue pour 8, 32 et 40 pour cent des échantillons après un traitement à la
lumière pulsée minimal, intermédiaire et maximal, respectivement. Les échantillons traités sous
tension plus intense (1000 V) ont montré des populations survivantes régulières de moins de 102
UFC g-1
au cours de la durée d’entreposage. Toutefois, les pains et les contrôles traités à 500 V
ont montré une croissance exponentielle pour chaque jour d'analyse (plus de 103 UFC g
-1).
Dans la quatrième phase de l’étude, l'efficacité d'une lumière UV pulsée à large spectre a
été évaluée pour la décontamination de Penicillium roqueforti sur la surface de l'agar solide. Les
paramètres du procédé évalués étaient le temps de traitement (1, 3, 5, 7 et 10 min) et la tension
d’entrée (500, 750 et 1000 V). La population de Penicillium roqueforti a été réduite après 10
minutes d'exposition à la lumière pulsée par 3.74, 5.36 et 6.14 log UFC ml-1
respectivement pour
500, 750 et 1000 V. Les données d'inactivation ont été utilisées pour construire des modèles pour
estimer l’inactivation. Les modèles log-linéaire et Weibull ont été construits. Les résultats
présentés dans cette étude indiquent que la cinétique de premier ordre n'est pas appropriée pour
l'estimation de l’inactivation de P. roqueforti sur l’agar solide avec la lumière pulsée. Cependant,
la cinétique d'inactivation a été mieux décrite par le modèle de Weibull avec la plus petite erreur
de moyenne quadratique (RMSE) (R2 ≥ 0.92). Le modèle de Weibull peut être utilisé avec succès
pour estimer l'inactivation et la concavité présente dans les courbes de survie observées dans
cette étude. L’augmentation de la température à l'intérieur de la chambre de traitement a
également été suivie au cours de cette expérience.
Finalement, dans la dernière phase de l’étude, des méthodes dépendantes ou
indépendantes des conditions de culture ont été appliquées pour étudier l'écologie des pizzas pré-
cuisinées produites dans une pizzeria de l'île de Montréal. Des analyses microbiologiques
classiques ont été effectuées pour identifier les principaux groupes microbiens présents dans le
produit. La moyenne de la population des bactéries mésophiles aérobies (BMA), des bactéries
mésophiles anaérobies (BMNA), des bactéries lactiques (BL), des moisissures et des levures

vii
(M+L) étaient respectivement de 6.6 ± 0.5, inférieur à 2.4, 2.8 ± 0.6 et 5.4 ± 0.4 log UFC g-1
. La
diversité fongique a été analysée par extraction d'ADN à partir d'échantillons de pizzas pré-
cuisinées naturellement contaminées. Les méthodes moléculaires incorporant la PCR
conventionnelle ciblant le gène de l’ARNr 18S des champignons, le clonage TA de fragments
amplifiés par PCR et le séquençage ont été réalisées pour détecter les champignons altérant les
pizzas pré-cuisinées naturellement contaminées. L'approche du clonage a permis l'identification
présumée de souches de Saccharomyces cerevisiae, Saccharomyces sp. WW- W23, Penicillium
expansum, Penicillium freii, Penicillium sp. HSL, Penicillium sp. ljg1, Rhodotorula
mucilaginosa, Monascus fuliginosus, Hordeum jubatum , Geotrichum galactomyces ainsi que
des champignons et eucaryotes non cultivés.
Dans l'ensemble, la lumière UV pulsée a démontré avoir un potentiel d’utilisation pour la
décontamination des microorganismes altérant les surfaces d'agar solide et les produits de
boulangerie. Toutefois, une étude plus approfondie sur des tensions de traitement plus élevées est
nécessaire pour parvenir à une décontamination satisfaisante de P. roqueforti.

viii
ACKNOWLEDGEMENTS
I would like to express sincere gratitude to my advisor, Dr. Michael O. Ngadi, for all his
guidance, encouragement, and patience throughout my graduate program. In the same vein, I
would like to appreciate my thesis co-supervisor, Dr. Martin R. Chénier, for his continuous and
valuable guidance, support and motivation for successful completion of the research work. My
special thanks go to Mr. Devin Holman for all the support and guidance extended to me during
the course of this work. I am grateful to Mr. Jamshid Rahimi, Mr. Chijioke Ejebe and Dr.
Akinbode Adedeji for their valuable help and support during this work.
My profound gratitude goes to Les Aliment Rustica in Montreal for having provided the
pizzas for the research work. I would like to acknowledge the Ministère de l'Agriculture, des
Pêcheries et de l'Alimentation du Québec (MAPAQ) for their financial support.
I would like to thank Mrs. Susan Gregus, Mrs. Trish Singleton and Mrs. Abida
Subhan for their valuable help and support in all administrative aspects.
I express my deep sense of gratitude to my most affectionate and beloved parents, Mrs.
Eli Nader and Mr. Alex Beigi for their great love, encouragement and advice during my studies.

ix
CONTRIBUTION OF AUTHORS
This thesis research consists of five manuscripts authored by me. The manuscripts were
corrected by Dr. Michael O. Ngadi, my supervisor, and by Dr. Martin R. Chénier, my co-
supervisor. Dr. Michael O. Ngadi and Dr. Martin R. Chénier were on my direct advisory
committee for designing the concepts, methodology and execution of the thesis research and
reviewed the thesis report. Chapter 5 was presented at the 2013 of The Northeast Agricultural
and Biological Engineering Conference (NABEC-2013, Altoona, PA, USA). A manuscript
including Chapters 3 to 7 of this thesis will be submitted for publication in a scientific journal.
The results from Chapter 6 have been submitted for oral presentation in the Annual Conference
of the American Society of Agricultural Engineers (ASABE-2014, Montreal, QC, Canada)

x
TABLE OF CONTENT
ABSTRACT ................................................................................................................................................................ ii
RÉSUMÉ ...................................................................................................................................................................... v
ACKNOWLEDGEMENTS .................................................................................................................................... viii
CONTRIBUTION OF AUTHORS ...........................................................................................................................ix
TABLE OF CONTENT .............................................................................................................................................. x
LIST OF TABLES .................................................................................................................................................... xiv
LIST OF FIGURES ................................................................................................................................................... xv
NOMENCLATURE ................................................................................................................................................. xvi
Greek ....................................................................................................................................................................... xvii
INTRODUCTION ....................................................................................................................................................... 1
OBJECTIVES ......................................................................................................................................... 4
CHAPTER 2 ................................................................................................................................................................. 5
LITERATURE REVIEW ........................................................................................................................................... 5
2.1 Bakery products .............................................................................................................................. 5
2.2.1 Physical spoilage ....................................................................................................................................... 7
2.2.2 Chemical spoilage ..................................................................................................................................... 7
2.2.3 Microbial spoilage .................................................................................................................................... 7
2.3 Traditional preservation technologies for bakery product ......................................................... 9
2.3.1 Freezing ..................................................................................................................................................... 9
2.3.2 Modified atmosphere packaging (MAP) .............................................................................................. 10
2.3.3 Microwave heating .......................................................................................................................... 10
2.4 Novel non-thermal processing technologies ................................................................................ 11
2.4.1 High hydrostatic pressure processing ................................................................................................. 11
2.4.2 Oscillating magnetic field (OMF) ......................................................................................................... 12
2.4.3 Ultraviolet ............................................................................................................................................... 12
2.5 Pulsed light treatment ................................................................................................................... 14
2.5.1 Pulse UV-light system ............................................................................................................................ 14
2.5.2 Pulsed-light mechanism of inactivation................................................................................................ 15
2.5.3 Kinetics of pulsed UV-light in microbial inactivation ......................................................................... 15
2.5.4 The efficiency of pulsed-light treatments ............................................................................................. 16
2.5.5 Light- substrate interaction ................................................................................................................... 16
2.5.6 Combination of pulsed light and other technologies ........................................................................... 17
2.5.7 Effects of pulsed light on food products ............................................................................................... 18
2.5.8 Various microorganism affected by pulsed UV-light .......................................................................... 21
2.6 Identification and quantification of spoilage fungi .................................................................... 21
2.6.1 Methods of identification of fungi ........................................................................................................ 22
2.7 REFERENCES .................................................................................................................................................. 25

xi
CHAPTER 3 ............................................................................................................................................................... 31
CHARACTERIZATION OF PULSED UV-LIGHT APPARATUS ..................................................................... 31
3.1 Abstract .......................................................................................................................................... 31
3.2 Introduction ................................................................................................................................... 31
3.3 Materials and Methods ................................................................................................................. 32
3.3.1 Pulsed UV- light system ......................................................................................................................... 32
3.3.2 Treatment chamber ............................................................................................................................... 33
3.3.3 Spatial distribution ................................................................................................................................ 34
3.3.4 Testing the equipment with the apple juice ......................................................................................... 35
3.3.5 Statistical analysis .................................................................................................................................. 37
3.4 Results and discussion .................................................................................................................. 37
3.4.1 Spatial power distribution (12 plate experiment) ................................................................................ 37
3.4.2 Microbial analysis for apple juice ...................................................................................................... 39
3.5 Conclusion ..................................................................................................................................... 41
3.6 REFERENCES .................................................................................................................................................... 41
CHAPTER 4 ............................................................................................................................................................... 43
SELECTION OF MICROBIOLOGICAL PROTOCOLS FOR INOCULATION AND ENUMERATION OF
MOLD ON BREAD SURFACE ............................................................................................................................... 43
4.1 Abstract .......................................................................................................................................... 43
4.2 Introduction ................................................................................................................................... 43
4.3 Materials and Methods ................................................................................................................. 44
4.3.1 Sampling ................................................................................................................................................. 44
4.3.2 Fungal isolate and preparation of inoculum ...................................................................................... 45
4.3.3 Inoculation of bread and visual inspection of untreated bread ....................................................... 45
4.3.4 Inoculation, pulsed UV-light treatment and visual inspection of treated breads without tomato
sauce topping ..................................................................................................................................................... 46
4.3.5 Inoculation, pulsed UV-light treatment and visual inspection of treated pizza bread with tomato
sauce topping ..................................................................................................................................................... 46
4.4 Results and discussion .............................................................................................................. 47
4.4.1 Inoculums size ...................................................................................................................................... 47
4.4.2 Inoculation methods ............................................................................................................................... 47
4.4.3 Inspection of mold growth on bread with and without tomato sauce topping .................................. 49
4.5 Conclusion ..................................................................................................................................... 51
4.6 REFERENCES ................................................................................................................................................. 51
CHAPTER 5 ............................................................................................................................................................... 52
SHELF LIFE EXTENTION OF PIZZA AND BREAD BY PULSED UV-LIGHT ............................................. 52
5.1 Abstract ............................................................................................................................... 52
5.2 Introduction......................................................................................................................... 52

xii
5.3 Materials and Methods ................................................................................................................. 54
5.3.1 Pizza bread with tomato sauce topping ................................................................................................ 54
5.3.2 Pizza bread without tomato sauce topping .......................................................................................... 54
5.3.3 Pulsed UV-light treatment for pizza samples .................................................................................... 54
5.3.4 Penicillium roqueforti inoculum preparation (for bread samples) ..................................................... 55
5.3.5 Pulsed UV- light treatment for bread samples .................................................................................. 55
5.3.6 Analysis of pizza samples after pulsed UV treatments ..................................................................... 55
5.3.7 Statistical analysis for bread ................................................................................................................. 56
5.4 Results and Discussion .................................................................................................................. 56
5.4.1 Pulsed UV-light on Pizza ....................................................................................................................... 56
5.4.2 Pulsed UV-light on Pizza ..................................................................................................................... 57
5.5 Conclusion ..................................................................................................................................... 59
5.6 REFERENCES .................................................................................................................................................. 59
CHAPTER 6 ............................................................................................................................................................... 61
EFFECTIVENESS OF PULSED ULTRAVIOLET-LIGHT TREATMENT FOR INACTIVATION OF
PENICILLIUM ROQUEFORTI ON AGAR SURFACE ........................................................................................ 61
6.1 Abstract .......................................................................................................................................... 61
6.2 Introduction ................................................................................................................................... 62
6.3 Material and methods ................................................................................................................... 63
6.3.1 Preparation of Inoculum ....................................................................................................................... 63
6.3.2 Treatments .............................................................................................................................................. 64
6.3.3 Inactivation of P. roqueforti ................................................................................................................... 64
6.3.4 Statistical analysis .................................................................................................................................. 64
6.3.5 Model development ................................................................................................................................ 64
6.4 Results and discussion .................................................................................................................. 66
6.4.1 Pulsed UV light and microbiological analysis ...................................................................................... 66
6.4.2 Inactivation kinetics model ................................................................................................................... 67
6.5 Conclusion ..................................................................................................................................... 69
6.6 REFRENCES ..................................................................................................................................................... 70
CHAPTER 7 ............................................................................................................................................................... 72
ANALYSIS OF FUNGAL DIVERSITY IN PRE-FORMED PIZZA BY SEQUENCING OF CLONED PCR-
AMPLIFIED GENES ENCODING 18S rRNA ...................................................................................................... 72
7.1 Abstract .......................................................................................................................................... 72
7.2 Introduction ................................................................................................................................... 72
7.3 Materials and methods ................................................................................................................. 73
7.3.1 Sampling ................................................................................................................................................. 73
7.3.2 Preparation of pizza samples for microbiological analysis ................................................................. 74
7.3.3 Enumeration of Total Bacteria ............................................................................................................. 74
7.3.4 Enumeration of Lactic Acid Bacteria .............................................................................................. 74
7.3.5 Identification of Lactic Acid Bacteria ............................................................................................. 74

xiii
7.3.6 Enumeration of Molds and Yeasts ........................................................................................................ 75
7.3.7 Extraction of Nucleic Acids ................................................................................................................... 75
7.3.8 Quantification and purity of DNA ........................................................................................................ 76
7.3.9 Verification of DNA quality .................................................................................................................. 76
7.3.10 Polymerase Chain Reaction amplification .................................................................................... 76
7.3.11 Temperature gradient PCR assay for primer pairs A and B ........................................................... 77
7.3.12 PCR on spoiled samples .................................................................................................................. 78
7.3.13 Purification of PCR products ......................................................................................................... 78
7.3.13 Cloning .................................................................................................................................................. 78
7.3.14 Sequencing ....................................................................................................................................... 81
7.4 Results and discussion .................................................................................................................. 81
7.4.1 Enumeration of microbial population .................................................................................................. 81
7.4.2 Identification of LAB isolates ................................................................................................................ 82
7.4.3 Concentration and purity of the isolated DNA after Extraction........................................................ 83
7.4.4 Temperature gradient PCR .................................................................................................................. 84
7.4.5 Conventional PCR on spoiled samples ................................................................................................. 85
7.4.6 Concentration and purity of PCR products ........................................................................................ 88
7.4.7 18S rDNA clone libraries ....................................................................................................................... 88
7.4.8 Diversity of fungal biota ........................................................................................................................ 91
7.5 Conclusion ..................................................................................................................................... 94
7.6 REFERENCES .................................................................................................................................................. 94
CHAPTER 8 ............................................................................................................................................................... 98
GENERAL SUMMARY & CONCLUSION ........................................................................................................... 98
Future Recommendations ....................................................................................................................................... 100

xiv
LIST OF TABLES
Table 2.1 Shelf-life of some bakery products. ......................................................................................................... 6
Table 3.1 Spatial power distribution of pulsed UV light on treatment tray, at three different distances (5, 10
and 15 cm) from pulsed UV source (PUV- 01 system)............................................................................................ 38
Table 4.1 Incidence of mold growth on pizza bread (without tomato topping) surface after UV treatment.
Ten random spots were applied to each dry bread surface (5 replicate bread slices per treatment) ................. 49
Table 4.2 Incidence of mold growth on pizza surface with tomato sauce topping, after UV treatment. Five
random spots were applied (4 replicated for each method). .................................................................................. 50
Table 5.1 Conditions used for the pulsed UV-light treatments ............................................................................ 56
Table 5.2 Percentage of non-moldy pizza before 10, 15, 20, 30, 40 days. ............................................................ 57
Table 6.1 Goodness-of-fit parameters of the first order kinetics models estimating reductions of Penicillium
roqueforti on solid agar after treatment with pulsed UV light. .............................................................................. 69
Table 6.2 Goodness-of-fit parameters of Weibull models estimating reductions of Penicillium roqueforti on
solid agar after treatment with pulsed UV light ..................................................................................................... 69
Table 7.1 Overview of the oligonucleotide sequences used in the study. ............................................................. 77
Table 7.2 Cloning conditions .................................................................................................................................. 80
Table 7.3 Microbia populations in spoiled pre-formed pizza. Data are the results of the microbiological
analysis of 10 samples.. .............................................................................................................................................. 82
Table 7.4 Identification of LAB by biomedical analysis. Biomedical profile was compared with the closest
relatives in the APIWEB database. .......................................................................................................................... 83
Table 7.5 Concentration and purity of extracted DNA from spoiled samples. .................................................. 84
Table 7.6 Concentration and purity of the purified PCR products spoiled samples... ...................................... 88
Table 7.7 Tentative identification of clones by sequencing and BLAST analysis. Sequences were aligned with
the closest relatives in the GenBank database with BLAST .................................................................................. 93
xv
LIST OF FIGURES
Figure 3.1 Schematic diagram of pulsed UV-light treatment system... ............................................................... 33
Figure 3.2 Spectral output from the light source at operating voltages of 400, 700 and 1,000 V ..................... 34
Figure 3.3 Position of Petri plates on pulsed UV-light chamber treatment tray ................................................ 35
Figure 3.4 Distribution of pulsed UV-light at varying distances (5, 10 and 15 cm) from the pulsed UV source
(1,000 V, 5 min) .......................................................................................................................................................... 38
Figure 3.5 Log reduction in population of Escherichia coli treated by pulsed UV- light in apple juice at
different distances, voltage inputs and treatment times ......................................................................................... 40
Figure 5.1 Surviving mold (P. roqueforti) population over storage time in each analysis day when time and
distance are fixed at 5 cm and 7 minutes ................................................................................................................. 58
Figure 6.1 Inactivation of Penicillium roqueforti with pulsed UV light fitted with the firstorder and Weibull
kinetics models.. ......................................................................................................................................................... 68
Figure 7.1 Temperature Gradient PCR for by perimer set A (A), and primer set B (B). Two replicates per
temperature are used ................................................................................................................................................. 85
Figure 7.2 PCR performed on spoiled samples using primer set B with 58°C annealing temperature. Two
replicates per temperature are used. Ladder shows 100 to 1,000 bp. ................................................................... 87
Figure 7.3 Four images show PCR performed after cloning using primer set C. The amplicons with insert of
the expected size are equal to 1,400 bp .................................................................................................................... 89

xvi
NOMENCLATURE
°C
Degree Celsius
A260/230
Absorbance at 260 nm / Absorbance at 230 nm
A260/280
Absorbance at 260 nm / Absorbance at 280 nm
ANOVA
Analysis of Variance
API
Analytical Profile Index
ATCC
American Type Culture Collection
aw
Water Activity
BLAST
Basic Local Alignment Sequence Tool
CFSAN
Center for Food Safety and Applied Nutrition
CFU
Colony Forming Unit
CM
Centimeter
CO2
Carbon Dioxide
DGGE
Denaturing Gradient Gel Electrophoresis
DNA
Deoxyribo Nucleic Acid
dNTP
Deoxyribo Nucleotide TriPhosphate
D-value
Time necessary for a 1 log reduction
EDTA
Ethylene-Diamine-Tetra-Acetic Acid
EPA
Environmental Protection Agency
FDA
Food and Drug Administration
HHP
High Hydrostatic Pressure
IPTG
Isopropyl b-D-Thio Galactoside
ITS
Internal Transcribed Spacers
J
Joule
LAB
Lactic Acid Bacteria
LB Broth
Luria-Bertani Broth
M+Y
Molds and Yeasts
MAB
Mesophilic Aerobic Bacteria
MANB
Mesophilic Anaerobic Bacteria
MAP
Modified Atmosphere Packaging
MHz
Mega Hertz
MPa
Mega Pascals
N
Number of Microorganisms
N0
Initial Number of Microorganisms
N2
Nitrogen
O2
Oxygen
xvii
OMF
Oscillating Magnetic Fields
PCR
Polymerase Chain Reaction
PDA
Potato Dextrose Agar
PDB
Potato Dextrose Broth
pH
Hydrogen Ion Concentration
PL
Pulsed Light
Pps
Pulse Per Second
PS
Polystyrene
PUV
Pulsed UV
R2
R-squared
rDNA
Ribosomal DNA
RFLP
Fragment Length Polymorphism
RMSE
Smallest Root Mean Squared Error
rpm
Revolutions Per Minute
rRNA
Ribosomal Ribonucleic Acid
SAS
Statistical Analysis Software
TA cloning
Adenine and Thymine cloning
TAE buffer
Tris-Acetate-EDTA
buffer
Taq
Thermus Aquaticus Polymerase
tR
Reliable life
UHP
Ultra High Pressure
UV
Ultraviolet
V
Voltage
X-Gal
5-bromo-4-chloro-3-indolyl-β-D-galactopyranoside
Greek
µl
Micro liter
µM
Micro Molar
t
Time
α
Wavelength
β
Characteristic Time
λ
Concavity

1
INTRODUCTION
Pizza is among the world’s most widely consumed convenience or fast food. It is
included in more than $2.3 billion industrial bread and bakery product in Canada and its
consumption is rapidly increasing (AAFC, 2011). In particular, pizza in its various forms is an
important part of the bakery industry. Beside the very large quantities that are prepared and
consumed at restaurants and homes, increasing numbers are produced as preformed pizza dough
that are ready to be finish-baked by consumers. The increasing popularity of pizza can be
attributed to its ability to address consumer demand for convenience products. Preformed pizzas
are sometimes sold frozen while others are sold as shelf stable products. Frozen pizza must be
kept frozen at all times until it is prepared for consumption. This requires significant energy
demand for processing. However, there is no need for refrigeration for shelf stable pizza products
as they are available in forms that can be stored at ambient temperature. Hence, the major
difficulty with these products is that they have very short shelf lives (Smith et al., 2004).
Despite their increasing popularity, the products are characterized by highly variable and
sometime unsatisfactory quality (Coppola et al., 1998). Spoilage problem of preformed pizza can
be grouped into 3 main sources namely: (1) physical spoilage (moisture loss, hardening); (2)
chemical spoilage (staling, rancidity); and (3) microbiological spoilage (yeast, mold, bacterial
growth). Spoilage due to microbial growth is by far the major factor limiting shelf life of
preformed pizza (Singh et al., 2011). Apart from health concerns, microbial spoilage presents
serious economic concern to the bakery industry accounting for about 1 to 5% of product losses.
Some of the common molds that have been identified on different bakery products include
Wallemia sebi, Penicillium spp., Cladosporium spp., Eurotium (Aspergillus) glaucus group, and
other Aspergilli (Smith et al., 2004). Though, there has not been any study to identify and
characterize mold in preformed pizza samples.
Preformed pizza products are generally free of viable microorganisms after baking.
However, contamination mostly occurs during the cooling and packaging processes (Pfeiffer et
al., 1999; Singh et al., 2010). Preventing contamination and growth of microbes in a
manufacturing environment is hardly achievable simply by adoption of aseptic conditions during
packaging. Therefore, most producers normally use chemical preservatives such as sodium
propionate, sorbic acid or other methods to prevent growth on the surface of the products
2
(Rodriguez et al., 2003). The use of chemical additives and thermal treatment of the products are
methods that are largely available to the industry to decontaminate, maintain the quality and
extend the shelf life of preformed pizza products. However, with more consumer desire for high
quality and no-chemical added products, it has become essential to search for novel non-thermal
methods of extending shelf life of the products.
Several non-thermal processing and preservation techniques have been used to minimize
these undesirable changes in bakery products. This includes traditional technologies such as
freezing and modified atmosphere packaging (MAP), as well as novel technologies such as high
hydrostatic pressure (HHP) processing, oscillating magnetic field (OMF), microwave heating,
and ultraviolet processing (Singh et al., 2010; Singh et al., 2011; Singh and Goyal, 2011;
Roriguez et al., 2003). However, there is always a need to investigate novel technologies as an
alternative to existing preservation methods to improve efficiency, minimize cost, and yield
minimal quality changes. One such technique is pulsed light treatment. Pulsed UV- light is a
method of decontamination when the microbial contamination is largely on the surface of a
product. This method of food preservation that involves the use of intense and short duration
pulses of broad-spectrum "white light", where each pulse, or flash, of light lasts a fraction of a
second and the intensity of each flash is approximately 20,000 times the intensity of sunlight at
sea level (Elmnasser et al., 2007). UV-light inactivates microorganisms by damaging the DNA
via the formation of thymine dimers, which prevents transcription thus inhibiting the replication
of the cell, which leads to death (Miller et al., 1999; Wang et al., 2005). The use of pulsed UV-
light is preferred to continuous UV-light, because it can provide a greater amount of
instantaneous energy which can result in a shorter application time.
Pulsed UV-light has been shown to successfully inactivate food pathogens on the
surfaces of some foods (Hillegas and Demirci, 2003; Jun, 2003; Sharma and Demirci, 2003b).
Literature reports on successful applications of pulsed light have been growing although
important gaps still remain with respect to actual application of the technology in the industry
(Ozer and Demirci, 2005; Elmnasser et al., 2007). Specifically, there is very limited information
on its application on baked products such as preformed pizza. Pulsed light is typically generated
by systems that accumulate electrical energy in a capacitor and subsequently dissipate the energy
within a very short time (nanoseconds) thus multiplying the power available several folds (Dunn
et al., 1995; MacGregor et al., 1998). Rowan et al. (1999) described a pulsed power device that

3
was evaluated for inactivation of microorganisms namely Listeria monocytogenes, Escherichia
coli, Salmonella enteritidis, Pseudomonas aeruginosa, Bacillus cereus and Staphylococcus
aureus on the surface of solid media. The authors reported inactivation up to 6 log reduction.
A vital aspect of characterizing novel technologies is the study of kinetic models to
determine the relationship between applied dose and inactivation levels. There have been limited
studies on the kinetics of pulsed UV inactivation of microorganisms on surfaces such as
preformed pizza. Unlike thermal processing, pulsed light treatment typically presents non-linear
inactivation curves (Izqquier and Gomez-Lopez, 2011; Luksiene et al., 2007; Geeraerd et al.,
2000). These curves may consist of a shoulder; a log-linear inactivation part and a tail.
Literatures report that these features are well described by the Weibull model. This model has
been used to describe pulsed light inactivation of E. coli O157:H7 and Salmonella enterica on
fruit surfaces (Bialka et al., 2008). Pulsed light inactivation kinetics of pure bacterial cultures
inoculated into model liquids or fruit juices has also recently been characterized (Uesugi et al.,
2007; Sauer and Moraru, 2009). The inactivation by pulsed light of microorganisms in solid food
substrates is however a more complex issue. A study on pulsed light application in the baked
product industry will contribute to the knowledge that will be required to implement industrial
applications of the technology. The possibility of using the technology will be a major industrial
break through. Adoption of the technology will give the industry an advantage that can be used
to produce and market superior and shelf stable products. Another novelty of the study is the
assessment and characterization of the microbial flora in the preformed pizza. The data generated
by the study will be critical for identifying the sources of contamination. The proposed study is
designed to be relevant to the bakery industry, particularly the preformed pizza sector.

4
OBJECTIVES
The objectives of this research were to:
(1) evaluate the effectiveness of pulsed light to inactivate molds and other microorganisms
on the surface of preformed pizza;
(2) determine the effect of pulse parameters and pulse durations on microbial inactivation;
(3) develop a method to study and model kinetics of inactivation of microorganisms on a flat
surface due to pulsed UV-light;
(4) to analyze the diversity and composition of the fungal community in pre-formed pizza

5
CHAPTER 2
LITERATURE REVIEW
2.1 Bakery products
Bakery products have been a significant part of a balanced diet for thousands of years.
These products that are widely available and consumed include sweet goods (pancakes,
doughnuts, waffles and cookies), unsweetened goods (bread, rolls, buns, crumpets, muffins and
bagels), and filled goods (sausage rolls, fruit and meat pies, sandwiches, pastries cream cakes,
pizza and quiche) (Smith et al., 2004). Bakery products are an essential source of calories, and an
important supply of nutrients such as protein, iron, calcium and several vitamins as well as a
good target for fiber enrichment (Saranraj and Geetha, 2012). Nowadays, the bakery products
production has evolved from a primeval, small house industry into a extensive, modern
manufacturing, creating thousands of employments and generating revenue in billions of dollars.
As these products are becoming a major part of the international food market, baking industry
struggles to satisfy the healthy eating trends, safety issues and the consumer demands for fresh
products (Byrne, 2000; Kohn, 2000). Deteriorations such as moulding and staling result in the
decrease of consumer acceptance for bakery products and in great economic losses (Kotsiani et
al., 2002). In the U.S. only, for example, it is estimated that losses due to microbiological
spoilage alone, are 1 to 3% or over 90 million kg of products each year (Oraikul et al., 1991).
Such concerns have made shelf life extension of bakery products an immense issue to be
discussed in the industry.
It is recognized that defining the shelf life of a food is a difficult task and is an area of
intense research for food product development scientists. Extending of shelf life is application
specific. Factors influencing shelf life of the bakery products are processing condition,
production properties (moisture content, physic-chemical properties), packaging materials
(barrier water vapor, O2, CO2, aroma, mechanical characteristics) and storage condition
(temperature, humidity, light) (Galić et al., 2009).

6
Table 2.1 Shelf-life of some bakery products
Product Shelf life (average)
Fresh bakery products 2 days (bread) 7 days (cake)
Breakfast cereals 6–18 months
Pasta Pasta with egg solids 9–36 months;
Macaroni and spaghetti 24–48 months
(Labuza and Szybist, 1999)
Extending the shelf life of the bakery products not only is a powerful preventing
measurement against outbreaks of food borne illnesses, but also can be a major economic help to
the bakery industry and consequently help to better feed increasing population in the world.
Therefore modern bakery plants and advanced food technologies should develop a suitable
method to ensure the necessary shelf life for bakery products.
2.2 Classification and spoilage of bakery products
Bakery products on the basis of their pH are classified into three groups, (i) high acid
bakery products with pH<4.6, such as Sourdough bread, (ii) low acid bakery products with pH >
4.6 but < 7 like white or whole wheat bread and (iii) non-acid or alkaline bakery products with
pH > 7 such as carrot muffin. Other important classification of bakery products is on the basis of
their water activity (aw) as (i) low moisture bakery products with aw < 0.6, (ii) intermediate
moisture bakery products with aw between 0.6 and 0.85, and (iii) high moisture bakery products
with aw > 0.85 and generally between 0.95 and 0.99 (Galić et al., 2009). The inter-related factors
that cause the spoilage problems in baked products are: storage temperature, relative humidity,
level of preservatives, pH, packaging material and gaseous environment surrounding the product
and most importantly, the moisture content and aw (Smith et al., 2004). In this respect pre-cooked
pizzas dough (the main product in the present study) produced with cereal, is an example of
intermediate moisture bakery product. This designation makes it an ideal substrate for fungal
development, due to contamination occurring after baking during packaging and storage (Pinho
and Furlong, 2000).

7
2.2.1 Physical spoilage
Spoilage generally limits the shelf life of low and intermediate moisture bakery products.
Physical spoilage involves textural changes and may encourage chemical and microbiological
spoilage. This type of spoilage can be caused by moisture loss or gain as well as staling
(Rodríguez et al., 2003). The problem with the moisture balance of bakery products can be
prevented by packaging in materials with selective moisture and gas barrier properties, such as
low or high density polyethylene. However, the more serious physical spoilage problem in
bakery product, staling occurs specially in bread during the post baking period, making it less
acceptable to the consumer (Kulp and Zobel, 1996). Such changes can be sensory (loss of aroma,
mouth feel) or physical (loss of crumb softness, development of crumbliness). Reformulation
with lipids and shortenings, and more recently, adding an anti-staling enzyme are the methods
that has been commercially used to delay staling in many bakery products (Boyle et al., 1990).
Moreover, the addition of chemical additives, the use of CO2 enriched atmospheres has also been
investigated as an effective means of retarding staling (Knorr et al., 1985).
2.2.2 Chemical spoilage
Low and intermediate moisture bakery products (especially those with a high fat content)
are also subject to chemical spoilage or rancidity which causes off-odor and off-flavor as a result
of lipid degradation. Two types of rancidity problems can occur; oxidative and hydrolytic
(Saranraj et al., 2012). The former leads to formation of free radicals and peroxides during lipid
oxidation that causes detrimental effects on food quality. Concerning present project’s product
oxidative rancidity and consequently free radicals might have bleaching effects on pigments e.g.
lycopene in tomato paste in pizza (Smith et al., 2004). However the latter result in hydrolysis of
triglycerides and the subsequent release of glycerol and malodorous fatty acids. Chemical
spoilage is usually prevented by the addition of antioxidants or displacement of atmospheric O2
by gas packaging in 100% N2 where microbiological problems are not a concern (Smith et al.,
2004).
2.2.3 Microbial spoilage
The major factor limiting the shelf life of high and intermediate moisture bakery products
is microbiological spoilage by bacteria and fungi. It has been estimated that in the USA alone,

8
losses due to microbiological spoilage are 1 - 3% or over 90 million kg of product each year
(Betchell et al., 1953). The most important factor influencing the microbiological spoilage of
bakery products is the aw. Basically, products with a aw higher than 0.85 are considered as high
moisture products, Preformed pizza with has a water activity of about 0.96 to 0.99. In high
moisture products (aw 0.94–0.99), almost all bacteria, yeasts and molds are capable of growth
(Smith and Simpson, 1995).
2.2.3.1 Bacterial spoilage
Bacteria have a potential to contaminate baked products; however, this type of spoilage is
mostly a concern in bakery products with high moisture content, since most bacteria require
high aw and low pH for growth (Saranraj and Geetha, 2012). There are several cases of
foodborne illnesses associated with bakery products involving bacteria such as Salmonella spp.,
Listeria monoctyogenes, Bacillus cereus, and even Clostridium. Bacillus subtilis is reported to
be the major bacteria causing spoilage in bakery products. This spore forming bacteria is
typically present in raw ingredients (e.g., flour, sugar, and yeast) and it causes “rope” in bread.
Ropey bread is characterized by discoloration from brown to black, the release of a rotten fruit
odor and having an extremely moist and stringy bread crumb (Rosenkvist et al., 1995).
2.2.3.2 Yeast spoilage
Yeast problems occur frequently in bakery products. This spoilage in bakery products
could be categorized in two broad types; (i) visible yeasts growth on the surface of the products
in white or pinkish patches, which is affiliated with products of high aw and short shelf life (ii)
fermentative spoilage that could be recognized by alcoholic, essence odors and/or evidence of
gas production which is usually associated with low aw and long shelf life products. Pichia
burtonii, also known as chalk mold, is the main yeast which cause of surface spoilage in bread.
Other yeasts namely Candida guilliermondii, Hansenula anomala and Debaromyces hansenii
also account for a lesser extent of spoilage (Saranaj and Geetha, 2012).

9
2.2.3.3 Mold spoilage
A perennial problem of intermediate and high moisture bakery products is mold growth.
Many molds prefer aw values of > 0.8 to grow, while a few xerophilic molds are capable of
growing at aw values as low as 0.65. Mold spoilage mostly results from post-baking
contamination, during cooling and packaging by mold spores from the air, bakery surfaces and
equipment (Black et al., 1993). According to Hickey (1998) losses due to mold spoilage in the
bakery industry average about 200 million pounds of product each year. Jarvis (2001) found that
mold spoilage caused undesirable odors and is often found on the surface of the product. The
most common mold species found in bakery products are: Penicillium sp., Rhizopus sp.,
Aspergillus sp., Monilia sp., Mucor sp.
2.3 Traditional preservation technologies for bakery product
2.3.1 Freezing
Most of the bakery products are marketed fresh and stored at ambient temperature.
However, microbial growth particularly pathogens and spoilage fungi are of a concern in a
number of baked products such as cream, fruit, and meat filled products; cakes and prepackaged
pizzas. These products are stored under frozen storage conditions to achieve a longer shelf life.
Freezing can be used to prevent mold growth, if applied directly after packaging (Matz, 1992).
The most important factors which determine shelf-life of frozen bakery products are storage
temperature, the original quality of raw material, the processing methods and the packaging
materials (Kotsianis et al., 2002). Chapatties (an indian bakery product) stored at ambient
temperature showed higher retrogradation enthalpy than samples kept at -18°C. The study
revealed that frozen storage could extend the shelf life and eating quality of chapatties (Gujral
and Singh et al., 2008). Despite the advantages of frozen bakery products such as rapid
preparation time and affordable prices, quality limitations of this type of product should be
carefully taken into consideration. For instance, Banwart et al. (2004) reported, that slow
freezing large crystals can disrupt membranes and internal cellular structures of bread leading to
thawing losses and poor quality of the product.

10
2.3.2 Modified atmosphere packaging (MAP)
Increasing energy costs associated with traditional methods of food storage, such as
freezing, have led to the growth of more economical and less energy consuming methods of
preservation such as modified atmosphere packaging (MAP). It was estimated that MAP can
reduce energy consumption by 18 – 20% as compared to freezing for the shelf life extension of
bakery products (Aboagye et al., 1986). Nowadays, more than 150 European bakery firms are
using gas packaging technology to extend the shelf life of rolls, cakes, pizza, baguettes, and
sliced bread (Altekruse et al., 1998). Crumpet produced by Forecrest Foods in Calgary was
reported to have a mold-free shelf life of 4 days prior to gas packaging; however, shelf life of the
product was extended for 1 month at ambient temperature through product reformulation and gas
packaging in 60% CO2. It is also reported that the vacuum packaging method is used for soft
products, such as bread and rolls, while for products such as cakes, doughnuts, pies and pizzas
gas packaging method is more functional (Smith et al., 1995).
2.3.3 Microwave heating
Microwave energy causes food molecules with a dipole or charge to oscillate when
placed in an electromagnetic field, creating an intermolecular friction which is noticeable as heat.
In fact, microwave energy make molecules to resonate or vibrate when placed in an
electromagnetic field, and the energy is conveyed to molecular structure that is manifested as
heat (Smith et al., 2004). Electromagnetic energy in the microwave region (223 to 100 GHz and
34500 MHz) has been studied as an alternative energy source for sterilization (Lakins et al.,
2008). In one of the earliest usage of high frequency microwave on prepackaged bakery product
the experimental treatment was shown to extend the mold free shelf life of bread (energy was
applied for 45 to 60 secs) (Pomeranz, 1969). Microwave heating is rapid and may increase the
shelf-life of fresh bread for 21 days (Smith, 1993). Lakins et al. (2008) reported directional
microwaves can be used to extend the shelf life of white enriched bread up to 2 months with
minimal mold growth. However, a disadvantage of this technology is that microwave heating
might adversely affect the appearance of the product due to the heat generating nature of the
technology (Cauvain et al., 2007). Therefore, despite the fact that the packaging films with
selective heat resistance are prevalent, microwave heating of pre-packaged products is not
widely used in the bakery industry.

11
2.4 Novel non-thermal processing technologies
Market demands for high-quality foods have led to the introduction of non-thermal
treatments which allow the processing of foods without applying temperature. Unlike thermal
processing, the expectation of non-thermal technology is that undesirable microorganisms and
enzymes are inactivated without damage to essential nutrients, vitamins and sensory properties
of the treated product. Foods can be non-thermally processed by technologies such as irradiation,
high hydrostatic pressure, antimicrobials, ultrasound, and electrical methods such as pulsed
electric fields, light pulses, and oscillating magnetic fields. The principles and applications of a
few novel non-thermal preservation methods are briefly described.
2.4.1 High hydrostatic pressure processing
High-pressure processing (HPP) also known as ultra-high pressure (UHP) is a novel non-
thermal technology capable of inactivating and eliminating pathogenic and food spoilage
microorganisms. Some of the potentials of this technology in the food industry are controlling
food spoilage and extending product shelf life while retaining the food’s inherent colour, flavour,
nutrients and texture (Morris et al., 2007). High hydrostatic pressure processing applies
instantaneously and uniformly on liquid and solid foods with or without packaging. In this
process, foods independent of size, shape and their compositions are subjected to pressure,
generally in the range of 100–600 MPa (1000 – 6000 atm) at below 0 to 100°C, from a few secs
to over 20 mins. Nevertheless, HPP is not generally applied to all food types, such as dairy,
animal products and shelf-stable low-acid foods. A number of changes in biological systems like
denaturation of enzymes and proteins as well as breakdown of biological membrane of
microorganisms occur under HPP processing. HPP is commercially used for entrees, guacamole,
salsa and fruit juices. EI-Khoury (1999) determines the effect of high pressures on the shelf life
of pita bread. This study showed that in all samples mold growth appeared after only 4 and 7
days in bread treated with low pressures (5–10 MPa). However, at higher pressure (30 –70 MPa)
mold growth did not occur until day 14, while mold growth was completely inhibited in all
products subjected to pressures higher than 200 MPa. Noteworthy, the samples were inoculated
with spores of A. niger and P. notataum packaged in a high gas barrier film.

12
2.4.2 Oscillating magnetic field (OMF)
Oscillating magnetic fields (OMF) is a technology in which magnetic wave intensity is
applied at a non-constant strength at alternate amplitudes over time (Morris et al., 2007). This
technology has the capability to inactivate vegetative and spores of spoilage microorganisms
(Pothakamury et al., 1993). With OMF technology, sealed food in a plastic bag can receive 1-
100 pulses at a frequency of 5-500 kHz between 25 to 100 ms total exposure time. OMF has
been shown to inactivate microorganisms in bread roll dough, juice, milk and yogurt
(FDA/CFSAN, 2006). In one study, packaged chopped bread dough inoculated with mold spores
with 3000 spores/cm3concentration was subjected to 1 pulse of 8.5 KHz oscillating magnetic
field. After treatment, the samples show a mold spore concentration of only about 1 spore per
cm3
(Hafmann et al., 1985). Advantages of the technology beside its convenient application on
flexible film packaged foods are less energy consumption as well as minimal thermal
denaturation of treated products. However, factors involved in magnetic fields are not fully
understood yet.
2.4.3 Ultraviolet
Ultraviolet (UV) light has been used as a bactericidal agent from as early as 1928
(Xenon, 2003). In UV light processing, radiation is obtained from the UV region of the
electromagnetic spectrum. Ultraviolet light is classified into four wavelength ranges: UV-A
(315-400 nm), UV-B (280 - 315 nm), UV-C (200 - 280 nm), and Vacuum-UV (100 - 200 nm)
(International Ultraviolet Association, 2009). While the effect of each of these ranges is not fully
clarified it is reported that, UV-C specifically is responsible for 50% of the disinfections, and it
has capability to cause damage to the nucleic acid of microorganisms such as bacteria, viruses,
and fungi, thus destroying their ability to multiply and cause disease and spoilage (Miller et al.,
1999; Xenon, 2006). Critical factors with UV light processing include the transmissivity of the
product, the power, wavelength and physical arrangement of the UV source(s), the product flow
profile and the radiation path length (FDA, 2006).

13
2.4.3.1 Continuous UV
The use of constant ultra-violet light source as a means of inactivation of bacteria and
fungi vegetative cells and spores goes back to a time before World War II (Dennington, 1942). In
most UV-based decontamination systems, mercury lamps have been the classical sources of
radiation. Lyon et al. (2007) evaluated the efficacy of UV light treatment at 254 nm on L.
monocytogenes on broiler breast fillets. About 2 log CFUg-1
reduction was achieved after 24 h at
4˚C overnight storage. In a similar study, Sommers et al. (2009) reported 1.31, 1.49, and 1.93 log
CFU g-1
reductions of L. monocytogenes as a result of UV irradiation with the doses of 1, 2 and 4
J cm-2
, respectively on surfaces of frankfurters. Ultra-violet light is also used in bakeries to
prevent yeast and mold growth on the surface of freshly baked products. UV light is reported to
be non-ionizing and is absorbed by proteins and nucleic acids which may lead to cell death (Jay,
1996). However, it is not very effective in extending the mold free shelf-life because it does not
penetrate the product and molds spores can still grow in the product. Limitation with UV
technology is considered to be its cost, its potential effect on packaging material, and effect on
workers' eyes (Kyzlink, 1990).
2.4.3.2 Pulsed UV-light
Pulsed UV-Light is a unique nonthermal method for food preservation that involves the
use of intense, short duration pulses of a broad spectrum. This technology was first developed by
Pure Pulse Technologies in San Diego, California in the 1990s (Barbosa-Canovas et al., 2000;
Dunn et al., 1997). The light generated by pulsed UV lamps consists of a continuum broadband
spectrum from ultraviolet (200 nm) to the infrared (1,000 nm). The system offers sterilization
technique that provides a high degree of penetration as compared to continuous UV. Germicidal
properties of pulsed light can almost be attributed to the UV part of the spectrum. The 250 to 260
nm range is considered to be capable of destroying most microorganisms due to the alteration of
DNA (Bintsis et al., 2000). Application of pulsed light as a method to sterilize or partially
decontaminate microbial loads on the surface of packaging materials, transparent pharmaceutical
products, surfaces, and transmissive materials, including water, air, and many solutions is well
published (Dunn et al., 1997b). U.S. Food and Drug Administration (FDA) has approved the use
of pulsed light method after evaluating it for both safety and effectiveness (Dunn et al., 1997).

14
2.4.3.3 Continuous UV vs. Pulsed UV-light
UV-light can be applied in two modes namely continuous mode and pulsed mode. In
continuous mode, energy UV-light is released continuously in a monochromatic or
polychromatic wavelength. In the pulsed mode, the electrical energy is stored in a capacitor over
a short period of time and released as very short duration pulses (Krishnamurthy and Demirci,
2008). Pulsed UV has a higher penetration depth and may be more effective than continuous UV
light (Krishnamurthy, 2006; Jun et al., 2003). Oxidative reactions could effectively be restricted
by pulsed UV-light rather than continuous UV light because of the short pulse duration, typically
300 ns to 1 ms (Fine and Gervais, 2004). Pulsed light system by generating a high energy density
is designed for the maximum conversion and collection efficiency of UV radiation. When
products are exposed to continuous UV, temperature increases over time and damages food
attributes. However, in pulsed light, due to short duration of pulses, the temperature increase is
lower and limited to a small area in a thinner surface layer. Mcdonald et al. (2000) reported
inactivation of pulsed UV-light treated Bacillus Subtilis spores by nearly three orders of
magnitude of enhancement over continuous UV-light treated spores. However, it is reported that
continuous UV treatment resulted in a larger amount of DNA damage in Saccharomyces
cerevisiae than pulsed light; except that pulsed light induced a greater level of structural damage
i.e., greatly expanded vacuoles and compromised cell membranes.
2.5 Pulsed light treatment
2.5.1 Pulsed UV-light system
Pulsed light is a system that magnifies power many times by accumulating electrical
energy in a capacitor over relatively short period of time (fractions of a second) and produce
pulses of very short duration (millionths or thousandths of a second) (Vicente and Gómez-López,
2007). The main components in pulsed light systems are high-voltage power supply, capacitor,
pulse-forming network, trigger, flash lamp and reflectors (Koutchma et al., 2002). Pulsed light
technology has a great potential to be used on a commercial scale as a result of its cost efficiency
features. An in-depth look at pulsed light treatment at 4 J cm-2
showed that usage cost was
estimated to 1 - 4 cents m-2
of treated surface area (including amortization of the capital
expenditure, lamp replacement, maintenance, and electrical costs) (Dunn et al., 1997).

15
2.5.2 Pulsed UV-light mechanism of inactivation
Although the exact mechanisms by which UV light causes cellular inactivation are not
yet fully understood, it is generally accepted that the radiation affect conjugated carbon double
bonds in proteins and nucleic acids, which result in DNA structural changes as well as irregular
ion flow that leads to increased permeability and depolarization of the cell membrane (Anderson
et al., 2000; Woodling et al., 2005). The main mechanism of the microbial inactivation by pulsed
UV-light is explained by the photochemical, photothermal and photophysical effects. The
photochemical effect causes transformation of pyrimidine (cytosine and thymine) and formation
of dimmers in DNA of microorganisms. Such bonds prevent DNA strands from becoming
unzipped for replication. The second mentioned effect is due to a significant temperature
increase during longer duration pulsed UV light treatment. Essentially, the difference between
the temperature of the bacteria cells and the surrounding media leads to cell disruption and death.
However, short-duration treatments (< 10 s) may have a negligible increase in the temperature
and consequently less significant photothermal effects. The third, photophysical effect, is due to
constant disturbance and structural damages to microbial cell caused by the high-energy pulses.
Krishnamurthy et al. (2008) suggested photophysical effects of Pulsed UV-light on
Staphylococcus aureus cell including wall damage, membrane shrinkage, leakage of cellular
content and mesosome disintegration.
2.5.3 Kinetics of pulsed UV-light in microbial inactivation
The quantitative characterization of kinetics is crucial for application of every microbial-
inactivation technique, including pulsed light. The traditional first-order-kinetics approach does
not apply for pulsed-light treatment because it shows an obvious non-log-linear approach
(Woodling and Moraru, 2005, 2007; Uesugi et al., 2007). Therefore, nonlinear models have been
mostly suggested in pulsed light studies to describe the variation of survivor ratio as a function of
treatment intensity.
The Weibull distribution (
)
(
)
is being used to a greater extent to
describe microbial inactivation, and is based on the engineering principle of failure. Instead of a
structural or mechanical failure, the failure is that of the microorganism (Peleg, 2006). This
model has been used to describe the survival of Listeria innocua after exposure to pulsed light

16
(Uesugi et al., 2007). Additionally, the inactivation of E. coli O157:H7 and Salmonella by pulsed
UV-light were accurately predicted by the Weibull model rather than by first-order kinetics
(Bialka et al., 2008). Weibull, models were used to describe the inactivation of Escherichia coli
K-12, E. coli O157:H7 and Listeria innocua treated with UV light in liquid egg white. However,
there are some limitations towards Weibull model including its accuracy restraint to predict
microbial inactivation in product with various substrate properties. The Weibull model resulted
in significant overestimation of pulsed UV-light effectiveness for the stainless steel substrates,
where the influence of various substrate properties and inoculum level on inactivation was
considerable.
2.5.4 The efficiency of pulsed-light treatments
Pulsed-light treatment efficiency depends on several of factors; the distance from light
source to the sample, pulsed-light dose, spectral distribution, type of microorganism, interaction
between light and the microorganisms as well as the interaction between the light and the treated
substrate (Elmnasser et al., 2007; Levy et al., 2012). Distance clearly affect energy incidence and
consequently the inactivation efficacy of pulsed UV-light; the more the distance between the
sample and the lamp is, the lower the lethality of the process (Gómez-López et al., 2005).
However, some studies demonstrated that a group of food pieces placed very close to the lamp
was not efficiently decontaminated. When the treatment is applied to surfaces, other factors such
as inoculums size have strong influence on the efficiency of pulsed UV-light (Uesugi et al.,
2007). Elmnaser et al. (2010) showed decreasing trend in the bacterial inactivation effect of
pulsed UV light by increasing the inoculums size on agar surfaces and liquid medium. Hillegas
and Demirci (2003) reported that increasing the number of pulses from 135 to 540 raised the
percentage of microbial reduction from 8 to 89.4% in pulsed UV-light treated milk samples.
2.5.5 Light- substrate interaction
Depending on the composition of the substrates and the wavelength of the light, when a
beam of light reach the target, it can be reflected, refracted, scattered or absorbed in various
degrees (Demirci & Krishnamurthy, 2011). This effect is crucial for pulsed-light treatment, as
reflection by the substrate could significantly decrease the efficiency of the treatment. When
surface roughness size is larger than the wavelength of the incident light, scattering effects are

17
low; however, when roughness size is similar, scattering is considerable (Guenther et al., 1993).
Based on the surface topography and potential hiding possibility of microorganism it could be
expected that the rough surfaces show a lower level of reduction of microorganism as compare to
the smooth surfaces. However, the results occasionally are contradictory in experiments.
Therefore, the roughness is not the only surface property that affect microbial inactivation, a
number of factors such as surface hydrophobicity and the reflective nature are also effective
(Woodling and Moraru, 2005). High level of pulsed UV-light photons absorption by molecules
of substrates result in reduction in the intensity of light traversing the products layers (in food
products mainly due to complex structure of proteins). Such absorption can decline significantly
the amount of light that reaches the microbial cells. In one study, significant inactivation of yeast
S. cerevisiae cells was obtained in uncolored samples of sugar syrup treated with pulsed UV-
light. This was achieved in only less than 10-mm-thick sugar syrup (Chaine et al., 2012). In a
similar study inoculated alfalfa seeds with E. coli O157:H7 were treated by pulsed UV-light.
Sharma and Demirci (2003) showed significantly less microbial reduction when the thickness of
the seed layer increased.
2.5.6 Combination of pulsed light and other technologies
Some studies show improvement in the effectiveness of the UV light by combining it
with thermal treatments. In one study, combination of pulsed UV-light with mild heat treatment
was used to inactivate spores of Botrytis cinerea and Monilia fructigena. Although in this
experiment, complete inactivation of conidia was not observed, it suggested a possible inhibition
of DNA repair mechanism by thermal treating of the product after the damage caused by pulsed
UV-light (Marquenie, 2003). Another way to improve the efficiency of pulsed UV-light to
develop the product’s shelf life is to expose the product to infrared source immediately before
the processing take place (Krishnamurthy et al., 2008). Ngadi et al. (2004) showed a higher
inactivation of E. coli O157:H7 in poultry chiller water, when combination of UV light
irradiation, pulsed electric field and ozone were applied. The effect was essentially a summation
of the different inactivation levels obtained separately for each of these technologies.
18
2.5.7 Effects of pulsed light on food products
2.5.7.1 Liquid food
Since the efficacy of UV light may be limited by its low degree of penetration,
transparent media such as water would be excellent examples of food to be treated by pulsed
UV-light. Nevertheless, other liquids, such as sugar solutions and wines, which exhibit more
limited transparency, are not proper samples for being treated by pulsed UV-light. Essentially, in
an aqueous solution, low transparency level reduces the intensity of UV penetration (Shama,
1999; Bintsis et al., 2000). A proportional relationship between vitamin C content and the
absorption coefficient of clear apple juices which reduces pulsed light efficacy was observed by
(Koutchma, 2002). Krishnamurthy et al. (2007) demonstrated milk pasteurization has been
efficiently performed by pulsed UV-light. In this study milk samples were exposed to pulsed
UV-light at a minimum dose of 12.6 J cm-2
delivered in 56 s resulted in complete inactivation of
Staphylococcus aureus. Pulsed UV-light processing has been proved to achieve the same level of
microbial reduction in clear liquids, regardless of the level of contamination. In comparison with
thermal pasteurization, less adverse effect of pulsed UV-light treatment on protein and lipid
components of milk were observed (Elmnasser et al., 2007). Ngadi et al. (2003) investigated the
effectiveness of pulsed UV-light on peptone water, apple juice, and egg white inoculated with E.
coli O157:H7. UV doses between 0 and 23.4 J cm-2
were evaluated and reductions of 6.0, 4.2,
and 4.2 log CFU ml-1
were achieved in peptone water, apple juice, and egg white. The
researchers noted that the pH of the medium did not influence the degree of inactivation.
2.5.7.2 Vegetable and fruits
Log reductions between 0.56 and 2.04 were obtained in mesophilic aerobic bacteria after
treating spinach, celeriac, radicchio, iceberg lettuce, white cabbage, carrots, green bell pepper,
and soybean sprouts with 2,700 pulses (Gómez-López et al., 2005). Two log reductions caused
by using only 2 pulses of 0.15 J cm-2
per flash, extended the shelf-life of cut vegetables by four
additional days (stored at 7°C) (Jun et al., 2003). The respiration rate of lettuce was enhanced by
80% after being treated by pulsed UV-light, while the respiratory rate of cabbage was not
affected (Gómez-López et al., 2005). Pulsed UV-light has also been used for surface
decontamination of fresh fruits. Most fungi, except Aspergillus niger, were controlled with less
19
than 0.5 J cm-2
on fruit surfaces (Lagunas-Solar et al., 2006; Bialka and Demirci, 2007; 2008). It
has been observed that the quality of fruits such as apples, oranges, lemons, peaches, raspberries,
and grapes could be damaged above UV fluence of 2 J cm-2
. The effects of pulsed UV-light on
the sensory properties of vegetables like color have been studied by Fine and Gervais (2004).
According to this study, the main cause of color changes of black pepper and wheat flour was
attributed to overheating combined with oxidation, which happened evidently more rapidly for
black pepper than for wheat flour. That is because dark products absorb more light energy than
lighter products. Another study showed that untreated potatoes began to brown rapidly as
compared to samples treated by flashes of pulsed UV-light at a fluence of 3 J cm−2
. They
retained their color after a prolonged storage (Dunn et al., 1989).
2.5.7.3 Meat
Although pulsed UV-light treatments achieved high levels of microbial inactivation on
relatively simple surfaces, it generally shows only 1 to 3 log reductions on complex surfaces
such as meats. That’s because proteins and lipids absorb light effectively and decreasing pulsed
light dose in order to inactivate microorganism (Gómez-López et al., 2005). Dunn et al. (1995)
demonstrated 2 log reductions in microbial counts of beef steaks samples treated with pulsed
UV-light using 5 J cm-2
to each side and stored 3 days at 4 - 5°C. Listeria innocua was reported
to be reduced by 2 log cycles on hot dogs after pulsed UV-light treatment (Dunn et al., 1997).
2.5.7.4 Baked goods
Baked goods are generally free of viable microorganisms after baking. However,
contamination occurs during the post baking process such as cooling and packaging.
Contamination sources could be bakery atmosphere and equipment, such as slicing machines,
and bakery personnel. In one study, bread loaves were treated by pulsed light through
polyethylene bags. Untreated samples showed mold growth after 5-11 days at room temperature,
while samples treated with 3 pulsed light flashes at 1 J cm-2
per flash were mold-free for the
duration of storage (Pollock et al., 2007). In a similar study, breadsticks packaged in low-density
polyethylene bags and free of any preservative were treated with eight flashes of pulsed light at
0.5 J cm-2
. These products were placed at three positions along the long axis of each of them with

20
1200 radial rotation in between treatment positions. Mold appeared on approximately 17% of the
untreated samples by day 6 and 100% were moldy by day 7. However, mold growth happened on
only less than 4% of the treated breadsticks by day 13 and no further visible signs of mold were
shown for the storage duration of 26 days (Dunn et al., 1995).
In a study chocolate cupcakes were subjected to the pulsed light treatment at various
angles to the incident light and exposed to eight flashes at 0.5 J cm-2
per flash. Approximately 14
cm distances from pulsed light source. 8% showed mold growth by day 15, 18% by day 19 and
58% by day 23. On the other hand a different trend was observed for control samples.
Approximately 6% of untreated samples had mold growth by day 8, 53% by day 12, 82% by day
15, and 94% by day 19.
The test showed that pulsed light treatment contributed to an approximate 10-day
extension in cupcake’s shelf life (Dunn et al., 1997). Pulsed light extend shelf life of bread more
than two weeks at ambient temperature as compared to untreated samples which were visibly
spoiled with mold growth after one week. Overall, pulsed light technology shows promising
results as a novel method to extend the mold free shelf life of pre-packaged bakery products
(Dunn et al., 1995; and1997).
2.5.7.5 Pizza
High gas barrier pouch is often used to package commercially pre-baked pizza crusts.
Although, it is a very effective preservation method against aerobic molds, this means of
packaging is very costly. In one study, pizza samples were placed in polyethylene pouches under
atmospheric conditions and treated with pulsed light with complete exposure on both sides
(Dunn et al., 1995). UV treated samples showed no mold growth as compared to untreated
samples. This suggests that integrating pulsed light treatment in the packaging process may allow
for less-expensive packaging systems. In another study by Dunn et al., (1997), pre-baked pizza
with an approximate composition of 60% dough, 18% tomato sauce, and 18% cheese were
inoculated by environmental exposure for 15 mins on either side, and then treated through the
pouch with an exposure of 12 flashes of pulsed light at 0.5 J cm-2
. Visual detection showed mold
growth in more than 80% untreated pizzas, while only one of the pulsed light treated samples
became moldy after 30 days storage at 7°C (Pollock et al., 2007).

21
2.5.8 Various microorganism affected by pulsed UV-light
Pulsed UV-light for inactivation of pathogenic microorganisms has gained interest
because of the very short treatment time. Unlike chemical biocides, UV does not introduce toxins
or residues and does not alter the chemical composition, taste, odor or PH of the product.
(Lamont et al., 2007) showed that the application of pulsed UV-light treatment for the
inactivation of poliovirus and adenovirus is significantly effective (Lamont et al., 2007).
Although both viruses showed vulnerability to the treatment, adenoviruses were more resistant to
pulsed UV-light than polioviruses. The same number of pulses resulted in approximately 1 log
reduction of adenovirus as compared to log reduction of 4 CFU ml-1
in poliovirus. At an energy
level of 31.12 J cm-2
(64 pulses), inactivation reached 0.7 and 2.93 log reductions in
Saccharomyces cerevisiae cells inoculated into wheat flour and black pepper, respectively. Jun et
al. (2003) showed an optimization of 3.12 log reduction, when pulsed UV-light system was used
to inactivate fungal spores of Aspergillus niger in corn meal. In another study, the effect of
Ultraviolet irradiation (254 nm, UV-C) on some fungi such as Aspergillus flavus, Aspergillus
niger, Penicillium corylophilum and Eurotium rubrum was investigated. These experiments
reported that pulsed light can effectively inactivate spores of A. flavus, Penicillium.
corylophilum, Empetrum rubrum and A. niger but the efficacy of UV-C radiation against fungal
spores depends on the genera and the method of exposure to the irradiation (Begum et al., 2009).
There is little information on the microflora of preformed pizza or the influence of tomato sauce
on the microbiological quality and safety of flat bread and other end products.
2.6 Identification and quantification of spoilage fungi
Microbiological analysis of a food product could be performed for a variety of different
reasons. The most important reason is confirm the presence and estimate the quantity of
pathogenic microorganisms in foods which may jeopardize public health. However, other
reasons must be considered from the industrial point of view, such as the estimation of the
products’ shelf life, the evaluation of the quality of raw materials, the contamination route
tracing in the processing lines, etc (Loureiro and Querol, 2000). For more than 50 years several
methods of classification on the basis of morphological, biochemical and physiological
properties have been proposed for yeasts and molds. However, there is not a single standardized

22
method for many of these tests and their results are often dependent on the applied techniques. In
addition, misidentification is very frequent due to variable results of the tests for different strains
of the same species (Loureiro and Querol, 2000).
2.6.1 Methods of identification of fungi
2.6.1.1 Classical microbiology
Culturing, standard plate counts and measuring individual microorganisms growth is the
traditional method of detection of viable bacteria and fungi. This method has been performed by
hundreds of commonly used microbiological media in the food industry (Harrigan et al., 1998).
Quantification of the growth of filamentous fungi is more complicated in comparison with
bacteria or yeasts, since no primary mold enumeration standard exists (such as cell numbers used
for yeasts and bacteria). Hyphae of mold in vegetative growth do not survive blending
completely and because of their poor detachment to the substrate, the estimation of fungal
growth or biomass is complicated. Nevertheless, most food laboratories continue to rely on
viable counting (dilution plating) for detecting and quantifying fungal growth in foods. Besides
dilution plating, recently a new method called direct plating has been developed for estimating
fungal numbers and growth in foods (Pitt and Hocking, 2009).
2.6.1.2 Molecular microbiology
In recent years, a new generation of innovative methods and technologies for the
enumeration, detection, identification and characterization of microorganisms in contaminated
foods has attracted a lot of attention. Molecular approaches that imply near-time or real-time
detection are considered an indispensable tool that allows the accurate description of the
microbial ecology of food (Iacumin et al., 2009). For instance, recent progress in molecular
biology has led to the development of new techniques such as fragment length polymorphism
(RFLP) of mitochondrial DNA, chromosomal DNA electrophoresis and ribosomal DNA
restriction analysis that facilitated identification and characterization of yeast. Esteve-Zarzoso et
al. (1999) proposed a new easy and rapid method of yeast identification based on the restriction
analysis of internal transcribed spacers (ITS). This method enables identification of yeast from
isolated colonies or directly from food samples. Dlauchy et al. (1999) assembled a database of

23
restriction fragment patterns to categorize 128 species associated mostly with food, wine, beer,
and soft drinks. Baleiras et al. (1969) used a type of PCR technique to identify strains of Z. Bailli
and Zygosaccharomyces bisporus present in mayonnaise and salad dressings. Pulsed
electrophoresis techniques have made possible the separation of the chromosomes of
Saccharomyces cerevisae and other yeasts.
2.6.1.2.1 Polymerase Chain Reaction (PCR)
The polymerase chain reaction (PCR) is a powerful genetic technique for copying a piece
of DNA (sequences of interest) a billion-fold. The PCR technique, by amplifying specific gene
fragments, allows fast and selective identification and detection of microorganisms in different
matrices by amplifying specific gene fragments (Varga, 2004). This method consists of reaction
cycle with the following steps: (1) denaturation of the double-stranded DNA (2) annealing of
primers to single DNA strands, and (3) extension of the primers with a thermostable DNA
polymerase (Rapley, 2007). Consequently, repetitive cycles of the mentioned procedure results
in an exponential increase of the number of copies of the target DNA that increase the possibility
of detection (Ercolini, 2004). PCR is considered to be a useful method to determine the
microflora of fermented foods and to identify significant microbial communities associated with
specific characteristics of the final product (Settanni and Corsetti, 2007). PCR techniques are
simple, fast and sensitive (Feret al., 1994). These features have made PCR-techniques popular
for food analysis (Meyer and Candrian, 1996). Thus, the detection and sequence determination of
nucleic acids via PCR-techniques is currently being extensively applied to the detection of
adulteration in foods (Javier Senorans et al. 2003). Amplification and direct sequencing of
ribosomal DNA (rDNA) was one of the first applications of PCR within mycology (White et al.,
1990). Several PCR-based techniques permit determination of taxonomic status of a fungal
isolate which PCR-cloning is one of them. This technique is mainly used when less diversity in
micro-flora of the examined sample is expected.
24
2.6. Conclusion
Contamination by yeast and mold in bakery products is a serious concern in the industry
from a health and economic perspective. These microorganisms continue to be a problem as a
post packaging contaminant of preformed pizza, primarily due to post processing contamination
in the manufacturing facility. Several conventional and novel decontamination methods are
utilized by the industry to inactivate fungi effectively; however, the challenge posed in the
preservation of food quality limits their application. Therefore, there is always a need to optimize
the existing processing method and/or identify a new inactivation method while preserving the
quality of the food.
UV-light has been used as a bactericidal agent for over a century, because it is effective
for inactivation of pathogens on a solid surface and in clear liquid. Pulsed UV-light technology is
the application of broadband UV-light in a pulsed mode, wherein the instantaneous intensity of
the UV-light is increased significantly. Increased UV-light intensity and the shocking effect of
pulses may aid in enhancing the effectiveness of UV-light on microbial inactivation.
Optimization of pulsed UV-light and a proper equipment design may result in a disinfection
process for food products for which the surface contamination is the major concern, such as
preformed pizza. Pulsed UV-light may provide a cheaper alternative to existing decontamination
methods as the capital and operational costs are comparatively less than existing technologies.
As the literature review substantiates, there was not much research work done in
optimization of pulsed UV-light inactivation of fungi in bakery products. In this study,
P.roqueforti (a dominant spoilage mold in bakery products) inoculated on solid agar, bread and
pizza, was treated with pulsed UV-light and the degree of P.roqueforti inactivation were
determined. Additional research was conducted to gain a better insight into the technologies
through inactivation modeling and characterization studies. Furthermore, classical and molecular
detection methods were preformed to identify microbial flora in preformed pizza.

25
2.7 REFERENCES
Alvarez, I., Raso, J., Palpo, A., and Sala, F.J. 2000. Infl uence of different factors on the inacti-
vation of Salmonella senftenberg by pulsed electric fi elds. International Journal of Food
Microbiology 55: 143–146.
Anderson, J. G., Rowan, N. J., Macgregor, S. J., Fouracre, R. A., Farish, O., & Member, S.
(2000). Inactivation of Food-Borne Enteropathogenic Bacteria and Spoilage Fungi Using
Pulsed-Light, 28(1), 83–88.
Anon, 1995; http://www.cfsan.fda.gov/~comm/ ift-xray.html [accessed 26 January 2006].
Baleiras Couto, M., van der Vossen, M., Hofstra, H. Veld, H. (1994). RAPD analysis: a rapid
technique for differentiation of spoilage yeasts. Int J Food Microbiol 24, 249-260.
Banwart, G. J. 2004. Basic Food Microbiology. A VI Publ. Inc., Westport. pp. 505-544
Begum, M., Hocking, A. D., & Miskelly, D. (2009). Inactivation of food spoilage fungi by ultra
violet (UVC) irradiation. International journal of food microbiology, 129(1), 74–7.
Betchel, W.G. and Meisner, D.F. and Bradley, W.B. 1953. The effect of the crust on the staling
of breacl. Cereal Chemistry. 16: 160-168.
Berry D., 2004 “Keeping foods fresh”. Food product design.; http://www.foodproductdesign.
com/archive/2004/0104De, html [accessed 22 February 2006].
Bialka, K.L., Demirci, A., Puri, V.M., 2008. Modeling the inactivation of Escherichia coli
O157:H7 and Salmonella enterica on raspberries and strawberries resulting from exposure
to ozone or pulsed UV-light. Journal of Food Engineering 85, 444–449.
Bialka, K. L., & Demirci, A. (2007). Decontamination of Escherichia coli O157:H7 and
Salmonella enterica on blueberries using ozone and pulsed UV-light. Journal of Food
Science, 72(9), 391– 396.
Bintsis, T., Litopoulou-Tzanetaki, E., Robinson, R.K., 2000. Existing and potential application of
ultraviolet light in the food industry - a critical review. Journal of the Science of Food and
Agriculture 90, 637–645.
Boyle, P.J. and Hebeda, R.E. 1990. Anti-staling enzyme for baked goods. Food Technol.,
44:129.
Boynton BB, Welt BA, Sims CA et al. Effects of low- dose electron beam irradiation on
respiration, microbiology, texture, color, and sensory character- istics of fresh-cut
cantaloupe stored in modified- atmosphere packages. J. Food Sci. 2006; 71(2): S149–S155.
Byrne, M. (2000). Barilla: investing for the future. Food Engineering and Ingredients, 25, 18–23.

26
Chaine, A., Levy, C., Lacour, B., Riedel, C., & Carlin, F. (2012). Decontamination of sugar
syrup by pulsed light. Journal of food protection, 75(5), 913–7.
Corsetti A & Settanni L (2007) Lactobacilli in sourdough fermentation. Food Res Int 40: 539–
558.
Demirci, A., & Krishnamurthy, K. (2011). Chapter 18 Pulsed Ultraviolet Light, 249–261.
Dunn, J. (1996). Pulsed light and pulsed electric field for foods and eggs. Poultry Science, 75(9),
1133–1136.
Dunn, J., Bushnell, A., Ott, T., & Clark, W. (1997). Pulsed white light food processing. Cereal
Foods World, 42, 510–515.
Dunn, J. E., Clark, R. W., Asmus, J. F., Pearlman, J. S., Boyer, K., Painchaud, F., et al. (1989).
Methods for preservation of food- stuffs. US Patent number 4871559.
Dunn, J. E., Clark, R. W., Asmus, J. F., Pearlman, J. S., Boyer, K., Painchaud, F., et al. (1991).
Methods for preservation of food- stuffs. US patent number 5034235.
Dunn, J., Ott, T., & Clark, W. (1995). Pulsed light treatment of food and packaging. Food
Technologist, 49(9), 95–98.
Elmnasser, N., Guillou, S., Leroi, F., Orange, N., Bakhrouf, a, & Federighi, M. (2007). Pulsed-
light system as a novel food decontamination technology: a review. Canadian journal of
microbiology, 53(7), 813–21.
Ercolini, D. (2004). PCR-DGGE fingerprinting: novel strategies for detection of microbes in
food. Journal of microbiological methods, 56(3), 297–314.
Esteve-Zarzoso, B., Belloch, C., Uruburu, F. and A. Querol (1999). Identification of yeasts by
RFLP analysis of the 5.8S rRNA gene and the two ribosomal internal transcribed spacers.
Int J Syst Bacteriol 49, 329–337.
Fine, F. and Gervais, P. 2004. Efficiency of pulsed UV light for microbial decontamination of
food powders. Journal of Food Protection 67(4):787–792.
F.avier Senorans, Elena Ibanez Cifuentes, A. 2003. New Trends in Food Proceesing. Minesterio
de ciencia y technologia, spain 507-526
Galić, K., Curić, D., & Gabrić, D. (2009). Shelf life of packaged bakery goods--a review. Critical
reviews in food science and nutrition, 49(5), 405–26.
Gómez-López, V M, Devlieghere, F., Bonduelle, V., & Debevere, J. (2005). Intense light pulses
decontamination of minimally processed vegetables and their shelf-life. International
journal of food microbiology, 103(1), 79–89.

27
Gómez-López, Vicente M., Ragaert, P., Debevere, J., & Devlieghere, F. (2007). Pulsed light for
food decontamination: a review. Trends in Food Science & Technology, 18(9), 464–473.
Hickey, C.S. 1998. Sorbate spray application for protecting yeast-raised bakery products.
Baker’s Digest, 54: 4-7.
Hillegas, S. L., & Demirci, A. (2003). Inactivation of Clostridium sporogenes in clover honey by
pulsed UV-light treatment. Agricultural Engineering International, V. Manuscritp FP03009.
Iacumin, L., Cecchini, F., Manzano, M., Osualdini, M., Boscolo, D., Orlic, S., & Comi, G.
(2009). Description of the microflora of sourdoughs by culture-dependent and culture-
independent methods. Food microbiology, 26(2), 128–35.
Jarvis, B. 2001. Mould spoilage of food. Process Biochemistry, 7:11-14. 25.
Jun, S., Irudayaraj, J., Demirci, A., & Geiser, D. (2003). Pulsed UV-light treatment of corn meal
for inactivation of Aspergillus niger spores, , 883–888.
Kohn, S. (2000). An update of the US baking industry. Cereal Foods World, 45, 94–97.
Kotsianis, I. ., Giannou, V., & Tzia, C. (2002). Production and packaging of bakery products
using MAP technology. Trends in Food Science & Technology, 13(9-10), 319–324.
Koutchma, T. (2002). UV Light for Processing Foods, 10(4), 24–29.
Knorr, D. and Tomlins, R.I. 1985. Effect of carbon dioxide modified atmosphere on the
compressibility of stored baked goods. Journal of Food Science. 50: 1172-1173, 1176.
Krishnamurthy, K. (2006). decontamination of milk and water by pulsed UV-light and infrared
heating. Applied and Environmental Microbiology7:11-14. 25
Krishnamurthy, K., Tewari, J. C., Irudayaraj, J., & Demirci, A. (2008). Microscopic and
Spectroscopic Evaluation of Inactivation of Staphylococcus aureus by Pulsed UV Light and
Infrared Heating. Food and Bioprocess Technology, 3(1), 93–104.
Kulp, K. and Zobel, H.P (1996). The Staling Mechanism. In: Buked Goods Freshness:
Technology, Evaluation. and Inhibition of Staling (ed. Hebeda, E.R. and Zobel, HF) Marcel
Dekker, Inc., New York, NY 10016. pp. 1-60
Labuza and Szybist F. (1999). Advancing Knowledge About Processing, Distribution, Sales, and
Food Service, (March)
Lagunas-Solar, M. C., Piña, C., MacDonald, J. D., & Bolkan, L. (2006). Development of pulsed
UV light processes for surface fungal disinfection of fresh fruits. Journal of Food
Protection, 69 (2), 376–384.

28
Lakins, D. G., Echeverry, a, Alvarado, C. Z., Brooks, J. C., Brashears, M. T., & Brashears, M.
M. (2008). Quality of and mold growth on white enriched bread for military rations
following directional microwave treatment. Journal of food science, 73(3), M99–103.
Lamont, Y., Rzezutka, A., Anderson, J. G., MacGregor, S. J., Given, M. J., Deppe, C., et al.
(2007). Pulsed UV-light inactivation of poliovirus and adenovirus. Letters in Applied
Microbiology, 54 (5), 564–567.
Levy, C., Aubert, X., Lacour, B., & Carlin, F. (2012). Relevant factors affecting microbial
surface decontamination by pulsed light. International journal of food microbiology, 152(3),
168–74.
Liew, E. Y., Guo, L., Ranghoo, V. M., & Hyde, K. D. (1998). Molecular approaches to assessing
fungal diversity in the natural environment, 1–17.
Loureiro, V. Ã., & Querol, A. (2000). The prevalence and control of spoilage yeasts in foods and
beverages, 10(1999), 356–365.
Matz, S. A. (1992). Formulas and processes. In bakery technology and engineering AVI
Publishing (3rd ed., pp.443–460).
Marquenie, D. (2003). Combinations of pulsed white light and UV-C or mild heat treatment to
inactivate conidia of Botrytis cinerea and Monilia fructigena. International Journal of Food
Microbiology, 85(1-2), 185–196.
Meyer, R.; Candrian, U.; Lu ¨thy, J. Detection of pork in heated meat products by the polymerase
chain reaction. J. AOAC Int. 1994, 77, 617-622.
Mcdonald, K. F., Curry, R. D., Clevenger, T. E., Unklesbay, K., Eisenstark, A., Golden, J., …
Morgan, R. D. (2000). A Comparison of Pulsed and Continuous Ultraviolet Light Sources
for the Decontamination of Surfaces, 28(5), 1581–1587.
Michael Ngadi, Xue Jun 1, J. S. and G. S. V. R. (2004). Inactivation of Escherichia coli
O157:H7 in Poultry Chiller Water Using Combined Ultraviolet Light, Pulsed Electric Field
and Ozone Treatments. International Journal of Poultry Science, 3(11), 733–737.
Morris, B. C., Brody, A. L., & Wicker, L. (2007). Non-Thermal Food Processing / Preservation
Technologies: A Review with Packaging Implications # and Science, (July), 275–286.
Ngadi, M., Smith, J., Cayouette, B., 2003. Kinetics of ultraviolet light inactivation of
Escherichia coli O157:H7 in liquid foods. Journal of the Science of Food and Agriculture
83,1551e1555.
Oraikul, B. (1991). Modified atmosphere packaging of bakery Pro- ducts. In B. Ooraikul, M. E.
Stiles (Eds.), Modified atmosphere packaging of food (pp. 38–114).

29
Peleg, M. (2006). Advanced quantitative microbiology for foods and biosystems. Boca Raton,
FL: CRC Press.
Pinho, B. H., & Furlong, E. B. (2000). The occurrence of molds, yeasts and mycotoxins in pre-
cooked pizza dough sold in Southern Rio Grande do Sul. Brazilian Journal of Microbiology,
31(2), 99–102.
Pitt, J. I., & Hocking, A. D. (2009). Fungi and Food Spoilage (pp. 19–52). Boston, MA: Springer
US.
Pollock, A. M. (2007). characterizaton of pulsed light treatment on the shelf life of and safety of
vacuum packaged cold smoked salmon.as a thesis fulfiment at McGill University.
Qin, B.L., Chang, F., Barbosa-Cánovas, G.V., and Swanson, B.G. 1995. Nonthermal inactiva-
tion of S. cerevisiae in apple juice using pulsed electric fi elds. Lebensmittel-Wissenschaft
und-Technologie—Food Science and Technology 28: 564–568.
Rapley, R. (n.d.). Molecular Analysis and Amplification Techniques.
Rosenkvist, H. and Hansen A. (1995) Contamination profiles and characterization of Bacillus
species in wheat bread and raw materials for bread production. International Journal of
Food Microbiology 26, 353–363.
Rodríguez, V., Medina, L., & Jordano, R. (2003). Influence of modified atmosphere packaging
on the shelf life of prebaked pizza dough with and without preservative added. Die
Nahrung, 47(2), 122–5.
Woodling and carmen I. (2005). Food Microbiology and Safety Influence of Surface
Topography on the Effectiveness of Pulsed Light Treatment for the Inactivation of Listeria
innocua on Stainless-steel Surfaces, 70(7).
Saranraj, P., & Geetha, M. (2012). Microbial Spoilage of Bakery Products and Its Control by
Preservatives, 3(1), 38–48.
Seiler, D.A.L. 1968. Prolonging the shelf life of cake. Brit. Baker, 156:25.
Settanni, L., Valmorri, S., Van Sinderen, D., Suzzi, G., Paparella, A., Corsetti, A., 2006.
Combination of multiplex PCR and PCR-Denaturing Gradient Gel Electrophoresis for
monitoring common sourdough-associated Lactobacil- lus species. Appl. Environ.
Microbiol. 72, 3739–3796
Shama, G. 1999. Ultraviolet light. In: Encyclopedia of Food Mi- crobiology, edited by Robinson,
R.K., Batt, C., and Patel, P. San Diego, CA: Academic Press.

30
Sharma, R., and Demirci, A. 2003. Inactivation of Escherichia coli O157:H7 on inoculated
alfalfa seeds with pulsed ultraviolet light and response surface modeling. J. Food Sci.,
68(4): 1448-1453.
Smith, J. P., Daifas, D. P., El-Khoury, W., Koukoutsis, J., & El-Khoury, A. (2004). Shelf life and
safety concerns of bakery products--a review. Critical reviews in food science and nutrition,
44(1), 19–55.
Smith, J.P. and Simpson, B.K. 1995. Modified atmosphere packaging of bakery and pasta produc
ts . in: Principles of Modfied atrnosphere packng ing and Sous- Vide Processing (eds. I.
Farber and K.L. Dodds). Technomic Publ. Co. , hncester, PA. U.S.A. pp. 207- 242
Uesugi, A. R., Woodling, S. E. & Moraru, C. I. (2007). Inactivation kinetics and factors of
variability in the pulsed light treatment of Listeria innocua cells. Journal of Food Protection
70, 2518-2525.
Varga, J. (2004). Molecular Detection Of Fungi In Foods And Feeds.
Vega-Mercado, H. 1996. Inactivation of Escherichia coli by combining pH, ionic strength and
pulsed electric fi elds. Food Research International 29: 117.
White, T.J., Burns, T., Lee, S., Taylor, J., 1990. Amplification and direct sequencing of fungal
ribosomalRNAgenes for phylogenetics.
Wekhof, A., Trompeter, F.J., Franken, O., 2001. Pulsed UV Disintegration (PUVD): a new
sterilisation mechanism for packaging and broad medical-hospital applications. The First
International Conference onUltraviolet Technologies,WashingtonD.C, p. 15.
Woodling, S.E., Moraru, C.I., 2005. Influence of surface topography on the effectiveness of
pulsed light treatment for the inactivation of Listeria innocua on stainless-steel surfaces. J.
Food Sci. 70 (7), M345–M351.

31
CHAPTER 3
CHARACTERIZATION OF PULSED UV-LIGHT APPARATUS
3.1 Abstract
Pulsed Ultraviolet (UV) light treatment has been proven effective for killing a wide
variety of microorganisms on foods and food contact materials. However, critical process
parameters need to be optimized for a better efficiency of pulsed UV-light treatments. Since the
light dissipation and exposure area to the pulsed light source is different for various distances
from the light source, in this chapter the spatial distribution of pulsed UV-light was investigated.
A bench-top pulsed UV was used to produce up to 1,000 V (20 J). Potato Dextrose Agar Petri
plates inoculated with Penicillium roqueforti ATCC 10010 were treated 10 min in the first three
effective levels in the treatment chamber (5, 10 and 15 cm). The result illustrated showed that
30, 75 and 90 % of the surface area of the tray was exposed to pulsed light at 5, 10 and 15 cm
distance from pulsed light lamp, respectively. Apple juice was also used as a simple substrate to
characterize the efficacy of the pulsed light apparatus. Apple juice inoculated with E. coli
(pathogenic microorganism frequently associated with apple juice) was treated with pulsed UV-
light at the same distances (5, 10 and 15 cm) from the light source, 3 voltage inputs (400, 750
and 1,000 V) and treatment time (1, 5 and 10 min). A multiple-way ANOVA method was used
for designing and analyzing the experiments. The log reduction in E. coli population treated by
pulsed UV-light varied from 1.4 to 2.05 log CFU ml-1
. This range was obtained after 120 pulse
treatment with 400 V to 1,200 pulses with 1,000 V.
3.2 Introduction
High intensity light pulses, also known as pulsed UV-light (PL), is a novel non-thermal
technology which involves the use of intense and short duration pulses of broad-spectrum white
light. The intensity of these light pulses is approximately 20,000 times greater than that of
sunlight on the Earth’s surface (Dunn, 1996). This technology is applicable mainly in
decontaminating or reducing microbial populations on the surface of packaging materials,
transparent liquids, or other surfaces (Dunn et al., 1997b). In addition, it has negligible effect on
product organoleptic quality as there is no substantial increase in temperature during the

32
treatment (Ross et al., 2003). Prior to challenge studies to assess microbial inactivation capability
of pulsed UV-light and inactivation kinetics of the technology on targeted microbes on bakery
products, it was necessary to characterize the pulsed UV-light system and treatment conditions.
High intensity pulsed UV-light treatment’s efficacy depends on several factors related to the
equipment, process, product and target microorganism (Pollock, 2007). The intensity of a light
and its effect also depends on its initial power and distance of the target from the light source. In
order to standardize the factors mentioned above, prior to extensive use of equipment in the
experiments, the spatial power distribution in the pulsed UV-light apparatus were characterized.
This chapter investigates the evaluation and characterization of the spatial power distribution in
the pulsed UV-light apparatus using inactivation of Penicillium roqueforti subjected to the
pulsed UV-light at different distances. Apple juice was used to study effectiveness of the pulsed
UV-light apparatus to inactivate a target microorganism in a simple substrate before further
studies on bakery products with variable porosity.
The specific objectives of this study were:
1-To optimize the pulsed UV-light unit with vegetative mold cells (Penicillium roqueforti) and
2-To evaluate the efficacy of pulsed UV-light on decontamination of apple juice as a non-
complex and pulsed UV- light penetrable substrate.
3.3 Materials and methods
3.3.1 Pulsed UV- light system
A bench-top pulsed UV- light system fitted with a low-pressure xenon flash lamp (Model
PUV-01, Magnavolt Technologies Inc., Plattsburgh, NY, USA) was used in the entire
experiment (Figure 3.1). This device provides a compact and portable source of intense pulsed
UV- light, with a significant biocidal component in the UV. The output intensity can be varied
by changing the operating voltage. The pulse repetition rate is continuously variable between
single shot and 5 pulse per second (pps) at 1,000 V. At lower voltages, the pulse repetition rate
can be increased up to a maximum of 10 pps. The emitted spectrum from the flash lamp is shown
in Figure 3.2. The light source produces a broad spectrum of white light with peak spectral
emissions at 250 nm. On the panel control, the system has a timer for multiple automatic and
manual pulsing and a switch for adjusting the voltage level. Each pulse is delivered in 250 μs and
corresponds to ultra violet light energy from 3 to 20 J depending on the delivered voltage. The

33
machine specification is as follows; Input Voltage (400 to 1,000 V), Pulse Frequency (0.1-10
pps).
3.3.2 Treatment chamber
The apparatus consists of a metal housing surrounding a treatment chamber made of polished
stainless steel (20 cm wide×14 cm deep×12 cm high) and equipped with an upper xenon lamp.
The sample holder plate in the treatment chamber is divided into five different zones which
determine the distance from the PL source (5-35 cm, with 5 cm increments) (Figure 3.1).
However the first three effective distances (5, 10 and 15 cm) were used during the experiment
because of light dissipation that occurs in longer distances from the light source.
Figure 3.1 Schematic diagram of pulsed UV- light treatment system.
Pulsed-Power Drive Treatment Chamber

34
Figure 3.2 Spectral output from the light source at operating voltages of 400, 700 and 1,000 V (bottom
to the top)
3.3.3 Spatial distribution
In this study, it was important to determine the exposed treatment area at each distance
due to various level of light distribution in the chamber at different distances from the pulsed UV
source.
3.3.3.1 Penicillium roqueforti inoculum preparation
A stock-culture of Penicillium roqueforti ATCC 10010 (Cedarlane Corporation,
Burlington, ON, Canada) was inoculated on Potato Dextrose Agar (PDA, Difco, Spark, MD,
USA) in order to obtain a pure culture. Plates were incubated for 3-7 days at 25°C in the dark,
after which colonies were transferred to fresh Potato Dextrose Broth (PDB, Difco, Sparks, MD,
USA) and re-incubated for 5-7 days at 180 rpm and 24°C to generate the inoculum which used to
inoculate Petri plates.
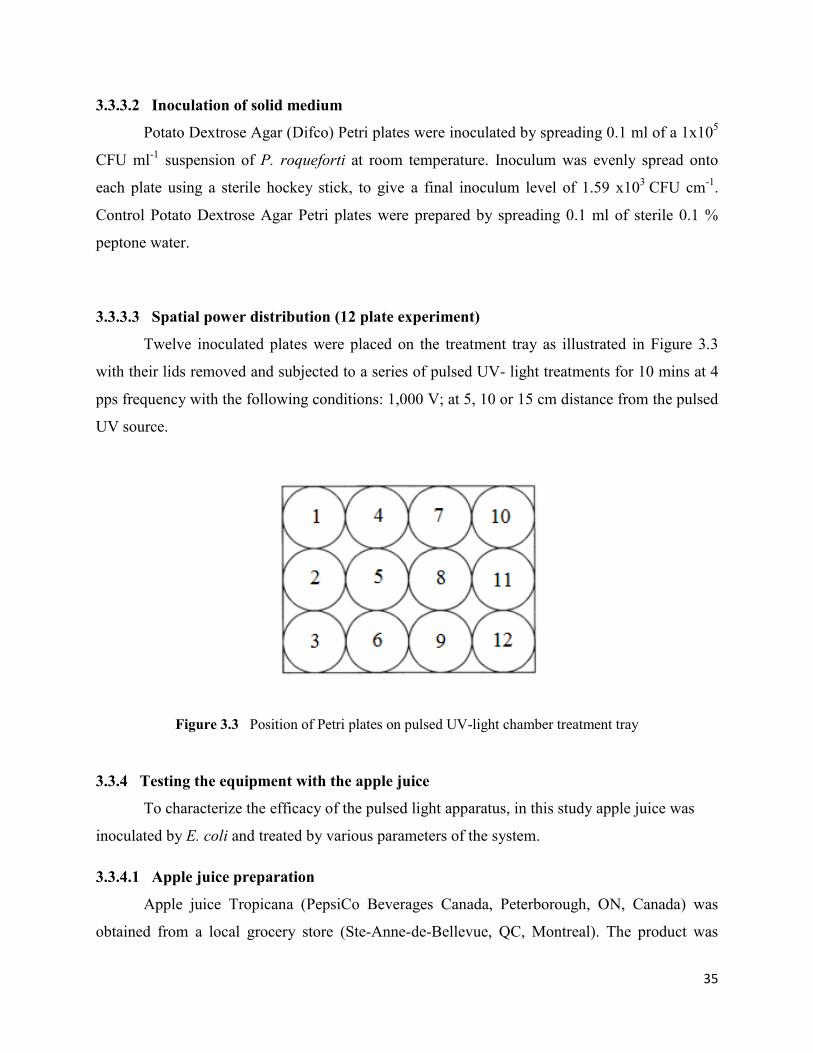
35
3.3.3.2 Inoculation of solid medium
Potato Dextrose Agar (Difco) Petri plates were inoculated by spreading 0.1 ml of a 1x10⁵
CFU ml-1
suspension of P. roqueforti at room temperature. Inoculum was evenly spread onto
each plate using a sterile hockey stick, to give a final inoculum level of 1.59 x10³
CFU cm-1
.
Control Potato Dextrose Agar Petri plates were prepared by spreading 0.1 ml of sterile 0.1 %
peptone water.
3.3.3.3 Spatial power distribution (12 plate experiment)
Twelve inoculated plates were placed on the treatment tray as illustrated in Figure 3.3
with their lids removed and subjected to a series of pulsed UV- light treatments for 10 mins at 4
pps frequency with the following conditions: 1,000 V; at 5, 10 or 15 cm distance from the pulsed
UV source.
Figure 3.3 Position of Petri plates on pulsed UV-light chamber treatment tray
3.3.4 Testing the equipment with the apple juice
To characterize the efficacy of the pulsed light apparatus, in this study apple juice was
inoculated by E. coli and treated by various parameters of the system.
3.3.4.1 Apple juice preparation
Apple juice Tropicana (PepsiCo Beverages Canada, Peterborough, ON, Canada) was
obtained from a local grocery store (Ste-Anne-de-Bellevue, QC, Montreal). The product was

36
prepared by autoclaving at 120 °C for 15 mins by Electric Sterilmatic Sterilizer, (Market Forge
Industries Inc., Everett, MS, USA). The sterilization was done to avoid potential interference in
microbial counts between the spiked microorganism and the natural microflora.
3.3.4.2 E. coli inoculums preparation
To evaluate pulsed UV-Light effectiveness on decontamination of apple juice, the
experiment was performed using E. coli K12 DSM 1607 (ATCC) as surrogate for their
pathogenic counter-parts that mostly occurs in apple juice. Stock cultures were stored in 30%
glycerol at -20 °C. The strain was grown overnight in LB Broth (Luria-Bertani, Difco, spark,
MD, USA) at 37 °C and 180 rpm to generate inocula.
3.3.4.3 Pulsed UV- light treatment of apple Juice
Samples of apple juice were inoculated with over-night culture E. coli (to the proportion
of 10:1) and initial population of approximately 1×10¹⁰
CFU ml-1
was achieved. For the purpose
of pulsed UV-light processing, 2 ml of the inoculated apple juice were pipetted into empty Petri
dish (50 mm diameter) to ensure that the entire dish surface was covered with sample to a depth
of 1 mm. A period of 20 mins following inoculation was allowed for adaptation of the cultures to
the product environment prior to the pulsed UV-light treatment. Inoculated apple juice samples
were exposed to two different input voltage (400 and 1,000 V), treatment time (1 and 2 min) and
distance from the light source (5 and 15 cm) at 1 and 10 pps frequencies.
3.3.4.3 Enumeration of E. coli
Ten-fold dilution series of UV-treated apple juice samples were prepared using Buffered
Peptone Water (Don Whitley Scientific, WY, UK) and 0.1 ml aliquots of relevant dilutions
plated out on solid LB medium. Plates were incubated at 37 °C for 48 h and survivors (CFU ml-
1) were enumerated. In order to establish the background microflora, fresh uninoculated juice
were also plated on LB agar and incubated at 37 °C for 48 h to determine total bacterial
populations. Treated and untreated samples were enumerated immediately after UV treatment.

37
3.3.5 Statistical analysis
Statistical analysis of the data was performed using the SAS software 9.2. A Multiple-
way ANOVA was used to compare the experimental treatments and a Student’s t-test was used
to determine significant differences between the means. All microbiological experiments were
performed in triplicate. All significant differences were reported at 95% (P < 0.05) confidence
intervals. In addition qualitative analysis was performed to facilitate analysis of pulsed UV- light
spatial power distribution.
3.4 Results and discussion
3.4.1 Spatial power distribution (12 plate experiment)
Figure 3.4 presents photographs showing the distribution of pulsed UV-light at varying
distances from the pulsed UV source at 1,000 V. The percentage of exposed surface area was
calculated by dividing Petri plate surface area by exposed surface area (the decontaminated area).
As it is illustrated in the images the exposed surface percentage increased as the distance from
the pulsed UV source is increased (Table 3.1). The affected surface area on Petri plates expands
by increasing the distance; however, the intensity of pulsed UV-light decline and consequently
fewer molds were eliminated from these areas. This might be due to the increase in energy
dissipation as the light pulse travel from the xenon lamp to the Petri dishes.
Ben Saïd et al. (2010) also indicates that the inactivation of bacterial populations on the
agar surface reduced significantly (p < 0.05) when the distance between the plate and the xenon
lamp increased. At the same number of pulses and at the same intensity of energy, a single pulse
with 162 J of energy achieved >7, 5–6, and 3 log reductions at shelf height of 4, 9, and 12 cm,
respectively. Similarly, study of inactivation of Aspergillus niger spores on corn meal by pulsed
UV-light showed log reduction of fungal spores increased significantly with respect to a decrease
in the distance from 8 to 13 cm (Jun et al., 2003). In another study honey inoculated with
Clostridium sporogenes spores was treated with pulsed UV-light. The distance between the
honey and the lamp, were investigated (Hillegas and Demirci, 2003). The results showed that
reducing the distance between the honey surface and the UV lamp enabled improved spore
reduction.

38
5cm
10cm
15cm
Figure 3.4 Distribution of pulsed UV- light at varying distances (5, 10 and 15 cm) from the pulsed UV
source (1,000 V, 5 min)

39
Table 3.1 Spatial power distribution of pulsed UV- light on treatment tray, in three different distances
(5, 10 and 15 cm) from pulsed UV source (PUV- 01 system).
Treatment voltage (V) Distance from pulsed UV
source (cm)
Surface area exposed to pulsed
UV-light treatment (%)
1,000
5 30
10 75
15 90
3.4.2 Microbial analysis for apple juice
Analysis of variance (ANOVA) was performed and the log reductions were plotted as a
function of different number of pulses and voltage input for two different distances from pulsed
UV source (Figure 3.5).
All of the treatment times had a significant impact on E. coli populations (p < 0.05). Even so,
the study showed no significant differences in E. coli inactivation of samples when the treatment
time increased from 60 to 120 and then to 600 pps (p > 0.05). This might be due to low intensity
of the treatment, for the reason that significantly greater reductions in E. coli populations were
observed in samples exposed to pulsed UV-light for 2 minutes at a frequency of 10 pps (1,200
pulses)(p<0.05). No significant differences in counts were observed when samples exposed to
pulsed UV- light from 5 cm distance compare to 15cm distance from UV strobe (p > 0.05).
Although statistical analysis showed no significant differences (p > 0.05), figure 3.5 illustrates
more inactivation when higher voltage input and less distance between sample and lamp is used
in the treatment.
Literature review on the effectiveness of pulsed UV-light have shown that this
technology may result in significant reductions in levels of microbial pathogens, moulds and
yeasts (Demirci and Krishnamurthy, 2011; Takeshita, 2003; Turtoi and Nicolau, 2007). In a
study by (Ngadi et al., 2003) apple juice inoculated with E. coli O157:H7 were treated with UV-
light. UV doses between 0 and 23.4 J cm-2
was evaluated and reductions of 4.2 log CFU ml-1
were achieved. In another study evaluating the effectiveness of pulsed UV- light treatments for

40
the control of Escherichia coli and Listeria innocua in apple juice, a reduction of 4.7 log CFU
ml-1
for E. coli was obtained after 8 seconds when total energy doses of 28 J cm-2
were imposed
to the samples (Palgan et al., 2011). In disagreement with the mentioned studies, the current
study on apple juice showed that at the most a reduction of 2 log CFU ml-1
for E. coli was
obtained after 2 min treatment (1,200 pulses) at 1,000 V and 5 cm. The lower inactivation
observed in the present study was as a result of low energy dose which is generated by 1,000 V
input (20 J).
Figure 3.5 The log reduction in population of Escherichia coli in apple juice treated by pulsed UV- light
at different distances, voltage inputs and treatment times.

41
3.5 Conclusion
The result of the effect of voltage and distance from the pulsed UV-light source on
inactivation of P. roqueforti showed mold inactivation is increased as treatment time increased.
When the distance from the pulsed UV-light source is increased (from 5 to 15 cm), the
inactivation of P.roqueforti is decreased due to decline in the intensity of the pulsed UV-light.
Thus, the findings show, it is crucial when choosing pulsed UV-light parameters (for the
Magnavolt PUV-01 in this study), to consider the sample exposed surface area to pulsed UV-
light. Based on the results achieved from bacterial inactivation in apple juice, it is concluded, in
the next experiments more treatment time needs to be considered in order to maximize microbial
destruction of highly resistant microorganism on the surface of more complex food substrates
than apple juice.
3.6 REFERENCES
Ben Saïd, N. E., Federighi, M., Bakhrouf, A., & Orange, N. (2010). Effectiveness of pulsed
ultraviolet-light treatment for bacterial inactivation on agar surface and liquid medium.
Foodborne pathogens and disease, 7(11), 1401–6.
Demirci, A., & Krishnamurthy, K. (2011). Chapter 18 Pulsed Ultraviolet Light, 249–261.
Dunn, J.E., Clark, R.W., Asmus, J.F., Pearlman, J.S., Boyerr, K., Painchaud, F., et al.,1989.
Methods for preservation of foodstuffs. Vol. US Patent 4871559.
Dunn, J., 1996 Sep. Pulsed light and pulsed electric field for foods and eggs. Poultry Science 75
(9), 1133e1136.
Gómez-López, V. M., Ragaert, P., Debevere, J., & Devlieghere, F. (2007). Pulsed light for food
decontamination: a review. Trends in Food Science & Technology, 18(9), 464–473.
Hillegas, S.L., and Demirci, A. 2003. Inactivation of Clostridium sporogenes in clover honey by
pulsed UV-light treatment. In Agriculture Engineering International: the CIGR Journal of
Sien- tific Research and Development. Vol. V. Manuscript FP 03 009
Jun, S., Irudayaraj, J., Demirci, A., & Geiser, D. (2003). Pulsed UV-light treatment of corn meal
for inactivation of Aspergillus niger spores, (2000), 883–888.
Ngadi, M., Smith, J., Cayouette, B., 2003. Kinetics of ultraviolet light inactivation of
Escherichia coli O157:H7 in liquid foods. Journal of the Science of Food and Agriculture
83, 1551e1555.

42
Palgan, I., Caminiti, I. M., Muñoz, a, Noci, F., Whyte, P., Morgan, D. J., … Lyng, J. G. (2011).
Effectiveness of High Intensity Light Pulses (HILP) treatments for the control of
Escherichia coli and Listeria innocua in apple juice, orange juice and milk. Food
microbiology, 28(1), 14–20.
Pollock, A. M. (2007). characterizaton of pulsed light treatment on the shelf life of and safety of
vacuum packaged cold smoked salmon.
Ross, A.I.V., Griffiths, M.W., Mittal, G.S., Deeth, H.C., 2003. Combining nonthermal
technologies to control foodborne microorganisms. International Journal of Food
Microbiology 89, 125e138.
Takeshita, K. (2003). Damage of yeast cells induced by pulsed light irradiation. International
Journal of Food Microbiology, 85(1-2), 151–158.
Turtoi, M., & Nicolau, a. (2007). Intense light pulse treatment as alternative method for mould
spores destruction on paper–polyethylene packaging material. Journal of Food Engineering,
83(1), 47–53.

43
CHAPTER 4
SELECTION OF MICROBIOLOGICAL PROTOCOLS FOR INOCULATION AND
ENUMERATION OF MOLD ON BREAD SURFACE
4.1 Abstract
Microbial contamination on the surface of food and food processing equipment is a major
concern for the bakery industry. In the current study, the distribution consistency of mold growth
(Penicillium roqueforti ATCC 10100) was investigated using different methods of inoculation.
Random spot and spread inoculation methods were employed on the upper surface of flat bread.
The consistency of P. roqueforti growth over time was similar for both methods of inoculation.
Two different inoculum concentrations (102 and 10
3 CFU ml
-1) were also used to assess the
effect of inoculum size on the distribution and consistency of mold growth after incubation of
bread for 7 days at room temperature. Samples inoculated with 102 CFU ml
-1 yielded a more
homogenous distribution of colonies across the upper surface of flat bread. The efficacy of these
two inoculation methods was also evaluated on pizza dough with and without toppings after
treatment of 400V, 60 to 1,200 pulses, 5 and 25 cm from UV source. Parameters of 400 V, 1,200
pulses and a distance of 5 cm from the UV strobe resulted in complete inactivation of P.
roqueforti on the surface of some of the random spot and spread inoculated pizza breads (by
visual inspection).
4.2 Introduction
One of the major challenges in designing an experiment for the present study is to
inoculate and enumerate mold populations on the surface of pre-formed pizza samples. One of
the critical concerns was to achieve a better pulsed UV-light penetration and treatment
homogeneity. This depicts the importance of inoculation techniques which could assure an even
distribution of inoculums over the surface of treated substrate. Therefore choosing an appropriate
method of inoculation can result in better dispersion inoculum and treatment homogeneity. As a
result, the inoculua distribution would not only be more similar to the natural distribution of
contaminants but would also simplify the detection of individual colonies for enumeration. A
literature review reveals numerous methods of propagation of bacteria and fungi on the surface

44
and inside various food products, depending on the nature of the samples and the treatment
method. For instance, an inoculum of 0.1 ml was spread on salmon skin and muscle tissue to
evaluate the inactivation of Escherichia coli O157:H7 and Listeria monocytogenes on raw
salmon fillets by pulsed UV-light treatment (Ozer & Demirci, 2006). The spray inoculation of
spores on polystyrene (PS), glass, or aluminum was performed with an airbrush connected to a
compressor (delivering compressed air at 2.5×10⁵ Pa) to study microbial surface
decontamination by pulsed UV-light (Levy and Bornard, 2011). In a previous study, pita bread
was inoculated with a total of 100 µl of mold suspension at random spots on the bread surface to
give a final inoculum of 103
spores g-1
(El-khoury et al., 1999). In another study which
investigated the inhibition of fungal growth on wheat and rye bread by Modified Atmosphere
Packaging (MAP), samples were inoculated by inserting inoculums at 3 points. Among studies
that assess the efficiency of possible inoculation methods (spread, random spot, spray and central
spot), Levy et al. (2011) showed that spray was an inefficient method of inoculation due to the
fact that not more than 20 % of the sprayed volume comes into contact with the target surface
(the agar plate or the Petri dish). The central spot method was also identified as a limited method
since the accumulation of inoculum in only one spot can affect pulsed UV-light effectiveness and
yield a low level of inactivation (Bialka, 2007).
The objectives of the present study were:
1- To compare the reproducibility of two different methods of inoculation (random spot and
spread) on untreated flat bread.
2- To conduct a preliminary study of the efficacy of pulsed UV-light on mold inactivation of
randomly spot inoculated pizza bread without tomato topping.
3- To conduct a preliminary study on the efficacy of pulsed UV-light on mold inactivation on
pizza bread with topping, using two methods of inoculation (spread and random spot).
4.3 Materials and Methods
4.3.1 Sampling
Pita bread (Selection, QC, Canada) with approximate radius of 10 cm was purchased
from a local grocery store in the region of Montreal Island. Pita bread was autoclaved in Electric
Sterilmatic Sterilizer (Market Forge Industries Inc., Everett, MS, USA) for 20 mins at 121°C

45
prior to inoculation in order to reduce the native microflora. Pizza bread, with and without
tomato sauce topping, were obtained from a pizzeria company (Les aliments Rustica, Montreal
QC, Canada) and were sterilized as above.
4.3.2 Fungal isolate and preparation of inoculum
A stock-culture of Penicillium roqueforti ATCC 10010 (Cedarlane Corporation, Burlington, ON,
Canada) was inoculated on Potato Dextrose Agar (PDA, Difco, Spark, MD, USA) in order to
obtain a pure culture. Plates were incubated for 3-7 days at 25 °C in the dark, after which
colonies were transferred to fresh Potato Dextrose Broth (Difco, Sparks, MD, USA) and re-
incubated for 5-7 days at 180 rpm and 24°C to generate the inoculums. Suspensions of
vegetative cells were made by diluting the inoculum with peptone water (102 and 10
3 CFU ml
-1).
Afterwards 100 µl suspensions were used for inoculating each piece of bread. Controls were
prepared using the same method. The inoculum was not diluted more than 3 folds as the initial
concentration of inoculum was estimated to be 105 CFU ml
-1 and four subsequent serial tenfold
dilutions yielded counts that were lower than the detection level. The first tenfold dilution
produced mold counts that were greater than detection level.
4.3.3 Inoculation of bread and visual inspection of untreated bread
For the random spot method, pita bread samples were inoculated by pipetting 0.1 ml of
the inoculum suspension and depositing the suspension on five randomly chosen spots of the
bread’s surface. For the spread method, an equal amount 0.1 of inoculum was introduced on the
surface of the bread and spread over the entire surface with a sterile hockey stick. The inoculated
samples were dried for 10 minutes under laminar flow in a biological safety cabinet (Labconco
Corporation, Kansas City, MO, USA) before packaging in aluminum foil to facilitate the
absorption of the liquid inoculum by the bread. Each experiment was done in quadruplicate for
each inoculation method and repeated 15 times with an independently prepared vegetative cell
suspension. Mold growth on the surface of the bread was enumerated at different time periods:
time 1 (0 - 8 days), time 2 (9 to 16 days) and time 3 (>16 days). The enumerations were done
almost every day, however as there were no significant difference in daily mold growth counts,
the results were reported in time periods.

46
4.3.4 Inoculation, pulsed UV-light treatment and visual inspection of treated breads
without tomato sauce topping
4.3.4.1 Inoculum preparation
The inoculum consisted of vegetative cell suspension of Penicillium roqueforti and was
prepared as detailed above.
4.3.4.2 Inoculation of bread
Samples were inoculated by pipetting 0.1 ml of P. roqueforti suspension in 10 drops
(approximately same volume) onto 10 randomly chosen spots on the surface of each piece of
bread. Controls (uninoculated breads) were prepared in the same fashion. In this experiment, the
random spot method has been used to create a feasible approach to detecting surviving spots of
inoculum after pulsed UV treatment. Only the top surface was inoculated due to the fact that the
pulsed UV-light chamber was equipped with only one lamp, at the top. The samples were kept
under laminar flow in a biological hood for 10 min before treatment to facilitate absorption of the
liquid inoculum by the bread.
4.3.4.3 Pulsed UV-light treatment
Two UV treatments were investigated: a minimum treatment (400 V, 300 pulses and 25
cm from UV strobe) and a maximum treatment (400 V, 600 pulses and 5 cm from UV strobe).
Mold growth on the bread was enumerated after 12 days of incubation at room temperature.
4.3.5 Inoculation, pulsed UV-light treatment and visual inspection of treated pizza bread
with tomato sauce topping
4.3.5.1 Inoculum preparation
The inoculum consisted of vegetative Penicillium roqueforti and was prepared as above.

47
4.3.5.2 Inoculation of bread
For the random spot method, pizza bread samples were inoculated by pipetting 0.1 ml of
P. roqueforti suspension in 5 drops (approximately same volume) onto 5 randomly chosen spots
on the surface of each piece of pizza bread. In this part of the experiment, the number of random
spots was reduced to prevent the spots of inoculum from coalescing since sample surface area is
limited. For the spread method, an equal amount of inoculum was introduced onto the entire
surface of the bread. The deposited suspension was dried for 10 minutes under a laminar flow
hood before treatment to facilitate the attachment of microbial cells to sample surfaces.
4.3.5.3 Pulsed UV-light treatment
Three UV treatments were investigated: minimum treatment (400 V, 60 pulses and 25 cm
from UV strobe), intermediate treatment (400 V, 120 pulses and 5 cm from UV strobe), and
maximum treatment (400 V, 1,200 pulses and 5 cm from UV strobe). Mold growth was
enumerated after 12 days of incubation at room temperature.
4.4 Results and discussion
4.4.1 Inoculums size
In this study, the effect of inoculum size on the growth of vegetative fungi cells was
evaluated. As expected, when bread was inoculated with 102 CFU ml
-1, less mold growth was
visible on the surface of the bread in comparison with bread inoculated with 103 CFU ml
-1
(Figure 4.1). Visual inspection also revealed that a lower initial fungal concentration was easier
to enumerate. However, mold growth (in number and size) increased on all the breads over time.
This can be seen on the bread inoculated with 103 CFU ml
-1. A non-homogeneous dispersion is
visible compared to those inoculated with 102 CFU ml
-1.
4.4.2 Inoculation methods
In this study, the consistency between the numbers of mold colonies grown during the
incubation time, with each inoculation method was determined in 15 experimental replications.

48
The enumeration scatters obtained using the spread and random spot methods are shown in
Figure 4.1.
Figure 4.1 Enumeration scatter of mold count on pizza bread surface after inoculation with 102 and 10
3
CFU ml-1 of P. roqueforti. Figure A (upper left) = 102 random spot, B (upper right): 102 spread, C
(lower left): 103 random spot, D (lower right): 103 spread. Mold growth on the surface of the bread was
enumerated at different time periods: time 1 (0 - 8 days), time 2 (9 to 16 days) and time 3 (>16 days).
A comparison was carried out between the consistency of mold growth obtained from
two different inoculation methods, random spot and spread (Figure 4.1). During the first 8 days
of incubation, mold growth on the bread was less than 50 colonies per bread in most of the
experimental replicates by using both inoculation methods and both inoculua concentrations. For
102 CFU ml
-1 inoculum size, colony numbers were less than 150 colonies per bread until day 16.
0
50
100
150
200
250
300
350
No
. of
Mo
ld c
olo
nie
s o
n b
read
Incubation Time
8 days 16 days > 16 days
A
0
50
100
150
200
250
300
350
400
450
No
. of
Mo
ld c
olo
nie
s o
n b
read
Incubation Time
8 days 16 days > 16 days
B
0
50
100
150
200
250
300
350
400
450
No
. of
Mo
ld c
olo
nie
s o
n b
read
Incubation Time
8 days 16 days > 16 days
C
0
50
100
150
200
250
300
350
400
450
No
. of
Mo
ld c
olo
nie
s o
n b
read
Incubation Time
8 days 16 days > 16 days
D

49
However, the majority were still under 100 colonies per bread. In the third time period, mold
growth increased to 300 and 350 per bread. Bread inoculated with an inoculum size of 103 CFU
ml-1
followed the same pattern as those inoculated with 102 CFU ml
-1. Nonetheless, these breads
had more colonies over each period of time because of a higher level of starting inoculum.
Despite the similarities between the two inoculation methods, visual observation of colonies
formed during incubation showed a more homogeneous dispersion of cells when they were
spread on the surface as compared to those randomly spotted on it. In the random spot method
there is also some underestimation due to colonies which had never been detected because they
were in the shade of other colonies (Levy et al., 2011). However, it was noticed that the mold
grouping was easier to differentiate when random spot was used. Therefore, both inoculation
methods can be selected as an ideal method of inoculating mold onto the sample surface
depending on the feasibility of each method with regards to the purpose of each experiment.
4.4.3 Inspection of mold growth on bread with and without tomato sauce topping
This part of the experiment was conducted using the concept of minimum and maximum
treatments, as described in Table 4.1 Random spot was applied as inoculation method on pizza
bread without topping.
Table 4.1 Incidence of mold growth on pizza bread (without tomato topping) surface after UV
treatment. Ten random spots were applied to each bread surface (5 replicates per treatment).
Treatments Replicates
1* 2 3 4 5
Control (no treatment) +++++
+++
+++++
+++++
+++++
+- - - -
++++ -
- - - - -
++++ -
- - - - -
Minimum UV treatment (400 V, 300
pulses and 25 cm from UV strobe) ++- - -
- - - - -
+ - - - -
- - - - -
+++++
++++-
+++- -
- - - - -
+ - - - -
- - - - -
Maximum UV treatment (400 V, 600
pulses and 5 cm from UV strobe) - - - - -
- - - - -
- - - - -
- - - - -
++- - -
- - - - -
- - - - -
- - - - -
- - - - -
- - - - -
* + represents growth; - represents no growth.

50
This part of the experiment was also conducted using the concept of minimum, intermediate and
maximum treatments as described in Table 4.1 the inoculation was performed using random spot
and spread methods. Two inoculation methods were examined on bread with topping to
determine the experimental efficacy of both methods on bread with topping. Results are shown
in Table 4.2.
Table 4.2 Incidence of mold growth on pizza surface with tomato sauce topping, after UV treatment.
Five random spots were applied (4 replicated for each treatment).
Spread Method Random Method
Replications 1 2 3 4 1 2 3 4
Control (no UV treatment) +* + + + - + + +
Minimum UV treatment (400V, 60 pulses and 25
cm from UV strobe) + - - + + + + -
Intermediate UV treatment (400V, 120 pulses and
5 cm from UV strobe) - - - - - + - +
Maximum UV treatment 400V, 1200 pulses and 5
cm from UV strobe) - - + - - - - -
* + represents growth; - represents no growth
Although the results varied between replicates of the same treatment, trends of mold
inactivation were considerably the same for both inoculation methods and bread with or without
tomato topping (Table 4.1 and 4.2). Penicillium roqueforti decontamination was improved by
decreasing the distance between the sample surface and the UV-lamp as well as by increasing
voltage input and the number of pulses (which also means increasing the treatment time).

51
4.5 Conclusion
The results showed that the scatter obtained by both random spot and spread methods are
in the same order of magnitude and both could be used to inoculate the surfaces. However, it was
noticed that the mold grouping was easier to differentiate when random spot was used, while
colonies’ scatter is more homogenous on the bread when spread inoculation method was applied.
Therefore, the random spot and spread methods will be selected as a preferred method of
inoculating mold onto the sample surface for the remaining part of study depending on the
feasibility of each method with regards to the purpose of each experiment. The effect of pulsed
UV-light was found to be more efficient to inactivate 102 CFU ml
-1 on some of the bread
samples. Considering that in practice the degree of cooked food contamination is much lower,
this achievement could lead to an effective reduction of molds (vegetative cells), and even to
obtain a total decontamination of the surface after packaging.
4.6 REFERENCES
Bialka, K. L. (2007). The Pennsylvania State University The Graduate School Department of
Agricultural and Biological Engineering decontamination of berries with ozone and pulsed
uv-light (thesis), 223–7.
KARIN I. SUHR. (2005). M;Food Microbiology and Safety Inhibition of Fungal Growth on
Wheat and Rye Bread by Modified Atmosphere Packaging and Active Packaging Using,
70(1).
Levy, C., Bornard, I., & Carlin, F. (2011). Deposition of Bacillus subtilis spores using an
airbrush-spray or spots to study surface decontamination by pulsed light. Journal of
microbiological methods, 84(2), 223–7.
Ozer, N. P., & Demirci, A. (2006). Inactivation of Escherichia coli O157:H7 and Listeria
monocytogenes inoculated on raw salmon fillets by pulsed UV-light treatment.
International Journal of Food Science and Technology, 41(4), 354–360.

52
CHAPTER 5
SHELF LIFE EXTENTION OF PIZZA AND BREAD BY PULSED UV-LIGHT
5.1 Abstract
Intense light pulse is one of the emerging non-thermal technologies considered as an
alternative to traditional thermal treatment due to its microbial destruction effects without
deteriorative impact on food quality. The aim of this study was to evaluate the possibility of
using pulsed UV-light treatment for effective inactivation of molds on pizza and bread surfaces.
The pizza samples had tomato sauce topping. The bread samples were plain pizza bread with no
topping. For pizza samples, three sets of pulsed UV light treatments were applied namely 500 V,
1 min (minimum treatment); 750 V, 5 min (intermediate treatment) and 1,000 V, 10 min
(maximum treatment). The treated samples were visually examined for mold growth within 40
days storage. The results showed that 8, 32, and 40% of pizza samples were mold free after the
40 days storage with minimal, intermediate and maximal pulsed UV-light treatment,
respectively. The bread samples were inoculated with Penicilium roqueforti, and treated with
different pulsed UV input voltage (500 and 1,000 V), treatment time (2 and 7 min) and distance
from the light source (5 and 15 cm). Treated bread samples were examined microbiologically
after 7, 14, 21 and 28 days storage. UV input voltage significantly influenced inactivation of P.
roqueforti on the surface of bread. There was a significant effect of voltage on the reduction of
mold population on the samples (P < 0.05). Samples treated with the more intense voltage (1,000
V) showed steady surviving population less than 102
CFU g-1
over the storage time. However,
500 V treated breads and controls showed an exponential growth in every analysis day (more
than 103
CFU g-1
). The results indicate that pulsed UV-light can be considered as a potential
decontamination method for bakery products.
5.2 Introduction
Cereal-based products, especially bakery products, are important part of a balanced diet.
Although microbial, chemical and physical spoilage all occur in bakery and pasta products, mold
spoilage is often the main shelf life limiting factor (Rodriguez et al., 2003). In fact, microbial

53
spoilage is the major cause of economic loss in the bakery industry (Ooraikul and Stiles, 1991).
Pulsed UV-light is a non-thermal technology which can be considered as an effective technique
to minimize these problems while at the same time extending their shelf life (Hierro et al., 2011).
Pulsed light has been investigated as a mean of extending the shelf life of baked goods, seafood,
meat products, and fruits and vegetables (Dunn, 1997). Changes in consumer preferences in
recent years have led to the development of a wide variety of ready-to-eat foods. Among these
foods, the bakery industry offers pre-cooked pizza products which can be kept at room
temperature. However, these products are presumed to be contaminated in post-cooking
procedures due to further manipulation such as cutting, slicing in handling and packaging
sections. Concerning food safety, preformed pizza have been reported to be contaminated by
mold such as Penicillium roqueforti (Saranraj and Geetha, 2012). In this regard pulsed UV-light
is a techniques which would aid in preventing the growth of spoilage or pathogenic bacteria,
while maintaining the sensory quality of the final product. The ability of pulsed UV light to kill
several fungus spores is well documented. Investigations showed a 60–99% reduction of viable
spores of Aspergillus flavus, Aspergillus niger, Penicillium corylophilum and Eurotium rubrum
on the surface of agar plates after a 15 s exposure to pulsed UV light (Begum et al,. 2009).
Pulsed light extends shelf life of bread more than two weeks at ambient temperature as compare
to untreated samples which were visibly spoiled with mold growth after one week. Overall,
pulsed light technology shows promising results as a novel method to extend the mold free shelf
life of pre-packaged bakery products (Dunn et al., 1995;1997). Pulsed UV-light effect on bakery
products was investigated by treating breadstick with eight flashes at 0.5 J cm-2
. Approximately
17% of the control breadsticks showed visible molding by day 6 while 100% were moldy by day
7. However, less than 4% of the treated breadsticks showed visible signs of mold by day 13, and
no further mold growth occurred throughout the 26 days of storage (Dunn et al., 1997b).
Application of pulsed UV-light treatment on disinfection of hard crusted white bread rolls are
described in the US patent of Dunn et al. (1989). Conventional UV exposure produced about 2.5
to 4.5 log reduction in CFU of Aspergillus niger (a common bread mold) during the first 3-10
seconds of treatment (Cerny, 1977). In another study, a few flashes of pulsed UV-light applied in
a fraction of a second resulted in 7 log CFU cm-2
reduction of A. niger in packaged bread (Dunn
et al., 1997). The objectives of this study were; to evaluate the efficacy of pulsed UV-light

54
intensity on the shelf life of pizza bread with topping (non-inoculated samples) and to enumerate
the mold surviving population on treated pizza without topping (inoculated samples) over time.
5.3 Materials and Methods
5.3.1 Pizza bread with tomato sauce topping
Samples of pizza bread with tomato sauce topping were obtained from both a nearby
factory (Les Aliments Rustica) and local grocery stores in the region of Montreal Island. The
samples were stored at room temperature for two days prior to pulsed UV irradiation. Following
treatment, the pizza samples were stored at room temperature until 40 days for visual
inspections. 40 days storage was decided as last visual inspection day because it is two times
longer than the product’s normal expiry date. After this day, physical deterioration such as
stalling will happen and this condition without considering microbiological spoilage would
nonetheless make the product unacceptable.
5.3.2 Pizza bread without tomato sauce topping
Samples of pizza bread without tomato sauce topping were also obtained from a pizza
producing factory (Les Aliments Rustica) and from grocery stores in the region of Montreal.
Each piece of bread (approximate radius of 10 cm) was divided into 4 equal size pieces. Pizza
bread slices were autoclaved for 20 mins at 121°C in Electric Sterilmatic Sterilizer (Market
Forge Industries Inc., Everett, MS, USA,) in order to reduce their native microflora prior to the
inoculation with test mold. Each piece was inoculated with 0.1 ml of inoculum which was spread
on the sample surface while ensuring that there was no spill off the edges of the sample. Since
pulsed UV-light is largely a surface treatment, the reduction of inoculums on the surface as a
result of inoculum spill off the edges, could be considered as a decontamination effect of pulsed
light. Visual and microbiological analyses were performed 7, 14 and 21 days after pulsed UV
treatment throughout the storage time.
5.3.3 Pulsed UV-light treatment for pizza samples
3 treatment combinations were considered for the experiments (Table 5.1). 25 samples
were treated by each treatment intensity to determine the efficacy of individual parameters on the

55
shelf life of the pizzas. The treated and untreated samples were then kept at room temperature,
the same storage conditions where the pizzas would be stored in the industrial setting. Visual
inspection was performed in anticipation of 40 days after treatment.
5.3.4 Penicillium roqueforti inoculum preparation (for bread samples)
A stock-culture of Penicillium roqueforti ATCC 10010 (Cedarlane Corporation,
Burlington, ON, Canada) was inoculated on Potato Dextrose Agar (PDA, Difco, Spark, MD,
USA) in order to obtain a pure culture. Plates were incubated for 3-7 days at 25°C in the dark,
after which colonies were transferred to fresh Potato Dextrose Broth (Difco, Sparks, MD, USA)
and re-incubated for 5-7 days at 24°C to generate the inoculum. The inoculum was homogenized
in a Stomacher 400 Lab Blender (Seward medical, London, UK) for 2 min and a population of
about 1x10⁵
CFU mL-1
was obtained in the resulting inoculum solution. An equal amount of
inoculum was introduced onto the entire surface of the bread. The deposited suspension was
dried for 10 minutes under a laminar flow hood before pulsed UV treatment to facilitate the
attachment of microbial cells to sample surfaces.
5.3.5 Pulsed UV- light treatment for bread samples
Characterization of pulsed UV-light system used in the present study is describes in
chapter 1. Each inoculated bread was centered individually on the adjustable stainless-steel shelf
in the pulsed UV unit. The experiments were performed by positioning the shelf at 5 and 15 cm
beneath the Xenon lamp. At each distance, the effect of treatment time (2 and 7 min) and input
voltage (500 and 1,000 V) was investigated. Treated breads were consequently wrapped with
aluminum foil immediately after flashing and kept at room temperature up to 21 days. Untreated
slices were analyzed as controls. Each set of parameters were performed in duplicate.
5.3.6 Analysis of pizza samples after pulsed UV treatments
To assess the efficacy of pulsed UV-light on shelf life extension of samples, molds were
enumerated immediately after treatment (day 0) and after storage for 7, 14, 21 days at room
temperature.
On each day, one slice was aseptically removed from the package, transferred into an individual
sterile stomacher bag, weighted and then mixed with buffered peptone water (in the proportion

56
with bread samples at 9:1). The mixture was homogenized in a Stomacher 400 Lab Blender
(Seward medical, London, UK) for 2 min. Serial decimal dilutions were conducted and the
dilutions were spread-plated onto PDA (Potato Dextrose Agar) plates. The plates were incubated
at 24ºC for 3 days, and then colonies were counted using a manual colony counter (Reichert
technologies, Depew, NY, USA).
5.3.7 Statistical analysis for bread
All experiments were performed in duplicate for the same treatment at the same time for
all two trials. Statistically significant differences were tested by repeated measurement analysis
of variance using SAS 9.1 software.
5.4 Results and Discussion
5.4.1 Pulsed UV-light on Pizza
The result shown in Table 5.1 indicates the average time of mold spoilage on the samples
for the selected treatment intensities. 25 samples were treated by each treatment intensity.
Table 5.1 Conditions used for the pulsed UV-light treatments. 25 replicate per each treatment intensity.
Treatment
Intensity Voltage(volts) Time(min) Frequency(Hz)
NO. of
pulses
Time for mold
spoilage (days)
Control 0 0 0 0 17.56 ± 6.7
Minimum 500 1 4 240 15.52 ± 15.5
Intermediate 750 5 4 1200 26 ± 12.7
Maximum 1,000 10 4 2400 30.8 ± 9.6
The overall trend showed, by increasing the intensity of treatment from minimum to
maximum, the shelf life of samples were increased by 10 to 40 percent (Table 5.2). The
companies’ specified expiry date for the product of our study is 21 days. According to this
information, 20, 48 and 60 percent of the samples were still visually proper to use after
minimum, intermediate and maximum pulsed light treatment respectively. Intermediate and
maximum treatment showed an increase in shelf life, as the number of non-moldy pizza was still
high and above 50% at 20 days. However, during the same period, mold spoilage occurred on
more than 70% of the minimally treated pizzas. This percentage was even higher than that of

57
control (untreated) samples which was around 68% until the inspection day of 20. This can be
attributed to a phenomenon, known as photoreactivation which is a DNA repairing mechanism
based on the activity of DNA photolyases. This enzyme uses the UV-A component of light for
repairing the damaged nitrogenous bases (Cook, 1970). Although all the pizzas were kept in the
same condition at room temperature, it is possible that photoreactivation took place on some of
the lower intensity treated products. Therefore, some injured fungi cells could have been
repaired, which reduced the samples’ shelf life to the level of untreated pizzas. Photoreactivation
can occur when the UV-C injured cells are exposed to wavelengths higher than 330 nm
(Guerrero-Beltrn, 2004; Hierro et al., 2009). It should be noted that the wavelength of the pulsed
UV- light system used in the present experiment has a peak spectral emissions at the wavelength
250 nm.
Table 5.2 Percentage of non-moldy pizza after 10, 15, 20, 30, 40 days.
Inspection time
(days) Percentage of non-moldy pizza
Control Minimum PL
treatment
Intermediate
PL treatment
Maximum PL
treatment
10 88 56 92 100
15 48 28 60 88
20 32 28 52 76
30 4 20 48 60
40 0 8 32 40
5.4.2 Pulsed UV-light on Pizza
5.4.2.3 Microbiological analysis
The effectiveness of pulsed UV-light was evaluated by determining the surviving population of
P. roqueforti on bread surfaces. While the UV treatment time and distance showed no significant
influence on mold population over time(P > 0.05), there was a significant effect of voltage on the
reduction of mold population on the samples (P < 0.05). Within each analysis day, there were
also a significant difference between surviving population obtained by 500 volts and 1,000 volts
(P < 0.05). However, other parameters including distance and treatment time were not
significantly different on their effect on surviving population in all of the analysis days. This

58
disagreement with the result from non-inoculated pizza treatment could be due to non-
homogeneous inocula introduced on the surface of samples.
Samples treated with the more intense voltage (1,000 V) showed a steady surviving
population of less than 102
CFU g-1
over the storage time (Figure 5.1). However 500 V treated
breads and controls showed an exponential growth in every analysis day to the level of more than
103 CFU g
-1 in day 21. UV-light damages the DNA of microorganisms by primarily forming
thymine dimers and thus the DNA cannot be replicated. Hence, microorganisms lose their ability
to reproduce (Oms-Oliu et al., 2008; Demirci and Krishnamurthy, 2011). The exponential growth
of P. roqueforti in 500 V treated breads could be attributed to the fact that mold cell’s DNA was
not vigorously affected by pulsed UV in a low intensity.
Figure 5.1 Surviving mold (P. roqueforti) population over storage time in each analysis day
when time and distance are fixed at 5 cm and 7 mins.
0.00E+00
5.00E+02
1.00E+03
1.50E+03
2.00E+03
2.50E+03
3.00E+03
3.50E+03
4.00E+03
0 7 14 21
Mo
ld p
op
ula
tio
n C
FU g
-1
Day
500 V
1000 V
Control

59
5.5 Conclusion
In non-inoculated pizza breads with topping, pulsed light treatment of 1,000 V for 10 min
at 10 cm distance from pulsed UV source extended shelf-life of 40% of the maximally treated
pizzas up to 40 days. Considering this result, pulsed light appears as a promising technique for
extending the shelf life of product in bakery industry applications. In bread without topping,
there was a significant effect of voltage on the reduction of the mold population on the samples
(P < 0.05). In addition, samples treated with the more intense voltage (1,000 V) showed steady a
surviving population of less than 102
over the storage time. However, many irregularityies and
unpredictability in the result had been seen especially when treatments with lower level of
voltage input were performed. This inconsistency might be because of the non-homogenized
nature of vegetative cell inoculum. Therefore, more homogenized source of inoculum such as
spore suspension has to be applied in the future experiments. The homogeneity in the inocula
helps to observe a more consistence and reliable inactivation results corresponding to the level of
pulsed light intensity even at lower levels.
5.6 REFERENCES
Cerny, G. (1977). Sterilization of packaging materials for aseptic packaging. Ver pack, 28(10):
77.
Cook, J.S., 1970. Photoreactivation in animal cells. Photophysiology 5, 191–233.
Demirci, A., and Krishnamurthy, K. (2011). Chapter 18 Pulsed Ultraviolet Light, Nonthermal
Processing Technologies for Food, 249–261.
Dunn, J., Bushnell, A., Ott, T., & Clark, W. (1997). Pulsed white light food processing. Cereal
Foods World, 42, 510e515.Fine, F. and P. Gervais (2004). "Efficiency of pulsed UV light
for microbial decontamination of food powders." Journal of Food Protection 67: 787‐792.
Fine, F. and P. Gervais (2004). "Efficiency of pulsed UV light for microbial decontamination of
food powders." Journal of Food Protection 67: 787‐792.
Guerrero-Beltrn, J. a. (2004). Advantages and Limitations on Processing Foods by UV Light.
Food Science and Technology International, 10(3), 137–147.
Hierro, E., Barroso, E., la Hoz, L. De, Ordóñez, J. a., Manzano, S., & Fernández, M. (2011).
Efficacy of pulsed light for shelf-life extension and inactivation of Listeria monocytogenes

60
on ready-to-eat cooked meat products. Innovative Food Science & Emerging Technologies,
12(3), 275–281.
Hierro, E., Manzano, S., Ordóñez, J. a, de la Hoz, L., & Fernández, M. (2009). Inactivation of
Salmonella enterica serovar Enteritidis on shell eggs by pulsed light technology.
International journal of food microbiology, 135(2), 125–30.
O’Connor-Shaw, R. E., Reyes, V. G., in: Robinson, R. J., Batt, C. A., Patel, P. D. (Eds.) (2000),
Encyclopedia of Food Microbiology, Academic Press, pp. 410–416.
Oms-Oliu, G., Martín-Belloso, O., & Soliva-Fortuny, R. (2008). Pulsed Light Treatments for
Food Preservation. A Review. Food and Bioprocess Technology, 3(1), 13–23.
Ooraikul, B., & Stiles, M. E. (1991). Review of the development of modidied atmosphere
packaging, 1–17.
Pollock, A. M. (2007). characterizaton of pulsed light treatment on the shelf life of and safety of
vacuum packaged cold smoked salmon.Thesis
Rodríguez, V., Medina, L., & Jordano, R. (2003). Influence of modified atmosphere packaging
on the shelf life of prebaked pizza dough with and without preservative added. Die
Nahrung, 47(2), 122–5.
Saranraj, P., & Geetha, M. (2012). Microbial Spoilage of Bakery Products and its Control by
Preservatives, International Journal of Pharmaceutical & Biological Archives 2012; 3(1):38-
48 3.

61
CHAPTER 6
EFFECTIVENESS OF PULSED UV-LIGHT TREATMENT FOR INACTIVATION OF
PENICILLIUM ROQUEFORTI ON AGAR SURFACE
6.1 Abstract
In the present study, the effectiveness of a broad-spectrum pulsed ultraviolet light was
evaluated for the decontamination of Penicillium roqueforti on the surface of solid agar as a
representative of a flat food surface. The process parameters evaluated were treatment time (1, 3,
5, 7 and 10 min), voltage input (500, 750 and 1,000V). The results demonstrated that an increase
of the input voltage of the lamps (which also increases the UV-C intensit) and the number of
pulses resulted in a higher inactivation. The population of Penicillium roqueforti was reduced
after 10 min of exposure to pulsed light by 3.74, 5.36 and 6.14 log CFU ml-1
, respectively at 500,
750 and 1,000 V. Overall, these observations suggest that pulsed UV-light can effectively
inactivate spores of Penicillium roqueforti on the surface of a solid agar medium. Additionally,
the inactivation data obtained for each voltage were correlated by using Weibull (2 parameters),
log-linear (1 parameter, based on first-order kinetics) models. The results presented in this study
indicate that first-order kinetics is not suitable for the estimation of P. roqueforti inactivation on
solid agar with pulsed UV-light. However, the inactivation kinetics was best described by the
Weibull model with the smallest root mean squared error (RMSE) (R2
≥ 0.92). Weibull model
can be successfully used to estimate the inactivation and the concavity exhibited in the survival
curves observed in this study. Temperature increase inside the treatment chamber was also
monitored during this experiment.
62
6.2 Introduction
Pulsed UV-light is a unique emerging technology mostly used for surface
decontamination. This non-thermal sterilization technology uses intense flashes of broad-
spectrum radiation ranging from UV light (200 nm) to infrared radiation (1,000 nm) (Mcdonald
et al., 2000). This novel technique is capable of reducing microbial populations of both
vegetative cells and spores of bacteria, mold and yeast (Ben Saïd and Orange, 2010). Pulsed UV-
light has been investigated as a means of extending the shelf life of baked goods, seafood, meat
products, and fruits and vegetables (Dunn, 1997). Nevertheless, due to lack of penetration, the
technology is increasingly proposed as an alternative non-thermal technology especially for
disinfection of transparent liquid foods and decontamination of solid food surfaces (Unluturk and
Atilgan, 2010; Baysal et al., 2010). Post-baking fungal contamination of bakery products is a
concern for the bakery industry. Penicillium roqueforti is one of the dominant molds that cause
spoilage on bread and other baked products.
The ability of pulsed UV light to kill several fungus spores is well documented.
Investigations showed a 60–99% reduction of viable spores of Aspergillus flavus, Aspergillus
niger, Penicillium corylophilum and Eurotium rubrum on the surface of agar plates after a 15 s
exposure to pulsed UV-light (Begum et al,. 2009). In addition, 50, 40 and 20 J cm-2
energy were
used successfully to inactivate S. cerevisiae at the populations of 5.4×10⁶, 7×10
5, 5×10
4 and
4×10³ CFU ml
-1, respectively in non-alcoholic beer (Hosseini et al., 2011). Marquenie et al.,
(2003) reported a maximal inactivation of 3 and 4 log units for conidia of fungi B. cinerea and
M. fructigena in vitro. In a study by Jun et al. (2003) on corn meal, a 100-s treatment time, 3 cm
of distance from the UV strobe, and with 3,800 V input gave a 4.93 log reduction of the spore of
A. niger. Takeshita et al. (2003) proposed that pulsed UV-light can be used as an effective
sterilizing method for the yeast Saccharomyces cerevisiae by investigating the mechanisms of
damage of yeast cells treated by pulsed UV-light and continuous UV light.
Complete inactivation of M. fructigena conidia was obtained after a 40-s pulsed light
treatment and 15 min heat at 41oC or after an 80-s light treatment and 10 min heat at 41
oC. It is
noted that microbial spores are more resistant than vegetative cells when they are exposed to UV
treatment. As a result, more intense treatments are required for their inactivation (Farkas et al.
2007). Overall, more extensive research is needed to investigate microbial inactivation on food

63
surfaces by this technique. Therefore in order to further understand the potentials of pulsed UV
light on Penicillium roqueforti, the responses of this microorganism to pulsed light treatment
need to be understood through modeling. The inactivation of microorganisms via UV light has
been shown to follow first-order kinetics in solution (EPA, 2003), but it has also been reported to
display a sigmoidal shape with a shoulder and/or a tail (CFSAN-FDA, 2006). The previous
chapters focused on the characterization and optimization of the pulsed light apparatus for
treatments used in this study. These results were used as a guideline to determine the proper
treatment procedure to construct inactivation model kinetics of P. roqueforti.
The objectives of this study were:
1) To evaluate the efficacy of pulsed UV-light treatment for inactivation of Penicillium
roqueforti on agar surface;
2) To evaluate the pulsed UV-light destruction kinetics of P. roqueforti on agar surface.
6.3 Material and Methods
6.3.1 Preparation of Inoculum
Penicillium roqueforti (ATCC 10010) provided by Cedarlane Corporation (Burlington,
Ontario, Canada) was used throughout this study. The strain was grown in Potato Dextrose Broth
(PDB, Difco, spark, MD, USA) with shaking at 180 rpm at 24o C for 4 to 7 days. Cultures were
maintained by spreading 0.1 ml of liquid culture on Potato Dextrose Agar (PDA, Difco, spark,
MD, USA). After incubating the Petri plates at 24oC for 7 days, the spore crops were harvested
by adding 5 ml of Tween 80 (Acros Organic, New Jersey, USA) onto the surface of PDA, then
filtered by using 4 layers of cheese cloth. The resulting inoculum solution had 2.74×10¹⁰
colony
forming units (CFU) mL-1
and this cell suspension was serially diluted up to 10 -2
, 10 -3
and 10 -5
before transferring to the test agar plate. A 0.1 ml of inoculum was transferred onto solid agar
and spread on each PDA Petri plates using a sterile hockey stick.

64
6.3.2 Treatments
The Agar seeded plates were positioned on the tray at 5 cm from the UV lamp in the
treatment chamber. At this distance, the effect of treatment time (1, 3, 5, 7 and 10 min) and input
voltages of 500, 750 and 1,000 V were investigated. The initial cell concentrations at the various
input voltages were set by 10-5
, 10-3
, 10-2
dilutions, respectively. Temperature of the treatment
chamber was measured at 5 cm away from the light source using K type thermocouple
(Omegaette HH306, Omega Engineering Inc., Stamford, CT, USA).
6.3.3 Inactivation of P. roqueforti
All Petri plates were incubated for 4 days at 24oC in the dark according to the supplier’s
protocol (ATTC); however enumeration was performed prior to 7 days (Tiwari et al., 2011),
since the colonies have not grown to the level of overlapping each other and they can be
distinguished easier. The impact of treatments on the inactivation of P. roqueforti was
determined by enumerating the Colony Forming Units (CFUs) on each Petri plate. The log
reduction was calculated by subtracting the log value of the control from that of treated sample.
6.3.4 Statistical analysis
An analysis of variance was performed using the general linear models procedure in SAS
to compare the effects of different applied pulsed-light intensity (voltage input) and treatment
time (number of pulses). All treatments were performed in triplicate, and all significant
differences are reported at 95% (P < 0.05) confidence intervals.
6.3.5 Model development
6.3.5.1 Log-linear model
Traditionally, microbial inactivation resulting from application of both thermal and non-
thermal processes have been described by the log-linear equation (Bialka, Demirci & Puri,
2008). This Model [Eq. (1)] follows the rules of first-order inactivation kinetics to describe
microorganism destruction (Van Boekel, 2002).

65
(
) Eq. (1)
Where N is the number of microorganisms at time t (CFU ml-1
), N0 is the initial number
of microorganisms (CFU ml-1
), t is the treatment time (sec or min), k is the first-order extinction
coefficient (s-1
or min-1
). From this equation, the classic “D-value” or the time necessary for a 1
log reduction can be calculated as the reciprocal of the first-order rate constant. The log-linear
equation is simply appropriate for linear inactivation curves and research findings suggest that
many inactivation curves are non-linear (Bialka et al., 2008).
6.3.5.2 Weibull model
The second model used in the study is the Weibull model [Eq. (2)] which is offered as a simple
model for the description of microbial inactivation by thermal and non-thermal treatment
methods (Van Boekel, 2002). In the case of UV-light treatment, inactivation curves are generally
sigmoidal and exhibit concavity or convexity behaviors through downwards or upwards as a
function of inactivation time or UV dose (Unluturk et al., 2010). The Weibull model usually
describes this behavior accurately. This model is composed of two parameters (α and β) given in
the following correlation (Van Boekel, 2002; Bialka et al., 2008):
(
)
(
)
Eq. (2)
Where N is the number of microorganisms (CFU ml-1
), N0 is the initial number of
microorganisms (CFU ml-1
), t is the treatment time (sec or min), α is the characteristic time (s or
min) and β is the shape parameter (unitless). Many survival curves exhibit concavity, either
downwards or upwards, and the β parameter is used to describe this concavity. If β < 1, the curve
displays upward concavity. This can be a sign of stress adaptation of surviving microorganism. If
β > 1, the curve displays downward concavity that shows considerable damages of pulsed UV-
light in the cells. In addition, by using α and β, reliable life (tR) (indicating the time necessary for
90% reduction in the number of microorganism) can be calculated (Van Boekel, 2002). This
parameter corresponds to the D-value for the first log reduction [Eq. (3)].

66
( )
Eq. (2)
Where α characteristic time, β shape parameter.
6.4 Results and discussion
6.4.1 Pulsed UV-light and microbiological analysis
Increasing the treatment time significantly (p<0.05) increased P. roqueforti inactivation. There
were significant (P < 0.05) differences between all treatment times (1, 3, 5, 7 and 10 mins) when
500 V were applied. For the treatment sets using 750 V, the significant difference (P < 0.05) was
demonstrated between 1 to 3 and 5 to 7 min. In the case of 1,000 V, treatment times of 1 to 3, 3
to 5 and 7 to 10 mins showed a significant difference (P < 0.05) on inactivation of P. roqueforti
on agar surface. Therefore, it can be noted that at a specific energy, the reduction in population
improved significantly with an increase in the treatment time. According to our results, there was
also a significant (P < 0.05) increase in the reduction of population along with an increase in the
voltage input for the same number of pulse. After 10 mins of pulsed light treatment, a log
reduction of 3.74, 5.36 and 6.14 were obtained by 500, 750 and 1,000 V, respectively.
Marquenie et al. (2003) also reported a maximal inactivation of 3 and 4 log units for conidia of
B. cinerea and M. fructigena in vitro after pulse UV treatment of 120 s at the fluence of 0.10 J
cm-2
. The treated fungal populations of Aspergillus niger and Fusarium culmorum were reduced
by 3 to 4.5 log orders after 1,000 light pulses of the 3 J UV intensity light (Anderson et al.,
2000). The maximal log reduction was close to 1 with a pulsed UV- light fluence of 1.2 Jcm-2
for
Aspergillus niger inoculated in sugar syrup (Chaine and Levy et al., 2012); however, on agar, the
log reduction for the same fungi was even lower than 1 for the same fluence.
Taking into account that solid agar used in the experiments was unnaturally
contaminated, the initial number of mold spores (determined for the control samples) was higher
than in normal conditions. Thus, it could be expected that, it is possible to achieve a complete
decontamination by 6.14 log reduction (the highest mold reduction achieved in this experiment).
Therefore, the results of this report shows that pulsed light can be considered as a promising
techniques for fungi elimination or decontamination in the industry.

67
Over a 10 min treatment period, temperature in the treatment chamber increased from the
initial 25°C to 27, 33 and 35°C when 500, 750 and 1,000 V, respectively were applied. Species
of Penicillium have an optimum temperature in the range of 25 to 35°C (Food and Drug
Administration, 2001). Therefore, the temperature as a result of pulsed UV treatment will not
inactivate Penicillium roqueforti used in this study. Therefore, temperature in pulsed UV-light
units was not of a major concern regarding the possible risk of detrimental effect on the quality
of bread or pizza and hence would not compromise the integrity of this value-added product.
6.4.2 Inactivation kinetics model
Comparison of the predicted and experimental inactivation data is shown in Figure 6.1.
From the inactivation curves, it can simply be observed that none of the inactivation curves (at
different voltages) exhibit a linear trend. As indicated by the results, the Weibull model was
found to more accurately estimate the microbial reductions obtained during pulsed UV light
treatments. Bialka et al. (2008) also reported that first-order kinetics are not suitable for the
estimation of microbial inactivation on berries treated with ozone or pulsed UV-light, but that the
Weibull model can be successfully used to estimate the reductions of E. coli O157:H7 and
Salmonella enterica on raspberries and strawberries. A modified Weibull model was chosen by
Levy et al. (2012) to fit microbial reduction curves for Bacillus subtilis, B. atrophaeus, B. cereus,
Geobacillus stearothermophilus, and Aspergillus niger treated by pulsed UV-light on solid agar
. Koseki and Yamamoto (2007) showed that a linear model was not suitable to describe reduction
of E. coli during high pressure processing. Their findings also demonstrate that the Weibull
model as well as the modified Baranyi model could be used to accurately estimate this
inactivation and were capable of fitting the tail of the survivor curve resulting from high pressure
processing. The ability of this model to accurately estimate reductions of P. roqueforti can be
seen in Figure 6.1.

68
Figure 6.1 Inactivation of Penicillium roqueforti with pulsed UV light fitted with the first order and
Weibull kinetics models. Inactivation was performed on solid agar at three different voltage inputs (500,
750 and 1,000 V) and five different treatment times (1, 3, 5, 7 and 10 mins). Data shown are mean and
standard deviation values.
Goodness-of-fit parameters of log-linear and Weibull models for pulsed UV-light treatment are
shown in Table 6.1 and 6.2. These parameters provide more insight into the shapes of the
inactivation curves. Overall, the RMSE and R2 values obtained for the Weibull model are less
than and greater, respectively, than those obtained for the log-linear model with the exception of
750 V due to the existence of an outliner in the results. The scale parameter α is usually
considered as a measure of the organism resistance (kinetic parameter) to treatment and
decreases with exposure time. This value was found to be decreasing when voltage increased.
For the three voltages, β values were less than 1, which accounts for curve’s upward concavity,
but also indicating that the remaining cells are less susceptible to pulsed UV-light, perhaps due to
0
1
2
3
4
5
6
7
0 2 4 6 8 10 12
Log(
N0
/N)
Time (min)
500 V
750 V
1000 V
Weibull (Predicted)
Linear (Weibull (Predicted))

69
lack of pulsed light penetrability. A trend can also be seen in the dose required for 1 log
reduction (tR). Values for tR decrease when higher voltage is applied which indicates that the
cells are inactivated quickly with higher voltages.
Table 6.1 Goodness-of-fit parameters of the first order kinetics models estimating reductions of P.
roqueforti on solid agar after treatment with pulsed UV- light.
Voltage RMSE R2 K
500 V 0.29317 0.9219 0.2497
750 V 0.7281 0.7296 0.2965
1,000 V 0.13248 0.9584 0.9584
Table 6.2 Goodness-of-fit parameters of Weibull models estimating reductions of P. roqueforti on solid
agar after treatment with pulsed UV- light.
Voltage α β tR RMSE R2
500 V 0.04326 0.40072 0.34687 0.1374 0.9828
750 V 0.0026 0.30359 0.04063 0.8163 0.6601
1,000 V 2.20E-09 0.11851 2.51E-06 0.0824 0.9839
6.5 Conclusion
In conclusion, by considering the impact of individual pulsed UV treatment’s parameters
and their interaction on inactivation of P. roqueforti, the most effective treatment conditions for
inactivating this mold was 1,000 V for 10 min. In fact, pulsed UV light irradiation was very
effective at inactivating the spores of P. roqueforti; however, the dose of energy per pulse and
the position of xenon lamp will determine the lethality. Moreover, decontamination by pulsed
UV-light has to account for possible interactions between the target surface and the
microorganism. Therefore, further research on the influence of pulsed light on foods with more
complex composition is needed to define the applicability of the technology in the
decontamination processes. The experimental data also suggest that inactivation of P. roqueforti
70
by pulsed UV light does not appear to follow first-order kinetics. On the other hand, the
inactivation kinetics of the tested microorganisms on solid agar was best described by Weibull
model with the smallest RMSE and R2 ≥ 0.92.
6.6 REFRENCES
Anderson, J. G., Rowan, N. J., Macgregor, S. J., Fouracre, R. A., Farish, O., & Member, S.
(2000). Inactivation of Food-Borne Enteropathogenic Bacteria and Spoilage Fungi Using
Pulsed-Light, 28(1), 83–88.
Begum, M., Hocking, A. D., & Miskelly, D. (2009). Inactivation of food spoilage fungi by ultra
violet (UVC) irradiation. International journal of food microbiology, 129(1), 74–7.
Ben Saïd, N. E., Federighi, M., Bakhrouf, A., & Orange, N. (2010). Effectiveness of pulsed
ultraviolet-light treatment for bacterial inactivation on agar surface and liquid medium.
Foodborne pathogens and disease, 7(11), 1401–6.
Bialka, K. L., Demirci, A., & Puri, V. M. (2008). Modeling the inactivation of Escherichia coli
O157:H7 and Salmonella enterica on raspberries and strawberries resulting from exposure
to ozone or pulsed UV-light. Journal of Food Engineering, 85(3), 444–449.
Chaine, A., Levy, C., Lacour, B., Riedel, C., & Carlin, F. (2012). Decontamination of sugar
syrup by pulsed light. Journal of food protection, 75(5), 913–7.
CFSAN-FDA. 2000. Kinetics of microbial inactivation for alternative food processing
technologies: Pulsed light technology. Atlanta, GA: Center for Food Safety and Applied
Nutrition – Food and Drug Administration. Available at: http://vm.cfsan.fda.gov/ ~comm/
ift-puls.html. Accessed 19 April 2006.
EPA (Environmental Protection Agency). 2003. Appendix J. Pilot-scale and demonstration-scale
testing. J-4, J-5. Ultraviolet Disinfection Guidance Manual. Washington, DC.: U.S.
Environmental Protection Agency.
Farkas, J. (2007). Physical methods of food preservation. Food microbiology: fundamentals and
frontiers, 685-712.
Hosseini, S., Azar-Daryany, M., Massudi, R., & Elikaei, a. (2011). Pulsed UV laser light on
Escherichia coli and Saccharomyces cerevisiae suspended in non-alcoholic beer. Iranian
journal of microbiology, 3(1), 31–5.
Jun, S., Irudayaraj, J., Demirci, A., & Geiser, D. (2003). Pulsed UV-light treatment of corn meal
for inactivation of Aspergillus niger spores, (2000), 883–888.

71
Koseki, S., & Yamamoto, K. (2007). A novel approach to predicting microbial inactivation
kinetics during high pressure processing. Inter- national Journal of Food Microbiology, 116,
275–282.
Levy, C., Aubert, X., Lacour, B., & Carlin, F. (2012). Relevant factors affecting microbial
surface decontamination by pulsed light. International journal of food microbiology, 152(3),
168–74.
Marquenie, D., Michiels, C.W., Van Impe, J.F., Schrevens, E. & Nicolai, B.N. (2003). Pulsed
white light in combination with UV-C & heat to reduce storage rot of strawberry. ostharv
Biology and Technology, 28, 455– 461.
Mcdonald, K. F., Curry, R. D., Clevenger, T. E., Unklesbay, K., Eisenstark, A., Golden, J.,
Morgan, R. D. (2000). A comparison of Pulsed and continuous vltraviolet light sources for
the decontamination of surfaces, 28(5), 1581–1587.
Takeshita, K. (2003). Damage of yeast cells induced by pulsed light irradiation. International
Journal of Food Microbiology, 85(1-2), 151–158.
Tiwari, K. L., Jadhav, S. K., & Kumar, A. (2011). Morphological and molecular study of
different penicillium species, 7(2), 203–210.
Turtoi, M., & Nicolau, a. (2007). Intense light pulse treatment as alternative method for mould
spores destruction on paper–polyethylene packaging material. Journal of Food Engineering,
83(1), 47–53.
Unluturk, S., Atilgan, M. R., Baysal, a H., & Unluturk, M. S. (2010). Modeling inactivation
kinetics of liquid egg white exposed to UV-C irradiation. International journal of food
microbiology, 142(3), 341–7.
Van Boekel, M.A.J.S., 2002. On the use of the Weibull model to describe thermal inactivation of
microbial vegetative cells. International Journal of Food Microbiology 74, 139–159

72
CHAPTER 7
ANALYSIS OF FUNGAL DIVERSITY IN PRE-FORMED PIZZA BY SEQUENCING OF
CLONED PCR-AMPLIFIED GENES ENCODING 18S rRNA
7.1 Abstract
Fungal contamination of food is a serious concern, both from a food safety and food trade
standpoint. Thus, the identification and characterization of food spoilage but fungi and other
microorganisms would be desirable in order to apply early intervention steps to limit the amounts
of contaminated materials, particularly in cereal-based industries. In the present study, culture-
dependent and independent methods were applied to study the ecology of preformed pizza
produced in a pizzeria in Montreal. Classical microbiological analyses were performed to
identify the main microbial groups present in the product. The average population of mesophilic
aerobic bacteria (MAB), mesophilic anaerobic bacteria (MANB), lactic acid bacteria (LAB),
molds and yeasts (M+Y) were 6.7±0.5, less than 2.3, 2.8±0.6 and 5.4±0.4 log CFU g-1
,
respectively. Fungal diversity was analyzed by extracting DNA from naturally spoiled preformed
pizza samples. Molecular methods including conventional PCR targeting the 18S rRNA gene of
fungi, TA cloning of PCR-amplified fragments and sequencing followed by BLAST analysis
were carried out to detect spoilage fungi in naturally spoiled pre-formed pizza. The cloning
approach enabled the putative identification of Saccharomyces cerevisiae, Saccharomyces sp.
WW-W23, Penicillium expansum, Penicillium freii, Penicillium sp. HSL, Penicillium sp. ljg1,
Rhodotorula mucilaginosa, Monascus fuliginosus, Hordeum jubatum, Galactomyces geotrichum
strains as well as uncultured fungus and uncultured eukaryote clones.
7.2 Introduction
Today, an important part of a balanced diet includes bakery products. This industry has
been increasing and varying its production and pizza has become one of the most widely
consumed fast food in the world. It has become popular because it can be sold ready to use,
frozen, chilled or pre-cooked, is cheap and easy to prepare. Nevertheless, physical, chemical and
microbial spoilage are of a concern in most cereal-based products including pizza. Spoilage

73
caused by fungi is considered as the dominant shelf life limiting factor and the major cause of
economic losses in the bakery industry. In baked products such as pre-cooked pizza dough, the
fungi may be inactivated during baking; however, they can contaminate the food again after
processing (Pinho et al., 2000). Considering the above mentioned information, three types of
fungi that are frequently found in pre-cooked pizza dough belong to the Penicillium and
Aspergillus genera (Pinho et al., 2000). Numerous studies suggest that only a small fraction of
microorganisms can be grown under typical laboratory conditions (Dorigo et al., 2005). Thus,
culture-dependent methods do not necessarily provide reliable information about the targeted
microbial communities (Palomba and Pepe, 2010). In recent years, a lot of attention has been
paid to the use of molecular methods for the detection, quantification, identification and
characterization of microorganisms in foods. These methods are currently considered as an
indispensable tool that permits the accurate description of the microbial ecology of food (De
Vuyst et al., 2007).
Polymerase Chain Reaction (PCR) using domain or taxon-specific probes in combination
with separation techniques such as Denaturing Gradient Gel Electrophoresis (DGGE) and
molecular cloning have revolutionized our understanding of the composition of food samples.
The cloning and sequencing of rRNA genes have been used for the study of food microbiology
for detection, identification and characterization of potential spoilage microorganisms. These
methods are robust, reproducible and provide valuable information about microbial taxonomy
(Diez et al., 2001). Although direct cloning has been used to characterize the microbial
composition of several environments, few published studies have applied this approach to
analysing food products. The aim of the present study was to analyze the diversity and
composition of the fungal community in pre-formed pizza using complementary culture-
dependent and culture-independent techniques.
7.3 Materials and methods
7.3.1 Sampling
The spoiled pre-cooked pizza samples were acquired from a pizza-manufacturing
company (Les Aliments Rustica) in the city of Montreal QC, Canada. Collected samples had
expiration dates of 21 days, according to the manufacturer. Sample collection was performed in
the summer of 2013.

74
7.3.2 Preparation of pizza samples for microbiological analysis
All of the pizzas were aseptically removed from the package and weighed. A 25 g
amount of the sample was then placed in a sterile stomacher bag containing 250 ml of buffered
peptone water (in the proportion with pizza samples at 10:1). The mixture was then blended in a
Stomacher 400 Lab Blender (Seward medical, London, UK) for 2 min or until homogenized.
From the resulting mixture, serial decimal dilutions were conducted and the dilutions were
spread-plated in triplicate onto different selective media (as mentioned in the next paragraphs).
Results of all the microbial enumerations are expressed in CFU g-1
.
7.3.3 Enumeration of total bacteria
To determine the total population of mesophilic aerobic bacteria (MAB) and mesophilic
anaerobic bacteria (MANB), Petri plates containing plate count agar (PCA, Oxoid, Hampshire,
UK) were prepared. Plates were incubated at 35ºC for 48 h either in aerobic condition or in
anaerobic condition in a Forma anaerobic system, model 1025/1029 (Thermo Scientific,
Marietta, Ohio, USA) (FDA, 1992). Colony Forming Units (CFU) was counted with a dark-field
Quebec colony counter (Reichert technologies, Depew, NY, USA).
7.3.4 Enumeration of lactic acid bacteria
Anaerobic lactic acid bacteria (ANLAB) were enumerated by plating on de Man Rogosa
Sharpe agar (MRS, Oxoid, Hampshire, UK), a selective medium acidified to pH 5.4 with tartaric
acid, and incubating in a Forma anaerobic system at 37°C for 72 h (Terzaghi and Sandine, 1975).
Aerobic lactic acid bacteria (ALAB) were enumerated by plating on M17 agar (Oxoid,
Hampshire, UK) and incubating in aerobic conditions at 37°C for 48-72 h.
7.3.5 Identification of lactic acid bacteria
Fermentation of carbohydrates was determined using the API 50 CH strips and API 50
CHL medium (API system, Biomérieux, NC, USA). This is a standardized system consisting of
50 biochemical tests for the study of carbohydrate metabolism by microorganisms (Sana and

75
Hamdi, 2007). According to the manufacturer’s instructions, API 50 CH along with API 50 CHL
medium could be used for the identification of Lactobacillus and related genera (Ghanbari et al,
2009). To assure the purity of the isolates, well-isolated colonies were streaked onto MRS agar
and incubated anaerobically for 24 h at 37°. Bacteria were transferred to API 50 CHL medium (5
ml) using a sterile swab in order to prepare heavy bacterial suspensions (S). Subsequently, a
suspension with a turbidity equivalent to 2 McFarland was prepared by transferring a certain
number of drops of suspension (S) into the ampoule provided by the manufacturer. The
concentration was determined by spectrophotometer. 10 ml of pure water was dispensed into the
incubation box with the strip placed in the incubation box. The wells of the API strips were filled
to the required level with the bacterial suspension and topped off with mineral oil. The API strips
were subsequently incubated at 37°C for 48 h.
7.3.6 Enumeration of molds and yeasts
To estimate the total number of molds and yeasts present, triplicate plates were poured
with Potato Dextrose agar (PDA, Difco, spark, MD, USA). Tartaric acid was filtered by 0.22µ
fisher band filter. The filter sterilized tartaric acid was added to the melted agar to reach the pH
of 5.6. The plates were incubated at 24ºC for 3-5 days, and then colonies were counted using a
Quebec Colony Counter (Reichert technologies, Depew, NY, USA).
7.3.7 Extraction of nucleic acids
Bags containing spoiled samples of preformed pizza were aseptically opened and 1 gram
of each sample (taken from a spoiled part of the sample) was weighed and placed into a sterile
stomacher bag. Sterile 0.1% peptone water (1 ml) was added to each sample and the contents
were homogenised in a Stomacher 400 Lab Blender (Seward Medical, London, UK) for 2 min.
DNA was extracted using a Power Food Microbial DNA Isolation Kit (MO BIO Laboratories,
Inc., Carlsbad, CA, USA for the isolation of genomic DNA from food). According to
manufacturer’s instructions, in brief, approximately 1.8 ml of each homogenized food mixture
was centrifuged at 13,000 rpm for 5 min at room temperature two times. Pellets were re-
suspended in a lysing reagent that includes a detergent to break cell walls and remove non-DNA

76
organic and inorganic materials. Microbial cells were lysed using a combination of chemical and
mechanical lysis conditions to increase yield for difficult cells. The process was followed by
adding high concentrated salt solution to the mix, to allow binding of DNA to silica, but not non-
DNA organic and inorganic materials that may still be present at low levels. The isolated DNA
was finally diluted in an alcohol based wash solution used to further clean the DNA from
residual salt and other contaminants. The eluted DNA, which did not contain EDTA, was stored
at -20°C as recommended by manufacturer.
7.3.8 Quantification and purity of DNA
DNA concentration and purity of each extract were analyzed using a Nano Drop 2000
Spectrophotometer (Thermo Fisher Scientific, Wilmington, DE, USA). Yield of extraction were
measured by following parameters; concentration (ng/µl), A260/280 (absorbance at 260 nm /
absorbance at 280 nm) and the A260/230 ratio (absorbance at 260 nm / absorbance at 230 nm).
7.3.9 Verification of DNA quality
Extracted DNA was run on a 1% agarose gel for 2 h with voltage input of 55V, to verify
its quality (shearing). The aliquot of 5 ul of each extracted DNA were loaded on the gel and the
electrophoresis was performed in 1X TAE buffer. Gels were stained with ethidium bromide for
20 min, destained in water for 5 min and viewed using a Red AlphaImager (Proteinsimple, Santa
Clara, CA, USA). The size of the products was estimated using a λDNA GeneRuler100-bp DNA
ladder (Thermo Fisher Scientific Inc., Carlsbad, CA, USA). The scale proposed by Lemarchand
et al. (2005) was used to evaluated the degradation degree of the DNA in each extract; 1 = low
(mean fragment size between 23 and 2 kb); 2 = medium (mean fragment size between 23 and 0.5
kb); 3 = high (mean fragment size between 23 and <0.5 kb) (Pakpour, 2012).
7.3.10 Polymerase chain reaction amplification
Fungal 18S rRNA genes were amplified from extracted genomic DNA using PCR primer sets A
and B (Table 7.1).The intensity of the amplicons generated by each primer pair was compared by
gel electrophoresis and staining with ethidium bromide, as described previously. Primer set C

77
was used for the sequencing of cloned fragments. All primers were obtained from Integrated
DNA Technologies (Toronto, ON, Canada) and the PCR reactions were prepared in an Esco®
PCR laminar flow cabinet (Esco Technologies Inc., PA, USA). PCR reaction mixtures and
thermal cycling conditions were as described in Wu and Blomquist (2002) and the next
paragraph. In order to determine the conditions giving the highest specificity, the annealing
temperatures were optimized by temperature gradient PCR. Intensity and presence of only one
amplicon were the criteria to determine the optimal temperature. Rhizoctonia solani as positive
control and a negative control consisting of the reaction mixture without DNA, were used in each
PCR run.
Table 7.1 Overview of the oligonucleotide sequences used in the study.
Primer
set *
Primer
name Sequence (5′ → 3′) Specificity References
A NS1f GTAGTCATATGCTTGTCTC Universal for fungi
(Wu et al.,
2002)
NS4r CTTCCGTCAATTCCTTTAAG Universal for fungi
(Wu et al.,
2002)
B NS1f GTAGTCATATGCTTGTCTC Universal for fungi
(Wu et al.,
2002)
NS6r GCATCACAGACCTGTTATTGCCTC Universal for fungi
(Wu et al.,
2002)
C M13 f GTAAAACGACGGCCAG
Plasmid linker
region
(Messing et
al., 1982)
M13 r CAGGAAACAGCTATGAC
Plasmid linker
region
(Messing et
al., 1982)
*: Primer sets A and B were used for the generation of PCR products for TA cloning. Primer set C was
used for the sequencing of PCR products cloned with the Easy T vector system.
7.3.11 Temperature gradient PCR assay for primer pairs A and B
The extracted genomic DNA served as a template for amplification of 1,100 and 1,400 bp
fragments of the 18S rRNA gene by using NS1f-NS4r and NS1f-NS6r (universal fungal primers
for 18S), respectively. In brief, all PCR amplifications were performed in a total volume of 50 ul
containing 1-5 ng of template DNA extracted from the spoiled samples, 1 X buffer (Denville
Scientific, Saint-Laurent, QC, Canada), 500 µM of each primer (Integrated DNA Technologies,
Toronto, ON, Canada), 1.5 U of Hot Start Taq DNA polymerase (Denville Scientific, Saint-

78
Laurent, QC, Canada), 200 mM of each dNTP (Bioshop Canada Inc., Burlington, ON, Canada)
and molecular grade water (Sigma-Aldrich, Oakville, ON, Canada) to reach a total volume of 50
µl (Wu et al., 2002). PCR amplifications were conducted using a Veriti Thermocycler (Applied
Biosystems, Foster City, CA, USA) with the following temperature cycling profile: initial
denaturation at 94°C for 3 min, followed by 35 cycles of denaturation at 94°C for 45 sec,
annealing at 50, 52, 54, 56, 58, 60°C for 50 sec, and extension at 72°C for 90 sec, followed by 5
min at 72°C for the final extension. Aliquots (13 ul) of the amplification products were examined
by electrophoresis on 1.5% agarose gels and ethidium bromide staining. A GeneRuler 100-bp
DNA ladder (Thermo Fisher Scientific Inc.) was used to estimate the size of the products.
7.3.12 PCR on spoiled samples
PCR on spoiled samples were carried on by using primer set A and B with the optimized
annealing temperature of 50°C and 52°C respectively. The PCR reaction mixture and cycling
profile were identical to those of temperature gradient PCR.
7.3.13 Purification of PCR products
The PCR products were purified using a SpinSmart PCR purification kit (Denville
Scientific Inc., Metuchen, NJ, USA). The samples were processed according to the protocol
supplied by the manufacturer. The purification is based on the following principle: DNA was
first absorbed to the silica-membrane of the spin column in the presence of high salt
concentration, whereas the contaminants passed through during centrifugation. Salts were
resolved and then washed away with an ethanol-containing buffer. Afterwards, DNA was eluted
with 15 to 50 µl of elution buffer. The concentration and quality of the purified PCR products
were determined with a NanoDrop 2000/2000c Spectrophotometer (Thermo Fisher Scientific), as
described hereinabove.
7.3.13 Cloning
Cloning was performed using a TA cloning kit pGEM-T Easy vector system A1380
(Promega, Madison WI, USA) as described by the manufacturer. In brief, 1 to 3 ul of PCR
products were ligated as specified in the kit’s protocol (Table 7.2). PCR amplicons were cloned

79
into a pGEM®-T Easy vector (3,015 bp) provided with protruding thymidines at the cloning site,
taking advantage of the adenosinic overhangs left by the Taq DNA polymerase at the 3' termini
of the DNA. The vector molar ratio is shown in Table 7.2. The ligation reaction was carried out
at room temperature for two hours. The ligation mixture was subsequently transformed into high
efficiency competent cells of Escherichia coli (JM109). After 20 mins of incubation on ice, cells
were heat shocked for 60 sec at 42°C and then incubated for an additional 150 mins in S.O.C.
medium (2% tryptone, 0.5% yeast extract, 10 mM NaCl, 2.5 mM KCl, 10 mM MgCl2, 10 mM
MgSO4, 20 mM glucose (Fisher Scientific, NY, USA) at 37°C under shaking condition (150
rpm). After incubation, small volumes (100 to 200 µl) were spread on pre-warmed LB agar
plates (Luria-Bertani, Difco, spark, MD, USA) 1% tryptone, 0.5% yeast extract, 0.5% NaCl,
15% agar, pH 7.0, ampicillin with a final concentration of 100 µg per ml, IPTG 0.5 nM, X-Gal
80 µg per ml (Fisher Scientific, NY, USA) and cells were allowed to grow overnight at 37°C.
Four to six white colonies (positive recombinants) for each sample were selected from each
transformation and screened by PCR for the presence of an insert, using primers M13 f and M13
r.

80
Table 7.2 Cloning conditions
Reagents Samples
1 2 3 5 8 9 11 12
2X Rapid ligation
buffer 5ul 5ul 5ul 5ul 5ul 5ul 5ul 5ul
pGEM-T easy Vector
(50ng) 1ul 1ul 1ul 1ul 1ul 1ul 1ul 1ul
PCR product 3ul 1ul 1ul 2ul 1ul 3ul 1ul 3ul
T4 DNA legase
(3weiss units/ul) 1ul 1ul 1ul 1ul 1ul 1ul 1ul 1ul
Nuclease-free water 0 2ul 2ul 1ul 2 ul 0ul 2ul 0ul
Approximate Vector
molar ratio 1-Jan 1-Feb 1-Feb 1-Feb 1-Jan 1-Feb 1-Feb 1-Feb
Sample concentration
in cloning reaction 27ng 36ng 37ng 46 ng 39.5ng 18.1ng 53ng 24 ng
Colony PCR was then performed using the vector-specific primers M13f and M13r and a
single colony as template. Four to six colonies per sample were used as a template for the PCR.
Each PCR reaction contained 1X PCR buffer, 200 nM of each primer (Integrated DNA
Technologies, Toronto, ON, Canada), 80 mM dNTPs (Bioshop Canada Inc., Burlington, ON,
Canada), 1 U Hot-Start Taq DNA polymerase (Denville Scientific, Saint-Laurent, QC, Canada),
and molecular grade water (Sigma-Aldrich, Oakville, ON, Canada) in a total volume of 50 µl.
PCR amplifications were conducted in a Veriti Thermocycler (applied Biosystems, CA, USA).
The thermal cycling conditions were as follows: initial denaturation at 95°C for 3 min, followed
by 35 cycles of denaturation at 94°C for 30 sec, annealing at 57°C for 30 sec and extension at
72°C for 1 min, and then 10 min at 72°C for the final extension. Aliquots (13 ul) of the PCR
products were verified for the correct insert length on 1.5% agarose gels and ethidium bromide
staining. The size of the products was estimated using a GeneRuler100-bp DNA ladder (Thermo
Fisher Scientific Inc.).

81
7.3.14 Sequencing
Cloned PCR products that contained the desired insert were selected for sequencing. In
total, 28 clones were sequenced. Sequencing was performed at the McGill University and
Genome Québec Innovation Centre (Montreal, QC, Canada) using a 3730 × l DNA Analyzer
system (Applied Biosystems, Carlsbad, CA, USA). Sequences were checked for putative
chimeras using DECIPHER (Wright et al. 2012) and chimeras were removed before comparing
sequences with those in the Ribosomal Database project (RDP; http://rdp.cme.msu.edu) and
BLASTn (http://blast.ncbi.nlm.nih.gov). Sequences were aligned with related sequences in the
database using ClustalX version 2.1 (Larkin et al. 2007). Phylogenetic analysis was performed
using programs found in the PHYLIP software package version 3.695 (Felsenstein et al., 1995).
The aligned sequences were bootstrapped 1,000 times using SEQBOOT and a DNA distance
matrix calculated with DNADIST using the Kimura 2-parameter model. Phylogenetic trees were
then created using the Fitch-Margoliash method in FITCH, and a consensus tree was constructed
using CONSENSE. Trees were displayed using TREEVIEW version 1.6.6.
7.4 Results and discussion
7.4.1 Enumeration of microbial population
In this work, the microbial diversity of 10 spoiled pizza samples was studied. The
samples were examined for the presence of mesophilic aerobic bacteria (MAB), mesophilic
anaerobic bacteria (MANB), lactic acid bacteria (LAB), molds and yeasts (M+Y) (Table 7.3).
MAB varied from 6.5 × 10⁵ to 2.2 × 10
7 CFU g
-1 with 40% of the samples having counts of
about 106 CFUg
-1. MANB counts ranged from less than 10
1 to 2.7 × 10
2. These numbers are
considerably lower than MANB counts 1.6 × 10⁴ reported by Rodríguez et al. (2003) in study of
the shelf life of pre-baked pizza dough. In all preformed pizza samples, counts of LAB ranged
between 1.2 × 10²
and 1.6 × 10⁴ CFU g
-1. This was in agreement with 1.0 × 10
4 CFU g
-1 which
was reported as enumerated LAB in the previous study by Rodríguez et al. (2003). However,
another study (Ricciardi et al. 2005) showed that LAB counts ranged from 107 and 10
8 CFU g
-1
in fermented bread. Since LAB is used to produce this fermented product, it is expected to find
more LAB counts on the product.

82
The fungal counts in the current study are higher, ranging from 3.95 × 10⁴ to 9.17 × 10
5
CFU g-1
(Table 7.3). These counts are comparable with those reported by Rodríguez et al. (2000)
which indicated yeasts and molds counts in the range of 3.78 to 6.09 log CFU g-1
in sliced wheat
flour bread (with preservative) after 18 days of storage at room temperature. Yeast numbers
depend especially on the inoculation ratio of the dough. It was shown by Hammes et al. (2005)
that regardless of the inoculum’s origin, yeasts in dough may originate from the flour or the other
ingredients of the dough and from the bakery environment.
Table 7.3 Microbial populations in spoiled pre-formed pizza. Data are the results of the microbiological
analysis of 10 samples.
Samples Microbial populations (log CFU g
-1)
MAB MANB LAB Y+M
1 6.8 1.6 2.5 5.3
2 7.1 <1 3.0 5.2
3 6.1 <1 2.1 4.9
4 6.0 1.8 2.1 4.6
5 7.4 2.4 2.9 5.2
1 5.9 <1 2.1 5.4
2 6.8 <1 4.2 5.6
3 5.8 <1 2.9 6.0
4 6.5 1.8 3.0 5.9
5 7.2 1.2 2.71 5.8
Average 6.6±0.5 2.8±0.6 5.4±0.4 Mean values of the CFU g
-1 for each sample, analyzed in triplicate, are reported. Refer to materials and
methods for media specifications and incubation conditions.
7.4.2 Identification of LAB isolates
Isolates of LAB from spoiled pizza samples were identified based on the fermentation of
carbohydrates. Identification tables were prepared as (+/-) according to colour change in
evaluation of results of API strips reactions. Numerical profiles of strains were identified by
adding positive values in indicative table. The biochemical profile obtained for each isolate was
determined using the APIWEB identification software and database Smith et al. (1994) reported
that LAB, particularly Leuconostoc mesenteroides, were responsible for the spoilage of crumpets

83
packed in CO2:N2 (3:2). In the present study, Lactobacillus plantarum and Pediococcus
acidilactici were found as the dominant LAB strains in 10 samples (Table 7.4). (Robert, Gabriel,
& Fontagné-Faucher, 2009) also found these two species together with other LAB when they
studied the biodiversity of lactic acid bacteria in French wheat sourdough. (V. Rodríguez et al.,
2003) identified the following genera in prebaked pizza dough: Leuconostoc (L. mesenteroides),
Pediococcus and Lactobacillus. Indeed, several factors including the degree of dough hydration,
the type of cereal used and the leavening temperature result in the vast variability in the numbers
and types of species found in bakery products (De Vincenzi et al., 1994). In addition, factors
resulting from substrates present in the cereal fraction and from endogenous and microbial
enzymes add to this unpredictability (De Vuyst and Neysens, 2005).
Table 7.4 Identification of LAB by biomedical analysis. Biomedical profile was compared with the
closest relatives in the APIWEB database. One replicate per sample were used.
Sample NO. Closest match Confidence level (%)
1 Lactobacillus plantarum 98
2 Lactobacillus plantarum 94
3 Pediococcus acidilactici 96
4 Lactobacillus plantarum 94
5 Pediococcus acidilactici 96
6 Pediococcus acidilactici 90
7 Pediococcus acidilactici 94
8 Pediococcus acidilactici 90
9 Pediococcus acidilactici 88
10 Pediococcus acidilactici 88
7.4.3 Concentration and purity of the isolated DNA after Extraction
The DNA concentration and purity of each extract DNA from spoiled samples are
reported in Table 7.4. The A260/280 ratio (absorbance at 260 nm / absorbance at 280 nm) and the
A260/230 ratio (absorbance at 260 nm / absorbance at 230 nm) are used to evaluate the purity of
DNA extracts. An A260/280 ratio >1.8 and A 260/230 ratio between 2.0 and 2.2 is recognized as an
indication of the purity of DNA solutions and extracts. When the A260/280 ratio is lower than 1.8
and the A260/230 ratio is lower than 2, proteins, carbohydrates, phenol and other contaminants that
absorb at or near 280 or 230 nm may be present (Pakpour, 2012). According to this information,

84
purity of sample number 3, 5, 6, 7, 9, 10, 11, 12 are acceptable, however sample number 1, 2, 4,
8 might have some impurities and contaminants. Overall, concentration of the samples is low and
needed to be increased through purification step.
Table 7.5 Concentration and purity of extracted DNA from spoiled samples
Sample number Concentration
(ng/µl) A260/280 ratio A260/230 ratio
1 11.3 1.68 0.31
2 10.4 1.58 0.06
3 10.3 1.92 0.65
4 25.5 1.49 0.48
5 14.7 2.04 0.50
6 4.7 2.08 0.36
7 6.2 2.03 0.06
8 7.3 1.56 0.39
9 9.4 2.54 0.76
10 9.1 2.23 0.05
11 4.6 2.15 1.49
12 2.9 2.6 0.2
Extracted DNA was subsequently verified for their quality and shearing by running on agarose
gel electrophoresis. The result is not shown as the gel only contained dimers; it could have been
because of low concentrations of DNA as it is shown in Table 7.5.
7.4.4 Temperature gradient PCR
Temperature gradient PCR assays were performed to determine the proper annealing
temperature for primer sets A and B. Results illustrated that the optimal annealing temperatures
are 50 and 58°C for primer set A and B, respectively, based on the intensity of the DNA bands
and presence of only one amplicon obtained in these temperatures (Figure 7.1).

85
7.4.5 Conventional PCR on spoiled samples
Fungal 18S rDNA was amplified from extracted genomic DNA (from spoiled pizza
samples) using PCR primer sets A and B. Since primer set B generated a more intense band
when stained with ethidium bromide, it was selected for the rest of the PCR reactions in the
present experiment (Figure 7.1). Due to the fact that no product was obtained for the samples
number 4, 6, 7 and 10, these samples were excluded from the remaining part of the experiment
(Figure 7.2).

86
A
B
Figure 7.1 Temperature Gradient PCR for by perimer set A (A) and primer set B (B). Two
replicates per temperature are used. Ladder shows 100 to 1,000 bp.

87
Figure 7.2 PCR performed on spoiled samples using primer set B with 58°C annealing
temperature. Two replicates per temperature are used. Ladder shows 100 to 1,000 bp.
Ladder

88
7.4.6 Concentration and purity of PCR products
The PCR products were purified and the concentration of the isolated DNA after
purification is shown in Table 7.6. As it was mentioned before, the concentration (ng/µl), A260/280
ratio and the A260/230 ratio are used to evaluate the purity of PCR products. An A260/280 ratio >1.8
and A 260/230 ratio between 2.0 and 2.2 is recognized as an indication of the purity of DNA
solutions and extracts. When the A260/280 ratio is lower than 1.8 and the A260/230 ratio is lower than
2, proteins, carbohydrates, phenol and other contaminants that absorb at or near 280 or 230 nm
may be present (Pakpour, 2012). According to this information, almost all of the samples in
Table 7.6 shows an acceptable purity based on A260/280 ratio.
Table 7.6 Concentration and purity of the purified PCR products spoiled samples.
Samples number Concentration (ng/µl) A260/280 ratio A260/230 ratio
1 9 2.47 0.02
2 36 1.30 0.01
3 37 1.72 0.07
5 23 1.86 0.04
8 39.5 1.93 0.05
9 6.6 1.83 0.07
11 53 1.85 0.45
12 8.1 1.81 0.05
7.4.7 18S rDNA clone libraries
Amplicons from primer set B were cloned into the pGEM-T Easy vector and screened on
LB agar with X-gal and IPTG. Four to six clones per sample were screened for the presence of
the insert prior to sequencing using the M13 primers. A total of 28 amplified PCR products from
these clones were sent for sequencing based on their size (primer set C, Table 7.1).

89
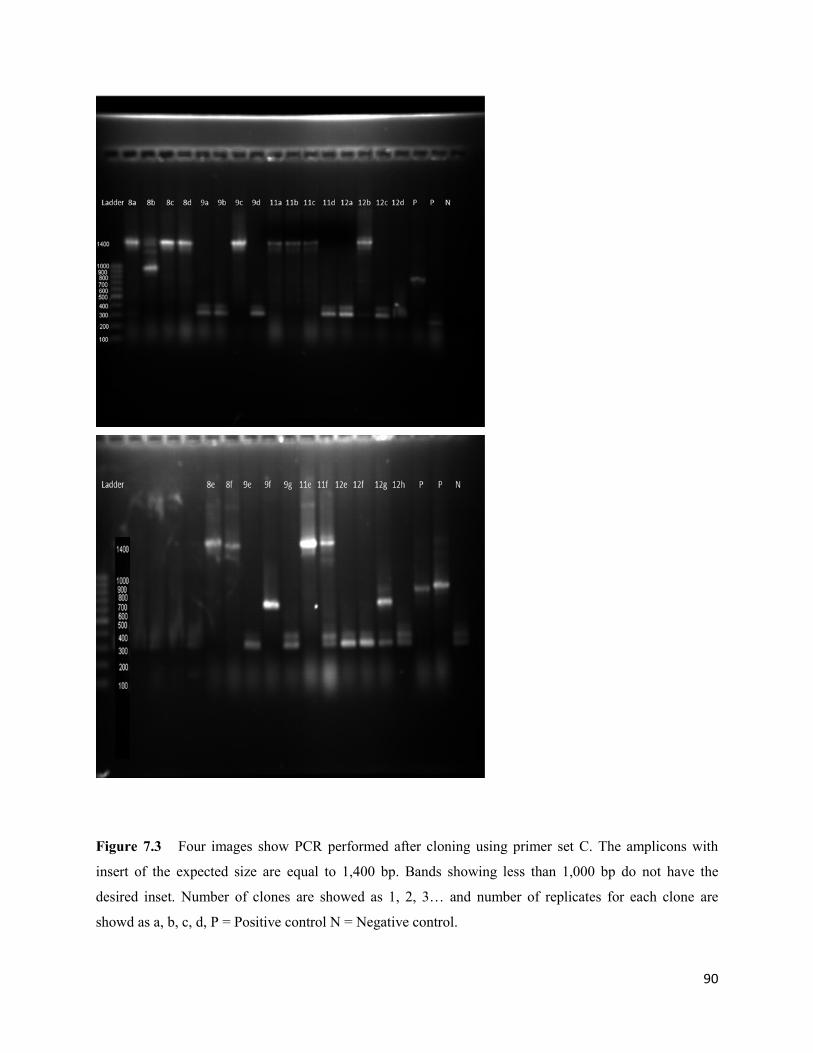
90
Figure 7.3 Four images show PCR performed after cloning using primer set C. The amplicons with
insert of the expected size are equal to 1,400 bp. Bands showing less than 1,000 bp do not have the
desired inset. Number of clones are showed as 1, 2, 3… and number of replicates for each clone are
showd as a, b, c, d, P = Positive control N = Negative control.
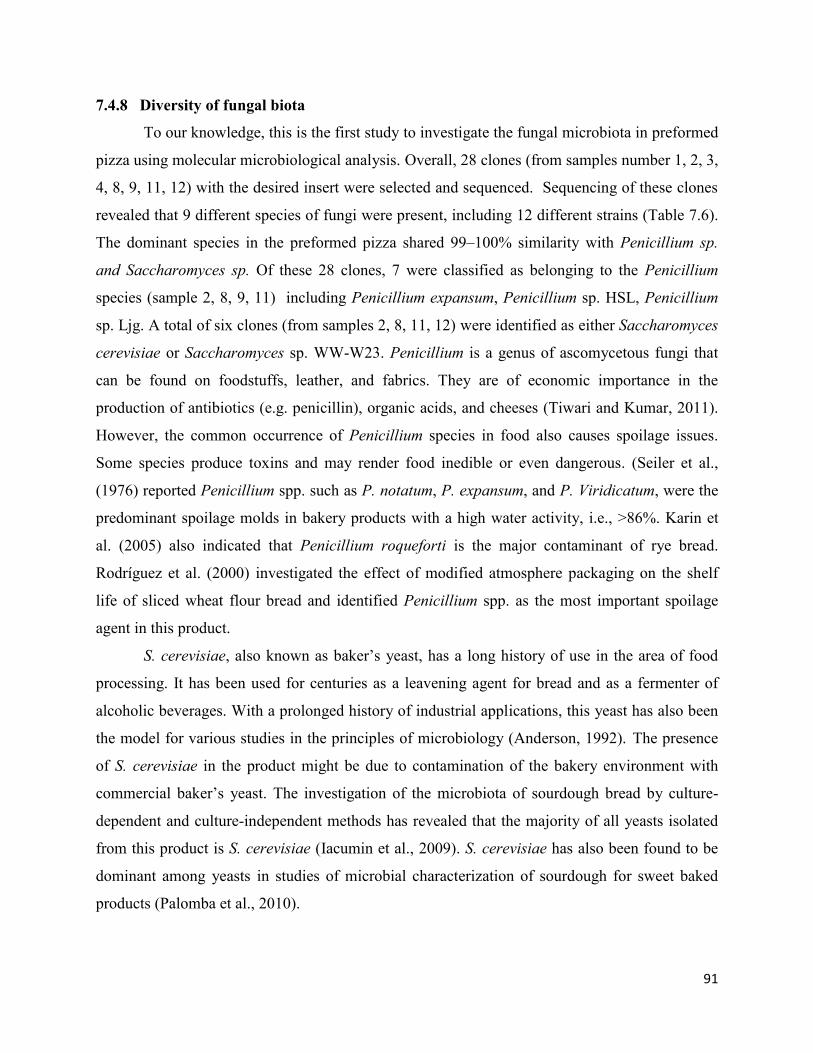
91
7.4.8 Diversity of fungal biota
To our knowledge, this is the first study to investigate the fungal microbiota in preformed
pizza using molecular microbiological analysis. Overall, 28 clones (from samples number 1, 2, 3,
4, 8, 9, 11, 12) with the desired insert were selected and sequenced. Sequencing of these clones
revealed that 9 different species of fungi were present, including 12 different strains (Table 7.6).
The dominant species in the preformed pizza shared 99–100% similarity with Penicillium sp.
and Saccharomyces sp. Of these 28 clones, 7 were classified as belonging to the Penicillium
species (sample 2, 8, 9, 11) including Penicillium expansum, Penicillium sp. HSL, Penicillium
sp. Ljg. A total of six clones (from samples 2, 8, 11, 12) were identified as either Saccharomyces
cerevisiae or Saccharomyces sp. WW-W23. Penicillium is a genus of ascomycetous fungi that
can be found on foodstuffs, leather, and fabrics. They are of economic importance in the
production of antibiotics (e.g. penicillin), organic acids, and cheeses (Tiwari and Kumar, 2011).
However, the common occurrence of Penicillium species in food also causes spoilage issues.
Some species produce toxins and may render food inedible or even dangerous. (Seiler et al.,
(1976) reported Penicillium spp. such as P. notatum, P. expansum, and P. Viridicatum, were the
predominant spoilage molds in bakery products with a high water activity, i.e., >86%. Karin et
al. (2005) also indicated that Penicillium roqueforti is the major contaminant of rye bread.
Rodríguez et al. (2000) investigated the effect of modified atmosphere packaging on the shelf
life of sliced wheat flour bread and identified Penicillium spp. as the most important spoilage
agent in this product.
S. cerevisiae, also known as baker’s yeast, has a long history of use in the area of food
processing. It has been used for centuries as a leavening agent for bread and as a fermenter of
alcoholic beverages. With a prolonged history of industrial applications, this yeast has also been
the model for various studies in the principles of microbiology (Anderson, 1992). The presence
of S. cerevisiae in the product might be due to contamination of the bakery environment with
commercial baker’s yeast. The investigation of the microbiota of sourdough bread by culture-
dependent and culture-independent methods has revealed that the majority of all yeasts isolated
from this product is S. cerevisiae (Iacumin et al., 2009). S. cerevisiae has also been found to be
dominant among yeasts in studies of microbial characterization of sourdough for sweet baked
products (Palomba et al., 2010).

92
Rhodotorula mucilaginosa was the third most frequently fungus identified in this study,
with 5 clones (samples 1, 2, 11) sharing high identity (100%) with this species (Table 7.6). This
microorganism is an anamorphic genus of heterobasidiomycetous yeasts, existing normally in air
and soil. Rhodotorula species can also be isolated from human skin, stool, food and fruits and
produce pink, orange and red pigments (Kreger-Van Rij, 1984). Red yeasts are the predominant
yeasts recognized in many studies of food products and are primarily members of the genera
Rhodotorula, Rhodosporidium and Sporobolomyces (Hagler et al., 1987). Although most species
of the genus Rhodotorula are nonpathogenic, some of them are infectious (Mokhtari et al., 2011).
Rhodotorula is characterized by: no ballistoconidia, no fermentation ability, no starch-like
compounds, and no xylose in whole-cell hydrolyzates (Nagahamaet al., 2001).
Three colonies from sample 3 shared a similarity of 99-100% with yeast Monascus
fuliginosus. This microorganism is a species of fungus belonging to the genus Monascus van
Teighem. Species of this genus are commercially important in the production of various Asian
fermented foods, e.g. red-rice and food-colouring pigments (Steinkraus, 1984). Monascus
fuliginosus van Tieghem is a cosmopolitan fungus found in soil, cooked potatoes, soya, sorghum,
tobacco, rice, oat and silage (Moharram et al., 2011).
A single clone from sample number 1 shared 99% identity with Hordeum jubatum
(foxtail barley). This plant is a short-lived perennial plant species indigenous to western North
America that has become naturalized in eastern North America. It is most prevalent in soils with
a high water table and high salinity (Kemuel et al., 1988).
Clone 27 from sample 4 had a high level of identity (99%) with Galactomyces
geotrichum. Galactomyces is an arthroconidial ascomycetous genus (Kurtzman and Robnett,
1998; Ueda-Nishimura et al., 2000). G. geotrichum is considered as a plant pathogen and is a
common post-harvest fungus disease of citrus known as sour rot (Pimenta et al., 2005).
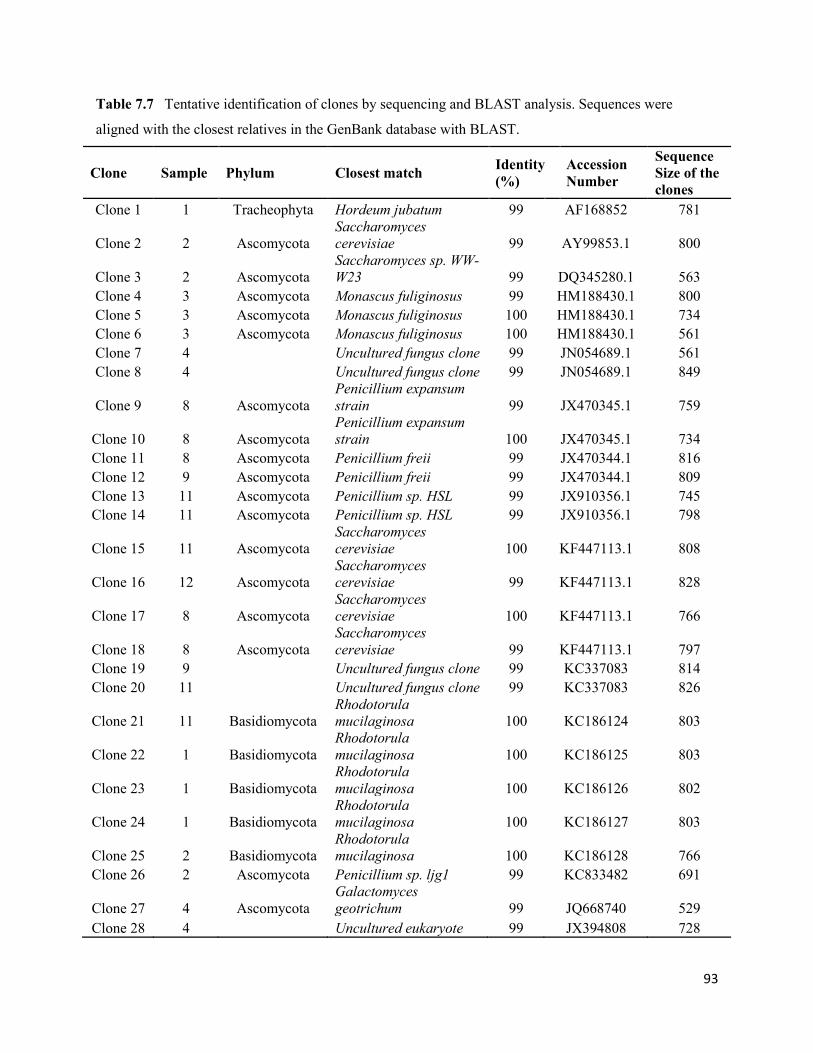
93
Table 7.7 Tentative identification of clones by sequencing and BLAST analysis. Sequences were
aligned with the closest relatives in the GenBank database with BLAST.
Clone Sample Phylum Closest match Identity
(%)
Accession
Number
Sequence
Size of the
clones
Clone 1 1 Tracheophyta Hordeum jubatum 99 AF168852 781
Clone 2 2 Ascomycota
Saccharomyces
cerevisiae 99 AY99853.1 800
Clone 3 2 Ascomycota
Saccharomyces sp. WW-
W23 99 DQ345280.1 563
Clone 4 3 Ascomycota Monascus fuliginosus 99 HM188430.1 800
Clone 5 3 Ascomycota Monascus fuliginosus 100 HM188430.1 734
Clone 6 3 Ascomycota Monascus fuliginosus 100 HM188430.1 561
Clone 7 4
Uncultured fungus clone 99 JN054689.1 561
Clone 8 4
Uncultured fungus clone 99 JN054689.1 849
Clone 9 8 Ascomycota
Penicillium expansum
strain 99 JX470345.1 759
Clone 10 8 Ascomycota
Penicillium expansum
strain 100 JX470345.1 734
Clone 11 8 Ascomycota Penicillium freii 99 JX470344.1 816
Clone 12 9 Ascomycota Penicillium freii 99 JX470344.1 809
Clone 13 11 Ascomycota Penicillium sp. HSL 99 JX910356.1 745
Clone 14 11 Ascomycota Penicillium sp. HSL 99 JX910356.1 798
Clone 15 11 Ascomycota
Saccharomyces
cerevisiae 100 KF447113.1 808
Clone 16 12 Ascomycota
Saccharomyces
cerevisiae 99 KF447113.1 828
Clone 17 8 Ascomycota
Saccharomyces
cerevisiae 100 KF447113.1 766
Clone 18 8 Ascomycota
Saccharomyces
cerevisiae 99 KF447113.1 797
Clone 19 9
Uncultured fungus clone 99 KC337083 814
Clone 20 11
Uncultured fungus clone 99 KC337083 826
Clone 21 11 Basidiomycota
Rhodotorula
mucilaginosa 100 KC186124 803
Clone 22 1 Basidiomycota
Rhodotorula
mucilaginosa 100 KC186125 803
Clone 23 1 Basidiomycota
Rhodotorula
mucilaginosa 100 KC186126 802
Clone 24 1 Basidiomycota
Rhodotorula
mucilaginosa 100 KC186127 803
Clone 25 2 Basidiomycota
Rhodotorula
mucilaginosa 100 KC186128 766
Clone 26 2 Ascomycota Penicillium sp. ljg1 99 KC833482 691
Clone 27 4 Ascomycota
Galactomyces
geotrichum 99 JQ668740 529
Clone 28 4 Uncultured eukaryote 99 JX394808 728

94
7.5 Conclusion
Based on culture dependant analysis, a scale of the number of colony forming units of
observed microorganisms was determined. In decreasing order of size, the scale is as follows:
mesophilic aerobic bacteria (MAB), molds and yeasts (M+Y), mesophilic anaerobic bacteria
(MANB), and finally lactic acid bacteria (LAB). Based on biochemical analysis, Lactobacillus
plantarum, Pediococcus acidilactici were identified as LAB isolate in the product. Analysis of
the clone libraries using cultivation-independent techniques revealed low diverse fungi
comunities in preformed pizza samples. The microbiota, as revealed by PCR-cloning, was
composed of mold affiliated to Penicillium genus and yeast affiliated to the Saccharomyce and
Rhodotorula genus. Preformed pizza is a popular food for all categories of people, including
children, the elderly and it is considered unsafe for such people when the product with a high
count of bacteria is consumed. Beside safety issues, pizza spoilage contributes to the annual loss
of bakery product as a staple food around the world. This emphasizes the importance of quality
control procedures aimed at reducing spoilage microorganism (particularly mold and yeast)
counts in bread. Classical microbiology as well as modern genetic methods, such as PCR-cloning
and sequencing can be useful in tracking the spoiling agents within and after the baking process
and in understanding the role of different microorganisms in spoilage of the pizza.
7.6 REFERENCES
Anderson, A. 1992. Yeast genome project: 300,000 and counting.
Badger, S., & Ungar, I. A. (1989). The effects of salinity and temperature on the germination of the inland
halophyte Hordeum jubatum, (Ungar 1984).
De Vincenzi S, Gobbetti M, Corsetti A, Rossi J, La Rosa F (1994). Identification and clustering of LAB
and yeasts from wheat sourdoughs of central Italy. Ital. J. Food Sci., 6: 85-94.
Dorigo, U., Volatier, L., Humbert, J.-F., 2005. Molecular approaches to the assessment of biodiversity in
aquatic microbial communities. Water Research 39 (11), 2207- 2218.
De Vuyst L, Vancanneyt M (2007) Biodiversity and identification of sourdough lactic acid bacteria. Food
Microbiol 24:120–127
Diez B, Pedros-Alio C, Massana R (2001) Study of Genetic Diversity of Eukaryotic Picoplankton in
Different Oceanic Regions by Small-Subunit rRNA Gene Cloning and Sequencing. Applied and
Environmental Microbiology 67:2932- 2941

95
De Vuyst L, Vandamme P & Huys G (2007) Influence of geographical origin and flour type on diversity
of lactic acid bacteria in traditional Belgian sourdoughs. Appl Environ Microb 73: 6262–6269.
Felsenstein J (1995) Confidence limit on phylogenies: an approach using the bootstrap. University of
Washington, Seattle . Evolution 39: 783–791
Ghanbari M, Rezaei M, Jami M, Nazari RM (2009). Isolation and characterization of Lactobacillus
species from intestinal contents of beluga (Huso huso) and Persian sturgeon (Acipenser persicus).
Iran. J. Vet. Res., 10: 152-157.
Hammes WP, Brandt MJ, Francis KL, Rosenheim J, Seitter MFH & Vogelmann SA (2005) Microbial
ecology of cereal fermentations. Trends Food Sci Tech 16: 4–11.
Hagler, A.N. and D.G. Ahearn (1987) Ecology of aquatic yeasts. In: Rose AH and Harrison JS (Eds) The
yeasts, second edition, vol. 1 (pp. 181–205). Academic Press, London, United Kingdom.
Iacumin, L., Cecchini, F., Manzano, M., Osualdini, M., Boscolo, D., Orlic, S., & Comi, G. (2009).
Description of the microflora of sourdoughs by culture-dependent and culture-independent methods.
Food microbiology, 26(2), 128–35.
KARIN I. SUHR. (2005). Food Microbiology and Safety Inhibition of Fungal Growth on Wheat and Rye
Bread by Modified Atmosphere Packaging and Active Packaging Using, 70(1).
Kreger-van Rij, N. J. W. (1984). Systems of classification of the yeasts. In: Kreger-van Rij, N. J. W. (ed.).
The Yeasts: A Taxonomic Study Third revised and enlarged edition El- sevier. Amsterdam
Kurtzman, C. P. & Robnett, C. J. (1998). Identification and phylogeny of ascomycetous yeasts from
analysis of nuclear large subunit (26S) ribosomal DNA partial sequences. Antonie van
Leeuwenhoek 73, 331–371.
Larkin M, Blackshields G, Brown N, Chenna R, McGettigan PA, McWilliam H, et al. Clustal W and
Clustal X version 2.0. Bioinformatics 2007;23:2947-8.
Lemarchand, K., Berthiaume, F., Maynard, C., Harel, J., Payment, P., Bayardelle, P., Masson, L. and
Brousseau, R. (2005) Optimization of microbial DNA extraction and purification from raw
wastewater samples for down-stream pathogen detection by microarrays. Journal of Microbiological
Methods, 63, 115-126
Messing, J., Vieira, J., Biochemistry, D., Paul, S., & Mn, U. S. A. (1982). A new pair of Ml3 vectors for
selecting either DNA strand of double-digest strategy) DNA phage inserts with controlled
orientation resiction fragments multiple cloning sites sequencing The strategy of shotgun cloning
with Ml3 is based on obtaini, 19, 269–276.
Moharram, A. M., M, E. M., & Ismail, M. A. (2011). Chemical Profile of Monascus ruber Strains. Food
Technology and Biotechnology, Vol.50 No.4 .490- 499

96
Mokhtari, M., Etebarian, H. R., Mirhendi, S. H., & Razavi, M. (2011). Identification and phylogeny of
some species of the genera Sporidiobolus and Rhodotorula using analysis of the 5.8s rDNA gene
and two ribosomal internal transcribed spacers. Archives of Biological Sciences, 63(1), 79–88.
Nagahama, T., Hamamoto, M., Nakase, T., Takami, H., & Horikoshi, K. (2001). Distribution and
identification of red yeasts in deep-sea environments around the northwest Pacific Ocean. Antonie
van Leeuwenhoek, 80(2), 101–10.
Pakpour, S. (2012). A multi-criteria decision-making approach for comparing sample preservation and
DNA extraction methods from swine feces. American Journal of Molecular Biology, 02(02), 159–
169.
Palomba, S., Blaiotta, G., Ventorino, V., Saccone, A., & Pepe, O. (2010). Microbial characterization of
sourdough for sweet baked products in the Campania region (southern Italy) by a polyphasic
approach. Annals of Microbiology, 61(2), 307–314.
Pimenta, R. S., Alves, P. D. D., Corrêa, A., Lachance, M.-A., Prasad, G. S., Rajaram, … Rosa, C. a.
(2005). Geotrichum silvicola sp. nov., a novel asexual arthroconidial yeast species related to the
genus Galactomyces. International journal of systematic and evolutionary microbiology, 55(Pt 1),
497–501.
Pinho, B. H., & Furlong, E. B. (2000). The occurrence of molds, yeasts and mycotoxins in pre-cooked
pizza dough sold in Southern Rio Grande do Sul. Brazilian Journal of Microbiology, 31(2), 99–102.
Ricciardi A, Parente E, Piraino P, Paraggio M, Romano P (2005). Phenotypic characterisation of LAB
from sourdoughs for Altamura bread production in Apulia (Southern Italy). Int. J. Food Microbiol.,
98: 63-72.
Robert, H., Gabriel, V., & Fontagné-Faucher, C. (2009). Biodiversity of lactic acid bacteria in French
wheat sourdough as determined by molecular characterization using species-specific PCR.
International journal of food microbiology, 135(1), 53–9.
Rodríguez, M., Medina, L. M., & Jordano, R. (2000). Effect of modified atmosphere packaging on the
shelf life of sliced wheat flour bread. Die Nahrung, 44(4), 247–52.
Rodríguez, V., Medina, L., & Jordano, R. (2003). Influence of modified atmosphere packaging on the
shelf life of prebaked pizza dough with and without preservative added. Die Nahrung, 47(2), 122–5.
Sana, M., Mejri, M., & Hamdi, M. (2007). Microflora distribution and species ratio of Tunisian fermented
doughs for bakery industry, 6(September), 2122–2129.
Steinkraus, K.H. (ed.) 1984 Handbook of IndigenousFermented Foods. New York & Basel: Marcel
Dekker.
Tiwari, K. L., Jadhav, S. K., & Kumar, A. (2011). Morphological and Molecular Study of Different
Penicillium Species, 7(2), 203–210.
Terzaghi B.E., Sandine W.E. 1975. App. Microbiol. 29: 807–813
97
Ueda-Nishimura, K. & Mikata, K. (2000). Two distinct 18S rDNA secondary structures in Dipodascus
(Hemiascomycetes). Microbiology 146, 1045–1051.
Wu, Z., Wang, X.-R., & Blomquist, G. (2002). Evaluation of PCR primers and PCR conditions for
specific detection of common airborne fungi. Journal of Environmental Monitoring, 4(3), 377–382.

98
CHAPTER 8
GENERAL SUMMARY & CONCLUSION
Preformed pizza is a popular food for all categories of people, including children and the
elderly. It is considered unsafe for people when the product with a high count of mold is
consumed. Beside safety issues, pizza spoilage contributes to the annual loss of bakery product
as a staple food around the world. This emphasizes the importance of quality control procedures
aimed at reducing spoilage microorganisms (particularly mold and yeast) counts in bakery
products. The industry is constantly looking for new preservation technologies to ensure the
safety of ready-to-eat bread and pizza products, while maintaining their organoleptic properties.
One such approach is pulsed UV-light treatment.
Preliminary studies showed that voltage, treatment time (number of pulses), distance
from the pulsed UV-light source, and position in the pulsed UV-light source treatment chamber
play a significant role in the destruction of Penicilium roqueforti as one of the predominant
spoiling molds in baked products. Maximum destruction was achieved at high voltage and
minimum distance from the pulsed UV-light source. However, due to the increase in treatment
area as the distance from the pulsed UV-light source increases, sample surface area must be
considered before choosing the appropriate combination of pulsed UV-light factors.
Different inoculation methods including the random spot and spread methods were
investigated. The results showed that depending on the feasibility of each method, both random
spot and spread methods can be selected for inoculating mold onto the sample surface.
Parameters which need to be considered in choosing the best inoculation method are detectability
of mold grouping and homogeneity of the colonies’ distribution on the surface of the substrate.
Three sets of pulsed UV light treatments were applied on pizza samples, namely 500 V, 1
min (minimum treatment); 750 V, 5 min (intermediate treatment) and 1,000 V, 10 min
(maximum treatment). The results showed that 8, 32, and 40% of pizza samples were mold-free
after the 40 days storage with minimal, intermediate and maximal pulsed UV-light treatment,
respectively. The bread samples were inoculated with Penicilium roqueforti, and treated with
different pulsed UV input voltage (500 and 1,000 V), treatment time (2 and 7 min) and distance
from the light source (5 and 15 cm). Samples treated with the more intense voltage (1,000 V)
showed steady surviving population less than 102
CFU g-1
over the storage time of 21 days.

99
However, 500 V treated breads and controls showed growth on every analysis day (more than
103
CFU g-1
). Yet, many irregularity and unpredictability in the results had been seen especially
when treatments with lower level of voltage input were performed. This inconsistency might be
because of the non-homogeneous nature of the vegetative cell inoculum and of the irregularity of
the surface of pizza samples. Therefore, a more homogeous source of inoculum such as spore
suspension has to be applied in future experiments in order to observe more consistent and
reliable inactivation results corresponding to the level of pulsed light intensity, even at lower
levels.
The effectiveness of a pulsed UV light was evaluated for the decontamination of P.
roqueforti on the surface of solid agar using the process parameters of treatment time (1, 3, 5, 7
and 10 min) and voltage input (500, 750 and 1,000 V). As a result, the most effective treatment
condition for inactivating this mold was 1,000 V for 10 min. The population of P. roqueforti was
reduced after 10 min of exposure to pulsed light by 3.74, 5.36 and 6.14 log CFU ml-1
,
respectively at 500, 750 and 1,000 V. The experimental data also suggest that inactivation of
Penicillium roqueforti by pulsed UV light does not appear to follow first-order kinetics. On the
other hand, the inactivation kinetics of the tested microorganisms on solid agar was best
described by the Weibull model with the smallest RMSE (Root Mean Squared Error) and R2
≥
0.92. RMSE of Weibull model for 500, 750 and 1,000 V were 0.1374, 0.8163 and 0.824,
respectively.
Culture-dependent and independent methods were applied to study the ecology of
preformed pizza. Based on culture-dependent analysis, the average population of mesophilic
aerobic bacteria (MAB), mesophilic anaerobic bacteria (MANB), lactic acid bacteria (LAB), and
molds and yeasts (M+Y) were 6.5±0.5, less than 2.43, 2.7±0.6 and 5.3±0.4 log CFU g-1
,
respectively. Based on biochemical analysis, Lactobacillus plantarum and Pediococcus
acidilactici were identified as LAB isolates in the product. Analysis of the clone libraries using
cultivation-independent techniques revealed low diverse fungi communities in preformed pizza
samples. The microbiota, as revealed by PCR-cloning, was composed of mold affiliated to
Saccharomyces cerevisiae, Saccharomyces sp. WW-W23, Penicillium expansum, Penicillium
freii, Penicillium sp. HSL, Penicillium sp. ljg1, Rhodotorula mucilaginosa, Monascus
fuliginosus, Hordeum jubatum, and Galactomyces geotrichum strains.
.

100
Pulsed UV light irradiation was very effective at inactivating the spores of Penicillium
roqueforti; however, the dose of energy per pulse and the position of xenon lamp will determine
the lethality. Moreover, decontamination by pulsed UV-light has to account for possible
interactions between the target surface and the microorganism. Therefore, further research on the
influence of pulsed light on foods with more complex composition is needed to define the
applicability of the technology in decontamination processes.
Future Recommendations
The voltages used in this study did not eliminate the population of P. roqueforti on the surface of
pre-formed pizza; therefore, in order to improve the microbial load reduction by pulsed UV-light
treatment, further studies utilizing higher voltages (1,000-3,500 V) seem to be necessary. In
addition, the advantage of using higher voltages is a decrease in the treatment time, which is
desirable for commercial purposes. The present studies have focused on the pulsed UV-light
destruction of P. roqueforti as it is one of the main concerns in shelf stable bakery products.
However, it would be advantageous to obtain pulsed UV-light destruction kinetics for other mold
and yeast strains that cause spoilage in these types of product.