shef: fy 2017 - sheeo.org · sheeo: state higher education finance: fy 2017 3 acknowledgements we...
TRANSCRIPT
SHEF: FY 2017 STATE HIGHER EDUCATION FINANCE

SHEEO: STATE HIGHER EDUCATION FINANCE: FY 2017 2
© 2018 State Higher Education Executive Officers
The State Higher Education Executive Officers is the national association of the chief executives of statewide governing, policy, and coordinating boards of postsecondary education. Founded in 1954, SHEEO serves its members as an advocate for state policy leadership, a liaison between states and the federal government, a vehicle for learning from and collaborating with peers, a manager of multistate teams to initiate new programs, and as a source of information and analysis on educational and public policy issues. SHEEO seeks to advance public policies and educational practices to achieve more widespread access to and completion of higher education, more discoveries through research, and more applications of knowledge that improve the quality of human lives and enhance the public good.
An electronic version of this report, State Higher Education Finance (SHEF) FY 2017, and numerous supplementary tables containing extensive state-level data are available at www.sheeo.org. These may be freely used with appropriate attribution and citation. In addition, core data and derived variables used in the SHEF study for fiscal years 1992 through 2017 are available on the SHEEO website, along with interactive data visualizations via Tableau.
SHEEO: STATE HIGHER EDUCATION FINANCE: FY 2017 3
ACKNOWLEDGEMENTS
We are pleased to present the fifteenth annual SHEEO State Higher Education Finance (SHEF) study of state support for higher education. For the fourth consecutive year, we continue to make improvements to the look, feel, and presentation of the SHEF report and through additional features on the SHEF webpage (www.sheeo.org/shef). We hope these changes provide additional utility as SHEF becomes a resource used year-round by staff at our member agencies, policymakers, researchers, and the media who report on higher education issues. Of course, SHEF’s underlying data provide the real strength of this project and no changes were made to the data or its basic presentation in the report. SHEEO developed the SHEF study building directly on a 25-year effort by Kent Halstead, an analyst and scholar of state policy for higher education, and the SHEF dataset now extends from 1980 to 2017.
Sophia Laderman, Senior Policy Analyst, led the SHEF project and was the primary author of the report with continued guidance and support from Andrew Carlson, Vice President of Finance Policy and Member Services. The report would not have been possible without support from the SHEEO staff, particularly:
• John Armstrong, Senior Policy Analyst• Gloria Auer, Executive Assistant and Communications Coordinator• Caitlin Dennis, Grants and Events Coordinator• Jiah Kim, IT Systems and Database Manager• Dustin Weeden, Senior Policy Analyst
We greatly appreciate the dedication and professionalism of Andy Sherman with Can of Creative (www.canofcreative.com), who provided the graphics and design, and Dr. James Palmer at Illinois State University, who heads up the Grapevine survey (www.education.illinoisstate.edu/grapevine).
We are also very grateful for the continued guidance of the 2017 SHEF Advisory Board:
• Allison Bell, Director, HCM Strategists• Russ Deaton, Executive Vice Chancellor for Policy and Strategy,
Tennessee Board of Regents• Jennifer Delaney, Associate Professor of Higher Education, University of Illinois• Gina Deom, Director for Research and Analytics,
Indiana Commission for Higher Education• Thomas Harnisch, Director of State Relations and Policy Analysis,
American Association of State Colleges and Universities• Robert Kelchen, Assistant Professor, Seton Hall University• Phillip Oliff, Research Manager, Fiscal Federalism Initiative,
The Pew Charitable Trusts• James C. Palmer, Professor and Grapevine Editor, Illinois State University• Sarah Pingel, Senior Policy Analyst, Education Commission of the States• Andrew Rauch, Director of Institutional Finance,
Colorado Department of Higher Education• Kenneth Redd, Senior Director of Research and Policy Analysis,
National Association of College and University Business Officers• Thomas Sanford, Finance and Accountability Manager,
Minnesota Office of Higher Education• Marc Webster, Senior Fiscal Policy Advisor,
Washington Student Achievement Council
SHEEO: STATE HIGHER EDUCATION FINANCE: FY 2017 4
Last but certainly not least, SHEEO is deeply indebted to the staff of state higher education agencies who annually provide the state-level data essential for the preparation of this report. Without their diligence and commitment, this project would not be possible. A number of SHEF data providers went above and beyond this year to help us explore the possibility of adding new variables to the regular SHEF collection. We thank the following data providers for completing the SHEF supplemental surveys:
• Dina Advani, New Mexico Higher Education Department• Nora Amyot, The State University of New York• Jim Bennett, Ohio Department of Higher Education• Brad Berg, Board of Regents, State of Iowa• Ed Buchanan, Texas Higher Education Coordinating Board• Susan Cagle, Alabama Commission on Higher Education• Dominick Chase, Indiana Commission for Higher Education• Tricia Coté, University of Vermont• Sarah Cox, Arkansas Department of Higher Education• Jill Dannemiller, Ohio Department of Higher Education• Sarah deNagy, Florida State University System Board of Governors• Elaine Frisbie, Kansas Board of Regents• Nicholas Fuller, Arkansas Department of Higher Education• Brenda Glynn, University System of New Hampshire• Frieda Houser, Montana Office of the Commissioner of Higher Education• Cathy Huff, Mississippi Institutions of Higher Learning• David Krebsbach, North Dakota University System• Eric Lichtenberger, Illinois Board of Higher Education• Patty Miller, West Virginia Higher Education Policy Commission• Taylor Odle, Tennessee Higher Education Commission
and Student Assistance Corporation• Kelly Oliver, Kansas Board of Regents• John Pearce, Mississippi Institutions of Higher Learning• Matt Petry, Wyoming Community College Commission• Andrew Rauch, Colorado Department of Higher Education• Anthony Reiner, Maryland Higher Education Commission• Nyle Robinson, Illinois Board of Higher Education• Brian Shuppy, Utah System of Higher Education• Thomas Simard, Massachusetts Department of Higher Education• Claire Smith, Wyoming Community College Commission• Tyler Trevor, Montana Office of the Commissioner of Higher Education• Daniel Wagner, Indiana Commission for Higher Education• Marc Webster, Washington Student Achievement Council• David Young, Texas Higher Education Coordinating Board• Yan Zheng, State Council of Higher Education for Virginia
Robert E. Anderson President State Higher Education Executive Officers
Eileen I. Klein President, Arizona Board of Regents Chair, SHEEO Executive Committee
SHEEO: STATE HIGHER EDUCATION FINANCE: FY 2017 5
TABLE OF CONTENTSACKNOWLEDGEMENTS .......................................................................................................................... 3
INDEX OF FIGURES .................................................................................................................................. 6
INDEX OF TABLES .................................................................................................................................... 6
EXECUTIVE SUMMARY .............................................................................................................................7
MEASURES, METHODS, AND ANALYTICAL TOOLS ............................................................................. 9
PRIMARY SHEF MEASURES ................................................................................................................................ 9
ADJUSTMENTS FOR COMPARABILITY ......................................................................................................... 10
DATA USES AND CAUTIONS ............................................................................................................................ 10
CASE STUDY: DATA IMPROVEMENT PROJECT .................................................................................. 12
SOURCES AND USES OF REVENUE ...................................................................................................... 13
NATIONAL TRENDS IN ENROLLMENT AND REVENUE ..................................................................... 16
PRIMARY SHEF METRICS .................................................................................................................................. 18
1. FULL-TIME EQUIVALENT ENROLLMENT (FTE) ........................................................................................ 19
2. EDUCATIONAL APPROPRIATIONS ............................................................................................................ 19
3. NET TUITION REVENUE ...............................................................................................................................20
4. TOTAL EDUCATIONAL REVENUE ...............................................................................................................21
INTERSTATE COMPARISONS ................................................................................................................ 22
1. FULL-TIME EQUIVALENT ENROLLMENT (FTE) ....................................................................................... 23
2. EDUCATIONAL APPROPRIATIONS ........................................................................................................... 25
3. NET TUITION REVENUE .............................................................................................................................28
4. TOTAL EDUCATIONAL REVENUE ...............................................................................................................31
CASE STUDY: OUTCOMES-BASED FUNDING ..................................................................................... 35
STATE WEALTH, TAXES, AND ALLOCATIONS FOR HIGHER EDUCATION ....................................... 37
1. NATIONAL CONTEXT .................................................................................................................................... 37
2. STATE CONTEXT ............................................................................................................................................ 39
CASE STUDY: THE IMPORTANCE OF STATE CONTEXT ..................................................................... 41
CONCLUSION.........................................................................................................................................46

SHEEO: STATE HIGHER EDUCATION FINANCE: FY 2017 6
1. PUBLIC FTE ENROLLMENT AND EDUCATIONAL APPROPRIATIONS PER FTE, U.S., FY 1992-2017 ...........................18
2. STATE PUBLIC AID PER FTE AND AS A PERCENT OF EDUCATIONAL APPROPRIATIONS IN THE U.S., FY 2000-2017 ......................................................................................................................................................................................20
3. NET TUITION AS A PERCENT OF PUBLIC HIGHER EDUCATION TOTAL EDUCATIONAL REVENUE, U.S., FY 1992-2017 ...................................................................................................................................................................................... 21
4. PUBLIC HIGHER EDUCATION FULL-TIME EQUIVALENT (FTE) ENROLLMENT: PERCENT CHANGE, FY 2012-2017 .......................................................................................................................................................................................23
5. PUBLIC HIGHER EDUCATION EDUCATIONAL APPROPRIATIONS PER FTE: PERCENT CHANGE, FY 2012-2017 .......................................................................................................................................................................................26
6. NET TUITION AS A PERCENT OF TOTAL EDUCATIONAL REVENUE, FY 2017 ..................................................................29
7. TOTAL EDUCATIONAL REVENUE PER FTE: PERCENT CHANGE, FY 2012-2017 .............................................................. 31
8. EDUCATIONAL APPROPRIATIONS PER FTE (ADJUSTED): DIFFERENCE FROM U.S. AVERAGE, FY 2017 ..................33
9. TOTAL EDUCATIONAL REVENUE PER FTE (ADJUSTED): DIFFERENCE FROM U.S. AVERAGE, FY 2017 ....................34
10. PERCENT OF STATE SUPPORT ALLOCATED THROUGH OUTCOMES-BASED FUNDING ............................................35
11. HIGHER EDUCATION SUPPORT PER CAPITA BY STATE, FY 2016 ........................................................................................43
12. HIGHER EDUCATION SUPPORT PER $1,000 OF PERSONAL INCOME BY STATE, FY 2016 ......................................... 44
13. PERCENT OF TAX REVENUES ALLOCATED TO HIGHER EDUCATION BY STATE, FY 2015 ...........................................45
INDEX OF FIGURES
INDEX OF TABLES1. STATE AND LOCAL SUPPORT: DISTRIBUTION OF SOURCES AND USES,
U.S., FY 2012-2017 (CURRENT DOLLARS, IN MILLIONS) ........................................................................................................ 15
2. IMPACT OF INFLATION AND ENROLLMENT ON HIGHER EDUCATION FINANCE, U.S., FY 1992-2017 .................... 17
3. PUBLIC HIGHER EDUCATION FULL-TIME EQUIVALENT (FTE) ENROLLMENT ................................................................24
4. EDUCATIONAL APPROPRIATIONS PER FTE (CONSTANT ADJUSTED 2017 DOLLARS) .................................................27
5. PUBLIC HIGHER EDUCATION NET TUITION REVENUE PER FTE (CONSTANT ADJUSTED 2017 DOLLARS) .................................................................................................................................. 30
6. TOTAL EDUCATIONAL REVENUE PER FTE (CONSTANT ADJUSTED 2017 DOLLARS) ...................................................32
7. OUTCOMES-BASED FUNDING STATUS AND EQUITY METRICS .........................................................................................36
8. STATE WEALTH, TAX REVENUES, EFFECTIVE TAX RATES, AND HIGHER EDUCATION ALLOCATIONS, U.S., FY 2005-2015 (CURRENT UNADJUSTED DOLLARS) .....................................................................................................38
9. STATE AND LOCAL GOVERNMENT REVENUES AND FUNDING EFFORT FOR HIGHER EDUCATION, FY 2015 AND FY 2016 ...................................................................................................................................................................... 40

SHEEO: STATE HIGHER EDUCATION FINANCE: FY 2017 7
EXECUTIVE SUMMARY
The State Higher Education Finance (SHEF) report is produced annually by the State Higher Education Executive Officers Association (SHEEO) to broaden understanding of the context and consequences of multiple public policy decisions in each state. These decisions contribute to public higher education funding levels and funding distributions across states and nationally.
Although the cost of college has been rising for students and families, so has the potential economic benefit of earning a postsecondary credential or degree. Greater attention to both the costs and benefits of higher education influences the environment in which political leaders, policymakers, and educators make decisions.
No single report can provide definitive answers to the broad and fundamental questions of state higher education finance policy, but the SHEF report supplies important context and trend analysis to help inform policy decisions. SHEF provides the earliest possible review of state and local support, tuition revenue, and enrollment trends for the most recently completed fiscal year.1
The report includes:
• An explanation of the measures and methods used in the SHEF metrics for analysis;
• A description of the revenue sources and uses for higher education;
• An analysis of national trends in enrollment and revenue;
• Comparisons of the SHEF metrics across states and over time;
• Indicators of state wealth, tax effort, and relative allocations for higher education; and
• A series of case studies that add important context and understanding to the data presented in the report.
This year, the report highlights case studies on our ongoing data improvement project as well as outcomes-based funding and the importance of evaluating state wealth when considering state support for higher education. A summary of the report’s major findings follows.
Overall, 2017 saw a moderate increase in state support for higher education along with a slight increase in tuition revenue and nearly no change in full-time equivalent enrollment.
In 2017, public educational revenues primarily came from state tax and non-tax appropriations ($83.9 billion), local appropriations in 29 states ($10.6 billion), and tuition revenues ($72.3 billion). Full-time equivalent (FTE) enrollment, which peaked during the Great Recession in 2011 and has decreased each year since, decreased by 10,700 FTE and is now at 11 million. Enrollment is up 7.7 percent since before the Great Recession in 2008. On a constant dollar, per-student basis:
• Educational appropriations increased 2.5 percent in 2017. Despite five straight years of increases, educational appropriations per FTE remain $1,000 below 2008 and nearly $2,000 below 2001 levels.
1. NOTE: Generally, years referenced in the body of this publication refer to state fiscal years (FY), which commonly start July 1 and run through June 30 of the following calendar year. For example, FY 2017 includes July 2016 through June 2017. All enrollments are full-time equivalent for an academic year (including summer term). National averages are calculated using the sum of all of the states. For example, the national average per FTE expenditure is calculated as the total of all states’ expenditures divided by the total of all states’ FTEs.
SHEEO: STATE HIGHER EDUCATION FINANCE: FY 2017 8
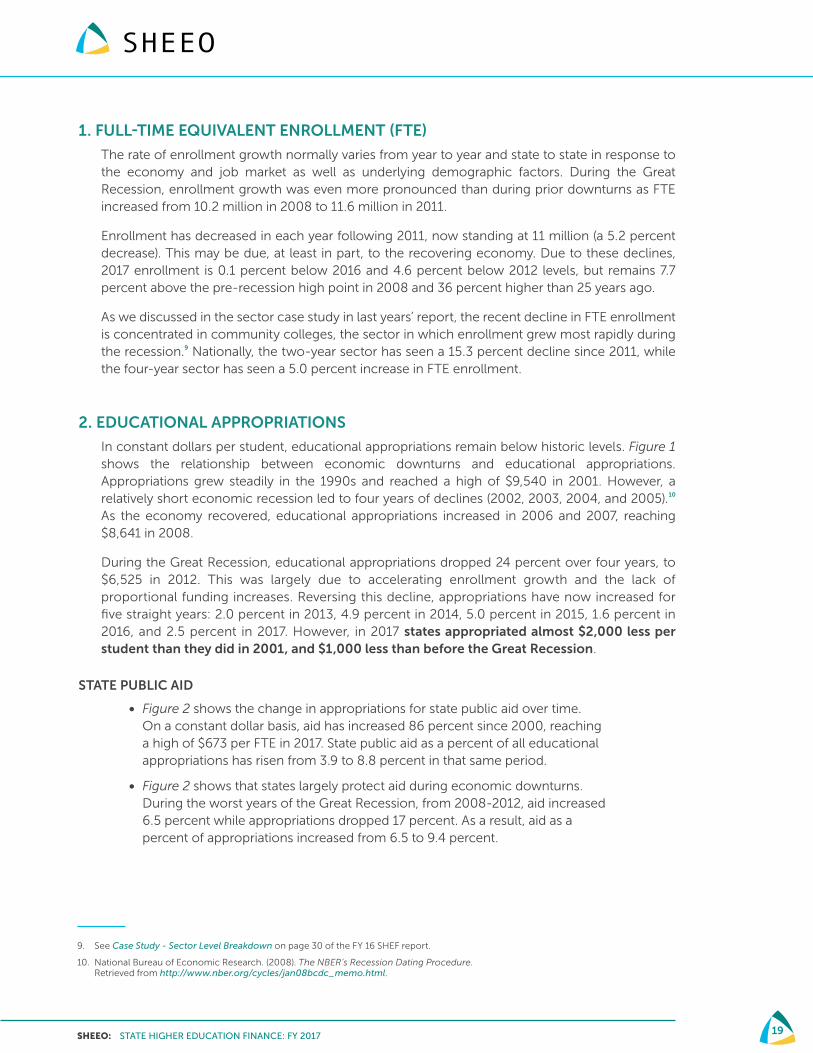
• State financial aid for students attending public institutions reached a high of $673 per FTE in 2017, and has increased 86 percent since 2000. Thanks to states’ protections of student aid, since 2000 state public aid has grown from 3.9 to 8.8 percent of educational appropriations. The public aid chart (Figure 2) is a new addition to SHEF this year.
• Net tuition revenue increased 0.4 percent from 2016 to 2017, but is up 34.4 percent since before the Great Recession in 2008.
• Increases in net tuition revenue have more than made up for the recent cuts in educational appropriations. This means that total educational revenues are 5.8 percent above 2008 and are currently the highest seen in the SHEF dataset, which goes back to 1980.
• Nationally, net tuition revenue accounted for 46.4 percent of all educational revenues in 2017. For the first time, more than half of all states relied more heavily on tuition than on educational appropriations.
The moderate changes seen nationally in enrollment, educational appropriations, and net tuition revenue mask significant variation across the states. Between 2016 and 2017:
• FTE enrollment increased in 20 states. The largest increase was 11 percent in Utah. The largest decrease was 4.7 percent in both Louisiana and New Mexico. California and Texas had the highest FTE at 1.57 and 1.03 million, respectively, and Alaska had the lowest FTE at just under 18,500.
• In constant dollars from 2016 to 2017, educational appropriations per FTE increased in 27 states. The largest increases were 32.8 percent in Illinois and 15.7 percent in South Dakota. Wyoming had the highest educational appropriations per FTE at over $18,200; Vermont and New Hampshire had the lowest, both below $3,000 per FTE.
• Net tuition revenue per FTE, driven both by changes in tuition rates and enrollment composition, increased in constant dollars in 33 states. Louisiana had the largest increase at 22.6 percent; Missouri had the largest decrease at 10.8 percent. Michigan had the highest net tuition revenue per FTE at $15,000, while California had the lowest at just over $2,100.
• Total educational revenues (the sum of educational appropriations and net tuition) increased in 32 states. The largest increases were 20.8 percent in Illinois and 10 percent in Hawai’i. The largest decreases were 8.4 percent in Missouri and 8.1 percent in Utah. In 2017, Florida had the lowest educational revenue per FTE at $9,712. The highest were Wyoming, Michigan, and Illinois, all above $20,000 per FTE.
SHEEO: STATE HIGHER EDUCATION FINANCE: FY 2017 9
MEASURES, METHODS, AND ANALYTICAL TOOLS
PRIMARY SHEF MEASURES
To assemble the annual SHEF report, SHEEO collects data on all state and local revenues used to support higher education, including revenues from taxes, lottery receipts, royalty revenue, and state-funded endowments. It also identifies the major purposes for which these public revenues are provided, including general institutional operating expenses, student financial assistance, and support for centrally funded research, medical education, and extension programs.
1. State and Local Support consists of state tax appropriations and local tax support plus additional non-tax funds (e.g., lottery revenue) that support or benefit higher education, and funds appropriated to other state entities for specific higher education expenditures or benefits (e.g., employee fringe benefits disbursed by the state treasurer). State and local support for 2009-2012 also includes federal American Reinvestment and Recovery Act (ARRA) funds provided to stabilize revenue during the Great Recession.
2. Educational Appropriations are that part of state and local support available for public higher education operating expenses. They are defined to exclude spending for research, agriculture-related programs, and medical education, as well as support for independent institutions or students attending them. Since funding for medical education and other major non-instructional purposes varies substantially across states, excluding these funding components helps to improve the comparability of state-level data on a per student basis.
3. Net Tuition Revenue is the gross amount of tuition and fees, less state and institutional financial aid, tuition waivers or discounts, and medical student tuition and fees. This is a measure of the resources available from tuition and fees to support instruction and related operations at public higher education institutions and includes revenue from in-state and out-of-state students as well as undergraduate and graduate students. Net tuition revenue generally reflects the share of instructional support received from students and their families, although it is not the same as and does not take into account many factors that need to be considered in analyzing the “net price” students pay for higher education.2
2. SHEF’s net tuition revenue does not measure “net price,” but measures the revenue that institutions receive from tuition. It is a straightforward measure of the proportion of public institution instructional costs borne by students and families. SHEF does not deduct federal grant assistance (primarily from Pell Grants) from gross tuition revenue, since these are non-state funds that substitute, at least in part, for costs borne by students. Measures of net price for the student need to include non-tuition costs and all forms of aid.
SHEEO: STATE HIGHER EDUCATION FINANCE: FY 2017 10
4. Total Educational Revenue is the sum of educational appropriations and net tuition revenue excluding any tuition revenue used for capital and debt service. It measures the amount of revenue available to public institutions to support instruction (excluding medical students). Very few public institutions have significant non-restricted revenue from gifts and endowments to support instruction. In some states, a portion of the net tuition revenue is used to fund capital debt service and similar non-operational activities. These sums are excluded from the total educational revenue.
5. Full-Time Equivalent Enrollment (FTE) is a measure of enrollment equal to one student enrolled full time for one academic year, calculated from the aggregate number of enrolled credit hours (including summer session). SHEF excludes most non-credit or non-degree program enrollments; medical school enrollments also are excluded for the reasons mentioned above. The use of FTE enrollment reduces multiple types of enrollment to a single measure in order to compare changes in total enrollment across states and sectors, and to provide a straightforward method for analyzing revenue on a per student basis.
ADJUSTMENTS FOR COMPARABILITY
SHEF’s analytic methods are designed to make basic data about higher education finance as comparable as possible across states and over time. Toward that end, financial indicators are provided on a per student basis (using FTE enrollment as the denominator), and the “raw data” provided by states is modified using three adjustments.
1. Cost of Living Index (COLI) is an adjustment to account for cost of living differences among the states;
2. Enrollment Mix Index (EMI) adjusts for differences in the mix of enrollment and costs among types of institutions with different costs across the states (e.g., graduate education versus undergraduate education); and
3. Higher Education Cost Adjustment (HECA) adjusts for inflation over time.
Technical Papers A and B on the SHEF website describe these adjustments in more detail.
DATA USES AND CAUTIONS
The SHEF report seeks to provide—to the extent possible—comparable data and reliable methods to examine many of the most fundamental financial issues facing higher education, particularly at the state level. However, using financial data can be complicated and even deceptive. Readers should be cognizant of limitations inherent in the data and methods.
1. Comparing institutions and states is a difficult task. Data providers often adjust their state data from prior years as more accurate information becomes available. States vary in climate, energy costs, housing costs, population densities, growth rates, areas of poverty, resource bases, and the mix of industries and enterprises driving their local economies. Some have a relatively homogeneous, well-educated population, while others have large numbers of traditionally-underserved populations. Additionally, the extent and rate at which these factors are changing varies across states.
SHEEO: STATE HIGHER EDUCATION FINANCE: FY 2017 11
2. State higher education systems differ. Some have many small institutions, others fewer but larger institutions. Some have many independent institutions while others rely almost entirely on public institutions, with varying combinations of research universities, community colleges, and four-year universities. Across states, tuition rates vary, as do the amounts and types of financial aid, which in turn affect enrollment patterns. Some states have many institutions that offer high-cost programs, while others focus funding on research or emphasize undergraduate education.
3. In addition to these differences, technical factors can distort interstate comparisons. For example, states differ in how they finance employee retirement. Some pay all retirement costs to employee accounts when the benefits are earned, while others defer part of the costs until the benefits are paid. Some pay benefit costs through a state agency, while others pay from institutional budgets. Many studies of state finance try to account for such factors, but no study, including this one, can assure flawless comparisons.
While making finance data cleaner, consistent, and more comparable, SHEF’s analytic methods also add complexity. All comparisons can claim only to be “valid, more or less,” and SHEF is no exception. Analysts with knowledge of particular states probably know of other factors that should be taken into account or that could mislead comparative analysis. SHEEO welcomes all efforts to improve the quality of its data and analytical tools. We urge readers and users to help us improve both methods and understanding. To that end, we are advised by a team of experts from states and policy organizations and welcome others to assist us. In the summer of 2015, SHEEO formed this advisory committee of experts from multiple areas of higher education finance.
Many educators and policymakers (and segments of the public) may look to interstate financial analysis to determine “appropriate” or “sufficient” funding for higher education, but sufficiency is meaningful only in the context of a particular state’s objectives and circumstances. State leaders, educators, and others must work together to set goals and develop strategies to achieve those goals, and then determine the amount and allocation of funds required to obtain success.
SHEEO: STATE HIGHER EDUCATION FINANCE: FY 2017 12
CASE STUDY: DATA IMPROVEMENT PROJECT
We continue to find new opportunities to expand the SHEF data collection as the landscape of higher education changes. Last summer, we surveyed the SHEF community and worked with our advisory group to determine how we could make the report more useful. In response to rapid expansion of dual-enrollment and dual-credit programs, this year we more explicitly defined how these students should be treated in the data collection and began to integrate dual-enrollment appropriations and dual-enrollment FTE into the SHEF survey.
We also began to work with data providers to collect tuition revenue and FTE enrollment by residency to help states and the higher education community better understand how out-of-state and international students have changed the picture of higher education over time. Finally, to address the growing number of primarily two-year institutions now offering four-year degrees, we adjusted how those institutions are classified when calculating the Enrollment Mix Index (EMI).
The table below shows the number of states that were able to provide each new variable. Partial reporting generally means that the state was able to provide one or more years of data but other years were not available. The majority of states who were unable to report indicated that they could provide this data in future years if it were to become part of the main data collection.
NUMBER OF STATES REPORTING NEW AND SUPPLEMENTAL VARIABLES
DUAL ENROLLMENT RESIDENCY
FTE APPROPRIATIONS FTE TUITION
FULLY REPORTED 8 2 9 4
PARTIALLY REPORTED 5 4 6 11
UNABLE TO REPORT 1 8 11 11
UNKNOWN 37 37 25 25
The SHEF collection continues to improve each year. Increasingly, we scrutinize the data with thorough verifications and cross-checks with other public data sources like IPEDS and NASSGAP, leading data providers to review and update both current and historical data. For example, we spoke with over 50 data providers to discuss large or unusual year-over-year changes in individual data components. This process led to data updates by eight providers. In addition, we continue to refine our sector breakdown information to provide a more comprehensive picture of sector-level state support, tuition revenue, and FTE enrollment over time.
These improvements would not be possible without the help of the SHEF advisory group. We look forward to the opportunity to continue expanding and refining the SHEF data collection.
SHEEO: STATE HIGHER EDUCATION FINANCE: FY 2017 13
SOURCES AND USES OF REVENUE
Support for higher education represents the third largest major budget area of state spending from state and local tax sources, behind K-12 and Medicaid appropriations. In fiscal 2017, 9.9 percent of state general funds were allocated to higher education, down from 12.9 percent in 1995.3, 4 It is generally understood that state funding for higher education acts as the “balance wheel” during economic downturns with funding reductions typically greater than reductions in other budget areas.5 In part, this is because higher education funding reductions can be offset (in whole or in part) with money from tuition increases.
This section provides data and analysis of the sources of state and local government support for higher education, focusing on the most recent five-year trend (2012-2017), during which most states largely recovered from the Great Recession. This section also provides an overview of the major uses of that support.
These funding amounts are not adjusted for inflation or for enrollment. Later sections of the report will show the impact of these two factors on state and local funding for higher education.
Table 1 presents state and local support in current unadjusted dollars for fiscal years 2012 through 2017. It shows evidence of continued recovery of state and local funding sources for higher education since the height of the Great Recession in 2012. In unadjusted terms, state and local government support grew 20.3 percent from 2012, reaching an all-time high of $97.3 billion in 2017. State funding grew 4.3 percent in the last year, from $83.2 to $86.8 billion in 2017.
State tax appropriations remained the largest source of funds, totaling $82.8 billion (85 percent of all state support). Additional sources included the following:
1. Twenty-nine states reported local tax appropriations, which accounted for 12.4 percent of their total support and 10.8 percent of total support in all states. Local support, which typically funds community colleges, increased from $10.05 to $10.56 billion in the last year.
2. Non-tax appropriations, mostly from state lotteries, continued to grow and exceeded $3.3 billion (3.4 percent of all funds) in 2017.
3. State-funded endowment earnings accounted for another 0.6 percent, and non-appropriated support, often from oil and mineral extraction fees or royalties, accounted for 0.1 percent of the total funding provided by state and local governments.
4. Overall, the different sources of higher education funding have remained fairly consistent in their distribution. Tax appropriations accounted for 89.3 percent of all funds in 2000 and 85 percent in 2017. Non-tax support increased from 1.4 percent to 3.4 percent in that timeframe, while local tax appropriations increased from 8.9 percent to 10.8 percent.
3. Sigritz, B. (2017). State Expenditure Report: Examining Fiscal 2015-2017 State Spending. Washington, DC: NASBO. Retrieved from https://www.nasbo.org/mainsite/reports-data/state-expenditure-report.
4. Unlike the SHEF data, NASBO expenditures exclude employer contribution to pensions and health benefits.
5. Delaney, J., & Doyle, W. (2011). State spending on higher education: Testing the balance wheel over time. Journal of Education Finance, 36(4). Retrieved from http://www.jstor.org/stable/23018116.
SHEEO: STATE HIGHER EDUCATION FINANCE: FY 2017 14
General operating expenses at public institutions increased 23 percent from 2012, and in 2017, they accounted for $76.7 billion, or 78.8 percent of the total state and local government funding for higher education. Additional uses included the following:
1. $10.4 billion (10.6 percent) went to special purpose appropriations for research, agricultural extension programs, and medical education. These appropriations grew 8 percent from 2012, more slowly than general operating expenses.
2. $9.8 billion was allocated to state-funded student financial aid programs. Three quarters of this aid went to students attending public institutions within a state. Since the height of the Great Recession in 2012, public student aid has increased 17 percent while aid to out-of-state and students attending independent institutions decreased 1 percent.
3. Funding for operations at independent institutions and for non-credit and continuing education programs increased 10 and 13 percent in the last year, respectively. These funds now account for 0.5 percent of state and local support for higher education.
4. The distribution of higher education funds for the above uses has remained relatively steady over time. The largest decrease was in research, agricultural extension programs, and medical education, which decreased from 15.6 percent of all funds in 2000 to 10.6 percent in 2017. Over the same time period, state public aid increased from 3.6 percent to 7.6 percent, and general public operations increased 1.1 percent.

SHEEO: STATE HIGHER EDUCATION FINANCE: FY 2017 15
TABLE 1 STATE AND LOCAL SUPPORT: DISTRIBUTION OF SOURCES AND USES, U.S., FY 2012-2017 (CURRENT DOLLARS, IN MILLIONS)
SOURCE 2012 2013 2014 2015 2016 20172017 %
DISTRIBUTION
STATE SUPPORT
ARRA FUNDS $117 - - - - - -
TAX APPROPRIATIONS $68,359 $69,361 $73,515 $77,386 $79,154 $82,751 85.0%
ALL NON-TAX SUPPORT $2,959 $2,932 $3,031 $3,158 $3,255 $3,348 3.4%
NON-APPROPRIATED SUPPORT $99 $92 $93 $121 $117 $123 0.1%
STATE FUNDED ENDOWMENT EARNINGS $471 $498 $530 $483 $582 $541 0.6%
OTHER1 $257 $266 $312 $201 $171 $179 0.2%
FUNDS NOT AVAILABLE FOR USE2 $107 $72 $81 $71 $53 $177 0.2%
STATE SUPPORT TOTAL $72,155 $73,077 $77,401 $81,278 $83,227 $86,764 89.2%
LOCAL TAX APPROPRIATIONS $8,727 $9,204 $9,337 $9,557 $10,053 $10,555 10.8%
TOTAL $80,881 $82,282 $86,738 $90,835 $93,280 $97,319 100.0%
USES
GENERAL PUBLIC OPERATIONS $62,096 $63,138 $67,285 $70,857 $73,117 $76,690 78.8%
RESEARCH - AGRICULTURE - MEDICAL (RAM) $9,579 $9,794 $10,058 $10,067 $10,185 $10,357 10.6%
PUBLIC STUDENT AID3 $6,340 $6,556 $6,564 $7,067 $7,182 $7,400 7.6%
INDEPENDENT STUDENT AID4 $2,330 $2,269 $2,296 $2,286 $2,292 $2,311 2.4%
OUT-OF-STATE STUDENT AID $35 $35 $34 $34 $31 $31 0.0%
INDEPENDENT INSTITUTIONS $180 $176 $188 $208 $195 $215 0.2%
NON-CREDIT AND CONTINUING EDUCATION $319 $313 $312 $315 $279 $316 0.3%
TOTAL $80,881 $82,282 $86,738 $90,835 $93,280 $97,319 100.0%
Percentages may not equal 100 due to rounding.
NOTES: 1. “Other” includes multi-year appropriations from previous years and funds not classified in one of the other source categories.
2. “Funds Not Available for Use” includes appropriations that were returned to the state, and portions of multi-year appropriations to be spread over other years.
3. “Public Student Aid” is state appropriated student financial aid for public institution tuition and fees. Includes aid appropriated outside the recognized state student aid program(s). Some respondents could not separate tuition aid from aid for living expenses.
4. “Independent Student Aid” is state appropriated student financial aid for students attending independent institutions in the state.
SOURCE: State Higher Education Executive Officers
SHEEO: STATE HIGHER EDUCATION FINANCE: FY 2017 16
NATIONAL TRENDS IN ENROLLMENT AND REVENUE
From this section on, the SHEF report highlights public national trends in higher education enrollment and the relationship between these trends and available revenues (and other components of financing). These “national” trends are composites of 50 unique and varied state trends, which are shown in the following section. Please note that the U.S. totals are not averages of state averages. For example, “U.S. total educational appropriations per FTE” is the sum of all educational appropriations divided by the sum of all net FTE across the 50 states. It is not the average of each of the 50 states’ individual per FTE calculations.
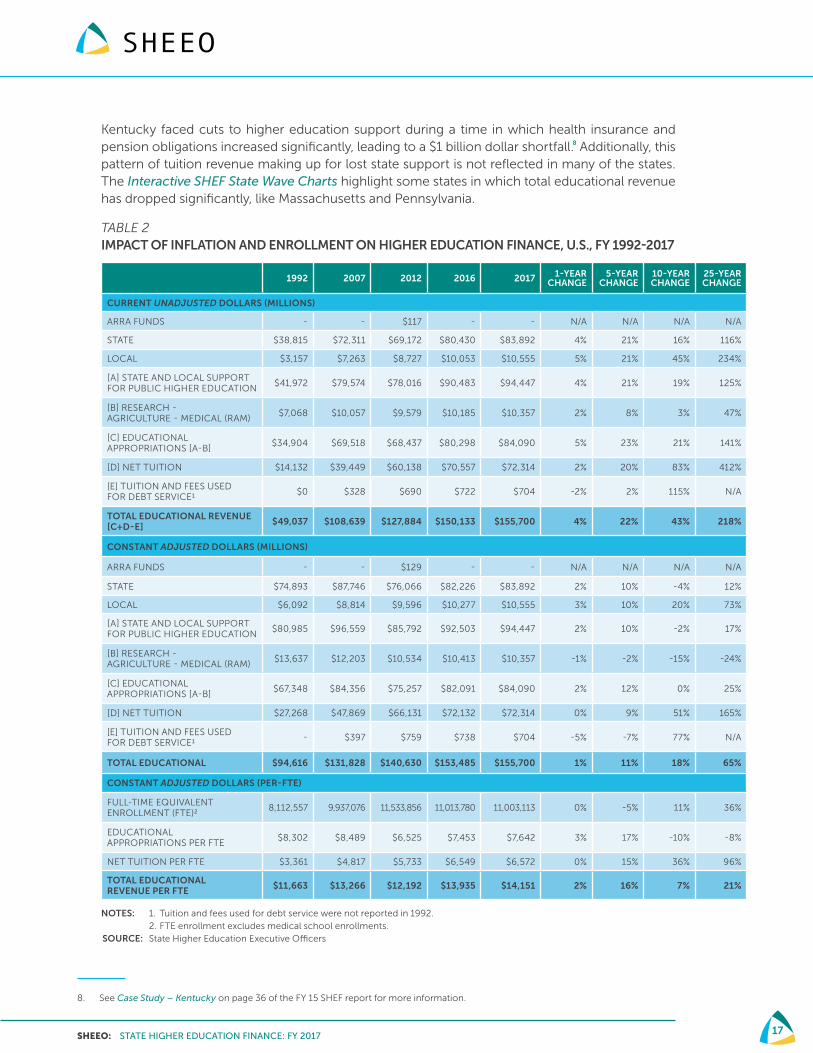
Table 2 presents a 25-year look at the SHEF Higher Education Finance Indicators and shows the impact of inflation and enrollment over time on higher education support for public institutions. It is a starting point for understanding the national story of public higher education funding from state and local sources, tuition revenue from students and families, and enrollment over time. The years 1992, 2007, 2012, 2016, and 2017 are shown, allowing for 25-year, 10-year, 5-year, and 1-year comparisons. The first section of the table shows unadjusted current dollars. Section two shows the impact of inflation by presenting the data in constant 2017 terms, while the third section presents the impact of both inflation and enrollment growth over time on these measures.
Over the last 25 years, total state and local support for public higher education grew 125 percent in unadjusted terms, from $42 billion in 1992 to $94.4 billion in 2017. After adjusting for inflation, state and local funding in 1992 was $81 billion, meaning that in constant dollars, funding increased 17 percent over the last 25 years. When making these comparisons, it is important to note that 25 years ago, the U.S. was at the height of the early 1990s economic recession and support for public higher education had decreased an inflation-adjusted 5.2 percent over the previous two years.6
General operations at public institutions of higher education are funded from both state and local support and tuition revenue. The SHEF report tracks net tuition revenue over time, and shows that overall net tuition revenue has grown 165 percent in constant dollars since 1992. This growth is due in part to a 36 percent increase in full-time equivalent enrollment (FTE) between 1992 and 2017. Put simply, there are significantly more students paying tuition charges. Tuition revenue has also increased due to rising tuition rates and changes in enrollment mix (e.g., more non-resident students or more graduate students paying higher rates).7
The third section of Table 2 summarizes the impacts of both inflation and enrollment on higher education funding. Since 1992, student FTE enrollment has increased from 8.1 million to 11 million FTE, while educational appropriations per FTE have declined 8 percent, meaning state and local funding has not kept up with inflation or enrollment growth over time. During the same period, net tuition revenue per FTE has increased 96 percent in constant dollars.
Taken together, the sum of educational appropriations and net tuition revenue per FTE has increased 21 percent. In other words, net tuition revenue has more than made up for the declines in state and local funding per student over the most recent 25-year period. However, as discussed in the 2015 SHEF report, the amount of total expenditures may also have changed. For example,
6. See Case Study - Impact of Recessions on page 24 of the FY 15 SHEF report for more information.
7. College Board. (2017). Trends in College Pricing. Retrieved from https://trends.collegeboard.org/sites/default/files/2017-trends-in-college-pricing_1.pdf.
SHEEO: STATE HIGHER EDUCATION FINANCE: FY 2017 17
Kentucky faced cuts to higher education support during a time in which health insurance and pension obligations increased significantly, leading to a $1 billion dollar shortfall.8 Additionally, this pattern of tuition revenue making up for lost state support is not reflected in many of the states. The Interactive SHEF State Wave Charts highlight some states in which total educational revenue has dropped significantly, like Massachusetts and Pennsylvania.
TABLE 2 IMPACT OF INFLATION AND ENROLLMENT ON HIGHER EDUCATION FINANCE, U.S., FY 1992-2017
1992 2007 2012 2016 2017 1-YEAR CHANGE
5-YEAR CHANGE
10-YEAR CHANGE
25-YEAR CHANGE
CURRENT UNADJUSTED DOLLARS (MILLIONS)
ARRA FUNDS - - $117 - - N/A N/A N/A N/A
STATE $38,815 $72,311 $69,172 $80,430 $83,892 4% 21% 16% 116%
LOCAL $3,157 $7,263 $8,727 $10,053 $10,555 5% 21% 45% 234%
[A] STATE AND LOCAL SUPPORT FOR PUBLIC HIGHER EDUCATION
$41,972 $79,574 $78,016 $90,483 $94,447 4% 21% 19% 125%
[B] RESEARCH - AGRICULTURE - MEDICAL (RAM)
$7,068 $10,057 $9,579 $10,185 $10,357 2% 8% 3% 47%
[C] EDUCATIONAL APPROPRIATIONS [A-B]
$34,904 $69,518 $68,437 $80,298 $84,090 5% 23% 21% 141%
[D] NET TUITION $14,132 $39,449 $60,138 $70,557 $72,314 2% 20% 83% 412%
[E] TUITION AND FEES USED FOR DEBT SERVICE1
$0 $328 $690 $722 $704 -2% 2% 115% N/A
TOTAL EDUCATIONAL REVENUE [C+D-E]
$49,037 $108,639 $127,884 $150,133 $155,700 4% 22% 43% 218%
CONSTANT ADJUSTED DOLLARS (MILLIONS)
ARRA FUNDS - - $129 - - N/A N/A N/A N/A
STATE $74,893 $87,746 $76,066 $82,226 $83,892 2% 10% -4% 12%
LOCAL $6,092 $8,814 $9,596 $10,277 $10,555 3% 10% 20% 73%
[A] STATE AND LOCAL SUPPORT FOR PUBLIC HIGHER EDUCATION
$80,985 $96,559 $85,792 $92,503 $94,447 2% 10% -2% 17%
[B] RESEARCH - AGRICULTURE - MEDICAL (RAM)
$13,637 $12,203 $10,534 $10,413 $10,357 -1% -2% -15% -24%
[C] EDUCATIONAL APPROPRIATIONS [A-B]
$67,348 $84,356 $75,257 $82,091 $84,090 2% 12% 0% 25%
[D] NET TUITION $27,268 $47,869 $66,131 $72,132 $72,314 0% 9% 51% 165%
[E] TUITION AND FEES USED FOR DEBT SERVICE1
- $397 $759 $738 $704 -5% -7% 77% N/A
TOTAL EDUCATIONAL $94,616 $131,828 $140,630 $153,485 $155,700 1% 11% 18% 65%
CONSTANT ADJUSTED DOLLARS (PER-FTE)
FULL-TIME EQUIVALENT ENROLLMENT (FTE)2
8,112,557 9,937,076 11,533,856 11,013,780 11,003,113 0% -5% 11% 36%
EDUCATIONAL APPROPRIATIONS PER FTE
$8,302 $8,489 $6,525 $7,453 $7,642 3% 17% -10% -8%
NET TUITION PER FTE $3,361 $4,817 $5,733 $6,549 $6,572 0% 15% 36% 96%
TOTAL EDUCATIONAL REVENUE PER FTE
$11,663 $13,266 $12,192 $13,935 $14,151 2% 16% 7% 21%
NOTES: 1. Tuition and fees used for debt service were not reported in 1992. 2. FTE enrollment excludes medical school enrollments.SOURCE: State Higher Education Executive Officers
8. See Case Study – Kentucky on page 36 of the FY 15 SHEF report for more information.
SHEEO: STATE HIGHER EDUCATION FINANCE: FY 2017 18
PRIMARY SHEF METRICS
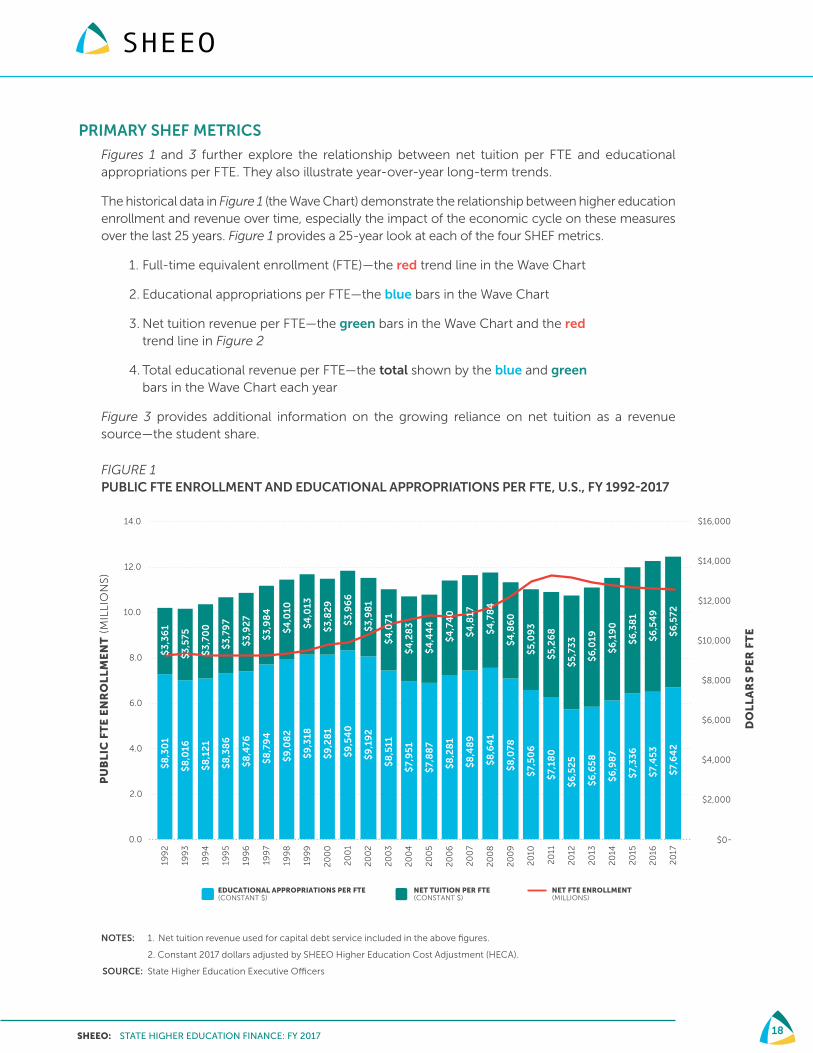
Figures 1 and 3 further explore the relationship between net tuition per FTE and educational appropriations per FTE. They also illustrate year-over-year long-term trends.
The historical data in Figure 1 (the Wave Chart) demonstrate the relationship between higher education enrollment and revenue over time, especially the impact of the economic cycle on these measures over the last 25 years. Figure 1 provides a 25-year look at each of the four SHEF metrics.
1. Full-time equivalent enrollment (FTE)—the red trend line in the Wave Chart
2. Educational appropriations per FTE—the blue bars in the Wave Chart
3. Net tuition revenue per FTE—the green bars in the Wave Chart and the red trend line in Figure 2
4. Total educational revenue per FTE—the total shown by the blue and green bars in the Wave Chart each year
Figure 3 provides additional information on the growing reliance on net tuition as a revenue source—the student share.
FIGURE 1PUBLIC FTE ENROLLMENT AND EDUCATIONAL APPROPRIATIONS PER FTE, U.S., FY 1992-2017
NOTES: 1. Net tuition revenue used for capital debt service included in the above figures.
2. Constant 2017 dollars adjusted by SHEEO Higher Education Cost Adjustment (HECA).
SOURCE: State Higher Education Executive Officers
FIGURE 1
PUBLIC FTE ENROLLMENT AND EDUCATIONAL APPROPRIATIONS PER FTE, U.S., FY 1992-2017
EDUCATIONAL APPROPRIATIONS PER FTE(CONSTANT $)
NET TUITION PER FTE(CONSTANT $)
NET FTE ENROLLMENT(MILLIONS)
DO
LL
AR
S P
ER
FT
E
PU
BL
IC F
TE
EN
RO
LL
ME
NT
(M
ILLI
ON
S)
$8
,30
1
$8
,016
$8
,12
1
$8
,38
6
$8
,476
$8
,79
4
$9
,08
2
$9
,318
$9
,28
1
$9
,54
0
$9
,19
2
$8
,511
$7,
95
1
$7,
88
7
$8
,28
1
$8
,48
9
$8
,64
1
$8
,078
$7,
50
6
$7,
180
$6
,52
5
$6
,65
8
$6
,98
7
$7,
33
6
$7,
45
3
$7,
64
2
$3
,36
1
$3
,575
$3
,70
0
$3
,79
7
$3
,92
7
$3
,98
4
$4
,010
$4
,013
$3
,82
9
$3
,96
6
$3
,98
1
$4
,071
$4
,28
3
$4
,44
4
$4
,74
0
$4
,817
$4
,78
4
$4
,86
0
$5
,09
3
$5
,26
8
$5
,73
3
$6
,019
$6
,19
0
$6
,38
1
$6
,54
9
$6
,572
$2,000
$4,000
$6,000
$8,000
$10,000
$12,000
$14,000
$16,000
0.0
2.0
4.0
6.0
8.0
10.0
12.0
14.0
199
2
199
3
199
4
199
5
199
6
199
7
199
8
199
9
20
00
20
01
20
02
20
03
20
04
20
05
20
06
20
07
20
08
20
09
20
10
20
11
20
12
20
13
20
14
20
15
20
16
20
17
$0-
SHEEO: STATE HIGHER EDUCATION FINANCE: FY 2017 19
1. FULL-TIME EQUIVALENT ENROLLMENT (FTE)
The rate of enrollment growth normally varies from year to year and state to state in response to the economy and job market as well as underlying demographic factors. During the Great Recession, enrollment growth was even more pronounced than during prior downturns as FTE increased from 10.2 million in 2008 to 11.6 million in 2011.
Enrollment has decreased in each year following 2011, now standing at 11 million (a 5.2 percent decrease). This may be due, at least in part, to the recovering economy. Due to these declines, 2017 enrollment is 0.1 percent below 2016 and 4.6 percent below 2012 levels, but remains 7.7 percent above the pre-recession high point in 2008 and 36 percent higher than 25 years ago.
As we discussed in the sector case study in last years’ report, the recent decline in FTE enrollment is concentrated in community colleges, the sector in which enrollment grew most rapidly during the recession.9 Nationally, the two-year sector has seen a 15.3 percent decline since 2011, while the four-year sector has seen a 5.0 percent increase in FTE enrollment.
2. EDUCATIONAL APPROPRIATIONS
In constant dollars per student, educational appropriations remain below historic levels. Figure 1 shows the relationship between economic downturns and educational appropriations. Appropriations grew steadily in the 1990s and reached a high of $9,540 in 2001. However, a relatively short economic recession led to four years of declines (2002, 2003, 2004, and 2005).10 As the economy recovered, educational appropriations increased in 2006 and 2007, reaching $8,641 in 2008.
During the Great Recession, educational appropriations dropped 24 percent over four years, to $6,525 in 2012. This was largely due to accelerating enrollment growth and the lack of proportional funding increases. Reversing this decline, appropriations have now increased for five straight years: 2.0 percent in 2013, 4.9 percent in 2014, 5.0 percent in 2015, 1.6 percent in 2016, and 2.5 percent in 2017. However, in 2017 states appropriated almost $2,000 less per student than they did in 2001, and $1,000 less than before the Great Recession.
STATE PUBLIC AID
• Figure 2 shows the change in appropriations for state public aid over time. On a constant dollar basis, aid has increased 86 percent since 2000, reaching a high of $673 per FTE in 2017. State public aid as a percent of all educational appropriations has risen from 3.9 to 8.8 percent in that same period.
• Figure 2 shows that states largely protect aid during economic downturns. During the worst years of the Great Recession, from 2008-2012, aid increased 6.5 percent while appropriations dropped 17 percent. As a result, aid as a percent of appropriations increased from 6.5 to 9.4 percent.
9. See Case Study - Sector Level Breakdown on page 30 of the FY 16 SHEF report.
10. National Bureau of Economic Research. (2008). The NBER’s Recession Dating Procedure. Retrieved from http://www.nber.org/cycles/jan08bcdc_memo.html.
SHEEO: STATE HIGHER EDUCATION FINANCE: FY 2017 20
FIGURE 2STATE PUBLIC AID PER FTE AND AS A PERCENT OF EDUCATIONAL APPROPRIATIONS IN THE U.S., FY 2000-2017
NOTES: 1. Public student aid is state appropriated student financial aid for public institution tuition and fees. Includes aid appropriated outside the recognized state student aid program(s).
2. Five states were excluded from this chart. Alaska, Mississippi, and Nevada are revising their public student aid data and will be included in the future. New Hampshire does not have a public student aid program. Nebraska could not separate aid for tuition and fees from aid for other expenses.
3. Constant 2017 dollars adjusted by SHEEO Higher Education Cost Adjustment (HECA).
SOURCE: State Higher Education Executive Officers
3. NET TUITION REVENUE
The substantial shift of responsibility for financing public higher education toward net tuition revenue (from around 25 percent to nearly 50 percent) since 1990 is a significant change for U.S. higher education. On a per student basis, net tuition revenue increased only 0.4 percent between 2016 and 2017. However, since the pre-recession high point in 2008, net tuition revenue per student has increased 37.5 percent—and it has increased 96 percent, in constant dollars, over the last 25 years.
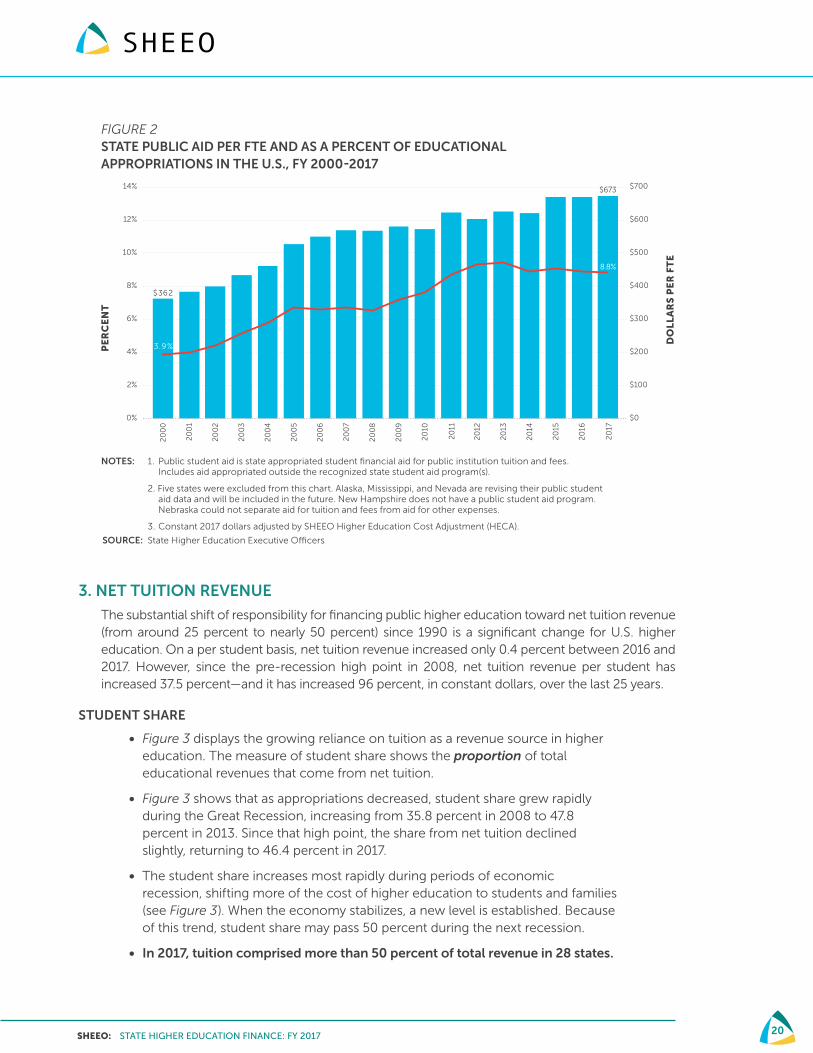
STUDENT SHARE
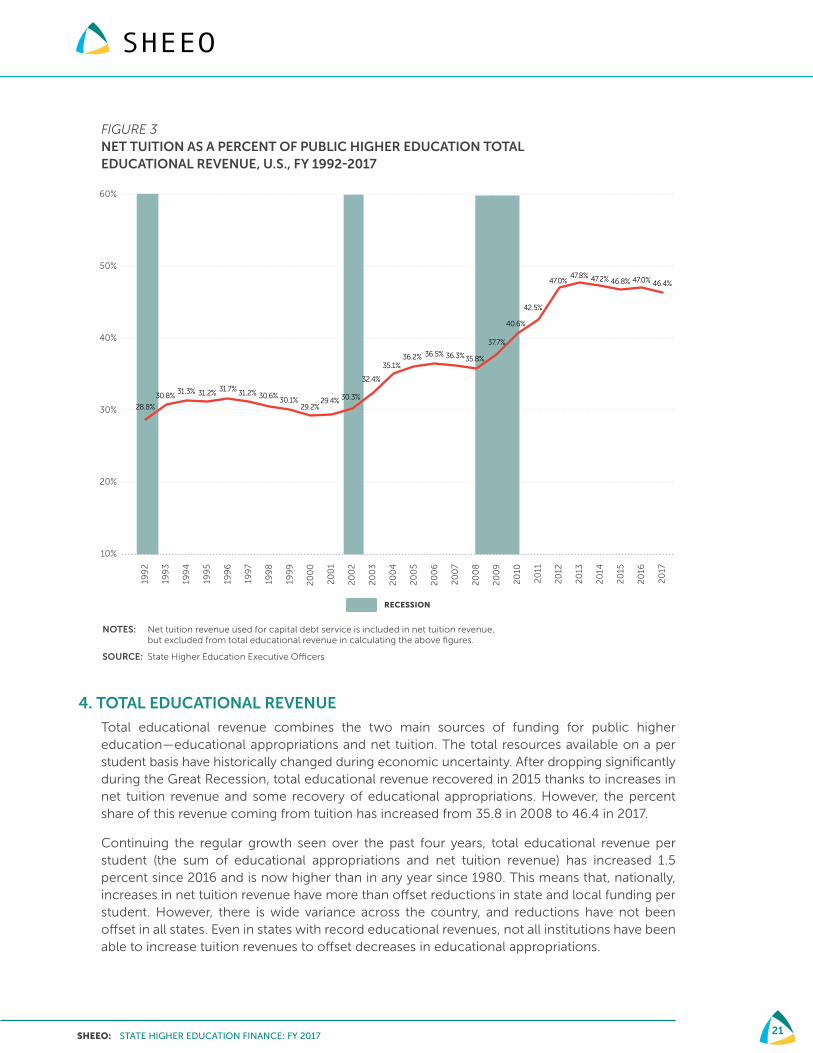
• Figure 3 displays the growing reliance on tuition as a revenue source in higher education. The measure of student share shows the proportion of total educational revenues that come from net tuition.
• Figure 3 shows that as appropriations decreased, student share grew rapidly during the Great Recession, increasing from 35.8 percent in 2008 to 47.8 percent in 2013. Since that high point, the share from net tuition declined slightly, returning to 46.4 percent in 2017.
• The student share increases most rapidly during periods of economic recession, shifting more of the cost of higher education to students and families (see Figure 3). When the economy stabilizes, a new level is established. Because of this trend, student share may pass 50 percent during the next recession.
• In 2017, tuition comprised more than 50 percent of total revenue in 28 states.
FIGURE 2
PUBLIC STUDENT AID PER FTE AND AS A PERCENT OF EDUCATIONAL APPROPRIATIONS IN THE U.S., FY 2000-2017
$0
$100
$200
$300
$400
$500
$600
$700
0%
2%
4%
6%
8%
10%
12%
14%
20
00
20
01
20
02
20
03
20
04
20
05
20
06
20
07
20
08
20
09
20
10
20
11
20
12
20
13
20
14
20
15
20
16
20
17
DO
LL
AR
S P
ER
FT
E
PE
RC
EN
T
$362
$673
8.8%
3.9%
SHEEO: STATE HIGHER EDUCATION FINANCE: FY 2017 21
FIGURE 3NET TUITION AS A PERCENT OF PUBLIC HIGHER EDUCATION TOTAL EDUCATIONAL REVENUE, U.S., FY 1992-2017
NOTES: Net tuition revenue used for capital debt service is included in net tuition revenue, but excluded from total educational revenue in calculating the above figures.
SOURCE: State Higher Education Executive Officers
4. TOTAL EDUCATIONAL REVENUE
Total educational revenue combines the two main sources of funding for public higher education—educational appropriations and net tuition. The total resources available on a per student basis have historically changed during economic uncertainty. After dropping significantly during the Great Recession, total educational revenue recovered in 2015 thanks to increases in net tuition revenue and some recovery of educational appropriations. However, the percent share of this revenue coming from tuition has increased from 35.8 in 2008 to 46.4 in 2017.
Continuing the regular growth seen over the past four years, total educational revenue per student (the sum of educational appropriations and net tuition revenue) has increased 1.5 percent since 2016 and is now higher than in any year since 1980. This means that, nationally, increases in net tuition revenue have more than offset reductions in state and local funding per student. However, there is wide variance across the country, and reductions have not been offset in all states. Even in states with record educational revenues, not all institutions have been able to increase tuition revenues to offset decreases in educational appropriations.
FIGURE 3
RECESSION
NET TUITION AS A PERCENT OF PUBLIC HIGHER EDUCATIONTOTAL EDUCATIONAL REVENUE, U.S., FY 1992-2017
10%
20%
30%
40%
50%
60%
199
2
199
3
199
4
199
5
199
6
199
7
199
8
199
9
20
00
20
01
20
02
20
03
20
04
20
05
20
06
20
07
20
08
20
09
20
10
20
11
20
12
20
13
20
14
20
15
20
16
20
17
28.8%
30.8%31.3% 31.2% 31.7% 31.2% 30.6%
30.1%29.2%
29.4% 30.3%
32.4%
35.1%36.2% 36.5% 36.3%35.8%
37.7%
40.6%
42.5%
47.0%47.8% 47.2% 46.8% 47.0% 46.4%
SHEEO: STATE HIGHER EDUCATION FINANCE: FY 2017 22
INTERSTATE COMPARISONS
The SHEF report is a collection of 50 very different states, and the national trends reported in the previous section mask substantial variation by state. This section examines these interstate differences more closely by illustrating these trends across the SHEF metrics of higher education financing, such as rates of enrollment growth or the varying proportions of funding sources.
Many factors affect the relative positions of states in their funding of higher education. Although no analysis can account for them all, SHEF makes two adjustments to reflect differences in cost of living and in enrollment levels at various institution types across the states.11 These adjustments tend to draw states toward the national average; for example, states with a high cost of living also often support higher education at above average levels and the cost of living index reduces the extent of their above average revenues per student. The size and direction of these adjustments vary across states:
• In states with a high cost of living, dollars per FTE are adjusted downward (e.g., Massachusetts). In states where the cost of living is below the national average, they are adjusted upward (e.g., Arkansas).
• If the proportion of enrollment in higher-cost institutions is above average, dollars per FTE are adjusted downward. In states with a relatively inexpensive enrollment mix, dollars are adjusted upward. 12
• Dollars per FTE are adjusted upward the most in states with an inexpensive enrollment mix and low cost of living (e.g., Wyoming). The reverse is true for states with a more expensive enrollment mix and a higher cost of living (e.g., Hawai’i). In some states, the two factors cancel out each other (e.g., Florida).
This section illustrates the variability across states and over time with respect to higher education enrollment growth, total state and local appropriations, the proportion of tuition-derived revenue, and total revenue available for public educational programs. The states are shown relative to one another to provide context for the national picture shown earlier in the report. These data are presented for the last five years and since the pre-recession high funding level of 2008.
11. For more information on these adjustments, see Technical Paper B on our website (http://www.sheeo.org/SHEF_Data_Collection_Process).
12. SHEEO’s Enrollment Mix Index adjusts state metrics based on the distribution of enrollment across institution type in a state. The adjustment does not account for distribution of students across educational level or the discipline mix offered across a state’s institutions.
SHEEO: STATE HIGHER EDUCATION FINANCE: FY 2017 23
1. FULL-TIME EQUIVALENT ENROLLMENT (FTE)
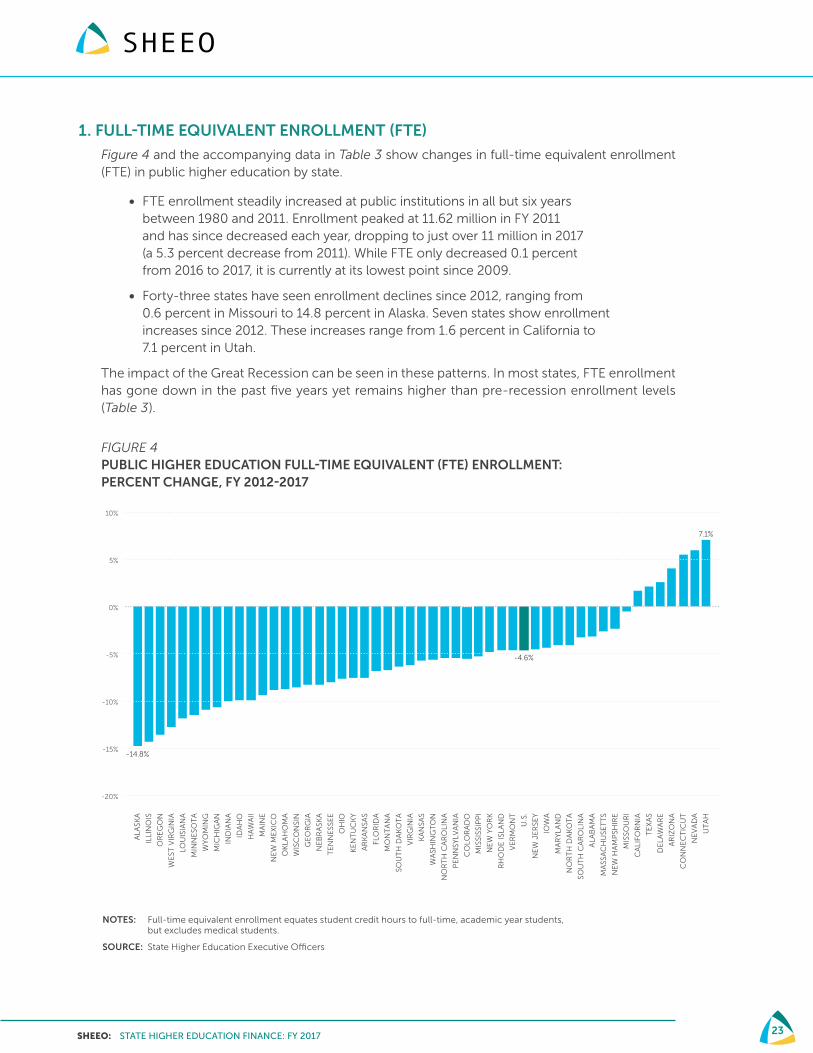
Figure 4 and the accompanying data in Table 3 show changes in full-time equivalent enrollment (FTE) in public higher education by state.
• FTE enrollment steadily increased at public institutions in all but six years between 1980 and 2011. Enrollment peaked at 11.62 million in FY 2011 and has since decreased each year, dropping to just over 11 million in 2017 (a 5.3 percent decrease from 2011). While FTE only decreased 0.1 percent from 2016 to 2017, it is currently at its lowest point since 2009.
• Forty-three states have seen enrollment declines since 2012, ranging from 0.6 percent in Missouri to 14.8 percent in Alaska. Seven states show enrollment increases since 2012. These increases range from 1.6 percent in California to 7.1 percent in Utah.
The impact of the Great Recession can be seen in these patterns. In most states, FTE enrollment has gone down in the past five years yet remains higher than pre-recession enrollment levels (Table 3).
FIGURE 4PUBLIC HIGHER EDUCATION FULL-TIME EQUIVALENT (FTE) ENROLLMENT: PERCENT CHANGE, FY 2012-2017
NOTES: Full-time equivalent enrollment equates student credit hours to full-time, academic year students, but excludes medical students.
SOURCE: State Higher Education Executive Officers
FIGURE 4
PUBLIC HIGHER EDUCATION FULL-TIME EQUIVALENT (FTE) ENROLLMENT: PERCENT CHANGE, FY 2012-2017
-20%
-15%
-10%
-5%
0%
5%
10%
ALA
SKA
ILLI
NO
IS
OR
EG
ON
WE
ST V
IRG
INIA
LOU
ISIA
NA
MIN
NE
SOT
A
WY
OM
ING
MIC
HIG
AN
IND
IAN
A
IDA
HO
HA
WA
II
MA
INE
NE
W M
EX
ICO
OK
LAH
OM
A
WIS
CO
NSI
N
GE
OR
GIA
NE
BR
ASK
A
TE
NN
ESS
EE
OH
IO
KE
NT
UC
KY
AR
KA
NSA
S
FLO
RID
A
MO
NT
AN
A
SOU
TH
DA
KO
TA
VIR
GIN
IA
KA
NSA
S
WA
SHIN
GT
ON
NO
RT
H C
AR
OLI
NA
PE
NN
SYLV
AN
IA
CO
LOR
AD
O
MIS
SISS
IPP
I
NE
W Y
OR
K
RH
OD
E IS
LAN
D
VE
RM
ON
T
U.S
.
NE
W J
ER
SEY
IOW
A
MA
RY
LAN
D
NO
RT
H D
AK
OT
A
SOU
TH
CA
RO
LIN
A
ALA
BA
MA
MA
SSA
CH
USE
TT
S
NE
W H
AM
PSH
IRE
MIS
SOU
RI
CA
LIFO
RN
IA
TE
XA
S
DE
LAW
AR
E
AR
IZO
NA
CO
NN
EC
TIC
UT
NE
VA
DA
UT
AH
-4.6%
7.1%
-14.8%
SHEEO: STATE HIGHER EDUCATION FINANCE: FY 2017 24
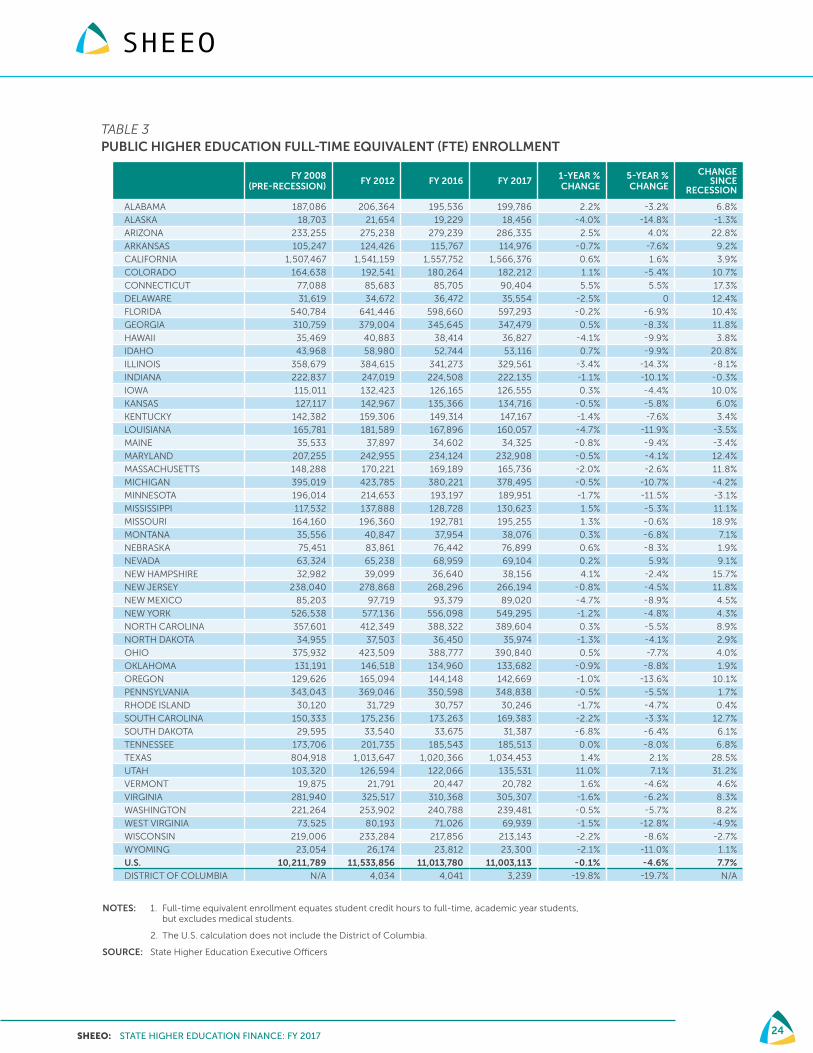
TABLE 3PUBLIC HIGHER EDUCATION FULL-TIME EQUIVALENT (FTE) ENROLLMENT
FY 2008
(PRE-RECESSION) FY 2012 FY 2016 FY 2017
1-YEAR % CHANGE
5-YEAR % CHANGE
CHANGE SINCE
RECESSION
ALABAMA 187,086 206,364 195,536 199,786 2.2% -3.2% 6.8%
ALASKA 18,703 21,654 19,229 18,456 -4.0% -14.8% -1.3%
ARIZONA 233,255 275,238 279,239 286,335 2.5% 4.0% 22.8%
ARKANSAS 105,247 124,426 115,767 114,976 -0.7% -7.6% 9.2%
CALIFORNIA 1,507,467 1,541,159 1,557,752 1,566,376 0.6% 1.6% 3.9%
COLORADO 164,638 192,541 180,264 182,212 1.1% -5.4% 10.7%
CONNECTICUT 77,088 85,683 85,705 90,404 5.5% 5.5% 17.3%
DELAWARE 31,619 34,672 36,472 35,554 -2.5% 0 12.4%
FLORIDA 540,784 641,446 598,660 597,293 -0.2% -6.9% 10.4%
GEORGIA 310,759 379,004 345,645 347,479 0.5% -8.3% 11.8%
HAWAII 35,469 40,883 38,414 36,827 -4.1% -9.9% 3.8%
IDAHO 43,968 58,980 52,744 53,116 0.7% -9.9% 20.8%
ILLINOIS 358,679 384,615 341,273 329,561 -3.4% -14.3% -8.1%
INDIANA 222,837 247,019 224,508 222,135 -1.1% -10.1% -0.3%
IOWA 115,011 132,423 126,165 126,555 0.3% -4.4% 10.0%
KANSAS 127,117 142,967 135,366 134,716 -0.5% -5.8% 6.0%
KENTUCKY 142,382 159,306 149,314 147,167 -1.4% -7.6% 3.4%
LOUISIANA 165,781 181,589 167,896 160,057 -4.7% -11.9% -3.5%
MAINE 35,533 37,897 34,602 34,325 -0.8% -9.4% -3.4%
MARYLAND 207,255 242,955 234,124 232,908 -0.5% -4.1% 12.4%
MASSACHUSETTS 148,288 170,221 169,189 165,736 -2.0% -2.6% 11.8%
MICHIGAN 395,019 423,785 380,221 378,495 -0.5% -10.7% -4.2%
MINNESOTA 196,014 214,653 193,197 189,951 -1.7% -11.5% -3.1%
MISSISSIPPI 117,532 137,888 128,728 130,623 1.5% -5.3% 11.1%
MISSOURI 164,160 196,360 192,781 195,255 1.3% -0.6% 18.9%
MONTANA 35,556 40,847 37,954 38,076 0.3% -6.8% 7.1%
NEBRASKA 75,451 83,861 76,442 76,899 0.6% -8.3% 1.9%
NEVADA 63,324 65,238 68,959 69,104 0.2% 5.9% 9.1%
NEW HAMPSHIRE 32,982 39,099 36,640 38,156 4.1% -2.4% 15.7%
NEW JERSEY 238,040 278,868 268,296 266,194 -0.8% -4.5% 11.8%
NEW MEXICO 85,203 97,719 93,379 89,020 -4.7% -8.9% 4.5%
NEW YORK 526,538 577,136 556,098 549,295 -1.2% -4.8% 4.3%
NORTH CAROLINA 357,601 412,349 388,322 389,604 0.3% -5.5% 8.9%
NORTH DAKOTA 34,955 37,503 36,450 35,974 -1.3% -4.1% 2.9%
OHIO 375,932 423,509 388,777 390,840 0.5% -7.7% 4.0%
OKLAHOMA 131,191 146,518 134,960 133,682 -0.9% -8.8% 1.9%
OREGON 129,626 165,094 144,148 142,669 -1.0% -13.6% 10.1%
PENNSYLVANIA 343,043 369,046 350,598 348,838 -0.5% -5.5% 1.7%
RHODE ISLAND 30,120 31,729 30,757 30,246 -1.7% -4.7% 0.4%
SOUTH CAROLINA 150,333 175,236 173,263 169,383 -2.2% -3.3% 12.7%
SOUTH DAKOTA 29,595 33,540 33,675 31,387 -6.8% -6.4% 6.1%
TENNESSEE 173,706 201,735 185,543 185,513 0.0% -8.0% 6.8%
TEXAS 804,918 1,013,647 1,020,366 1,034,453 1.4% 2.1% 28.5%
UTAH 103,320 126,594 122,066 135,531 11.0% 7.1% 31.2%
VERMONT 19,875 21,791 20,447 20,782 1.6% -4.6% 4.6%
VIRGINIA 281,940 325,517 310,368 305,307 -1.6% -6.2% 8.3%
WASHINGTON 221,264 253,902 240,788 239,481 -0.5% -5.7% 8.2%
WEST VIRGINIA 73,525 80,193 71,026 69,939 -1.5% -12.8% -4.9%
WISCONSIN 219,006 233,284 217,856 213,143 -2.2% -8.6% -2.7%
WYOMING 23,054 26,174 23,812 23,300 -2.1% -11.0% 1.1%
U.S. 10,211,789 11,533,856 11,013,780 11,003,113 -0.1% -4.6% 7.7%
DISTRICT OF COLUMBIA N/A 4,034 4,041 3,239 -19.8% -19.7% N/A
NOTES: 1. Full-time equivalent enrollment equates student credit hours to full-time, academic year students, but excludes medical students.
2. The U.S. calculation does not include the District of Columbia.
SOURCE: State Higher Education Executive Officers
SHEEO: STATE HIGHER EDUCATION FINANCE: FY 2017 25
2. EDUCATIONAL APPROPRIATIONS
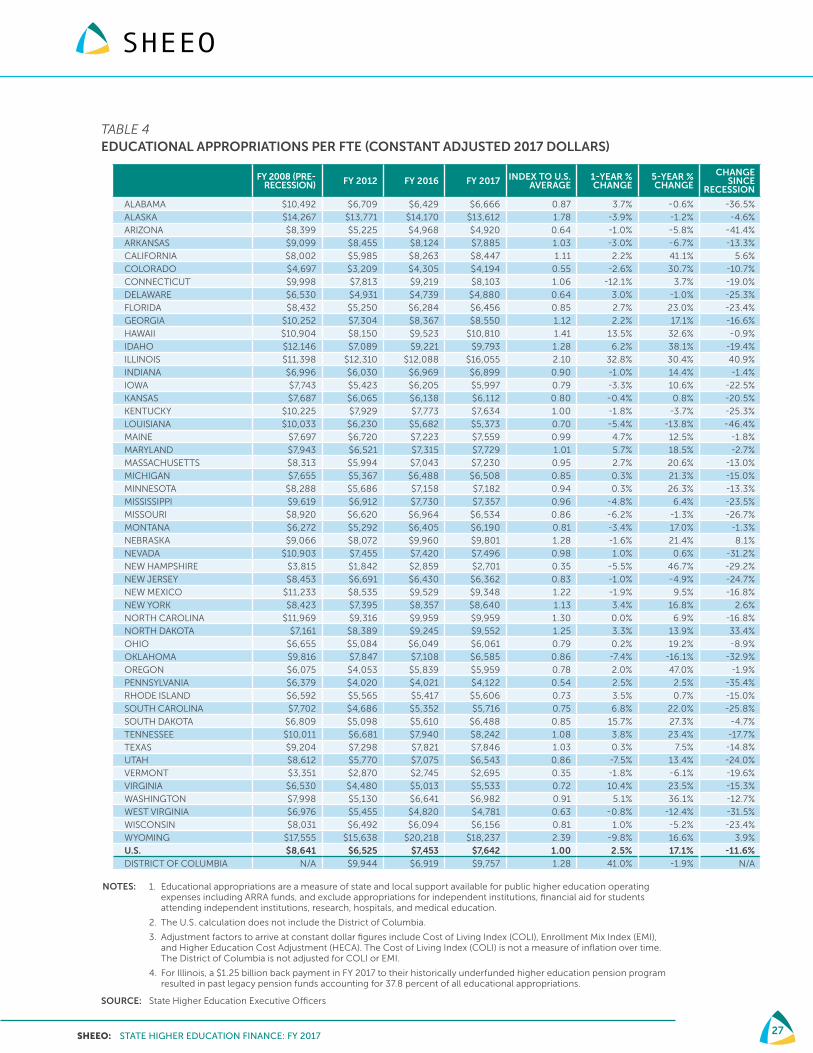
Figure 5 and the accompanying data in Table 4 show the percent change by state in higher educational appropriations per FTE student in the past five years. Five years ago (2012) was the low point of the Great Recession for educational appropriations.
• After adjusting for inflation, educational appropriations per FTE are still 11.6 percent below the pre-recession high point in 2008. However, they have increased 17.1 percent since the low point in 2012.
• Only six states have reached or surpassed their pre-recession high point in 2008. Nineteen states remain at least 20 percent below their pre-recession per student educational appropriations.
• Figure 5 shows that 37 states have seen increases in appropriations since 2012: the highest were in California, New Hampshire, and Oregon. Similarly, Table 4 shows that 27 states have increased appropriations since 2016. Virginia, Hawai’i, South Dakota, and Illinois saw increases above 10 percent.
• Twenty-two states saw decreases in the last year, the largest of which were Connecticut (12.1 percent), Wyoming (9.8 percent), Utah (7.5 percent), and Oklahoma (7.4 percent).
• Thirteen states are still below their constant dollar educational appropriations per FTE from 2012, the low point of the Great Recession. The states with the largest five-year decreases are Oklahoma (16.1 percent), Louisiana (13.8 percent), and West Virginia (12.4 percent). Each of these states has appropriations at least 30 percent below 2008 levels, and has an economy somewhat dependent on the production of natural resources.13
13. U.S. Geological Survey. (2018). Mineral Commodity Summaries 2018. Retrieved from https://minerals.usgs.gov/minerals/pubs/mcs/2018/mcs2018.pdf.

SHEEO: STATE HIGHER EDUCATION FINANCE: FY 2017 26
FIGURE 5PUBLIC HIGHER EDUCATION EDUCATIONAL APPROPRIATIONS PER FTE: PERCENT CHANGE, FY 2012-2017
NOTES: 1. Educational appropriations are a measure of state and local support available for public higher education operating expenses including ARRA funds, and exclude appropriations for independent institutions, financial aid for students attending independent institutions, research, hospitals, and medical education.
2. Adjustment factors to arrive at constant dollar figures include Cost of Living Index (COLI), Enrollment Mix Index (EMI), and Higher Education Cost Adjustment (HECA). The Cost of Living Index (COLI) is not a measure of inflation over time.
3. For Illinois, a $1.25 billion back payment in FY 17 to their historically underfunded higher education pension program resulted in past legacy pension funds accounting for 37.8 percent of all educational appropriations. The substantial increase in appropriations per FTE for Illinois between 2016 and 2017 was primarily due to institutions receiving 30 percent of their annual state appropriations (compared to levels in adjacent years).
SOURCE: State Higher Education Executive Officers
FIGURE 5
PUBLIC HIGHER EDUCATION EDUCATIONAL APPROPRIATIONS PER FTE: PERCENT CHANGE, FY 2012-2017
0%
10%
20%
30%
40%
50%
60%
OK
LAH
OM
A
LOU
ISIA
NA
WE
ST V
IRG
INIA
AR
KA
NSA
S
VE
RM
ON
T
AR
IZO
NA
WIS
CO
NSI
N
NE
W J
ER
SEY
KE
NT
UC
KY
MIS
SOU
RI
ALA
SKA
DE
LAW
AR
E
ALA
BA
MA
NE
VA
DA
RH
OD
E IS
LAN
D
KA
NSA
S
PE
NN
SYLV
AN
IA
CO
NN
EC
TIC
UT
MIS
SISS
IPP
I
NO
RT
H C
AR
OLI
NA
TE
XA
S
NE
W M
EX
ICO
IOW
A
MA
INE
UT
AH
NO
RT
H D
AK
OT
A
IND
IAN
A
WY
OM
ING
NE
W Y
OR
K
MO
NT
AN
A
GE
OR
GIA
U.S
.
MA
RY
LAN
D
OH
IO
MA
SSA
CH
USE
TT
S
MIC
HIG
AN
NE
BR
ASK
A
SOU
TH
CA
RO
LIN
A
FLO
RID
A
TE
NN
ESS
EE
VIR
GIN
IA
MIN
NE
SOT
A
SOU
TH
DA
KO
TA
ILLI
NO
IS
CO
LOR
AD
O
HA
WA
II
WA
SHIN
GT
ON
IDA
HO
CA
LIFO
RN
IA
NE
W H
AM
PSH
IRE
OR
EG
ON
-16.1%
17.1%
47.0%
-20%
-10%
SHEEO: STATE HIGHER EDUCATION FINANCE: FY 2017 27
TABLE 4EDUCATIONAL APPROPRIATIONS PER FTE (CONSTANT ADJUSTED 2017 DOLLARS)
FY 2008 (PRE- RECESSION) FY 2012 FY 2016 FY 2017 INDEX TO U.S.
AVERAGE1-YEAR % CHANGE
5-YEAR % CHANGE
CHANGE SINCE
RECESSION
ALABAMA $10,492 $6,709 $6,429 $6,666 0.87 3.7% -0.6% -36.5%
ALASKA $14,267 $13,771 $14,170 $13,612 1.78 -3.9% -1.2% -4.6%
ARIZONA $8,399 $5,225 $4,968 $4,920 0.64 -1.0% -5.8% -41.4%
ARKANSAS $9,099 $8,455 $8,124 $7,885 1.03 -3.0% -6.7% -13.3%
CALIFORNIA $8,002 $5,985 $8,263 $8,447 1.11 2.2% 41.1% 5.6%
COLORADO $4,697 $3,209 $4,305 $4,194 0.55 -2.6% 30.7% -10.7%
CONNECTICUT $9,998 $7,813 $9,219 $8,103 1.06 -12.1% 3.7% -19.0%
DELAWARE $6,530 $4,931 $4,739 $4,880 0.64 3.0% -1.0% -25.3%
FLORIDA $8,432 $5,250 $6,284 $6,456 0.85 2.7% 23.0% -23.4%
GEORGIA $10,252 $7,304 $8,367 $8,550 1.12 2.2% 17.1% -16.6%
HAWAII $10,904 $8,150 $9,523 $10,810 1.41 13.5% 32.6% -0.9%
IDAHO $12,146 $7,089 $9,221 $9,793 1.28 6.2% 38.1% -19.4%
ILLINOIS $11,398 $12,310 $12,088 $16,055 2.10 32.8% 30.4% 40.9%
INDIANA $6,996 $6,030 $6,969 $6,899 0.90 -1.0% 14.4% -1.4%
IOWA $7,743 $5,423 $6,205 $5,997 0.79 -3.3% 10.6% -22.5%
KANSAS $7,687 $6,065 $6,138 $6,112 0.80 -0.4% 0.8% -20.5%
KENTUCKY $10,225 $7,929 $7,773 $7,634 1.00 -1.8% -3.7% -25.3%
LOUISIANA $10,033 $6,230 $5,682 $5,373 0.70 -5.4% -13.8% -46.4%
MAINE $7,697 $6,720 $7,223 $7,559 0.99 4.7% 12.5% -1.8%
MARYLAND $7,943 $6,521 $7,315 $7,729 1.01 5.7% 18.5% -2.7%
MASSACHUSETTS $8,313 $5,994 $7,043 $7,230 0.95 2.7% 20.6% -13.0%
MICHIGAN $7,655 $5,367 $6,488 $6,508 0.85 0.3% 21.3% -15.0%
MINNESOTA $8,288 $5,686 $7,158 $7,182 0.94 0.3% 26.3% -13.3%
MISSISSIPPI $9,619 $6,912 $7,730 $7,357 0.96 -4.8% 6.4% -23.5%
MISSOURI $8,920 $6,620 $6,964 $6,534 0.86 -6.2% -1.3% -26.7%
MONTANA $6,272 $5,292 $6,405 $6,190 0.81 -3.4% 17.0% -1.3%
NEBRASKA $9,066 $8,072 $9,960 $9,801 1.28 -1.6% 21.4% 8.1%
NEVADA $10,903 $7,455 $7,420 $7,496 0.98 1.0% 0.6% -31.2%
NEW HAMPSHIRE $3,815 $1,842 $2,859 $2,701 0.35 -5.5% 46.7% -29.2%
NEW JERSEY $8,453 $6,691 $6,430 $6,362 0.83 -1.0% -4.9% -24.7%
NEW MEXICO $11,233 $8,535 $9,529 $9,348 1.22 -1.9% 9.5% -16.8%
NEW YORK $8,423 $7,395 $8,357 $8,640 1.13 3.4% 16.8% 2.6%
NORTH CAROLINA $11,969 $9,316 $9,959 $9,959 1.30 0.0% 6.9% -16.8%
NORTH DAKOTA $7,161 $8,389 $9,245 $9,552 1.25 3.3% 13.9% 33.4%
OHIO $6,655 $5,084 $6,049 $6,061 0.79 0.2% 19.2% -8.9%
OKLAHOMA $9,816 $7,847 $7,108 $6,585 0.86 -7.4% -16.1% -32.9%
OREGON $6,075 $4,053 $5,839 $5,959 0.78 2.0% 47.0% -1.9%
PENNSYLVANIA $6,379 $4,020 $4,021 $4,122 0.54 2.5% 2.5% -35.4%
RHODE ISLAND $6,592 $5,565 $5,417 $5,606 0.73 3.5% 0.7% -15.0%
SOUTH CAROLINA $7,702 $4,686 $5,352 $5,716 0.75 6.8% 22.0% -25.8%
SOUTH DAKOTA $6,809 $5,098 $5,610 $6,488 0.85 15.7% 27.3% -4.7%
TENNESSEE $10,011 $6,681 $7,940 $8,242 1.08 3.8% 23.4% -17.7%
TEXAS $9,204 $7,298 $7,821 $7,846 1.03 0.3% 7.5% -14.8%
UTAH $8,612 $5,770 $7,075 $6,543 0.86 -7.5% 13.4% -24.0%
VERMONT $3,351 $2,870 $2,745 $2,695 0.35 -1.8% -6.1% -19.6%
VIRGINIA $6,530 $4,480 $5,013 $5,533 0.72 10.4% 23.5% -15.3%
WASHINGTON $7,998 $5,130 $6,641 $6,982 0.91 5.1% 36.1% -12.7%
WEST VIRGINIA $6,976 $5,455 $4,820 $4,781 0.63 -0.8% -12.4% -31.5%
WISCONSIN $8,031 $6,492 $6,094 $6,156 0.81 1.0% -5.2% -23.4%
WYOMING $17,555 $15,638 $20,218 $18,237 2.39 -9.8% 16.6% 3.9%
U.S. $8,641 $6,525 $7,453 $7,642 1.00 2.5% 17.1% -11.6%DISTRICT OF COLUMBIA N/A $9,944 $6,919 $9,757 1.28 41.0% -1.9% N/A
NOTES: 1. Educational appropriations are a measure of state and local support available for public higher education operating expenses including ARRA funds, and exclude appropriations for independent institutions, financial aid for students attending independent institutions, research, hospitals, and medical education.
2. The U.S. calculation does not include the District of Columbia.
3. Adjustment factors to arrive at constant dollar figures include Cost of Living Index (COLI), Enrollment Mix Index (EMI), and Higher Education Cost Adjustment (HECA). The Cost of Living Index (COLI) is not a measure of inflation over time. The District of Columbia is not adjusted for COLI or EMI.
4. For Illinois, a $1.25 billion back payment in FY 2017 to their historically underfunded higher education pension program resulted in past legacy pension funds accounting for 37.8 percent of all educational appropriations. SOURCE: State Higher Education Executive Officers

SHEEO: STATE HIGHER EDUCATION FINANCE: FY 2017 28
3. NET TUITION REVENUE
Figure 6 shows net tuition revenue as a percentage of total educational revenue for public higher education by state for 2017. The accompanying data in Table 5 show the constant dollar values of net tuition per FTE by state.
• Thirty-three states have increased constant dollar per FTE net tuition revenue from 2016 to 2017. The largest increase was in Louisiana (22.6 percent). No other state had an increase above 10 percent.
• Seventeen states saw a decrease in net tuition revenue, the largest of which was 10.8 percent in Missouri. Decreases in constant dollar net tuition revenue per FTE should not be construed as being driven entirely by changes in tuition rates. Changes like more students at institutions with lower tuition and fees or fewer out-of-state students may also impact net tuition revenue.
• Since the recession, all but two states (Massachusetts and Missouri) have seen an increase in net tuition revenue. Since 2008, net tuition revenue has increased by more than 50 percent in 12 states, and has increased 103.3 percent in Georgia. Despite this increase, in 2017 Georgia still had the 9th lowest net tuition revenue in the U.S.
• Figure 6 shows that states vary widely in net tuition as a percent of total revenue (the student share), from 14.7 percent in Wyoming to 86.6 percent in Vermont. Since 2008, the student share has increased in all but two states (North Dakota and Wyoming), yet the relative positions in Figure 6 have not changed; states do not generally move from below average to above average.
• Thirty-three states are above the national average student share of 46.4 percent. Twenty-eight states are above a 50 percent student share. This means that for the first time, public higher education is more dependent on tuition revenue than educational appropriations in over half of all states.
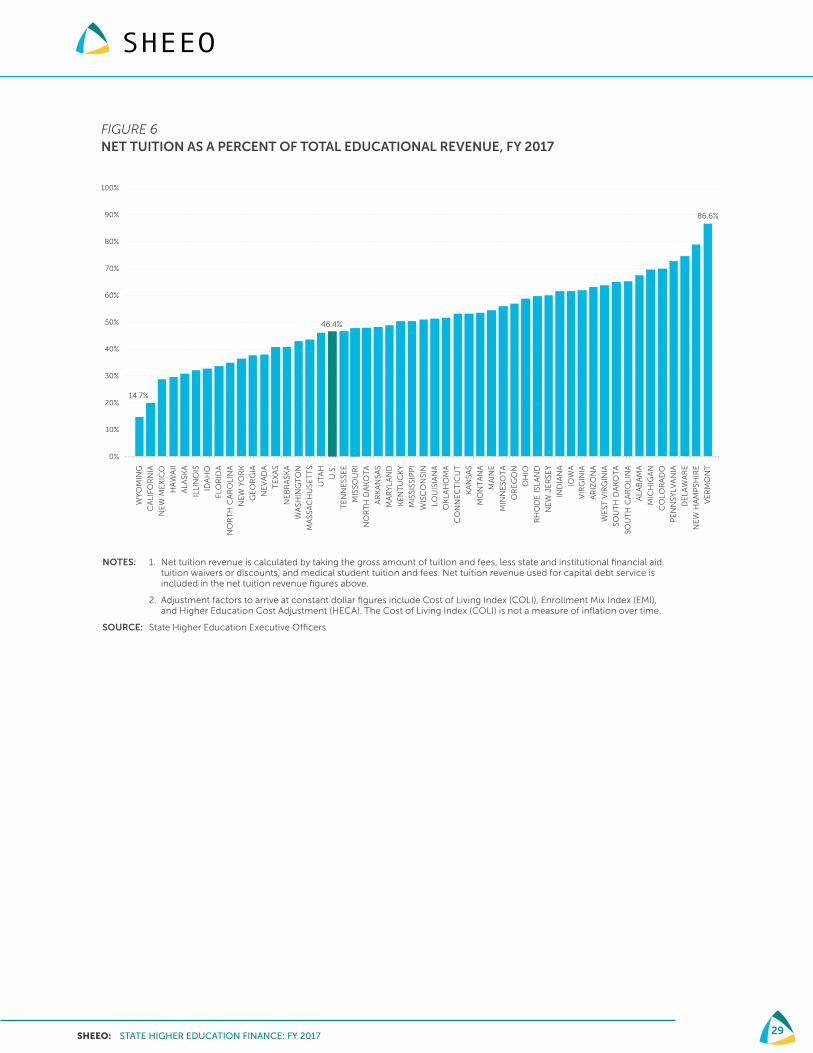
SHEEO: STATE HIGHER EDUCATION FINANCE: FY 2017 29
FIGURE 6NET TUITION AS A PERCENT OF TOTAL EDUCATIONAL REVENUE, FY 2017
NOTES: 1. Net tuition revenue is calculated by taking the gross amount of tuition and fees, less state and institutional financial aid, tuition waivers or discounts, and medical student tuition and fees. Net tuition revenue used for capital debt service is included in the net tuition revenue figures above.
2. Adjustment factors to arrive at constant dollar figures include Cost of Living Index (COLI), Enrollment Mix Index (EMI), and Higher Education Cost Adjustment (HECA). The Cost of Living Index (COLI) is not a measure of inflation over time.
SOURCE: State Higher Education Executive Officers
FIGURE 6
NET TUITION AS A PERCENT OF TOTAL PUBLIC EDUCATIONAL REVENUE, FY 2017
0%
10%
20%
30%
40%
50%
60%
70%
80%
90%
100%
WY
OM
ING
CA
LIFO
RN
IA
NE
W M
EX
ICO
HA
WA
II
ALA
SKA
ILLI
NO
IS
IDA
HO
FLO
RID
A
NO
RT
H C
AR
OLI
NA
NE
W Y
OR
K
GE
OR
GIA
NE
VA
DA
TE
XA
S
NE
BR
ASK
A
WA
SHIN
GT
ON
MA
SSA
CH
USE
TT
S
UT
AH
U.S
.
TE
NN
ESS
EE
MIS
SOU
RI
NO
RT
H D
AK
OT
A
AR
KA
NSA
S
MA
RY
LAN
D
KE
NT
UC
KY
MIS
SISS
IPP
I
WIS
CO
NSI
N
LOU
ISIA
NA
OK
LAH
OM
A
CO
NN
EC
TIC
UT
KA
NSA
S
MO
NT
AN
A
MA
INE
MIN
NE
SOT
A
OR
EG
ON
OH
IO
RH
OD
E IS
LAN
D
NE
W J
ER
SEY
IND
IAN
A
IOW
A
SOU
TH
CA
RO
LIN
A
VIR
GIN
IA
AR
IZO
NA
WE
ST V
IRG
INIA
SOU
TH
DA
KO
TA
ALA
BA
MA
MIC
HIG
AN
CO
LOR
AD
O
PE
NN
SYLV
AN
IA
DE
LAW
AR
E
NE
W H
AM
PSH
IRE
VE
RM
ON
T
86.6%
46.4%
14.7%
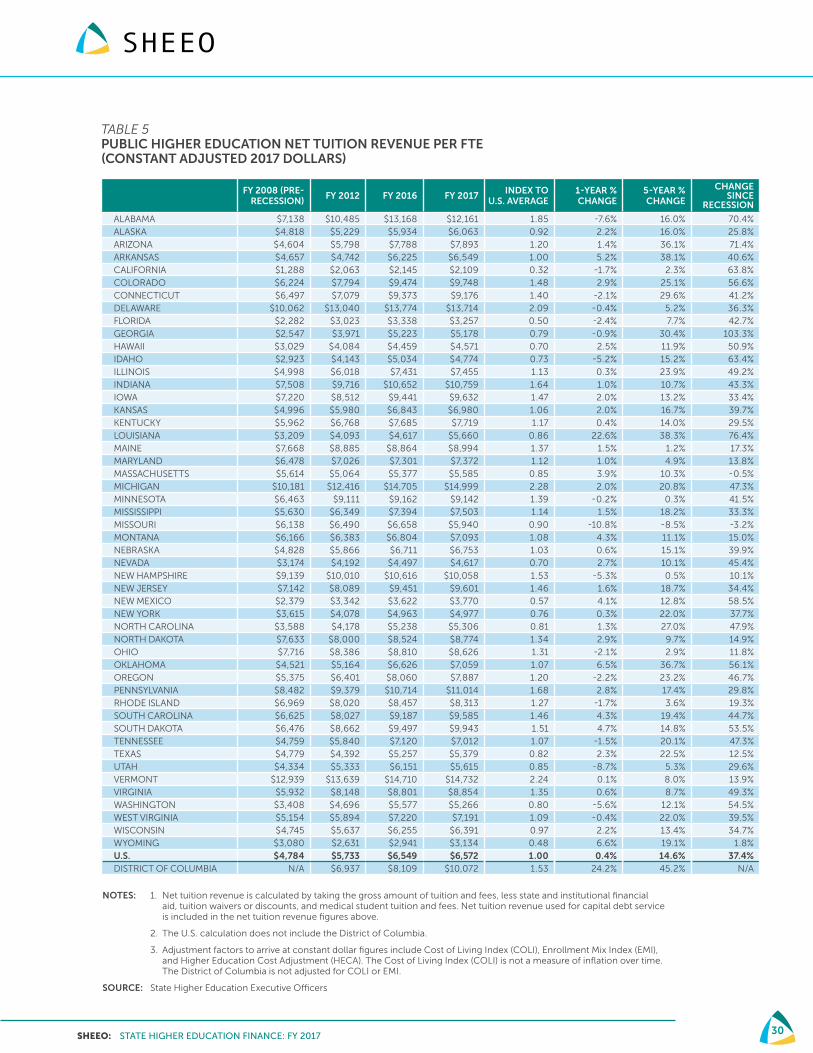
SHEEO: STATE HIGHER EDUCATION FINANCE: FY 2017 30
TABLE 5PUBLIC HIGHER EDUCATION NET TUITION REVENUE PER FTE (CONSTANT ADJUSTED 2017 DOLLARS)
FY 2008 (PRE-
RECESSION) FY 2012 FY 2016 FY 2017
INDEX TO U.S. AVERAGE
1-YEAR % CHANGE
5-YEAR % CHANGE
CHANGE SINCE
RECESSION
ALABAMA $7,138 $10,485 $13,168 $12,161 1.85 -7.6% 16.0% 70.4%
ALASKA $4,818 $5,229 $5,934 $6,063 0.92 2.2% 16.0% 25.8%
ARIZONA $4,604 $5,798 $7,788 $7,893 1.20 1.4% 36.1% 71.4%
ARKANSAS $4,657 $4,742 $6,225 $6,549 1.00 5.2% 38.1% 40.6%
CALIFORNIA $1,288 $2,063 $2,145 $2,109 0.32 -1.7% 2.3% 63.8%
COLORADO $6,224 $7,794 $9,474 $9,748 1.48 2.9% 25.1% 56.6%
CONNECTICUT $6,497 $7,079 $9,373 $9,176 1.40 -2.1% 29.6% 41.2%
DELAWARE $10,062 $13,040 $13,774 $13,714 2.09 -0.4% 5.2% 36.3%
FLORIDA $2,282 $3,023 $3,338 $3,257 0.50 -2.4% 7.7% 42.7%
GEORGIA $2,547 $3,971 $5,223 $5,178 0.79 -0.9% 30.4% 103.3%
HAWAII $3,029 $4,084 $4,459 $4,571 0.70 2.5% 11.9% 50.9%
IDAHO $2,923 $4,143 $5,034 $4,774 0.73 -5.2% 15.2% 63.4%
ILLINOIS $4,998 $6,018 $7,431 $7,455 1.13 0.3% 23.9% 49.2%
INDIANA $7,508 $9,716 $10,652 $10,759 1.64 1.0% 10.7% 43.3%
IOWA $7,220 $8,512 $9,441 $9,632 1.47 2.0% 13.2% 33.4%
KANSAS $4,996 $5,980 $6,843 $6,980 1.06 2.0% 16.7% 39.7%
KENTUCKY $5,962 $6,768 $7,685 $7,719 1.17 0.4% 14.0% 29.5%
LOUISIANA $3,209 $4,093 $4,617 $5,660 0.86 22.6% 38.3% 76.4%
MAINE $7,668 $8,885 $8,864 $8,994 1.37 1.5% 1.2% 17.3%
MARYLAND $6,478 $7,026 $7,301 $7,372 1.12 1.0% 4.9% 13.8%
MASSACHUSETTS $5,614 $5,064 $5,377 $5,585 0.85 3.9% 10.3% -0.5%
MICHIGAN $10,181 $12,416 $14,705 $14,999 2.28 2.0% 20.8% 47.3%
MINNESOTA $6,463 $9,111 $9,162 $9,142 1.39 -0.2% 0.3% 41.5%
MISSISSIPPI $5,630 $6,349 $7,394 $7,503 1.14 1.5% 18.2% 33.3%
MISSOURI $6,138 $6,490 $6,658 $5,940 0.90 -10.8% -8.5% -3.2%
MONTANA $6,166 $6,383 $6,804 $7,093 1.08 4.3% 11.1% 15.0%
NEBRASKA $4,828 $5,866 $6,711 $6,753 1.03 0.6% 15.1% 39.9%
NEVADA $3,174 $4,192 $4,497 $4,617 0.70 2.7% 10.1% 45.4%
NEW HAMPSHIRE $9,139 $10,010 $10,616 $10,058 1.53 -5.3% 0.5% 10.1%
NEW JERSEY $7,142 $8,089 $9,451 $9,601 1.46 1.6% 18.7% 34.4%
NEW MEXICO $2,379 $3,342 $3,622 $3,770 0.57 4.1% 12.8% 58.5%
NEW YORK $3,615 $4,078 $4,963 $4,977 0.76 0.3% 22.0% 37.7%
NORTH CAROLINA $3,588 $4,178 $5,238 $5,306 0.81 1.3% 27.0% 47.9%
NORTH DAKOTA $7,633 $8,000 $8,524 $8,774 1.34 2.9% 9.7% 14.9%
OHIO $7,716 $8,386 $8,810 $8,626 1.31 -2.1% 2.9% 11.8%
OKLAHOMA $4,521 $5,164 $6,626 $7,059 1.07 6.5% 36.7% 56.1%
OREGON $5,375 $6,401 $8,060 $7,887 1.20 -2.2% 23.2% 46.7%
PENNSYLVANIA $8,482 $9,379 $10,714 $11,014 1.68 2.8% 17.4% 29.8%
RHODE ISLAND $6,969 $8,020 $8,457 $8,313 1.27 -1.7% 3.6% 19.3%
SOUTH CAROLINA $6,625 $8,027 $9,187 $9,585 1.46 4.3% 19.4% 44.7%
SOUTH DAKOTA $6,476 $8,662 $9,497 $9,943 1.51 4.7% 14.8% 53.5%
TENNESSEE $4,759 $5,840 $7,120 $7,012 1.07 -1.5% 20.1% 47.3%
TEXAS $4,779 $4,392 $5,257 $5,379 0.82 2.3% 22.5% 12.5%
UTAH $4,334 $5,333 $6,151 $5,615 0.85 -8.7% 5.3% 29.6%
VERMONT $12,939 $13,639 $14,710 $14,732 2.24 0.1% 8.0% 13.9%
VIRGINIA $5,932 $8,148 $8,801 $8,854 1.35 0.6% 8.7% 49.3%
WASHINGTON $3,408 $4,696 $5,577 $5,266 0.80 -5.6% 12.1% 54.5%
WEST VIRGINIA $5,154 $5,894 $7,220 $7,191 1.09 -0.4% 22.0% 39.5%
WISCONSIN $4,745 $5,637 $6,255 $6,391 0.97 2.2% 13.4% 34.7%
WYOMING $3,080 $2,631 $2,941 $3,134 0.48 6.6% 19.1% 1.8%
U.S. $4,784 $5,733 $6,549 $6,572 1.00 0.4% 14.6% 37.4%DISTRICT OF COLUMBIA N/A $6,937 $8,109 $10,072 1.53 24.2% 45.2% N/A
NOTES: 1. Net tuition revenue is calculated by taking the gross amount of tuition and fees, less state and institutional financial aid, tuition waivers or discounts, and medical student tuition and fees. Net tuition revenue used for capital debt service is included in the net tuition revenue figures above.
2. The U.S. calculation does not include the District of Columbia.
3. Adjustment factors to arrive at constant dollar figures include Cost of Living Index (COLI), Enrollment Mix Index (EMI), and Higher Education Cost Adjustment (HECA). The Cost of Living Index (COLI) is not a measure of inflation over time. The District of Columbia is not adjusted for COLI or EMI.
SOURCE: State Higher Education Executive Officers
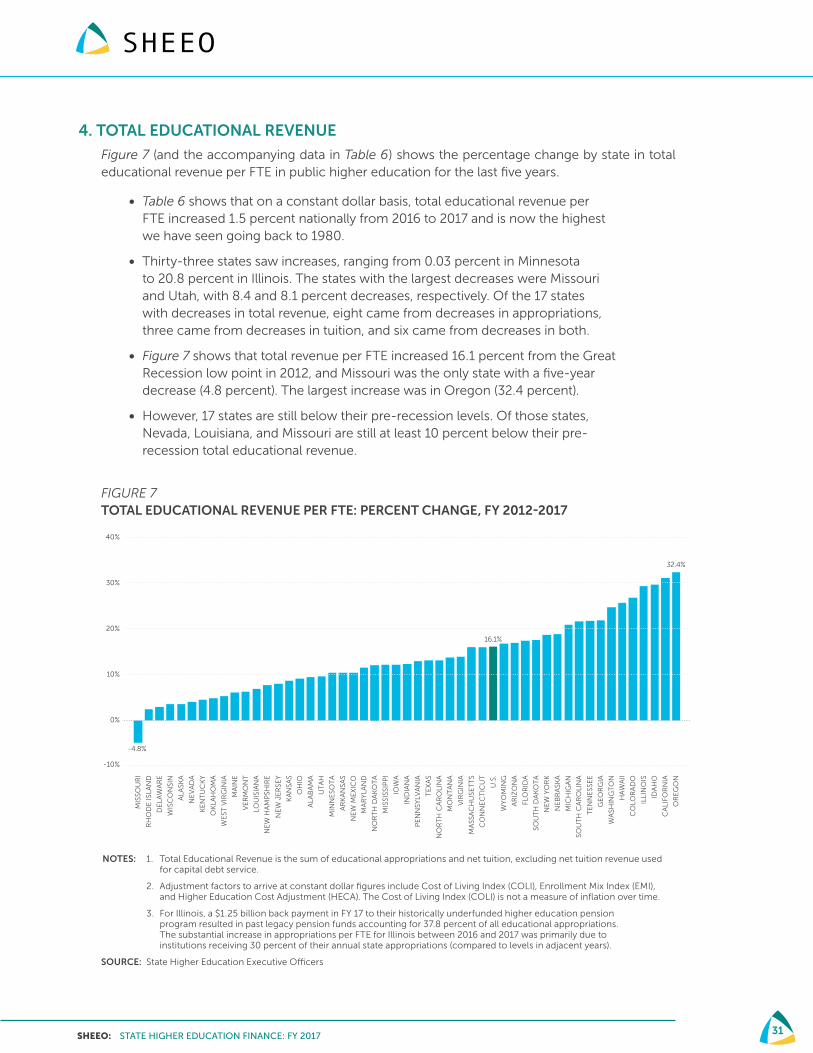
SHEEO: STATE HIGHER EDUCATION FINANCE: FY 2017 31
4. TOTAL EDUCATIONAL REVENUE
Figure 7 (and the accompanying data in Table 6) shows the percentage change by state in total educational revenue per FTE in public higher education for the last five years.
• Table 6 shows that on a constant dollar basis, total educational revenue per FTE increased 1.5 percent nationally from 2016 to 2017 and is now the highest we have seen going back to 1980.
• Thirty-three states saw increases, ranging from 0.03 percent in Minnesota to 20.8 percent in Illinois. The states with the largest decreases were Missouri and Utah, with 8.4 and 8.1 percent decreases, respectively. Of the 17 states with decreases in total revenue, eight came from decreases in appropriations, three came from decreases in tuition, and six came from decreases in both.
• Figure 7 shows that total revenue per FTE increased 16.1 percent from the Great Recession low point in 2012, and Missouri was the only state with a five-year decrease (4.8 percent). The largest increase was in Oregon (32.4 percent).
• However, 17 states are still below their pre-recession levels. Of those states, Nevada, Louisiana, and Missouri are still at least 10 percent below their pre-recession total educational revenue.
FIGURE 7TOTAL EDUCATIONAL REVENUE PER FTE: PERCENT CHANGE, FY 2012-2017
NOTES: 1. Total Educational Revenue is the sum of educational appropriations and net tuition, excluding net tuition revenue used for capital debt service.
2. Adjustment factors to arrive at constant dollar figures include Cost of Living Index (COLI), Enrollment Mix Index (EMI), and Higher Education Cost Adjustment (HECA). The Cost of Living Index (COLI) is not a measure of inflation over time.
3. For Illinois, a $1.25 billion back payment in FY 17 to their historically underfunded higher education pension program resulted in past legacy pension funds accounting for 37.8 percent of all educational appropriations. The substantial increase in appropriations per FTE for Illinois between 2016 and 2017 was primarily due to institutions receiving 30 percent of their annual state appropriations (compared to levels in adjacent years).
SOURCE: State Higher Education Executive Officers
FIGURE 7
TOTAL EDUCATIONAL REVENUE PER FTE: PERCENT CHANGE, FY 2012-2017
0%
10%
20%
30%
40%
MIS
SOU
RI
RH
OD
E IS
LAN
D
DE
LAW
AR
E
WIS
CO
NSI
N
ALA
SKA
NE
VA
DA
KE
NT
UC
KY
OK
LAH
OM
A
WE
ST V
IRG
INIA
MA
INE
VE
RM
ON
T
LOU
ISIA
NA
NE
W H
AM
PSH
IRE
NE
W J
ER
SEY
KA
NSA
S
OH
IO
ALA
BA
MA
UT
AH
SOU
TH
CA
RO
LIN
A
MIN
NE
SOT
A
AR
KA
NSA
S
NE
W M
EX
ICO
MA
RY
LAN
D
NO
RT
H D
AK
OT
A
MIS
SISS
IPP
I
IOW
A
IND
IAN
A
PE
NN
SYLV
AN
IA
TE
XA
S
NO
RT
H C
AR
OLI
NA
MO
NT
AN
A
VIR
GIN
IA
U.S
.
MA
SSA
CH
USE
TT
S
CO
NN
EC
TIC
UT
WY
OM
ING
AR
IZO
NA
FLO
RID
A
SOU
TH
DA
KO
TA
NE
W Y
OR
K
NE
BR
ASK
A
MIC
HIG
AN
TE
NN
ESS
EE
GE
OR
GIA
WA
SHIN
GT
ON
HA
WA
II
CO
LOR
AD
O
ILLI
NO
IS
IDA
HO
CA
LIFO
RN
IA
OR
EG
ON
-10%
32.4%
16.1%
-4.8%

SHEEO: STATE HIGHER EDUCATION FINANCE: FY 2017 32
TABLE 6 TOTAL EDUCATIONAL REVENUE PER FTE (CONSTANT ADJUSTED 2017 DOLLARS)
FY 2008 (PRE-RECESSION) FY 2012 FY 2016 FY 2017 INDEX TO
U.S. AVERAGE1-YEAR % CHANGE
5-YEAR % CHANGE
CHANGE SINCE
RECESSION
ALABAMA $17,052 $16,454 $18,701 $18,007 1.27 -3.7% 9.4% 5.6%
ALASKA $19,085 $19,000 $20,104 $19,676 1.39 -2.1% 3.6% 3.1%
ARIZONA $12,646 $10,708 $12,413 $12,519 0.89 0.8% 16.9% -1.0%
ARKANSAS $13,030 $12,297 $13,510 $13,581 0.96 0.5% 10.4% 4.2%
CALIFORNIA $9,290 $8,048 $10,408 $10,556 0.75 1.4% 31.2% 13.6%
COLORADO $10,921 $11,003 $13,779 $13,942 0.99 1.2% 26.7% 27.7%
CONNECTICUT $16,495 $14,892 $18,592 $17,278 1.22 -7.1% 16.0% 4.8%
DELAWARE $16,545 $17,886 $18,354 $18,408 1.30 0.3% 2.9% 11.3%
FLORIDA $10,713 $8,273 $9,622 $9,712 0.69 0.9% 17.4% -9.3%
GEORGIA $12,776 $11,258 $13,583 $13,721 0.97 1.0% 21.9% 7.4%
HAWAII $13,933 $12,234 $13,983 $15,381 1.09 10.0% 25.7% 10.4%
IDAHO $15,069 $11,232 $14,255 $14,567 1.03 2.2% 29.7% -3.3%
ILLINOIS $16,223 $17,956 $19,220 $23,228 1.64 20.8% 29.4% 43.2%
INDIANA $14,468 $15,556 $17,432 $17,468 1.23 0.2% 12.3% 20.7%
IOWA $14,963 $13,934 $15,646 $15,630 1.11 -0.1% 12.2% 4.5%
KANSAS $12,683 $12,046 $12,981 $13,091 0.93 0.8% 8.7% 3.2%
KENTUCKY $16,187 $14,697 $15,457 $15,353 1.09 -0.7% 4.5% -5.2%
LOUISIANA $13,242 $10,323 $10,299 $11,033 0.78 7.1% 6.9% -16.7%
MAINE $15,364 $15,604 $16,086 $16,553 1.17 2.9% 6.1% 7.7%
MARYLAND $14,421 $13,547 $14,616 $15,101 1.07 3.3% 11.5% 4.7%
MASSACHUSETTS $13,927 $11,057 $12,421 $12,815 0.91 3.2% 15.9% -8.0%
MICHIGAN $17,836 $17,783 $21,193 $21,507 1.52 1.5% 20.9% 20.6%
MINNESOTA $14,751 $14,797 $16,320 $16,324 1.15 0.0% 10.3% 10.7%
MISSISSIPPI $15,249 $13,261 $15,124 $14,860 1.05 -1.7% 12.1% -2.5%
MISSOURI $15,058 $13,110 $13,621 $12,474 0.88 -8.4% -4.8% -17.2%
MONTANA $12,438 $11,675 $13,208 $13,283 0.94 0.6% 13.8% 6.8%
NEBRASKA $13,894 $13,938 $16,672 $16,553 1.17 -0.7% 18.8% 19.1%
NEVADA $14,077 $11,646 $11,916 $12,113 0.86 1.7% 4.0% -14.0%
NEW HAMPSHIRE $12,954 $11,851 $13,476 $12,759 0.90 -5.3% 7.7% -1.5%
NEW JERSEY $15,595 $14,780 $15,881 $15,963 1.13 0.5% 8.0% 2.4%
NEW MEXICO $13,613 $11,877 $13,151 $13,118 0.93 -0.2% 10.4% -3.6%
NEW YORK $12,038 $11,473 $13,320 $13,617 0.96 2.2% 18.7% 13.1%
NORTH CAROLINA $15,557 $13,493 $15,197 $15,265 1.08 0.5% 13.1% -1.9%
NORTH DAKOTA $14,794 $16,389 $17,769 $18,326 1.30 3.1% 11.8% 23.9%
OHIO $14,371 $13,469 $14,859 $14,688 1.04 -1.2% 9.0% 2.2%
OKLAHOMA $14,337 $13,011 $13,734 $13,644 0.96 -0.7% 4.9% -4.8%
OREGON $11,451 $10,454 $13,900 $13,846 0.98 -0.4% 32.4% 20.9%
PENNSYLVANIA $14,861 $13,399 $14,735 $15,135 1.07 2.7% 13.0% 1.8%
RHODE ISLAND $13,561 $13,585 $13,874 $13,919 0.98 0.3% 2.5% 2.6%
SOUTH CAROLINA $13,767 $12,074 $13,932 $14,693 1.04 5.5% 21.7% 6.7%
SOUTH DAKOTA $12,669 $13,000 $14,035 $15,279 1.08 8.9% 17.5% 20.6%
TENNESSEE $14,600 $12,347 $14,853 $15,045 1.06 1.3% 21.8% 3.0%
TEXAS $13,979 $11,690 $13,078 $13,225 0.94 1.1% 13.1% -5.4%
UTAH $12,946 $11,103 $13,225 $12,158 0.86 -8.1% 9.5% -6.1%
VERMONT $15,962 $16,020 $17,056 $17,019 1.20 -0.2% 6.2% 6.6%
VIRGINIA $12,446 $12,557 $13,735 $14,309 1.01 4.2% 14.0% 15.0%
WASHINGTON $11,405 $9,826 $12,217 $12,249 0.87 0.3% 24.6% 7.4%
WEST VIRGINIA $11,405 $10,690 $11,289 $11,256 0.80 -0.3% 5.3% -1.3%
WISCONSIN $12,777 $12,128 $12,349 $12,547 0.89 1.6% 3.5% -1.8%
WYOMING $20,634 $18,269 $23,118 $21,331 1.51 -7.7% 16.8% 3.4%
U.S. $13,375 $12,192 $13,935 $14,151 1.00 1.5% 16.1% 5.8%DISTRICT OF COLUMBIA N/A $16,881 $15,028 $19,828 1.40 31.9% 17.5% N/A
NOTES: 1. Total educational revenue is the sum of educational appropriations and net tuition, excluding net tuition revenue used for capital debt service.
2. The U.S. calculation does not include the District of Columbia.
3. Adjustment factors to arrive at constant dollar figures include Cost of Living Index (COLI), Enrollment Mix Index (EMI), and Higher Education Cost Adjustment (HECA). The Cost of Living Index (COLI) is not a measure of inflation over time. The District of Columbia is not adjusted for COLI or EMI.
4. For Illinois, a $1.25 billion back payment in FY 2017 to their historically underfunded higher education pension program resulted in past legacy pension funds accounting for 37.8 percent of all educational appropriations. SOURCE: State Higher Education Executive Officers
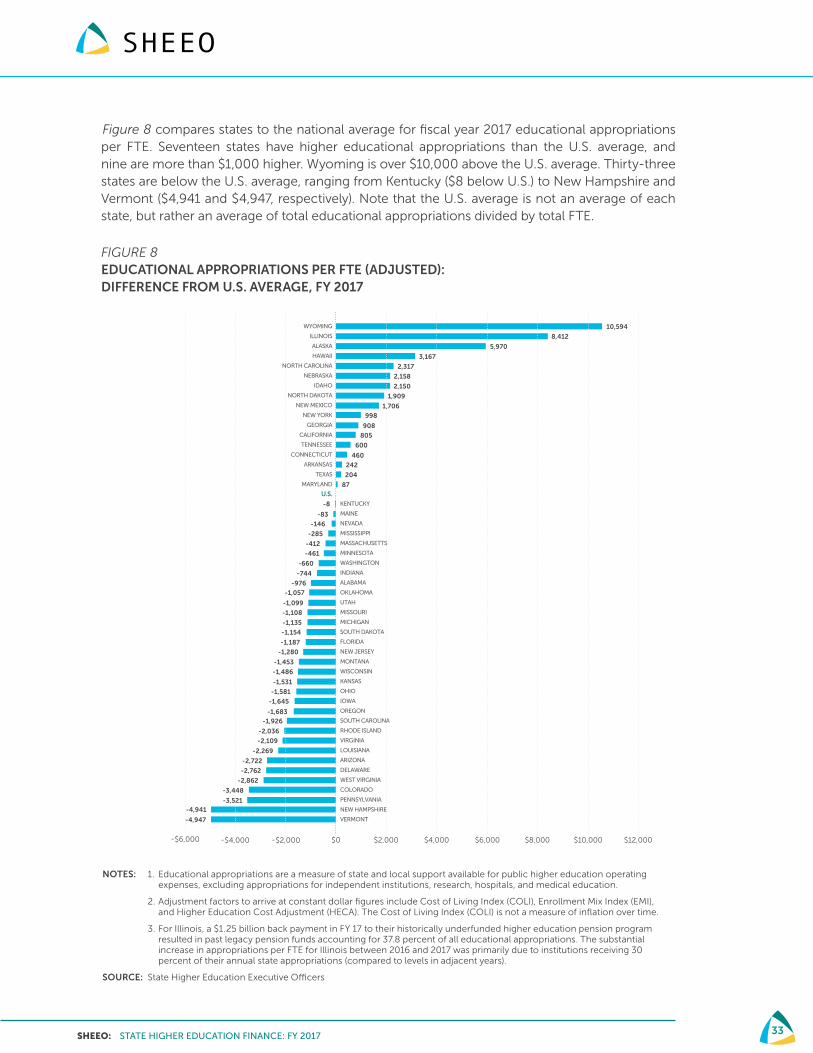
SHEEO: STATE HIGHER EDUCATION FINANCE: FY 2017 33
Figure 8 compares states to the national average for fiscal year 2017 educational appropriations per FTE. Seventeen states have higher educational appropriations than the U.S. average, and nine are more than $1,000 higher. Wyoming is over $10,000 above the U.S. average. Thirty-three states are below the U.S. average, ranging from Kentucky ($8 below U.S.) to New Hampshire and Vermont ($4,941 and $4,947, respectively). Note that the U.S. average is not an average of each state, but rather an average of total educational appropriations divided by total FTE.
FIGURE 8EDUCATIONAL APPROPRIATIONS PER FTE (ADJUSTED): DIFFERENCE FROM U.S. AVERAGE, FY 2017
NOTES: 1. Educational appropriations are a measure of state and local support available for public higher education operating expenses, excluding appropriations for independent institutions, research, hospitals, and medical education.
2. Adjustment factors to arrive at constant dollar figures include Cost of Living Index (COLI), Enrollment Mix Index (EMI), and Higher Education Cost Adjustment (HECA). The Cost of Living Index (COLI) is not a measure of inflation over time.
3. For Illinois, a $1.25 billion back payment in FY 17 to their historically underfunded higher education pension program resulted in past legacy pension funds accounting for 37.8 percent of all educational appropriations. The substantial increase in appropriations per FTE for Illinois between 2016 and 2017 was primarily due to institutions receiving 30 percent of their annual state appropriations (compared to levels in adjacent years).
SOURCE: State Higher Education Executive Officers
FIGURE 8
EDUCATIONAL APPROPRIATIONS PER FTE (ADJUSTED) - DIFFERENCE FROM U.S. AVERAGE, FY 2017
10,594
8,412
5,970
3,167
2,317
2,158
2,150
1,909
1,706
998
908
805
600
460
242
204
87
$0 $2,000 $4,000 $6,000 $8,000 $10,000 $12,000-$6,000 -$4,000 -$2,000
-8
-83
-146
-285
-412
-461
-660
-744
-976
-1,057
-1,099
-1,108
-1,135
-1,154
-1,187
-1,280
-1,453
-1,486
-1,531
-1,581
-1,645
-1,683
-1,926
-2,036
-2,109
-2,269
-2,722
-2,762
-2,862
-3,448
-3,521-4,941
-4,947
WYOMING
ILLINOIS
ALASKA
HAWAII
NORTH CAROLINA
NEBRASKA
IDAHO
NORTH DAKOTA
NEW MEXICO
NEW YORK
GEORGIA
CALIFORNIA
TENNESSEE
CONNECTICUT
ARKANSAS
TEXAS
MARYLAND
U.S.
KENTUCKY
MAINE
NEVADA
MISSISSIPPI
MASSACHUSETTS
MINNESOTA
WASHINGTON
INDIANA
ALABAMA
OKLAHOMA
UTAH
MISSOURI
MICHIGAN
SOUTH DAKOTA
FLORIDA
NEW JERSEY
MONTANA
WISCONSIN
KANSAS
OHIO
IOWA
OREGON
SOUTH CAROLINA
RHODE ISLAND
VIRGINIA
LOUISIANA
ARIZONA
DELAWARE
WEST VIRGINIA
COLORADO
PENNSYLVANIA
NEW HAMPSHIRE
VERMONT
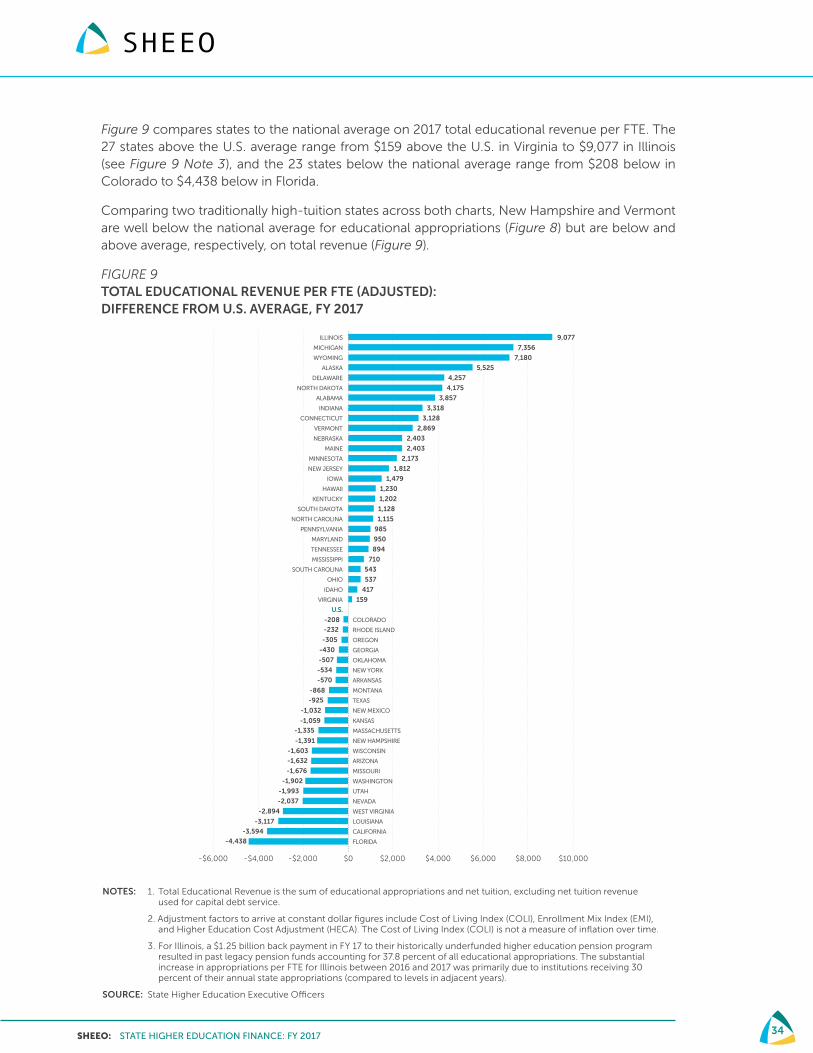
SHEEO: STATE HIGHER EDUCATION FINANCE: FY 2017 34
Figure 9 compares states to the national average on 2017 total educational revenue per FTE. The 27 states above the U.S. average range from $159 above the U.S. in Virginia to $9,077 in Illinois (see Figure 9 Note 3), and the 23 states below the national average range from $208 below in Colorado to $4,438 below in Florida.
Comparing two traditionally high-tuition states across both charts, New Hampshire and Vermont are well below the national average for educational appropriations (Figure 8) but are below and above average, respectively, on total revenue (Figure 9).
FIGURE 9TOTAL EDUCATIONAL REVENUE PER FTE (ADJUSTED): DIFFERENCE FROM U.S. AVERAGE, FY 2017
NOTES: 1. Total Educational Revenue is the sum of educational appropriations and net tuition, excluding net tuition revenue used for capital debt service.
2. Adjustment factors to arrive at constant dollar figures include Cost of Living Index (COLI), Enrollment Mix Index (EMI), and Higher Education Cost Adjustment (HECA). The Cost of Living Index (COLI) is not a measure of inflation over time.
3. For Illinois, a $1.25 billion back payment in FY 17 to their historically underfunded higher education pension program resulted in past legacy pension funds accounting for 37.8 percent of all educational appropriations. The substantial increase in appropriations per FTE for Illinois between 2016 and 2017 was primarily due to institutions receiving 30 percent of their annual state appropriations (compared to levels in adjacent years).
SOURCE: State Higher Education Executive Officers
FIGURE 9
TOTAL EDUCATIONAL REVENUE PER FTE (ADJUSTED) - DIFFERENCE FROM U.S. AVERAGE, FY 2017
9,077
7,356
7,180
5,525
4,257
4,175
3,857
3,318
3,128
2,869
2,403
2,403
2,173
1,812
1,479
1,230
1,202
1,128
1,115
985
950
894
710
543
537
417
159
$6,000 $8,000 $10,000
ILLINOIS
MICHIGAN
WYOMING
ALASKA
DELAWARE
NORTH DAKOTA
ALABAMA
INDIANA
CONNECTICUT
VERMONT
NEBRASKA
MAINE
MINNESOTA
NEW JERSEY
IOWA
HAWAII
KENTUCKY
SOUTH DAKOTA
NORTH CAROLINA
PENNSYLVANIA
MARYLAND
TENNESSEE
MISSISSIPPI
SOUTH CAROLINA
OHIO
IDAHO
VIRGINIA
U.S.
COLORADO
RHODE ISLAND
OREGON
GEORGIA
OKLAHOMA
NEW YORK
ARKANSAS
MONTANA
TEXAS
NEW MEXICO
KANSAS
MASSACHUSETTS
NEW HAMPSHIRE
WISCONSIN
ARIZONA
MISSOURI
WASHINGTON
UTAH
NEVADA
WEST VIRGINIA
LOUISIANA
CALIFORNIA
FLORIDA-4,438
-3,594
-3,117
-2,894
-2,037
-1,993
-1,902
-1,676
-1,632
-1,603
-1,391
-1,335
-1,059
-1,032
-925
-868
-570
-534
-507
-430
-305
-232
-208
-$6,000 -$4,000 -$2,000 $0 $2,000 $4,000
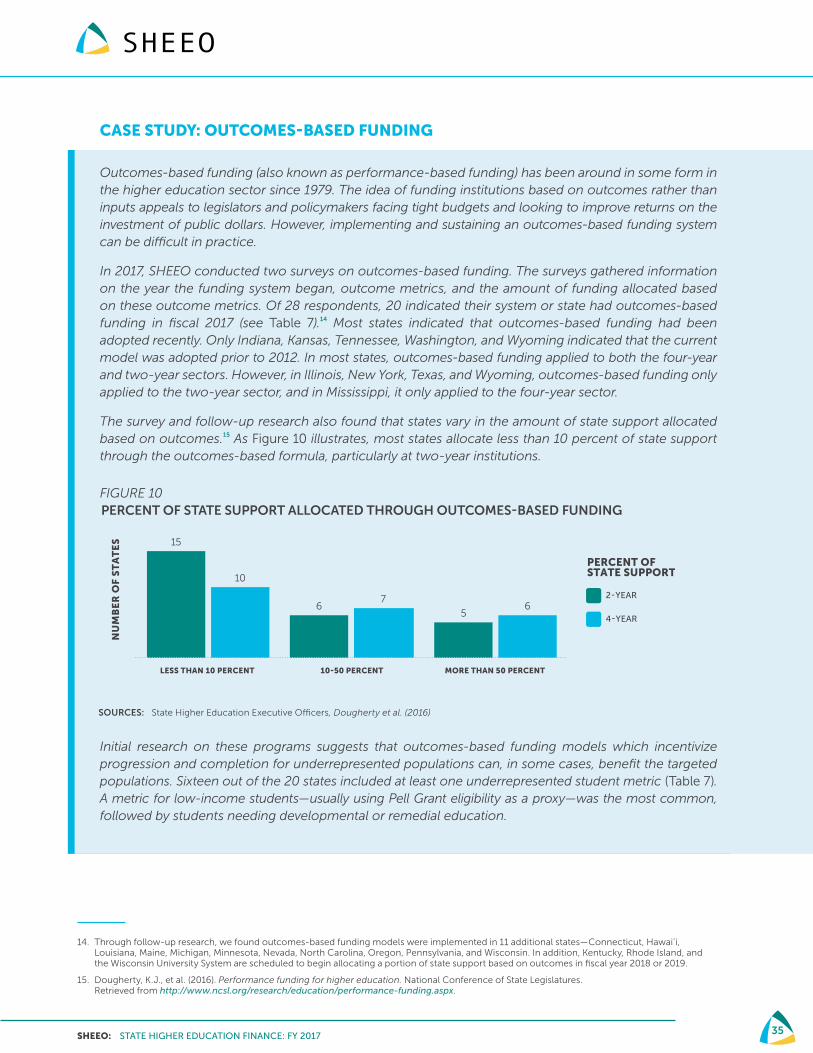
SHEEO: STATE HIGHER EDUCATION FINANCE: FY 2017 35
CASE STUDY: OUTCOMES-BASED FUNDING
Outcomes-based funding (also known as performance-based funding) has been around in some form in the higher education sector since 1979. The idea of funding institutions based on outcomes rather than inputs appeals to legislators and policymakers facing tight budgets and looking to improve returns on the investment of public dollars. However, implementing and sustaining an outcomes-based funding system can be difficult in practice.
In 2017, SHEEO conducted two surveys on outcomes-based funding. The surveys gathered information on the year the funding system began, outcome metrics, and the amount of funding allocated based on these outcome metrics. Of 28 respondents, 20 indicated their system or state had outcomes-based funding in fiscal 2017 (see Table 7).14 Most states indicated that outcomes-based funding had been adopted recently. Only Indiana, Kansas, Tennessee, Washington, and Wyoming indicated that the current model was adopted prior to 2012. In most states, outcomes-based funding applied to both the four-year and two-year sectors. However, in Illinois, New York, Texas, and Wyoming, outcomes-based funding only applied to the two-year sector, and in Mississippi, it only applied to the four-year sector.
The survey and follow-up research also found that states vary in the amount of state support allocated based on outcomes.15 As Figure 10 illustrates, most states allocate less than 10 percent of state support through the outcomes-based formula, particularly at two-year institutions.
FIGURE 10PERCENT OF STATE SUPPORT ALLOCATED THROUGH OUTCOMES-BASED FUNDING
SOURCES: State Higher Education Executive Officers, Dougherty et al. (2016)
Initial research on these programs suggests that outcomes-based funding models which incentivize progression and completion for underrepresented populations can, in some cases, benefit the targeted populations. Sixteen out of the 20 states included at least one underrepresented student metric (Table 7). A metric for low-income students—usually using Pell Grant eligibility as a proxy—was the most common, followed by students needing developmental or remedial education.
14. Through follow-up research, we found outcomes-based funding models were implemented in 11 additional states—Connecticut, Hawai’i, Louisiana, Maine, Michigan, Minnesota, Nevada, North Carolina, Oregon, Pennsylvania, and Wisconsin. In addition, Kentucky, Rhode Island, and the Wisconsin University System are scheduled to begin allocating a portion of state support based on outcomes in fiscal year 2018 or 2019.
15. Dougherty, K.J., et al. (2016). Performance funding for higher education. National Conference of State Legislatures. Retrieved from http://www.ncsl.org/research/education/performance-funding.aspx.
FIGURE 10
PERCENT OF STATE SUPPORT ALLOCATED THROUGH OUTCOMES-BASED FUNDING
15
65
10
76
LESS THAN 10 PERCENT MORE THAN 50 PERCENT
NU
MB
ER
OF
ST
AT
ES
PERCENT OFSTATE SUPPORT
10-50 PERCENT
2-YEAR
4-YEAR
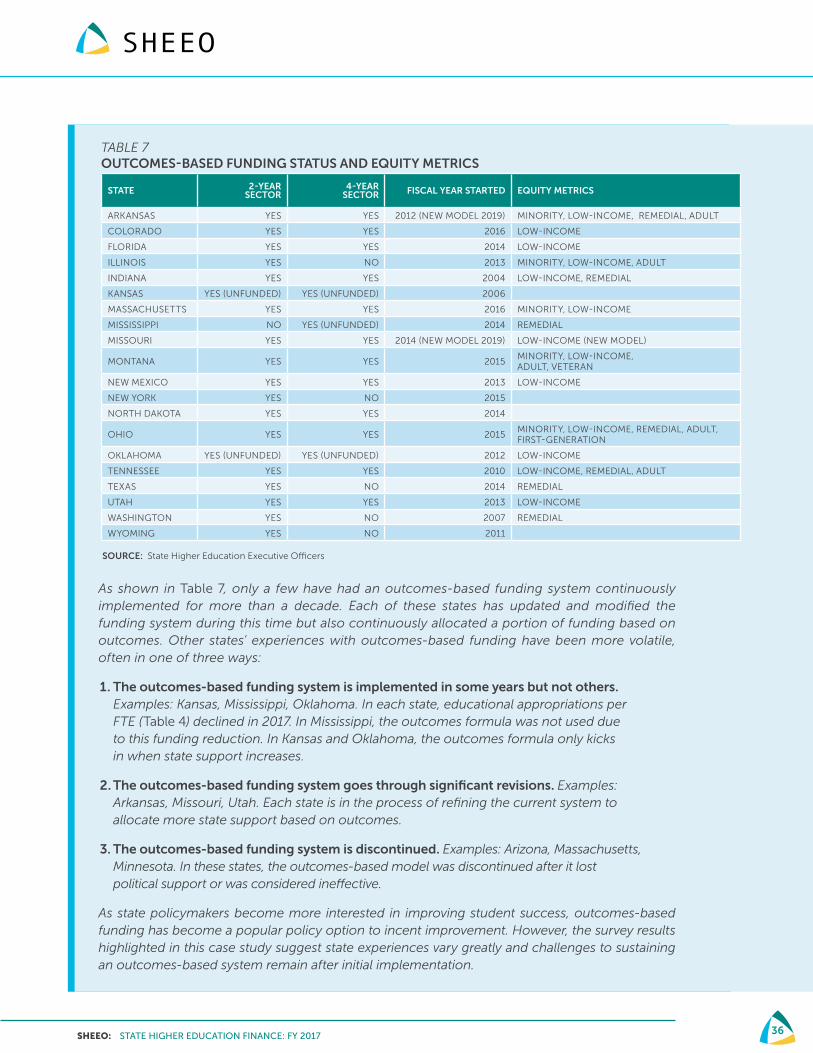
SHEEO: STATE HIGHER EDUCATION FINANCE: FY 2017 36
TABLE 7 OUTCOMES-BASED FUNDING STATUS AND EQUITY METRICS
STATE 2-YEAR SECTOR
4-YEAR SECTOR FISCAL YEAR STARTED EQUITY METRICS
ARKANSAS YES YES 2012 (NEW MODEL 2019) MINORITY, LOW-INCOME, REMEDIAL, ADULT
COLORADO YES YES 2016 LOW-INCOME
FLORIDA YES YES 2014 LOW-INCOME
ILLINOIS YES NO 2013 MINORITY, LOW-INCOME, ADULT
INDIANA YES YES 2004 LOW-INCOME, REMEDIAL
KANSAS YES (UNFUNDED) YES (UNFUNDED) 2006
MASSACHUSETTS YES YES 2016 MINORITY, LOW-INCOME
MISSISSIPPI NO YES (UNFUNDED) 2014 REMEDIAL
MISSOURI YES YES 2014 (NEW MODEL 2019) LOW-INCOME (NEW MODEL)
MONTANA YES YES 2015MINORITY, LOW-INCOME, ADULT, VETERAN
NEW MEXICO YES YES 2013 LOW-INCOME
NEW YORK YES NO 2015
NORTH DAKOTA YES YES 2014
OHIO YES YES 2015MINORITY, LOW-INCOME, REMEDIAL, ADULT, FIRST-GENERATION
OKLAHOMA YES (UNFUNDED) YES (UNFUNDED) 2012 LOW-INCOME
TENNESSEE YES YES 2010 LOW-INCOME, REMEDIAL, ADULT
TEXAS YES NO 2014 REMEDIAL
UTAH YES YES 2013 LOW-INCOME
WASHINGTON YES NO 2007 REMEDIAL
WYOMING YES NO 2011
SOURCE: State Higher Education Executive Officers
As shown in Table 7, only a few have had an outcomes-based funding system continuously implemented for more than a decade. Each of these states has updated and modified the funding system during this time but also continuously allocated a portion of funding based on outcomes. Other states’ experiences with outcomes-based funding have been more volatile, often in one of three ways:
1. The outcomes-based funding system is implemented in some years but not others. Examples: Kansas, Mississippi, Oklahoma. In each state, educational appropriations per FTE (Table 4) declined in 2017. In Mississippi, the outcomes formula was not used due to this funding reduction. In Kansas and Oklahoma, the outcomes formula only kicks in when state support increases.
2. The outcomes-based funding system goes through significant revisions. Examples: Arkansas, Missouri, Utah. Each state is in the process of refining the current system to allocate more state support based on outcomes.
3. The outcomes-based funding system is discontinued. Examples: Arizona, Massachusetts, Minnesota. In these states, the outcomes-based model was discontinued after it lost political support or was considered ineffective.
As state policymakers become more interested in improving student success, outcomes-based funding has become a popular policy option to incent improvement. However, the survey results highlighted in this case study suggest state experiences vary greatly and challenges to sustaining an outcomes-based system remain after initial implementation.
SHEEO: STATE HIGHER EDUCATION FINANCE: FY 2017 37
STATE WEALTH, TAXES, AND ALLOCATIONS FOR HIGHER EDUCATION
Within each state, policies and decisions about the financing of higher education are made in the context of multiple external factors, including current and projected economic conditions, state tax structures, competing budgetary priorities across the state, cultural and ideological shifts in the state population, and political and higher education characteristics of the state.
Within this context, state policymakers face challenging questions about necessary taxation levels and spending priorities for different public services and investments. This section is intended to help policymakers evaluate public policy decisions for higher education by exploring several types of comparative data and indicators, including state wealth, population, personal wealth, and comparative allocations to higher education.16, 17
State wealth: The most direct assessment of state funding effort relative to state revenue compares available state funds from taxable revenues and lottery profits relative to the amount of these funds appropriated or spent on higher education.
Population: The measure of higher education support per capita normalizes state funding for a state’s population. It assesses effort because states with larger populations generally should have a larger tax base, and therefore may be able to direct greater resources toward higher education.
Personal wealth: Higher education support per $1,000 of personal income measures what a state pays for higher education relative to its capacity to pay. It helps us understand the scale of support for higher education in relation to a state’s relative wealth.
The non-SHEF data presented here are in nominal terms and are not adjusted for inflation. In all cases, the most recent available data are presented. In some cases (such as tax revenue), this means a two-year lag from 2017.
1. NATIONAL CONTEXT
As shown in Table 8, current dollar aggregate state wealth (total taxable resources) per capita increased 27.1 percent, from $48,822 in 2005 to $62,070 in 2015. The effects of the 2008 recession are evident in the total taxable resource decreases in 2009 and 2010. Between 2010 and 2015, total taxable resources increased 19.8 percent (without inflation), suggesting a strong rebound from the recession.
Actual state and local tax revenues per capita increased 31.4 percent, from $3,700 in 2005 to $4,863 in 2015, which is 11.5 percent higher than the pre-recession high of $4,362 in 2008. In 2015, the effective tax rate (actual tax revenues/total taxable resources) remained constant with 2014. From 2005 to 2015, the effective tax rate increased 3.4 percent.
16. Part of this section draws on previous work by Kent Halstead to assemble data and develop indicators for higher education support per capita and relative to wealth (personal income), state tax capacity, and tax effort.
17. Tandberg, D., & Laderman, S. (2018). State Effort for Higher Education. Midwestern Higher Education Compact, forthcoming.
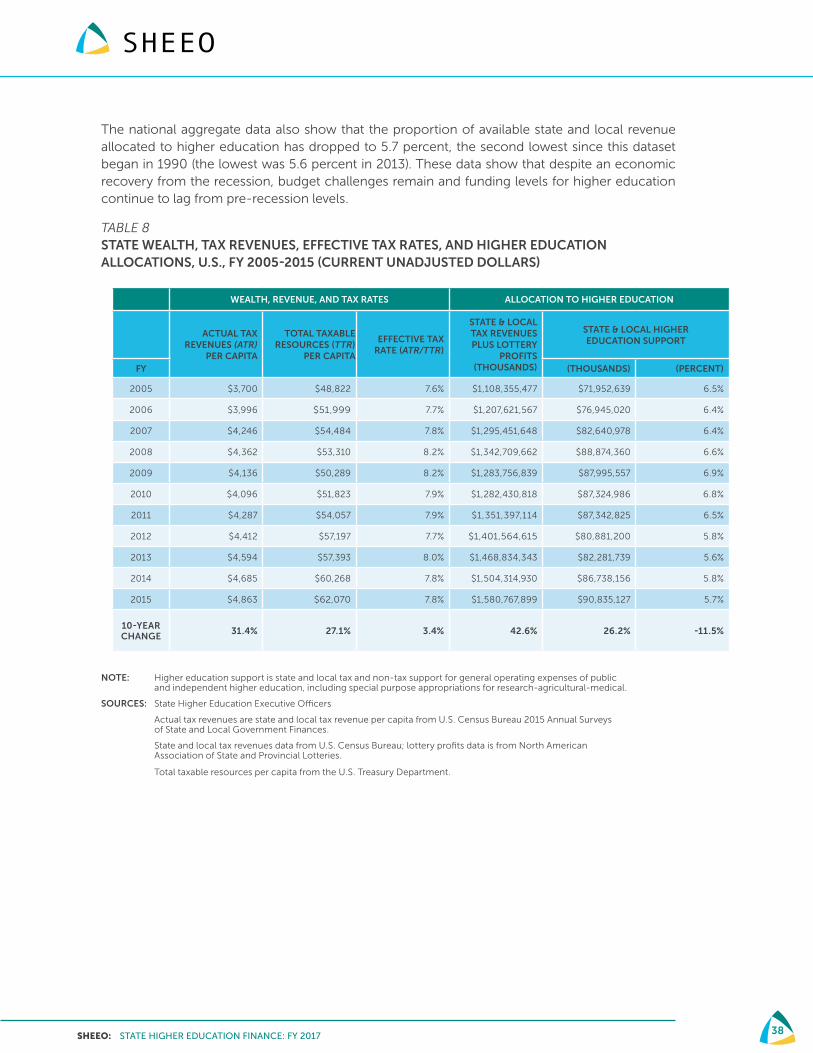
SHEEO: STATE HIGHER EDUCATION FINANCE: FY 2017 38
The national aggregate data also show that the proportion of available state and local revenue allocated to higher education has dropped to 5.7 percent, the second lowest since this dataset began in 1990 (the lowest was 5.6 percent in 2013). These data show that despite an economic recovery from the recession, budget challenges remain and funding levels for higher education continue to lag from pre-recession levels.
TABLE 8 STATE WEALTH, TAX REVENUES, EFFECTIVE TAX RATES, AND HIGHER EDUCATION ALLOCATIONS, U.S., FY 2005-2015 (CURRENT UNADJUSTED DOLLARS)
WEALTH, REVENUE, AND TAX RATES ALLOCATION TO HIGHER EDUCATION
ACTUAL TAX REVENUES (ATR)
PER CAPITA
TOTAL TAXABLE RESOURCES (TTR)
PER CAPITA
EFFECTIVE TAX RATE (ATR/TTR)
STATE & LOCAL TAX REVENUES PLUS LOTTERY
PROFITS (THOUSANDS)
STATE & LOCAL HIGHER EDUCATION SUPPORT
FY (THOUSANDS) (PERCENT)
2005 $3,700 $48,822 7.6% $1,108,355,477 $71,952,639 6.5%
2006 $3,996 $51,999 7.7% $1,207,621,567 $76,945,020 6.4%
2007 $4,246 $54,484 7.8% $1,295,451,648 $82,640,978 6.4%
2008 $4,362 $53,310 8.2% $1,342,709,662 $88,874,360 6.6%
2009 $4,136 $50,289 8.2% $1,283,756,839 $87,995,557 6.9%
2010 $4,096 $51,823 7.9% $1,282,430,818 $87,324,986 6.8%
2011 $4,287 $54,057 7.9% $1,351,397,114 $87,342,825 6.5%
2012 $4,412 $57,197 7.7% $1,401,564,615 $80,881,200 5.8%
2013 $4,594 $57,393 8.0% $1,468,834,343 $82,281,739 5.6%
2014 $4,685 $60,268 7.8% $1,504,314,930 $86,738,156 5.8%
2015 $4,863 $62,070 7.8% $1,580,767,899 $90,835,127 5.7%
10-YEAR CHANGE
31.4% 27.1% 3.4% 42.6% 26.2% -11.5%
NOTE: Higher education support is state and local tax and non-tax support for general operating expenses of public and independent higher education, including special purpose appropriations for research-agricultural-medical.
SOURCES: State Higher Education Executive Officers
Actual tax revenues are state and local tax revenue per capita from U.S. Census Bureau 2015 Annual Surveys of State and Local Government Finances.
State and local tax revenues data from U.S. Census Bureau; lottery profits data is from North American Association of State and Provincial Lotteries.
Total taxable resources per capita from the U.S. Treasury Department.

SHEEO: STATE HIGHER EDUCATION FINANCE: FY 2017 39
2. STATE CONTEXT
Table 9 shows state-level data for each indicator of state wealth and taxes, along with allocations to higher education per capita and per $1,000 of personal income. These comparative statistics reflect interstate differences in wealth, population characteristics and density, postsecondary enrollment rates, the relative size of the public and independent higher education sectors, student mobility, and numerous other factors. Poorer states may lag the national average in per capita support, but exceed the national average in support per $1,000 of personal income. Similarly, sparsely populated states sometimes exceed the national average in both per capita support and per $1,000 of personal income.
Actual tax revenues (ATR) per capita ranged from $3,141 in Alabama to $9,182 in North Dakota. Other than North Dakota, only two states had an ATR above $7,000 per capita (New York and Connecticut). Total taxable resources (TTR) per capita ranged from $87,499 in Connecticut to $40,036 in Mississippi. Four states (Connecticut, New York, Delaware, and Massachusetts) have more than two times Mississippi’s TTR.
The effective tax rate (ATR/TTR) varied from a high of 11.6 percent in North Dakota to a low of 4.7 percent in Alaska. Twenty-two states were above the U.S. average, while 34 states were within 1.0 percent of the U.S. average.
Tax revenues and lottery profits varied widely (largely due to differences in population size), from $230 billion in California to $2.6 billion in Alaska. California alone accounted for 15 percent of the U.S. total, and the top seven states on this metric (California, New York, Texas, Illinois, Florida, Pennsylvania, and New Jersey) accounted for half of all tax revenues and lottery profits in the United States.
SHEF higher education support in fiscal 2015 ranged from $15 billion in California to $91 million in Vermont, while the percent allocated to higher education ranged from 14.9 percent of all tax revenues and lottery profits in Alaska to 2.0 percent in New Hampshire (Table 9).
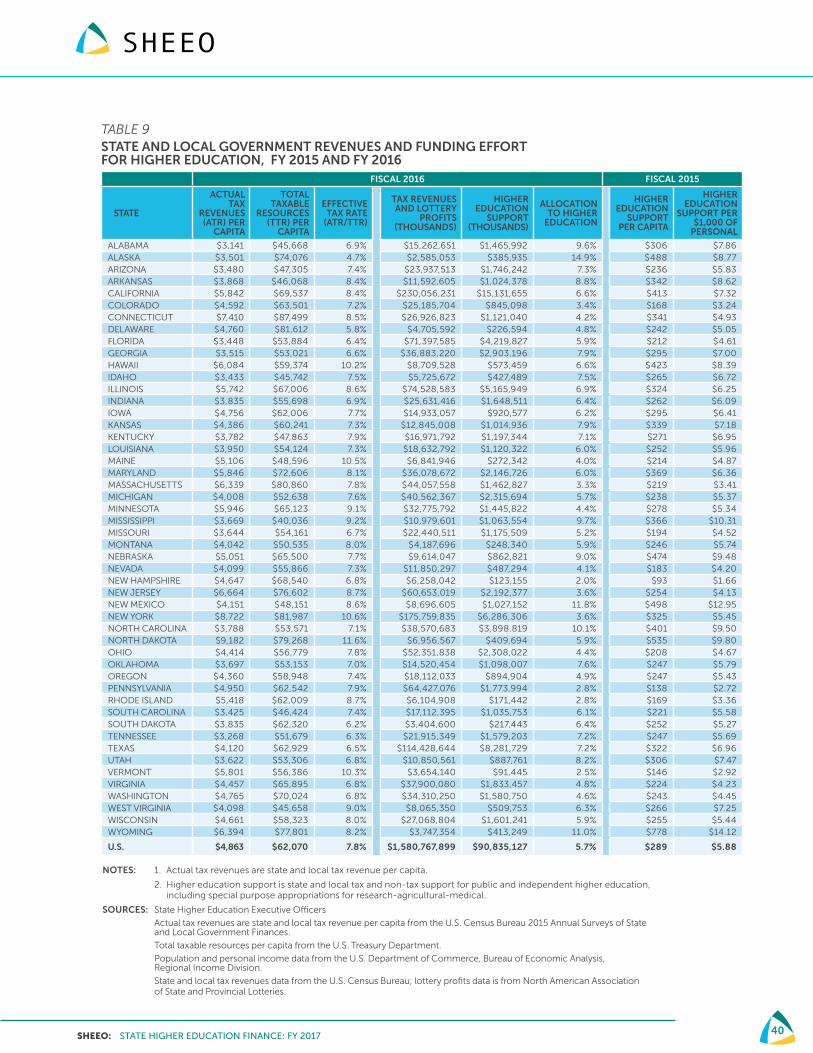
SHEEO: STATE HIGHER EDUCATION FINANCE: FY 2017 40
TABLE 9 STATE AND LOCAL GOVERNMENT REVENUES AND FUNDING EFFORT FOR HIGHER EDUCATION, FY 2015 AND FY 2016 FISCAL 2016 FISCAL 2015
STATE
ACTUAL TAX
REVENUES (ATR) PER
CAPITA
TOTAL TAXABLE
RESOURCES (TTR) PER
CAPITA
EFFECTIVE TAX RATE
(ATR/TTR)
TAX REVENUES AND LOTTERY
PROFITS (THOUSANDS)
HIGHER EDUCATION
SUPPORT (THOUSANDS)
ALLOCATION TO HIGHER
EDUCATION
HIGHER EDUCATION
SUPPORT PER CAPITA
HIGHER EDUCATION
SUPPORT PER $1,000 OF
PERSONAL
ALABAMA $3,141 $45,668 6.9% $15,262,651 $1,465,992 9.6% $306 $7.86ALASKA $3,501 $74,076 4.7% $2,585,053 $385,935 14.9% $488 $8.77ARIZONA $3,480 $47,305 7.4% $23,937,513 $1,746,242 7.3% $236 $5.83ARKANSAS $3,868 $46,068 8.4% $11,592,605 $1,024,378 8.8% $342 $8.62CALIFORNIA $5,842 $69,537 8.4% $230,056,231 $15,131,655 6.6% $413 $7.32COLORADO $4,592 $63,501 7.2% $25,185,704 $845,098 3.4% $168 $3.24CONNECTICUT $7,410 $87,499 8.5% $26,926,823 $1,121,040 4.2% $341 $4.93DELAWARE $4,760 $81,612 5.8% $4,705,592 $226,594 4.8% $242 $5.05FLORIDA $3,448 $53,884 6.4% $71,397,585 $4,219,827 5.9% $212 $4.61GEORGIA $3,515 $53,021 6.6% $36,883,220 $2,903,196 7.9% $295 $7.00HAWAII $6,084 $59,374 10.2% $8,709,528 $573,459 6.6% $423 $8.39IDAHO $3,433 $45,742 7.5% $5,725,672 $427,489 7.5% $265 $6.72ILLINOIS $5,742 $67,006 8.6% $74,528,583 $5,165,949 6.9% $324 $6.25INDIANA $3,835 $55,698 6.9% $25,631,416 $1,648,511 6.4% $262 $6.09IOWA $4,756 $62,006 7.7% $14,933,057 $920,577 6.2% $295 $6.41KANSAS $4,386 $60,241 7.3% $12,845,008 $1,014,936 7.9% $339 $7.18KENTUCKY $3,782 $47,863 7.9% $16,971,792 $1,197,344 7.1% $271 $6.95LOUISIANA $3,950 $54,124 7.3% $18,632,792 $1,120,322 6.0% $252 $5.96MAINE $5,106 $48,596 10.5% $6,841,946 $272,342 4.0% $214 $4.87MARYLAND $5,846 $72,606 8.1% $36,078,672 $2,146,726 6.0% $369 $6.36MASSACHUSETTS $6,339 $80,860 7.8% $44,057,558 $1,462,827 3.3% $219 $3.41MICHIGAN $4,008 $52,638 7.6% $40,562,367 $2,315,694 5.7% $238 $5.37MINNESOTA $5,946 $65,123 9.1% $32,775,792 $1,445,822 4.4% $278 $5.34MISSISSIPPI $3,669 $40,036 9.2% $10,979,601 $1,063,554 9.7% $366 $10.31MISSOURI $3,644 $54,161 6.7% $22,440,511 $1,175,509 5.2% $194 $4.52MONTANA $4,042 $50,535 8.0% $4,187,696 $248,340 5.9% $246 $5.74NEBRASKA $5,051 $65,500 7.7% $9,614,047 $862,821 9.0% $474 $9.48NEVADA $4,099 $55,866 7.3% $11,850,297 $487,294 4.1% $183 $4.20NEW HAMPSHIRE $4,647 $68,540 6.8% $6,258,042 $123,155 2.0% $93 $1.66NEW JERSEY $6,664 $76,602 8.7% $60,653,019 $2,192,377 3.6% $254 $4.13NEW MEXICO $4,151 $48,151 8.6% $8,696,605 $1,027,152 11.8% $498 $12.95NEW YORK $8,722 $81,987 10.6% $175,759,835 $6,286,306 3.6% $325 $5.45NORTH CAROLINA $3,788 $53,571 7.1% $38,570,683 $3,898,819 10.1% $401 $9.50NORTH DAKOTA $9,182 $79,268 11.6% $6,956,567 $409,694 5.9% $535 $9.80OHIO $4,414 $56,779 7.8% $52,351,838 $2,308,022 4.4% $208 $4.67OKLAHOMA $3,697 $53,153 7.0% $14,520,454 $1,098,007 7.6% $247 $5.79OREGON $4,360 $58,948 7.4% $18,112,033 $894,904 4.9% $247 $5.43PENNSYLVANIA $4,950 $62,542 7.9% $64,427,076 $1,773,994 2.8% $138 $2.72RHODE ISLAND $5,418 $62,009 8.7% $6,104,908 $171,442 2.8% $169 $3.36SOUTH CAROLINA $3,425 $46,424 7.4% $17,112,395 $1,035,753 6.1% $221 $5.58SOUTH DAKOTA $3,835 $62,320 6.2% $3,404,600 $217,443 6.4% $252 $5.27TENNESSEE $3,268 $51,679 6.3% $21,915,349 $1,579,203 7.2% $247 $5.69TEXAS $4,120 $62,929 6.5% $114,428,644 $8,281,729 7.2% $322 $6.96UTAH $3,622 $53,306 6.8% $10,850,561 $887,761 8.2% $306 $7.47VERMONT $5,801 $56,386 10.3% $3,654,140 $91,445 2.5% $146 $2.92VIRGINIA $4,457 $65,895 6.8% $37,900,080 $1,833,457 4.8% $224 $4.23WASHINGTON $4,765 $70,024 6.8% $34,310,250 $1,580,750 4.6% $243 $4.45WEST VIRGINIA $4,098 $45,658 9.0% $8,065,350 $509,753 6.3% $266 $7.25WISCONSIN $4,661 $58,323 8.0% $27,068,804 $1,601,241 5.9% $255 $5.44WYOMING $6,394 $77,801 8.2% $3,747,354 $413,249 11.0% $778 $14.12
U.S. $4,863 $62,070 7.8% $1,580,767,899 $90,835,127 5.7% $289 $5.88
NOTES: 1. Actual tax revenues are state and local tax revenue per capita.
2. Higher education support is state and local tax and non-tax support for public and independent higher education, including special purpose appropriations for research-agricultural-medical.
SOURCES: State Higher Education Executive Officers
Actual tax revenues are state and local tax revenue per capita from the U.S. Census Bureau 2015 Annual Surveys of State and Local Government Finances.
Total taxable resources per capita from the U.S. Treasury Department.
Population and personal income data from the U.S. Department of Commerce, Bureau of Economic Analysis, Regional Income Division.
State and local tax revenues data from the U.S. Census Bureau; lottery profits data is from North American Association of State and Provincial Lotteries.
SHEEO: STATE HIGHER EDUCATION FINANCE: FY 2017 41
CASE STUDY: THE IMPORTANCE OF STATE CONTEXT
The primary enrollment based SHEF metrics (educational appropriations, net tuition revenue, and total educational revenue) are useful to determine overall levels and sources of support. However, the metrics do not account for the broader context in which appropriation and tuition rate decisions are made. The state effort section tries, where possible, to provide some of that context. The following state examples show how these measures inform interpretations of the SHEF metrics.
Colorado and Florida
Colorado and Florida are similar in higher education support per $1,000 of personal income and support per capita. Colorado is 46th in each measure, while Florida is 39th by income and 42nd per capita. The similarities end there, as Colorado has almost $10,000 more total taxable resources and over $1,000 more actual tax revenue per capita. Colorado has a higher effective tax rate (7.2 vs. 6.4 percent), but appropriates fewer revenues to higher education (3.4 vs. 5.9 percent).
These differences are clearly reflected in the SHEF metrics. Colorado is the fifth highest state in student share at 69.9 percent and Florida is the eighth lowest at 33.5 percent. Despite having less actual tax revenue per capita to appropriate to higher education, Florida devotes a larger portion of its revenue to higher education. As a result, Florida has higher appropriations (32nd vs. 46th). Thanks to tuition rate flexibility during the Great Recession,18 Colorado has made up for its low appropriations with tuition dollars and has total revenues just 1.0 percent below the national average, while Florida has the third lowest tuition and the lowest total revenues in the United States. Florida has $4,438 less funding per student than the U.S. average. Florida has fewer tax dollars per person but appropriates a larger proportion of its actual tax revenue to higher education.
Additional context is helpful in understanding the differences between Colorado and Florida. Colorado has one of the strongest economies in the country but is also subject to very restrictive limits on taxation, revenue collection, and spending due to the Taxpayers Bill of Rights (TABOR), a state constitutional amendment.19, 20 Although appropriations in Florida are down 23.4 percent since the 2008 pre-recession high point, higher education advocates have been unable to raise tuition to offset this lost revenue because the Board of Governors has limited control over tuition setting policy.21
18. Colorado Senate. (2010). Bill 10-003. Retrieved from http://www.leg.state.co.us/clics/clics2010a/csl.nsf/fsbillcont2/E7D30EB79557E237872576A80026B0CD/$FILE/003_enr.pdf
19. Bernardo, R. (2017). 2017’s Best & Worst State Economies. Wallethub. Retrieved from https://wallethub.com/edu/states-with-the-best-economies/21697/
20. The Bell Policy Center. (2002). Understanding TABOR: The First Steps. Retrieved from https://www.bellpolicy.org/wp-content/uploads/2017/11/Understanding-TABOR.pdf
21. Armstrong, J., Carlson, A., & Laderman, S. (2017). The State Imperative: Aligning Tuition Policies with Strategies for Affordability. SHEEO. Retrieved from http://www.sheeo.org/sites/default/files/State_Tuition_Fees_Financial_Assistance_2017.pdf

SHEEO: STATE HIGHER EDUCATION FINANCE: FY 2017 42
New Hampshire and Vermont
New Hampshire and Vermont are often grouped together in the SHEF report. They have the lowest educational appropriations per student (almost $5,000 below the U.S. average) and the highest student shares at 78.8 percent for New Hampshire and 86.6 percent for Vermont. However, they diverge in total educational revenue per student. Vermont is 10th in highest total educational revenue per student while New Hampshire is 40th. Although both states have higher tuition than average, Vermont has $4,674 more per student in tuition revenue than New Hampshire, largely because a larger proportion of Vermont’s FTE attend their flagship institution, which is more expensive.22
From many angles, New Hampshire and Vermont appear to provide similar effort. Both states are in the bottom three for higher education support per capita, support per $1,000 of personal income, and percent allocation to higher education. However, the state wealth data provide a more nuanced understanding of their relative effort. Vermont has almost $12,000 less in total taxable resources per capita, but has the fourth highest tax rate and is above average in actual tax revenues, while New Hampshire has the 10th lowest tax rate and is below average in actual tax revenues. This is because the states have very different tax structures. Vermont has a high, progressive income tax in addition to sales tax, while New Hampshire has no earned income or statewide sales tax.23, 24
22. U.S. Department of Education, Institute of Education Sciences, National Center for Education Statistics. (2017). Integrated Postsecondary Data System 12-month Enrollment and Institutional Characteristics (2016) [Dataset].
23. Vermont Department of Taxes. (n.d.). Tax Rates and Charts. Retrieved from http://tax.vermont.gov/research-and-reports/tax-rates-and-charts.
24. New Hampshire Department of Revenue Administration. (n.d.). Taxpayer Assistance – Overview of New Hampshire Taxes. Retrieved from https://www.revenue.nh.gov/assistance/tax-overview.htm.
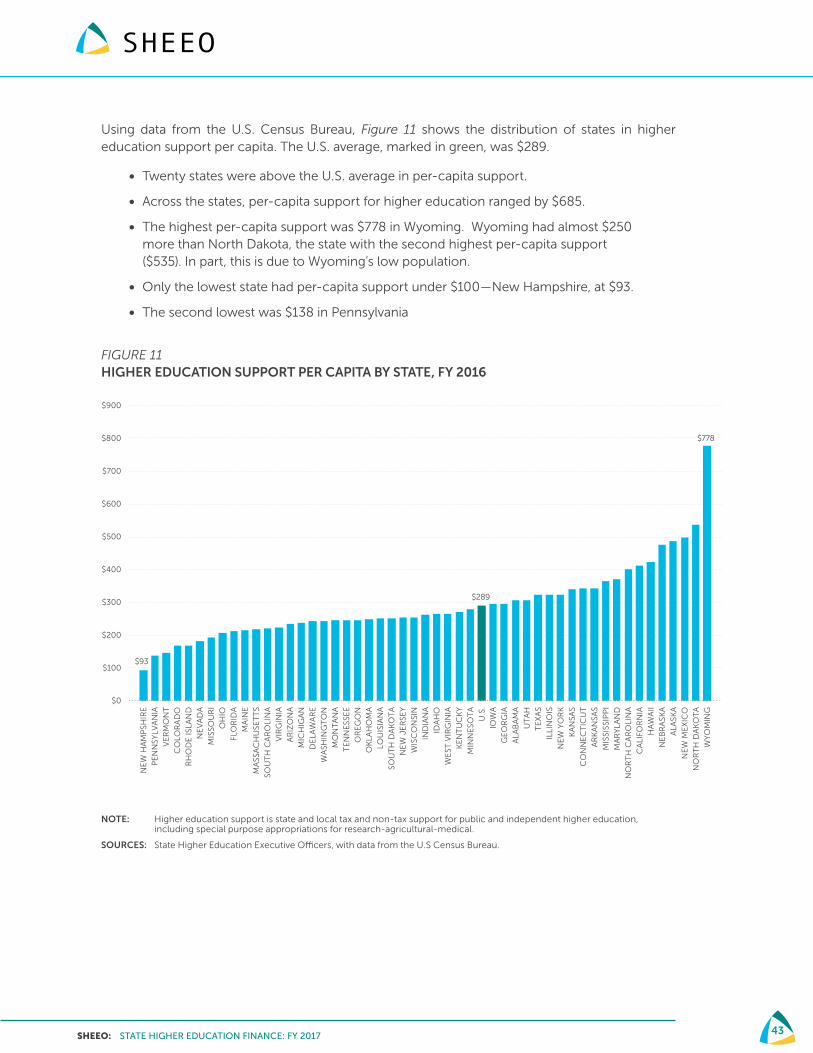
SHEEO: STATE HIGHER EDUCATION FINANCE: FY 2017 43
Using data from the U.S. Census Bureau, Figure 11 shows the distribution of states in higher education support per capita. The U.S. average, marked in green, was $289.
• Twenty states were above the U.S. average in per-capita support.
• Across the states, per-capita support for higher education ranged by $685.
• The highest per-capita support was $778 in Wyoming. Wyoming had almost $250 more than North Dakota, the state with the second highest per-capita support ($535). In part, this is due to Wyoming’s low population.
• Only the lowest state had per-capita support under $100—New Hampshire, at $93.
• The second lowest was $138 in Pennsylvania
FIGURE 11 HIGHER EDUCATION SUPPORT PER CAPITA BY STATE, FY 2016
NOTE: Higher education support is state and local tax and non-tax support for public and independent higher education, including special purpose appropriations for research-agricultural-medical.
SOURCES: State Higher Education Executive Officers, with data from the U.S Census Bureau.
FIGURE 11
HIGHER EDUCATION SUPPORT PER CAPITA BY STATE, FY 2016
NE
W H
AM
PSH
IRE
PE
NN
SYLV
AN
IA
VE
RM
ON
T
CO
LOR
AD
O
RH
OD
E IS
LAN
D
NE
VA
DA
MIS
SOU
RI
OH
IO
FLO
RID
A
MA
INE
MA
SSA
CH
USE
TT
S
SOU
TH
CA
RO
LIN
A
VIR
GIN
IA
AR
IZO
NA
MIC
HIG
AN
DE
LAW
AR
E
WA
SHIN
GT
ON
MO
NT
AN
A
TE
NN
ESS
EE
OR
EG
ON
OK
LAH
OM
A
LOU
ISIA
NA
SOU
TH
DA
KO
TA
NE
W J
ER
SEY
WIS
CO
NSI
N
IND
IAN
A
IDA
HO
WE
ST V
IRG
INIA
KE
NT
UC
KY
MIN
NE
SOT
A
U.S
.
IOW
A
GE
OR
GIA
ALA
BA
MA
UT
AH
TE
XA
S
ILLI
NO
IS
NE
W Y
OR
K
KA
NSA
S
CO
NN
EC
TIC
UT
AR
KA
NSA
S
MIS
SISS
IPP
I
MA
RY
LAN
D
NO
RT
H C
AR
OLI
NA
CA
LIFO
RN
IA
HA
WA
II
NE
BR
ASK
A
ALA
SKA
NE
W M
EX
ICO
NO
RT
H D
AK
OT
A
WY
OM
ING
$93
$289
$778
$0
$100
$200
$300
$400
$500
$600
$700
$800
$900

SHEEO: STATE HIGHER EDUCATION FINANCE: FY 2017 44
Figure 12 uses data from the Bureau of Economic Analysis to show the state distribution in higher education support per $1,000 of personal income. The U.S. average was $5.90.
• The state with the highest support per income was Wyoming, with $14.10 of every $1,000 in personal income going toward higher education.
• Following Wyoming, two other states had support above $10: New Mexico at $12.90 and Mississippi at $10.30.
• Including the three states above, 23 states were higher than the U.S. average.
• The states with the lowest support were all under $3 of higher education support per $1,000 in personal income. Those states were New Hampshire ($1.66), Pennsylvania ($2.72), and Vermont ($2.92).
FIGURE 12HIGHER EDUCATION SUPPORT PER $1,000 OF PERSONAL INCOME BY STATE, FY 2016
NOTE: Higher education support is state and local tax and non-tax support for public and independent higher education, including special purpose appropriations for research-agricultural-medical.
SOURCES: State Higher Education Executive Officers, with data from the Bureau of Economic Analysis.
FIGURE 12
HIGHER EDUCATION SUPPORT PER $1,000 OF PERSONAL INCOME BY STATE, FY 2016
$1.7
$5.9
$14.1
$2
$4
$6
$8
$10
$12
$14
$16
$-
NE
W H
AM
PSH
IRE
PE
NN
SYLV
AN
IA
VE
RM
ON
T
CO
LOR
AD
O
RH
OD
E IS
LAN
D
MA
SSA
CH
USE
TT
S
NE
W J
ER
SEY
NE
VA
DA
VIR
GIN
IA
WA
SHIN
GT
ON
MIS
SOU
RI
FLO
RID
A
OH
IO
MA
INE
CO
NN
EC
TIC
UT
DE
LAW
AR
E
SOU
TH
DA
KO
TA
MIN
NE
SOT
A
MIC
HIG
AN
OR
EG
ON
WIS
CO
NSI
N
NE
W Y
OR
K
SOU
TH
CA
RO
LIN
A
TE
NN
ESS
EE
MO
NT
AN
A
OK
LAH
OM
A
AR
IZO
NA
U.S
.
LOU
ISIA
NA
IND
IAN
A
ILLI
NO
IS
MA
RY
LAN
D
IOW
A
IDA
HO
KE
NT
UC
KY
TE
XA
S
GE
OR
GIA
KA
NSA
S
WE
ST V
IRG
INIA
CA
LIFO
RN
IA
UT
AH
ALA
BA
MA
HA
WA
II
AR
KA
NSA
S
ALA
SKA
NE
BR
ASK
A
NO
RT
H C
AR
OLI
NA
NO
RT
H D
AK
OT
A
MIS
SISS
IPP
I
NE
W M
EX
ICO
WY
OM
ING
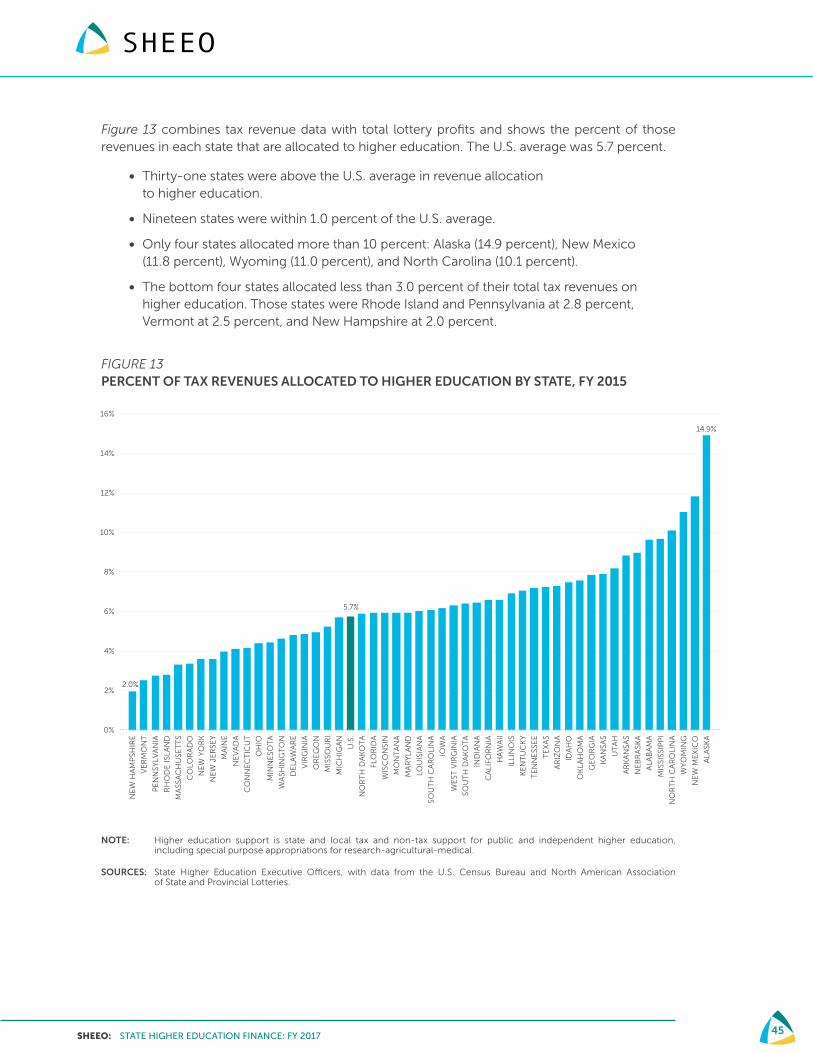
SHEEO: STATE HIGHER EDUCATION FINANCE: FY 2017 45
Figure 13 combines tax revenue data with total lottery profits and shows the percent of those revenues in each state that are allocated to higher education. The U.S. average was 5.7 percent.
• Thirty-one states were above the U.S. average in revenue allocation to higher education.
• Nineteen states were within 1.0 percent of the U.S. average.
• Only four states allocated more than 10 percent: Alaska (14.9 percent), New Mexico (11.8 percent), Wyoming (11.0 percent), and North Carolina (10.1 percent).
• The bottom four states allocated less than 3.0 percent of their total tax revenues on higher education. Those states were Rhode Island and Pennsylvania at 2.8 percent, Vermont at 2.5 percent, and New Hampshire at 2.0 percent.
FIGURE 13PERCENT OF TAX REVENUES ALLOCATED TO HIGHER EDUCATION BY STATE, FY 2015
NOTE: Higher education support is state and local tax and non-tax support for public and independent higher education, including special purpose appropriations for research-agricultural-medical.
SOURCES: State Higher Education Executive Officers, with data from the U.S. Census Bureau and North American Association of State and Provincial Lotteries.
FIGURE 13
PERCENT OF TAX REVENUES ALLOCATED TO HIGHER EDUCATION BY STATE, FY 2015
0%
2%
4%
6%
8%
10%
12%
14%
16%
2.0%
5.7%
14.9%
NE
W H
AM
PSH
IRE
VE
RM
ON
T
PE
NN
SYLV
AN
IA
RH
OD
E IS
LAN
D
MA
SSA
CH
USE
TT
S
CO
LOR
AD
O
NE
W Y
OR
K
NE
W J
ER
SEY
MA
INE
NE
VA
DA
CO
NN
EC
TIC
UT
OH
IO
MIN
NE
SOT
A
WA
SHIN
GT
ON
DE
LAW
AR
E
VIR
GIN
IA
OR
EG
ON
MIS
SOU
RI
MIC
HIG
AN
U.S
.
NO
RT
H D
AK
OT
A
FLO
RID
A
WIS
CO
NSI
N
MO
NT
AN
A
MA
RY
LAN
D
LOU
ISIA
NA
SOU
TH
CA
RO
LIN
A
IOW
A
WE
ST V
IRG
INIA
SOU
TH
DA
KO
TA
IND
IAN
A
CA
LIFO
RN
IA
HA
WA
II
ILLI
NO
IS
KE
NT
UC
KY
TE
NN
ESS
EE
TE
XA
S
AR
IZO
NA
IDA
HO
OK
LAH
OM
A
GE
OR
GIA
KA
NSA
S
UT
AH
AR
KA
NSA
S
NE
BR
ASK
A
ALA
BA
MA
MIS
SISS
IPP
I
NO
RT
H C
AR
OLI
NA
WY
OM
ING
NE
W M
EX
ICO
ALA
SKA
SHEEO: STATE HIGHER EDUCATION FINANCE: FY 2017 46
CONCLUSION
In the last fifteen years, two recessions and larger macroeconomic challenges have put significant pressure on state budgets and higher education funding, contributing to increased reliance on tuition. The largest increases in tuition during the Great Recession have slowed. Rising tuition contributed to increased scrutiny on cost, affordability, and the value of higher education. The standard model of increasing tuition to offset funding reductions may not be sustainable. This could lead to significant challenges for states.
For the fifth year in a row, educational appropriations per FTE increased in adjusted terms. These increases mean that 2017 educational appropriations per student are 17 percent above the 2012 low point following the Great Recession. Despite these increases, the last two economic downturns have left an impact on educational appropriations. In 2017, state and local governments provided $1,000 less than in 2008 and $2,000 less than in 2001. Looking at the states individually, only six states have reached or surpassed their 2008 pre-recession appropriations.
FTE enrollment at public institutions was 11 million in 2017. As expected in periods of economic growth, this is the sixth year of enrollment declines after a peak of 11.6 million in 2011. Despite the recent decline, enrollment remains 7.7 percent above 2008 levels, before the Great Recession.
Net tuition revenue per FTE increased less than one percent from 2016 to 2017. During the Great Recession, reliance on tuition increased and student share moved from 35.8 percent in 2008 to 47.8 percent in 2013. Based on this trend, the student share will likely reach 50 percent during the next economic downturn. Twenty-eight states have already exceeded 50 percent.
Total educational revenue is now above pre-recession levels. In 33 states, increases in net tuition revenue have offset decreases in educational appropriations. However, these national data mask wide variation across the states, and across institutions within states.
Amidst these changes, 40 states have now adopted ambitious attainment goals tied to expected workforce needs.25 These goals can only be met by better serving those students who have typically been underserved—first generation, low income, adult, and minority students who may need additional supports and services to succeed.26, 27 The cost to effectively serve these students may be higher, but state lawmakers have an obligation to support these students in order to meet attainment goals and workforce needs in a time of constrained resources. The next downturn may force states to have tough conversations and make decisions prioritizing funding on programs and at institutions that most directly serve these underserved students.
The data and analysis in this and future SHEF reports are intended to help higher education leaders and state policymakers focus on how discrete, annual decisions fit into broader patterns of change over time, and to help them make decisions in the coming years that will meet the long-term need to increase postsecondary attainment.
25. Lumina Foundation. (2018). A Stronger Nation 2018. Retrieved from http://strongernation.luminafoundation.org/report/2018/#nation.
26. Pingel, S., Parker, E., & Sisneros, L. (2016). Free Community College: An approach to increase adult student success in postsecondary education. Education Commission of the States. Retrieved from https://www.ecs.org/wp-content/uploads/Free-Community-College-An-approach-to-increase-adult-student-success-in-postsecondary-education-.pdf.
27. Wolniak, G., Flores, S., & Kemple, J. (2016). How can we improve college success for underserved students? Education Solutions Initiative. Retrieved from https://steinhardt.nyu.edu/e/i2/edsolutions/201609/6CollegeAccessFinal.pdf.

SHEEO: STATE HIGHER EDUCATION FINANCE: FY 2017 47

STATE HIGHER EDUCATION EXECUTIVE OFFICERS
3035 CENTER GREEN DRIVE, SUITE 100, BOULDER, COLORADO, 80301 303.541.1600 • SHEEO.org