sex ratio at birth in india - images.hindustantimes.com
TRANSCRIPT

i
Sex Ratio at Birth in IndiaRecent Trends and Patterns
Purushottam M. Kulkarni
(A report prepared for the United Nations Population Fund)

Sex Ratio at Birth in India- Recent Trends and Patterns
© UNFPA 2019
Published in 2020
Published by: United Nations Population Fund (UNFPA) 55 Lodi Estate, New Delhi 110003 India Tel: +91-11-4632333 E-mail:[email protected]
Citation Advice: United Nations Population Fund 2020. ‘Sex Ratio at Birth in India: RecentTrendsandPatterns’2020.UNFPA,NewDelhi,India
DESIGN AspireDesign,NewDelhi
DISCLAIMER All rights reserved. The contents, analysis, opinions and recommendationsexpressedinthisreportaresolelytheviewsoftheauthoranddonotnecessarilyrepresent the views of the United Nations Population Fund – UNFPA. Thedocumentmaybequoted,reproducedortranslated,eitherinpartorfull,withdueacknowledgements.UNFPAwillnot,inanyway,beliablefortheuse,orany consequencesarisingout of theuseof anyother information from thisreport.Thisreportisforinformingandeducatingthepublicatlargeandisnottobesoldorusedforcommercialpurposes.


ii

iii
Contents
Foreword v
Acknowledgements vii
List of Abbreviations ix
Executive Summary xi
1. Introduction 1
2. Estimates of Sex Ratio at Birth from Different Sources of Data 3
2.1CivilRegistrationSystem 3
2.2SampleRegistrationSystem(SRS) 3
2.3 Census 4
2.4NationalFamilyHealthSurveys(NFHS) 6
2.5HealthManagementInformationSystem(HMIS) 7
2.6Regionalvariations 8
3. Correspondence among Various Estimates 9
4. Estimates of Numbers of Missing Girls and Missing Female Births 13
5. Sex Ratio at Birth by Birth Order 18
6. Conditional Sex Ratio at Birth 20
7. Differentials in Sex Ratio at Birth 23
7.1PriorworkforIndia 23
7.2AnalysisbasedonNFHS-4 24
8. Why Sex Selection? 33
8.1 Evidenceonvaluesofsonsvis-à-visdaughtersinIndia 33
9. Principal Findings 42
References 45
Annexures 50

iv

v
Foreword
Sonpreferenceisadeep-rootedculturalphenomenoninmanycountriesincludingIndia,whichresultsindiscriminatoryandharmfulpracticesagainstwomenandgirls.Itmanifestsitselfthroughprenatalandpost-nataldiscriminationagainstgirlsintheformofgender-biasedsexselection.TheSustainableDevelopmentGoalsby2030 includea target (5.1)onendingharmfulpracticesagainstwomenandgirls.For years, as part of itsmandate, the United Nations Population Fund (UNFPA)has focused on this issue, guided by the International Conference on PopulationandDevelopment (ICPD) Programme ofAction of 1994 in Cairo. Thiswas furtherreinforcedattheNairobisummitonICPD25lastyearwhenheadsofgovernments,civil society and grassroots organizations committed to eliminate all forms ofharmfulpractices.
Gender-biasedsexselectionismeasuredthroughsexratioatbirth,acomparisonofthenumberofgirlsversusthenumberofboysborninagivenyear.Thisrequiresaccurateandreliabledataonsexratioatbirthtojudgetheextentofimbalances.InIndia,severalsourcesprovidethisindicator,however,mostoftentheseestimatesdonotagreetoeachother.Thisreportanalysesvariousestimatesofsexratioatbirthandattemptstoarriveatthemostplausiblelevel,afterapplyingacorrectionfactor.
Further, this report elaborates on the severity of gender-biased sex selection byexamining the pre and post-natal discrimination against girls, the estimation ofnumberofgirlsmissingatbirth,thepracticeofsex-selectionbybirthorderandthesexcompositionoftheexistingnumberofchildren,basedonbackgroundcharacteristicsandbygeographicalregions.Thereportalsoexploresvariousfactorsassociatedwiththisphenomenonandthereasonsbehindsuchdiscriminatorypractices.
TheGovernmentofIndiahasenactedseverallawstobanpre-natalsexdetectiontocurbthepracticeofgender-biasedsexselectionandinitiatedseveralprogrammestoenhancethevalueofthegirlchild.Civilsocietyorganisationshavelongbeenactivelyengagedinlarge-scalecampaignstoaddresssonpreference.Althoughtrendsofthesexratioatbirthsuggestthatthereisacontinuedpreferenceforsonsinthecountry.Oneofthecriticalaspectsofthisanalysisisthepost-natalneglectofthegirlchild,whichhasbeenacknowledgedinpublicdiscourse,butstillneedsappropriatemeasurestoaddressit.IwishtothankProf.P.M.Kulkarniforhiseffortsinbringingoutthisreport.
I hope that the analysis and insights from this report, looking specifically at thisharmfulpractice inIndia,willcomplementUNFPA’s StateoftheWorldPopulation2020Reportthatfocuseson19harmfulpracticesthatdiscriminateagainstwomenandgirls.Further,Ihopethisreportwillbeusefulforpolicymakers,programmeplanners,academiaandcivilsocietyorganisationstodeviseevidencebasedstrategiestoaddressthesexratioimbalanceinthecountry.
Argentina Matavel PiccinUNFPA Representative India and Country Director Bhutan

vi

vii
Acknowledgements
TheriseinmasculinityinIndia’ssexratioatbirthhasbeenamatterofdeepconcernforquitesometime.Inviewofthis,theUnitedNationsPopulationFund(UNFPA) commissioned this study to examine the current situation regardingsexratioatbirthinIndia,obtainestimatesofmissingfemalebirthsandmissinggirls, and analyse influences of various factors on pre-natal and post–nataldiscrimination.TheinitiativeforthisresearchcamefromMs.ArgentinaMatavelPiccin,Representative,UNFPA,India.Thereporthasbenefitedonaccountofthesupport of anumber of officers fromUNFPA, India.Ms.EnaSingh,AssistantRepresentative, UNFPA, India, took keen interest in the study and providedvaluable suggestions. Sanjay Kumar has been associated with the researchthroughouttheentirecourseoftheproject.Heexaminedthemethodology,drewattentiontoimportantrelevantsourcesofdata,andgavefeedbackonanalysisand presentation. Sanjay’s contribution to the study has been invaluable.InteractionswithDhanashriBrahmeandShobhanaBoyleduringtheconductofthestudyandtheircommentsonearlierdraftshavesignificantlystrengthenedthe report. Hemant Bajaj and Laetitia Jones Mukhim provided efficientadministrativesupport.
The present work has benefited immensely from discussions with ProfessorsChristopheGuilmoto,CEPED,Paris,RavinderKaur,IIT,DelhiandMaryJohn,CentreforWomen‘sDevelopmentStudies,NewDelhi,eminentresearchersinthefield.
TheanalysisinthereporthasusedtheunitleveldatafromvariousroundsoftheNationalFamilyHealthSurvey(NFHS)andtheIndiaHumanDevelopmentSurvey (IHDS). Access provided to the data files by the survey organisations,the International Institute for Population Sciences (IIPS), Mumbai and theUniversityofMarylandandtheNationalCouncilofAppliedEconomicResearch(NCAER),NewDelhi,isgratefullyacknowledged.
Purushottom M. Kulkarni

viii

ix
List of Abbreviations
BLY Birthslastyear
CEB Childreneverborn
CRS CivilRegistrationSystem
EFCM Excessfemalechildhoodmortality
GBSS Genderbiasedsexselection
HMIS HealthManagementInformationSystem
IHDS TheIndiaHumanDevelopmentSurvey
IIPS InternationalInstituteforPopulationSciences
MA MovingAverage
MCA MultipleClassificationAnalysis
NFHS NationalFamilyHealthSurvey
OBC OtherBackwardCaste
ORGI OfficeoftheRegistrarGeneral&CensusCommissioner,India
PCPNDT Pre-ConceptionandPre-NatalDiagnosticTechniques
PNDT Pre-NatalDiagnosticTechniques
PES Postenumerationsurvey
SC ScheduledCaste
SFMS SpecialFertilityandMortalitySurvey
SRB Sexratioatbirth
SRS SampleRegistrationSystem
ST ScheduledTribe
UNFPA United Nations Population Fund

x

xi
Thesexratioatbirth(SRB)inIndiahasbecomemore masculine in the recent decades. Theimbalance in sex ratios stems from strong
son preference combined with declining fertility,and the availability of and access to sonographicscanningduringpregnancy.ThepracticeofgenderbiasedsexselectioncontinueseventhoughIndiahasenactedlawsbanningtheuseofpre-nataldiagnostictechniquesforsexdetection.Theinstancesofgenderbiasedsexselectionareobviouslynotrecordedbutthe numbers of cases can be estimated indirectlybasedonthedeviationoftheobservedSRBfromthenaturallevel.Tothisend,thisstudyfirstexamineddataonIndia’sSRBfromvarioussources,identifiedthe most plausible estimates, and then used these to estimate thenumbers ofmissing female births.Further,thestudyestimatesthenumberofmissinggirls based on the 2011 census enumeration andpresentsthedecompositionofthemissingnumbersby two factors, pre-natal discrimination (sexselection at birth) and post-natal discrimination(excess female childhood mortality). For the five-year period beyond the 2011 census, the studyestimates gender biased sex selection and excessdeathsofgirlsbelowagefive.Thestudygoesastepfurther and presents variations in the SRB by thestageof familybuilding, that is,atdifferentbirthordersandbythesexcompositionofpreviousbirths,up to the third order. In its analysis, the studyexamines, socioeconomic and spatial differentialsintheSRBatvariousstagesoffamilybuildingandassessesthenetinfluencesofvariousfactorsontheprobabilityofamalebirth.Finally,thestudylooksatrecentevidenceonreasonsforsonpreferenceand,inparticular,onthevalueaccordedtosonsvis-à-visdaughters.Themainresultsarepresentedbelow.
The SRB in India is clearly more masculine thanthe natural level. In the absence of sex selectionthe SRB is around 105male births per 100 femalebirths or around 950 female births per 1000malebirthswhereasinIndiathenumberoffemalebirthsper 1000 male births ratio has been much below950intherecentdecades.EstimatesoftheSRBareavailable from various sources, and an assessment
of these revealed that the census based indirectestimate obtained by reverse survival is the mostplausible one. At the national level, this was 923female births per 1000male births for the period2004-2011. The sample registration system (SRS)estimateoftheSRBforthisperiodis903andseemsto be an underestimate (whenmeasured in termsoffemalesper1000males)byabouttwopercentatthe national level and needs to be corrected; thecorrection factor varies somewhat for states. TheSRB has been fluctuating in the range 900 to 930female births per 1000male births since 2000 forIndiawithnocleartrend.
TheregionalpatternintheSRBiswellrecognized.States in the northern-western region showmuchmoremasculineSRBthanintheotherregions;somestatesinthecentralregionalsoshowlowratiosbutnot to the levels of the northern-western regions.The eastern, northeastern, and southern regionsgenerally show ratios near natural. In Punjab,Jammu and Kashmir, and Himachal Pradesh theSRBseemstohaverisenbutisstill lowerthanthenaturallevel.
It is estimated that close to 400 thousand femalebirthsaremissed in Indiaannuallyasaresultofgender biased sex selection, amounting to aboutthreepercentoffemalebirths.Thedegree(numberoffemalebirthsmissedaspercentoffemalebirthsoccurred) is high in most states in the northernand western regions, moderate in Uttar Pradesh,HimachalPradeshandMadhyaPradesh,andlowornegligibleinmoststatesintheeasternandsouthernregions.
Atthe2011censusenumeration,aboutfourmilliongirls of ages 0-6 may be considered to have beenmissing;2.5milliononaccountofsexselection(pre-nataldiscrimination)and1.5millionduetoexcessfemale mortality (post-natal discrimination). Thissituationhaspersistedbeyond2011aswell.Further,while pre-natal discrimination is concentratedin the northern and western regions, post-natal- discrimination is common across the country;
Executive Summary

xii
thesouthernregionanda fewotherstates showrelatively low levels but the regionaldifferencesinpost-nataldiscriminationarenotaswideasinpre-nataldiscrimination.
At higher birth orders and among those whohave no son, the SRB is very highly masculinein the northern, western, and central regions.Sex selection at the third birth following twodaughters seems to be verywidely prevalent. Inthenorthernregion,theSRBatthefirstorderisalsomoremasculine thannatural implying thatthereissomesexselectionatthefirstbirthitselfindicating that some couples desire to avoid thebirthofevenonedaughter.
Some differences in the SRB by socioeconomicbackground are seen especially at the secondand thirdbirths.For the secondbirthafterfirstdaughter, the SRB is generally more masculinethanaverageinthehighesteducationandwealthclasses.Atthethirdbirthfollowingtwodaughters,theSRBishighlymasculine;thisismoresointhemost recent period of 2010-14. Further, the SRBis highly masculine at the highest wealth andeducation levels, in the northern and westernregions.Highlymasculine SRB is also associatedwithhighmediaexposure.
Evidence on perceived values of sons vis-à-visdaughtersshowsthatsonsarevaluedforoldagesupport, financial as well as for residence; suchreliance is relatively higher in the northernand western regions compared to other regions.Though some changes in attitudes are seen in
recentinvestigations,thesearenotlargeenoughand parents by and large continue to expectsuch support primarily from sons rather thanfrom daughters. Besides, in spite of the legalentitlementsandprovisions,itisnotcommonfordaughterstoinheritparentalproperty.
The analysis shows that in spite of effortsmadeby enactment of laws and campaigns by thegovernment and civil society organisations, sexselection has continued. Though some changehasbeenseeninPunjab,Haryana,andHimachalPradesh, the SRB is yet to return to thenaturallevel in these states. Besides, in recent years,the SRB in some states outside the northern-westernregionhasalsobecomemoremasculine.Given that sonpreference iswidelyprevalent inIndia,thereisapossibilityofthepracticeofsexselectionspreadingtoareaswhichhavehithertonotshownitonalargescale,oncetheavailabilityofsonographicscanfacilitiesandaffordabilityoftheservicesrise.
Itmustalsoberecognisedthatalargenumberofgirlsare‘missing’duetopost-nataldiscrimination,reflected in higher childhood mortality amongfemales than amongmales.While thematter ofgender biased sex selection has been receivingmediaandpolicyattentioninIndia,andrightlyso,post-nataldiscriminationrarelyfiguresinpublicdiscussions.Itisimperativethatcivilsocietyandpolicymakersaccorddueattentiontothisconcernaswellandadoptappropriatemeasurestoaddressit.

1
ThesexratioofIndia’spopulationhasbeeninfavourofmalesincontrastto the situation inmost of theworldwherewomenoutnumbermen inthe population. In his seminalwork on India’s sex ratio, Visaria (1968)
examinedthedatauptothecensusof1961andidentifiedhighermortalityamongfemalesascomparedtomalesastheprincipalfactorresponsiblefortheratiotobeinfavourofmalesinIndia’spopulation.Ontheotherhand,forthecountryasawhole,thesexratioatbirthwasnearthenaturallevel;theratioisusuallycloseto105malebirthsper100femalebirths,generallyintherange104to106,oraround952femalebirthsper1000malebirths,intheabsenceofanydistortion.However,datasincethe1990shaverevealedariseinmasculinityinIndia’ssexratioatbirth (SRB)and this issuehasbeenexamined inanumberof studies(Premi,2001;Bhat,2002;Arnoldetal.,2002;BhatandZavier,2007;GuilmotoandAttene,2007;Guilmoto,2008,2009).Moreover,ithasemergedthatgenderbiasedsex selection has been practised especially since the 1990s on a large scale inmanypartsofthecountrycausingtheSRBtobecomemoremasculine(Arnoldetal.,2002;Jhaetal.,2006;Kulkarni,2007;Visaria,2007;Kulkarni,2012;BongaartsandGuilmoto,2015).Thisoutcomestemsfromstrongsonpreferencecombinedwithdecliningfertilityandenabledbytheavailabilityofandaccesstopre-natalsexdetectiontechnologies,especiallytheuseofsonographicscans.
Inpopulationswithsonpreference,stoppingstrategies(havechildrenuntilthedesirednumberofsonsisbornandthenstopchildbearing)areoftenadoptedbutitiswellrecognisedthatsuchstrategiesdonotaltertheSRB(Goodman,1961).However, sex selection through sex detection and gender biased sex selectiondoesinfluencetheSRB.Suchaplanwouldbeadoptedbycoupleswhowanttohaveacertainnumberofsons(oracertainsexcompositionofchildren)butatthesametimelimitthetotalnumberofchildren.Thismayalsobedoneincaseofaversiontochildrenofaparticularsex(‘daughteravoidance’hasoftenbeenmentionedinliterature).Inthepast,technologyforpre-natalsexdetectionwasnotavailableandhenceresortingtogenderbiasedsexselectionwasnotanissue.FemaleinfanticidewaspracticedtosomeextentinafewpopulationsandthereisevidenceofthisforpartsofIndia(Visaria,1968;Georgeetal.,1992),andwhilethispracticeaffectedthechildsexratio itdidnotaffect theSRBpersesinceinfanticideoccurspost-birth.However,sincethe1980s,pre-natalsexdetectionhasbecomeeasilyaccessibleinmanypartsoftheworldandwithadvancementin technology, pre-natal sex selection (also referred to as gender biased sexselection)hasengineeredariseinmasculinityatbirth.
India is not unique to this phenomenon; South Korea, China, Vietnam, andcountriesaroundtheCaucasushavealsoseenthispracticeonafairlylargescalethough this has been phased out in SouthKorea (Guilmoto andAttane, 2007;Guilmoto,2015;Guilmotoetal.2018).There isalsoevidenceofsuchapracticeamongpersons of Indianorigin in theUnitedKingdom (DubucandColeman,2007).Inordertoeliminategenderbiasedsexselection,Indiahasenactedlawstobanpre-natalsexdetection;thePre-NatalDiagnosticTechniques(Regulation
Introduction 1
The sex ratio at birth was near the natural level; the ratio is usually close to 105 male births per 100 female births, generally in the range 104 to 106, or around 952 female births per 1000 male births, in the absence of any distortion. However, data since the 1990s have revealed a rise in masculinity in India’s sex ratio at birth (SRB)

2
and Prevention ofMisuse) Act, 1994 (PNDT Act), thatwas amended in 2003 asthe Pre-Conception and Pre-Natal Diagnostic Techniques (Prohibition of SexSelection)Act(PCPNDTAct).
Availableevidenceshowsthat,inspiteoftheAct,thepracticeofgenderbiasedsexselectionpersistsinIndia.Sincethepracticeisillegal,itisdifficulttohaveanydocumenteddataonthenumbersofsuchcases.However,anestimateofthenumberofinstancesofgenderbiasedsexselection,thatis,thenumberofmissingfemalebirths, maybedrawn indirectly fromtheSRB.ThoughdataonSRB inIndiaareavailable fromvarious sources, theestimatesobtained fromdifferentsourcesdonotalwaysagreewiththeresultthattherearediverseinferencesonthelevelsandchangesintheratio.Therefore,thisstudyfirstliststhesourcesofdataontheSRBandpresentsestimatesfromthesesince1991;forestimatesfromvarioussourcesforearlierperiodsseeKulkarni(2007;2009).
ThestudythendiscussestheacceptabilityofvariousestimatesoftheSRBtoarriveatthemostplausibleestimates.ThesevaluesoftheSRBhavethenbeenused,inconjunctionwithestimatesofthenumbersofbirths,toestimatethenumbersofmissingfemalebirths..
The practice of gender biased sex selection, resulting from ‘pre-nataldiscrimination’againstfemales,isonlyonefactorcausingfemaledeficit.Higherthanexpectedfemalechildhoodmortality,duetoneglectofthegirlchild,called‘post-nataldiscrimination’,istheotherfactorthatcausesfemaledeficit;infact,thepioneeringworkonestimationofmissingwomenbySen(1990)andCoale(1991)wasinthecontextofthisfactor.Hence,thestudyestimatesthenumberofmissinggirlsat the2011censusenumerationandpresents itsdecompositionbythetwofactors, pre-natal discrimination and post-natal discrimination. This has beendoneforgirlsofages0-6,sincethechildsexratioforthisagegroupiscommonlyused in India indiscussionson femaledeficit.Further, for thefive-yearperiodbeyondthe2011census,estimatesofmissingfemalebirthsandexcessdeathsofgirlsbelowagefivehavebeenobtained.
ThestudyalsoexamineshowtheSRBvariesbythestageoffamilybuilding,thatis,atdifferentbirthordersandbythesexcompositionofpreviousbirthsuptothethirdorder.Thisaidsanunderstandingofthelocationofsexselectionwithinthereproductivespan.Thisisfollowedbyanexaminationofsocioeconomicandspatialdifferentialsinthesexratioatbirthatvariousstagesoffamilybuildingandanassessmentofthenetinfluencesofvariousfactorsontheprobabilityofamalebirthatordersuptothethird.Finally,thestudylooksatrecentevidenceonreasonsforsonpreferenceand,inparticular,onvaluesofsonsvis-à-visdaughters.
Sex selection, in addition to being intrinsically undesirable, also has adverseimplicationsforthesocietycausingseximbalancesinthesociety.TheimpactofsuchseximbalanceonmarriagesqueezeinIndiahasbeenexaminedinpaperbyKaur(2004),Guilmoto(2012),andKauretal.(2016)andisnotthesubjectmatterofthepresentstudy.
In international convention, the SRB is expressed in terms ofnumber ofmalebirthsper100femalebirths.However,inIndiaSRBistraditionallypresentedasnumberoffemalebirthsper1000malebirthsandhenceratiosinthisconventionarepresentedinthetablesinthisstudy.Inthisconvention,alowerSRBmeanshighermasculinityatbirth.TheconversionfromSRBinoneconventiontoanotherisstraightforward:
SRB (malebirthsper 100 femalebirths)= 100000/SRB (femalebirthsper 1000malebirths).
The study estimates the number of missing girls at the 2011 census enumeration and presents its decomposition by the two factors, pre-natal discrimination and post-natal discrimination

3
Estimates of Sex Ratio at Birth from Different Sources of Data
A number of independent data sets allow estimation of the sex ratio atbirth. These include the Civil Registration System (CRS), the SampleRegistration System (SRS), the decennial censuses, and the National
FamilyHealthSurveys(NFHS).Besides,someothersurveys,andadministrativerecordsincludingtheHealthManagementInformationSystem(HMIS)alsogiverelevantdata.
2.1 Civil Registration SystemTheCRShasbeeninoperationinIndiaforalongtime.Initially,registrationofbirthsanddeathswasvoluntarybutaftertheenactmentoftheRegistrationofBirthsandDeathsActin1969itismandatorytoregisterallbirthsanddeaths.TheORGIpublishesannualreportsthatprovidedataonregistrationandthesegive SRB for India and states andunion territories.However, for someyears,tabulationsofbirthsbysexarenotavailableforafewstates.Thoughthelevelofcompletenessofcoverageofcivilregistrationofbirthshasshownanimpressiverisefrom56percentin2000to86-88percentduring2014-2016,thecoverageisfarfromcomplete(RegistrarGeneral,2019a).Sinceregistrationcanbesexselective,theestimatesofSRBarelikelytobebiased(newbornboysaremorelikelytoberegisteredthangirls,asnotedbyVisaria,1968)andthisisalimitationthatneedstobenoted.TrendsintheSRBaccordingtotheCRSsince1991areshowninTable1.Atthenationallevel,theSRBhasfluctuatedbetween857and909;thelowestvaluewasseenintheyear2010,however,thisappearstobeanoutlierasthisismuchdifferentfromthevaluesfor2009(898)and2011(909).Overall,theSRBwashighlymasculinethroughouttheperiod;thelevelwassomewhathigherduring2007to2013(excepttheyear2010whenitwasunusuallylow)buttheredoesnotseemtobeanydiscerniblelong-termtrend.
2.2 Sample Registration System (SRS)
TheSampleRegistrationSystem(SRS)wasintroducedinIndiain1964-65onapilotbasisandin1969onaregularbasissincetheCivilRegistrationSystemdidnothaveagoodcoverageatthetime.TheSRShasbeenprovidingestimatesoffertility andmortality on a regular basis since 1970 (Registrar General, 2019).The SRS is a dual record systemwith continuous registration andhalf-yearly
2
Since registration can be sex selective, the estimates of SRB are likely to be biased

4
retrospectivesurveysthatarematchedandcorrected.In2017,thesampleoftheSRScovered8850units(4961ruraland3889urban)whichhadatotalpopulationof7.9million.FortheSRB,estimatesforIndiaandlargestatesareavailableasthree-yearmovingaveragessince1998-2000(someestimatespriortothisperiodareavailableforIndiaasawhole).SincetheSRS,asthenameshows,isbasedon registration in a sample of geographic units, sampling errors can be largeand the organisation gives three-year averages of the SRB rather than singleyearestimates.Theestimatesforthethree-years 1990-92totheyears2015-2017arepresentedinTable1.AccordingtotheSRSestimates,theSRBhasbeenquitelow,below910,wellbelowthenaturallevel,throughouttheperiod.TherewasanapparentriseinthemasculinityintheSRBduringthefirstfewyearsofthecenturywiththeSRBfallingto880andamildrecoveryseenafter2003-2005butasmalldeclineafter2012-14.SincetheSRSchangedthesampleunitsin2004andagainin2014(theSRSnormallychangesthesampleunitsevery10years,usingthelatestcensusastheframe),someoftheseturnaroundsmaybeattributabletothesechanges.Notwithstandingthepossibleeffectofchangesinthesample,theSRSestimatesshowahighlymasculineSRBinrecentdecades.
2.3 Census
TheIndiancensusisdecennialandhasbeenorganizedregularlyforoveracentury.Since1981,thecensushasquestionson‘birthslastyear’tomarriedwomenandon‘thenumberofchildreneverborn’aswellas‘thenumberofsurvivingchildren’toevermarriedwomen.Thisinformationistabulatedbysexofchildrenandageofwomenwhichallowsustocomputethesexratioofbirthslastyearandofallbirthstowomen.TheSRBbasedonbirthslastyear(BLY)referstotheone–yearperiodbeforethecensusenumeration.OnecannotspecifyareferenceperiodfortheSRBbasedonallbirths(childreneverborn-CEB)sincethesebirthswouldhaveoccurredoveralongperiod;fortheyoungerwomenthebirthswouldberecentbutforolderwomen,manyofthesebirthswouldhaveoccurredsometimeago.HencewecomputetheSRBbasedonbirthstowomenintheagerange20-29,labeledCEB(20-29),asalmostallofthesebirthswouldhaveoccurredduringaperiodof 10-15yearsbeforethecensusandmostduringthe10-yearperiodbeforethecensus.Thoughno specific ‘referenceperiod’ as such canbe given for this SRB, itdoesrefertoarecentperiod.TheBLYandCEB(20-29)estimatesbasedon2001and2011censusesaregiveninthelastcolumnofTable1.
Further,thecensusesprovideage-sexdistribution.Inpublicdiscoursesandthemedia,thechild-sexratiohasoftenbeenusedtocommentonthelevelofSRBandby implicationon sex selection.The child sex ratio for the age group0-6iscommonlyusedinIndiabecausethisratioisavailablesoonafterthecensuswhereastabulationsoncompleteage-sexdistributiontakelongertime.Strictlyspeaking,childsexratioisnotidenticaltoSRBsincechildsexratioisinfluencedbysexdifferentialsinearlychildhoodmortalityinadditiontotheSRB.Butifinformationonchildmortalitybysexisavailable,onecanestimatetheSRBfromthechildsexratioindirectlybyapplyingthetechniqueofreversesurvival.Forthispurpose,agegroupssuchas0-4or5-9maybeusedinordertoestimaterecentSRB.However,sexselectivemisreportingofageandsexselectiveomissioncandistort this ratio. It has been seen that such an effect isminimal in the agerange0-6(Bhat,2002)andhenceitispreferabletoestimatetheSRBbasedonthechildsexratiofortheages0-6.KumarandSathyanarayana(2012)haveobtainedsuch estimates from the 2001 and 2011 census data. These refer to the seven-
The study estimates the number of missing girls at the 2011 census enumeration and presents its decomposition by the two factors, pre-natal discrimination and post-natal discrimination

5
Table 1:Table 1: Estimates of sex ratio at birth from various sources, India, 1991-2017(femalebirthsper1000malebirths)
Year/mid-year of period
Source
CRS SRS @ NFHS-3Annual MA $
NFHS-4Annual MA $
HMIS Census based
1991 865 900 870 947 859 850
1992 863 894 957 925 865 858
1993 863 885 937 915 840 868
1994 862 879 913 933 894 876 Based on
1995 870 883 897 928 877 882 2001 Census
1996 869 891 969 926 897 894 CEB20-29 939
1997 881 901 929 930 895 901
1998 883 928 938 907 899 Indirect 935
1999 895 898 933 928 926 905
2000 886 894 936 933 871 919 BLY 906
2001 875 892 914 927 929 921
2002 872 883 956 919 963 917
2003 868 882 894 917 925
2004 872 880 894 908 923 Based on
2005 876 892 907 916 2011 Census
2006 891 901 920 916 CEB20-29 928
2007 903 904 928 919
2008 904 906 920 912 900 Indirect 923
2009 898 905 919 909 927
2010 857 906 875 909 913 BLY 899
2011 909 908 902 913 917
2012 908 909 931 911 915
2013 898 906 942 918
2014 887 900 905 918
2015 881 898 923
2016 877 896 926
2017 929
@:Three-yearmovingaverage;$:MA:Five-yearmovingaverage.CEB(20-29):Childreneverborntowomenofages20-29atthecensus.BLY:Birthslastyear.Indirect:Indirectestimatecomputedbyapplyingreversesurvivaltochildsexratio(ages0-6).Sources:CRS(CivilRegistrationSystem):RegistrarGeneral(2013a,2018a);SRS(SampleRegistrationSystem):RegistrarGeneral(variousyears,2001-2018);NFHS-3and4(NationalFamilyHealthSurvey-3,-4):ComputedfromNFHS-3,-4datafiles;HMIS(HealthManagementInformationSystem):HMIS(2018);Censusbased:CEBandBLYestimatescomputedfrom2001and2011Censusfertilitytables;Censusbased:IndirectestimatesfromKumarandSathyanarayana(2012).

6
year periods before the census, that is,March 1994-February 2001 andMarch2004-February2011orroughly1994-2000and2004-2010basedonthe2001and2011censusesrespectively.Theseestimates,labeledindirectestimates,arealsoshownin Table 1.
ThethreeestimatesoftheSRB,fromBLY,CEB(20-29),andindirectfromchildsexratio,dovarysomewhat.TheratiobasedonBLYislowerthanthatbasedonCEB(20-29).TheestimatebasedonBLYreferstothelastyearbeforethecensuswhereasthatbasedonCEB(20-29)referstoalongerperiodbeforethecensusandhighervaluesforthelattermayindicatethattheSRBhasbeenfallingovertheyearspriortothecensus.However, it isseenthatwhilethenumberofbirthsreportedasBLY in the2001 censuswas 19.9million, theestimatednumberofbirthsbyapplyingtheSRSbirthratetothethenpopulationwouldbecloseto26.3million. Similarfigures for the 2011 census are: reported births last year20.9millionandestimatedbirths26.5million.Thus,alargenumberofbirthsthatoccurredinthepreviousyearwerenotreportedinthecensusesasbirthslastyear.Inviewofthis,aninferenceontrendsisnotwarrantedmerelyfromacomparisonoftheestimates.Incidentally,theindirectestimatesfromthecensuschildsexratiosareclosetothosebasedonCEB(20-29)forboththecensuses.
2.4 National Family Health Surveys (NFHS)
TheNationalFamilyHealthSurvey(NFHS)istheDemographicandHealthSurvey(DHS)forIndiaandfourroundsoftheNHFShavebeencarriedout inIndiasofar;thelatestround(NFHS-4)wasin2015-16andtheprevious(NFHS-3)in2005-06.ThesurveyshavealargesamplesizeandthiswasparticularlysoinNFHS-4;6,01,509householdsand6,99,686womenofages15-49wereinterviewedinNFHS-4and1,09,041householdsand1,24,385womenofages15-49interviewedinNFHS-3(InternationalInstituteforPopulationSciences(IIPS)andMacroInternational,2007;InternationalInstituteforPopulationSciences (IIPS)andICF,2017).SincetheNFHSobtainedcompletefertilityhistories,itispossibletocomputeSRBforvarioustimeperiods;theNFHSdatafilesalsoallowanexaminationofSRBbythesexcompositionofpreviousbirthsinordertoseehowtheSRBis influencedbysexpreference,especiallysonpreference,anissuethatwillbeaddressedinalatersection.EstimatesofSRBforIndiaforcalendaryearsupto2004forNFHS-3andupto2014forNFHS-4,thelastcompleteyearscoveredinthetwosurveysrespectively,areobtainedfromtheNFHS-3andNFHS-4datafiles;sampleweightsprovidedinNFHSdatafileshavebeenapplied.
Theestimatesarepresented inTable 1and inFig.1.Therewasagapof 10yearsbetween the NFHS-3 and the NFHS-4 and hence for the years prior to 2005,estimatesareavailablefromboththesurveys.ItisseenthattheNFHS-4estimatesfor theyears2000to2002areslightly lower (moremasculine) thanthosefromthe NFHS-3, and for earlier years, the NFHS-4 showsmuch lower values. It islikelythatforchildrenbornlongago,morethan10yearsbeforethesurvey,thereisselectiveomissionofgirlsinreporting.Oneplausiblereasonisthat,theNFHSbeingaretrospectiveenquiry,birthsofdaughterswhoweremarriedbythesurveydatemaynothavebeenreportedbysomewomeninthesurvey.Regardlessofthereasonsforsuchomission,itisnotadvisabletodrawinferencesbasedontheNFHSestimatesreferringtoperiodsmuchbeyond10yearsbeforethedateofthesurvey.Further,sincetheNFHSaresamplesurveys,theestimateshavesamplingerrorsasaresultofwhichfluctuationsareseenintheannualseries(Fig.1).Hence,five-yearaverageshavealsobeencomputedandpresentedinFig.1andinTable1.
The NFHS data files allow an examination of SRB by the sex composition of previous births in order to see how the SRB is influenced by sex preference, especially son preference

7
Fig.1:Fig.1: Trends in SRB based on NFHS-3 and NFHS-4, India, annual estimates and five-year moving averages (female births per 1000 male births)
975
950
925
900
875
850
825
8001991 1996 2001 2006 2011 2016
1000
NFHS-4-MA NFHS-4 NFHS-3-MA NFHS-3
Note:MA:Five-yearMovingAverage;thesevaluesareshownagainstthemid-yearinthegraph.Source:Table1.
From theNFHS-3 series, it is seen that the SRB (five-year average)was fairlystablefrom1992to2002(thelastmiddleyearforwhichfive-yearaveragecouldbecomputedfromtheNFHS-3),fluctuatingmildlyaround925femalebirthsper1000malebirths.TheNFHS-4seriessince2000showsaslightlylowerSRB,fluctuatingaround915upto2012(thelastmiddleyearforwhichfive-yearaveragecouldbecomputedfromtheNFHS-4).Thus,thetwosurveysshowlowerthannaturalSRBinIndiafluctuatingintherange910to935femalebirthsper1000malebirthsovertheperiod1992to2012(ignoringtheNFHS-4estimatesforyearsbefore2000forreasonsnotedabove).
TheIndiaHumanDevelopmentSurvey(IHDS)isanotherseriesoflargesurveyswhichalso collectdataon fertility; this surveywasconductedduring2004-05andagain in 2011-12 (IHDS, 2018). Thefirst roundof the IHDS (IHDS-1)nearlycoincideswiththeNFHS-3andthereportshowedthatatthenationallevel52percentofbirthswereboys(basedonbirthsduringthe10-yearperiodbeforethesurvey).ThisisequivalenttoanSRBof923femalebirthsper1000malebirthswhichisclosetotheNFHS-3estimatefortheperiodwhichis930for1995-99and919for2000-2004.
2.5 Health Management Information System (HMIS)
The HMIS is a relatively new system introduced by the Ministry of HealthandFamilyWelfareoftheGovernmentofIndiaaspartoftheNationalHealthMissiontocollectinformationonvariousaspectsofhealthservicesinordertomonitor the performance of the programme (HMIS, 2018). The information isprovidedbyhealthworkersand institutionsanddataat thedistrict levelareuploadedtotheHealthStatisticsInformationPortalusingawebbasedHealthManagement InformationSystem(HMIS) interface.Periodic reportsaremadeavailablebythesystem.Theinformationpertainstoservicesbyboththepublicandtheprivatesectors.TheHMISreportssince2008-09(monthly,quarterly,andannual,atnational,state,anddistrictlevel)areavailableonthewebsiteandthesexratioatbirthhasbeenincludedinthereports.ThevaluesofSRBfromthissystemareshowninTable1.
Two rounds of National Family Health Surveys (NFHS) show lower than natural SRB in India fluctuating in the range 910 to 935 female births per 1000 male births over the period 1992 to 2012

8
Exceptforthefirstyearofinformation,2008-09,theSRBforIndiahasbeenintherange913and929.Thus,itismoderatelybelowthenaturallevel.
Itshouldbenotedthatthesystemisgettingestablishedandthecoverageisnotcomplete;thesystemalsogivesthelevelofcoverageofbirthsandthishasbeenhoveringaround75-80percentinrecentyears(HMIS,2018).Thereisapossibilitythatreportingofbirthshassomesexselectivity,andthiscouldbiastheestimatesto that extent.
2.6 Regional variations
The various sources provide estimates for states andunion territories aswellthough the SRS estimates are only for large states; estimates for states/unionterritoriesaregiveninAppendixTables.Geographicvariations intheSRBarevery conspicuousand seenacrossall the sources though theprecisevaluesdovary. States in the northern-western region show very low ratios, notablyPunjab, Haryana, Chandigarh, Delhi, Rajasthan, Himachal Pradesh, Gujarat,Maharashtra,andUttarakhand.Insomeofthesestates,theratioseemstohavebecome less masculine over the period; in particular, Himachal Pradesh andPunjabshowadistinctimprovementthoughtheratioinPunjabcontinuestobemoremasculinethanthenaturallevel.Ontheotherhand,inallthesouthernstates, inWest Bengal, Odisha, Chhattisgarh, and in the northeastern states,the SRB is generally close to the natural level. A few of these did showhighmasculinitybasedontheCRSdatainafewyears,butotherwisehaveSRBwithintherange935to970withnocleartrend.
Kumar and Sathyanarayana (2012) provide district level estimates of the SRBbasedonthecensus0-6sexratioviareversesurvivalandthesearedepictedinamap(Map2intheirpaper).TheseallowonetoseeamoredisaggregatedspatialpatternoftheSRBthanwhatisseenfromestimatesatthestatelevel.
States in the northern-western region show very low ratios, notably Punjab, Haryana, Chandigarh, Delhi, Rajasthan, Himachal Pradesh, Gujarat, Maharashtra, and Uttarakhand
9
AsseeninTable1,theestimatesofSRBforIndiaasobtainedfromvarioussourcesdonotalwaysagree.Thiscallsforacomparativeassessmentoftheestimatesfromtheavailablesources.TheSRSestimatesareforthree-
yearperiodsandhencesimilarthree-yearaveragesareobtainedfromtheannualestimates from the CRS. For comparing NFHS estimates, only the estimatesfortherecentperiodsareusedsince,asnotedearlier, theNFHSestimatesforperiods10yearsbeforethesurveyarehighlymasculinebecauseofalikelihoodofomissionofdaughtersbornwellbeforethesurveyintheretrospectiveenquiry.Moreover,five-yearaveragesof theNFHSareused since theannual estimateshavelargesamplingerrors.Fig.2presentsacomparativeviewoftheestimatesofSRBforvariousyearsandtimeperiods.Itisseenthatthethree-yearaveragesfromtheCRSarelowerthanthecorrespondingSRSestimatesbyabout10points.AlowervaluefromtheCRSshouldnotcomeasasurprisesinceregistrationofsonsismorelikelythanthatofdaughters.Further,theSRSestimatesarelowerthanthosefromtheNFHS-3andNFHS-4thoughtheveryrecentSRSestimatesarequiteclosetotheNFHSonesforthecorrespondingperiods.TherecentHMISestimatesarealsoclosetotheNFHSestimates.
Ofthecensusbasedestimates,thosefromBLY(birthslastyear)areclosetotheSRSestimates for the correspondingyears.However, theestimates impliedbythechildsexratios,obtainedindirectlybyreversesurvival,arehigherthantheSRSestimatesforthecorrespondingperiods(acomparativepicturecanbeseenfromthelowerpanelinTable2).Theestimatebasedonthesexratioforages0-6inthe2001censusreferstotheperiod1994-2000whichis935whereastheSRSestimateforroughlythesameperiodis895.Theestimatefromthe2011censusreferringto2004-10is923whereastheaverageofSRSestimatesforroughlythesameperiodis9031.TheCEB(20-29)estimatesfromthebirthstowomenofages20-29areslightlyhigherthantheonesimpliedSRB,byaboutfivepoints.But,asthesedonothaveaclearlydefinedreferenceperiod,itisnotpossibletocomparethesewithothers.Inadditiontothesourcesnotedintheprevioussection,theUnitedNations PopulationDivision also provides populationdata base for allcountries in the reports onworldpopulationprospects and thevalues of SRBforIndiaforfive-yearperiodsaccordingtothelatestpublication(U.N.,2019)are1.106,1.111,1.112,1.101,1.099,and1.099(expressedasratiosofmalebirthsto100femalebirths)fortheperiods1990-95,1995-2000,2000-2005,2005-2010,2010-2015,
1 Since the SRS does not give annual figures but only three-year averages, and there are some gaps in the SRS series of SRB estimates, it is not possible to get the averages precisely for the seven-year periods 1994 to 2000 and 2004 to 2010 and hence the average of the estimate for 1995-97, centered on 1996 and of 1998-2000 centered on 1999, is used for comparison with the 2001 census based estimate for 1994-2000 and the average of 2005-07 and 2008-10 estimates is used for comparison with the 2011 census based estimate for 2004-10.
Correspondence among Various Estimates
3
The estimate based on the sex ratio for ages 0-6 in the 2001 census refers to the period 1994-2000 which is 935 whereas the SRS estimate for roughly the same period is 895

10
2015-2020respectively;intermsoffemalebirthsper1000malebirths,theseare:904,900,899,908,910,and910.TheseareclosetotheSRSestimatesthoughnotidentical;theU.N.estimatefor2000-05ismuchhigherthanthatbytheSRS.
Fig.2:Fig.2: Comparison of estimates of SRB from various sources, India(femalebirthsper1000malebirths)
Source:Table1;SRS-correctedseriesbasedoncorrectionof0.978toSRSestimates
940
920
900
880
860
840
1991 1996
CRS - 3 year avg
NFHS-4 5-year avg HMIS SRS-corrected
SRS 3 year avg NFHS-3 5-year avg
2001 2006 2011 2016
960
Table 2:Table 2: Comparison of estimates of SRB from various sources for the periods 1994-2000 and 2004-10, India(femalebirthsper1000malebirths)
Period CRS SRS NFHS Indirect from Census Child sex ratio, ages 0-6NFHS-3 NFHS-4
1994-2000EstimateRatioto2001CensusIndirectestimate
878
0.939
895
0.957
929
0.994
935(2001census)
2004-10EstimateRatioto2011censusindirectestimate
886
0.960
903
0.978
911
0.987
923(2011census)
Sourceforestimates:Table1.
Note:theCRS,SRSandNFHSestimatesareaveragesforthespecifiedperiods.
Thus,weseethattheestimatesdodiffer;theCRSestimatesandthecensusbasedestimatesfromBLYarelowerthantheSRSestimateswhich,inturn,arelowerthantheNFHSfive-yearaverages,andthecensuschildsexratiobasedimpliedestimates2. Ifregistrationofbirthsissexselective,withthelikelihoodofregistrationbeinghigherformales,theCRSandSRSwouldunderestimatetheSRB(asmeasuredintermsoffemalebirthsper1000malebirths).Butitisalsoconceivablethatcensusenumerationfavoursfemalesandthisoverestimatesthechildsexratio(femalesper1000males)inthecensusandconsequentlytheSRBcomputedfromit.However,resultsfromthepostenumerationsurvey(PES)ofthe2011censusshowthatthereishardlyanysex-selectiveomissioninearlyages(RegistrarGeneral,2014a).Thenetomissionratesare32.57per1000formalesand32.57forfemalesfortheagegroup0-4and22.92per1000formalesand22.17forfemalesforthe5-9agegroup.
2 For a recent work on comparison of estimates of SRB, see Rajan et al. (2017).

11
Theslightdifferenceinthenetomissionratesinthe5-9agegroupdoesnotimpactthechildsexratiofor0-6agesbyevenonepoint.Thus,theSRBimpliedbythechildsexratiodoesnotappeartohavebeenaffectedbysexselectiveunder-enumeration.
Moreover,asnotedearlier,sexselectiveagemisreportinghasverylittleeffectonthe0-6agegrouptakenasawhole.Further,migrationatveryyoungagesisgenerallynot sex selectiveandhencewouldnot influence thechild sexratio.The computationof SRB from the child sex ratiodoes involve assumptions ofsexdifferentialsinearlychildhoodmortality.However,minordeparturesfromsuchassumptionsdonotaffecttheestimatenotably.Thechildsexratiofromthe2011censusis919femalesper1000malesandtheSRBwouldnotbelowerthanthisvalueunlessfemaleearlychildhoodmortalityislowerthanmalemortalitywhereasallevidencepointstowardshigherfemalethanmalemortalityduringearly childhood in India.According to the SRS report for 2011, theunder-fivemortalityratewas59per thousandforfemalesand51per thousandformales(under-fivemortalityratesbysexareavailableinrecentreportsoftheSRS;seeRegistrar General, various years). Given the evidence on sex differentials inchildmortality(whichshowshigherchildhoodmortalityamongfemalesthanmales)andonomissionrates(whichdonotvarybysex)incensusenumeration,estimatesofSRBshowinglowermasculinitythanthecensuschildsexratiosarenot tenable.
Inviewofthis,theindirectestimatesobtainedfromthechildsexratiosmaybeacceptedasthemostplausible.However,theseareavailableonlyonceintenyearsanddonotgiveatimeseriestoassesschangesovershortperiods.Ontheotherhand,theSRSgiveacontinuousseriesbuttheseareseentobeunderestimatesofthefemalebirthstomalebirthsratio.OnecouldthencorrecttheSRSestimatesonthebasisoftheratioofSRSestimatetotheindirectcensusbasedestimateforthesameperiod.Theseratios,showninTable2,are0.957basedon2001censusand0.978basedon2011census.Fortherecentperiod,thecorrectionof0.978asobtained from the 2011 censusmaybe applied. Thus the SRS estimatemaybecorrectedbydividingitby0.978incaseoffemalebirthstomalebirthsratio;asaroundfigure,thecorrectionamountstoraisingtheSRSestimateby2percent.The estimates so corrected from 2000 onwards are shown in Fig.2 alongwiththedirectestimates.Afterapplyingthecorrection,India’sSRBduring2000-2016fluctuatesintherange899to929(roundedto900to930)femalebirthsper1000malebirthswithnocleartrend.
Inarecentanalysis,Kauretal.(2016)alsonotedamismatchbetweentheSRSestimateandindirectcensusbasedestimatesof theSRBandadjustedtheSRSestimates on the basis of the relationship between SRB and child sex ratiothroughchildmortalityrates(fordetailsseeAppendix–Iofthepapercited).Fortherecentyears,theadjustedvaluesofSRBarehigherthantheSRSestimatesby2-3percent(femalesper1000males)attheall-Indialevel,closetothecorrectionnoted above. For periods before 2000, the correction is higher, by about fourpercent,whichis inlinewiththecorrectionfactorof0.957basedonthe2001censusshowninTable2.
The SRS give a continuous series but these are seen to be underestimates of the female births to male births ratio. One could then correct the SRS estimates on the basis of the ratio of SRS estimate to the indirect census based estimate for the same period
After applying the correction, India’s SRB during 2000-2016 fluctuates in the range 899 to 929 female births per 1000 male births with no clear trend

12
Table 3:Table 3: Comparison of estimates of SRB from various sources for the period 2004-10, India and large states
India/state
Estimates of SRB for the period 2004-10 from various sources
(female births per 1000 male births)
Ratios to indirect census based estimate
CRS2004-2010Average
SRS2005/07&2008/10average
NFHS-42004-2010
Indirectestimatebasedon2011census
CRSest./Censusindirect
SRSest./Censusindirect
NFHS-4est./CensusIndirect
India 886 903 911 923 0.960 0.978 0.987
AndhraPradeshβ 980 917 915 938 1.045 0.978 0.975
Assam 888 933 959 961 0.924 0.971 0.998
Bihar $ 910 930 943 $ 0.966 0.986
Chhattisgarh 916 977 951 971 0.943 1.006 0.979
Delhi 874 877 787 873 1.001 1.005 0.901
Gujarat 885 897 910 895 0.989 1.002 1.016
Haryana 840 845 818 845 0.994 1.001 0.969
HimachalPradesh 894 936 965 916 0.976 1.022 1.053
Jammu&Kashmirα 918 863 933 866 1.060 0.997 1.077
Jharkhand 854 923 946 958 0.891 0.963 0.987
Karnataka 973 934 934 949 1.026 0.985 0.984
Kerala 947 962 961 965 0.981 0.997 0.996
MadhyaPradesh 892 917 921 923 0.966 0.993 0.998
Maharashtra 850 883 856 896 0.949 0.985 0.955
Orissa 925 935 938 942 0.982 0.993 0.996
Punjab 812 834 837 854 0.950 0.977 0.980
Rajasthan 824 871 877 897 0.918 0.971 0.978
TamilNadu 934 935 928 942 0.992 0.993 0.985
UttarPradesh $ 875 909 914 $ 0.958 0.995
WestBengal 913 937 938 954 0.957 0.982 0.984
Sourceforestimates:Appendixtables1-5
β :IncludingTelangana;α;IncludingLadakh;$:Dataforsomeyearsarenotavailable.
A comparison of estimates for large states is shown in Table 3 for the period2004-10.Itisseenthatinamajorityofstates,theratioofSRSestimatetocensuschild sex ratio based estimate is close to 0.98, that is, the SRS estimates arelower(showinggreatermasculinity)thanthechildsexratiobasedestimatesbyabout twopercent. The SRS estimates are lower bymore than twopercent inUttarPradesh,Bihar,Jharkhand,Rajasthan,andAssam.Ontheotherhand,inafewstates,theSRSestimatesareveryclosetothecensusbasedestimateswiththedifferencebeinglessthanonepercent.Thus,theSRSestimatesseemtobeacceptableinthesestatesbutrequireasmallcorrectionatthenationallevelandforotherstates.
13
A lower (more masculine) than natural SRB obviously implies theoccurrence of gender biased sex selection. Such sex selection againstfemale births, indicates pre-natal discrimination, and is one factor
causingfemaledeficitinthepopulation.DepartureoftheSRBfromthenaturallevel,inconjunctionwiththenumberofbirths,givesanestimateofthenumberofmissing female births provided there is no sex bias in reporting of births.The other factor behind relative femaledeficit inpopulation is excess femalemortality. Generally femalemortality is lower thanmalemortality.Maternalmortality does certainly raise femalemortality in childbearing ages butwithsubstantialdecline in this, femaledisadvantagerelative tomales isno longeranissue.However, insomepopulations,femalemortality ishigherthanmalemortality even during childhood and in some, female childhoodmortality islowerthanmalemortalitybutnotaslowasseeninpopulationsatasimilarlevelofmalemortality.Femalemortalityhigherthanthatexpectedattheprevailinglevelofmalemortalityisattributedtofemaleneglectinhealthandnutrition,whichamountstopost-nataldiscrimination.Usingdemographictechniques,onecanestimatethesizeoffemalepopulationatagivenagethatwouldhavebeenpresentatatimepointintheabsenceofpre-andpost-nataldiscriminationandthe difference between this number and the number actually enumerated atthattimepointisthenumberof‘missingwomen’.AnumberofresearcheshaveprovidedestimatesofnumbersofmissingfemalebirthsaswellasestimatesofmissingwomenforanumberofcountriesincludingIndia;forrecentwork,seeBongaartsandGuilmoto(2015)andKashyap(2019).SomeIndiaspecificstudiesarebyArnoldetal.(2002),Bhat(2002),Jhaetal.(2006),Kulkarni(2007),andKauretal.(2017).
Inthisstudy,weestimatethenumberofmissingfemalebirthsaswellas thenumberofmissingfemalesofyoungages,ormissinggirls,onthebasisofIndia’s2011censusenumeration.Agemisreportingcanobviouslyinfluencetheestimatesandhencewechoosetheagegroup0-6,which,asnotedearlier,isleastaffectedbysexselectivemisreporting.Thus,theestimatesofmissingfemalebirthsrefertotheseven-yearperiodprecedingthe2001census,thatis,March2004toFebruary2011sinceMarch1,2011 is thereferencedateforthe2011censusenumeration.TheestimatednumbersofmissinggirlsarereckonedasonMarch 1,2011.TheprocedurehasbeendescribedintheAppendix.
Estimates of Numbers of Missing Girls and Missing Female Births
4
Female mortality higher than that expected at the prevailing level of male mortality is attributed to female neglect in health and nutrition, which amounts to post-natal discrimination

14
TheestimationhasbeendoneforIndiaandforlargestatesforwhichdataonlifetablesareavailableandtheresultsareshowninTable4.Theestimatesshowthattherewere2.6millionmissingfemalebirthsinIndiaduring2004-2011,anannualaverageof378thousandwhichamountsto3.1percentoffemalebirths.EstimatesofannualnumberofmissingfemalebirthsbyBongaartsandGuilmotofortheperiods2000-2005and2005-2010are0.62millionand0.63millionrespectively.TheseestimatesarehigherthanthatinthepresentstudyprimarilybecausetheBongaartsandGuilmotopaperisbasedontheU.N.estimatesofSRBwhicharemoremasculinethanthecensusbasedindirectestimateoftheSRBusedhere.ThenumbersofmissingfemalebirthsperannumarehighinUttarPradeshandMaharashtra(over50thousand)andmoderateinRajasthan,Gujarat,Haryana,MadhyaPradesh,andPunjab(25thousandormore).Inrelativeterms(numberof missing female births as percent of female births), Haryana and Punjabare verypoorlyplaced:missing female births amounted to over 10 percent offemalebirthsinthesestates,followedbyDelhi,JammuandKashmir,Gujarat,Maharashtra,Rajasthan,UttarPradesh,HimachalPradeshandMadhyaPradesh.Ontheotherhand,insomestates,Chhattisgarh,Kerala,Assam,JharkhandandWestBengal,theSRBduring2004-2011wasabove952;clearlygenderbiasedsexselectiondidnottakeplaceonanotablescaleinthesestates.NotethatestimatesforsmallstateshavenotbeenobtainedheresincetheSRSprovidessomeofthenecessarydataonlyforlargestates.However,estimatesoftheSRBbyKumarandSathyanarayana(2012)showthattheSRBduring2004-2011formostofthestatesinthenortheasternregionwashigherthan952andgenderbiasedsexselectionwasobviouslynotcommoninthesestates.
Estimates of the totalnumber ofmissing girls and also thedecomposition bypre-natal and post-natal discrimination are provided in Table 4. It is seenthat nationally about four million girls of ages 0-6 were missing at the 2011census. Of these, 2.5millionweremissing due to gender biased sex selection(pre-nataldiscrimination)and1.5millionduetoexcessfemalemortality(post-natal discrimination).3 The relative contributions of pre-natal and post-nataldiscriminationsareintheroughratioof5:3.
InHaryana,Punjab,JammuandKashmirandDelhithenumberofmissinggirlsofages0-6 is 10percentormoreoftheenumeratedgirlsofthisage.Intermsof volume, Uttar Pradesh, Maharashtra, Rajasthan, Bihar, Gujarat, MadhyaPradesh,Haryanahavelargenumbersofmissinggirls.Therelativesharesofpre-natalandpost-nataldiscriminationvaryacrossstates. InDelhi,Maharashtra,Punjab,JammuandKashmir,andHaryanaover80percentandinGujarat,andHimachalPradeshover70percentofmissinggirlsaremissedonaccountofpre-natal discrimination. As seen above, Chhattisgarh, Kerala, Assam, JharkhandandWestBengaldonotseemtohavenotablyhighprevalenceofgenderbiasedsexselection.However,eveninthesestatesthereisevidenceofsomepost-nataldiscrimination.Inaddition,inKarnataka,post-nataldiscriminationdominatesthecountofmissinggirls.InRajasthan,TamilNadu,AndhraPradesh,MadhyaPradesh, Uttar Pradesh, Odisha, and Bihar both the factors have substantialsharesincontributingtothenumberofmissinggirls.
3 The number of missing girls in the 2011 census due to pre-natal discrimination is slightly less than the number of missing female births during the preceding period of seven years because the missing girls due to pre-natal discrimination are the ‘expected numbers of survivors’ on March 1, 2011 of the missing female births during the preceding period.
It is seen that nationally about four million girls of ages 0-6 were missing at the 2011 census. Of these, 2.5 million were missing due to gender biased sex selection (pre-natal discrimination) and 1.5 million due to excess female mortality (post-natal discrimination)

15
Table 4:Table 4: Estimates of numbers of missing girls of ages 0-6 at 2011 census enumeration and missing female births during 2004-11, India and large states
Number of missing female births during 2004-11 (in thousands)
Number of missing girls 0-6 at 2011 census enumeration (in thousands )
Number of missing girls 0-6 at 2011 census enumeration as percent of enumerated girls
Total Annual as % of female births
Total
Missing due to Total
Missing due to
GBSS EFCM GBSS EFCM
India 2646 378 3.1 4007 2515 1492 5.1 3.2 1.9
AndhraPradeshβ 72 10 1.5 112 69 43 2.5 1.5 1.0
Assam neg neg Neg 32 neg 32 1.4 0.0 1.4
Bihar 103 15 1.0 309 98 211 3.3 1.1 2.3
Chhattisgarh neg neg Neg 30 neg 30 1.7 0.0 1.7
Delhi 88 13 9.1 94 86 8 10.0 9.2 0.9
Gujarat 250 36 6.4 307 238 69 8.4 6.5 1.9
Haryana 211 30 12.7 241 201 40 15.6 13.0 2.6
HimachalPradesh 15 2 3.9 21 15 7 5.8 4.0 1.8
Jammu&Kashmirα 93 13 9.4 107 90 18 11.5 9.6 1.9
Jharkhand neg neg neg 62 neg 62 2.4 0.0 2.4
Karnataka 11 2 0.3 47 11 36 1.3 0.3 1.0
Kerala neg neg neg 6 neg 6 0.3 0.0 0.3
MadhyaPradesh 180 26 3.2 285 167 118 5.5 3.2 2.3
Maharashtra 411 59 6.3 456 400 56 7.2 6.3 0.9
Odisha 29 4 1.0 68 27 41 2.7 1.0 1.6
Punjab 172 25 11.5 193 166 27 13.6 11.8 1.9
Rajasthan 339 48 6.1 452 317 135 9.0 6.3 2.7
TamilNadu 41 6 1.1 59 40 19 1.6 1.1 0.5
UttarPradesh 679 97 4.2 1113 634 480 7.6 4.3 3.3
WestBengal neg neg neg 30 neg 30 0.6 0.0 0.6
GBSS:Genderbiasedsexselection
EFCM:Excessfemalechildhoodmortality
neg:negligible.
β:IncludingTelangana.α:IncludingLadakh.
Source:Computationsbytheauthor.
Suchanestimationofmissinggirlsisnotpossibleforthepost-2011censusperioduntil the next enumeration takes place; this will occur in the 2021 census.However,wedohavedataonSRBfromtheSRSforsomeyearsafter2001andthesecanbeusedtoestimatethenumbersofmissingfemalebirthsforaperiodoffiveyearsaftertheenumerationandexcessfemalechildhoodmortality.TheprocedurehasbeendescribedintheAppendixandtheresultsaregiveninTable5.

16
Table 5:Table 5: Estimates of missing female births during 2011-16 and excess female deaths before age 5 for births of 2011-16, India and large states
State
Missing female birthsduring 2011-16
Excess female deaths before age 5 among births during 2011-16
Total(in thousands)
Annual (in thousands)
as % of female births
Number (in thousands)
as % of female births
INDIA 1941 388 3.0 895 1.4
AndhraPradeshβ 63 13 1.7 37 1.0
Assam 27 5 1.5 31 1.8
Bihar 80 16 1.1 93 1.3
Chhattisgarh neg neg neg 31 2.0
Delhi 65 13 9.5 6 0.8
Gujarat 238 48 7.8 31 1.0
Haryana 156 31 12.2 19 1.5
HimachalPradesh 12 2 4.5 1 0.4
Jammu&Kashmirα 26 5 5.0 5 0.9
Jharkhand 13 3 0.6 31 1.6
Karnataka neg neg neg 26 0.9
Kerala neg neg neg 6 0.5
MadhyaPradesh. 127 25 2.7 93 1.9
Maharashtra 249 50 5.5 27 0.6
Orissa neg neg neg 25 1.2
Punjab 66 13 6.3 12 1.2
Rajasthan 225 45 5.2 108 2.5
TamilNadu 77 15 2.8 15 0.5
UttarPradesh 667 133 4.9 312 2.3
WestBengal neg neg neg 35 0.8
Uttarakhand 37 7 9.6 3 0.9
β:IncludingTelangana;α:IncludingLadakh;neg:Negligible.
Source:Computationsbytheauthor.
ItisestimatedthatthenumberofmissingfemalebirthsinIndiaduring2011-2016was 1,941 thousandor about twomillion, anaverageof 388 thousandperyearandamountstothreepercentoffemalebirths,closetotheestimatefortheperiod2004-2011.Essentially,theSRBhasfluctuatedsince2000butnotshownacleartrendandhencethedegreeofsexselectionhasremainedfairlysteady.TheestimatebyBongaartsandGuilmoto(2015)fortheperiod2010-15is0.63millionper year; this is higher than our estimate of 0.388million because BongaartsandGuilmotohaveusedtheU.N.estimateofSRBwhichismoremasculinethantheadjustedvalueofSRBusedinthepresentstudy.Kashyap(2019)hasgivenanestimateof1536.3thousandfortheperiod2010-15,lowerthanourestimateof1941thousand;thisisdue,inpart,tosomedifferenceinthemethodologyadoptedand

17
inpart,duetotheadjustmentinSRBmadeinthepresentstudy(seeGuilmotoetal.,2020,foradiscussiononthedifferencesinmethodology).
Thegeographicpatternisfairlysimilartothatobservedfortheperiod2004-2011.ThenumberofmissingfemalebirthsisveryhighinUttarPradesh,Maharashtra,Gujarat,Rajasthan,HaryanaandMadhyaPradesh.InChhattisgarh,Karnataka,Kerala,Odisha,andWestBengal,thereisnoevidenceofsuchsexselectiononanotablescale. Inrelativeterms(assessed intermsof thenumberofmissingfemale births as percent of female births), Haryana shows the highest level(12.2 percent) followed by Uttarakhand, Delhi, Gujarat, Punjab,Maharashtra,UttarPradesh,HimachalPradesh,andJammuandKashmir.Inotherstates,therelativelevelislow.PunjabandJammuandKashmirshowanimpressivedeclineintheextentofgenderbiasedsexselectionthoughinbothofthesestates,thelevelcontinuestobewellabovethenationalaverage.
Excessfemaleunder-fivemortalityisoftheorderof1.4percentoffemalebirthsnationallyandintherangeof0.5to2.5percentforthelargestatesforwhichdatahavebeenexamined.ThedegreeisrelativelyhighinRajasthanandUttarPradeshandlowinHimachalPradesh,Kerala,TamilNadu,Maharashtra,WestBengal,Delhi, JammuandKashmir, andUttarakhand.Overall, the inter-statevariation in the level of post-natal discrimination is much less than in thelevelofpre-nataldiscrimination.Thereisnoevidencethatthesetwolevelsarecorrelated;thus,thedegreesofpre-natalandpost-nataldiscriminationsdonotseemtoberelatedempirically.
The number of missing female births is very high in Uttar Pradesh, Maharashtra, Gujarat, Rajasthan, Haryana and Madhya Pradesh
18
Ifthereisgenderbiasedsexselection,onewouldexpectittotakeplaceafterthefirstchildisborn,andthusaffectSRBatbirthsofhigherorders.ToseeifthisisthecaseinIndia,SRBestimateswereobtainedbybirthorder.Itis
possibletodosofromtheNFHSsincethesurveyhadobtainedfertilityhistoriesfromwomeninchildbearingagesandtheentiresequenceofbirthswasrecorded.EstimatesoftheSRBfromtheNFHS-3andNFHS-4werefirstobtainedbyfive-yearperiods.Ashasbeennotedearlier,estimatesforperiodsmuchearlierthanthesurveydatearepossiblyaffectedbyselectiveomissionofdaughtersandhenceonlythetworecentfive-yearperiodsduringwhichallthestateswerecoveredwereused.Theseare:1995-1999and2000-2004fromNFHS-3and2005-2009and2010-2014fromtheNFHS-4.
TheSRBhasbeenestimatedonlyforthefirstthreeorderssinceinthesamplesthenumbersofbirthsathigherordersaresmallandtheestimateswouldhaverelativelylargesamplingerrors.TheNFHS-3datafilescontainedinformationon58,128birthsduring1995-99ofwhich41,903wereofthefirstthreeordersand52,892birthsduring2000-04ofwhich39,870wereofthefirstthreeorders.TheNFHS-4datafilescontainedinformationon2,78,146birthsduring2005-09ofwhich2,17,327wereofthefirstthreeordersand2,63,508birthsduring2010-14ofwhich2,18,834wereof thefirst threeorders.
Further,sincethesamplingerrorsforstatelevelestimatesarelarge,estimatesareobtainedforgroupsofstatesinsixregions.TheregionalizationfollowedintheNFHS-4report(IIPSandICF,2017)hasbeenadoptedhere.Theregionsare:
Northern: JammuandKashmirandLadakh,HimachalPradesh,Uttarakhand,Punjab,Haryana,Delhi,Rajasthan,andChandigarh;
Western: Gujarat,Maharashtra,Goa,Diu and Daman, Dadra and Nagar Haveli;Central: UttarPradesh,Chhattisgarh,MadhyaPradesh;Eastern: Bihar,Jharkhand,Odisha,WestBengal;Northeastern: Sikkim,ArunachalPradesh,Nagaland,Manipur,Mizoram,Tripura,
Meghalaya,Assam;Southern: Andhra Pradesh, Telangana, Karnataka, Kerala, Tamil Nadu,
Lakshdweep, Puducherry, Andaman and Nicobar Islands.
Sixunionterritories,showninitalics,werenotincludedinNFHS-3.Sampleweightshavebeenapplied.
TheresultsarepresentedinTable6.Itisseenthatatthenationallevel,theSRBismoremasculinethanthenaturallevel(thatis,significantlybelow950)atthesecondorderinthreeperiodsandatthethirdorderinalltheperiods.Inthenorthernregion,theSRBishighlymasculineatthesecondorderandveryhighlymasculineat thethirdorder.Besides, theSRBat thefirstorder isalsohighlymasculineinthenorthernregionsince2000indicatingsomeselectionevenatthefirstbirth.TheSRBinthewesternregionisalsoveryhighlymasculineatthe
Sex Ratio at Birth by Birth Order5
The SRB has been estimated only for the first three orders since in the samples the numbers of births at higher orders are small and the estimates would have relatively large sampling errors
19
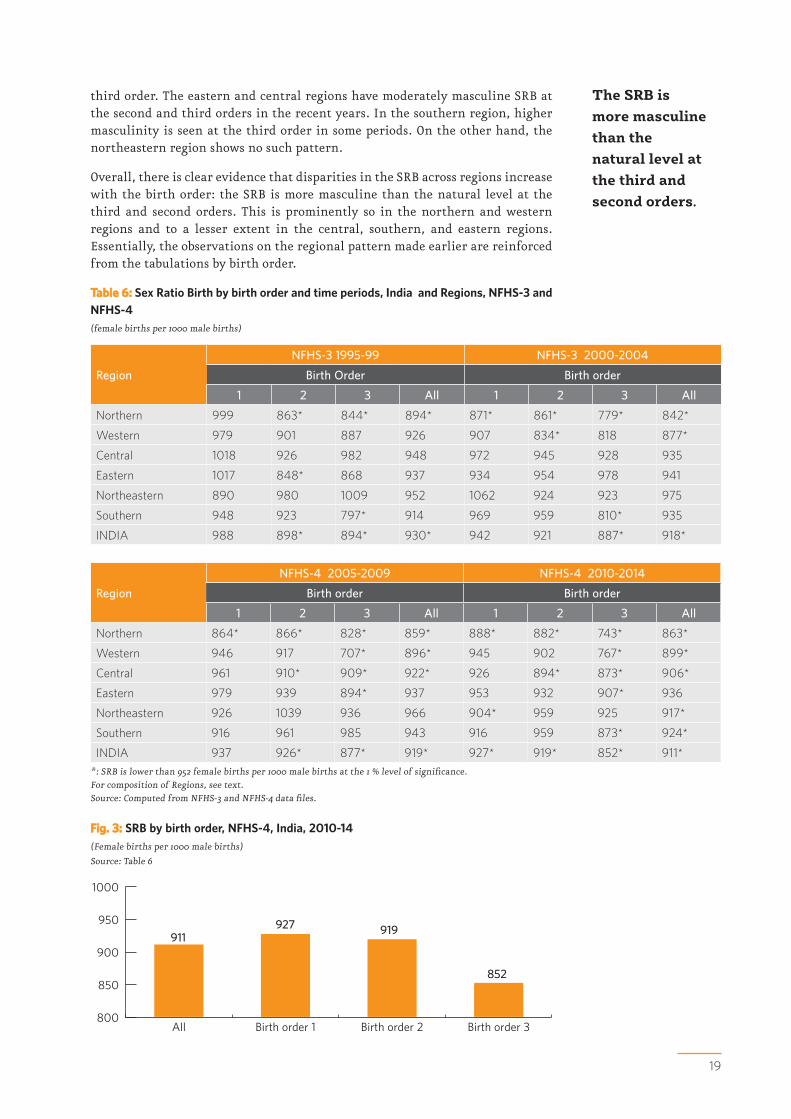
thirdorder.TheeasternandcentralregionshavemoderatelymasculineSRBatthesecondandthirdordersintherecentyears.Inthesouthernregion,highermasculinityisseenatthethirdorderinsomeperiods.Ontheotherhand,thenortheasternregionshowsnosuchpattern.
Overall,thereisclearevidencethatdisparitiesintheSRBacrossregionsincreasewiththebirthorder:theSRBismoremasculinethanthenatural levelatthethirdand secondorders. This is prominently so in thenorthernandwesternregions and to a lesser extent in the central, southern, and eastern regions.Essentially,theobservationsontheregionalpatternmadeearlierarereinforcedfromthetabulationsbybirthorder.
Table 6:Table 6: Sex Ratio Birth by birth order and time periods, India and Regions, NFHS-3 and NFHS-4(femalebirthsper1000malebirths)
Region
NFHS-3 1995-99 NFHS-3 2000-2004
Birth Order Birth order
1 2 3 All 1 2 3 All
Northern 999 863* 844* 894* 871* 861* 779* 842*
Western 979 901 887 926 907 834* 818 877*
Central 1018 926 982 948 972 945 928 935
Eastern 1017 848* 868 937 934 954 978 941
Northeastern 890 980 1009 952 1062 924 923 975
Southern 948 923 797* 914 969 959 810* 935
INDIA 988 898* 894* 930* 942 921 887* 918*
Region
NFHS-4 2005-2009 NFHS-4 2010-2014
Birth order Birth order
1 2 3 All 1 2 3 All
Northern 864* 866* 828* 859* 888* 882* 743* 863*
Western 946 917 707* 896* 945 902 767* 899*
Central 961 910* 909* 922* 926 894* 873* 906*
Eastern 979 939 894* 937 953 932 907* 936
Northeastern 926 1039 936 966 904* 959 925 917*
Southern 916 961 985 943 916 959 873* 924*
INDIA 937 926* 877* 919* 927* 919* 852* 911*
*:SRBislowerthan952femalebirthsper1000malebirthsatthe1%levelofsignificance.ForcompositionofRegions,seetext.Source:ComputedfromNFHS-3andNFHS-4datafiles.
800
850
900
950
1000
Birth order 3Birth order 2Birth order 1All
911927 919
852
The SRB is more masculine than the natural level at the third and second orders.
Fig. 3:Fig. 3: SRB by birth order, NFHS-4, India, 2010-14(Femalebirthsper1000malebirths)
Source:Table6

20
TheriseinthemasculinityoftheSRBinIndiaisattributedtosonpreferenceandgenderbiasedsexselectioninordertoavoidthebirthofagirl,oftencalled‘daughter avoidance’. In the context of low family size desires, for various
reasonsincludingquality-quantitytrade-offandgovernmentpolicies,sonpreferencecould lead to sex selectionrather thancontinuingchildbearinguntil thedesirednumberofsonsareborn;thiseffectiscalled‘fertilitysqueeze’or‘intensification’(Das Gupta and Bhat, 1997; Guilmoto, 2009; Bhalla et al., 2013). Correspondingly,theoverarchingfactorforsexselectionatthesecondorderbirthisthesexofthesurvivingfirstchildandathigherorderbirths, thesexcompositionof survivingchildren.Inotherwords,thedecisionsonsexselectionarelikelytobesequentialdependingonthesexofchildrenalreadybornandsuchbehaviormaybemanifestafterthefirstbirth.Ifthefirstbirthisagirl,thereis likelihoodofadoptingsexselectionandthiswouldthenresultinfewerdaughtersatthesecondbirthbutsuchatendencywouldbelesslikelyifthefirstchildisason.Similarly,theSRBatthethirdbirthwouldbemoremasculineifthefirsttwochildrenweregirls.
The NFHS had collected detailed fertility histories and from these conditionalSRB, that is, SRBconditionedon the sex compositionofprevious children, canbecomputed.Thishasbeendonefromthedataofthelatesttworounds,NFHS-3andNFHS-4.First, SRBat the secondbirthhasbeencomputed for thosewhosefirstchildwasasonandthosewhosefirstchildwasadaughter.Further,giventhattheSRBatthethirdordershowslargedeviationsfromthenaturalrangeasseenabove,SRBatthethirdbirthhasbeencomputedbysexcompositionofthefirsttwobirths.Itmustbenotedthatchildlosscouldinfluencesuchdecisions.Besides, in case twins are born, there isno sequential decisionmaking at thatstage.Therefore,incomputingSRBs,twinbirthsandthoseafterachildlossarenot taken intoaccount. Sampleweightshavebeenapplied.The tabulationsaremadeforIndiaandregionsbutnotstatessincethenumbersofbirthsbysexofthefirstbirthandbysexcompositionsofpreviouschildrenaresmallatthestatelevel.Further,thedenominatorsformanyofthecategoriesofsexcompositionofpreviouschildrenaresmallintheNFHS-3evenatthelevelofregionandhenceonlytheestimatesatthenationallevelarepresentedfromtheNFHS-3dataset.TheresultsareshowninTable7.
Atthenationallevel,theSRBatthesecondbirthwhenthefirstchildisadaughterismoremasculinethanthatwhenthefirstchildisasonandsignificantlylowerthan952femalebirthsper1000malebirthsinallthefourtimeperiods.Thisisalsoseeninthenorthern,western,andcentralregionsinboththeperiodsofNFHS-4 considered, 2005-09 and 2010-14, and in the southern region during 2005-09.Further,theSRBatthethirdbirthfollowingtwodaughtersissignificantlymoremasculinethanthenaturallevelinalltheperiods1995-99,2000-2004,2005-2009,and2010-14atthenationallevel.Thenorthern,western,andcentralregionsalsoshowsuchapatternduring2005-09andalltheregionsshowthispatternduring2010-14.Inparticular,
Conditional Sex Ratio at Birth6
the SRB at the second birth when the first child is a daughter is more masculine than that when the first child is a son and significantly lower than 952 female births per 1000 male births in all the four time periods

21
Table 7:Table 7: Sex Ratio at Birth by Sex Composition of Previous Births, India and regions(femalebirthsper1000malebirths)
Survey/RegionFirst Birth
Second Birth Third Birth
Sex of first birth Sex composition of first two births
Male Female Any Both sonsOne daughter and one son
Both daughters
Any
NFHS-3(1995-99)INDIA
979 928 863* 895* 970 860* 798* 866*
NFHS-3(2000-04)INDIA
941 1003 834* 913* 967 916 812* 894*
NFHS-4(2005-09)
Region
Northern 865* 1015 728* 863* 1004 882* 633* 812*
Western 946 1033 798* 910 918 735 579* 697*
Central 959 970 840* 904* 1004 909 857* 913
Eastern 981 917 959 939 901 905 883 898*
Northeastern 928 1040 1051 1046 971 899 897 915
Southern 917 1032 877* 953 1108 1089 850 998
INDIA 938 990 858* 922* 977 899* 781* 874*
NFHS-4(2010-14)
Region
Northern 888* 999 782* 880* 905 812* 585* 726*
Western 943 1082 775* 909 916 843 572* 721*
Central 927 929 845* 886* 956 897 766* 863*
Eastern 953 916 917 917 1081 930 760* 895*
Northeastern 902* 1020 904 959 905 981 822* 912
Southern 917 1001 919 960 986 834 788* 845*
INDIA 927* 974 860* 914* 984 884* 708* 832*
Note:Twinsandthosewiththepreviousbirth/birthsnotsurvivingareexcluded.*:SRBislowerthan952femalebirthsper1000malebirthsatthe1%levelofsignificance.ForcompositionofRegions,seetext.Source:ComputedfromNFHS-3andNFHS-4datafiles.
0
200
400
600
800
1000
AnyBoth daughters
1 daughter & 1 son
Both sons
FB - Any
FB - Female
FB - Male
First Birth(FB)
Second Birth Third Birth
927974
860914
984884
708
832
Fig. 4:Fig. 4: Conditional SRB by sex composition of previous births, NFHS-4, India, 2010-14(Femalebirthsper1000malebirths)
Source:Table6

22
TheSRBatthethirdbirthaftertwodaughtersisextremelylowinthenorthernandwesternregions.Moreover,theSRBfollowingonedaughterandonesonisalsomoremasculinethanthenaturallevelatthenationallevelinthreetimeperiods.TheNFHS-4datashowthisphenomenoninthenorthernregionandtoasmallerextentinthewesternregion.Thus,sexselectionatthethirdbirthwhenthefirsttwochildrenaredaughtersseemswidelyprevalentandthisisofahighdegreeinthenorthernandwesternregionsinwhichsexselectionisalsoseentobeprevalentatthesecondbirth.
These results are in broad agreement with the findings based on two othernational surveys, the Special Fertility andMortality Survey of 1998, and theIndiaHumanDevelopmentSurvey(IHDS)-1,aswellasfromanearlieranalysisoftheNFHS(see,Jhaetal.,2006;Desaietal.,2010,andJhaetal.,2011).
23
Guilmoto(2009),drawinguponCoale’spreconditionsforfertilitydecline,states:“Weadapttheseprerequisitestosexselectionbysayingthatparentshavetobeable,willing,andreadytopracticesexselection”(p.526).Various
socioeconomicfactorshaveabearingontheability,willingness,andreadinesstoresorttosexselection.Placeofresidence(rural-urban)hasimplicationsforaccessto the technology since sonographic scan centres aremostly located inurbanareas.Besides,placeofresidencemayalsoplausiblyimpactsexdifferentialintheperceivedvalueofchildren.Educationandincomeorwealthlevelmayalsoinfluenceaccesstotechnology(viaawarenessandaffordability)aswellasvalueofchildren.Stricturesandtenetsofreligionimpactdesirabilityofsonsasalsoacceptabilityofabortion.Socialbackgroundsuchascasteortribemembershipmayalsohaveabearingonrelativevaluesofsonsanddaughtersandthusonsonpreferenceordaughteravoidance.Mediaexposurebrings inawarenessoftechnologyandalsochangeinattitudesongenderissues.Valuesanddisvaluesofsonsvis-à-visdaughtersandsocialpressurestohavesonsmayalsovaryregionally.
Ideally, theeffectof thebackgroundfactorson theprobabilityof resorting togender biased sex selection should be analysed. However, gender biased sexselectionisillegalinmostcountriesandhencenotrecordedandcouplestoomaynotreport these in surveysdue to the illegalityandsocialdisapproval.But iftheSRBismoremasculinethanthenaturallevel,theimplicationisthatgenderbiased sex selectiondoes takeplace. Therefore, instead ofdifferentials in theprobabilityofgenderbiasedsexselection,onecanexaminedifferentialsintheSRB.Suchananalysisispossibleifdataonfertilityhistoriesorbirthsequencesareavailable.
7.1 Prior work for IndiaForIndia,researchershaveexaminedinfluencesofseveralfactorsontheSRBor on theprobability of a birth beingmale on the basis of thedata from theNationalFamilyHealthSurveys(NFHSs)andotherlargesurveys(RetherfordandRoy,2003; Jhaetal., 2006;BhatandZavier,2007;ArokiasamyandGoli,2012).The NFHS collects complete fertility histories and these data can be used toestimateSRBatvariousbirthordersandbysexcompositionofpreviouschildren.RetherfordandRoy (2003)analyseddata fromthe fertilityhistories fromtheNFHS-1 (carriedoutduring 1992-93)andNFHS-2 (1998-99)andobserved that inNFHS-1,theSRBatthethirdorderbirthswashighlymasculineforcoupleswithnolivingsonandinNFHS-2,SRBwashighlymasculineatboththesecondandthethirdordersforcoupleswithnolivingsons.Itwasfoundthattherearenotableregionalvariations,withstatesinthewesternregionshowinghighlymasculineSRBinNFHS-1andNFHS-2,moreprominentlyinNFHS-2.MultivariateanalysisusinglogisticregressionrevealedhardlyanyinfluencesofsocioeconomicfactorsinNFHS-1,exceptapositiveeffectofurbanresidence,aneffectnotseeninNFHS-
Differentials in Sex Ratio at Birth 7
“We adapt these prerequisites to sex selection by saying that parents have to be able, willing, and ready to practise sex selection”

24
2,andnegativeeffectofMuslimreligion.AnalysisoftheNFHS-2datashowedthatmiddleschoolorhighereducation,religionsotherthanHinduandMuslim,andmediaexposurehadaneffect(highermasculinity)ontheSRBatthesecondandhigherorderbirths.Effectsofotherfactorswereinsignificantorunclear.Thepaper carriedout logistic regressionanalysis separately for states in fourregions,North,West,EastandSouthbuthardlyanysignificantneteffectswereseeninthesestatelevelanalyses.
BhatandZavier(2007)alsoanalyseddatafromtheNFHS-1andNFHS-2.Theyfirstexamineddeterminantsoftheuseofpre-nataldiagnostictechnologiesbasedontheNFHS-2whichhadenquiredabout theuse of such technologies for birthsduringthethree-yearperiodbeforethesurvey.Theresultsoflogisticregressionanalysisshowedthatanumberofsocioeconomicfactorsdoinfluencetheuseofsuchtechnologies.However,thoughuseofpre-nataldiagnostictechnologyisaprerequisiteforsexselection,asitcanbeusedtodetectthesexofthefetus,itisnotnecessarilyusedforthatpurpose.Therefore,useofpre-nataldiagnostictechnology as such need not necessarily imply gender biased sex selection.Besides, those using such a technology for sex selectionmay not reveal it insurveys. The paper also examined determinants of the probability of a malebirth,usingdatafromtheNFHS-1andNFHS-2.Thiswasfoundtobesignificantlyhighinthenorth-westernandthenorth-centralregions.Socioeconomicfactorsshowedhardlyanysignificanteffects.However,theprobabilityofamalebirthwassignificantlyhighincaseofnosurvivingmalesiblingbeforethebirth.Theprobabilitywaslowerincaseofahighidealfamilysize.Maternalfactorssuchasage,anemiastatus,useofpre--natalcare,birthattendance,body-massindexwere also used in this analysis but it was also noted that there are issues ofmeasurementinrespectofthesevariables.
Jhaetal.(2006)analyseddatafromtheSpecialFertilityandMortalitySurvey(SFMS), a very large survey with a sample size of 1.1 million households (incontrast toabout 100 thousand in theNFHS-1andNFHS-2)andcovered 133738birthswhichoccurredduring1997.ThistoofoundthattheSRBatthesecondorderbirthswasveryhighlymasculineincasethefirstchildwasfemale.Similarly,theSRBatthethirdorderbirthswashighlymasculineifthefirsttwochildrenwerefemale.Amongsocioeconomicvariables,mother’seducationhadapositiveeffectontheprobabilityofamalebirthbutreligionandsizeofagriculturallandowneddidnotshowasignificanteffect.Atthethirdorderbirthsforthosewithno living sons, urban residence had a significant positive effect. ArokiasamyandGoli(2012)focusedontheruralpopulationandonthebasisoftheNFHS-3data(2012)notedapositiveeffectofthesizeoflandholdingontheprobabilityofamalebirthafteroneortwodaughters.Wealthindexalsoshowedapositiveinfluenceprominentlyatthesecondbirthwhereasmaternaleducationandcastedidnotshowacleareffectintheirstudy.
7.2 Analysis based on NFHS-4Thestudiescitedaboveuseddatareferringto the 1990sandearly2000s.Overtime, therehavebeenmanychanges; the technologyhasbecomemorewidelyavailablewiththespreadofpre-natalscanfacilities(forthepurposeofpregnancycare rather than for sex selection per se), the laws prohibiting sex detectionhavebeen strengthened (theamendedPCPNDTAct) in India, therehavebeencampaigns both by the government and by civil and religious organisationsagainstsexselection,andsocioeconomicchangeshavebeentakingplacewhichcouldplausiblychangefamilysizedesires,relativevaluesofsonsanddaughters,andgenderattitudes.
The SRB at the third order births was highly masculine if the first two children were female

25
Therefore, this studyexamines the influencesof socioeconomic factorson sexselectionindirectlyviatheprobabilityofamalebirthonthebasisofthedatafromthelatestroundoftheNFHS(NFHS-4)whichwasconductedduring2015-16throughoutIndia.ThesamplesizeoftheNFHS-4wasquitelarge,muchlargerthanthesize intheearlierrounds,andthustheNFHS-4providesrecentdatathattoofromalargesample.Theresultsfromthisanalysisarepresentedbelow.
7.2.1 Gross differentialsThe SRB at the first birth is computed by categories of selected backgroundcharacteristics: Place of residence (Rural, Urban), Education of mother (Noeducation,Primary,Secondary,Higher),Wealthindexquintiles(Poorest,Poorer,Middle,Richer,Richest),Religion(Hindu,Muslim,Otherreligions),SocialGroup(Scheduled Caste-SC, Scheduled Tribe-ST, Other Backward Caste-OBC, OtherslabelledasNonSC/ST/OBC),Exposuretomassmedia(Noorlow,Moderate,High)and Region (Central, Southern, Western, Northern, Eastern, Northeastern).TheregionalizationisinaccordancewiththatintheNFHS-4asnotedearlierinsection5.
ThewealthindexhasbeenconstructedintheNFHSonthebasisofhouseholdownership of assets and housing conditions and quintile groups have beenprovidedintheNFHSdatasets.ExposuretomassmediahasbeenascertainedbasedonresponsestoNFHSquestionsonwhethertherespondentreadsnewspapersorwatchestelevision;thosewhodonotreadnewspaper/watchtelevisionatallordosolessthanonceaweekarecategorisedashaving‘Noorlowexposure’,thosewhoreadnewspapers/watchtelevisionat leastweeklybutnotdailyashaving‘Moderateexposure’,and thosewhoreadnewspaper/watch televisiondailyashaving‘Highexposure’.
Theanalysishasbeendoneseparatelyfortwofive-yeartimeperiods,2005-2009and2010-2014.Estimatesforthetwotimeperiodsallowonetoseeifthepatternhas changedover time.Similarly,SRBat the secondbirthhasbeencomputedbythebackgroundvariablesseparatelyforthosewiththefirstbirthasonandthosewiththefirstbirthadaughter.Further,onlythosebirthswherethefirstchildwassurvivingareincludedsinceitisthesexcompositionofthenumberoflivingchildrenthatmattersinsexselection.TheSRBatthethirdbirthhasbeencomputedbythesexcompositionofthefirsttwobirths:twosons,onesonandonedaughter,andtwodaughtersandonlythosethirdbirthswherethefirsttwo children survived have been included. Twins have been excluded in thecomputationoftheSRB.Sincethenumberofbirthsbeyondthethirdorderwassmall,SRBhasbeencomputedonly for thefirst threeorders.Sampleweightshavebeenapplied.
Table8presentstheSRBsatthefirstbirthbybackgroundscharacteristics(thetablealsoshowsresultsoflogisticregressionanalysiswhicharediscussedlater,inthenextsub-section).TheSRBintheurbanpopulationislowerthantheruralpopulationandsignificantlylowerthan952intheperiods2005-2009,and2010-2014.Differentials by education ofmother donot showa pattern. The SRB islowerfortherichestwealthindexgroupcomparedtothepoorest.Differentialsbyreligionandsocialgroupdonotshowaclearpattern.ThenorthernregionshowslowerSRBthanotherregionsinboththeperiods.TheSRBissignificantlylowerthan952athighmediaexposureonlyintherecentperiod.
AsseeninTable7,ifthefirstbirthisason,theSRBatthesecondbirthdoesnotshow lower thannaturalSRB inanyof the regions.Hence, resultsof furtheranalysisinthiscasehavenotbeenpresentedhere.Ifthefirstchildisadaughter,
The SRB is lower for the richest wealth index group compared to the poorest

26
theSRBatthesecondbirthissignificantlylowerthan952inbothruralandurbanareas,amongbirthstowomenwithsecondaryandhighereducation,andfromupperquintilesofwealthindex(Table9).TheSRBforbirthstowomenbelongingtoreligionsexceptMuslim,andthosenotbelongingtoSCandSTcategoriesisalsolow.Thenorthern,western,andcentralregionsalsohavelowSRB;itisverylowinthenorthernregion.TheSRBisalsolowforthosewithhighmediaexposure.SomecategoriesshowalowSRBinoneofthetwoperiods.Overall,thereisclearevidenceofsexselectionatthesecondbirthifthefirstchildisadaughterandthis is seenat thenational level, in someregions,prominently thenorthern,andinsociallyoreconomicallyadvantagedclasses.Ontheotherhand,amongMuslims,thereisabsenceofsexselectionatthisstage.
Table 8:Table 8: Sex Ratio at First Birth and Adjusted Sex Ratios by Background Characteristics, India, NFHS-4(SRBisexpressedasfemalebirthsper1000malebirths)
Characteristic Period 2010-14 2005-09
CategoriesSRB
Adjusted SRB
ODDS RATIO SRB
Adjsuted SRB
ODDS RATIO
Placeofresidence Rural®
Urban
935
910*
931
918
1
1.01
947
919
940
933
1
1.01
Educationof
woman
Noeducation®
PrimarySecondary
Higher
959
901
919*
936
950
893
918
957
1
1.06
1.03
0.99
917
991
939
914
897
981
946
947
1
0.91@
0.95
0.95
Wealthindex
quintile
Poorest®
Poorer
Middle
Richer
Richest
937
971
899*
936
895*
920
971
904
943
896
1
0.95
1.02
0.98
1.03
979
926
945
950
889*
970
921
946
955
898
1
1.05
1.03
1.02
1.08@
Workstatusof
woman
Didnotwork®
Worked
927
939
927
931
1
1.00
941
872
942
869
1
1.08
Religion Hindu®
Muslim
Other
930
917
911
929
919
920
1.00
1.01
1.01
943
931
878*
943
923
897
1
1.02
1.05
Socialgroup NonSC/ST/OBC®
SC
ST
OBC
931
915
992
916*
938
912
985
915
1
1.03
0.95
1.02
947
930
965
930
953
927
958
928
1
1.03
0.99
1.03
Region Central®
Southern
Western
Northern
Eastern
Northeastern
927
917
943
888*
953
903
925
925
943
895
947
885
1
1.00
0.98
1.03
0.98
1.05
959
917
946
865*
981
928
958
924
944
877
970
917
1
1.04
1.02
1.09@
0.99
1.05
Mediaexposure Noorlow®
Moderate
High
941
924
921*
925
919
929
1
1.01
1.00
959
933
928
947
925
935
1
1.02
1.01
All 927* 938
Note:Twinbirthsexcluded.AdjustedSRBobtainedbasedonlogisticregressionanalysis.
*:indicatestheSRBissignificantlylowerthan952at1%levelofsignificance.
®:Referencecategory.
@:indicatestheoddsratio(oddsofabirthbeingmale)isdifferentfromthereferencegroupat1%levelofsignificance.

27
Table 9:Table 9: Sex Ratio at Second Birth after First Daughter and Adjusted Sex Ratios by Background Characteristics, India, NFHS-4 (SRBisexpressedasfemalebirthsper1000malebirths)
Characteristic Period 2010-14 2005-09
Categories SRB
AdjustedSRB
ODDS RATIO SRB
Adjusted SRB
ODDS RATIO
Place ofresidence
Rural®Urban
876*825*
856868
10.99
877*817*
842891
10.95
Education ofwoman
Noeducation®PrimarySecondaryHigher
913902855*719*
878879864777
11.001.021.13@
902879844*714*
838848879836
10.990.951.00
Wealth indexquintiles
Poorest®PoorerMiddleRicherRichest
912921876*854*727*
884905870860770
10.981.021.031.15@
972888892838*694*
938879900848719
11.071.041.111.30@
Workstatusofwoman
Didnotwork®Worked
863*785*
863784
11.10
855*897*
855895
10.96
Religion Hindu®MuslimOther
844*970831*
843968859
850*923810*
849912844
10.931.01
Socialgroup Non-SC/ST/OBC®SCSTOBC
824*886875866*
841881871858
10.950.970.98
806*918856*863*
826912818861
Region Central®SouthernWesternNorthernEasternNortheastern
845*919775*782*917904
837948791805881855
840*877798*727*9591050
8249008257639121023
[email protected]@0.81@
Mediaexposure Noorlow®ModerateHighAll
910917827*860*
875911844
10.961.04
966808*814*857*
923796835
Note:SeefootnotestoTable8.
Onlythosebirthswiththefirstchildsurvivingareincluded.
For those with the first two sons, the SRB at the third birth is not highlymasculine(seeTable7).WhileinsomecategoriestheSRBisactuallyhigherthan952,inmostcasesthisisnotsignificantlyso.Moreover,ahighvalueofSRBneednotbetakentoimplysexselectioninfavouroffemalessincesofarnoevidencehas emerged, from research studies or anecdotal, of the prevalence of such apractice.Hence, further analysis forwomenwith thefirst two births as sonsisnotpresentedhere.Forthosewithonedaughterandoneson,theSRBatthethirdbirthislowinsomecategoriesespeciallyintherecentperiod,2010-14,butthereisnoconsistentpatternovertimeandacrosscategoriesofthebackgroundvariablesexaminedhere(Table10).

28
Table 10:Table 10: Sex Ratio at Third Birth after One Daughter and One Son and Adjusted Sex Ratios by Background Characteristics, India, NFHS-4(SRBisexpressedasfemalebirthsper1000malebirths)
Characteristic
Period 2010-14 2005-09
Categories SRB
Adjusted SRB
ODDS RATIO SRB
Adjusted SRB
ODDS RATIO
Placeofresidence
Rural®Urban
921765*
905816
11.11
897*906
894915
10.98
Educationofwoman
Noeducation®PrimarySecondaryHigher
922946791*994
8879408341160
10.941.060.76
930859875762
930874871708
11.061.071.31
Wealthindexquintile
Poorest®PoorerMiddleRicherRichest
981885858813*676*
939872884871722
11.081.061.081.30@
945871852865984
9338678578751011
11.081.091.070.92
Workstatusofwoman
Didnotwork®Worked
885*863
887842
11.05
902*860
901874
11.03
Religion Hindu®MuslimOther
882*909818*
870963796
0.000.901.09
884*966891
886956902
0.000.930.98
Socialgroup NonSC/ST/OBC®SCSTOBC
8529011011858*
865908993853
10.950.871.01
871867926922
880869941913
11.010.940.96
Region Central®SouthernWesternNorthernEasternNortheastern
897835842812*930989
886892889845889945
10.991.001.051.000.94
9101091736*883906891
9051116753885894887
[email protected]@1.021.011.02
Mediaexposure Noorlow®ModerateHighAll
945895810*884*
896898866
11.001.04
914902883899*
902923890
10.981.01
Note: See footnotes to Table8.
Onlythosebirthswiththefirsttwochildrensurvivingareincluded.
Forwomenwhosefirsttwochildrenaredaughters,theSRBatthethirdorderishighlymasculineoverallandformostofthecategoriesofbackgroundvariables(Table 11). The SRB is extremely low in the top two wealth and educationcategories,inurbanpopulation,non-Muslims,socialgroupnon-SC/ST/OBC,andthenorthernandwesternregions.Forthemostrecentperiod,2010-14,theSRBissignificantlylowerthan952inallthecategoriesexceptthereligioncategoryMuslimandinthesouthernandnortheasternregions.However,somecategories(loweducation,lowwealth,Muslims,scheduledtribes,scheduledcastes,eastern,northeastern, and southern regions, and low andmoderatemedia exposure),donotshowsignificantlylowSRBduring2005-09.TheSRBatthisstage(thirdorderbirthaftertwodaughters)hasbecomemoremasculineintherecentyearsandmorepervasivethaninthepast.Besides,widedifferentialspersist.Clearly,

29
strongsonpreferencehas ledtoahighdegreeofsexselectionifthefirsttwochildrenaregirlsandthisisparticularlysoforsomesocioeconomicclassesandinthenorthernandwesternregions.
7.2.2 Multivariate analysis: Net differencesThedifferentials inSRBnotedabovearegrossdifferences.Sincemanyof thesocioeconomicfactorsarehighlyassociatedleadingtopossibleconfoundingofeffects, it isnecessary toassessnet influencesofvarious factors.To this end,logisticregressionanalysishasbeencarriedoutwiththesexofthebirth,maleor female, as thedichotomousdependentvariable and the socioeconomicandspatialvariableslistedintheprevioussub-sectionasexplanatoryvariables.Thedichotomousdependentvariablehasavalueof1formaleand0forfemale;thustheanalysisexaminesthenetinfluencesofvariousfactorsontheprobabilityofabirthbeingamale,controllingfortheeffectsofotherexplanatoryvariablesusedintheanalysis.
Therearefourregressions:i)forthefirstbirth,ii)forthesecondbirthforthosewhosefirstbirthwasadaughter, iii) for the thirdbirth for thosewhosefirsttwobirths includedonesonandonedaughter,and iv) for the thirdbirthforthosewhosefirsttwobirthsweredaughters.Since,asnotedabove,theSRBatthesecondbirthfollowingonesonandatthethirdbirthfollowingtwosonswasnotfoundtobehighlymasculine,resultsforthesesituationsarenotpresented.Analysis has been carried out for the time periods 2005-2009 and 2010-2014separately.
For women with two daughters, the SRB at the third birth is significantly lower than 952 in all the categories except the religion category Muslim and in the southern and northeastern regions

30
Table 11:Table 11: Sex Ratio at Third Birth after First Two Daughters and Adjusted Sex Ratios by Background Characteristics, India, NFHS-4(SRBisexpressedasfemalebirthsper1000malebirths)
Characteristic Period 2010-14 2005-09
Categories SRB
Adjusted SRB
ODDS RATIO SRB
Adjusted SRB
ODDS RATIO
Placeof
residence
Rural®
Urban
760*
582*
724
665
1
1.09
818*
680*
759
844
1
0.90
Educationof
woman
Noeducation®
Primary
Secondary
Higher
820*
733*
656*
356*
759
706
702
432
1
1.08
1.08
1.76@
902
834
665*
342*
805
824
760
473
1
0.98
1.06
1.70@
Wealthindex
quintile
Poorest®
Poorer
Middle
Richer
Richest
795*
852
706*
593*
481*
690
814
730
657
606
1
0.85@
0.95
1.05
1.14
950
903
776*
693*
435*
864
878
802
745
507
1
0.98
1.08
1.16
1.70@
Worksstatus
Ofwoman
Didnotwork®
Worked
710*
673*
711
645
1
1.10
792*
623*
793
612
1
1.30@
Religion Hindu®
Muslim
Other
690*
807
700*
680
856
745
1
0.79@
0.91
768*
904
625*
762
925
674
1
0.82@
1.13
Socialgroup NonSC/ST/OBC®
SC
ST
OBC
610*
767*
807*
714*
648
767
780
697
1
0.85@
0.83
0.93
642*
827
966
794*
697
809
945
775
1
0.86
0.74@
0.90
Region Central®
Southern
Western
Northern
Eastern
Northeastern
766*
786
573*
584*
760*
822
751
862
616
628
697
721
1
0.87
1.22@
1.20@
1.08
1.04
857
850
579*
633*
882
888
826
935
621
714
791
813
1
0.88
1.33@
1.16
1.04
1.02
Mediaexposure Noorlow®
Moderate
High
All
841*
705*
618*
708*
784
692
657
1
1.13
1.19@
931
908
654*
780*
837
897
716
1
0.93
1.17@
Note:SeefootnotestoTable8.
Onlythosebirthswiththefirsttwochildrensurvivingareincluded.
Alltheexplanatoryvariablesarecategorizedandthereferencecategoryineachhas beendesignated. The odds ratio for a specific category shows the ratio ofoddsofabirthbeingamaleinthespecificcategorytotheoddsforthereferencecategory. On the basis of the regression coefficients, the predicted value ofthe probability that a birth is male has been computed for each category ofthe explanatory variables, holding other variables constant. These are thusadjustedprobabilities,adjustedfortheeffectsofothervariables,asinMultipleClassificationAnalysis(MCA).Fromtheseprobabilities,thecorrespondingvaluesofadjustedSRB(femalebirthsper1000malebirths)forcategoryjofvariableihavebeencomputedsimplyas,AdjustedSRBij=1000x(1-Adjustedpij)/Adjustedpij,whereAdjustedpij is theadjustedprobability of a birthbeingamale forcategoryjofvariableicomputedfromthecoefficientsofthelogisticregression

31
equation.Twinbirthshavebeenexcluded intheanalysis.Further,onlythosebirthswhere thefirst childwas survivingare included in the analysis of thesexofthesecondbirthandonlythosebirthswherethefirsttwochildrenweresurviving are included in the analysis of the sex of the third birth. Sampleweightshavebeenapplied.
Table 8 presents the results for the sex of the first birth. The columns showthe unadjusted SRB, the adjusted SRB, and the odds ratio for each category.TheadjustedSRBsvarysomewhatfromtheunadjustedSRBsbutgenerallythedifferencesaresmall.Hardlyanyoddsratiosaresignificant(thatis,thelogisticregressioncoefficientsforthecategoriesarenotsignificant).Thisistrueofboththetimeperiods2005-09and2010-14.Asnotedabove,grossdifferentialsarealsominorandshowednopattern.Thus,theSRBatthefirstbirthdoesnotseemtobenotablyinfluencedbyanyofthebackgroundfactors.
Analysisforthesexofsecondbirthincasethefirstisadaughterrevealsthattherichestwealthcategory shows lowerSRBcompared to thepoorest inboththe periods and the higher education category compared to those with noeducationduring2010-14(Table9).MuslimreligionhassignificantlyhigherSRBthanHindusduring2010-14.SocialgroupsgenerallydonotshowsignificantnetdifferencesexceptforSCsduring2005-09.SomeregionshavehigheradjustedSRBthanthecentralregion(referencecategory);thesoutherninboththeperiodsandtheeasternandthenortheasterninonlyoneperiod.Overall,socioeconomicdifferencesarenotveryconsistentexceptthelowvaluesforthehigheducationandwealthindexgroups.NotethatthelackofsignificantlyhighoddsratiosdoesnotimplythattheSRBisnothigherthanthenatural.Infact,forthesecondbirthafteradaughter,theSRBishighlymasculineformostcategories.
Forthethirdbirthafteronedaughterandoneson,theoddsratiosbyandlargedo not differ significantly from 1 (Table 10). Thus, the adjusted SRB formostcategoriesdoesnotdifferfromthatforthereferencecategory.Thereareonlyafewexceptions,richestcategoryduring2010-14,andthesouthernandwesternregionsduring2005-09.Incontrast,notabledifferencesinadjustedSRBareseeninthecaseoftheSRBatthethirdbirthfollowingtwodaughters,(Table11).Theoddsratioforthehigheducationcategoryissignificantlyhighinboththetimeperiods and for the richest category in oneperiod. The adjusted SRBs for thetopeducationandwealthcategoriesarehigherthantheunadjustedSRBs;thusthenet effect isnot as strong as seen in the gross differentials; yet even theadjustedSRBsarequitelowforthesecategories.Ontheotherhand,theSRBforMuslimsissignificantlyhigherthanHindus inboththeperiods.Noclearnetdifferencesareseenacrosssocialgroups.ThenorthernandwesternregionsshowsignificantlylowerSRBthanthecentralregion(whichtooshowsalowSRB)inoneorbothperiods.TheSRBathighmediaexposureislowerthanatnoorlowlevelofexposure.TheoverallSRBatthisstage,thatis,atthethirdbirthaftertwodaughters,islow(thatis,highlymasculine),andthisissoforthereferencecategoriesofall thesevenvariables inthe2010-14periodandexceptfor thosewithlowlevelsofeducationandthepoorest,inthe2005-09periodaswell.AhighvalueoftheoddsratioforanycategorythenimpliesaveryhighlymasculineSRBevenaftereffectsofotherfactorsareadjusted.This isseenfromtheadjustedSRBs shown in the table.
Overall, as assessed from the SRBs at different stages of family building, sexselectionatthefirstbirthdoesnotseemtobeatanotablelevel.Thereissomeindication of this in the northern region and for the richest quintile of thepopulationbuttheeffectsseemtobecomeweakeronceotherfactorsarecontrolled.
Analysis for the sex of second birth in case the first is a daughter reveals that the richest wealth category shows lower SRB compared to the poorest in both the periods and the higher education category compared to those with no education during 2010-14

32
Ontheotherhand,sexselectionisquiteconspicuousatthesecondbirthincasethe first was female. This cuts acrossmost of the regions and socioeconomicbackgrounds.Thedegreeisquitehighfortherichestquintileandtosomeextentforthericherquintileaswellasforthosewithhighereducationbutrelativelylower forMuslims. There is some sex selection at the third birth in case thefirsttwoincludeadaughterandason.Thisisespeciallyseeninthenorthernregionandtherichestquintile.Butnetdifferencesaregenerallynotsignificant.Sexselectionishighatthethirdbirthforthosewhosefirsttwochildrenweredaughters.Thisisseenregardlessofbackgroundcharacteristicsandcutsacrossalltheregionsintherecentyears.Moreover,thenorthernandwesternregions,thewealthiestsectionsofpopulation,andthosewithhighereducationshowveryhighdegreeof sex selection.The relativelyhigherprevalenceof sex selectioninhighereducationaswellaswealth/incomeclassesinIndiacould,atleastinpart,beattributedtothegreaterawarenessof,accessto,andaffordabilityofthetechnologyofsexselectionforthesesectionsofpopulation.Religiousandmoralconsiderationsand societalnormsmayprohibit access to abortionand this isprobablythereasonfortheabsenceorverylowprevalenceofsexselectionamongMuslims.

33
Theprimemotive for resorting to sex selection, specifically of amale, isastrongpreferenceforsonsoverdaughters.Sonpreference isknowntobewidelyprevalentaroundtheworld(Williamson,1976)andespeciallyin
partsofAsia(DasGuptaetal.2003).Manycoupleswouldlikethefamilylinetocontinueandinpatrilinealsocietiesmaleoffspringareneededforthispurpose.Besides,certainrituals,especiallythoserelatedtodeath(burialorlightingthefuneralpyre)andancestorworshipare traditionallyperformedby sons.Suchvaluesmaybeconsideredsentimentalorritual.Formorepracticalandmaterialneedssuchasoldagesecurity,traditionallysonsarevaluedoverdaughters.Thismayinvolveresidenceduringoldage,especiallywhenthecouplecannolongerwork or take care of day-to-day household management, as well as financialsupport. Inpatrilocal (or virilocal) arrangements, sonsand their families areexpectedtoresidewithparentswhereasamarrieddaughterwouldresidewiththeparentsofherhusband.Childrenalsocontributetofamilylabour(labelledas‘productionutility’byLeibenstein,1974)andformanyagriculturaloperationsandenterprisessonsarevaluedoverdaughtersthoughdaughtersdocontributetohouseholdworkandalsotoagriculturalandsimilaractivities.However,overtime,theextentofchildlabourhasdeclinedandthelabourvalueofchildrenisnolongeramajorissue.Expensesonmarriagesofdaughters,especiallydowryandcostsofthecelebration,ifexpectedtobebornebythefamilyofthebride,leadto‘disvalues’ofdaughters.Anotherfactoristheconsiderationofsecurityofunmarrieddaughtersandapprehensionsonsafetyofunmarriedgirlscouldleadto‘daughteraversion’.Overall,forvariousreasons,theperceivedvalueofsonsdiffersfromthatofdaughters.Thedegreeofsonpreferencedependsonhowhighistheperceivedvalueofsonsvis-à-visdaughters.Suchvaluesmayvaryacrosssocial,cultural,andeconomicsettings.
8.1 Evidence on values of sons vis-à-vis daughters in India
Thereisahugebodyofliteratureonperceivedvaluesofadaughtervis-à-visasoninIndia.KaurandKapur(2018)provideacomprehensivereviewofthestudieswithfocusonrecentchangesinvariousaspects,namely,education,marriage,work, rituals, and property. A field investigation in five states examinedfactorsthatleadtosonpreference(Johnetal,2008).InamorerecentstudyinHaryanaandMaharashtra,John(2018)adoptedaqualitativeapproachtoinquireinto recent changes in attitudes towards daughters and sons. Further, threestudiescommissionedby theUNFPA inTamilNadu,Maharashtra,andPunjabalsoaddressed these issuesasperceivedby ‘daughtersonly’ families followingqualitativemethods (Gokhale InstituteofPoliticsandEconomics, 2017).Thesestudies do show that attitudes have changed in the recent years. There isnowa strongdesire among couples to educatedaughters. Though the level ofeducationdesiredfordaughtersmaynotbeashighasthatdesiredforsons,oftenat least high school education and inmany cases higher education is sought
Why Sex Selection? 8

34
fordaughters.This is inordertoenabledaughterstoseekemploymentinthemodernsector(sothattheyareselfreliantandcan‘standontheirfeet’)andalsotoimproveprospectsoffindingagoodgroom.Theneedofasonforcontinuinglineageandforritualsincludingfuneralandancestorworshipseemstobenotasstrongasinthepastandthereissomeacceptanceofdaughtersperformingsuch rituals.Thoughdaughtersare legally entitled to inherit familypropertyincludingland,generallymanywomenforgotheirshareinancestralpropertyandletbrothershaveit.Itisunderstoodthatdaughterswouldgetsomeshareatthetimeofmarriageinaformotherthanthefamilyhouseorlandandhencewouldnotexerciserighttoparentalpropertylater.Incaseofacouplewithnosons,adaughterinheritsthepropertyifherhusbandmovesinwithherparents(thehusbandisthencalled‘gharjamai’)andthusthedaughter’shusbandandchildrenresidewithherparents.Butparentsgenerallydonotprefertomovetothedaughter’smaritalhome.Financialsupportfromdaughtersisgenerallynotexpected.However,many‘daughtersonly’couplesnotedthatsonstoomaynotprovidesupportastheymaygetinto‘undesirablehabits’andcannotbereliedupon.While thiscouldbepost-factoattitudeorrationalization,complaintsofyoungmengettingintodrinkingordrugusearecommon.Thoughthemarriageofadaughterinvolvesexpensesincludingdowry,thegroom’sfamilyalsohastoincurexpendituresandheavycostsofperformingadaughter’smarriagedidnotfigureasanotablefactorcausingdaughteravoidanceinresponsesofparticipantsof these studies.
Inadditiontothequalitativestudies,theIndiaHumanDevelopmentSurvey-II,carriedoutduring2011-12inIndia(IHDS,2018),alsocollectedinformationonoldage security expectations from children. The survey covered 42152householdsand39253evermarriedwomenof reproductiveageswere interviewed. In thesurvey,marriedwomenwereaskedaseriesofquestionsonexpectationsofoldagesecurityandfromtheresponsesonecanseewhetherthedegreeofdependenceonsonsvis-à-visdaughtersvariesacrossbackgroundcharacteristicsandregions.Thewomenwereasked:17.41:Whodoyouexpecttolivewithwhenyougetold?:‘Son’, ‘Daughter’, ‘Both’, and ‘Others’ were listed as responses. Those whoseresponsedidnotinclude‘Daughter’werefurtherasked:17.42Wouldyouconsiderlivingwithyourdaughter?Similarquestionswereaskedonfinancial supportduringoldage:17.43Whodoyouexpectwillsupportyoufinanciallywhenyougetolder?Andagainthosewhoseresponsedidnotinclude‘Daughter’wereasked:17.44:Wouldyouconsiderbeingfinanciallysupportedbyyourdaughter?Inthecaseoflivingarrangements,thosewhosefirstresponse(Q.17.41)didnotinclude‘Daughter’ were subdivided into ‘Sons only’ (response as ‘Son’ to Q.17.41 and‘No’toQ.17.42)and‘SonorDaughter’(Response‘Son’to17.41and‘Yes’to17.41).Similarly,thecategories‘Othersonly’and‘Othersordaughter’werecreated.Inalikemanner,responsestoquestionsonfinancialsupportduringoldagewerecategorized.
The responses are tabulatedbykeybackground characteristics inorder to seeifperceivedvaluesvarybysocioeconomicbackground.Thecharacteristicsusedare:placeofresidence(rural/urban),educationallevelofwoman(no,primary,secondary,higher),percapitaincomequintiles(poorest,poorer,middle,richer,andrichest),workingstatusofwoman(Yes:working,No:notworking),religion(Hindu, Muslim, other), social group (SC, ST, OBC, and Non-SC/ST/OBC), andownershipofagriculturallandbythehousehold(No,Yes).Besides,tabulationsarealsomadebyregion,forthesixregionsasintablesbasedonNFHSpresentedearlier.Further,thetabulationsbyregionarealsoprovidedseparatelyforthosewithnolivingsonandthosewithatleastonelivingsoninordertoseewhattheexpectationsofthosewithoutasonare.Sampleweightshavebeenapplied.
Though daughters are legally entitled to inherit family property including land, generally many women forgo their share in ancestral property and let brothers have it
35
ItisseenfromTable12thatamajorityofwomen,65percent,expecttoliveonlywithsons inoldage incontrast to less than 10percentexpecting to livewithdaughters.Thisistobeexpectedgiventhepatrilinealandpatrilocaltraditionsinmostofthecountry(somecommunitiesinpartsofthenortheastandthesouth-westerncoastdonot followpatrilocal traditionsand,according to tabulationsbystates,notshownhere,86percentofwomeninMeghalayaexpecttolivewithdaughtersinoldage).Variationsbysocio-economicbackgroundfactorsarenotsoconspicuousexceptthatrelianceonsonsisslightlyhigherthanaverageamongnon-SC/ST/OBCwomen.Nodifferentials are seenbyplace of residence (rural-urban)andbyownershipofagriculturalland.Theexpectationtolivewithsonsishigherthanthenationalaverageinthewesternandnorthernregionsandlowerinthesouthernregion.Separatetabulationsbythenumberofsonsatthetimeofthesurveyshowthatevenamongthosewithnosonsatthetimeofsurvey,about25percentmentionedthattheyexpecttoliveonlywithsons(showninthelowerpanelsofthetable);thispercentageishigher,over40percent,inthewesternandnorthernregions.
Forfinancialsupportduringoldage,amajorityofwomen(57percent)expecttorelyonlyonsons(Table13).Again,thislevelishighinthewesternandnorthernregionsthanintheotherregions.Suchexclusiverelianceonsonsistheleastinthenortheasternregionandlowerthanaverageinthesouthern(inMeghalaya,relianceexclusivelyonsonsisonly11percent).Differentialsbysocioeconomicfactorsarenarrow.Amongthosewithnosonsatthetimeofsurvey,aboutafifthexpectedfinancialsupportonlyfromsons.

36
Table 12:Table 12: Expected living arrangements in old age by background characteristics, ever married women of ages 15-49, India, IHDS-II
Characteristic Category
(Percent who expect to live with)
Sons only Daughters Both S & D
Others only
Son or Daughter
Others or daughter
Total
PlaceofresidenceRuralUrban
65.065.3
7.39.0
5.34.8
4.04.3
18.016.3
0.50.4
100100
EducationlevelcompletedNoPrimarySecondaryHigher
65.067.265.060.3
6.17.39.212.2
4.95.15.45.3
2.94.54.87.0
20.915.115.214.9
0.30.70.50.3
100100100100
PercapitaincomequintilesPoorestPoorerMiddleRicherRichest
63.364.265.466.066.6
6.87.38.08.48.7
5.55.25.84.74.7
3.63.93.94.34.7
20.419.116.616.314.5
0.40.30.30.30.8
100100100100100
WorkingpresentlyNoYes
66.163.6
7.09.0
5.44.9
4.33.8
16.818.3
0.50.4
100100
ReligionHinduMuslimOtherreligions
65.763.158.5
7.76.911.8
4.77.48.0
4.24.12.8
17.418.116.8
0.40.32.0
100100100
SocialgroupNonSC/ST/OBCOBCSCST
70.062.965.060.3
6.68.37.89.3
4.74.85.28.8
4.33.64.54.8
13.920.216.916.2
0.50.30.50.6
100100100100
OwnagriculturallandNoYes
64.665.6
9.16.4
5.15.2
4.14.1
16.718.2
0.40.4
100100
All 65.1 7.8 5.2 4.1 17.4 0.4 100
RegionCentralSouthernWesternNorthernEasternNortheasternAll
63.653.381.772.563.360.865.1
5.916.93.43.35.513.87.8
5.75.52.13.05.719.75.2
5.03.23.03.35.72.44.1
19.820.49.017.619.62.717.4
0.10.70.80.30.30.70.4
100100100100100100100
Amongthosewithnolivingson
RegionCentralSouthernWesternNorthernEasternNortheasternAll
20.910.047.242.426.722.824.7
37.066.120.924.129.743.641.0
8.63.92.65.310.018.16.7
23.811.217.514.219.810.016.7
9.26.46.812.312.12.78.7
0.42.45.01.81.72.72.2
100100100100100100100
Amongthosewithatleastonelivingson
RegionCentralSouthernWesternNorthernEasternNortheasternAll
72.366.387.877.170.771.573.7
0.22.30.30.20.65.30.9
5.16.02.02.64.820.14.8
0.50.60.31.52.80.21.2
21.924.79.518.421.12.719.3
0.00.10.10.10.00.10.1
100100100100100100100
Source:ComputedfromIHDS-IIdatafiles.

37
Table 13:Table 13: Expected financial support in old age by background characteristics, ever married women of ages 15-49, India, IHDS-II
Characteristic Category
(Percent who expect support from)
Sons only Daughters Both S & D
Others only
Son or Daughter
Others or daughter Total
PlaceofresidenceRuralUrban
56.657.8
7.59.3
8.27.1
7.58.2
19.416.6
0.80.9
100100
EducationlevelcompletedNoPrimarySecondaryHigher
57.958.356.649.5
6.37.89.312.4
8.07.97.87.7
5.58.09.013.0
21.617.316.415.5
0.60.71.01.9
100100100100
PercapitaincomequintilesPoorestPoorerMiddleRicherRichest
55.756.356.458.058.3
7.17.08.48.69.3
8.58.78.27.16.8
6.67.17.68.29.2
21.319.718.517.615.5
0.71.10.90.60.9
100100100100100
WorkingpresentlyNoYes
57.556.0
7.39.2
8.27.4
8.56.6
17.520.0
0.90.7
100100
ReligionHinduMuslimOtherreligions
57.854.848.3
8.06.413.4
7.011.513.3
7.87.76.6
18.618.617.2
0.81.01.1
100100100
SocialgroupNonSC/ST/OBCOBCSCST
60.455.856.652.3
7.58.18.68.5
7.37.18.213.0
8.47.17.78.7
15.421.218.016.6
1.10.60.90.9
100100100100
OwnagriculturallandNoYes
56.857.0
9.36.7
7.68.2
8.07.4
17.419.8
0.90.8
100100
All 56.9 8.1 7.9 7.7 18.5 0.8 100
RegionCentralSouthernWesternNorthernEasternNortheasternAll
56.246.175.965.054.431.556.9
6.016.65.33.65.911.58.1
9.28.03.24.87.732.37.9
6.47.65.87.010.79.27.7
22.020.99.218.720.111.018.5
0.20.80.50.81.24.50.8
100100100100100100100
Amongthosewithnolivingson
RegionCentralSouthernWesternNorthernEasternNortheasternAll
18.38.538.829.418.99.719.5
33.056.723.217.624.036.934.4
9.65.64.87.09.819.68.1
29.521.626.029.532.621.327.2
8.55.24.612.59.54.37.6
1.02.52.64.05.28.23.3
100100100100100100
Amongthosewithatleastonelivingson
RegionCentralSouthernWesternNorthernEasternNortheasternAll
65.158.984.672.464.339.666.9
0.43.11.20.70.92.31.3
9.18.92.84.47.136.97.8
0.42.70.92.34.54.62.3
25.126.210.320.123.113.521.5
0.00.20.10.20.13.10.2
100100100100100100100
Source:ComputedfromIHDS-IIdatafiles.
38
Afactormentionedinthecontextofdaughteraversionistheperceivedharassmentofunmarrieddaughters intheneighborhood.TheIHDShadaskedaquestion:How frequently are unmarried girls harassed in your village/neighborhood?;theresponseswere: ‘Rarely’, ‘Sometimes’,and ‘Often’.Less than 10percentofwomenreportedthat thisoccursoften intheirvillageorneighbourhood.Thequalitativestudiescitedabovealsorevealedthatwhilecouplesareawareofsuchharassment,manysaidthat theyheardofsuch incidences throughthemediaoroccurrencesatotherplaces.Daughteravoidanceduetothisfactordoesnotappeartobeamajorfactor.
TheIHDSalsocollecteddataonmarriageexpensesincludinggiftsanddowryatthetimeofmarriageasprevalentinthecommunity.ItiscustomarytogivesomegoldintheformofJewellerytothebride.Dowryincashisalsogiventhoughthisislessprevalentinthenortheasternandnorthernregionsandtheamountsarerelativelyhigherinthesouthernregion.Overallweddingexpensesarehigherforthebride’sfamilybutthegroom’sfamilyalsoincursexpenditures;theratioofthemedianexpenditurebybrides’familytothatbythegroom’sfamilyisintherange1to2.
Ifdaughtersinheritparentalpropertytothesameextentassons,manywomenshouldbeownersofpropertysuchasahouseorland.IntheNFHS-4,womenwereaskedquestionsonownershipofhouseorland.Itisseenthatabouttwothirdsof themarriedwomen interviewed in the survey didnot own ahouse eitherindividuallyorjointly(intheNFHS-4thesequestionswereaskedonlytomarriedwomeninasub-sample,thestatemodule,ofthemainsample,andcovered121118women).Hardlyanydifferentialsby socioeconomic factorsare seen (Table 14)butthenorthernandwesternregionsshowlowerlevelsofownershipbywomencomparedtotheotherregions.Similarly,over70percentofwomendidnotownanylandindividuallyorjointly.Thelevelof‘non-ownership’oflandishigherinthewesternandnorthernregionsandlowerinthenortheasternregionthanaverage.Separatetabulationsfortheruralpopulation(forwhichownershipoflandmattersmorethanfortheurbanpopulation)giveafairlysimilarpicturethough,asexpected,thenon-ownershipoflandislowerintheruralpopulationthan urban, yet substantial, 69 percent. Given that inheritance laws entitledaughterstohaveashareinancestralproperty,ownershipofwomenisinsisteduponincertainhousingschemesandlandallotments,andfurtherthatthereareincentivesforfemaleownershipsuchaslowerstampdutiesinsomestates,theleveloffemaleownershipappearstobequitelow.
Fertility surveys generally ask direct questions on ideal number of childrenandnotethesebysex.ResultsonthisfromtheNFHS-4showamildpreferenceforsons;atthenationallevel,themeanidealnumberofsonswas1.1comparedto0.9daughters (IIPSandICF,2017:Table4.16,p.104).Further, 18.8percentofinterviewedwomenstatedmoresonsthandaughtersintheidealcombination;thisislowerthanthefigureintheNFHS-3,22.4percent,andshowssomedeclineovertimeinthedegreeofsonpreference.Butthepercentagewhomentionedmoresonsthandaughtersisrelativelyhigherforwomenwithnoschoolingandthelowestwealthindexquintilethanthosewithhigherlevelsofeducationandwealthquintilesrespectivelywhereasthedegreeofsexselection,asseenfromtheSRB,ishigherforthosewithhighereducationandwealthlevels.Further,mostof the states in thenorthernandwestern regionswhichhaveexhibitedhighsexselection inouranalysis showlowersonpreferenceandmanystatesintheeasternandnortheasternregionshowhighersonpreferenceinresponseto thequestionon idealnumberof sons anddaughters (seeTable 4.17 in IIPSandICF,2017).Ofcourse,onedoesnotexpectaperfectcorrespondencebetween
It is customary to give some gold in the form of jewelry to the bride. Dowry in cash is also given though this is less prevalent in the northeastern and northern regions and the amounts are relatively higher in the southern region

39
son preference and sex selection since thewillingness and ability to practisesexselectionalsomatter.Butitisquitelikelythatthereisatendencytogivenormativeandsociallyandpoliticallycorrectresponsestothequestiononidealnumberofchildrenbysexandhenceonemaynotseeagreementbetweentheresponses todirectquestionson sonpreferenceanddegreeof sex selectionasascertainedfromtheanalysisofdataonSRB.
The NFHS also askedmarried women whether they want anymore childrenandtheseresponsesaretabulatedintheNFHSreportsbythenumberoflivingchildrenaswellasbythenumberoflivingsons.ForIndia,amongwomenwithtwochildren,87percentofthosewithoneson(thatis,thosewithonesonandonedaughter)didnotwantanymorechildrenincontrastto62percentofthosewithnoson,thatis,thosewithonlytwodaughters(seeTable4.14inIIPSandICF,2017).Thefactthat62percentofwomenwithnosonwantedtostopchildbearingshowsthatamajoritydoesnotinsistonason,yetthedifferencebetweenthetwopercentagesisconspicuousandshowsthatmanydesiretohaveatleastoneson.Thegapbetweenthetwopercentagesisverywideinmanystatesinthenorthernregion,around50percentagepointsinHaryanaandRajasthanandaround40pointsinPunjabandUttarakhand(thefiguresaretakenfromTable17ofNFHS-4statereportsforlargestates;IIPSandICF,2017a).Thegapisalsowide,closeto40pointsinUttarPradeshandJharkhandandbetween30and40pointsinMadhyaPradesh,Bihar,Chhattisgarh,JammuandKashmir,andGujarat.Attheotherend,thegapisnarrow,below20pointsinallthesouthernstatesandinWestBengalandmoderate,20to30percent,inAssam,Maharashtra,Odisha,andHimachalPradesh.Thus,sonpreferenceseemstobequitestronginthenorthernandcentralstatesandsomeeasternandwesternstates.Notethatdesiretostopchildbearingafteraparticularsexcompositionmayleadtostoppingstrategies,ifthedesireistranslatedintopracticeofcontraception,butdoesnotamounttosexselection.Butthegeneralpatternofthelevelofsonpreferenceasascertainedfromthisinformationisquitesimilartothatseeninsexselection,thoughnotidentical.

40
Table 14:Table 14: Women’s ownership of house and land, by background characteristics, women ages 15-49, India, NFHS-4, State module
Categories of background characteristics
Owns a house individually or jointly (Percentage distribution)
Owns land individually or jointly(Percentage distribution)
Ruralpopulation
Does not own
Indivi-dually
Jointly Both indivi-dually and jointly
Does Not own
Indivi- dually only
Jointly only
Both indivi Dually and jointly
Percent of women not Owning any land
UrbanRural
66.161.0
10.610.6
13.916.1
9.412.3
77.168.6
5.97.5
10.213.4
6.810.4
-68.6
NoeducationPrimarySecondaryHigher
55.662.165.767.4
13.111.19.59.4
18.115.814.113.5
13.311.010.69.7
66.372.173.675.1
8.57.16.26.3
14.611.811.510.9
10.69.18.77.7
63.869.571.172.5
PoorestPoorerMiddleRicherRichest
56.961.163.665.365.5
11.210.211.210.610.1
17.516.515.014.214.0
14.412.310.29.810.5
66.068.971.774.675.3
7.66.77.86.66.2
14.113.812.211.310.5
12.210.68.47.58.0
65.368.169.671.072.0
DidnotworkWorked
63.361.8
9.213.9
15.714.2
11.810.1
71.272.8
6.38.4
12.711.1
9.77.7
67.970.1
HinduMuslimOtherreligions
62.265.964.7
11.18.110.1
15.415.313.7
11.310.811.5
71.075.173.6
7.35.26.8
12.511.610.6
9.38.19.1
68.271.070.6
NonSC/ST/OBCSCSTOBC
65.063.259.862.0
9.510.811.811.0
14.415.017.215.6
11.111.011.211.4
73.373.268.070.8
6.36.28.17.4
11.511.714.512.5
8.98.89.49.4
70.566.667.370.5
CentralSouthernWesternNorthernEasternNortheastern
64.960.069.772.254.948.4
5.118.08.85.013.17.6
15.416.111.811.517.626.5
14.65.99.711.414.317.4
73.170.779.178.463.458.0
3.311.94.33.29.56.0
11.812.99.39.114.821.9
11.94.57.39.312.314.1
70.566.877.760.855.570.5
MediaexposureNoorlowModerateHighAll
58.262.064.862.9
10.19.611.010.6
17.116.714.315.3
14.611.79.911.2
66.870.373.871.7
7.06.57.06.9
13.913.611.412.2
12.39.67.89.1
65.667.570.868.6
Source:ComputedfromNFHS-4datafiles.
Overall,sonscontinuetobemorevaluedthandaughtersforoldageresidenceandsupport.Thoughsomechangesinpreferencesandattitudesareseen,thesearenot large.Perhaps changes ineconomyand societymightbring ina shifttowardspost-maritalneo-localresidentialarrangementsandthenparentsmayhavelesshesitationinco-residingwithmarrieddaughters;butsuchchangesaregenerallyslow.Thelowleveloffemaleownershipoflandandhouseshowsthatinspiteoftheentitlementunderinheritancelaws,itisprimarilythesonsandnotdaughterswho inherit familyproperty. Thehigh level of sex selection inthewesternandnorthernregionsisconsistentwiththehighrelianceonandimplicitlyhighvalueattachedtosonsintheseregions.

41
The north-south dichotomy in kinship structure and female autonomy inIndiahas longbeenrecognisedandhasbeenlinkedtoregionaldifferences indemographicbehaviour(Karve,1965;DysonandMoore,1983).Itmakessensetoarguethatthedegreeofautonomywomenenjoywouldcorrespondtothevalueofgirls toa fairly largeextent.Wehaveseenabove that thesouthernregion,inwhichwomenareknowntohavegreaterautonomythaninnorthernIndia,haslowlevelsofsexselection.Butsodotheeasternandnortheasternregions.Further, the western region has shown a high level of sex selection. Thus,insteadofanorth-southdichotomy,weseeapatternwiththenorthernregion(ascategorizedintheNFHSandinthisstudythisisessentiallythenorthwesternpartofIndia)andthewesternregionsshowinghighdegreeofsexselectionandthesouthern,eastern,northeasternregionsshowinglowsexselectionwiththecentralregionfallinginthemiddle.

42
ThesexratioatbirthinIndiahasbeenmoremasculinethannaturalforsome timeand it iswell recognised that this is causedprimarilyby thepracticeofgenderbiasedsexselection.EstimatesoftheSRBareavailable
from a number of sources; civil registration, sample registration, surveys,censuses,andhealthmanagementinformationsystem.Theevidenceisclearonthe point that in the recent decades the SRBhas beenmuchmoremasculinethanthenaturallevel.However,theestimatesdifferandatthenationalleveltheSRBvariesinawiderangeof860to960excludingsomeoutliers.ThisstudyscannedvarioussourcesofdatatohaveaclearerideaofthevalueofSRBandinturnestimatethemagnitudeofgenderbiasedsexselection.Further,theeffectofpost-nataldiscriminationwasalsoassessed intermsofmissinggirlsduetoexcess femalechildhoodmortality.Ananalysisof surveydatawascarriedouttoseehowtheSRBvariesbythestageoffamilybuilding;mostoftheestimatespertaintotimeperiodsafter2000.Thestudyalsoexaminedsocioeconomicandspatialdifferentialsinthesexratioofbirth.Finally,factorsassociatedwithsonpreferenceandrecentchanges in the situationwerediscussedon thebasisofevidencefromsomerecentstudies.Theprincipalfindingsarenotedbelow.
1. 1. Onthebasisoftheassessmentofvariousestimates,itcanbesaidthatthecensus based indirect estimate obtained by reverse survival is the mostplausibleone.Atthenationallevel,thiswas923femalebirthsper1000malebirthsfortheperiod2004-2011.
2. 2. TheSRBinIndiaisclearlymoremasculinethanthenaturallevelbutnotashighassomeoftheestimatesindicate.TheSRSestimateoftheSRB(intermsoffemalesper1000males)seemstobeanunderestimatebyabout2percentatthenationallevelandneedstobecorrected;thecorrectionfactorvariessomewhatforstates.TheSRBhasbeenfluctuatingintherange900to930femalebirthsper1000malebirthssince2000forIndiawithnocleartrend.
3. 3. TheregionalpatternintheSRBiswellrecognized.Statesinthenorthern-westernregionshowmuchmoremasculineSRBthanintheotherregions;somestatesinthecentralregionalsoshowlowratiosbutnottothelevelsof thenorthern-westernregions.Theeastern,northeastern,andsouthernregionsgenerallyshowratiosnearnatural.InPunjab,JammuandKashmir,andHimachalPradeshtheSRBseemstohaverisenbutisstilllowerthanthenaturallevel.
4. 4. Thehighermasculinityisonaccountofthewide-scaleprevalenceofgenderbiasedsexselection.Closeto400thousandfemalebirthsaremissedinIndiaannually, amounting to about three percent of female births. The degree(number ofmissing female births as percent of female births) is high inmoststatesinthenorthernandwesternregions,moderateinUttarPradesh,HimachalPradeshandMadhyaPradesh,andlowornegligibleinmoststatesintheeasternandsouthernregions.
Principal Findings9
On the basis of the assessment of various estimates, it can be said that the census based indirect estimate obtained by reverse survival is the most plausible one. At the national level, this was 923 female births per 1000 male births for the period 2004-2011

43
5. 5. At the 2011 census enumeration, about fourmillion girls of ages 0-6maybeconsideredtohavebeenmissing;2.5milliononaccountofsexselection(pre-natal discrimination) and 1.5 million due to excess femalemortality(post-nataldiscrimination).Thissituationhaspersistedbeyond2011aswell.Further,whilepre-nataldiscriminationisconcentratedinthenorthernandwestern regions, post-natal discrimination is common across the country;thesouthernregionandafewotherstatesshowrelativelylowlevelsbuttheregionaldifferencesinpost-nataldiscriminationarenotaswideasseeninthecaseofpre-nataldiscrimination.
6. 6. AnalysisofSRBbybirthorderandbysexcompositionofpreviouschildrenshowsthatathigherordersandamongthosewhohavenoson, theratiosare veryhighlymasculine in thenorthern,western, and central regions.In thenorthern region, the SRBat thefirst order is alsomoremasculinethannaturalimplyingthatthereissomesexselectionatthefirstbirthitselfindicatingthatsomecouplesdesiretoavoidthebirthofevenonedaughter.Moreover, sex selection at the third birth following two daughters seemstobeverywidelyprevalent.This is in linewith thefindings fromJohn’sresearch(2018),thatmostfamiliesareincreasinglyaversetothepossibilityofbeingadaughter-onlyfamily.
7.7. SomedifferencesintheSRBbysocioeconomicbackgroundareseenespeciallyatthesecondandthirdbirths.Forthesecondbirthafterfirstdaughter,theSRBisgenerallymoremasculinethanaverageinthehighesteducationandwealthclasses.Atthethirdbirthfollowingtwodaughters,theSRBishighlymasculine;thisismoresointhemostrecentperiodof2010-14.Further,theSRBishighlymasculineatthehighestwealthandeducationlevels,inthenorthernandwesternregions,andathighmediaexposure,butnotamongMuslims.
8.8. Evidence on perceived values of sons vis-à-vis daughters shows that sonsare valued for old age support, financial as well as for residence; suchrelianceisrelativelyhigherinthenorthernandwesternregionscomparedtootherregions.Thoughsomechanges intheattitudesareseen inrecentinvestigations,thesearenotlargeenoughandparentsbyandlargecontinueto expect such support primarily from sons rather than from daughters.Besides,inspiteofthelegalentitlementsandprovisions,itisnotcommonfordaughterstoinheritparentalproperty.Sonpreference,clearly,persists.
Beforeclosing,itisnecessarytonotetwomajorconcerns.Inordertocurbthepracticeofgenderbiasedsexselection,effortshavebeenmadebyenactmentoflawsandcampaignsbythegovernmentandcivilsocietyorganisations.Financialincentiveshavealsobeenintroducedtodissuadecouplesfromresortingtosexselection (for a review, see Sekher, 2012). However, the persistence of highlymasculine SRB clearly shows that sex selection has persisted. Some changehasbeenseeninstateswithveryhighratios,Punjab,Haryana,andHimachalPradesh,buteveninthesestatestheSRBisfarfromthenaturallevelandtheSRBinthenorthernregionishighlymasculineevenatthefirstbirthorder.Clearly,themultitude of efforts at preventing sex selection, legalmeasures,financialincentives,andcampaignshasnotbeensuccessfulineradicatingthepracticeofgenderbiasedsexselectionsofar.Besides,inrecentyears,theSRBinsomestatesoutside the northern-western region has also becomemore masculine. GiventhatsonpreferenceiswidelyprevalentinIndia,thereisthepossibilityofthepracticeofsexselectionspreadingtoareaswhichhavehithertonotshownitonalargescale,oncetheavailabilityofsonographicscanfacilitiesandaffordabilityoftheservicesrise.
Analysis of SRB by birth order and by sex composition of previous children shows that at higher orders and among those who have no son, the ratios are very highly masculine in the northern, western, and central regions

44
Moreover,childhoodmortalityishigherforfemalesthanformalesindicatingthatneglectofthegirlchild,orpost-natalgenderdiscrimination,persists.WhilethematterofgenderbiasedsexselectionhasbeenreceivingmediaandpolicyattentioninIndia,andrightlyso,post-nataldiscriminationfindslittlespaceinthepublicdiscourse.Itisimperativethatcivilsocietyandpolicymakersaccorddueattentiontothisconcernaswellandadoptappropriatemeasurestoaddressit.

45
References
Arnold, Fred, Sunita Kishor, and T.K. Roy, 2002. “Sex Selective Abortions inIndia”,PopulationandDevelopmentReview28(4):759-85.
ArokiasamyP.andSrinivasGoli,2012.“ExplainingtheSkewedChildSexRatioinRuralIndia-Revisitingthelandholding-patriarchyhypothesis”,EconomicandPoliticalWeekly,47:85-94.
Bhalla, Surjit S., Ravinder Kaur, and Manoj Agrawal, 2013. Son Preference,Fertility Decline and the Future of the SexRatio at Birth,UNFPA,NewDelhi.
Bhat,P.N.Mari,2002.“OntheTrailofMissingIndianFemalesI:SearchforClues,II:IllusionandReality”,EconomicandPoliticalWeekly,37:5105-18,5244-63.
Bhat, P.N.Mari andA.J. Francis Zavier, 2007. “Factors Influencing theUse ofPrenatal Diagnostic Technique and the Sex Ratio at Birth in India”,EconomicandPoliticalWeekly42:2292-2303.
Bongaarts, John and Christophe Z. Guilmoto, 2015. “HowManyMoreMissingWomen?ExcessFemaleMortalityandPrenatalSexSelection,1970–2050”,PopulationandDevelopmentReview,41(2):241-269.
Coale, Ansley J. 1991. “Excess FemaleMortality and the Balance of Sexes: AnEstimateoftheNumberof‘MissingFemales’”,PopulationandDevelopmentReview17(1):35-51.
DasGupta,MonicaandP.N.Mari.Bhat,1997,“FertilityDeclineandIncreasedManifestationofSexBiasinIndia”,PopulationStudies,51,No.3:307-315.
DasGupta,Monica, Jiang Zhenghua, Li Bohua,Xie Zhenming,Woojin Chung,BaeHwa-Ok,2003.“WhyIsSonPreferenceSoPersistentinEastandSouthAsia?ACross-CountryStudyofChina, Indiaand theRepublicofKorea”,JournalofDevelopmentStudies40(2):153-187
Desai, Sonalde, Amaresh Dubey, B.L. Joshi, Mitali Sen, Abusaleh Shariff andReeveVanneman.2010.IndiaHumanDevelopmentinIndia:ChallengesforaSocietyinTransition.NewDelhi:OxfordUniversityPress.
Dubuc,SylviaandDavidColeman,2007.“AnIncreaseintheSexRatioofBirthsto India-bornMothers in England andWales: Evidence for Sex-SelectiveAbortions,”PopulationandDevelopmentReview33(2):383-400.
Dyson, T., & Moore, M. 1983. “On kinship structure, female autonomy, anddemographicbehaviourinIndia”.PopulationandDevelopmentReview,9,35-60.
GokhaleInstituteofPoliticsandEconomics,2017.ReversingSonPreference:AStudy of Contributory Factors: Tamil Nadu, Maharashtra, Punjab, DraftReports,GokhaleInstituteofPoliticsandEconomics,Pune.

46
George, Sabu, Rajaratnam Abel and B.D. Miller, 1992. “Female Infanticide inRuralSouthIndia”,EconomicandPoliticalWeekly,27:1153-1156.
Goodman,LeoA.,1961.”SomePossibleEffectsofBirthControlontheHumanSexRatio”,AnnalsofHumanGenetics,225.
GuilmotoCZ, 2008. “Economic, social and spatialdimensionsof India’s excesschildmasculinity,“Population-E.2008;63(1):91-118.
Guilmoto,ChristopheZ.2009.“TheSexRatioTransitioninAsia”,PopulationandDevelopmentReview,35(3):519-549.
Guilmoto,ChristopheZ.2012.“SkewedSexRatiosatBirthandFutureMarriageSqueezeinChinaandIndia,2005-2010”,Demography,49(1):77–100.
Guilmoto C. Z., 2015. “The masculinization of births: Overview and CurrentKnowledge,”,Population.70(2):201-264.
Guilmoto C. Z.; Dudwick N; Gjonça A; Rahm L, 2018. “How do demographictrendschange?theonsetofbirthmasculinizationinAlbania,GeorgiaandVietnam,1990-2005”PopulationandDevelopmentReview.44(1):37-61.
Guilmoto,C.Z. and I.Attane, 2007. “Thegeographyofdeteriorating child sexratio in China and India,” In: Watering the neighbour’s garden: Thegrowing demographic female deficit in Asia, edited by Isabelle Attaneand Christophe Z. Guilmoto. Paris, France, Committee for InternationalCooperationinNationalResearchinDemography[CICRED]:109-129.
Guilmoto, Christophe Z. and S. Irudaya Rajan, 2013. “Fertility at the DistrictLevelinIndia,”EconomicandPoliticalWeekly,48(23).
Guilmoto, Christophe Z, Nandita Saikia, Vandana Tamrakar, Jayanta KumarBora,2018,“Excessunder-5femalemortalityacrossIndia:aspatialanalysisusing2011censusdata”,LancetGlobHealth,6:e650–58.
ChristopheZ.Guilmoto,FengqingChao&PurushottamM.Kulkarni,2020.“Onthe estimation of female births missing due to prenatal sex selection”,PopulationStudies,74(2):283-289.
HealthManagementInformationSystem(HMIS),MinistryofHealthandFamilyWelfare, Government of India, 2018. www.nrhm-mis.nic.in accessed onDecember6,2018.
India Human Development Survey (IHDS), 2018. India Human DevelopmentSurvey.http://ihds.umd.eduaccessedonDecember6,2018.
InternationalInstituteforPopulationSciences(IIPS)andMacroInternational.2007.NationalFamilyHealthSurvey (NFHS-3),2005–06: India:VolumeI.Mumbai:IIPS.
International Institute for Population Sciences (IIPS) and ICF. 2017. NationalFamilyHealthSurvey(NFHS-4),2015-16:India.Mumbai:IIPS.
International Institute for PopulationSciences (IIPS) and ICF. 2017s.NationalFamilyHealthSurvey(NFHS-4),2015-16:India,Reportsforvariousstates.Mumbai:IIPS.
JamesK.S.,N.Kavitha,AnnieGeorge.P.M.Kulkarni,SardaPrasadandSanjayKumar,2015.AnAssessmentofQualityofCivilRegistrationSystemDatain

47
StatesofIndia,PRC,InstituteforSocialandEconomicChange,Bangalore,CSRD, Jawaharlal Nehru University, New Delhi, and United NationsPopulation Fund, New Delhi.
Jha, Prabhat, RajeshKumar, Priya Vasa,Neeraj Dhingra, Deva Thiruchelvam,RahimMoineddin,2006.”Lowmale-to-femalesexratioofchildrenborninIndia:nationalsurveyof1·1millionhouseholds,”Lancet,2006:367:211:18.
Jha, Prabhat, Maya A Kesler, Rajesh Kumar, Faujdar ram, Usha Ram, LukaszAleksandrowicz,DiegoG.Bassani,ShailajaChandraandJayantK.Banthia,2011.“TrendsinselectiveabortionsofgirlsinIndia:Analysisofnationallyrepresentativebirthhistoriesfrom1990to2005andcensusdatafrom1991to2011”,Lancet377:9781:1921-1928.
John,MaryE.,RavinderKaur,RajniPalriwala,SaraswatiRajuandAlpanaSagar,2008, Planning Families Planning Gender: The Adverse Child Sex Ratioin Selected Districts of Madhya Pradesh, Rajasthan, Himachal Pradesh,HaryanaandPunjab.BooksforChange:Bangalore.
John,Mary E., 2018. Political and Social Economy of Sex Selection- ExploringFamilyDevelopmentLinkages,ReportofastudyundertakenbytheCWDSforUNFPA,NewDelhi:UNFPAandUNWomen.https://india.unfpa.org/sites/default/files/pub-pdf/The%20Political%20Social%20Economy%20of%20Sex%20selection.pdf
Karve, Irawati, 1965. Kinship Organization in India, Asia Publishing House:Bombay.
Kashyap, Ridhi, 2019. “Is prenatal sex selection associatedwith lower femalechildmortality?”PopulationStudies,73(1):57-78.
Kaur,Ravinder,2004,“AcrossRegionMarriages-Poverty,FemaleMigrationandtheSexRatioinEconomicandPoliticalWeekly,Vol.XXXIXNo.25:2595-2603.
Kaur,Ravinder,SurjitBhalla,ManojK.AgarwalandPrasanthiRamakrishnan,2016.SexRatioatBirth:TheRoleofGender,ClassandEducation.Delhi,UNFPA.
Kaur,Ravinder,SurjitBhalla,ManojK.AgarwalandPrasanthiRamakrishnan,2017. Sex Ratio Imbalances and Marriage Squeeze in India: 2000–2050.Delhi, UNFPA.
Kaur,RavinderandTaanyaKapoor,2018.ReportonChangingParentalAttitudesandShiftingValueofDaughters,UNFPA.
Kulkarni,P.M.,2007.“EstimationofMissingGirlsatBirthandJuvenileAgesinIndia”,ApaperpreparedfortheUnitedNationsPopulationFund(UNFPA),India
Kulkarni P. M., 2009. “Tracking India’s Sex Ratio at Birth: Evidence of aTurnaround,”inPopulation,GenderandHealthinIndia-Methods,ProcessesandPolicies,K.S.James,ArvindPandey,DhananjayW.BansodandLekhaSubaiya(eds.),NewDelhi:AcademicFoundation:191-210.
Kulkarni P.M., 2012. “India’s Child Sex Ratio:Worsening Imbalance”, IndianJournalofMedicalEthicsIX(2):112-114.

48
Kumar,SanjayandK.M.Sathyanarayana,2012.“DecadalTrendsinDistrictLevelEstimatesofImpliedSexRatioatBirthinIndia,”DemographyIndia,41,No.1&2:.1-30
Leibenstein,Harvey,1974.“AnInterpretationoftheEconomicTheoryofFertility:PromisingPathorBlindAlley?”JournalofEconomicLiterature,12,No.2:457-479.
Premi, Mahendra K., 2001. “The Missing Girl Child”. Economic and PoliticalWeekly,36:1875-80.
Rajan,SIrudaya,SharadaSrinivasan,ArjunSBedi,2017.“UpdateonTrendsinSexRatioatBirthinIndia”,EconomicandPoliticalWeekly,LII(11):14-16.
RegistrarGeneral,2001.ProvisionalPopulationTotals,Paper1of2001,CensusofIndia2001,Series-1India.Delhi:ControllerofPublications.
Registrar General, various years: 2002-2019. Sample Registration SystemStatistical Report, various years: 1999…2017. Office of Registrar General,MinistryofHomeAffairs:NewDelhi.
RegistrarGeneral,2013a.VitalStatisticsinIndiabasedontheCivilRegistrationSystem2009.OfficeofRegistrarGeneral,MinistryofHomeAffairs:NewDelhi.
RegistrarGeneral, 2014a.ReportonPostEnumerationSurvey,Censusof India2011.OfficeofRegistrarGeneral,MinistryofHomeAffairs:NewDelhi.
RegistrarGeneral,2018a.VitalStatisticsinIndiabasedontheCivilRegistrationSystem2016.Office ofRegistrarGeneral,Ministry ofHomeAffairs:NewDelhi.
RegistrarGeneral,2019a.VitalStatisticsinIndiabasedontheCivilRegistrationSystem 2017. Office ofRegistrarGeneral,Ministry ofHomeAffairs:NewDelhi.
RegistrarGeneral,n.d.a).Datafrom2001Census:TableF1:Numberofwomenandevermarriedwomenbypresentage,parityandchildreneverbornbysex.
RegistrarGeneral,n.d.b)Datafrom2001Census:TableF9:Numberofwomenandcurrentlymarriedwomenbypresentage,numberofbirthslastyearbysexandbirthorder..
RegistrarGeneral,n.d.c)Datafrom2011Census:TableF1:Numberofwomenandevermarriedwomenbypresentage,parityandchildreneverbornbysex.
RegistrarGeneral,n.d.d)Datafrom2011Census:TableF9:Numberofwomenandcurrentlymarriedwomenbypresentage,numberofbirthslastyearbysexandbirthorder.
Registrar General, n.d. e) Data from 2011 Census: Table C-13: Single year agereturnsbyresidenceandsex.
Retherford, Robert D. and T.K. Roy, 2003. “Factors Affecting Sex-SelectiveAbortion in India and 17Majors States”,National FamilyHealth SurveySubject Reports, Number 21, January 2003, International Institute forPopulation Sciences, Mumbai, India and East-West Centre program onPopulation,Honolulu,Hawaii.U.S.A.

49
Sekher,T.V.2012.“LadlisandLakshmis:FinancialIncentiveSchemesfortheGirlChildinIndia”,EconomicandPoliticalWeekly,Vol.47(17)..
Sen,Amartya,1990.“Morethan100womenaremissing”,NewYorkReviewofBooks20:61-66.
United Nations, 2015. World Population Prospects: The 2015 Revision. U.N.PopulationDivision,NewYork;UnitedNations.
United Nations, 2017. World Population Prospects: The 2017 Revision. U.N.PopulationDivision,NewYork;UnitedNations.
Visaria, Leela, 2007. “Deficit ofGirls in India: Can It BeAttributed to FemaleSelectiveAbortion?” inTulsiPatel (ed.), Sex-SelectiveAbortion in India,NewDelhi:Sage.
Visaria,PravinM.1968.SexRatioofIndia’sPopulation,1961CensusMonograph,Delhi:ControllerofPublications.
Williamson, Nancy. 1976. Sons or Daughters? Beverley Hills, California: SagePublications.

50
Appendix
Estimation of the numbers of missing female births, missing girls, and excess female childhood mortality
Estimation of the number of missing female births during 2004-2011
Themethodologyfortheestimationofmissingfemalebirthsisstraightforward.First, female and male life tables for the seven-year period 2004-2010 wereconstructedbasedontheannualdataonage-specificdeathratesfromtheSRS(RegistrarGeneral,SampleRegistrationSystemStatisticalReport,variousyears)andaveraging therates for thesevenyears.Thenumbersof femaleandmalebirthsduringthisperiodwerethencomputedusingtheenumeratedpopulationsofages0-6inthe2011censusandapplyingreversesurvival.NotethatsincethecensusenumerationwasonMarch1,2011,ideallythedeathratesfortheperiodMarch2004-February2011areneededfortheconstructionoflifetableswhereastheSRSgivesratesforcalendaryearsandthusthelifetablefromtheSRSratesfor2004 to2010refers to the seven-yearperiod January2004-December2010.Butthedisplacementofonlytwomonthsisnotexpectedtochangethelifetablefunctionsmaterially since changes inmortality are generally gradual. If thefemaleandmalepopulationsintheagegroup0-6in2011censusenumerationaredenotedbyFP
0-6 (2011)andMP
0-6 (2011)respectively,and
7L
0 female and
7L
0 male , the
standardlifetablefunctionsforpersonyearsforfemalesandmalesrespectively,then thenumbers of female andmale birthsduring 2004-2011, denoted byFB(2004-2011)andMB(2004-2011)are
FB(2004-2011)=FP0-6 (2011)/(
7L
0 female//700000)and
MB(2004-2011)=MP0-6 (2011)/(
7L
0 male//700000)respectively. (1)
Populationsinages0-6bysexaretakenfromthedatasetfromRegistrarGeneral,Census of 2011, Table C-13.
TheSRB(expressedasnumberoffemalebirthsper1000malebirths)impliedbythecensusviareversesurvivalisthengivenas
SRB=1000xFB(2004-2011)/MB(2004-2011). (2)
Incidentally,thisissamemethodasthatemployedtoestimateSRBbyKumarandSathyanarayana(2012).
Now,iftheSRBhadbeennatural,thenumberfemalebirthsduringtheperiod,calledexpectedfemalebirthsanddenotedasEFB(2004-2011),isgivenby
EFB(2004-2011)=NSRB*MB(2004-2011)/1000 (3)
whereNSRBisthenaturalSRBexpressedasfemalebirthsper1000malebirths.Inthecalculationsinthisstudy,NSRBhasbeenassumedtobe952.

51
Theestimatednumberofmissingfemalebirthsduringtheperiod,denotedbyMiFB(2004-2011),isthencomputedas
MiFB(2004-2011)=EFB(2004-2011)-FB(2004-2011). (4)
Estimation of the number of missing girls at the 2011 census enumeration
Fortheestimationoftheeffectofexcessfemalemortalityintermsofmissinggirls at a point in time, it is necessary to first estimate ‘expected’ level offemale childhood mortality in the absence of post-natal discrimination. Inmost populations, female mortality is lower than male mortality and thefemalemortalitylevelcorrespondingtoagivenmalemortalitylevelinnormalsituations(thatis,intheabsenceofpost-nataldiscrimination)isthe‘expected’femalemortality.Inanearlierwork(Kulkarni,2007),thesystemofPrinceton(Coale-Demeny)WestModellifetableswasinvoked,andfemalemortalityatthesame level in themodel tables as the level ofmalemortalitywas acceptedastheexpectedleveloffemalemortality.ArecentpaperbyGuilmotoetal.(2018)hasprovidedaregressionrelationshipbetweenmaleunder-fivemortalityrate(U5MR)andfemaleU5MRonthebasisofdatafromcountriesthatdonotshowevidenceofpost-nataldiscrimination.Theequationis:
5qf
0 =Ax(
5qm
0 )2 + Bx (
5qm
0 ) + C. (5)
where5qf
0 f and
5qm
0 arefemaleandmaleU5MRs(expressedasdeathsbelowage5
per1000births)andA=0.0006,B=0.8013andC=-0.3462.
Using this regression equation, the value of expected U5MR for female wascomputedfromthemaleU5MR.Fromthis,theexpectedvalueoffemalepersonyearsbetweenages0and 7,denotedby
7L*
0 female , was obtained. Theexpected
femalepopulationofages0-6atthe2011census,denotedbyEFP0-6
(2011) was then computedas:
EFP 0-6 (2011)=EFB(2004-2011)x(
7L*
0 female /700000). (6)
Thisisthenumberofgirlsofages0-6whichwouldhavebeenpresentatthe2011censusenumeration intheabsenceofpre-nataldiscrimination(genderbiasedsexselection)andpost-nataldiscrimination(excessfemalechildhoodmortality).
Thetotalnumberofmissinggirlsofages0-6atthe2011censusissimply
Missinggirls(0-6)in2011=EFP0-6
(2011) - FP 0-6 (2011). (7)
Further,thenumberofmissinggirlsduetoexcessfemalechildhoodmortalityis
FB (2004-2011) x (7L*
0 female -
7L
0 female )/700000. (8).
Thenumberofgirlsmissingduetogenderbiasedsexselectionisthengivenbythedifferencebetweenthesetwoterms.Thiscanalsobeobtaineddirectlyas
MiFB(2004-10)x(7L*
0 female /700000). (9)

52
Estimation of the number of missing female births during 2011-2016
Forestimationofthenumbersofmissingfemalebirthsduringaspecifiedperiod,informationonthenumbersofbirthsbysexisessential.Fortheperiodbeforethecensus,thereversesurvivalmethodwasemployedforthispurposebutthisapproachcannotobviouslybeusedforperiodafter thecensus.Since thecivilregistration system does not provide a complete coverage, onemust resort tothe estimates of the crude birth rate from the SRS and in combinationwiththeSRBfromtheSRSandprojectedpopulationsize,estimate thenumbersofbirthsby sex.Normally, theOfficeofRegistrarGeneralof Indiapreparesandpublishespopulationprojectionssometimeaftereverycensusbutsofarnosuchprojectionshave been released after the 2011 census.Hence, projectionsmadeby the author independently have been used. Of course, making populationprojectionsinvolveassumptionsonfuture(thatis,forperiodsafter2011)levelsoffertility,mortality,andmigrationwith2011censusasthebaselineandthesewouldvary indifferentprojectionsbut for a shortperiod, suchvariationsdonotinfluencetheprojectedtotalsizeofpopulationsubstantially.Therefore,thepopulationsizeintheprojectionsbytheauthorcombinedwithcrudebirthratesfromtheSRSareusedheretoestimatethenumbersofbirthsover2011-2016andthen, by applying the SRB, thenumber ofmale and female births computed.Forthispurpose,populationsatmid-yearswereinterpolatedfromthe2011and2016 projected populations and the SRS crude birth rates applied to these tocomputethenumbersofbirthsineachyear.TheSRSestimatesoftheSRB,whichareavailableasthree-yearaverageswereusedforthemiddleyearandfurtheradjustedbythefactorshowninTable3(thisistheratioshowninthecolumnSRSEst./CensusbasedestimateoftheTableforIndiaandforindividualstates;since such ratiowasnot available forUttarakhand, the adjustment factor forIndiawasapplied).ForboththecrudebirthsratesandtheSRB,theestimatesareforcalendaryearsbutwereusedfortheperiodsMarch2011-February2012andsoonignoringthedisplacementoftwomonths.ApplyingtheadjustedSRBtothenumberofbirths,thenumbersoffemaleandmalebirthswerecomputed.Thestepsare:
Let Pi=Projectedpopulationatmid-yearforyeari,
wherei=1for2011-2012,2for2012-2013,3for2013-2014,4for2014-2015,5for2015-2016.
CBRi=crudebirthrateforyeari(per1000population),and
SRBi = SRB for year i, taken from the three-year average SRB for the
years,i-1,i,i+2.
Then,thenumberofbirthsinyeari,thenumberoffemalebirthsinyeari,andthenumberofmalebirthsinyeari,denotedbyB
i, FB
i,andMB
i respectively,are
givenby
Bi=P
i x CBR
i/1000,
FBi=B
ix(SRBi/A)/((SRB
i/A)+1000),and
MBi=B
i–FB
i, (10)
whereAistheadjustmentfactorforSRB(thisistheratioshowninthecolumnSRSEst/CensusbasedestimateofTable3).
Now,

53
FB(2011-16)= Numberoffemalebirthsduring2011-16=Σ FB
i , and
MB(2011-16)= Numberofmalebirthsduring2011-16=ΣMB
i ,
thesumbeingoveri=1,5. (11)
Then,Expectednumberoffemalebirthsduring2011-16,denotedbyEFB(2011-16),isgivenby
EFB(2011-16)=NSRB*MB(2011-16)/1000. (12)
Thenumber ofmissing female births during 2011-2016,MiFB (2011-16), is thengivenby
MiFB(2011-16)=EFB(2011-16)–FB(2011-16). (13)
Estimation of the number of excess female under-five deaths out of births during 2011-16
In order to estimate the impact of excess under-five female mortality, it isnecessarytofirstcomputefemaleandmaleunder-fivemortalityrates.Averagesofage-specificdeathsratesfromtheSRSfortheyears2011-2015wereobtainedbysexandlifetablesconstructedfortheperiodandfromthesethevaluesofU5MRformalesandfemalesweretaken.TheexpectedU5MRforfemalescorrespondingtomaleU5MRwascomputedusingtheregressionequationgivenbyGuilmotoetal(2018),reproducedaseq(5)above,andtheestimatednumberofexcessfemaledeathsunderage5obtainedas
FB(2011-16)x[FemaleU5MR–ExpectedFemaleU5MR]/1000. (14)
Ideally,U5MRfromcohortlifetablesshouldbeusedforthispurpose.However,changesinmortalityovertimeareveryslowwhenthelifeexpectancyiscloseto70yearsorhigherandhenceperiodlifetablesservethepurposequitewell.

54
App
endi
x Ta
bles
App
endi
x Ta
ble
1: S
ex R
atio
at
Birt
h fr
om t
he C
ivil
Reg
istr
atio
n Sy
stem
, Ind
ia, S
tate
s, a
nd U
nion
Ter
rito
ries
, 20
00
-20
16(f
emal
ebi
rths
per
10
00
mal
ebi
rths
bas
edo
nre
gist
ered
bir
ths)
Stat
e/ Y
ear
200
020
01
200
220
03
200
420
05
200
620
07
200
820
09
2010
2011
2012
2013
2014
2015
2016
IND
IA8
86
875
872
86
88
728
768
91
90
39
04
89
88
579
09
90
88
98
88
78
81
877
And
hra
Prad
esh
936
934
936
973
972
98
797
397
49
86
98
59
83
98
39
85
954
955
971
80
6
Aru
nach
alP
rade
sh72
88
87
80
68
128
64
799
792
854
875
80
679
28
978
1997
89
93
89
59
64
Ass
amna
nana
750
na73
28
768
348
539
3112
44
920
872
90
99
02
88
58
88
Biha
rna
98
477
98
268
01
793
nana
na71
5@
naN
a9
248
68
870
837
Chh
attis
garh
933
925
920
926
919
939
919
919
88
69
249
06
915
89
59
259
349
389
80
Del
hi8
208
09
831
823
823
822
831
84
810
04
915
90
18
93
88
68
95
89
68
98
90
2
Goa
918
919
929
931
931
931
96
39
47
931
921
90
89
349
299
46
94
79
289
00
Guj
arat
816
80
28
268
358
248
46
972
879
88
39
05
90
29
01
90
29
01
88
6na
na
Har
yana
792
789
829
814
796
827
857
86
08
548
538
388
338
328
40
84
38
518
65
Him
acha
lPra
desh
857
856
86
68
778
728
66
88
59
03
90
49
229
119
189
169
06
89
69
03
910
Jam
mu
&K
ashm
irα
879
916
923
925
934
923
90
69
229
06
918
917
913
Na
923
914
912
914
Jhar
khan
dna
nana
na8
40
830
835
86
58
788
64
86
5na
84
78
85
88
68
798
63
Kar
nata
ka9
5597
19
569
248
589
43
952
100
410
47
1011
1025
98
397
19
43
926
89
38
96
Ker
ala
99
89
68
94
49
519
46
94
99
559
44
952
94
29
399
399
559
42
94
89
48
954
Mad
hya
Prad
esh
86
98
41
823
84
18
64
855
855
90
59
139
389
228
979
129
04
90
89
04
90
9
Mah
aras
htra
84
78
198
268
08
811
nana
na8
708
68
854
86
18
94
90
19
118
83
90
4
Man
ipur
914
753
94
99
2310
04
1011
96
39
139
509
3477
08
1679
770
06
84
68
6na
Meg
hala
ya9
349
42
976
875
1011
918
96
58
64
959
94
89
129
42
94
797
89
68
975
na
Miz
oram
911
927
913
926
94
59
40
952
938
94
29
49
94
897
29
68
954
96
397
39
64
Nag
alan
d8
208
94
98
097
197
79
80
80
48
238
02
88
38
718
738
738
738
60
897
967
Odi
sha
94
79
399
88
950
927
934
927
919
935
925
911
90
28
96
88
68
80
86
68
58
Punj
ab74
775
477
778
979
479
08
138
208
208
228
248
528
44
876
88
08
91
857
Raj
asth
an8
218
258
06
833
820
80
58
288
3278
58
61
839
911
86
18
5979
979
48
06
Sikk
im97
39
3612
529
359
569
549
41
98
19
519
559
61
94
797
49
569
68
973
99
9
Tam
ilN
adu
922
929
926
920
936
935
939
935
928
933
935
90
59
04
853
834
818
84
0

55
App
endi
x Ta
ble
1: S
ex R
atio
at
Birt
h fr
om t
he C
ivil
Reg
istr
atio
n Sy
stem
, Ind
ia, S
tate
s, a
nd U
nion
Ter
rito
ries
, 20
00
-20
16(f
emal
ebi
rths
per
10
00
mal
ebi
rths
bas
edo
nre
gist
ered
bir
ths)
Stat
e/ Y
ear
200
020
01
200
220
03
200
420
05
200
620
07
200
820
09
2010
2011
2012
2013
2014
2015
2016
Tela
ngan
a(i
nclu
ded
inA
ndhr
aPr
ades
h)9
549
61
834
88
1
Trip
ura
931
914
1121
120
2na
nana
nana
na9
96
98
29
80
1055
88
210
00
917
Utt
arP
rade
shna
nana
nana
nana
nana
nana
na9
308
83
88
18
778
85
Utt
arak
hand
nana
nana
84
58
64
873
86
98
60
855
858
86
98
47
84
38
65
86
28
25
Wes
tBe
ngal
932
90
48
82
88
99
03
90
68
90
918
914
929
931
924
926
913
897
919
911
Uni
onT
errit
orie
s
A&
Nic
obar
94
69
68
927
100
39
359
679
339
49
96
197
39
349
549
349
47
1031
925
98
7
Cha
ndig
arh
751
771
827
80
778
68
268
60
86
08
728
678
788
358
87
90
48
708
98
90
1
Dad
ra&
NH
avel
i9
03
86
58
339
328
799
188
95
917
94
69
289
05
96
09
548
768
90
100
19
45
Dam
an&
Diu
897
86
08
769
159
06
86
98
47
90
89
169
349
128
578
86
96
19
169
2497
4
Laks
hadw
eep
90
79
08
96
89
91
84
38
69
89
99
119
348
66
1015
897
Na
96
910
43
89
19
45
Pudu
cher
ry9
42
94
69
379
42
936
950
955
950
923
927
917
912
90
99
109
119
399
31
Leve
lofc
over
age
ofb
irth
sun
der
regi
stra
tion
(per
cent
)
Indi
a56
.258
.059
.557
.76
0.4
62.
56
9.0
74.5
76.4
81.
38
2.0
83.
68
4.4
85.
68
8.8
88
.38
6.0
@Theva
lueofSRBfor
Bih
arin2010asgiven
intherepo
rtdoe
sis323
andisprimafaciein
correct.
α:I
ncludingLa
dakh
Source:Reg
istrar
Gen
eral(20
13a,2018a
)

56
App
endi
x Ta
ble
2: E
stim
ates
of
Sex
Rat
io a
t Bi
rth
for
Indi
a an
d La
rge
Stat
es F
rom
SR
S, 1
99
8 o
nwar
ds
(fem
ale
birt
hsp
er1
00
0m
ale
birt
hs)
Peri
od
199
8-
200
019
99
-20
01
200
0-
200
220
01-
200
320
02-
200
420
03-
200
520
04
-20
06
200
5-20
07
200
6-
200
820
07-
200
920
08
-20
1020
09
-20
1120
10-
2012
2011
-20
1320
12-
2014
2013
-20
1520
14-
2016
Mid
-yea
r19
99
200
020
01
200
220
03
200
420
05
200
620
07
200
820
09
2010
2011
2012
2013
2014
2015
IND
IA8
98
89
48
92
88
38
82
88
08
92
90
19
04
90
69
05
90
69
08
90
99
06
90
08
98
And
hra
Prad
eshβ
96
09
349
45
932
916
917
917
915
917
919
920
915
914
916
919
918
913
Ass
am9
84
96
29
45
90
49
159
07
920
939
933
937
928
926
922
920
918
90
08
96
Biha
r8
96
873
870
86
18
63
86
58
81
90
99
149
179
129
109
09
911
90
79
169
08
Chh
attis
garh
96
49
47
96
19
69
975
98
09
85
99
197
997
097
39
61
96
3
Del
hi8
358
318
47
871
877
88
28
84
88
08
84
88
78
768
69
857
Guj
arat
851
837
84
48
62
855
84
48
65
89
18
98
90
49
03
90
99
09
911
90
78
548
48
Har
yana
797
80
38
04
80
78
218
298
378
43
84
78
49
84
88
548
578
64
86
68
318
32
Him
acha
lPr.
90
28
588
268
03
851
858
872
931
938
94
49
42
938
939
94
39
389
249
17
Jam
mu.
&K
ashm
irα
816
824
838
854
86
28
708
738
80
89
59
02
89
98
99
90
6
Jhar
khan
d8
65
872
88
89
279
229
219
199
159
189
139
109
02
918
Kar
nata
ka9
42
935
952
94
39
239
159
179
269
359
44
94
39
45
950
958
950
939
935
Ker
ala
930
927
911
89
28
89
912
922
958
96
49
68
96
69
65
96
69
66
974
967
959
Mad
hya
Pr.
90
79
159
209
229
169
119
139
139
199
269
219
209
219
209
279
199
22
Mah
aras
htra
913
915
89
98
87
878
872
879
871
88
48
96
89
58
93
89
69
02
89
68
788
76
Oris
sa9
289
209
44
934
94
49
329
349
339
379
41
938
94
69
48
956
953
950
94
8
Punj
ab79
277
577
577
679
78
01
80
88
378
368
368
328
41
86
38
678
708
89
89
3
Raj
asth
an8
778
85
89
08
558
388
398
558
65
870
875
877
878
89
38
93
89
38
61
857
Tam
ilN
adu
931
926
926
953
94
69
43
955
94
49
369
299
279
269
289
279
219
119
15
Utt
arP
rade
sh8
68
870
86
48
538
598
62
874
88
18
778
748
708
758
748
788
69
879
88
2
Wes
tBe
ngal
952
956
94
99
379
319
269
319
369
41
94
49
389
41
94
49
43
952
951
937
Sour
ce:R
egis
trar
Gen
eral
(va
rious
yea
rs,2
00
1-20
18).
β:IncludingTe
langa
na;α
:IncludingLa
dakh

57
Appendix Table 3: Estimates of Sex Ratio at Birth for India and States, 2001 and 2011 Census Data (femalebirthsper1000malebirths)
2001 Census 2011 Census Indirect estimate from
Based on Based on Child sex ratio (0-6 years) #
CEB $ BLY @ CEB $ BLY @ 2001 census 2011 Census
Reference period 2000-01 2010-11 1994-2000 2004-10
INDIA 939 906 928 899 935 923
AndhraPradeshβ 961 951 929 924 959 938
Assam 964 948 963 930 968 961
Bihar 935 917 929 892 954 943
Chhattisgarh 975 928 965 948 983 971
Delhi 903 852 1001 869 865 873
Gujarat 896 834 904 868 890 895
Haryana 864 786 878 824 838 845
HimachalPradesh 919 845 969 948 898 916
Jammu&Kashmirα 915 951 888 774 na 866
Jharkhand 962 907 941 903 977 958
Karnataka 953 936 951 922 944 949
Kerala 964 969 966 977 959 965
MadhyaPradesh 942 903 944 908 941 923
Maharashtra 927 877 905 862 915 896
Orissa 966 928 941 910 951 942
Punjab 851 787 882 843 809 854
Rajasthan 918 864 903 899 924 897
TamilNadu 954 935 927 934 945 942
UttarPradesh 937 901 919 890 936 914
WestBengal 962 976 947 937 953 954
ArunachalPradesh 978 997 954 935 965 972
Goa 943 921 903 908 931 943
Manipur 969 976 929 905 957 937
Meghalaya 990 958 982 978 960 967
Mizoram 997 994 977 966 949 970
Nagaland 954 984 956 965 na 944
Sikkim 994 937 956 965 948 960
Tripura 974 973 963 956 964 958
Utttarakhand 938 853 931 869 928 895
$:CEB:Childreneverborntowomenofages20-29atcensus;@:BLY:Birthslastyear
#:Estimatedfromchildsexratioages0-6byKumarandSathyanarayana(2012)
β:includingTelangana;α:IncludingLadakh.na:Notavailable.
Source:CEBandBLYestimatescomputedfrom2001and2011Censusfertilitytables.

58
Appendix Table 4: Trends in Sex Ratio at Births based on NFHS-3 and NFHS-4(femalebirthsper1000malebirths)
Survey NFHS-3 NFHS-4
Period 1995-1999 2000-2004 2000-2004 2005-2009 2010-2014
Mid-year 1997 2002 2002 2007 2012
India 930 919 917 919 911
Jammu&Kashmirα 900 913 887 928 909
HimachalPradesh 938 898 923 943 928
Punjab 751 742 816 853 845
Uttarakhand 912 878 913 908 878
Haryana 910 723 777 810 846
Delhi 874 857 921 759 821
Rajasthan 931 897 886 881 869
UttarPradesh 931 915 893 917 896
Bihar 927 921 944 939 931
Sikkim 1000 929 904 955 800
Arunachal 974 1000 1008 915 911
Nagaland 896 922 924 957 953
Manipur 921 1017 931 959 964
Mizoram 962 1083 981 956 982
Tripura 966 976 973 952 941
Meghalaya 945 935 976 929 990
Assam 952 980 945 975 901
WestBengal 953 947 931 927 947
Jharkhand 1027 1063 949 942 930
Odisha 862 887 957 948 941
Chhattisgarh 969 890 922 923 913
MadhyaPradesh 993 1014 922 923 913
Gujarat 895 898 864 946 873
Maharashtra 944 865 935 869 911
AndhraPradeshincludingTelangana 909 872 946 951 888
AndhraPradesh na na 943 948 899
Telangana na na 951 954 874
Karnataka 878 971 970 918 909
Goa 893 929 977 867 945
Kerala 1005 934 972 941 1027
TamilNadu 933 992 909 955 950
Source:ComputedfromNFHS-3andNFHS-4datafiles.
na:Notavailable.
α:IncludingLadakh

59
Appendix Table 5: Sex Ratio at Birth from HMIS reports, India, States and Union Territories, 2008/09 to 2017/18 (femalebirthsper1000malebirths)
State/Year Year
2008-09
2009-10 2010-11 2011-12 2012-13 2013-14 2014-
152015-
162016-
172017-
18
India 900 927 913 917 915 918 918 923 926 929
A&NIslands na 956 923 971 954 959 967 890 1003 897
AndhraPradesh 915 946 938 943 931 926 921 951 946 958
ArunachalPradesh 995 911 942 918 931 921 916 951 936 956
Assam 927 885 903 924 917 928 920 922 936 938
Bihar 797 1129 935 946 932 941 936 928 918 910
Chandigarh 806 898 881 867 889 899 874 906 921 897
Chhattisgarh 969 968 964 930 920 923 930 931 946 961
Dadra&NagarHaveli 945 919 901 928 947 936 939 951 934 919
Daman&Diu na Na 1062 936 915 960 894 906 972 894
Delhi 900 871 882 891 888 893 901 904 908 917
Goa 865 919 923 963 934 905 939 918 937 942
Gujarat 904 904 894 890 891 900 901 907 910 910
Haryana 874 854 853 865 865 883 876 887 902 914
HimachalPradesh 886 898 880 896 894 894 897 908 916 931
Jammu&Kashmirα 924 891 909 921 913 937 936 942 947 958
Jharkhand 896 914 908 912 921 918 920 924 918 921
Karnataka 937 948 923 935 942 941 945 943 948 940
Kerala 914 957 960 950 955 952 959 953 958 964
Lakshadweep Na 1054 951 891 866 1021 1000 832 955 885
MadhyaPradesh 928 929 936 936 932 924 926 929 937 929
Maharashtra 886 881 870 889 910 921 920 924 922 940
Manipur 978 957 978 932 941 918 933 936 952 914
Meghalaya 1012 959 940 953 960 953 938 952 949 936
Mizoram 904 922 962 936 953 948 971 955 980 958
Nagaland 994 928 955 900 925 912 948 904 923 921
Odisha 992 936 927 924 932 940 948 943 940 936
Puducherry 912 914 924 903 927 898 916 948 931 939
Punjab 902 878 884 885 884 890 892 891 902 907
Rajasthan 905 901 893 900 906 924 929 929 938 945
Sikkim 1014 942 946 920 985 959 957 998 954 928
TamilNadu 950 947 943 933 924 923 917 935 938 947
Telangana IncludedinAndhraPradesh 925 947 941 925
Tripura 899 935 922 924 936 940 958 930 954 946
UttarPradesh 870 909 907 909 891 888 885 902 906 911
Uttarakhand 947 901 910 894 911 907 903 906 914 922
WestBengal 846 922 928 927 935 931 942 937 936 942
Source:HMIS(2018).
na:Notavailable.
α:IncludingLadakh

60

61

62
United Nations Population Fund (UNFPA)55 Lodi Estate, New Delhi 110003 IndiaE-mail:[email protected]