sentara port warwick ambulatory surgery center community
TRANSCRIPT

Community Health Needs Assessment2013
www.sentara.com/belleharbour
Sentara Port Warwick Ambulatory Surgery Center

Sentara Port Warwick Ambulatory Surgery Center
Community Health Needs Assessment
Introduction
Sentara Port Warwick Ambulatory Surgery Center has conducted a community health needs assessment in collaboration with Sentara CarePlex Hospital. The assessment provides us with a picture of the health status of the residents in our communities and provides us with information about health and health-related problems that impact health status.
Our assessment includes a review of population characteristics such as age, educational level, and racial and ethnic composition because these factors can impact health. The assessment also looks at risk factors like obesity and smoking and health indicators such as infant mortality and preventable hospitalizations. Community input is important so the assessment also includes survey results from local health departments, the school system, social services, community health centers, free clinics, local governments, and many others. In the following pages, additional information on the assessment process and findings can be found.
The needs assessment identifies numerous health issues that our communities face. While there are many important health matters, we are focusing our efforts on the health issues listed below. Considering factors such as size and scope of the health problem, the intensity and severity of the issue, the potential to effectively address the problem and the availability of community resources, and Sentara’s mission “to improve health every day”, we have identified these priority health problems in our area:
• Healthcare for the uninsured and underinsured • Adult Obesity • Cancer • Diabetes
The community health needs assessment was used as the foundation for a hospital implementation strategy to address these priority needs. The assessment and implementation strategy have been adopted by the facility’s governing body. A number of resources are available in the community to address these needs through community partners such as the local health departments, United Way Agencies, and others. Information about these resources is available from sources like 2-1-1 Virginia and Sentara.com. Together, we will work to improve the health of the communities we serve.
Your input is important to us so that we can incorporate your feedback into our assessments. You may use our online feedback form available on the Sentara.com website. Thanks!
A Community Health Needs Assessment Prepared for the Sentara CarePlex Hospital
By Community Health Solutions
Table of Contents Section Page
Executive Summary 1
Part I. Community Insight Profile 4
Item 1. Survey Respondents 4
Item 2. Community Health Concerns 5
Item 3. Community Service Gaps 7
Part II. Community Indicator Profile 9
1. Health Demographic Trend Profile 10
2. Health Demographic Snapshot Profile 11
3. Mortality Profile 12
4. Maternal and Infant Health Profile 13
5. Preventable Hospitalization Discharge Profile 14
6. Behavioral Health Hospitalization Discharge Profile 15
7. Adult Health Risk Factor Profile 16
8. Youth Health Risk Factor Profile 17
9. Uninsured Profile 18
10. Medically Underserved Profile 19
Appendix A: Zip Code Level Maps 20
Appendix B: Community Insight Profile: Additional Ideas and Suggestions for Improving Community Health 37
Appendix C: Data Sources 38
Page | 1 Sentara CarePlex Hospital Community Health Needs Assessment
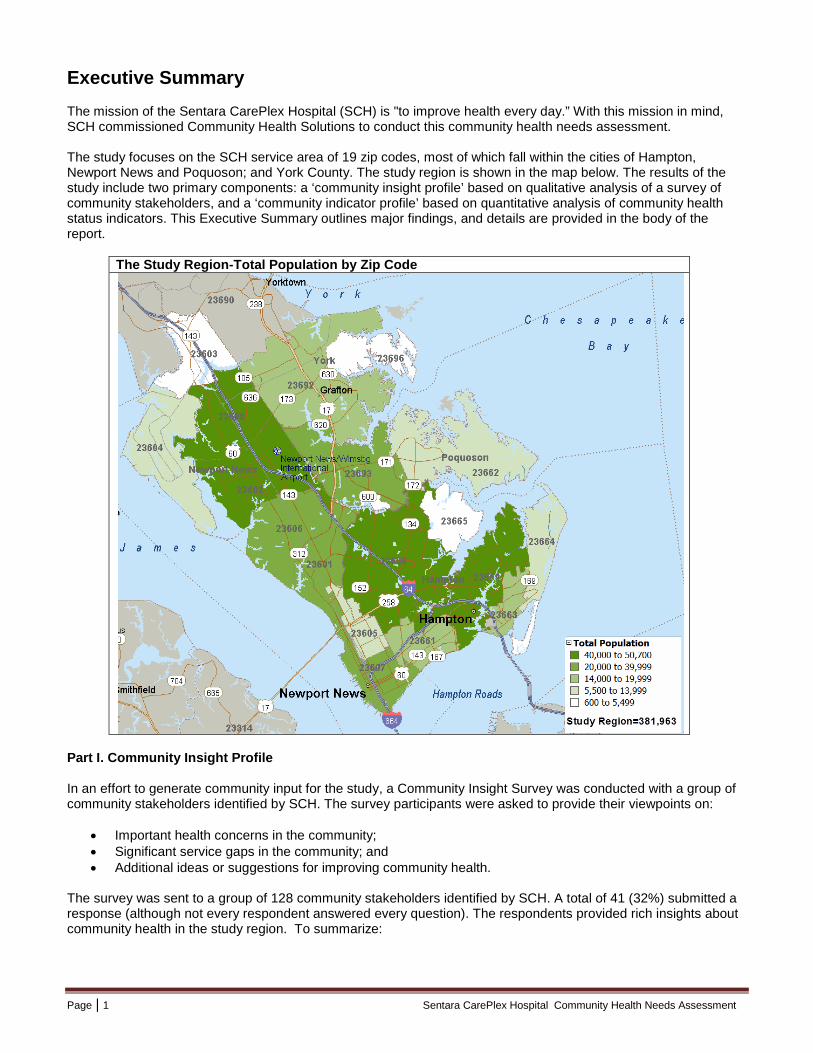
Executive Summary The mission of the Sentara CarePlex Hospital (SCH) is "to improve health every day.” With this mission in mind, SCH commissioned Community Health Solutions to conduct this community health needs assessment. The study focuses on the SCH service area of 19 zip codes, most of which fall within the cities of Hampton, Newport News and Poquoson; and York County. The study region is shown in the map below. The results of the study include two primary components: a ‘community insight profile’ based on qualitative analysis of a survey of community stakeholders, and a ‘community indicator profile’ based on quantitative analysis of community health status indicators. This Executive Summary outlines major findings, and details are provided in the body of the report.
The Study Region-Total Population by Zip Code
Part I. Community Insight Profile In an effort to generate community input for the study, a Community Insight Survey was conducted with a group of community stakeholders identified by SCH. The survey participants were asked to provide their viewpoints on:
• Important health concerns in the community; • Significant service gaps in the community; and • Additional ideas or suggestions for improving community health.
The survey was sent to a group of 128 community stakeholders identified by SCH. A total of 41 (32%) submitted a response (although not every respondent answered every question). The respondents provided rich insights about community health in the study region. To summarize:
Page | 2 Sentara CarePlex Hospital Community Health Needs Assessment
• The respondents identified over 20 important health concerns such as obesity, chronic disease, illegal drug substance abuse, alcohol use and more.
• The respondents reported more than two dozen specific community services in need of strengthening.
Commonly identified services included aging services, behavioral health services, health care services for the uninsured/underinsured, health care insurance coverage and more.
Fourteen respondents offered open-ended responses with additional ideas and suggestions for improving community health. These responses are listed in Appendix B on page 37.
Part II. Community Indicator Profile The community indicator profile in Part II presents a wide array of quantitative community health indicators for the study region. To produce the profile, Community Health Solutions analyzed data from multiple sources. By design, the analysis does not include every possible indicator of community health. The analysis is focused on a set of indicators that provide broad insight into community health, and for which there were readily available data sources. To summarize: • Demographic Profile. As of 2012, the study region included an estimated 381,963 people. The population is
expected to increase to 387,482 by 2017. Compared to the Commonwealth of Virginia as a whole, the study region is more densely populated, has (proportionally) more adults age 18-29, and fewer adults age 30-44. With regards to racial/ethnic composition, the study region has (proportionally) more Black/African American residents and fewer residents of Hispanic ethnicity. The study region also has fewer adults age 25+ without a high school education and more households with lower income levels than Virginia as a whole.
• Mortality Profile. The study region had 2,862 total deaths in 2011. The leading causes of death were malignant neoplasms (cancer), heart disease and cerebrovascular diseases (stroke). The study region death rate per 100,000 population was higher than the statewide rate for all age groups.
• Maternal and Infant Health Profile. The study region had 5,326 total live births in 2011. Compared to Virginia as a whole, the study region had a comparable rate of low weight births, a lower rate of births without early prenatal care, and a higher rate of non-marital births. In 2011, teen pregnancy rates for the cities of Hampton and Newport News were higher than the statewide rate. The five-year infant mortality rates for the cities of Hampton, Newport News and Poquoson were also higher than the statewide rate.
• Preventable Hospitalization Discharge Profile. The Agency for Healthcare Research and Quality (AHRQ) defines a set of conditions (called Prevention Quality Indicators, or ‘PQIs’) for which hospitalization should be avoidable with proper outpatient health care. High rates of hospitalization for these conditions indicate potential gaps in access to quality outpatient services for community residents. Residents of the study region had 3,545 PQI hospital discharges from Virginia hospitals in 2011. The leading diagnoses for these discharges were congestive heart failure, diabetes and bacterial pneumonia. The study region PQI discharge rates per 100,000 population were higher than the statewide rates for residents age 18-64.
• Behavioral Health Hospitalization Discharge Profile. Behavioral Health (BH) hospitalizations provide another important indicator of community health status. Residents of the study region had 2,584 hospital discharges from Virginia hospitals for behavioral health conditions in 2011.1 The leading diagnoses for these discharges were affective psychoses, general symptoms2 and schizophrenic disorders. The study region behavioral health hospitalization discharge rate per 100,000 population was higher than the statewide rate for seniors age 65+.
• Adult Health Risk Profile. Local estimates indicate that substantial numbers of adults (age 18+) in the study region have health risks related to nutrition, physical inactivity, weight, tobacco, and alcohol. In addition, substantial numbers of adults have chronic conditions such as high blood pressure, arthritis, high cholesterol, diabetes and asthma.
1 Data include discharges for Virginia residents from Virginia community hospitals reporting to Virginia Health Information, Inc. These data do not include discharges from state behavioral health facilities or federal (military) facilities. Data reported are based on the primary diagnosis. 2 This diagnosis includes symptoms, signs, abnormal results of laboratory or other investigative procedures, and ill-defined conditions regarding which no diagnosis classifiable elsewhere is recorded.
Page | 3 Sentara CarePlex Hospital Community Health Needs Assessment
• Youth Health Risk Profile. Local estimates indicate that substantial numbers of youth (age 14-19) in the study region have health risks related to nutrition, physical inactivity, weight, tobacco, alcohol and mental health.
• Uninsured Profile. An estimated 48,716 (21%) nonelderly residents of the study region were uninsured at any point in time in 2012. This included an estimated 7,360 children and 41,357 adults.
• Medically Underserved Profile. Medically Underserved Areas (MUAs) and Medically Underserved Populations (MUPs) are designated by the U.S. Health Resources and Services Administration as being at risk for health care access problems. The designations are based on several factors including primary care provider supply, infant mortality, prevalence of poverty, and the prevalence of seniors age 65+. Three of the four localities included in the study region (cities of Hampton and Newport News; and York County) are partially designated as MUAs/MUPs.
Accompanying File of Zip Code Level Indicators This report includes community health indicators for the study region as a whole. A separate Microsoft Excel file contains indicators for each zip code within the study region. Appendix A: Zip Code Level Maps Appendix A provides a set of thematically colored maps displaying variation in selected community health indicators by zip code. The underlying data for these maps are provided in a separate Microsoft Excel file. Please read the important technical notes about zip code level data. Appendix B: Community Insight Profile-Additional Ideas and Suggestions for Improving Community Health Fourteen survey respondents offered open-ended responses with additional ideas and suggestions for improving community health. These responses are listed in Appendix B on page 37. Appendix C: Data Sources Appendix C provides a list of the data sources used in the analyses for this report.
Page | 4 Sentara CarePlex Hospital Community Health Needs Assessment
Part I. Community Insight Profile In an effort to generate community input for the study, a Community Insight Survey was conducted with a group of community stakeholders identified by SCH. The survey participants were asked to provide their viewpoints on:
• Important health concerns in the community; • Significant service gaps in the community; and • Additional ideas and suggestions for improving community health.
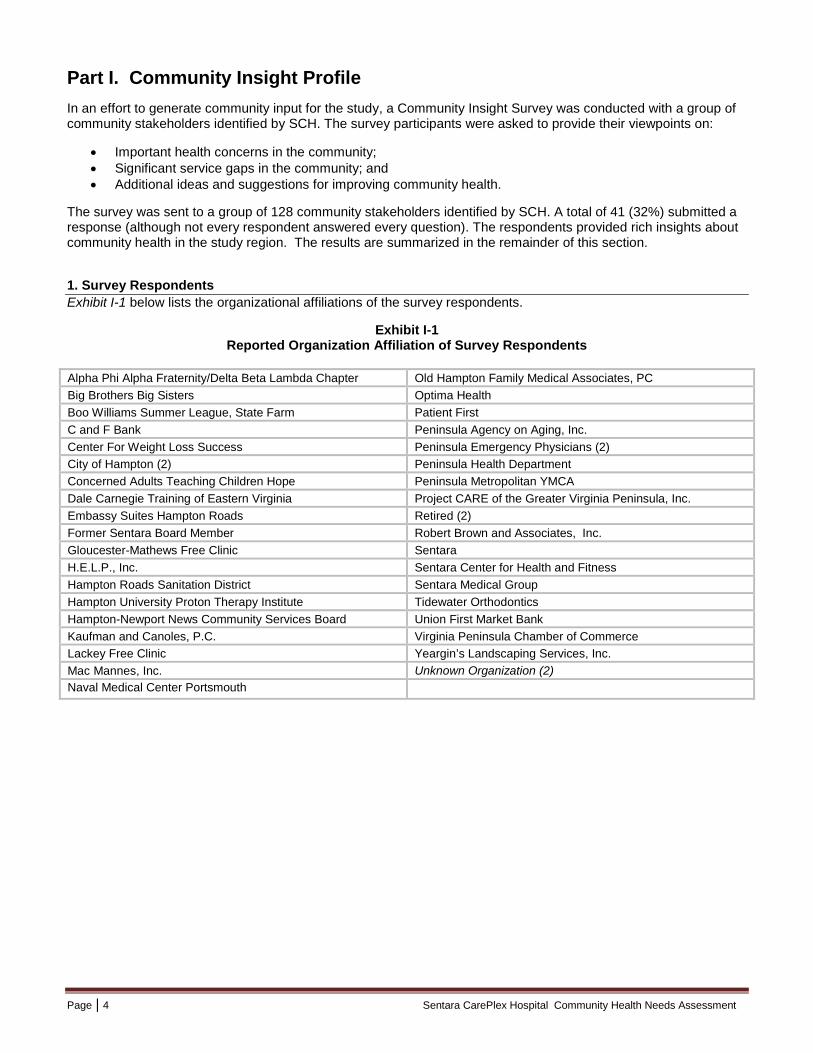
The survey was sent to a group of 128 community stakeholders identified by SCH. A total of 41 (32%) submitted a response (although not every respondent answered every question). The respondents provided rich insights about community health in the study region. The results are summarized in the remainder of this section. 1. Survey Respondents Exhibit I-1 below lists the organizational affiliations of the survey respondents.
Exhibit I-1 Reported Organization Affiliation of Survey Respondents
Alpha Phi Alpha Fraternity/Delta Beta Lambda Chapter Old Hampton Family Medical Associates, PC Big Brothers Big Sisters Optima Health Boo Williams Summer League, State Farm Patient First C and F Bank Peninsula Agency on Aging, Inc. Center For Weight Loss Success Peninsula Emergency Physicians (2) City of Hampton (2) Peninsula Health Department Concerned Adults Teaching Children Hope Peninsula Metropolitan YMCA Dale Carnegie Training of Eastern Virginia Project CARE of the Greater Virginia Peninsula, Inc. Embassy Suites Hampton Roads Retired (2) Former Sentara Board Member Robert Brown and Associates, Inc. Gloucester-Mathews Free Clinic Sentara H.E.L.P., Inc. Sentara Center for Health and Fitness Hampton Roads Sanitation District Sentara Medical Group Hampton University Proton Therapy Institute Tidewater Orthodontics Hampton-Newport News Community Services Board Union First Market Bank Kaufman and Canoles, P.C. Virginia Peninsula Chamber of Commerce Lackey Free Clinic Yeargin’s Landscaping Services, Inc. Mac Mannes, Inc. Unknown Organization (2) Naval Medical Center Portsmouth
Page | 5 Sentara CarePlex Hospital Community Health Needs Assessment
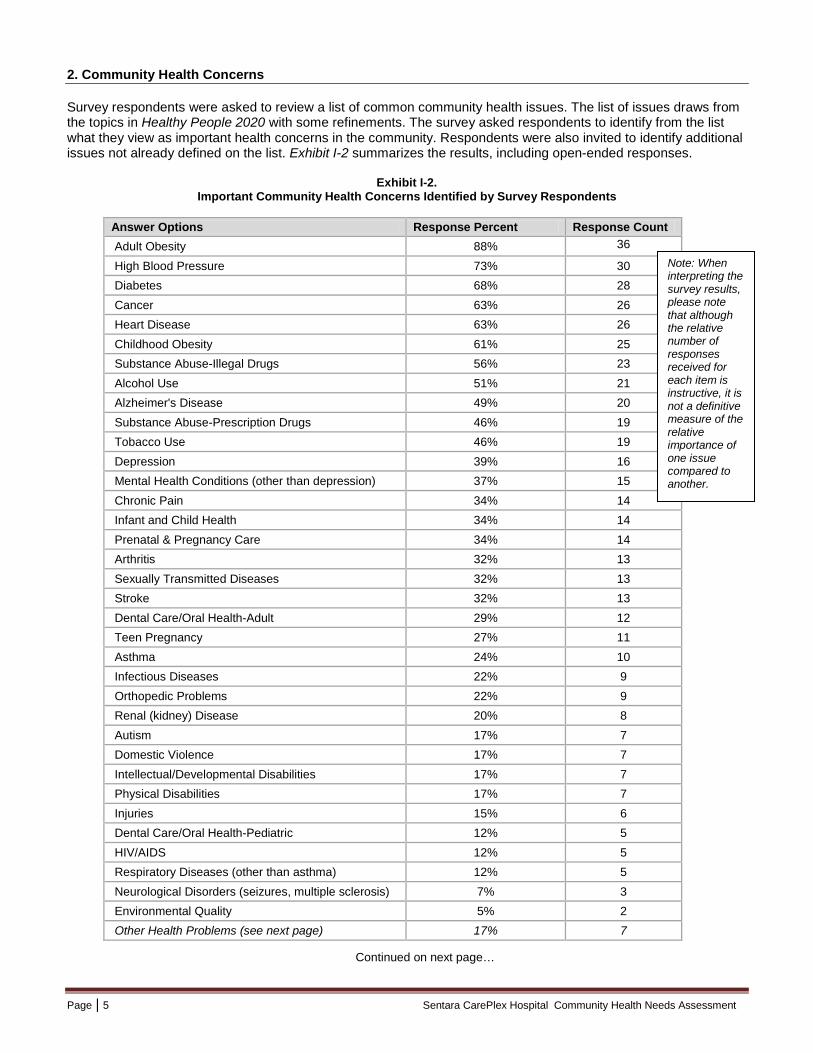
2. Community Health Concerns Survey respondents were asked to review a list of common community health issues. The list of issues draws from the topics in Healthy People 2020 with some refinements. The survey asked respondents to identify from the list what they view as important health concerns in the community. Respondents were also invited to identify additional issues not already defined on the list. Exhibit I-2 summarizes the results, including open-ended responses.
Exhibit I-2. Important Community Health Concerns Identified by Survey Respondents
Answer Options Response Percent Response Count Adult Obesity 88% 36
High Blood Pressure 73% 30 Diabetes 68% 28 Cancer 63% 26 Heart Disease 63% 26 Childhood Obesity 61% 25 Substance Abuse-Illegal Drugs 56% 23 Alcohol Use 51% 21 Alzheimer's Disease 49% 20 Substance Abuse-Prescription Drugs 46% 19 Tobacco Use 46% 19 Depression 39% 16 Mental Health Conditions (other than depression) 37% 15 Chronic Pain 34% 14 Infant and Child Health 34% 14 Prenatal & Pregnancy Care 34% 14 Arthritis 32% 13 Sexually Transmitted Diseases 32% 13 Stroke 32% 13 Dental Care/Oral Health-Adult 29% 12 Teen Pregnancy 27% 11 Asthma 24% 10 Infectious Diseases 22% 9 Orthopedic Problems 22% 9 Renal (kidney) Disease 20% 8 Autism 17% 7 Domestic Violence 17% 7 Intellectual/Developmental Disabilities 17% 7 Physical Disabilities 17% 7 Injuries 15% 6 Dental Care/Oral Health-Pediatric 12% 5 HIV/AIDS 12% 5 Respiratory Diseases (other than asthma) 12% 5 Neurological Disorders (seizures, multiple sclerosis) 7% 3 Environmental Quality 5% 2 Other Health Problems (see next page) 17% 7
Continued on next page…
Note: When interpreting the survey results, please note that although the relative number of responses received for each item is instructive, it is not a definitive measure of the relative importance of one issue compared to another.
Page | 6 Sentara CarePlex Hospital Community Health Needs Assessment
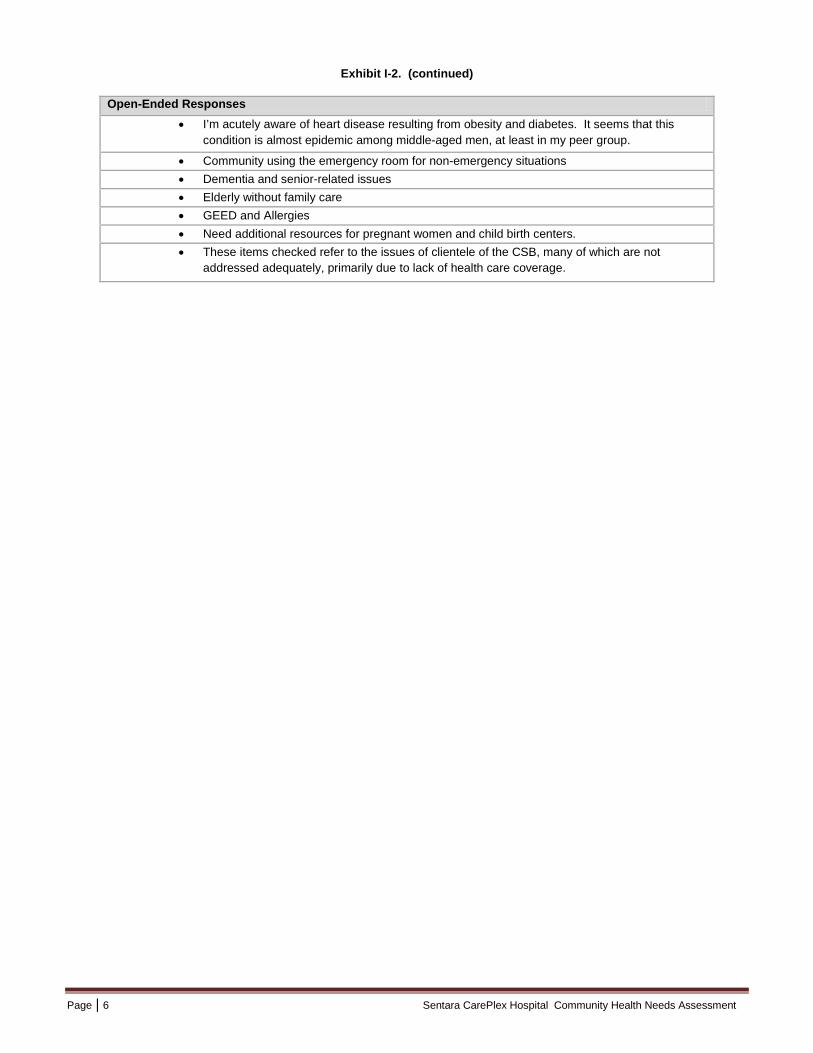
Exhibit I-2. (continued)
Open-Ended Responses
• I’m acutely aware of heart disease resulting from obesity and diabetes. It seems that this condition is almost epidemic among middle-aged men, at least in my peer group.
• Community using the emergency room for non-emergency situations • Dementia and senior-related issues • Elderly without family care • GEED and Allergies • Need additional resources for pregnant women and child birth centers.
• These items checked refer to the issues of clientele of the CSB, many of which are not addressed adequately, primarily due to lack of health care coverage.
Page | 7 Sentara CarePlex Hospital Community Health Needs Assessment
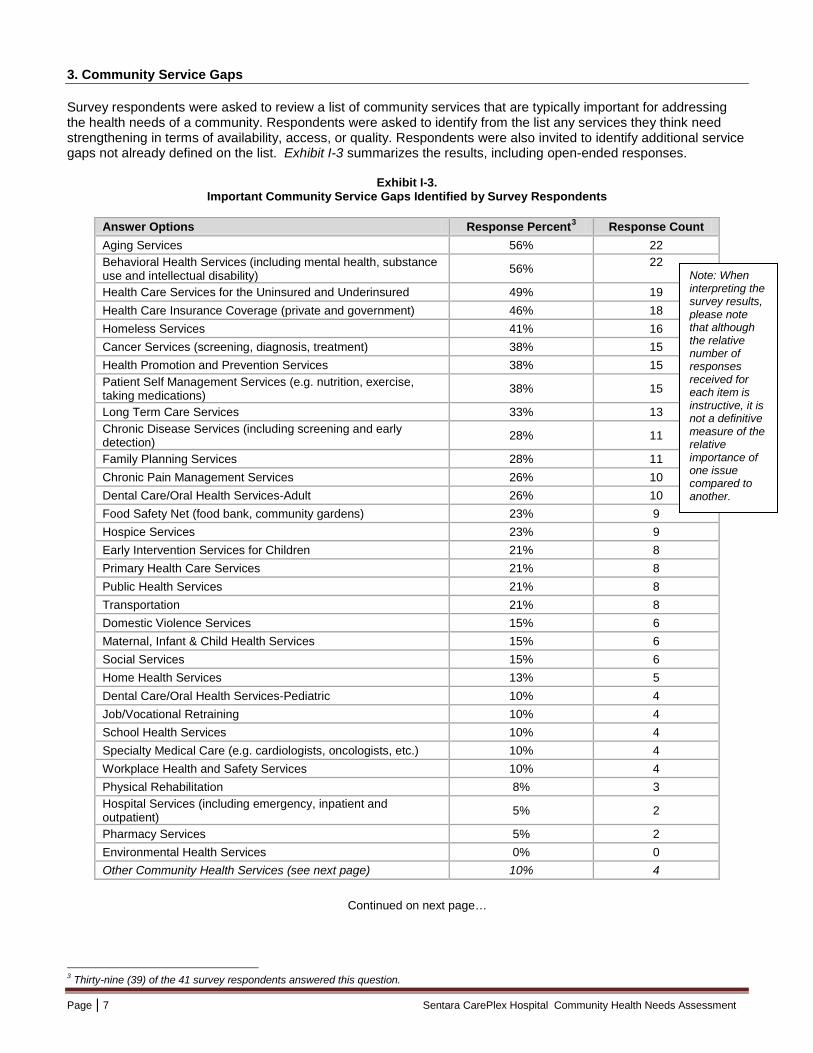
3. Community Service Gaps Survey respondents were asked to review a list of community services that are typically important for addressing the health needs of a community. Respondents were asked to identify from the list any services they think need strengthening in terms of availability, access, or quality. Respondents were also invited to identify additional service gaps not already defined on the list. Exhibit I-3 summarizes the results, including open-ended responses.
Exhibit I-3. Important Community Service Gaps Identified by Survey Respondents
Answer Options Response Percent3 Response Count Aging Services 56% 22 Behavioral Health Services (including mental health, substance use and intellectual disability) 56% 22
Health Care Services for the Uninsured and Underinsured 49% 19 Health Care Insurance Coverage (private and government) 46% 18 Homeless Services 41% 16 Cancer Services (screening, diagnosis, treatment) 38% 15 Health Promotion and Prevention Services 38% 15 Patient Self Management Services (e.g. nutrition, exercise, taking medications)
38% 15
Long Term Care Services 33% 13 Chronic Disease Services (including screening and early detection)
28% 11
Family Planning Services 28% 11 Chronic Pain Management Services 26% 10 Dental Care/Oral Health Services-Adult 26% 10 Food Safety Net (food bank, community gardens) 23% 9 Hospice Services 23% 9 Early Intervention Services for Children 21% 8 Primary Health Care Services 21% 8 Public Health Services 21% 8 Transportation 21% 8 Domestic Violence Services 15% 6 Maternal, Infant & Child Health Services 15% 6 Social Services 15% 6 Home Health Services 13% 5 Dental Care/Oral Health Services-Pediatric 10% 4 Job/Vocational Retraining 10% 4 School Health Services 10% 4 Specialty Medical Care (e.g. cardiologists, oncologists, etc.) 10% 4 Workplace Health and Safety Services 10% 4 Physical Rehabilitation 8% 3 Hospital Services (including emergency, inpatient and outpatient) 5% 2
Pharmacy Services 5% 2 Environmental Health Services 0% 0 Other Community Health Services (see next page) 10% 4
3 Thirty-nine (39) of the 41 survey respondents answered this question.
Continued on next page…
Note: When interpreting the survey results, please note that although the relative number of responses received for each item is instructive, it is not a definitive measure of the relative importance of one issue compared to another.
Page | 8 Sentara CarePlex Hospital Community Health Needs Assessment
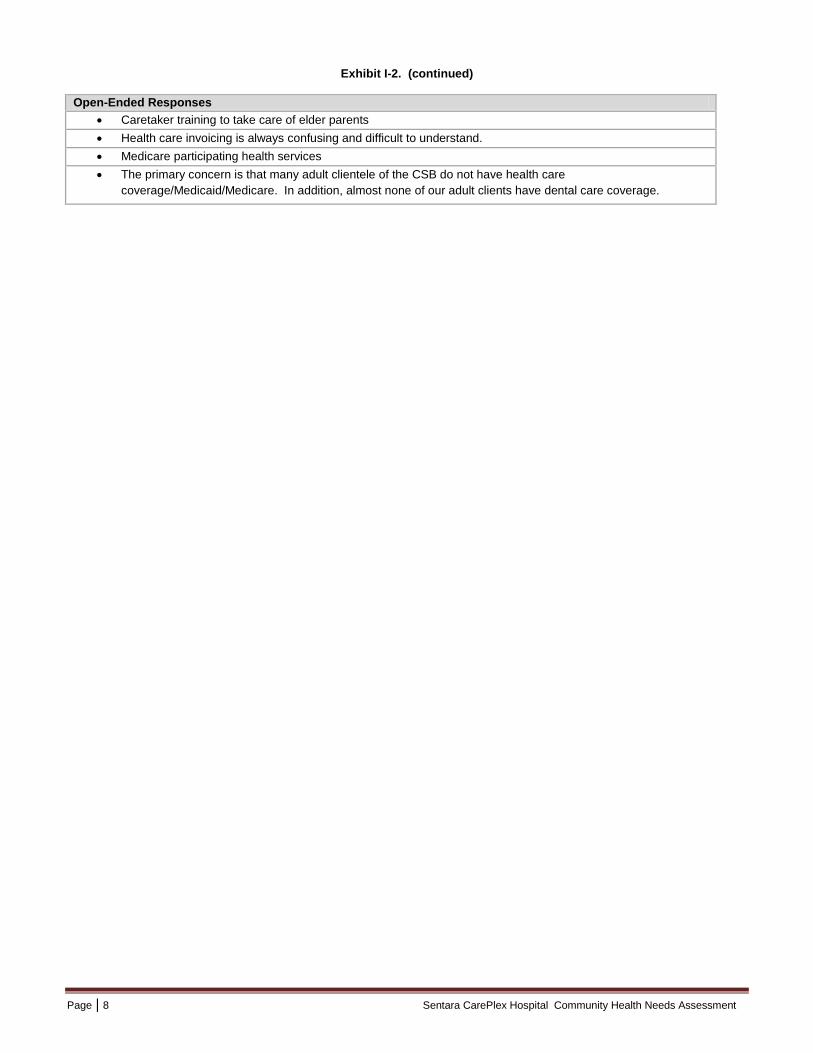
Exhibit I-2. (continued) Open-Ended Responses
• Caretaker training to take care of elder parents • Health care invoicing is always confusing and difficult to understand. • Medicare participating health services • The primary concern is that many adult clientele of the CSB do not have health care
coverage/Medicaid/Medicare. In addition, almost none of our adult clients have dental care coverage.
Page | 9 Sentara CarePlex Hospital Community Health Needs Assessment
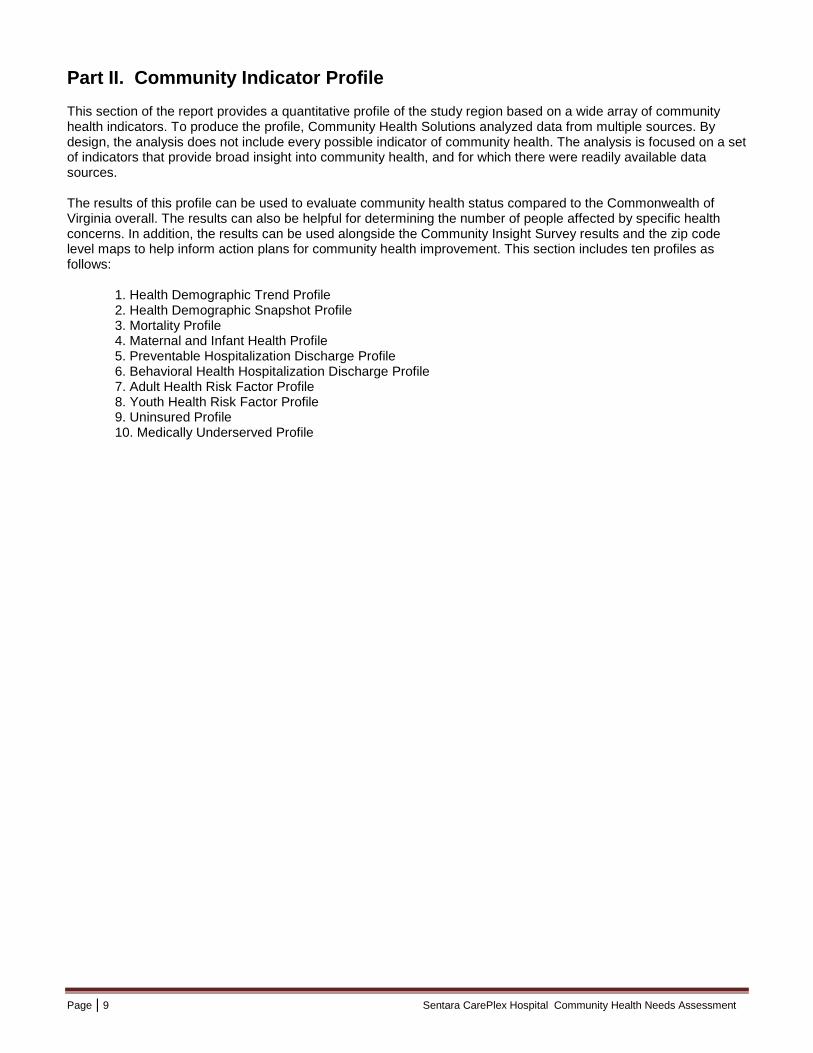
Part II. Community Indicator Profile This section of the report provides a quantitative profile of the study region based on a wide array of community health indicators. To produce the profile, Community Health Solutions analyzed data from multiple sources. By design, the analysis does not include every possible indicator of community health. The analysis is focused on a set of indicators that provide broad insight into community health, and for which there were readily available data sources. The results of this profile can be used to evaluate community health status compared to the Commonwealth of Virginia overall. The results can also be helpful for determining the number of people affected by specific health concerns. In addition, the results can be used alongside the Community Insight Survey results and the zip code level maps to help inform action plans for community health improvement. This section includes ten profiles as follows:
1. Health Demographic Trend Profile 2. Health Demographic Snapshot Profile 3. Mortality Profile 4. Maternal and Infant Health Profile 5. Preventable Hospitalization Discharge Profile 6. Behavioral Health Hospitalization Discharge Profile 7. Adult Health Risk Factor Profile 8. Youth Health Risk Factor Profile 9. Uninsured Profile 10. Medically Underserved Profile
Page | 10 Sentara CarePlex Hospital Community Health Needs Assessment
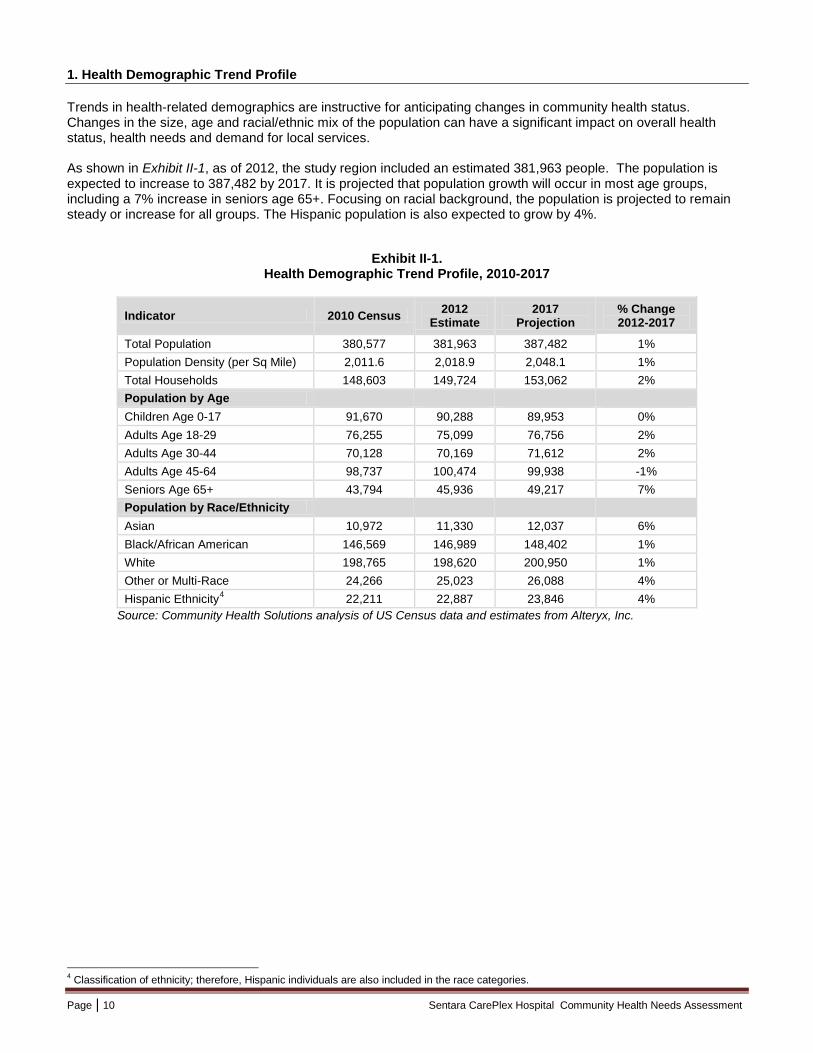
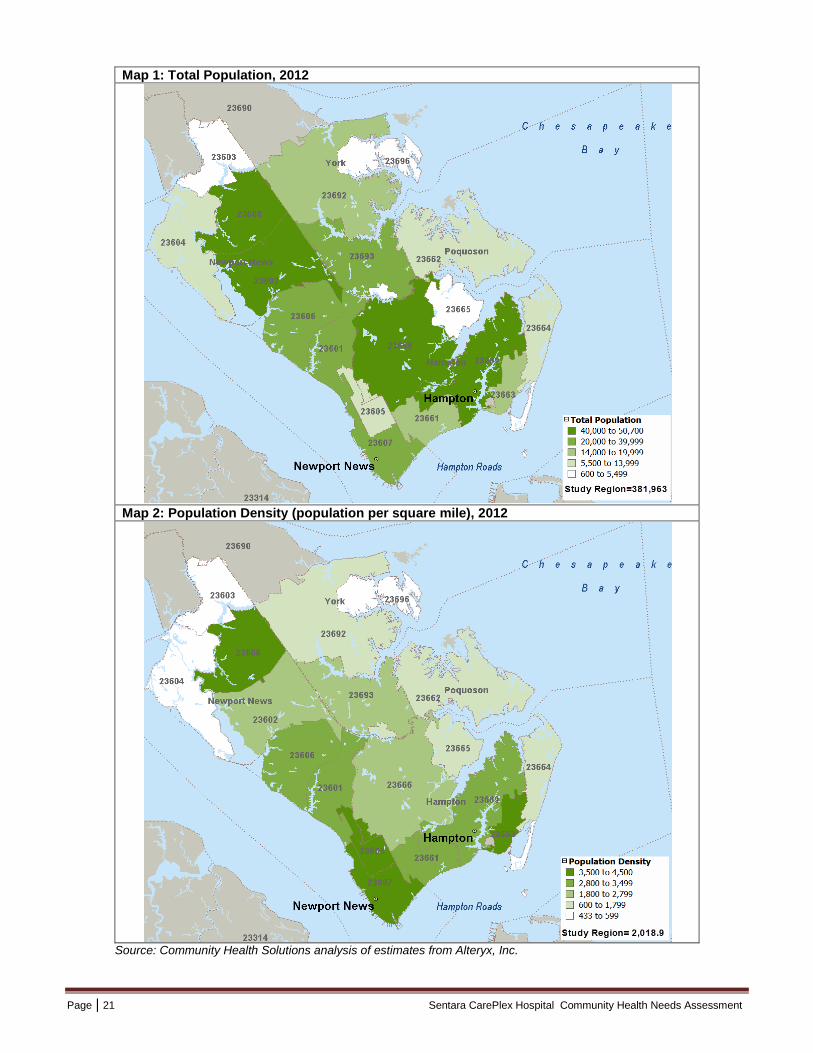
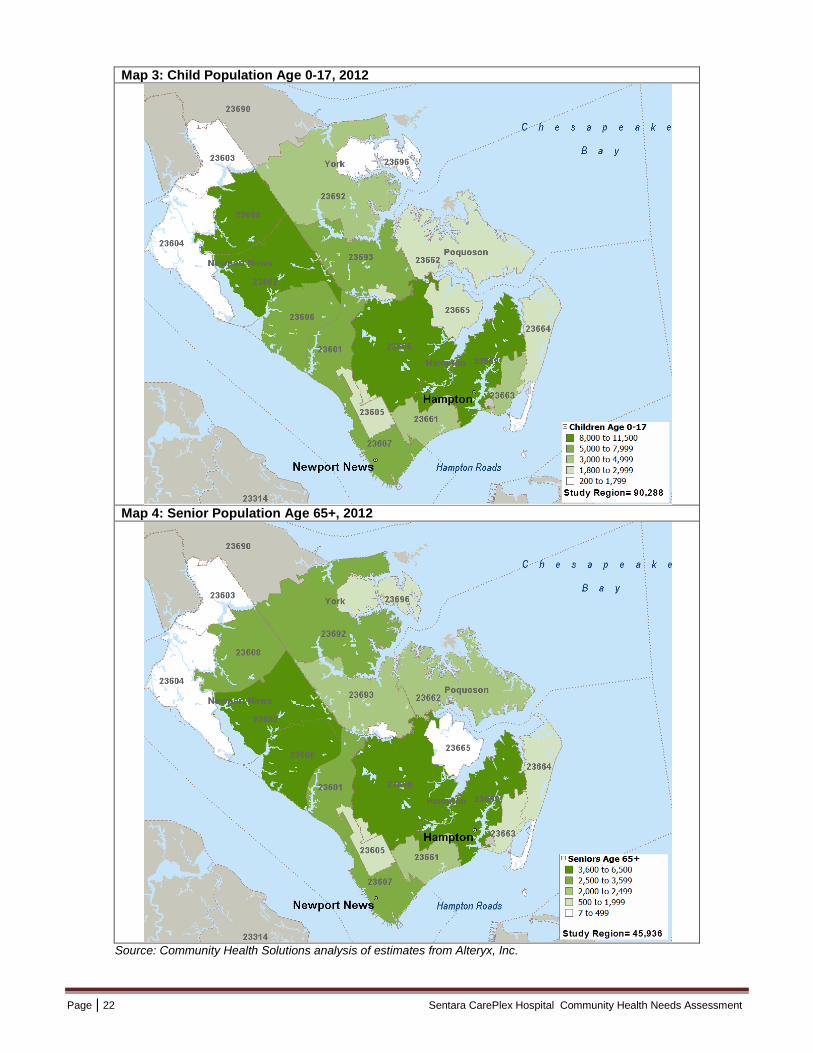
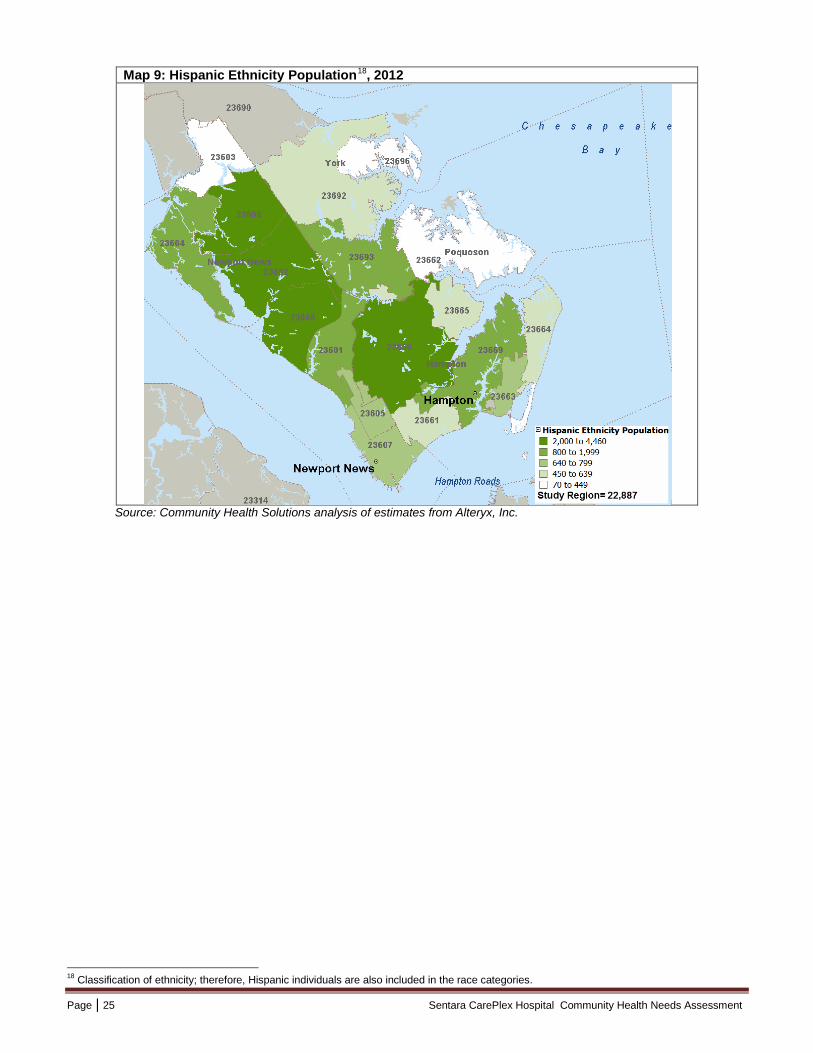
1. Health Demographic Trend Profile Trends in health-related demographics are instructive for anticipating changes in community health status. Changes in the size, age and racial/ethnic mix of the population can have a significant impact on overall health status, health needs and demand for local services. As shown in Exhibit II-1, as of 2012, the study region included an estimated 381,963 people. The population is expected to increase to 387,482 by 2017. It is projected that population growth will occur in most age groups, including a 7% increase in seniors age 65+. Focusing on racial background, the population is projected to remain steady or increase for all groups. The Hispanic population is also expected to grow by 4%.
Exhibit II-1. Health Demographic Trend Profile, 2010-2017
Indicator 2010 Census 2012 Estimate
2017 Projection
% Change 2012-2017
Total Population 380,577 381,963 387,482 1% Population Density (per Sq Mile) 2,011.6 2,018.9 2,048.1 1% Total Households 148,603 149,724 153,062 2% Population by Age Children Age 0-17 91,670 90,288 89,953 0% Adults Age 18-29 76,255 75,099 76,756 2% Adults Age 30-44 70,128 70,169 71,612 2% Adults Age 45-64 98,737 100,474 99,938 -1% Seniors Age 65+ 43,794 45,936 49,217 7% Population by Race/Ethnicity Asian 10,972 11,330 12,037 6% Black/African American 146,569 146,989 148,402 1% White 198,765 198,620 200,950 1% Other or Multi-Race 24,266 25,023 26,088 4% Hispanic Ethnicity4 22,211 22,887 23,846 4%
Source: Community Health Solutions analysis of US Census data and estimates from Alteryx, Inc.
4 Classification of ethnicity; therefore, Hispanic individuals are also included in the race categories.
Page | 11 Sentara CarePlex Hospital Community Health Needs Assessment
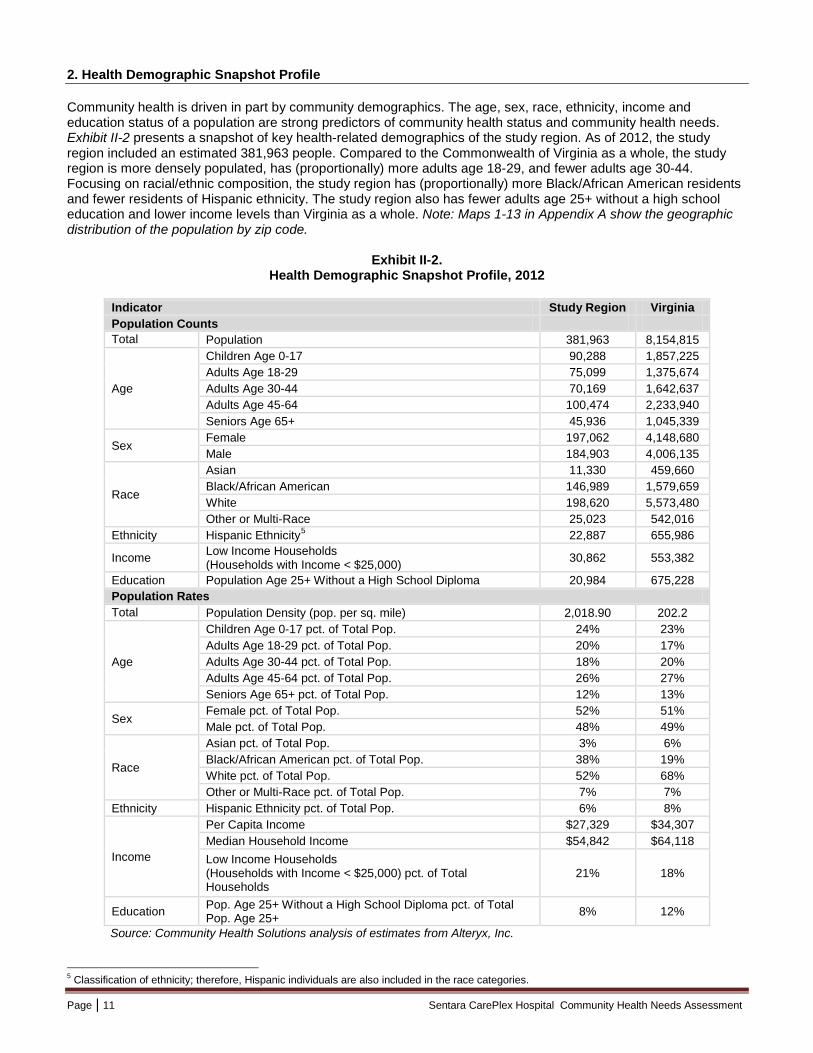
2. Health Demographic Snapshot Profile Community health is driven in part by community demographics. The age, sex, race, ethnicity, income and education status of a population are strong predictors of community health status and community health needs. Exhibit II-2 presents a snapshot of key health-related demographics of the study region. As of 2012, the study region included an estimated 381,963 people. Compared to the Commonwealth of Virginia as a whole, the study region is more densely populated, has (proportionally) more adults age 18-29, and fewer adults age 30-44. Focusing on racial/ethnic composition, the study region has (proportionally) more Black/African American residents and fewer residents of Hispanic ethnicity. The study region also has fewer adults age 25+ without a high school education and lower income levels than Virginia as a whole. Note: Maps 1-13 in Appendix A show the geographic distribution of the population by zip code.
Exhibit II-2.
Health Demographic Snapshot Profile, 2012
Indicator Study Region Virginia Population Counts Total
Population 381,963 8,154,815
Age
Children Age 0-17 90,288 1,857,225 Adults Age 18-29 75,099 1,375,674 Adults Age 30-44 70,169 1,642,637 Adults Age 45-64 100,474 2,233,940 Seniors Age 65+ 45,936 1,045,339
Sex Female 197,062 4,148,680 Male 184,903 4,006,135
Race
Asian 11,330 459,660 Black/African American 146,989 1,579,659 White 198,620 5,573,480 Other or Multi-Race 25,023 542,016
Ethnicity Hispanic Ethnicity5 22,887 655,986
Income Low Income Households (Households with Income < $25,000) 30,862 553,382
Education Population Age 25+ Without a High School Diploma 20,984 675,228 Population Rates Total
Population Density (pop. per sq. mile) 2,018.90 202.2
Age
Children Age 0-17 pct. of Total Pop. 24% 23% Adults Age 18-29 pct. of Total Pop. 20% 17% Adults Age 30-44 pct. of Total Pop. 18% 20% Adults Age 45-64 pct. of Total Pop. 26% 27% Seniors Age 65+ pct. of Total Pop. 12% 13%
Sex Female pct. of Total Pop. 52% 51% Male pct. of Total Pop. 48% 49%
Race
Asian pct. of Total Pop. 3% 6% Black/African American pct. of Total Pop. 38% 19% White pct. of Total Pop. 52% 68% Other or Multi-Race pct. of Total Pop. 7% 7%
Ethnicity Hispanic Ethnicity pct. of Total Pop. 6% 8%
Income
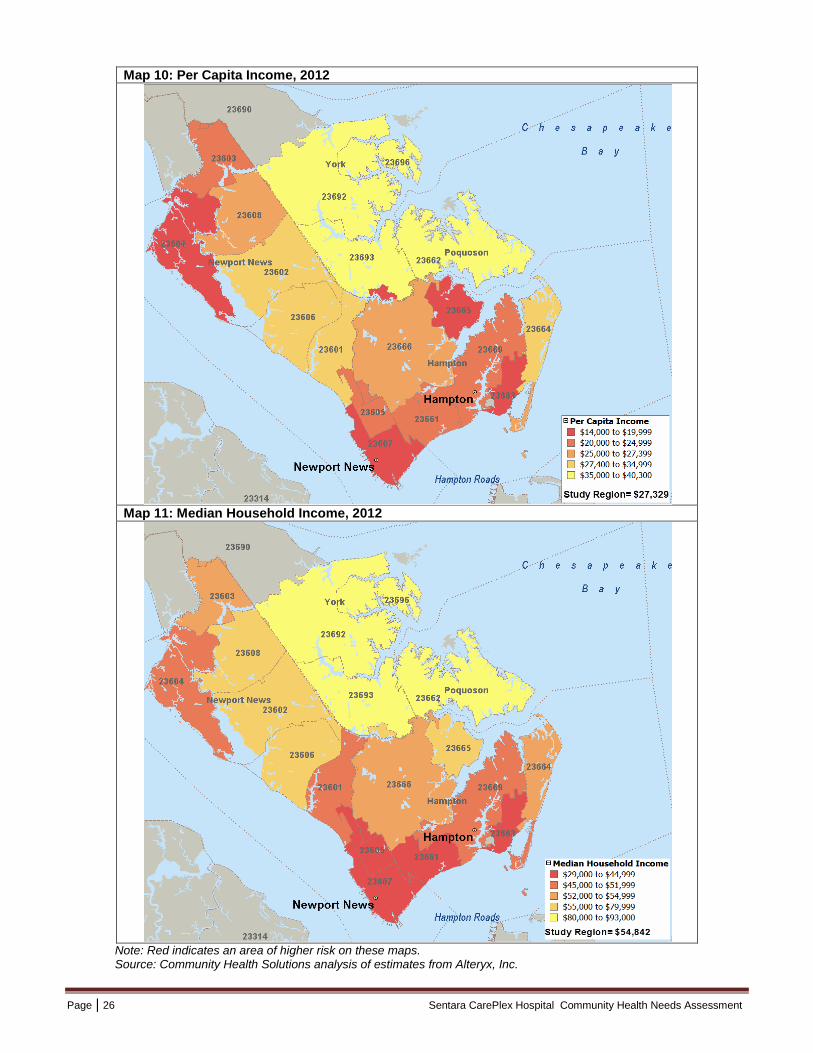
Per Capita Income $27,329 $34,307 Median Household Income $54,842 $64,118 Low Income Households (Households with Income < $25,000) pct. of Total Households
21% 18%
Education Pop. Age 25+ Without a High School Diploma pct. of Total Pop. Age 25+ 8% 12%
Source: Community Health Solutions analysis of estimates from Alteryx, Inc.
5 Classification of ethnicity; therefore, Hispanic individuals are also included in the race categories.
Page | 12 Sentara CarePlex Hospital Community Health Needs Assessment
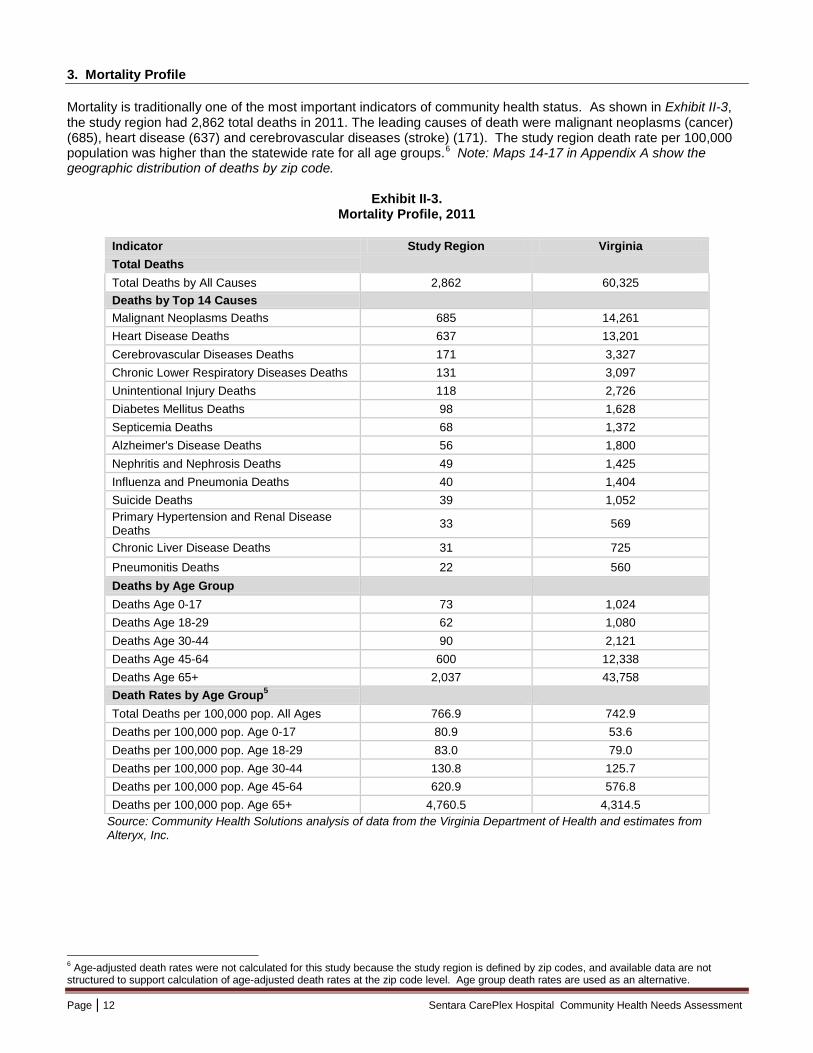
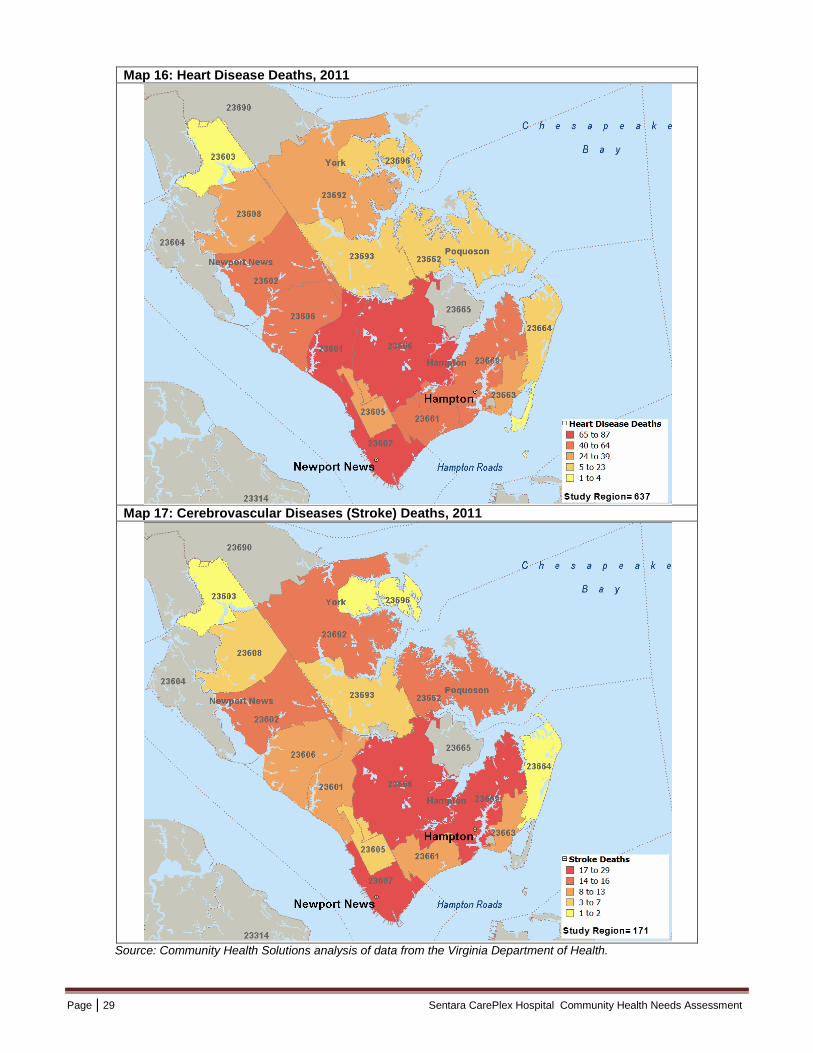
3. Mortality Profile Mortality is traditionally one of the most important indicators of community health status. As shown in Exhibit II-3, the study region had 2,862 total deaths in 2011. The leading causes of death were malignant neoplasms (cancer) (685), heart disease (637) and cerebrovascular diseases (stroke) (171). The study region death rate per 100,000 population was higher than the statewide rate for all age groups.6 Note: Maps 14-17 in Appendix A show the geographic distribution of deaths by zip code.
Exhibit II-3. Mortality Profile, 2011
Indicator Study Region Virginia Total Deaths
Total Deaths by All Causes 2,862 60,325 Deaths by Top 14 Causes Malignant Neoplasms Deaths 685 14,261 Heart Disease Deaths 637 13,201 Cerebrovascular Diseases Deaths 171 3,327 Chronic Lower Respiratory Diseases Deaths 131 3,097 Unintentional Injury Deaths 118 2,726 Diabetes Mellitus Deaths 98 1,628 Septicemia Deaths 68 1,372 Alzheimer's Disease Deaths 56 1,800 Nephritis and Nephrosis Deaths 49 1,425 Influenza and Pneumonia Deaths 40 1,404 Suicide Deaths 39 1,052 Primary Hypertension and Renal Disease Deaths 33 569
Chronic Liver Disease Deaths 31 725 Pneumonitis Deaths 22 560 Deaths by Age Group Deaths Age 0-17 73 1,024 Deaths Age 18-29 62 1,080 Deaths Age 30-44 90 2,121 Deaths Age 45-64 600 12,338 Deaths Age 65+ 2,037 43,758 Death Rates by Age Group5 Total Deaths per 100,000 pop. All Ages 766.9 742.9 Deaths per 100,000 pop. Age 0-17 80.9 53.6 Deaths per 100,000 pop. Age 18-29 83.0 79.0 Deaths per 100,000 pop. Age 30-44 130.8 125.7 Deaths per 100,000 pop. Age 45-64 620.9 576.8 Deaths per 100,000 pop. Age 65+ 4,760.5 4,314.5
Source: Community Health Solutions analysis of data from the Virginia Department of Health and estimates from Alteryx, Inc.
6 Age-adjusted death rates were not calculated for this study because the study region is defined by zip codes, and available data are not structured to support calculation of age-adjusted death rates at the zip code level. Age group death rates are used as an alternative.
Page | 13 Sentara CarePlex Hospital Community Health Needs Assessment
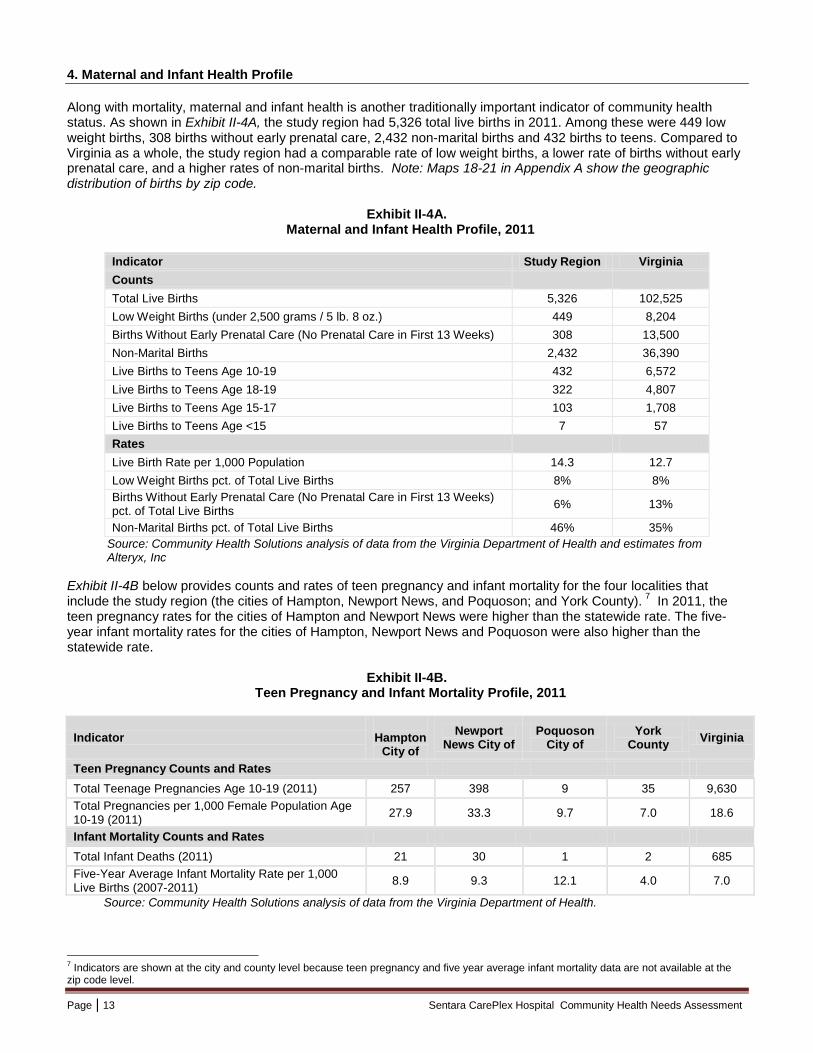
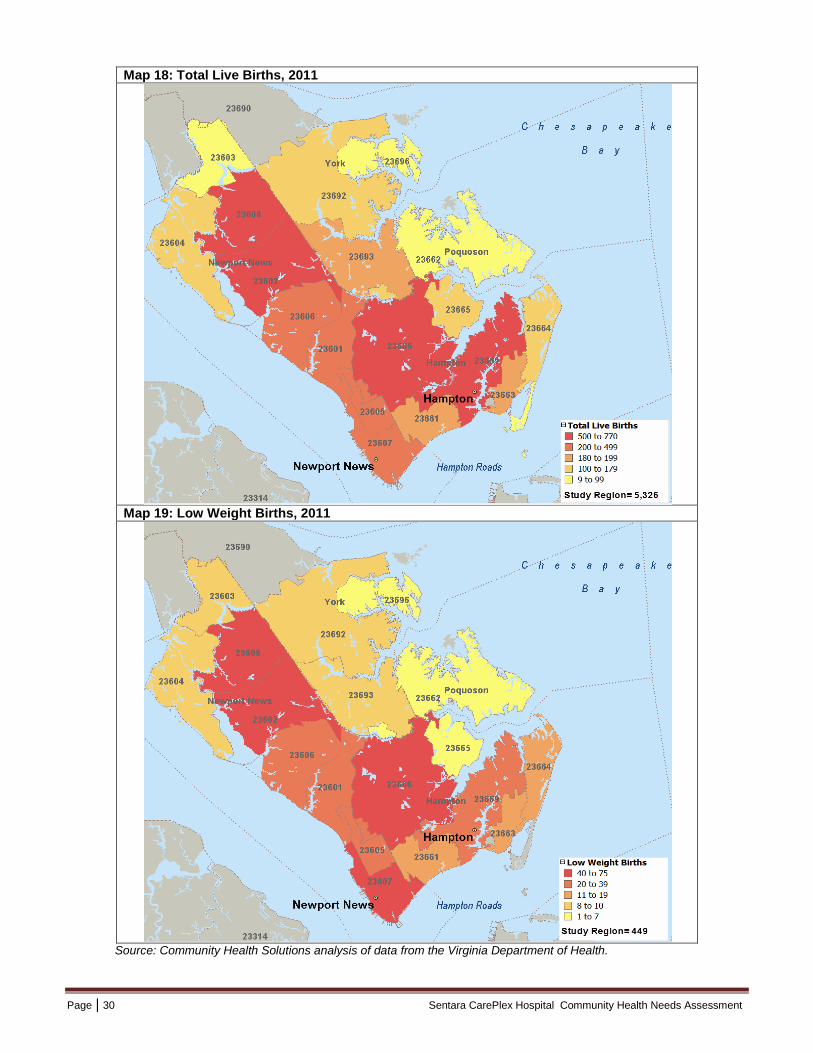
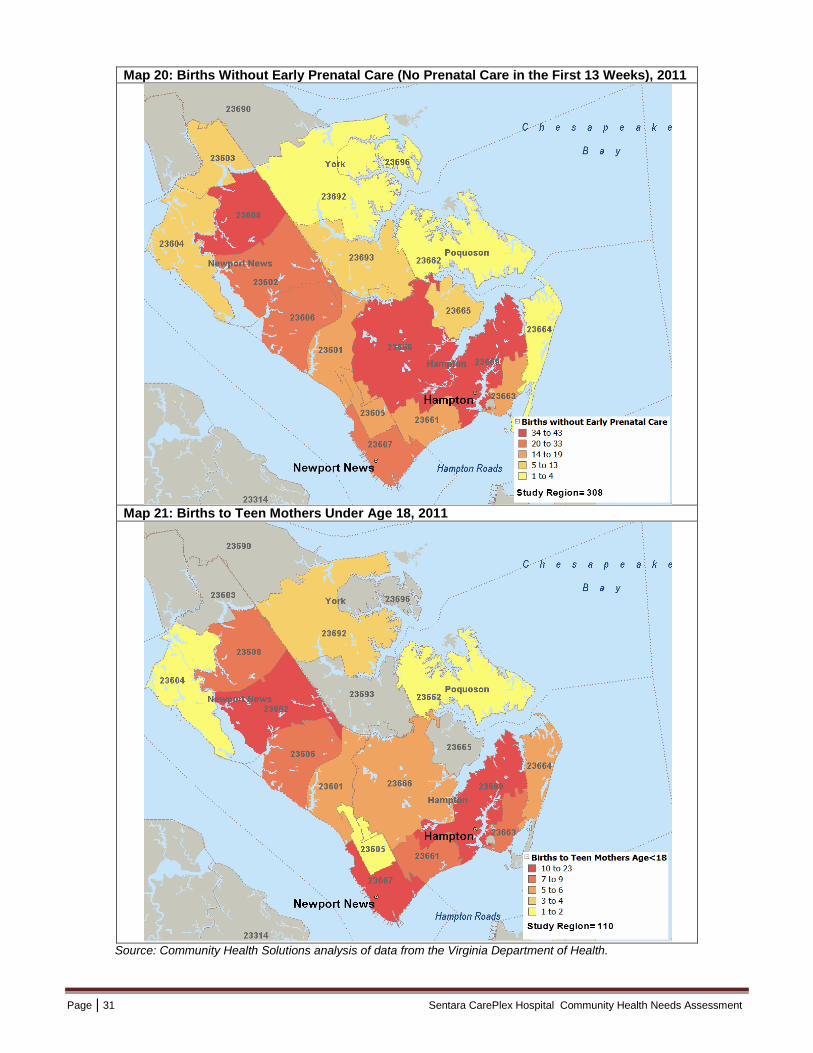
4. Maternal and Infant Health Profile Along with mortality, maternal and infant health is another traditionally important indicator of community health status. As shown in Exhibit II-4A, the study region had 5,326 total live births in 2011. Among these were 449 low weight births, 308 births without early prenatal care, 2,432 non-marital births and 432 births to teens. Compared to Virginia as a whole, the study region had a comparable rate of low weight births, a lower rate of births without early prenatal care, and a higher rates of non-marital births. Note: Maps 18-21 in Appendix A show the geographic distribution of births by zip code.
Exhibit II-4A. Maternal and Infant Health Profile, 2011
Indicator Study Region Virginia Counts Total Live Births 5,326 102,525 Low Weight Births (under 2,500 grams / 5 lb. 8 oz.) 449 8,204 Births Without Early Prenatal Care (No Prenatal Care in First 13 Weeks) 308 13,500 Non-Marital Births 2,432 36,390 Live Births to Teens Age 10-19 432 6,572 Live Births to Teens Age 18-19 322 4,807 Live Births to Teens Age 15-17 103 1,708 Live Births to Teens Age <15 7 57 Rates Live Birth Rate per 1,000 Population 14.3 12.7 Low Weight Births pct. of Total Live Births 8% 8% Births Without Early Prenatal Care (No Prenatal Care in First 13 Weeks) pct. of Total Live Births 6% 13%
Non-Marital Births pct. of Total Live Births 46% 35% Source: Community Health Solutions analysis of data from the Virginia Department of Health and estimates from Alteryx, Inc Exhibit II-4B below provides counts and rates of teen pregnancy and infant mortality for the four localities that include the study region (the cities of Hampton, Newport News, and Poquoson; and York County). 7 In 2011, the teen pregnancy rates for the cities of Hampton and Newport News were higher than the statewide rate. The five-year infant mortality rates for the cities of Hampton, Newport News and Poquoson were also higher than the statewide rate.
Exhibit II-4B.
Teen Pregnancy and Infant Mortality Profile, 2011
Indicator
Hampton City of
Newport News City of
Poquoson City of
York County Virginia
Teen Pregnancy Counts and Rates Total Teenage Pregnancies Age 10-19 (2011) 257 398 9 35 9,630 Total Pregnancies per 1,000 Female Population Age 10-19 (2011) 27.9 33.3 9.7 7.0 18.6
Infant Mortality Counts and Rates Total Infant Deaths (2011) 21 30 1 2 685 Five-Year Average Infant Mortality Rate per 1,000 Live Births (2007-2011) 8.9 9.3 12.1 4.0 7.0
Source: Community Health Solutions analysis of data from the Virginia Department of Health.
7 Indicators are shown at the city and county level because teen pregnancy and five year average infant mortality data are not available at the zip code level.

Page | 14 Sentara CarePlex Hospital Community Health Needs Assessment
5. Preventable Hospitalization Discharge Profile Preventable hospitalization is a community health indicator that is receiving increasing interest as the health system focuses on patient-centered care and avoidance of unnecessary hospitalization. The Agency for Healthcare Research and Quality (AHRQ) defines a set of conditions (called Prevention Quality Indicators, or ‘PQIs’) for which hospitalization should be avoidable with proper outpatient health care.8 High rates of hospitalization for these conditions indicate potential gaps in access to quality outpatient services for community residents. As shown in Exhibit II-5, residents of the study region had 3,545 PQI hospital discharges from Virginia hospitals in 2011.9 The leading diagnoses for these discharges were congestive heart failure (911), diabetes (656) and bacterial pneumonia (593). The study region PQI discharge rates per 100,000 population were higher than the statewide rates for residents age 18-64. Note: Map 22 in Appendix A shows the geographic distribution of PQI discharges by zip code.
Exhibit II-5. Prevention Quality Indicator (PQI) Hospital Discharge Profile, 2011
Indicator Study Region Virginia PQI Discharges by Age Group8 All Ages 3,545 83,392 Total PQI Discharges-Age 0-17 13 335 Total PQI Discharges-Age 18-29 222 3,639 Total PQI Discharges-Age 30-44 352 7,190 Total PQI Discharges-Age 45-64 1,151 24,359 Total PQI Discharges-Age 65+ 1,807 47,869 PQI Discharges by Diagnosis Congestive Heart Failure 911 18,990 Diabetes 656 11,326 Bacterial Pneumonia 593 16,221 Urinary Tract Infection 365 10,496 Chronic Obstructive Pulmonary Disease (COPD) 361 11,439 Adult Asthma 306 6,419 Hypertension 144 2,898 Dehydration 110 3,401 Perforated Appendix 63 1,487 Angina 36 715 PQI Discharge Rates by Age Group PQI Discharges per 100,000 pop. All Ages 949.9 1,027.0 PQI Discharges per 100,000 pop. Age 0-17 -- 17.5 PQI Discharges per 100,000 pop. Age 18-29 297.1 266.1 PQI Discharges per 100,000 pop. Age 30-44 511.5 426.0 PQI Discharges per 100,000 pop. Age 45-64 1,191.2 1,138.7 PQI Discharges per 100,000 pop. Age 65+ 4,222.9 4,719.8 Source: Community Health Solutions analysis of hospital discharge data from Virginia Health Information, Inc. and estimates from Alteryx, Inc. -- Rates are not calculated where n<30
8 The PQI definitions are detailed in their specification of ICD-9 diagnosis codes and procedure codes. Not every hospital admission for congestive heart failure, bacterial pneumonia, etc. is included in the PQI definition; only those meeting the detailed specifications. Low birth weight is one of the PQI indicators, but for the purpose of this report, low birth weight is included in the Maternal and Infant Health Profile. Also, there are three diabetes-related PQI indicators which have been combined into one for the report. For more information, visit the AHRQ website at www.qualityindicators.ahrq.gov/pqi_overview.htm 9 Data include discharges for Virginia residents from Virginia community hospitals reporting to Virginia Health Information, Inc. These data do not include discharges from state behavioral health facilities or federal (military) facilities. Data reported are based on the primary diagnosis.
Page | 15 Sentara CarePlex Hospital Community Health Needs Assessment
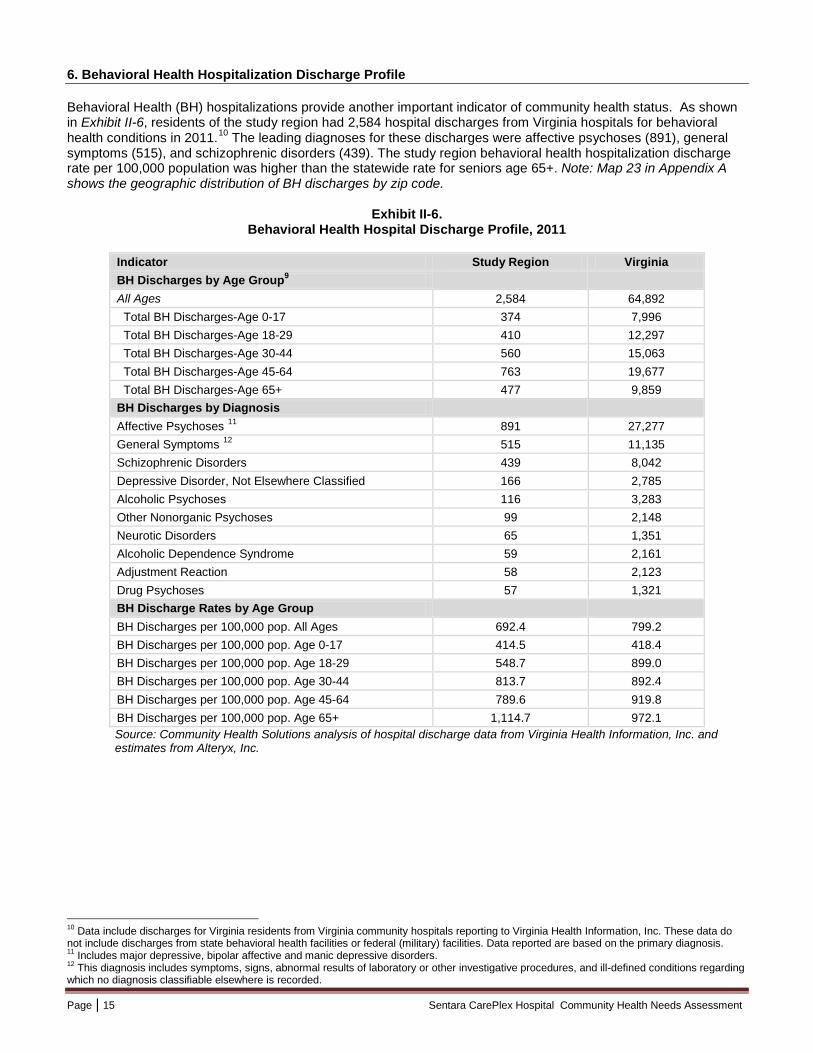
6. Behavioral Health Hospitalization Discharge Profile Behavioral Health (BH) hospitalizations provide another important indicator of community health status. As shown in Exhibit II-6, residents of the study region had 2,584 hospital discharges from Virginia hospitals for behavioral health conditions in 2011.10 The leading diagnoses for these discharges were affective psychoses (891), general symptoms (515), and schizophrenic disorders (439). The study region behavioral health hospitalization discharge rate per 100,000 population was higher than the statewide rate for seniors age 65+. Note: Map 23 in Appendix A shows the geographic distribution of BH discharges by zip code.
Exhibit II-6. Behavioral Health Hospital Discharge Profile, 2011
Indicator Study Region Virginia BH Discharges by Age Group9 All Ages 2,584 64,892 Total BH Discharges-Age 0-17 374 7,996 Total BH Discharges-Age 18-29 410 12,297 Total BH Discharges-Age 30-44 560 15,063 Total BH Discharges-Age 45-64 763 19,677 Total BH Discharges-Age 65+ 477 9,859 BH Discharges by Diagnosis Affective Psychoses 11 891 27,277 General Symptoms 12 515 11,135 Schizophrenic Disorders 439 8,042 Depressive Disorder, Not Elsewhere Classified 166 2,785 Alcoholic Psychoses 116 3,283 Other Nonorganic Psychoses 99 2,148 Neurotic Disorders 65 1,351 Alcoholic Dependence Syndrome 59 2,161 Adjustment Reaction 58 2,123 Drug Psychoses 57 1,321 BH Discharge Rates by Age Group BH Discharges per 100,000 pop. All Ages 692.4 799.2 BH Discharges per 100,000 pop. Age 0-17 414.5 418.4 BH Discharges per 100,000 pop. Age 18-29 548.7 899.0 BH Discharges per 100,000 pop. Age 30-44 813.7 892.4 BH Discharges per 100,000 pop. Age 45-64 789.6 919.8 BH Discharges per 100,000 pop. Age 65+ 1,114.7 972.1 Source: Community Health Solutions analysis of hospital discharge data from Virginia Health Information, Inc. and estimates from Alteryx, Inc.
10 Data include discharges for Virginia residents from Virginia community hospitals reporting to Virginia Health Information, Inc. These data do not include discharges from state behavioral health facilities or federal (military) facilities. Data reported are based on the primary diagnosis. 11 Includes major depressive, bipolar affective and manic depressive disorders. 12 This diagnosis includes symptoms, signs, abnormal results of laboratory or other investigative procedures, and ill-defined conditions regarding which no diagnosis classifiable elsewhere is recorded.
Page | 16 Sentara CarePlex Hospital Community Health Needs Assessment
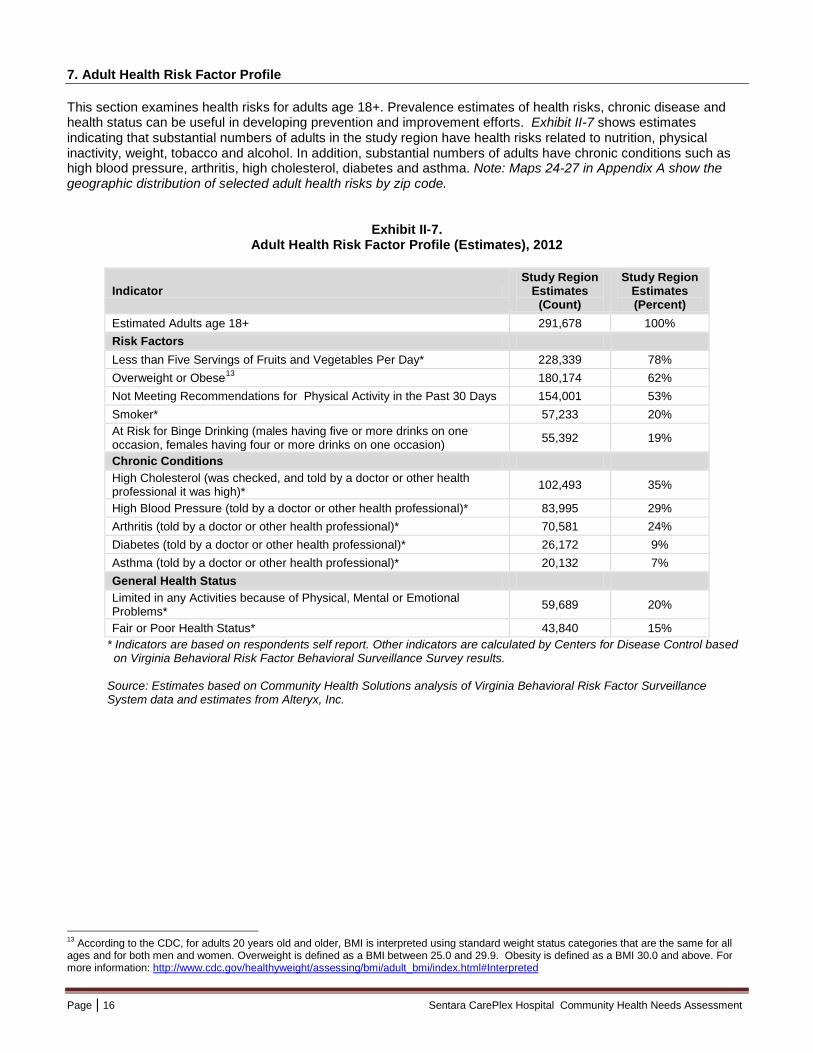
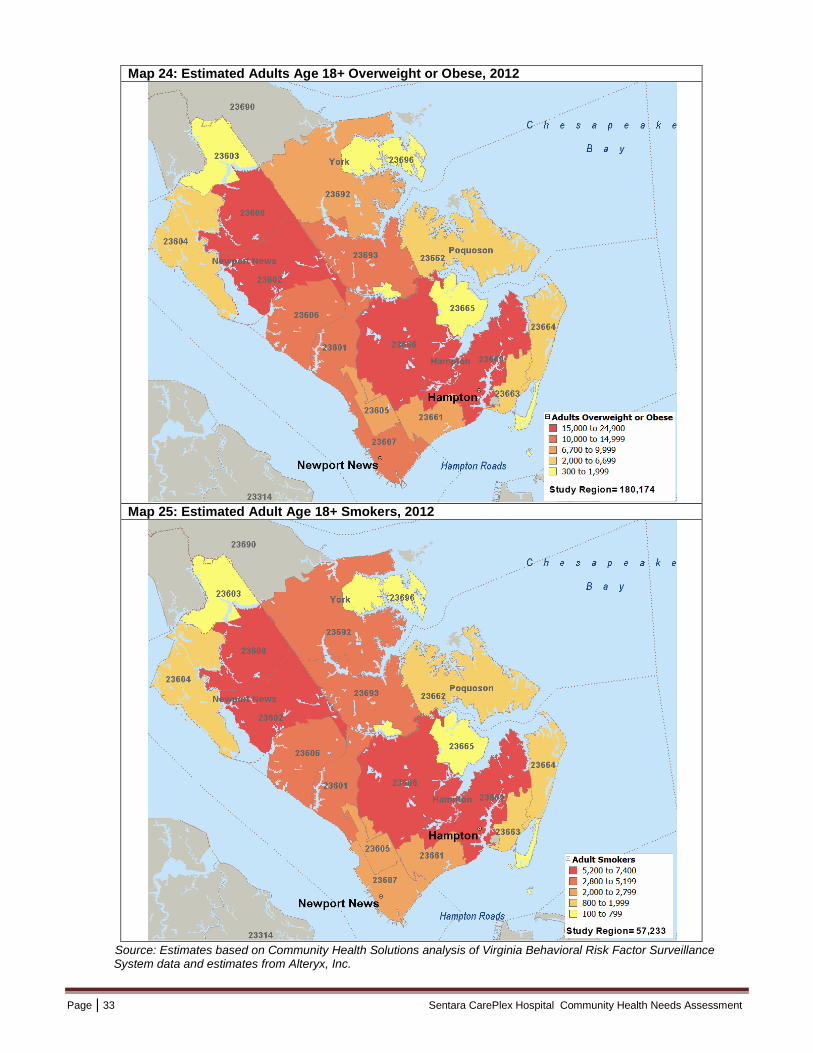
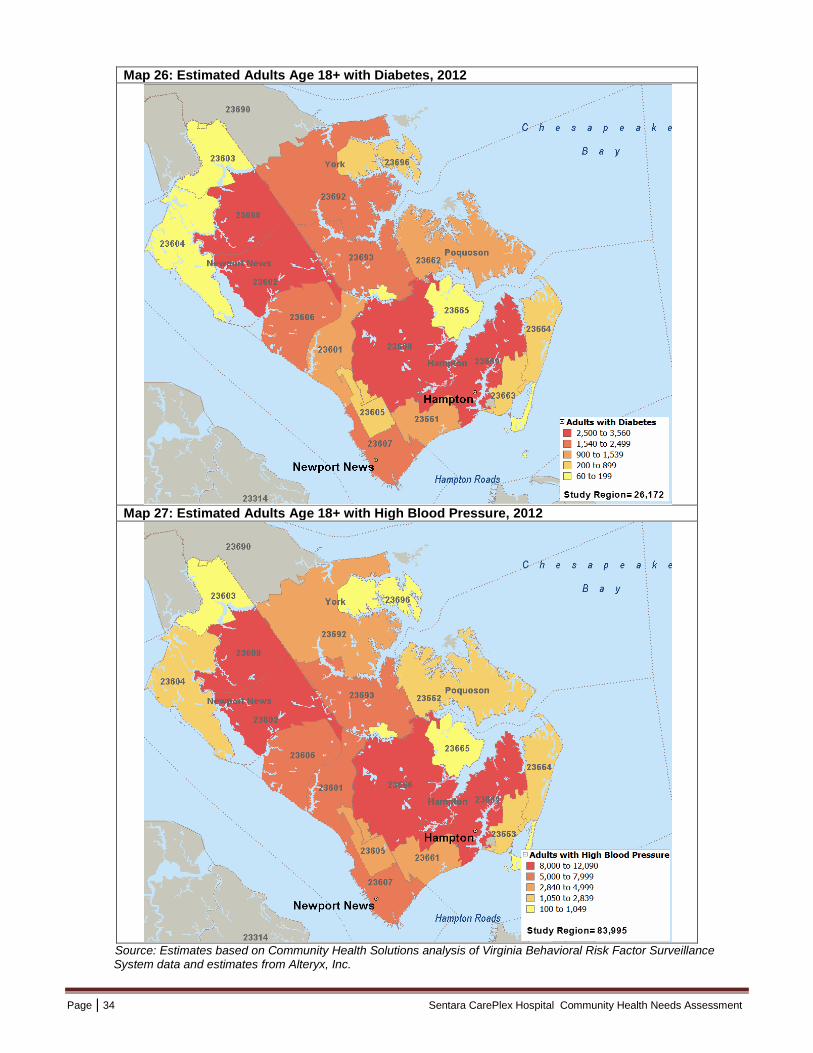
7. Adult Health Risk Factor Profile This section examines health risks for adults age 18+. Prevalence estimates of health risks, chronic disease and health status can be useful in developing prevention and improvement efforts. Exhibit II-7 shows estimates indicating that substantial numbers of adults in the study region have health risks related to nutrition, physical inactivity, weight, tobacco and alcohol. In addition, substantial numbers of adults have chronic conditions such as high blood pressure, arthritis, high cholesterol, diabetes and asthma. Note: Maps 24-27 in Appendix A show the geographic distribution of selected adult health risks by zip code.
Exhibit II-7. Adult Health Risk Factor Profile (Estimates), 2012
Indicator Study Region
Estimates (Count)
Study Region Estimates (Percent)
Estimated Adults age 18+ 291,678 100% Risk Factors Less than Five Servings of Fruits and Vegetables Per Day* 228,339 78% Overweight or Obese13 180,174 62% Not Meeting Recommendations for Physical Activity in the Past 30 Days 154,001 53% Smoker* 57,233 20% At Risk for Binge Drinking (males having five or more drinks on one occasion, females having four or more drinks on one occasion) 55,392 19%
Chronic Conditions High Cholesterol (was checked, and told by a doctor or other health professional it was high)* 102,493 35%
High Blood Pressure (told by a doctor or other health professional)* 83,995 29% Arthritis (told by a doctor or other health professional)* 70,581 24% Diabetes (told by a doctor or other health professional)* 26,172 9% Asthma (told by a doctor or other health professional)* 20,132 7% General Health Status Limited in any Activities because of Physical, Mental or Emotional Problems* 59,689 20%
Fair or Poor Health Status* 43,840 15% * Indicators are based on respondents self report. Other indicators are calculated by Centers for Disease Control based on Virginia Behavioral Risk Factor Behavioral Surveillance Survey results. Source: Estimates based on Community Health Solutions analysis of Virginia Behavioral Risk Factor Surveillance System data and estimates from Alteryx, Inc.
13 According to the CDC, for adults 20 years old and older, BMI is interpreted using standard weight status categories that are the same for all ages and for both men and women. Overweight is defined as a BMI between 25.0 and 29.9. Obesity is defined as a BMI 30.0 and above. For more information: http://www.cdc.gov/healthyweight/assessing/bmi/adult_bmi/index.html#Interpreted
Page | 17 Sentara CarePlex Hospital Community Health Needs Assessment
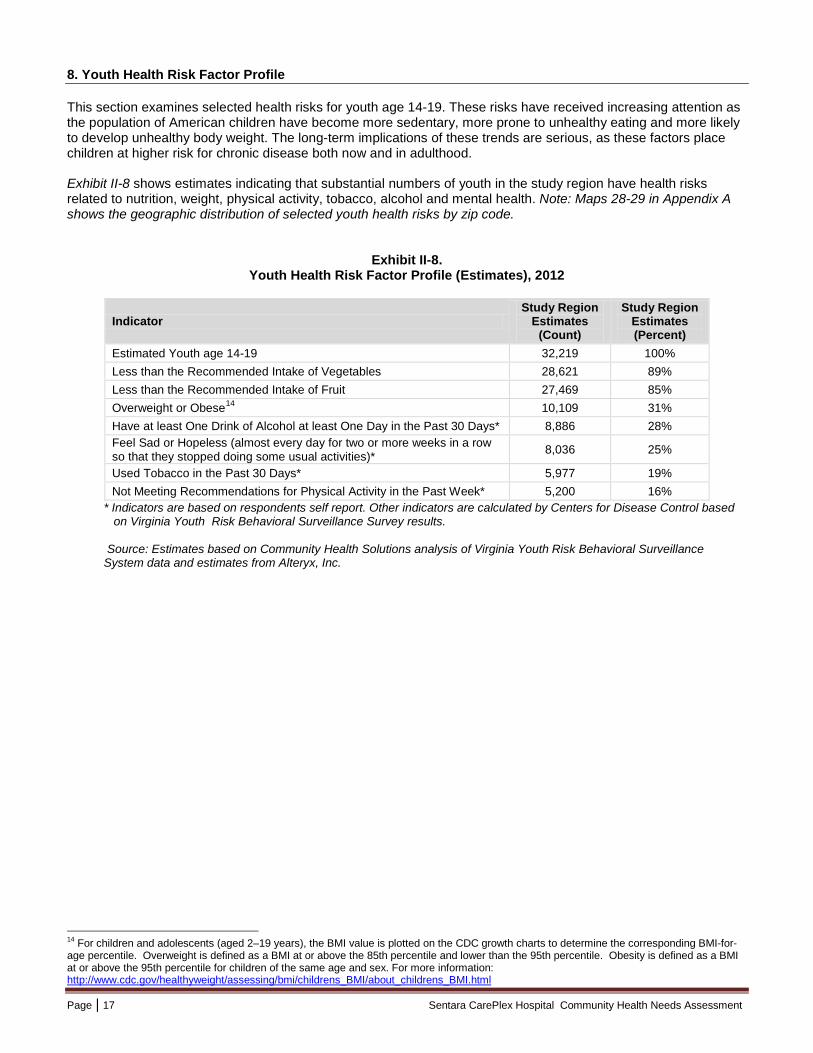
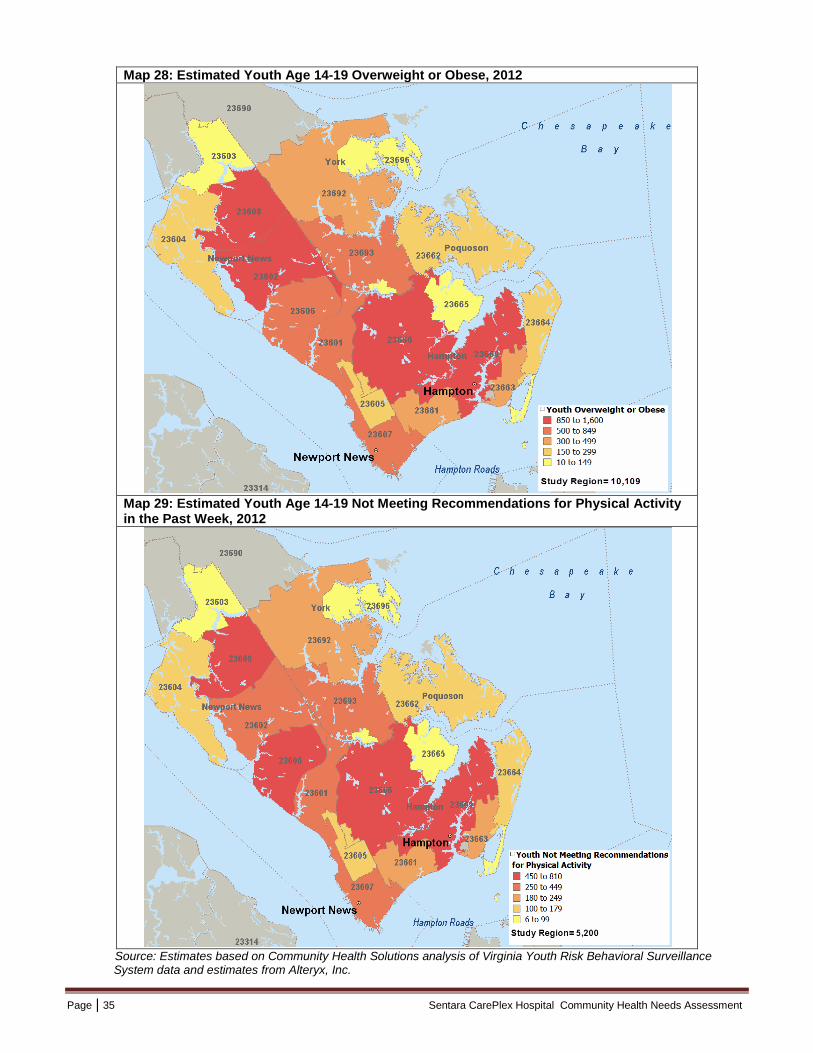
8. Youth Health Risk Factor Profile This section examines selected health risks for youth age 14-19. These risks have received increasing attention as the population of American children have become more sedentary, more prone to unhealthy eating and more likely to develop unhealthy body weight. The long-term implications of these trends are serious, as these factors place children at higher risk for chronic disease both now and in adulthood. Exhibit II-8 shows estimates indicating that substantial numbers of youth in the study region have health risks related to nutrition, weight, physical activity, tobacco, alcohol and mental health. Note: Maps 28-29 in Appendix A shows the geographic distribution of selected youth health risks by zip code.
Exhibit II-8. Youth Health Risk Factor Profile (Estimates), 2012
Indicator Study Region
Estimates (Count)
Study Region Estimates (Percent)
Estimated Youth age 14-19 32,219 100% Less than the Recommended Intake of Vegetables 28,621 89% Less than the Recommended Intake of Fruit 27,469 85% Overweight or Obese14 10,109 31% Have at least One Drink of Alcohol at least One Day in the Past 30 Days* 8,886 28% Feel Sad or Hopeless (almost every day for two or more weeks in a row so that they stopped doing some usual activities)* 8,036 25%
Used Tobacco in the Past 30 Days* 5,977 19% Not Meeting Recommendations for Physical Activity in the Past Week* 5,200 16%
* Indicators are based on respondents self report. Other indicators are calculated by Centers for Disease Control based on Virginia Youth Risk Behavioral Surveillance Survey results. Source: Estimates based on Community Health Solutions analysis of Virginia Youth Risk Behavioral Surveillance System data and estimates from Alteryx, Inc.
14 For children and adolescents (aged 2–19 years), the BMI value is plotted on the CDC growth charts to determine the corresponding BMI-for-age percentile. Overweight is defined as a BMI at or above the 85th percentile and lower than the 95th percentile. Obesity is defined as a BMI at or above the 95th percentile for children of the same age and sex. For more information: http://www.cdc.gov/healthyweight/assessing/bmi/childrens_BMI/about_childrens_BMI.html

Page | 18 Sentara CarePlex Hospital Community Health Needs Assessment
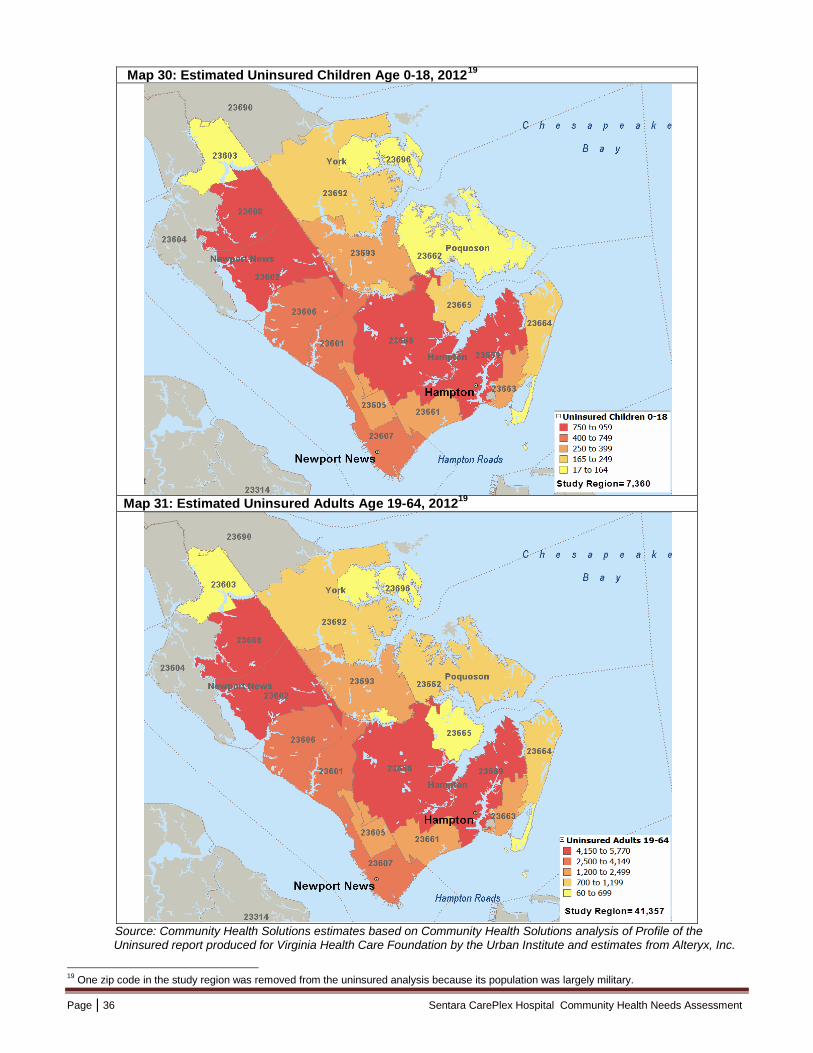
9. Uninsured Profile Decades of research show that health coverage matters when it comes to overall health status, access to health care, quality of life, school and work productivity, and even mortality. Exhibit II-9 shows the estimated number of uninsured individuals by income as a percent of the federal poverty level (FPL) in the study region as of 2012.15 An estimated 48,716 (21%) nonelderly residents of the study region were uninsured at any point in time in 2012. This included an estimated 7,360 children and 41,357 adults. Note: Maps 30-31 in Appendix A show the geographic distribution of the uninsured population by zip code.
Exhibit II-9.
Uninsured Profile (Estimates)16, 2012
Indicator Study Region Estimated Uninsured Counts Uninsured Nonelderly Age 0-64 48,716 Uninsured Children Age 0-18 7,360
Uninsured Children <100% FPL 2,320 Uninsured Children 100-200% FPL 2,830 Uninsured Children 201-300% FPL 1,136 Uninsured Children 301%+ FPL 1,074
Uninsured Adults Age 19-64 41,357 Uninsured Adults <100% FPL 18,600 Uninsured Adults 100-200% FPL 10,779 Uninsured Adults 201-300% FPL 6,335 Uninsured Adults 301%+ FPL 5,642 Uninsured Adults Under 133% FPL17 19,872
Estimated Uninsured Rates Uninsured Nonelderly Percent 21%
Uninsured Children Percent 8% Uninsured Adults Percent 18%
Source: Community Health Solutions estimates based on Community Health Solutions analysis of Profile of the Uninsured report produced for Virginia Health Care Foundation by the Urban Institute and estimates from Alteryx, Inc.
15 For more information, please see: http://aspe.hhs.gov/poverty/12poverty.shtml 16 One zip code in the study region was removed from the uninsured analysis because its population was largely military. 17 Uninsured Adults Under 133% FPL are included in the <100 and 100-200% FPL income categories. This separate income level has been included in the table to provide an estimate of uninsured adults who may be eligible for health coverage under Medicaid expansion.
Page | 19 Sentara CarePlex Hospital Community Health Needs Assessment
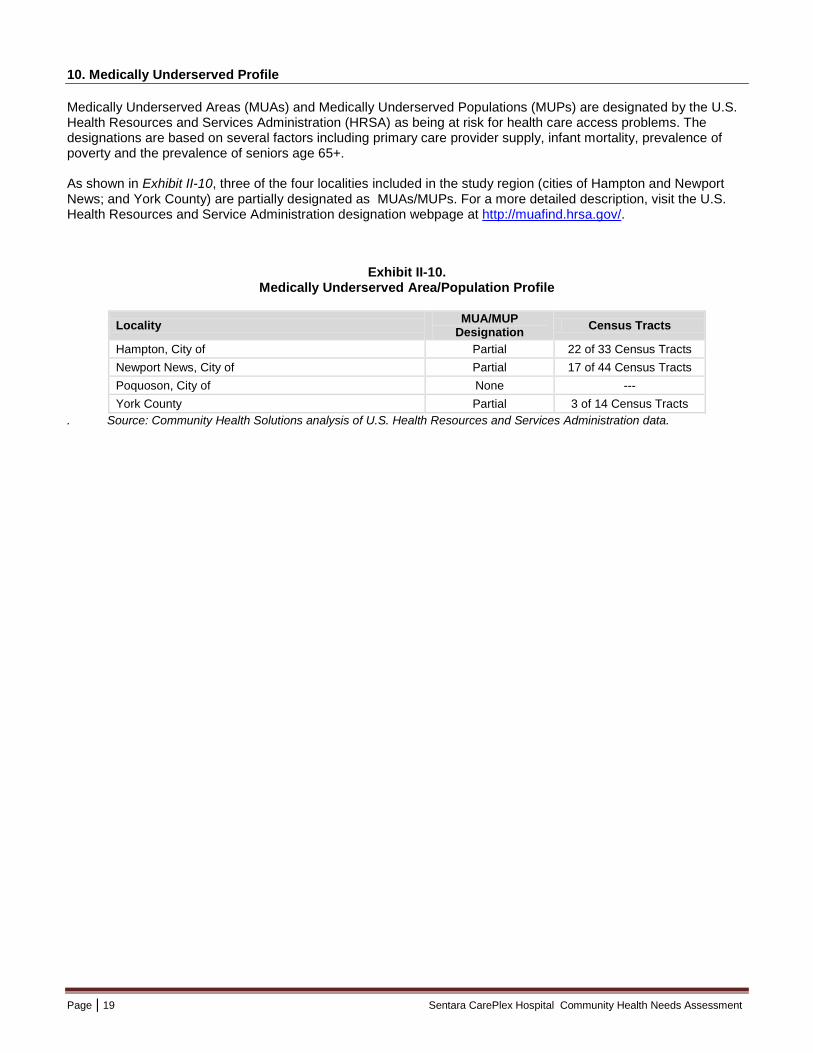
10. Medically Underserved Profile Medically Underserved Areas (MUAs) and Medically Underserved Populations (MUPs) are designated by the U.S. Health Resources and Services Administration (HRSA) as being at risk for health care access problems. The designations are based on several factors including primary care provider supply, infant mortality, prevalence of poverty and the prevalence of seniors age 65+. As shown in Exhibit II-10, three of the four localities included in the study region (cities of Hampton and Newport News; and York County) are partially designated as MUAs/MUPs. For a more detailed description, visit the U.S. Health Resources and Service Administration designation webpage at http://muafind.hrsa.gov/.
Exhibit II-10.
Medically Underserved Area/Population Profile
Locality MUA/MUP Designation Census Tracts
Hampton, City of Partial 22 of 33 Census Tracts Newport News, City of Partial 17 of 44 Census Tracts Poquoson, City of None --- York County Partial 3 of 14 Census Tracts
. Source: Community Health Solutions analysis of U.S. Health Resources and Services Administration data.
Page | 20 Sentara CarePlex Hospital Community Health Needs Assessment
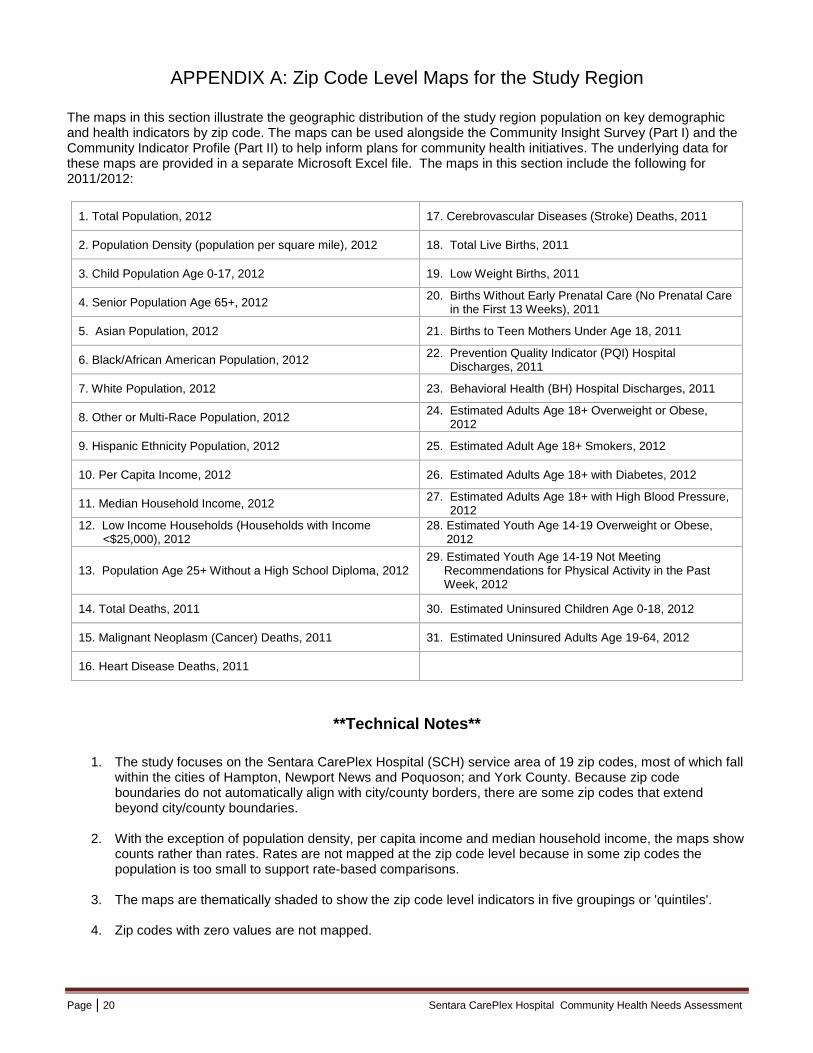
APPENDIX A: Zip Code Level Maps for the Study Region The maps in this section illustrate the geographic distribution of the study region population on key demographic and health indicators by zip code. The maps can be used alongside the Community Insight Survey (Part I) and the Community Indicator Profile (Part II) to help inform plans for community health initiatives. The underlying data for these maps are provided in a separate Microsoft Excel file. The maps in this section include the following for 2011/2012:
1. Total Population, 2012 17. Cerebrovascular Diseases (Stroke) Deaths, 2011
2. Population Density (population per square mile), 2012 18. Total Live Births, 2011
3. Child Population Age 0-17, 2012 19. Low Weight Births, 2011
4. Senior Population Age 65+, 2012 20. Births Without Early Prenatal Care (No Prenatal Care in the First 13 Weeks), 2011
5. Asian Population, 2012 21. Births to Teen Mothers Under Age 18, 2011
6. Black/African American Population, 2012 22. Prevention Quality Indicator (PQI) Hospital Discharges, 2011
7. White Population, 2012 23. Behavioral Health (BH) Hospital Discharges, 2011
8. Other or Multi-Race Population, 2012 24. Estimated Adults Age 18+ Overweight or Obese, 2012
9. Hispanic Ethnicity Population, 2012 25. Estimated Adult Age 18+ Smokers, 2012
10. Per Capita Income, 2012 26. Estimated Adults Age 18+ with Diabetes, 2012
11. Median Household Income, 2012 27. Estimated Adults Age 18+ with High Blood Pressure, 2012
12. Low Income Households (Households with Income <$25,000), 2012
28. Estimated Youth Age 14-19 Overweight or Obese, 2012
13. Population Age 25+ Without a High School Diploma, 2012 29. Estimated Youth Age 14-19 Not Meeting
Recommendations for Physical Activity in the Past Week, 2012
14. Total Deaths, 2011 30. Estimated Uninsured Children Age 0-18, 2012
15. Malignant Neoplasm (Cancer) Deaths, 2011 31. Estimated Uninsured Adults Age 19-64, 2012
16. Heart Disease Deaths, 2011
**Technical Notes**
1. The study focuses on the Sentara CarePlex Hospital (SCH) service area of 19 zip codes, most of which fall
within the cities of Hampton, Newport News and Poquoson; and York County. Because zip code boundaries do not automatically align with city/county borders, there are some zip codes that extend beyond city/county boundaries.
2. With the exception of population density, per capita income and median household income, the maps show counts rather than rates. Rates are not mapped at the zip code level because in some zip codes the population is too small to support rate-based comparisons.
3. The maps are thematically shaded to show the zip code level indicators in five groupings or 'quintiles'.
4. Zip codes with zero values are not mapped.
Page | 21 Sentara CarePlex Hospital Community Health Needs Assessment
Map 1: Total Population, 2012
Map 2: Population Density (population per square mile), 2012
Source: Community Health Solutions analysis of estimates from Alteryx, Inc.
Page | 22 Sentara CarePlex Hospital Community Health Needs Assessment
Map 3: Child Population Age 0-17, 2012
Map 4: Senior Population Age 65+, 2012
Source: Community Health Solutions analysis of estimates from Alteryx, Inc.

Page | 23 Sentara CarePlex Hospital Community Health Needs Assessment
Map 5: Asian Population, 2012
Map 6: Black/African American Population, 2012
Source: Community Health Solutions analysis of estimates from Alteryx, Inc. .

Page | 24 Sentara CarePlex Hospital Community Health Needs Assessment
Map 7: White Population, 2012
Map 8: Other or Multi-Race Population, 2012
Source: Community Health Solutions analysis of estimates from Alteryx, Inc.
Page | 25 Sentara CarePlex Hospital Community Health Needs Assessment
Map 9: Hispanic Ethnicity Population18, 2012
Source: Community Health Solutions analysis of estimates from Alteryx, Inc.
18 Classification of ethnicity; therefore, Hispanic individuals are also included in the race categories.
Page | 26 Sentara CarePlex Hospital Community Health Needs Assessment
Map 10: Per Capita Income, 2012
Map 11: Median Household Income, 2012
Note: Red indicates an area of higher risk on these maps. Source: Community Health Solutions analysis of estimates from Alteryx, Inc.

Page | 27 Sentara CarePlex Hospital Community Health Needs Assessment
Map 12: Low Income Households (Households with Income<$25,000), 2012
Map 13: Population Age 25+ Without a High School Diploma, 2012
Note: Red indicates an area of higher risk on these maps. Source: Community Health Solutions analysis of estimates from Alteryx, Inc.

Page | 28 Sentara CarePlex Hospital Community Health Needs Assessment
Map 14: Total Deaths, 2011
Map 15: Malignant Neoplasm (Cancer) Deaths, 2011
Source: Community Health Solutions analysis of data from the Virginia Department of Health.
Page | 29 Sentara CarePlex Hospital Community Health Needs Assessment
Map 16: Heart Disease Deaths, 2011
Map 17: Cerebrovascular Diseases (Stroke) Deaths, 2011
Source: Community Health Solutions analysis of data from the Virginia Department of Health.
Page | 30 Sentara CarePlex Hospital Community Health Needs Assessment
Map 18: Total Live Births, 2011
Map 19: Low Weight Births, 2011
Source: Community Health Solutions analysis of data from the Virginia Department of Health.
Page | 31 Sentara CarePlex Hospital Community Health Needs Assessment
Map 20: Births Without Early Prenatal Care (No Prenatal Care in the First 13 Weeks), 2011
Map 21: Births to Teen Mothers Under Age 18, 2011
Source: Community Health Solutions analysis of data from the Virginia Department of Health.

Page | 32 Sentara CarePlex Hospital Community Health Needs Assessment
Map 22: Prevention Quality Indicator (PQI) Hospital Discharges, 2011
Map 23: Behavioral Health Hospital Discharges, 2011
Source: Community Health Solutions analysis of hospital discharge data from Virginia Health Information, Inc.
Page | 33 Sentara CarePlex Hospital Community Health Needs Assessment
Source: Estimates based on Community Health Solutions analysis of Virginia Behavioral Risk Factor Surveillance System data and estimates from Alteryx, Inc.
Map 24: Estimated Adults Age 18+ Overweight or Obese, 2012
Map 25: Estimated Adult Age 18+ Smokers, 2012
Page | 34 Sentara CarePlex Hospital Community Health Needs Assessment
Map 26: Estimated Adults Age 18+ with Diabetes, 2012
Map 27: Estimated Adults Age 18+ with High Blood Pressure, 2012
Source: Estimates based on Community Health Solutions analysis of Virginia Behavioral Risk Factor Surveillance System data and estimates from Alteryx, Inc.
Page | 35 Sentara CarePlex Hospital Community Health Needs Assessment
Map 28: Estimated Youth Age 14-19 Overweight or Obese, 2012
Map 29: Estimated Youth Age 14-19 Not Meeting Recommendations for Physical Activity in the Past Week, 2012
Source: Estimates based on Community Health Solutions analysis of Virginia Youth Risk Behavioral Surveillance System data and estimates from Alteryx, Inc.
Page | 36 Sentara CarePlex Hospital Community Health Needs Assessment
Map 30: Estimated Uninsured Children Age 0-18, 201219
Map 31: Estimated Uninsured Adults Age 19-64, 201219
Source: Community Health Solutions estimates based on Community Health Solutions analysis of Profile of the Uninsured report produced for Virginia Health Care Foundation by the Urban Institute and estimates from Alteryx, Inc. 19 One zip code in the study region was removed from the uninsured analysis because its population was largely military.
Page | 37 Sentara CarePlex Hospital Community Health Needs Assessment
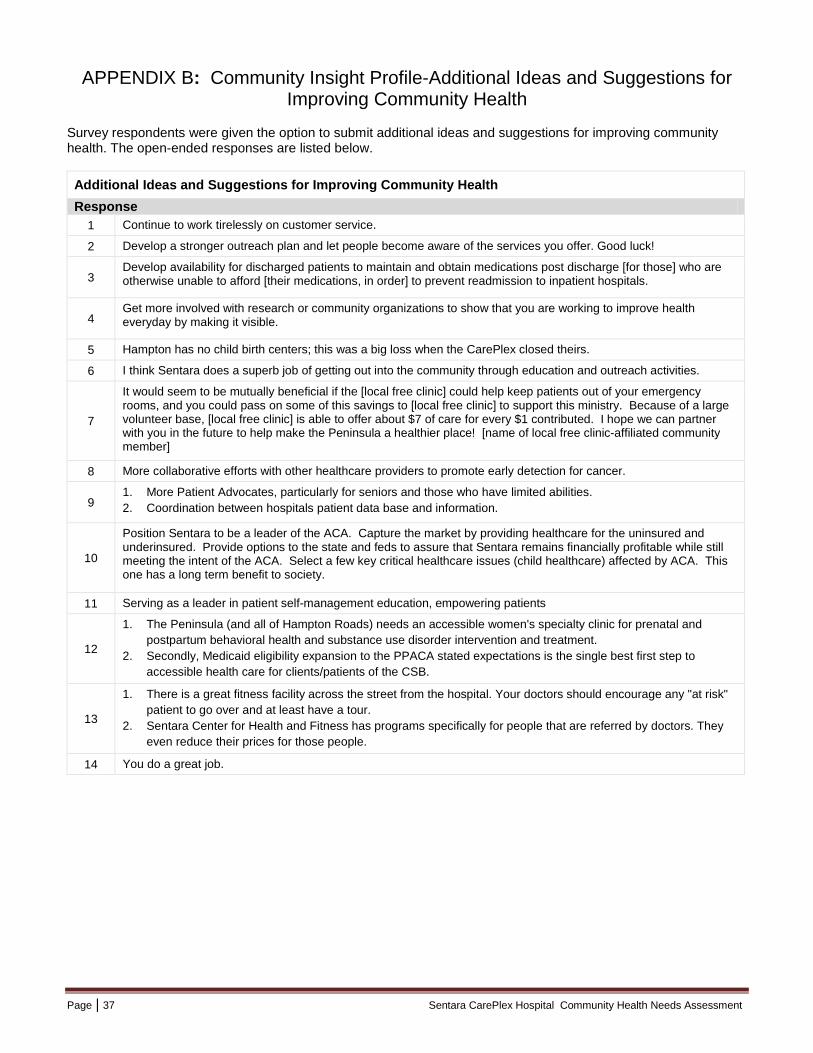
APPENDIX B: Community Insight Profile-Additional Ideas and Suggestions for Improving Community Health
Survey respondents were given the option to submit additional ideas and suggestions for improving community health. The open-ended responses are listed below. Additional Ideas and Suggestions for Improving Community Health Response
1 Continue to work tirelessly on customer service.
2 Develop a stronger outreach plan and let people become aware of the services you offer. Good luck!
3 Develop availability for discharged patients to maintain and obtain medications post discharge [for those] who are otherwise unable to afford [their medications, in order] to prevent readmission to inpatient hospitals.
4 Get more involved with research or community organizations to show that you are working to improve health everyday by making it visible.
5 Hampton has no child birth centers; this was a big loss when the CarePlex closed theirs.
6 I think Sentara does a superb job of getting out into the community through education and outreach activities.
7
It would seem to be mutually beneficial if the [local free clinic] could help keep patients out of your emergency rooms, and you could pass on some of this savings to [local free clinic] to support this ministry. Because of a large volunteer base, [local free clinic] is able to offer about $7 of care for every $1 contributed. I hope we can partner with you in the future to help make the Peninsula a healthier place! [name of local free clinic-affiliated community member]
8 More collaborative efforts with other healthcare providers to promote early detection for cancer.
9 1. More Patient Advocates, particularly for seniors and those who have limited abilities. 2. Coordination between hospitals patient data base and information.
10
Position Sentara to be a leader of the ACA. Capture the market by providing healthcare for the uninsured and underinsured. Provide options to the state and feds to assure that Sentara remains financially profitable while still meeting the intent of the ACA. Select a few key critical healthcare issues (child healthcare) affected by ACA. This one has a long term benefit to society.
11 Serving as a leader in patient self-management education, empowering patients
12
1. The Peninsula (and all of Hampton Roads) needs an accessible women's specialty clinic for prenatal and postpartum behavioral health and substance use disorder intervention and treatment.
2. Secondly, Medicaid eligibility expansion to the PPACA stated expectations is the single best first step to accessible health care for clients/patients of the CSB.
13
1. There is a great fitness facility across the street from the hospital. Your doctors should encourage any "at risk" patient to go over and at least have a tour.
2. Sentara Center for Health and Fitness has programs specifically for people that are referred by doctors. They even reduce their prices for those people.
14 You do a great job.
Page | 38 Sentara CarePlex Hospital Community Health Needs Assessment
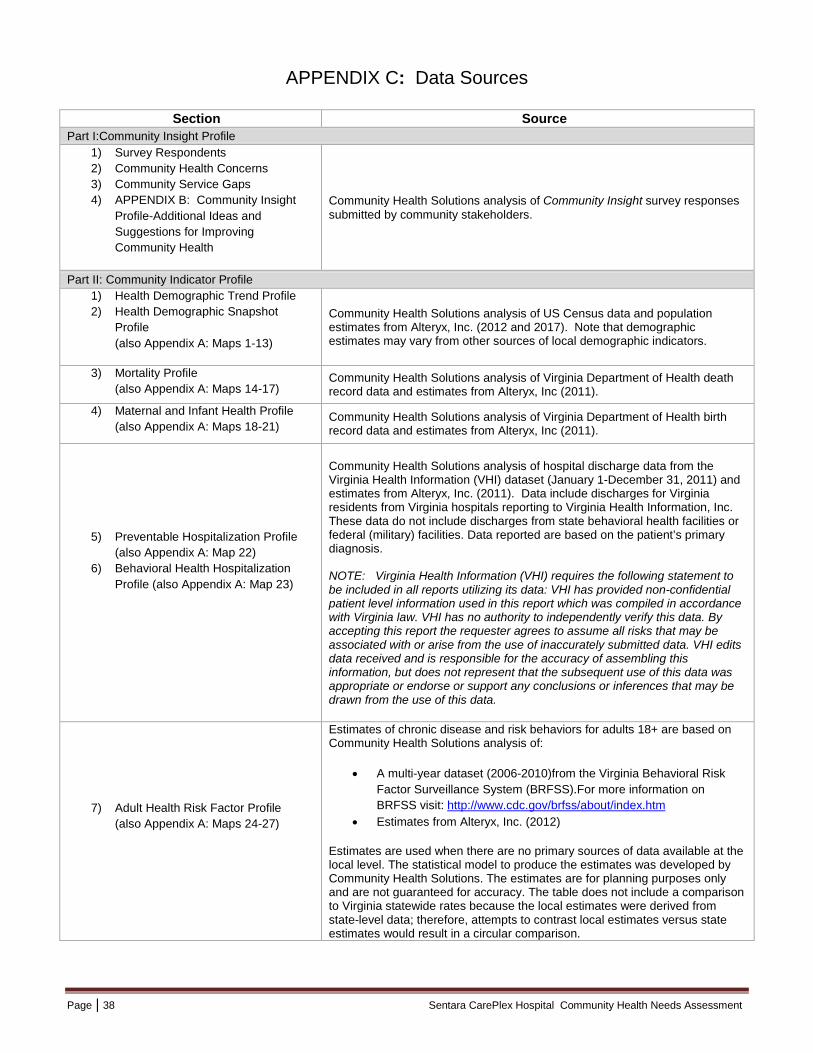
APPENDIX C: Data Sources
Section Source Part I:Community Insight Profile
1) Survey Respondents 2) Community Health Concerns 3) Community Service Gaps 4) APPENDIX B: Community Insight
Profile-Additional Ideas and Suggestions for Improving Community Health
Community Health Solutions analysis of Community Insight survey responses submitted by community stakeholders.
Part II: Community Indicator Profile 1) Health Demographic Trend Profile 2) Health Demographic Snapshot
Profile (also Appendix A: Maps 1-13)
Community Health Solutions analysis of US Census data and population estimates from Alteryx, Inc. (2012 and 2017). Note that demographic estimates may vary from other sources of local demographic indicators.
3) Mortality Profile (also Appendix A: Maps 14-17)
Community Health Solutions analysis of Virginia Department of Health death record data and estimates from Alteryx, Inc (2011).
4) Maternal and Infant Health Profile (also Appendix A: Maps 18-21)
Community Health Solutions analysis of Virginia Department of Health birth record data and estimates from Alteryx, Inc (2011).
5) Preventable Hospitalization Profile (also Appendix A: Map 22)
6) Behavioral Health Hospitalization Profile (also Appendix A: Map 23)
Community Health Solutions analysis of hospital discharge data from the Virginia Health Information (VHI) dataset (January 1-December 31, 2011) and estimates from Alteryx, Inc. (2011). Data include discharges for Virginia residents from Virginia hospitals reporting to Virginia Health Information, Inc. These data do not include discharges from state behavioral health facilities or federal (military) facilities. Data reported are based on the patient’s primary diagnosis. NOTE: Virginia Health Information (VHI) requires the following statement to be included in all reports utilizing its data: VHI has provided non-confidential patient level information used in this report which was compiled in accordance with Virginia law. VHI has no authority to independently verify this data. By accepting this report the requester agrees to assume all risks that may be associated with or arise from the use of inaccurately submitted data. VHI edits data received and is responsible for the accuracy of assembling this information, but does not represent that the subsequent use of this data was appropriate or endorse or support any conclusions or inferences that may be drawn from the use of this data.
7) Adult Health Risk Factor Profile (also Appendix A: Maps 24-27)
Estimates of chronic disease and risk behaviors for adults 18+ are based on Community Health Solutions analysis of:
• A multi-year dataset (2006-2010)from the Virginia Behavioral Risk
Factor Surveillance System (BRFSS).For more information on BRFSS visit: http://www.cdc.gov/brfss/about/index.htm
• Estimates from Alteryx, Inc. (2012)
Estimates are used when there are no primary sources of data available at the local level. The statistical model to produce the estimates was developed by Community Health Solutions. The estimates are for planning purposes only and are not guaranteed for accuracy. The table does not include a comparison to Virginia statewide rates because the local estimates were derived from state-level data; therefore, attempts to contrast local estimates versus state estimates would result in a circular comparison.

Page | 39 Sentara CarePlex Hospital Community Health Needs Assessment
8) Youth Health Risk Factor Profile (also Appendix A: Maps 28-29)
Estimates of risk behaviors for children age 14-19 are based on Community Health Solutions analysis of:
• National and statewide Virginia Youth Risk Behavioral Surveillance System from the Centers for Disease Control (2011). For more information on YRBSS visit: http://www.cdc.gov/HealthyYouth/yrbs/index.htm
• Estimates from Alteryx, Inc. (2012).
Estimates are used when there are no primary sources of data available at the local level. The statistical model to produce the estimates was developed by Community Health Solutions. The estimates are for planning purposes only and are not guaranteed for accuracy. The table does not include a comparison to Virginia statewide rates because the local estimates were derived from state-level data; therefore, attempts to contrast local estimates versus state estimates would result in a circular comparison.
9) Uninsured Profile (also Appendix A: Maps 30-31)
Estimates of uninsured nonelderly age 0-64 are based on Community Health Solutions analysis of:
• Profile of the Uninsured report produced for Virginia Health Care Foundation by the Urban Institute (2011)
• Estimates from Alteryx, Inc. (2012)
Estimates are used when there are no primary sources of data available at the local level. The statistical model to produce the estimates was developed by Community Health Solutions. The estimates are for planning purposes only and are not guaranteed for accuracy. The table does not include a comparison to Virginia statewide rates because the local estimates were derived from state-level data; therefore, attempts to contrast local estimates versus state estimates would result in a circular comparison.
10) Medically Underserved Profile Community Health Solutions analysis of U.S. Health Resources and Services Administration data. For more information visit: http://muafind.hrsa.gov/.